deutsche bank (malaysia) berhad - db.com · compliance with bank negara malaysia’s expectations...
TRANSCRIPT

Deutsche Bank (Malaysia) Berhad (Company No. 312552-W)
(Incorporated in Malaysia)
and its subsidiaries
Financial statements for the year
ended 31 December 2018

1
Deutsche Bank (Malaysia) Berhad (Company No. 312552-W)
(Incorporated in Malaysia)
and its subsidiaries
Directors’ report for the year ended
31 December 2018
The Directors have pleasure in submitting their report and the audited financial statements
of the Group and of the Bank for the financial year ended 31 December 2018.
Principal activities
The principal activities of the Bank are banking and related financial services that also
include Islamic Banking business. The principal activities of the subsidiary companies are
set out in Note 8 to the financial statements. There have been no significant changes in
these activities during the financial year.
Results Group
and Bank
RM’000
Profit before tax 264,100
Tax expense (63,202)
Profit for the year attributable to owner of the Bank 200,898

2
Company No. 312552-W
Dividends
Since the end of the previous financial year, the amount of dividends paid by the Bank was
as follows:-
In respect of the financial year ended 31 December 2017 as reported in the
Director’s Report of that year, a final ordinary dividend of 89.3 sen per ordinary
share totalling RM155,000,000 paid on 11 July 2018.
The final dividend recommended by the Directors in respect of the financial year ended 31
December 2018 is 115.7 sen per ordinary share totaling RM200,898,000.
Reserves, provisions and allowances
There were no material transfers to or from reserves, provisions and allowances during the
financial year under review other than those disclosed in the financial statements.
Directors of the Bank
Directors who served during the financial year until the date of this report are:
Tunku Dato’ Mahmood Fawzy bin Tunku Muhiyiddin
Dato’ Yusof Annuar bin Yaacob
Mr Steven Choy Khai Choon
Madam Koid Swee Lian
Mr Seamus Toal
3
Company No. 312552-W
Bad and doubtful debts and financing
Before the financial statements of the Group and of the Bank were made out, the Directors
took reasonable steps to ascertain that actions had been taken in relation to the writing off
of bad debts and financing and the making of allowance for impaired debts and financing,
and satisfied themselves that all known bad debts and financing had been written off and
adequate allowance had been made for impaired debts and financing.
At the date of this report, the Directors are not aware of any circumstances which would
render the amount written off for bad debts and financing, or the amount of the allowance
for impaired debts and financing, in the financial statements of the Group and of the Bank
inadequate to any substantial extent.
Current assets
Before the financial statements of the Group and of the Bank were made out, the Directors
took reasonable steps to ascertain that any current assets, other than debts and financing,
which were unlikely to be realised in the ordinary course of business at their values as
shown in the accounting records of the Group and of the Bank, have been written down to
an amount which they might be expected to realise.
At the date of this report, the Directors are not aware of any circumstances which would
render the values attributed to the current assets in the financial statements of the Group
and of the Bank misleading.
Valuation methods
At the date of this report, the Directors are not aware of any circumstances which have
arisen which render adherence to the existing methods of valuation of assets or liabilities
in the financial statements of the Group and of the Bank misleading or inappropriate.
4
Company No. 312552-W
Contingent and other liabilities
At the date of this report, there does not exist:
(a) any charge on the assets of the Group or of the Bank which has arisen since the end
of the financial year and which secures the liabilities of any other person, or
(b) any contingent liability in respect of the Group or of the Bank that has arisen since
the end of the financial year other than those incurred in the ordinary course of
business.
No contingent or other liability of the Group and of the Bank has become enforceable, or is
likely to become enforceable within the period of twelve months after the end of the
financial year which, in the opinion of the Directors, will or may substantially affect the
ability of the Group and of the Bank to meet their obligations as and when they fall due.
Change of circumstances
At the date of this report, the Directors are not aware of any circumstances, not otherwise
dealt with in this report or the financial statements of the Group and of the Bank, which
would render any amount stated in the financial statements misleading.
Items of an unusual nature
The results of the operations of the Group and of the Bank for the financial year were not,
in the opinion of the Directors, substantially affected by any item, transaction or event of a
material and unusual nature.
There has not arisen in the interval between the end of the financial year and the date of
this report any item, transaction or event of a material and unusual nature likely to affect
substantially the results of the operations of the Group and of the Bank for the current
financial year in which this report is made.

5
Company No. 312552-W
Compliance with Bank Negara Malaysia’s expectations on financial
reporting
In the preparation of the financial statements, the Directors have taken reasonable steps
to ensure that Bank Negara Malaysia’s expectations on financial reporting have been
complied with, including those set out in the Guidelines on Financial Reporting.
Directors’ interests in shares
According to the Register of Directors’ Shareholdings maintained by the Bank in
accordance with the Companies Act 2016, the Directors holding office at year end who
have beneficial interests in the shares of the Bank and its related corporations are as
follows:
Number of ordinary shares
Balance at Balance at
1.1.2018 Bought Sold 31.12.2018
Holding company
Deutsche Bank Aktiengesellschaft
Dato’ Yusof Annuar bin Yaacob 19,101 3,001 22,102 -
Number of ordinary shares
Balance at Awarded/ Exercised/ Balance at
1.1.2018 Granted Vested 31.12.2018
Holding company
Deutsche Bank Aktiengesellschaft
- DB Restricted Equity Units Plan
Dato’ Yusof Annuar bin Yaacob 19,843 7,635 3,001 24,477
Seamus Toal 53,876 13,661 26,739 40,799
None of the other Directors held or dealt in the shares of the Bank or its related
corporations during the financial year.
6
Company No. 312552-W
Directors’ benefits
Since the end of the previous financial year, no Director of the Bank has received nor
become entitled to receive any benefit (other than a benefit included in the aggregate
amount of remuneration received or due and receivable by Directors as shown in Note 24
to the financial statements) by reason of a contract made by the Bank or a related
corporation with the Director or with a firm of which the Director is a member, or with a
company in which the Director has a substantial financial interest.
Neither at the end of the financial year, nor at any time during that year, did there subsist
any arrangements to which the Bank is a party whereby Directors might acquire benefits
by means of the acquisition of shares in, or debentures of, the Bank or any other body
corporate other than the share and options compensation plans operated by Deutsche
Bank Aktiengesellschaft as disclosed in Note 34.
Issue of shares and debentures
There were no changes in the issued and paid-up capital of the Bank during the financial
year.
There were no debentures issued during the year.
Options granted over unissued shares
No options were granted to any person to take up unissued shares of the Bank during the
year.
Indemnity and insurance costs
During the financial year, the total amount of insurance cost incurred for the Directors of
the Bank net of Directors’ contribution is RM50,516.
There were no indemnity and insurance cost effected for auditors of the Bank during the
financial year.


16
Deutsche Bank (Malaysia) Berhad (Company No. 312552-W)
(Incorporated in Malaysia)
and its subsidiaries
Statements of financial position as at
31 December 2018
Group Bank
Note 2018 2017 2018 2017
RM’000 RM’000 RM’000 RM’000
Assets
Cash and short-term funds 3.1 1,793,561 3,416,228 1,793,561 3,416,228
Deposits and placements
with banks and other
financial institutions
3.2 374,990
333,033
374,990
333,033
Reverse repurchase
agreements
146,401
69,042
146,401
69,042
Financial securities 4 3,407,359 1,447,393 3,407,359 1,447,393
Loans, advances and
financing
5 2,275,345
2,391,753
2,275,345
2,391,753
Other assets 6 1,283,639 1,752,189 1,283,639 1,752,189
Tax recoverable 15,188 10,149 15,188 10,149
Statutory deposit with
Bank Negara Malaysia
7 20,000
100,000
20,000
100,000
Investments in subsidiary
companies
8 -
-
20
20
Property and equipment 9 2,927 4,090 2,927 4,090
Deferred tax assets 10 35,355 27,299 35,355 27,299
Total assets 9,354,765 9,551,176 9,354,785 9,551,196

17
Company No. 312552-W
Statements of financial position as at
31 December 2018 (continued)
Group Bank
Note 2018 2017 2018 2017
RM’000 RM’000 RM’000 RM’000
Liabilities and equity
Deposits from customers 11 4,226,840 4,627,017 4,226,860 4,627,037
Deposits and placements
of banks and other
financial institutions
12 1,514,300
658,943
1,514,300
658,943
Other liabilities 13 1,740,204 2,446,461 1,740,204 2,446,461
Total liabilities 7,481,344 7,732,421 7,481,364 7,732,441
Equity
Share capital 14 531,362 531,362 531,362 531,362
Reserves 15 1,342,059 1,287,393 1,342,059 1,287,393
Total equity attributable to
owner of the Bank
1,873,421
1,818,755
1,873,421
1,818,755
Total liabilities and
equity
9,354,765
9,551,176
9,354,785
9,551,196
Group and Bank
Note 2018 2017
RM’000 RM’000
Commitments and contingencies 30 97,386,346 108,969,319
The notes on pages 23 to 131 are an integral part of these financial statements.
18
Deutsche Bank (Malaysia) Berhad (Company No. 312552-W)
(Incorporated in Malaysia)
and its subsidiaries
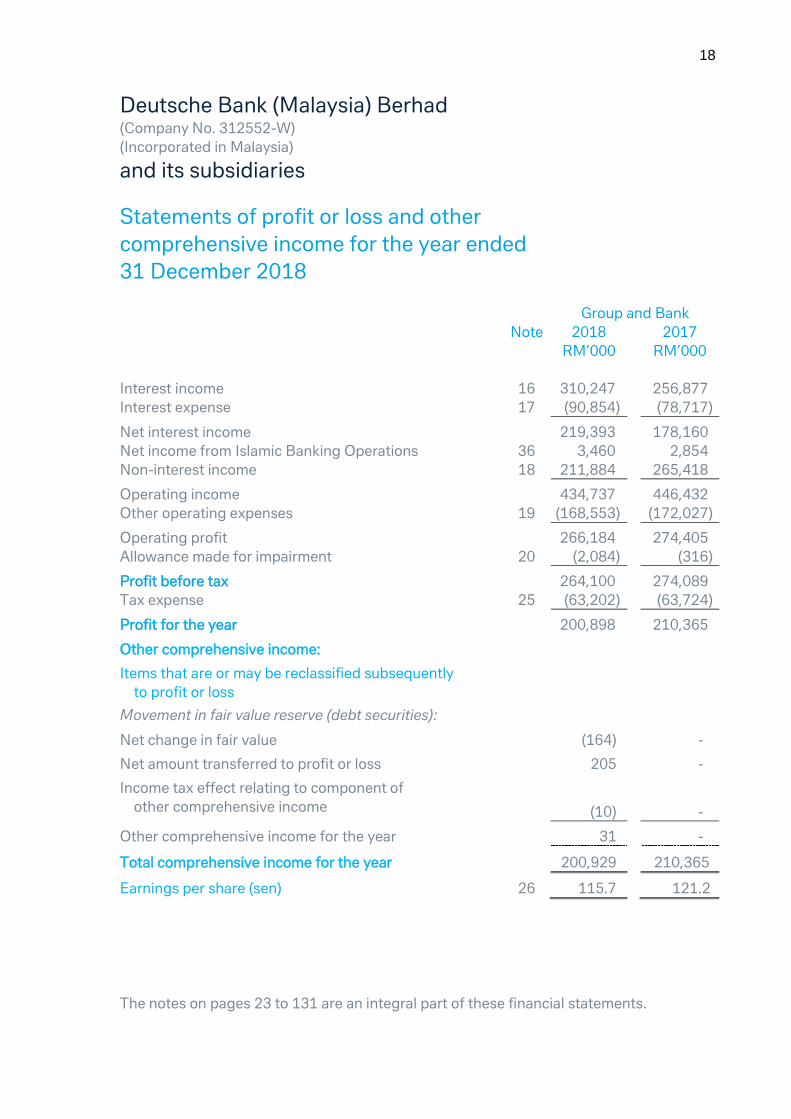
Statements of profit or loss and other
comprehensive income for the year ended
31 December 2018
Group and Bank
Note 2018 2017
RM’000 RM’000
Interest income 16 310,247 256,877
Interest expense 17 (90,854) (78,717)
Net interest income 219,393 178,160
Net income from Islamic Banking Operations 36 3,460 2,854
Non-interest income 18 211,884 265,418
Operating income 434,737 446,432
Other operating expenses 19 (168,553) (172,027)
Operating profit 266,184 274,405
Allowance made for impairment 20 (2,084) (316)
Profit before tax 264,100 274,089
Tax expense 25 (63,202) (63,724)
Profit for the year 200,898 210,365
Other comprehensive income:
Items that are or may be reclassified subsequently
to profit or loss
Movement in fair value reserve (debt securities):
Net change in fair value (164) -
Net amount transferred to profit or loss 205 -
Income tax effect relating to component of
other comprehensive income
(10)
-
Other comprehensive income for the year 31 -
Total comprehensive income for the year 200,929 210,365
Earnings per share (sen) 26 115.7 121.2
The notes on pages 23 to 131 are an integral part of these financial statements.
19
Deutsche Bank (Malaysia) Berhad (Company No. 312552-W)
(Incorporated in Malaysia)
and its subsidiaries
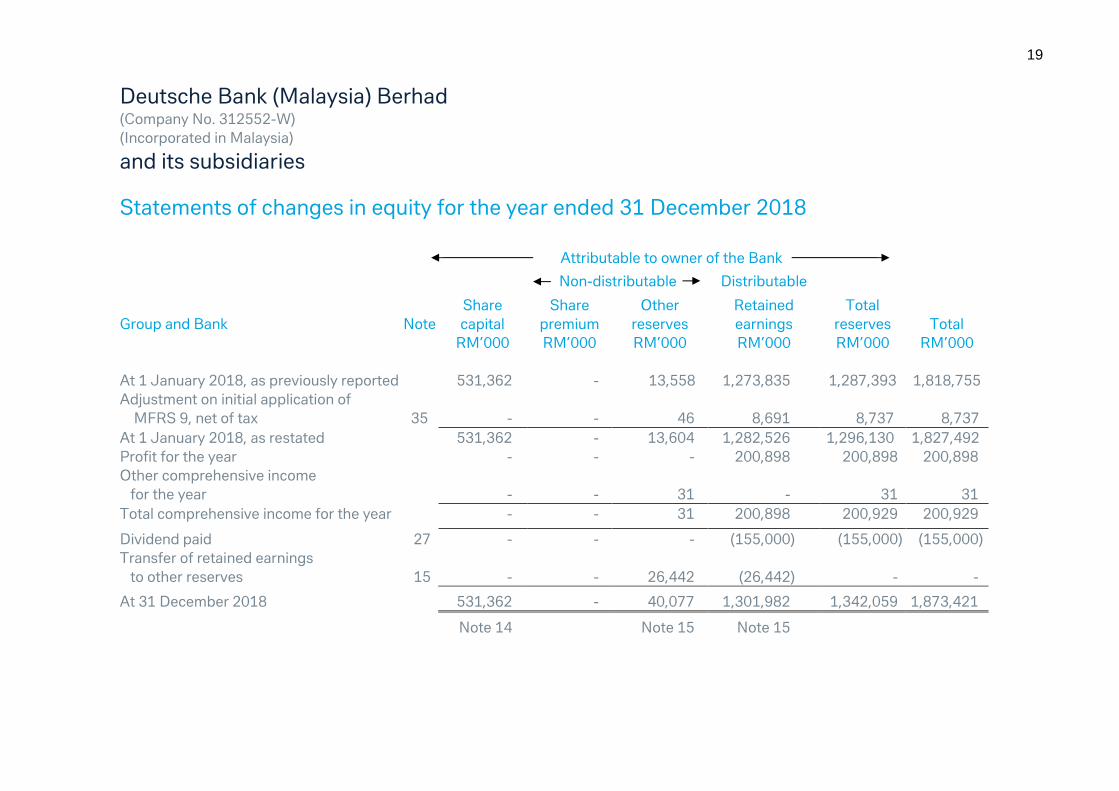
Statements of changes in equity for the year ended 31 December 2018
Attributable to owner of the Bank
Non-distributable Distributable
Share Share Other Retained Total
Group and Bank Note capital premium reserves earnings reserves Total
RM’000 RM’000 RM’000 RM’000 RM’000 RM’000
At 1 January 2018, as previously reported 531,362 - 13,558 1,273,835 1,287,393 1,818,755
Adjustment on initial application of
MFRS 9, net of tax
35
-
-
46
8,691
8,737
8,737
At 1 January 2018, as restated 531,362 - 13,604 1,282,526 1,296,130 1,827,492
Profit for the year - - - 200,898 200,898 200,898
Other comprehensive income
for the year
-
-
31
-
31
31
Total comprehensive income for the year - - 31 200,898 200,929 200,929
Dividend paid 27 - - - (155,000) (155,000) (155,000)
Transfer of retained earnings
to other reserves 15
-
-
26,442
(26,442)
-
-
At 31 December 2018 531,362 - 40,077 1,301,982 1,342,059 1,873,421
Note 14 Note 15 Note 15

20
Company No. 312552-W
Statements of changes in equity for the year ended 31 December 2018 (continued)
Attributable to owner of the Bank
Non-distributable Distributable
Share Share Other Retained Total
Group and Bank Note capital premium reserves earnings reserves Total
RM’000 RM’000 RM’000 RM’000 RM’000 RM’000
At 1 January 2017 173,599 357,763 188,280 1,035,787 1,581,830 1,755,429
Profit and total comprehensive income for
the year - - - 210,365 210,365 210,365
Dividend paid 27 - - - (147,039) (147,039) (147,039)
Transfer of share premium to share capital 14 357,763 (357,763) - - (357,763) -
Transfer of reserve fund to retained
earnings
-
-
(174,722)
174,722
-
-
At 31 December 2017 531,362 - 13,558 1,273,835 1,287,393 1,818,755
Note 14 Note 15 Note 15
The notes on pages 23 to 131 are an integral part of these financial statements.
21
Deutsche Bank (Malaysia) Berhad (Company No. 312552-W)
(Incorporated in Malaysia)
and its subsidiaries
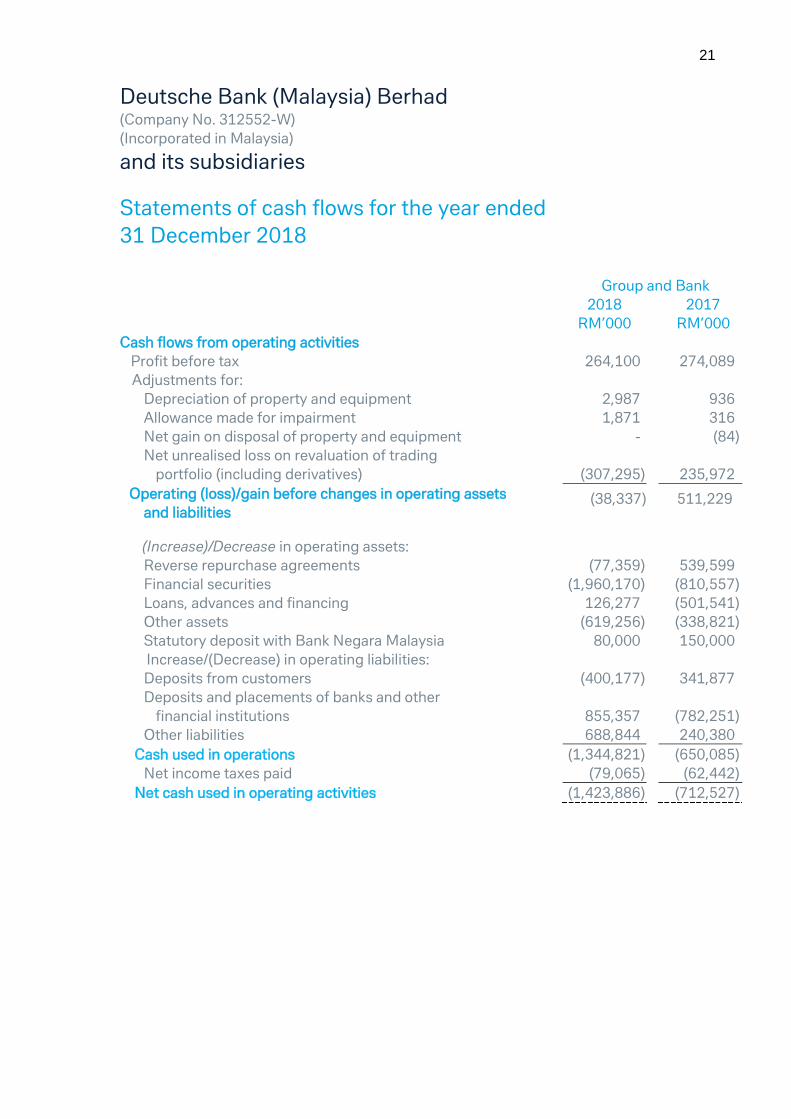
Statements of cash flows for the year ended
31 December 2018
Group and Bank
2018 2017
RM’000 RM’000
Cash flows from operating activities
Profit before tax 264,100 274,089
Adjustments for:
Depreciation of property and equipment 2,987 936
Allowance made for impairment 1,871 316
Net gain on disposal of property and equipment - (84)
Net unrealised loss on revaluation of trading
portfolio (including derivatives)
(307,295)
235,972
Operating (loss)/gain before changes in operating assets
and liabilities (38,337) 511,229
(Increase)/Decrease in operating assets:
Reverse repurchase agreements (77,359) 539,599
Financial securities (1,960,170) (810,557)
Loans, advances and financing 126,277 (501,541)
Other assets (619,256) (338,821)
Statutory deposit with Bank Negara Malaysia 80,000 150,000
Increase/(Decrease) in operating liabilities:
Deposits from customers (400,177) 341,877
Deposits and placements of banks and other
financial institutions
855,357
(782,251)
Other liabilities 688,844 240,380
Cash used in operations (1,344,821) (650,085)
Net income taxes paid (79,065) (62,442)
Net cash used in operating activities (1,423,886) (712,527)

22
Company No. 312552-W
Statements of cash flows for the year ended
31 December 2018 (continued)
Group and Bank
2018 2017
RM’000 RM’000
Cash flows from investing activities
Purchase of property and equipment (1,824) (850)
Proceeds from disposal of property and equipment - 99
Net cash used in investing activities (1,824) (751)
Cash flows from financing activity
Dividends paid (155,000) (147,039)
Net cash used in financing activity (155,000) (147,039)
Net decrease in cash and cash equivalents (1,580,710) (860,317)
Cash and cash equivalents at 1 January 3,749,261 4,609,578
Cash and cash equivalents at 31 December (i) 2,168,551 3,749,261
(i) Cash and cash equivalents comprise:
Cash and short-term funds 1,793,561 3,416,228
Deposits and placements with banks and
other financial institution
374,990
333,033
2,168,551 3,749,261
The notes on pages 23 to 131 are an integral part of these financial statements.

23
Deutsche Bank (Malaysia) Berhad (Company No. 312552-W)
(Incorporated in Malaysia)
and its subsidiaries
Notes to the financial statements
Deutsche Bank (Malaysia) Berhad (“the Bank”) is a public limited liability company
incorporated and domiciled in Malaysia. The address of both its registered office and
principal place of business is located at Level 18, Menara IMC, 8, Jalan Sultan Ismail,
50250 Kuala Lumpur. The consolidated financial statements of the Bank as at and for the
year ended 31 December 2018 comprise the Bank and its subsidiaries (together referred
to as the “Group” and individually referred to as “Group entities”).
The Bank is principally engaged in banking and related financial services that also include
Islamic Banking business, whilst the principal activities of the subsidiaries are stated at
Note 8 to the financial statements.
The immediate and ultimate holding company of the Bank is Deutsche Bank
Aktiengesellschaft, a bank incorporated in Germany.
The financial statements were approved and authorised for issue by the Board of Directors
on ________________.
1. Basis of preparation
(a) Statement of compliance
The financial statements of the Group and of the Bank have been prepared in
accordance with Malaysian Financial Reporting Standards (“MFRSs”),
International Financial Reporting Standards (“IFRSs”) and the requirements of
the Companies Act 2016 in Malaysia.

24
Company No. 312552-W
1. Basis of preparation (continued)
(a) Statement of compliance (continued)
Pursuant to paragraph 10.5 of the Guidelines on Financial Reporting issued by
Bank Negara Malaysia, all banking institutions are required to maintain in
aggregate, loss allowance for non-credit-impaired exposures and regulatory
reserve of no less than 1.0% over the total credit exposures, net of loss
allowance for credit-impaired exposures. The Bank has complied with this
minimum requirement as at 31 December 2018.
The following are accounting standards, amendments and interpretations that
have been issued by the Malaysian Accounting Standards Board (“MASB”) but
have not been adopted by the Group and the Bank:
MFRSs, Interpretations and amendments effective for annual periods
beginning on or after 1 January 2019
MFRS 16, Leases
IC Interpretation 23, Uncertainty over Income Tax Treatments
Amendments to MFRS 3, Business Combinations (Annual Improvements to
MFRS Standards 2015-2017 Cycle)
Amendments to MFRS 9, Financial Instruments – Prepayment Features with
Negative Compensation
Amendments to MFRS 11, Joint Arrangements (Annual Improvements to
MFRS Standards 2015-2017 Cycle)
Amendments to MFRS 112, Income Taxes (Annual Improvements to MFRS
Standards 2015-2017 Cycle)
Amendments to MFRS 119, Employee Benefits – Plan Amendment,
Curtailment or Settlement
Amendments to MFRS 123, Borrowing Costs (Annual Improvements to
MFRS Standards 2015-2017 Cycle)
Amendments to MFRS 128, Investments in Associates and Joint Ventures –
Long-term Interests in Associates and Joint Venture
MFRSs, Interpretations and amendments effective for annual periods beginning
on or after 1 January 2020
Amendments to MFRS 3, Business Combinations – Definition of a Business
Amendments to MFRS 101, Presentation of Financial Statements and MFRS
108, Accounting Policies, Changes in Accounting Estimates and Errors –
Definition of Material

25
Company No. 312552-W
1. Basis of preparation (continued)
(a) Statement of compliance (continued)
MFRSs, Interpretations and amendments effective for annual periods beginning
on or after 1 January 2021
MFRS 17, Insurance Contracts
MFRSs, Interpretations and amendments effective for annual periods
beginning on or after a date yet to be confirmed
Amendments to MFRS 10, Consolidated Financial Statements and MFRS
128, Investments in Associates and Joint Ventures – Sale or Contribution of
Assets between an Investor and its Associate or Joint Venture
The Group and the Bank plan to apply the abovementioned accounting
standards, amendments and interpretations, where applicable:
from the annual period beginning on 1 January 2019 for the accounting
standard, amendments and interpretation that are effective for annual
periods beginning on or after 1 January 2019;
from the annual period beginning on 1 January 2020 for the amendments
that are effective for annual periods beginning on or after 1 January 2020;
and
from the annual period beginning on 1 January 2021 for the accounting
standard that is effective for annual periods beginning on or after 1 January
2021.
The initial application of the accounting standards, amendments and
interpretations are not expected to have any material financial impact to the
current period and prior period financial statements of the Group and the Bank.

26
Company No. 312552-W
1. Basis of preparation (continued)
(b) Basis of measurement
The financial statements of the Group and the Bank have been prepared on the
historical cost basis, except as mentioned in the respective accounting policy
notes.
The financial statements incorporate all activities relating to the Islamic Banking
business which have been undertaken by the Group and the Bank. Islamic
Banking business refers generally to the acceptance of deposits and granting
of financing under the principles of Shariah.
(c) Functional and presentation currency
The financial statements are presented in Ringgit Malaysia (“RM”) which is also
the functional currency of the Bank. All financial information is presented in RM
and has been rounded to the nearest thousand (RM’000), unless otherwise
stated.
(d) Use of estimates and judgements
The preparation of the financial statements requires management to make
judgements, estimates and assumptions that affect the application of
accounting policies and the reported amount of assets, liabilities, income and
expenses. Actual results may differ from these estimates.
Estimates and underlying assumptions are reviewed on an ongoing basis.
Revisions to accounting estimates are recognised in the period in which the
estimates are revised and in any future periods affected.
Significant areas of estimation, uncertainty and critical judgements used in
applying accounting policies that have significant effect on the amount
recognised in the financial statements are described in the following notes:
Note 2(c)(vi) and 33.2 – Fair value of financial instruments
Note 2(d)(i) – Impairment of financial assets
Note 10 – Deferred tax assets

27
Company No. 312552-W
2. Significant accounting policies
The accounting policies set out below have been applied consistently to the periods
presented in these financial statements, and have been applied consistently by the
Group entities, unless otherwise stated.
Arising from the adoption of MFRS 9, Financial Instruments, there are changes to the
accounting policies of financial instruments and impairment of financial assets as
compared to those adopted in previous financial statements. The impacts arising
from the changes are disclosed in Note 2(c), Note 2(d)(i) and Note 35.
(a) Basis of consolidation
(i) Subsidiaries
Subsidiaries are entities, including structured entities, controlled by the
Bank. The financial statements of subsidiaries are included in the
consolidated financial statements from the date that control commences
until the date that control ceases.
The Bank controls an entity when it is exposed, or has rights, to variable
returns from its involvement with the entity and has the ability to affect
those returns through its power over the entity. Potential voting rights are
considered when assessing control only when such rights are substantive.
The Bank also considers it has de facto power over an investee when,
despite not having the majority of voting rights, it has the current ability to
direct the activities of the investee that significantly affect the investee’s
return.
Investments in subsidiaries are measured in the Bank’s statement of
financial position at cost less any impairment losses, unless the investment
is classified as held for sale or distribution. The cost of investment includes
transaction costs.
(ii) Loss of control
Upon the loss of control of a subsidiary, the Bank derecognises the assets
and liabilities of the former subsidiary, any non-controlling interests and
the other components of equity related to the former subsidiary from the
consolidated statement of financial position. Any surplus or deficit arising
on the loss of control is recognised in profit or loss. If the Bank retains any
interest in the former subsidiary, then such interest is measured at fair
value at the date that control is lost. Subsequently, it is accounted for as
an equity accounted investee or as a financial asset depending on the level
of influence retained.

28
Company No. 312552-W
2. Significant accounting policies (continued)
(a) Basis of consolidation (continued)
(iii) Transactions eliminated on consolidation
Intra-group balances and transactions, and any unrealised income and
expenses arising from intra-group transactions, are eliminated in
preparing the consolidated financial statements.
(b) Cash and cash equivalents
Cash and cash equivalents comprise cash and balances with banks and other
financial institutions, and short-term deposits maturing within three months.
(c) Financial instruments
Unless specifically disclosed below, the Group and the Bank generally applied
the following accounting policies retrospectively. Nevertheless, as permitted by
MFRS 9, Financial Instruments, the Group and the Bank have elected not to
restate the comparative.
(i) Recognition and initial measurement
A financial asset or a financial liability is recognised in the statements
of financial position when, and only when, the Group or the Bank
becomes a party to the contractual provisions of the instrument.
A financial instrument is recognised initially, at its fair value plus, in the
case of a financial instrument not at fair value through profit or loss,
transaction costs that are directly attributable to the acquisition or
issue of the financial instrument.

29
Company No. 312552-W
2. Significant accounting policies (continued)
(c) Financial instruments (continued)
(ii) Financial instrument categories and subsequent measurement
Current financial year
Financial assets
Under MFRS 9, on initial recognition, a financial asset is classified as
measured at: amortised cost; fair value through other comprehensive
income (“FVOCI”) – debt securities; FVOCI – equity investments; or fair
value through profit or loss (“FVTPL”). The classification of financial
assets under MFRS 9 is generally based on the business model in which
a financial asset is managed and its contractual cash flow characteristics.
Derivatives embedded in contracts where the host is a financial asset in
the scope of the standard are never separated. Instead, the hybrid
financial instrument as a whole is assessed for classification.
A financial asset is measured at amortised cost if it meets both of the
following conditions and is not designated as at FVTPL:
it is held within a business model whose objective is to hold assets
to collect contractual cash flows; and
its contractual terms give rise on specified dates to cash flows that
are solely payments of principal and interest on the principal
outstanding.
A debt security is measured at FVOCI if it meets both of the following
conditions and is not designated as at FVTPL:
it is held within a business model whose objective is achieved by
both collecting contractual cash flows and selling financial assets;
and
its contractual terms give rise on specified dates to cash flows that
are solely payments of principal and interest on the principal
outstanding.
On initial recognition of an equity investment that is not held for trading,
the Group and the Bank may irrevocably elect to present subsequent
changes in the investment’s fair value in other comprehensive income
(“OCI”). This election is made on an investment-by-investment basis.
30
Company No. 312552-W
2. Significant accounting policies (continued)
(c) Financial instruments (continued)
(ii) Financial instrument categories and subsequent measurement
(continued)
Current financial year (continued)
Financial assets (continued)
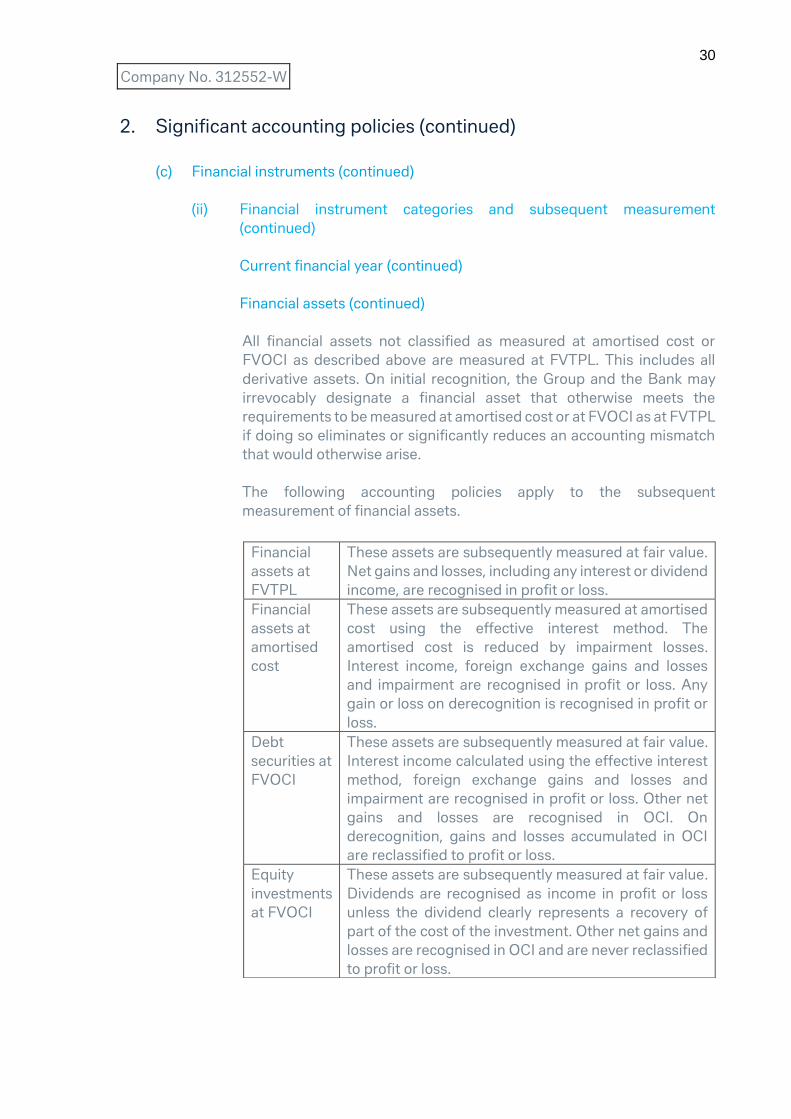
All financial assets not classified as measured at amortised cost or
FVOCI as described above are measured at FVTPL. This includes all
derivative assets. On initial recognition, the Group and the Bank may
irrevocably designate a financial asset that otherwise meets the
requirements to be measured at amortised cost or at FVOCI as at FVTPL
if doing so eliminates or significantly reduces an accounting mismatch
that would otherwise arise.
The following accounting policies apply to the subsequent
measurement of financial assets.
Financial
assets at
FVTPL
These assets are subsequently measured at fair value.
Net gains and losses, including any interest or dividend
income, are recognised in profit or loss.
Financial
assets at
amortised
cost
These assets are subsequently measured at amortised
cost using the effective interest method. The
amortised cost is reduced by impairment losses.
Interest income, foreign exchange gains and losses
and impairment are recognised in profit or loss. Any
gain or loss on derecognition is recognised in profit or
loss.
Debt
securities at
FVOCI
These assets are subsequently measured at fair value.
Interest income calculated using the effective interest
method, foreign exchange gains and losses and
impairment are recognised in profit or loss. Other net
gains and losses are recognised in OCI. On
derecognition, gains and losses accumulated in OCI
are reclassified to profit or loss.
Equity
investments
at FVOCI
These assets are subsequently measured at fair value.
Dividends are recognised as income in profit or loss
unless the dividend clearly represents a recovery of
part of the cost of the investment. Other net gains and
losses are recognised in OCI and are never reclassified
to profit or loss.

31
Company No. 312552-W
2. Significant accounting policies (continued)
(c) Financial instruments (continued)
(ii) Financial instrument categories and subsequent measurement
(continued)
Current financial year (continued)
Financial liabilities
The categories of financial liabilities at initial recognition are as follows:
(a) Fair value through profit or loss
Fair value through profit or loss category comprises financial
liabilities that are derivatives (except for a derivative that is a financial
guarantee contract or a designated and effective hedging instrument)
and financial liabilities that are specifically designated into this
category upon initial recognition.
On initial recognition, the Group or the Bank may irrevocably
designate a financial liability that otherwise meets the requirements
to be measured at amortised cost as at fair value through profit or
loss:
(a) if doing so eliminates or significantly reduces an accounting
mismatch that would otherwise arise;
(b) a group of financial liabilities or assets and financial liabilities is
managed and its performance is evaluated on a fair value basis,
in accordance with a documented risk management or
investment strategy, and information about the group is provided
internally on that basis to the Group’s key management
personnel; or
(c) if a contract contains one or more embedded derivatives and the
host is not a financial asset in the scope of MFRS 9, where the
embedded derivative significantly modifies the cash flows and
separation is not prohibited.

32
Company No. 312552-W
2. Significant accounting policies (continued)
(c) Financial instruments (continued)
(ii) Financial instrument categories and subsequent measurement
(continued)
Current financial year (continued)
Financial liabilities (continued)
(a) Fair value through profit or loss (continued)
Financial liabilities categorised as fair value through profit or loss are
subsequently measured at their fair value with gains or losses,
including any interest expense are recognised in profit or loss.
For financial liabilities where it is designated as fair value through
profit or loss upon initial recognition, the Group and the Bank
recognise the amount of change in fair value of the financial liability
that is attributable to change in credit risk in the other
comprehensive income and remaining amount of the change in fair
value in the profit or loss, unless the treatment of the effects of
changes in the liability’s credit risk would create or enlarge an
accounting mismatch.
(b) Amortised cost
Other financial liabilities not categorised as fair value through profit
or loss are subsequently measured at amortised cost using the
effective interest method.
Interest expense and foreign exchange gains and losses are
recognised in the profit or loss. Any gains or losses on derecognition
are also recognised in profit or loss.

33
Company No. 312552-W
2. Significant accounting policies (continued)
(c) Financial instruments (continued)
(ii) Financial instrument categories and subsequent measurement
(continued)
Previous financial year
In the previous financial year, financial instruments of the Group and
the Bank were classified and measured under MFRS 139, Financial
Instruments: Recognition and Measurement as follows:
Financial assets
i. Financial assets at fair value through profit or loss
Fair value through profit or loss category comprised financial
assets that were held-for-trading, including derivatives or financial
assets that were specifically designated into this category upon
initial recognition.
Derivatives that were linked to and must be settled by delivery of
unquoted equity instruments whose fair values could not be
reliably measured were measured at cost.
Financial assets categorised as fair value through profit or loss
were subsequently measured at their fair values with the gain or
loss recognised in profit or loss.
34
Company No. 312552-W
2. Significant accounting policies (continued)
(c) Financial instruments (continued)
(ii) Financial instrument categories and subsequent measurement
(continued)
Previous financial year (continued)
Financial assets (continued)
ii. Loans and receivables
Loans and receivables category comprised debt instruments
that were not quoted in an active market.
Financial assets categorised as loans and receivables were
subsequently measured at amortised cost using the effective
interest method.
iii. Financial investments available-for-sale
Available-for-sale financial assets were non-derivative financial
assets, comprising investment in equity and debt securities
instruments that were not categorised into any of the other
categories above. Financial assets available-for-sale were
usually held for an indefinite period of time, which may be sold
in response to liquidity requirement or changes in market
conditions.
iv. Financial investments available-for-sale
Investments in equity instruments that did not have a quoted
market price in an active market and whose fair value could not
be reliably measured were measured at cost. Other financial
assets categorised as available-for-sale were subsequently
measured at their fair values with the gain or loss recognised in
other comprehensive income, except for impairment losses,
foreign exchange gains and losses arising from monetary items
which were recognised in profit or loss. On derecognition, the
cumulative gain or loss recognised in other comprehensive
income was reclassified from equity into profit or loss. Interest
calculated for a debt instrument using the effective interest
method was recognised in profit or loss.
All financial assets, except for those measured at fair value through
profit or loss, were subject to impairment assessment.

35
Company No. 312552-W
2. Significant accounting policies (continued)
(c) Financial instruments (continued)
(ii) Financial instrument categories and subsequent measurement
(continued)
Previous financial year (continued)
Financial liabilities
All financial liabilities were subsequently measured at amortised cost
other than those categorised as fair value through profit or loss.
Fair value through profit or loss category comprised financial
liabilities that were held-for-trading, including derivatives or financial
liabilities that were specifically designated into this category upon
initial recognition.
Derivatives that were linked to and must be settled by delivery of
unquoted equity instruments whose fair values could not be reliably
measured were measured at cost.
Financial liabilities categorised as fair value through profit or loss
were subsequently measured at their fair values with the gain or loss
recognised in profit or loss.
36
Company No. 312552-W
2. Significant accounting policies (continued)
(c) Financial instruments (continued)
(iii) Financial guarantee contracts
A financial guarantee contract is a contract that requires the issuer to
make specified payments to reimburse the holder for a loss it incurs
because a specified debtor fails to make payment when due in accordance
with the original or modified terms of a debt instrument.
Current financial year
Financial guarantees issued are initially measured at fair value.
Subsequently, they are measured at higher of:
the amount of the loss allowance; and
the amount initially recognised less, when appropriate, the
cumulative amount of income recognised in accordance to the
principles of MFRS 15, Revenue from Contracts with Customers.
Liabilities arising from financial guarantees are presented together with
other provisions.
Previous financial year
In the previous financial year, fair value arising from financial guarantee
contracts were classified as deferred income and were amortised to profit
or loss using straight-line method over the contractual period or, when
there was no specified contractual period, recognised in profit or loss upon
discharge of the guarantee. When settlement of a financial guarantee
contract was probable, an estimate of the obligation was made. If the
carrying value of the financial guarantee contract was lower than the
obligation, the carrying value was adjusted to the obligation amount and
accounted for as a provision.
(iv) Regular way purchase or sale of financial assets
A regular way purchase or sale is a purchase or sale of a financial asset
under a contract whose terms require delivery of the asset within the time
frame established generally by regulation or convention in the
marketplace concerned.
A regular way purchase or sale of financial assets is recognised and
derecognised, as applicable, using trade date accounting. Trade date
accounting refers to:
(a) the recognition of an asset to be received and the liability to pay for
it on the trade date, and
(b) derecognition of an asset that is sold, recognition of any gain or loss
on disposal and the recognition of a receivable from the buyer for
payment on the trade date.
37
Company No. 312552-W
2. Significant accounting policies (continued)
(c) Financial instruments (continued)
(v) Derecognition
A financial asset or part of it is derecognised when, and only when, the
contractual rights to the cash flows from the financial asset expire or the
financial asset is transferred to another party without retaining control or
substantially all risks and rewards of the asset. On derecognition of a
financial asset, the difference between the carrying amount and the sum
of the consideration received (including any new asset obtained less any
new liability assumed) is recognised in the profit or loss.
A financial liability or a part of it is derecognised when, and only when, the
obligation specified in the contract is discharged or cancelled or expires.
On derecognition of a financial liability, the difference between the
carrying amount of the financial liability extinguished or transferred to
another party and the consideration paid, including any non-cash assets
transferred or liabilities assumed, is recognised in the profit or loss.
(vi) Determination of fair value
Fair value of an asset or a liability, except for share-based payment and
lease transactions, is determined as the price that would be received to
sell an asset or paid to transfer a liability in an orderly transaction between
market participants at the measurement date. The measurement assumes
that the transaction to sell the asset or transfer the liability takes place
either in the principal market or in the absence of a principal market, in the
most advantageous market.
For non-financial asset, the fair value measurement takes into account a
market participant’s ability to generate economic benefits by using the
asset in its highest and best use or by selling it to another market
participant that would use the asset in its highest and best use.
When measuring the fair value of an asset or a liability, the Group uses
observable market data as far as possible. Fair value are categorised into
different levels in a fair value hierarchy based on the input used in the
valuation technique as follows:

38
Company No. 312552-W
2. Significant accounting policies (continued)
(c) Financial instruments (continued)
(vi) Determination of fair value (continued)
Level 1: quoted prices (unadjusted) in active markets for identical
assets or liabilities that the Group can access at the
measurement date.
Level 2: inputs other than quoted prices included within Level 1 that are
observable for the asset or liability, either directly or indirectly.
Level 3: unobservable inputs for the asset or liability.
The Group recognises transfers between levels of the fair value hierarchy
as of the date of the event or change in circumstances that caused the
transfers.
For financial instruments measured at fair value, where available, quoted
and observable market prices in an active market or dealer price
quotations are used to measure fair value. These include listed equity
securities and broker quotes on Bloomberg and Reuters.
Where such quoted and observable market prices are not available, fair
values are determined using appropriate valuation techniques, which
include the use of mathematical models, such as discounted cash flow
models and option pricing models, comparison to similar instruments for
which market observable prices exist and other valuation techniques.
Valuation techniques used incorporate assumptions regarding discount
rates, interest/profit rate yield curves, estimates of future cash flows and
other factors, as applicable. The Group and the Bank generally use widely
recognised valuation techniques with market observable inputs, if
available, for the determination of fair value.

39
Company No. 312552-W
2. Significant accounting policies (continued)
(c) Financial instruments (continued)
(vi) Determination of fair value (continued)
If prices and parameter inputs or assumptions are not observable, the
appropriateness of fair value is subject to additional procedures to assess
its reasonableness. Such procedures include performing revaluations
using independently generated models, assessing the valuations against
appropriate proxy instruments, performing sensitivity analysis and
extrapolation techniques, and considering other benchmarks. Assessment
is made as to whether the valuation techniques yield fair value estimates
that are reflective of the way the market operates by calibrating the results
of the valuation models. These procedures require the application of
management judgement.
(vii) Offsetting of financial instruments
Financial assets and liabilities are offset and the net amount reported in
the statements of financial position when there is a legally enforceable
right to offset the recognised amounts and there is an intention to settle
on a net basis, or to realise the asset and to settle the liability
simultaneously. This is not generally the case with master netting
agreements and therefore, the related assets and liabilities are presented
on a gross basis in the statements of financial position.

40
Company No. 312552-W
2. Significant accounting policies (continued)
(d) Impairment
Unless specifically disclosed below, the Group and the Bank generally applied
the following accounting policies retrospectively. Nevertheless, as permitted
by MFRS 9, Financial Instruments, the Group and the Bank elected not to
restate the comparatives.
i. Financial assets
Current financial year
MFRS 9 replaces the ‘incurred loss’ model in MFRS 139 with an ‘expected
credit loss’ model. The new impairment model applies to all debt
instruments that are measured at amortised cost or FVOCI, and to off-
balance sheet credit exposures such as loan commitments and financial
guarantees (hereafter collectively referred to as “Financial Assets”).
Staged Approach to the Determination of Expected Credit Losses
MFRS 9 introduces a three stage approach to impairment for Financial
Assets at the date of origination or purchase. This approach is summarised
as follows:
Stage 1: The Bank recognises a loss allowance at an amount equal to
12-month expected credit losses (“ECL”). This represents the portion
of lifetime ECL from default events that are expected within 12 months
of the reporting date, assuming that credit risk has not increased
significantly after initial recognition.
Stage 2: The Bank recognises a loss allowance at an amount equal to
lifetime ECL for those Financial Assets which are considered to have
experienced a significant increase in credit risk since initial recognition.
This requires the computation of ECL based on lifetime probability of
default (LTPD) that represents the probability of default occurring over
the remaining lifetime of the Financial Asset. Allowance for credit
losses are higher in this stage because of an increase in credit risk and
the impact of a longer time horizon being considered compared to 12
months in Stage 1.
Stage 3: The Bank recognises a loss allowance at an amount equal to
lifetime ECL, reflecting a Probability of Default (PD) of 100 %, via the
recoverable cash flows for the asset, for those Financial Assets that are
credit-impaired. The Group’s definition of default is aligned with the
regulatory definition. The treatment of loans in Stage 3 remains
substantially the same as the treatment of impaired loans under MFRS
139.
Financial Assets that are credit-impaired upon initial recognition, if any, are
categorised within Stage 3 with a carrying value already reflecting the
lifetime ECL.

41
Company No. 312552-W
2. Significant accounting policies (continued)
(d) Impairment (continued)
i. Financial assets (continued)
Current financial year (continued)
Significant Increase in Credit Risk
Under MFRS 9, when determining whether the credit risk (i.e., risk of
default) of a Financial Asset has increased significantly since initial
recognition, the Bank considers reasonable and supportable information
that is relevant and available without undue cost or effort. This includes
quantitative and qualitative information based on historical experience,
credit risk assessment and forward-looking information (including macro-
economic factors). The assessment of significant credit deterioration is key
in determining when to move from measuring an allowance based on 12-
month ECLs to one that is based on lifetime ECLs.
Credit-impaired financial assets
The determination of whether a Financial Asset is credit impaired focusses
exclusively on default risk, without taking into consideration the effects of
credit risk mitigants such as collateral or guarantees. Specifically, a
Financial Asset is credit impaired and in Stage 3 when:
The Bank considers the obligor is unlikely to pay its credit obligations
to the Bank. Determination may include forbearance actions, where a
concession has been granted to the borrower or economic or legal
reasons that are qualitative indicators of credit impairment; or
Contractual payments of either principal or interest by the obligor are
past due by more than 90 days.
For Financial Assets considered to be credit impaired, the ECL allowance
covers the amount of loss the Bank is expected to suffer. Forecasts of
future economic conditions when calculating ECLs are considered. The
lifetime expected losses are estimated based on the probability-weighted
present value of the difference between 1) the contractual cash flows that
are due to the Bank under the contract; and 2) the cash flows that the Bank
expects to receive.

42
Company No. 312552-W
2. Significant accounting policies (continued)
(d) Impairment (continued)
i. Financial assets (continued)
Previous financial year
All financial assets (except for financial assets categorised as fair value
through profit or loss and investments in subsidiaries) were assessed at
each reporting date whether there was any objective evidence of
impairment as a result of one or more events having an impact on the
estimated future cash flows of the asset. Losses expected as a result of
future events, no matter how likely, were not recognised. For an equity
instrument, a significant or prolonged decline in the fair value below its
cost was an objective evidence of impairment. If any such objective
evidence exists, then the impairment loss of the financial assets was
estimated.
In respect of loans, advances and financing, the Group and the Bank first
assessed whether objective evidence of impairment existed individually
for loans which were individually significant, or collectively for loans which
were not individually significant. An individually assessed loan was
deemed to be impaired if, and only if, there was objective evidence of
impairment as a result of one or more events that had occurred after the
initial recognition of the loans (an incurred “loss event”) and that loss event
(or events) had an impact on the present value of estimated future cash
flows of the loans that could be reliably estimated.
Objective evidence of impairment may include indications that a borrower
or a group of borrowers was experiencing significant financial difficulty,
default or delinquency in interest or principal payments, that it was
possible that they would enter bankruptcy or other financial
reorganisation and that there were observable data indicating a
measurable decrease in the estimated future cash flows, such as changes
in arrears or economic conditions that correlated with default.
43
Company No. 312552-W
2. Significant accounting policies (continued)
(d) Impairment (continued)
i. Financial assets (continued)
Previous financial year (continued)
If there was objective evidence that an impairment loss had been incurred,
the amount of loss was measured as the difference between the loan’s
carrying amount and the present value of the estimated future cash flows
discounted at the loan’s original effective interest rate. The carrying
amount of the loan was reduced through the use of an allowance account
and the amount of loss was recognised in the profit or loss. Where
appropriate, the calculation of the present value of estimated future cash
flows of a collateralised loan reflected the cash flows that may result from
foreclosure less costs for obtaining and selling the collateral, whether or
not foreclosure was probable.
Where a loan was not recoverable, it was written off against the related
allowance for loan impairment. Such loans were written off after the
necessary procedures had been completed and the amount of the loss had
been determined. Subsequent recoveries of the amounts previously
written off were recognised in the profit or loss.
Under the Guidelines on Classification and Impairment Provision for
Loans/Financing issued by BNM where loans, advances and financing that
was past due for more than 90 days/3 months should be classified as
impaired. The Bank applied this policy in addition to the above when
determining if a loan was impaired.

44
Company No. 312552-W
2. Significant accounting policies (continued)
(d) Impairment (continued)
i. Financial assets (continued)
Previous financial year (continued)
An impairment loss in respect of financial investments available-for-sale
was recognised in profit or loss and was measured as the difference
between the asset’s acquisition cost (net of any principal repayment and
amortisation) and the asset’s current fair value, less any impairment loss
previously recognised. Where a decline in the fair value of a financial
investment available-for-sale had been recognised in the other
comprehensive income, the cumulative loss in other comprehensive
income was reclassified from equity and recognised to profit or loss.
An impairment loss in respect of unquoted equity instrument that was
carried at cost was recognised in profit or loss and was measured as the
difference between the asset’s carrying amount and the present value of
estimated future cash flows discounted at the current market rate of return
for a similar financial asset.
Impairment losses recognised in profit or loss for an investment in an
equity instrument classified as available-for-sale was not reversed through
profit or loss.
If, in a subsequent period, the fair value of a debt instrument increased and
the increase could be objectively related to an event occurring after the
impairment loss was recognised in profit or loss, the impairment loss was
reversed, to the extent that the asset’s carrying amount did not exceed
what the carrying amount would have been had the impairment not been
recognised at the date the impairment was reversed. The amount of the
reversal was recognised in profit or loss.
ii. Other assets
The carrying amounts of other assets (except for deferred tax assets) are
reviewed at the end of each reporting period to determine whether there
is any indication of impairment. If any such indication exists, then the
asset’s recoverable amount is estimated.
For the purpose of impairment testing, assets are grouped together into
the smallest group of assets that generates cash inflows from continuing
use that are largely independent of the cash inflows of other assets or
groups of assets (the “cash-generating unit”).
45
Company No. 312552-W
2. Significant accounting policies (continued)
(d) Impairment (continued)
ii. Other assets (continued)
The recoverable amount of an asset or cash-generating unit is the greater
of its value in use and its fair value less costs of disposal. In assessing value
in use, the estimated future cash flows are discounted to their present
value using a pre-tax discount rate that reflects current market
assessments of the time value of money and the risks specific to the asset
or cash-generating unit.
An impairment loss is recognised if the carrying amount of an asset or its
cash-generating unit exceeds its recoverable amount.
Impairment losses are recognised in profit or loss. Impairment losses
recognised in respect of cash-generating units are allocated to reduce the
carrying amounts of the assets in the cash-generating unit (groups of
cash-generating units) on a pro rata basis.
Impairment losses recognised in prior periods are assessed at the end of
each reporting period for any indications that the loss has decreased or no
longer exists. An impairment loss is reversed if there has been a change in
the estimates used to determine the recoverable amount since the last
impairment loss was recognised. An impairment loss is reversed only to
the extent that the asset’s carrying amount does not exceed the carrying
amount that would have been determined, net of depreciation or
amortisation, if no impairment loss had been recognised. Reversals of
impairment losses are credited to profit or loss in the year in which the
reversals are recognised.

46
Company No. 312552-W
2. Significant accounting policies (continued)
(e) Repurchase agreements
Reverse repurchase agreements are securities which the Bank commits to resell
at future dates and are reflected as an asset.
Repurchase agreements are obligations which the Bank commits to repurchase
at future dates and are reflected as a liability.
(f) Property and equipment
(i) Recognition and measurement
Items of property and equipment are measured at cost less accumulated
depreciation and accumulated impairment losses, if any.
Cost includes expenditures that are directly attributable to the acquisition
of the asset and any other costs directly attributable to bringing the asset
to working condition for its intended use, and the costs of dismantling and
removing the items and restoring the site on which they are located. The
cost of self-constructed assets also includes the cost of materials and
direct labour.
When significant parts of an item of property and equipment have
different useful lives, they are accounted for as separate items (major
components) of property and equipment.
Gains and losses on disposal of an item of property and equipment are
determined by comparing the proceeds from disposal with the carrying
amount of property and equipment and are recognised net within “other
operating income” and “other operating expenses” respectively in profit
or loss.
(ii) Subsequent costs
The cost of replacing part of an item of property and equipment is
recognised in the carrying amount of the item if it is probable that the
future economic benefits embodied within the part will flow to the Group
or the Bank, and its cost can be measured reliably. The carrying amount of
the replaced part is derecognised to profit or loss. The costs of the day-to-
day servicing of property and equipment are recognised in profit or loss as
incurred.

47
Company No. 312552-W
2. Significant accounting policies (continued)
(f) Property and equipment (continued)
(iii) Depreciation
Depreciation is calculated on the depreciable amount, which is the cost of
an asset, or other amount substituted for cost, less its residual value.
Depreciation is recognised in profit or loss on a straight-line basis over the
estimated useful lives of each component of an item of property and
equipment from the date that they are available for use. Leased assets are
depreciated over the shorter of the lease term and their useful lives unless
it is reasonably certain that the Group or the Bank will obtain ownership by
the end of the lease term. The estimated useful lives for the current and
comparative periods are as follows:
Renovations 5 – 10 years
Office equipment 4 – 10 years
Computer equipment and software 3 – 5 years
Furniture and fittings 5 – 10 years
Motor vehicles 4 – 5 years
Depreciation methods, useful lives and residual values are reviewed, and
adjusted as appropriate at the end of the reporting period.
48
Company No. 312552-W
2. Significant accounting policies (continued)
(g) Income tax
Income tax expense comprises current and deferred tax. Current tax and
deferred tax are recognised in profit or loss except to the extent that it relates
to a business combination or items recognised directly in equity or other
comprehensive income.
Current tax is the expected tax payable or receivable on the taxable income or
loss for the year, using tax rates enacted or substantively enacted by the end of
the reporting period, and any adjustment to tax payable in respect of previous
financial years.
Deferred tax is recognised using the liability method, providing for temporary
differences between the carrying amounts of assets and liabilities in the
statements of financial position and their tax bases. Deferred tax is not
recognised for the following temporary differences: the initial recognition of
goodwill, the initial recognition of assets or liabilities in a transaction that is not
a business combination and that affects neither accounting nor taxable profit or
loss. Deferred tax is measured at the tax rates that are expected to be applied
to the temporary differences when they reverse, based on the laws that have
been enacted or substantively enacted by the end of the reporting period.
Deferred tax assets and liabilities are offset if there is a legally enforceable right
to offset current tax liabilities and assets, and they relate to income taxes levied
by the same tax authority on the same taxable entity, or on different tax entities,
but they intend to settle current tax assets and liabilities on a net basis or their
tax assets and liabilities will be realised simultaneously.
A deferred tax asset is recognised to the extent that it is probable that future
taxable profits will be available against which the temporary difference can be
utilised. Deferred tax assets are reviewed at the end of each reporting period
and are reduced to the extent that it is no longer probable that the related tax
benefit will be realised.
49
Company No. 312552-W
2. Significant accounting policies (continued)
(h) Recognition of interest and financing income and expense
Interest and financing income and expense for all interest-bearing financial
instruments are recognised in the statements of profit or loss and other
comprehensive income using the effective interest rates of the financial assets
or financial liabilities to which they relate.
The effective interest rate is the rate that exactly discounts estimated future
cash payments or receipts through the expected life of the financial asset or
financial liability, or where appropriate, a shorter period, to the net carrying
amount of the financial asset or financial liability. When calculating the effective
interest rate, the Group and the Bank estimate cash flows considering all
contractual terms of the financial instrument but not future credit losses. The
calculation includes all amounts paid or received by the Bank that are an integral
part of the effective interest rate, including transaction costs and all other
premiums or discounts.
(i) Recognition of fees and other income
Loan arrangement fees and commissions are recognised as income when all
conditions precedent are fulfilled.
Commitment fees and guarantee fees are recognised as income based on time
apportionment over the contractual period.
Dividends from securities are recognised when the right to receive payment is
established.

50
Company No. 312552-W
2. Significant accounting policies (continued)
(j) Foreign currency transactions
Transactions in foreign currencies are translated to the functional currency of
the Group and the Bank at exchange rates at the dates of the transactions.
Monetary assets and liabilities denominated in foreign currencies at the end of
the reporting period are retranslated to the functional currency at the exchange
rate at that date.
Non-monetary assets and liabilities denominated in foreign currencies that are
measured at fair value are retranslated to the functional currency at the
exchange rate at the date that the fair value was determined. Foreign currency
differences arising on retranslation are recognised in the profit or loss.
(k) Employee benefits
(i) Short-term employee benefits
Wages, salaries, bonuses and social security contributions are recognised
as an expense in the year in which the associated services are rendered by
employees of the Group and the Bank. Short-term accumulating
compensated absences such as paid annual leaves are recognised when
services are rendered by employees that increase their entitlement to
future compensated absences, and short-term non-accumulating
compensated absences such as sick leave are recognised when the
absences occur.
(ii) Defined contribution plan
As required by law, companies in Malaysia make contributions to the state
pension scheme, the Employees’ Provident Fund (“EPF”). Such
contributions are recognised as expense in the statements of profit or loss
and other comprehensive income as incurred.

51
Company No. 312552-W
2. Significant accounting policies (continued)
(k) Employee benefits (continued)
(iii) Share-based compensation
The Group and the Bank participate in equity-settled and cash-settled
share based compensation plan for the employees that is offered by the
ultimate holding company, Deutsche Bank Aktiengesellschaft, a bank
incorporated in Germany. The fair value of the services received in
exchange for the grant of the options is recognised as an expense in the
profit of loss over the vesting periods of the grant.
The total amount to be expensed over the vesting period is determined by
reference to the fair value of the options granted, excluding the impact of
any non-market vesting conditions. Non-market vesting conditions are
included in assumptions about the number of options that are expected to
vest. At each reporting date, the Group and the Bank revise its estimates
of the number of options that are expected to vest. The Group and the
Bank recognise the impact of the revision of original estimates, if any, in
the profit or loss.
(l) Operating lease
Leases, where the Group and the Bank do not assume substantially all the risks
and rewards of ownership are classified as operating leases and, except for
property interest held under operating lease, the leased assets are not
recognised on the statements of financial position.
Payments made under operating leases are recognised in the statements of
profit or loss and other comprehensive income on a straight-line basis over the
term of the lease. Lease incentives received are recognised in profit or loss as
an integral part of the total lease expense, over the term of the lease.

52
Company No. 312552-W
2. Significant accounting policies (continued)
(m) Earnings per ordinary share
The Group and the Bank present basic earnings per share (“EPS”) data for their
ordinary shares. Basic EPS is calculated by dividing the profit or loss
attributable to ordinary shareholders of the Group and the Bank by the weighted
average number of ordinary shares outstanding during the year.
(n) Provisions
A provision is recognised if, as a result of a past event, the Group or the Bank
has a present legal or constructive obligation that can be estimated reliably, and
it is probable that an outflow of economic benefits will be required to settle the
obligation. Provisions are determined by discounting the expected future cash
flows at a pre-tax rate that reflects current market assessments of the time value
of money and the risks specific to the liability. The unwinding of the discount is
recognised as finance cost.

53
Company No. 312552-W
3. Cash and cash equivalents
3.1 Cash and short-term funds
Group and Bank
2018 2017
RM’000 RM’000
Cash and balances with banks and other
financial institutions 355,351 279,993
Money at call and deposit placements
maturing within one month 1,438,210 3,136,235
1,793,561 3,416,228
3.2 Deposits and placements with banks and other financial institutions
Group and Bank
2018 2017
RM’000 RM’000
Licensed bank 374,990
330,000
Other financial institutions - 3,033
374,990 333,033
54
Company No. 312552-W
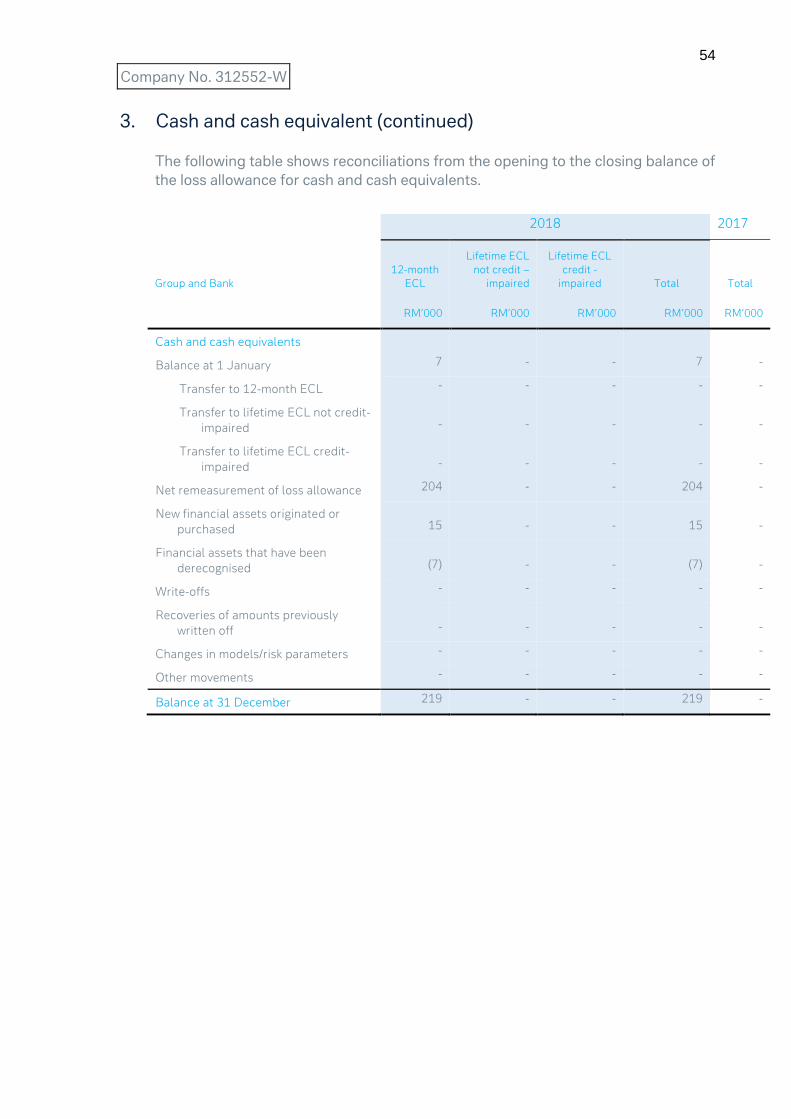
3. Cash and cash equivalent (continued)
The following table shows reconciliations from the opening to the closing balance of
the loss allowance for cash and cash equivalents.
2018 2017
Group and Bank
12-month
ECL
Lifetime ECL
not credit –
impaired
Lifetime ECL
credit -
impaired Total Total
RM’000 RM’000 RM’000 RM’000 RM’000
Cash and cash equivalents
Balance at 1 January 7 - - 7 -
Transfer to 12-month ECL - - - - -
Transfer to lifetime ECL not credit-
impaired - - - - -
Transfer to lifetime ECL credit-
impaired - - - - -
Net remeasurement of loss allowance 204 - - 204 -
New financial assets originated or
purchased 15 - - 15 -
Financial assets that have been
derecognised (7) - - (7) -
Write-offs - - - - -
Recoveries of amounts previously
written off - - - - -
Changes in models/risk parameters - - - - -
Other movements - - - - -
Balance at 31 December 219 - - 219 -

55
Company No. 312552-W
4. Financial securities
Group and Bank
2018 2017
RM’000 RM’000
Debt securities at FVTPL
Malaysian Government Securities 2,151,445 -
Malaysian Investment Issue 252,469 -
Cagamas bonds 200,000 -
Negotiable Instruments of Deposits 400,000 -
Treasury Bills 24,568 -
Corporate bonds 5,005 -
3,033,487 -
Debt securities at FVOCI
Malaysian Government Securities 272,281 -
Negotiable Instruments of Deposits 100,000 -
372,281 -
Equity investments at FVOCI
Unquoted shares in Malaysia 1,591 -
Financial assets held-for-trading
Malaysian Government Securities - 825,718
Malaysian Investment Issue - 620,084
- 1,445,802
Financial investments available-for-sale
Unquoted shares in Malaysia - 1,591
3,407,359 1,447,393

56
Company No. 312552-W
4. Financial securities (continued)
The following table show reconciliations from the opening to the closing balance of
the loss allowance for debt securities at FVOCI.
2018 2017
Group and Bank
12-month
ECL
Lifetime ECL
not credit –
impaired
Lifetime ECL
credit -
impaired Total Total
RM’000 RM’000 RM’000 RM’000 RM’000
Debt securities at FVOCI
Balance at 1 January 2 - - 2 -
Transfer to 12-month ECL - - - - -
Transfer to lifetime ECL not credit-
impaired - - - - -
Transfer to lifetime ECL credit-
impaired - - - - -
Net remeasurement of loss allowance - - - - -
New financial assets originated or
purchased 207 - - 207 -
Financial assets that have been
derecognised (2) - - (2) -
Write-offs - - - - -
Recoveries of amounts previously
written off - - - - -
Changes in models/risk parameters - - - - -
Other movements - - - - -
Balance at 31 December 207 - - 207 -
57
Company No. 312552-W
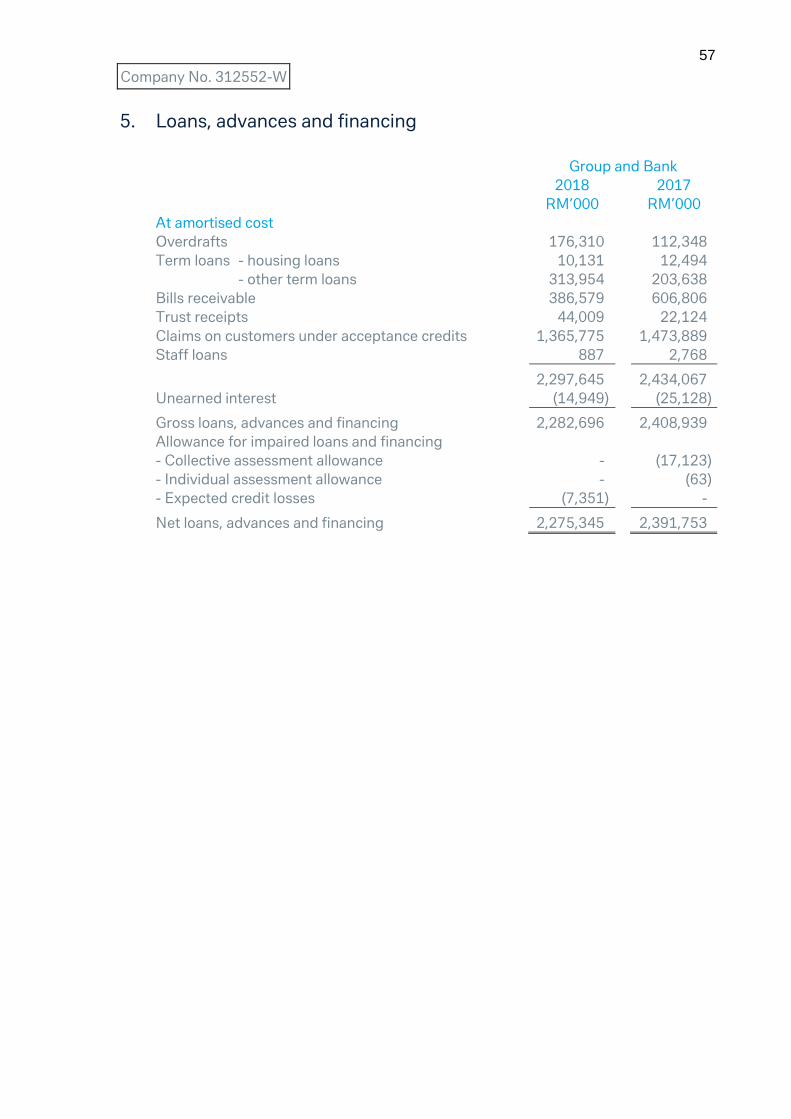
5. Loans, advances and financing
Group and Bank
2018 2017
RM’000 RM’000
At amortised cost
Overdrafts 176,310 112,348
Term loans - housing loans 10,131 12,494
- other term loans 313,954 203,638
Bills receivable 386,579 606,806
Trust receipts 44,009 22,124
Claims on customers under acceptance credits 1,365,775 1,473,889
Staff loans 887 2,768
2,297,645 2,434,067
Unearned interest (14,949) (25,128)
Gross loans, advances and financing 2,282,696 2,408,939
Allowance for impaired loans and financing
- Collective assessment allowance - (17,123)
- Individual assessment allowance - (63)
- Expected credit losses (7,351) -
Net loans, advances and financing 2,275,345 2,391,753

58
Company No. 312552-W
5. Loans, advances and financing (continued)
The following table shows reconciliations from the opening to the closing balance of
the loss allowance for loans, advances and financing.
2018 2017
Group and Bank
12-
month
ECL
Lifetime
ECL not
credit -
impaired
Lifetime
ECL
credit -
impaired Total Individual Collective Total
RM’000 RM’000 RM’000 RM’000 RM’000 RM’000 RM’000
Loans, advances and
financing at
amortised cost*
Balance at 1 January 4,652 357 675 5,684 178 16,822 17,000
Transfer to 12-
month ECL 131 - (131) - - - -
Transfer to lifetime
ECL not credit-
impaired - - - - - - -
Transfer to lifetime
ECL credit- impaired (493) - 493 - - - -
Net remeasurement of
loss allowance 527 405 545 1,477 30 301 331
New financial assets
originated or
purchased 1,164 158 - 1,322 - - -
Financial assets that
have been
derecognised (835) (297) - (1,132) - - -
Write-offs - - - - (130) - (130)
Recoveries of amounts
previously written off - - - - (15) - (15)
Changes in models/risk
parameters - - - - - - -
Other movements - - - - - - -
Balance at 31 December 5,146 623 1,582 7,351 63 17,123 17,186
* The loss allowance in this table includes ECL on loan commitment and financial
guarantees.

59
Company No. 312552-W
5. Loans, advances and financing (continued)
5.1 The maturity structure of gross loans, advances and financing are as follows:
Group and Bank
2018 2017
RM’000 RM’000
Maturing within one year 2,109,664 2,378,919
More than one year to three years 163,682 15,588
More than three years to five years 1,401 1,734
Over five years 7,949 12,698
2,282,696 2,408,939
5.2 Gross loans, advances and financing analysed by type of customer are as
follows:
Group and Bank
2018 2017
RM’000 RM’000
Domestic banking institutions - 2,005
Domestic non-bank financial institutions 463,061 347,431
Domestic business enterprises 1,348,391 1,365,625
Individuals 11,018 15,263
Government and statutory bodies 73,836 74,066
Foreign entities 386,390 604,549
2,282,696 2,408,939
5.3 Gross loans, advances and financing analysed by interest/profit rate sensitivity
are as follows:
Group and Bank
2018 2017
RM’000 RM’000
Fixed rate
- Other fixed rate loans/financing 13,651 2,768
Variable rate
- Base lending rate plus 110,976 49,705
- Cost plus 2,156,691 2,354,811
- Other variable rates 1,378 1,655
2,282,696 2,408,939

60
Company No. 312552-W
5. Loans, advances and financing (continued)
5.4 Gross loans, advances and financing analysed by their economic sectors are as
follows:
Group and Bank
2018 2017
RM’000 RM’000
Mining and Quarrying 150,235 -
Manufacturing 241,598 300,444
Construction 150,416 85,747
Wholesale & retail trade and restaurants & hotels 264,299 124,446
Transport, storage and communication 410,549 811,154
Finance, insurance and business services 980,745 997,819
Education, health and others 73,836 74,066
Household 11,018 15,263
2,282,696 2,408,939
5.5 Gross loans, advances and financing analysed by geographical distribution are
as follows:
Group and Bank
2018 2017
RM’000 RM’000
Malaysia 1,896,306 1,804,389
China 4,740 5,894
India 288,405 351,800
Turkey 62,759 226,522
Others 30,486 20,334
2,282,696 2,408,939

61
Company No. 312552-W
5. Loans, advances and financing (continued)
5.6 Movements in impaired loans, advances and financing are as follows:
Group and Bank
2018 2017
RM’000 RM’000
At 1 January 2,032 2,634
Classified as impaired during the year 1,437 504
Reclassified as non-impaired during the year (303) (650)
Amounts recovered (201) (326)
Amounts written off - (130)
At 31 December 2,965 2,032
Gross impaired loans as a percentage
of gross loans, advances and financing
0.13%
0.08%
5.6.1 Impaired loans, advances and financing analysed by economic sector and
geographical distribution are as follows:
Group and Bank
2018 2017
RM’000 RM’000
Household (Malaysia) 2,965 2,032

62
Company No. 312552-W
6. Other assets
Group and Bank
2018 2017
RM’000 RM’000
Interest/Income receivable 28,851 17,651
Margin placed with exchange 6,620 4,581
Derivative assets (Note 33.3) 890,488 1,302,496
Other debtors, deposits and prepayments 357,680 427,461
1,283,639 1,752,189
7. Statutory deposit with Bank Negara Malaysia
The non-interest bearing statutory deposit is maintained with Bank Negara Malaysia
in compliance with Section 26(2)(c) and Section 26(3) of the Central Bank of Malaysia
Act, 2009, the amount of which is determined as a set percentage of total eligible
liabilities.
8. Investments in subsidiary companies
Bank
2018 2017
RM’000 RM’000
Unquoted shares, at cost 20 20
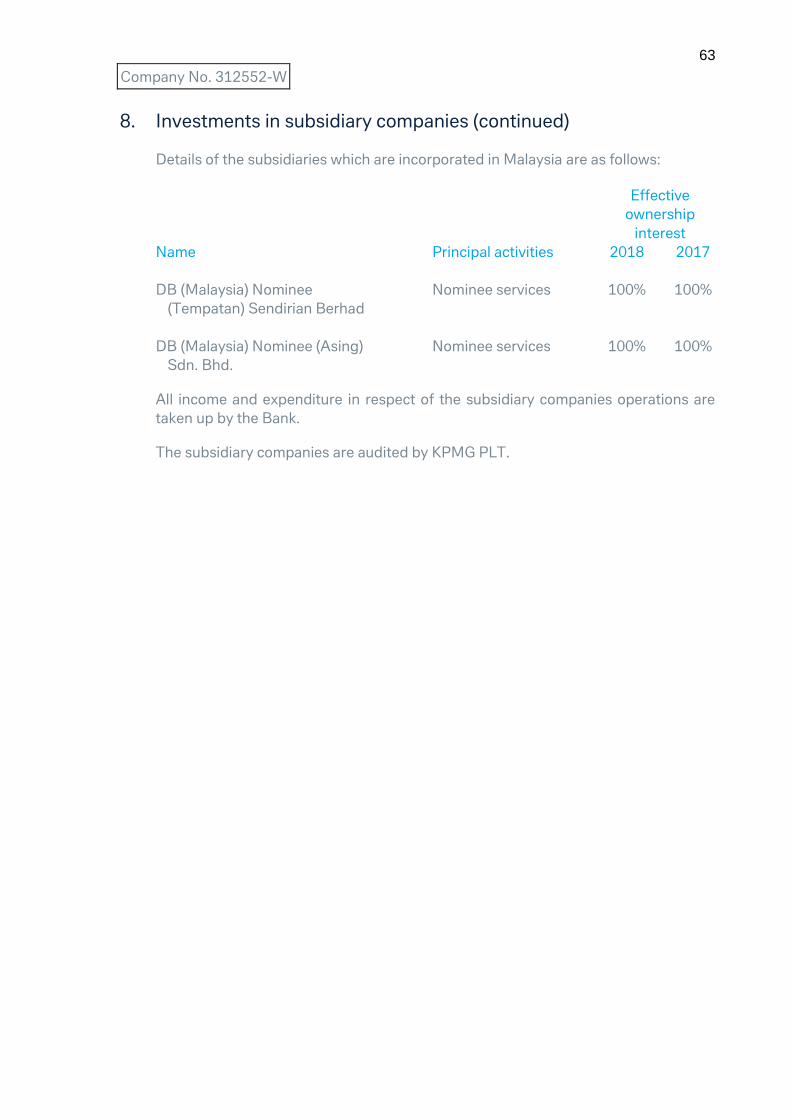
63
Company No. 312552-W
8. Investments in subsidiary companies (continued)
Details of the subsidiaries which are incorporated in Malaysia are as follows:
Effective
ownership
interest
Name Principal activities 2018 2017
DB (Malaysia) Nominee
(Tempatan) Sendirian Berhad
Nominee services 100% 100%
DB (Malaysia) Nominee (Asing)
Sdn. Bhd.
Nominee services 100% 100%
All income and expenditure in respect of the subsidiary companies operations are
taken up by the Bank.
The subsidiary companies are audited by KPMG PLT.
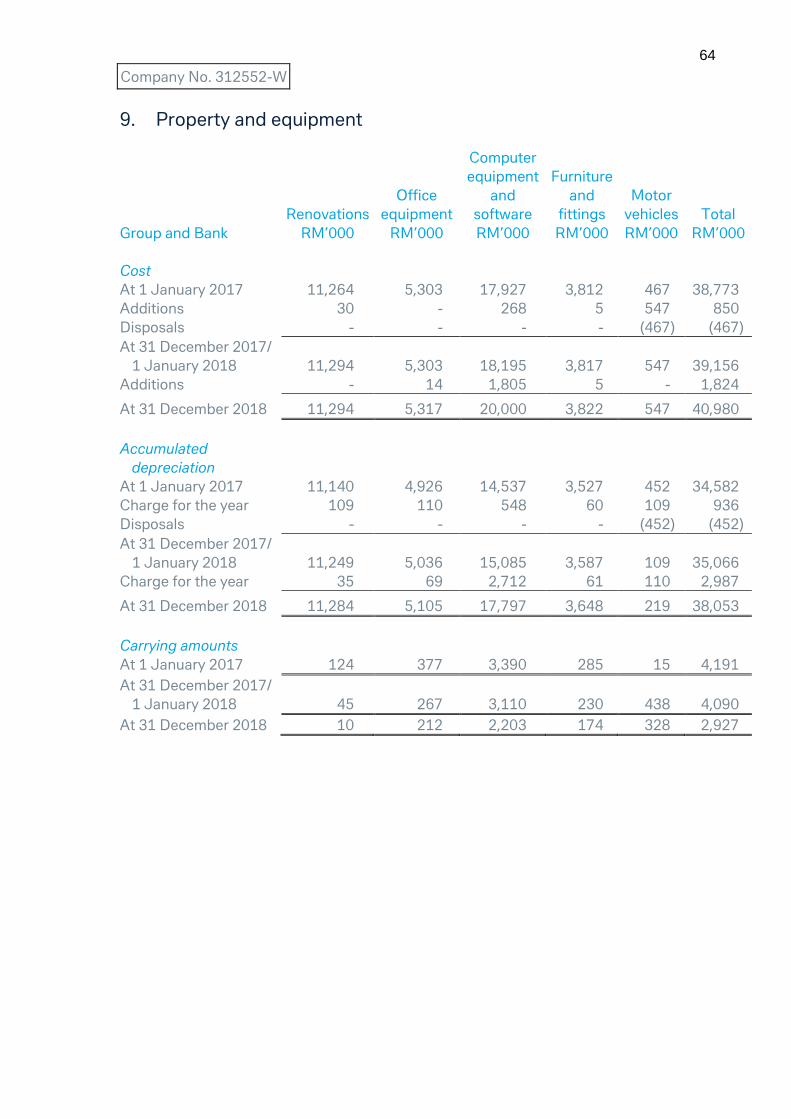
64
Company No. 312552-W
9. Property and equipment
Renovations
Office
equipment
Computer
equipment
and
software
Furniture
and
fittings
Motor
vehicles
Total
Group and Bank RM’000 RM’000 RM’000 RM’000 RM’000 RM’000
Cost
At 1 January 2017 11,264 5,303 17,927 3,812 467 38,773
Additions 30 - 268 5 547 850
Disposals - - - - (467) (467)
At 31 December 2017/
1 January 2018 11,294 5,303 18,195 3,817 547 39,156
Additions - 14 1,805 5 - 1,824
At 31 December 2018 11,294 5,317 20,000 3,822 547 40,980
Accumulated
depreciation
At 1 January 2017 11,140 4,926 14,537 3,527 452 34,582
Charge for the year 109 110 548 60 109 936
Disposals - - - - (452) (452)
At 31 December 2017/
1 January 2018 11,249 5,036 15,085 3,587 109 35,066
Charge for the year 35 69 2,712 61 110 2,987
At 31 December 2018 11,284 5,105 17,797 3,648 219 38,053
Carrying amounts
At 1 January 2017 124 377 3,390 285 15 4,191
At 31 December 2017/
1 January 2018 45 267 3,110 230 438 4,090
At 31 December 2018 10 212 2,203 174 328 2,927
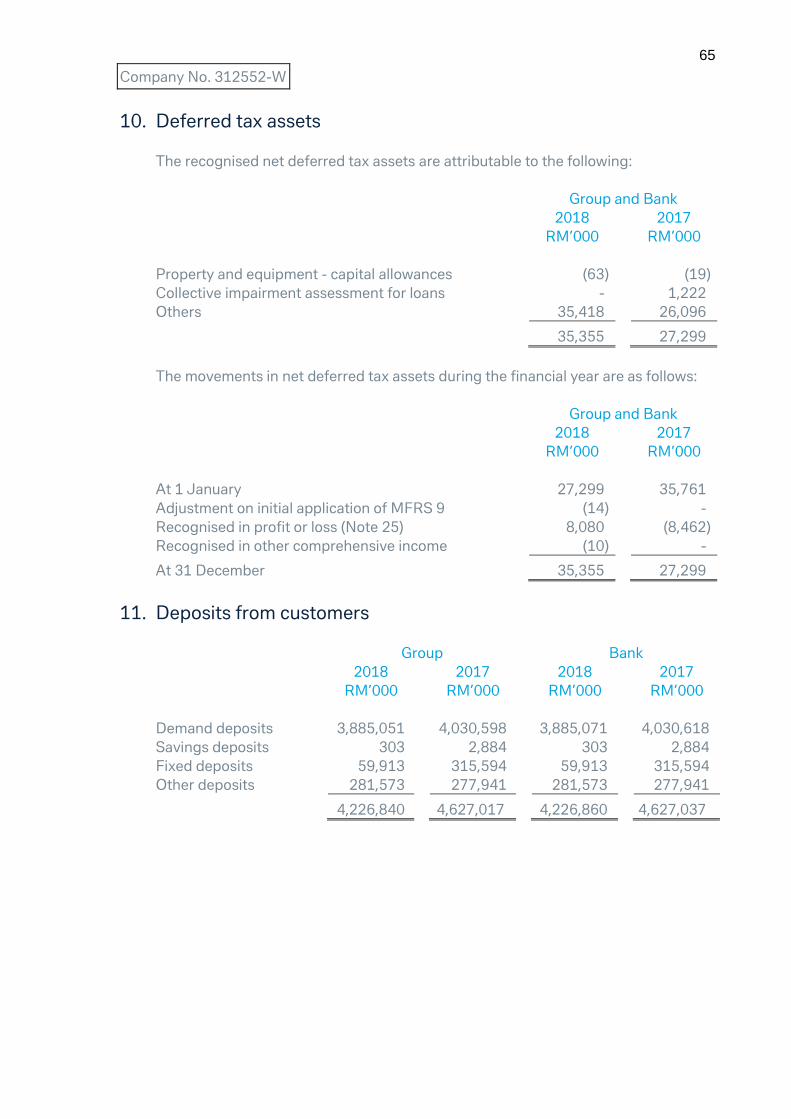
65
Company No. 312552-W
10. Deferred tax assets
The recognised net deferred tax assets are attributable to the following:
Group and Bank
2018 2017
RM’000 RM’000
Property and equipment - capital allowances (63) (19)
Collective impairment assessment for loans - 1,222
Others 35,418 26,096
35,355 27,299
The movements in net deferred tax assets during the financial year are as follows:
Group and Bank
2018 2017
RM’000 RM’000
At 1 January 27,299 35,761
Adjustment on initial application of MFRS 9 (14) -
Recognised in profit or loss (Note 25) 8,080 (8,462)
Recognised in other comprehensive income (10) -
At 31 December 35,355 27,299
11. Deposits from customers
Group Bank
2018 2017 2018 2017
RM’000 RM’000 RM’000 RM’000
Demand deposits 3,885,051 4,030,598 3,885,071 4,030,618
Savings deposits 303 2,884 303 2,884
Fixed deposits 59,913 315,594 59,913 315,594
Other deposits 281,573 277,941 281,573 277,941
4,226,840 4,627,017 4,226,860 4,627,037

66
Company No. 312552-W
11. Deposits from customers (continued)
11.1 The maturity structure of fixed deposits and other deposits are as follows:
Group and Bank
2018 2017
RM’000 RM’000
Due within six months 185,534 406,600
More than six months to one year 31,212 78,827
More than five years 124,740 108,108
341,486 593,535
11.2 The deposits are sourced from the following types of customers:
Group Bank
2018 2017 2018 2017
RM’000 RM’000 RM’000 RM’000
Business enterprises 3,600,871 3,663,481 3,600,891 3,663,501
Individuals 594 18,137 594 18,137
Foreign customers 76,942 200,568 76,942 200,568
Others 548,433 744,831 548,433 744,831
4,226,840 4,627,017 4,226,860 4,627,037
12. Deposits and placements of banks and other financial institutions
Group and Bank
2018 2017
RM’000 RM’000
Other financial institutions 1,514,300 658,943

67
Company No. 312552-W
13. Other liabilities
Group and Bank
2018 2017
RM’000 RM’000
Interest payable 2,148 2,342
Bills payable 42,640 59,402
Derivative liabilities (Note 33.3) 854,986 1,576,409
Employee benefits 18,903 19,903
Other liabilities 821,527 788,405
1,740,204 2,446,461
14. Share capital
Group and Bank
Number
of shares Amount
Number
of shares Amount
2018 2018 2017 2017
‘000 RM’000 ‘000 RM’000
Ordinary shares:
Issued and fully paid
At 1 January 173,599 531,362 173,599 173,599
Transfer from share premium
in accordance with Section
618(2) of the
Companies Act 2016
-
-
-
357,763
At 31 December 173,599 531,362 173,599 531,362

68
Company No. 312552-W
14. Share capital (continued)
The holders of ordinary shares are entitled to receive dividends as declared from time
to time, and are entitled to one vote per share at meeting of the Bank.
During the financial year ended 31 December 2017, the Group and the Bank has
transferred RM357,763,000 from share premium pursuant to the transition
provisions set out in Section 618(2) of the Companies Act 2016.
There is no impact on the number of ordinary shares in issue or the relative
entitlement of the member as a result of this transfer of the amount in the share
premium account to share capital account.
15. Reserves
Group and Bank
2018 2017
RM’000 RM’000
Non-distributable:
Regulatory reserve 40,000 13,558
Fair value reserve 77 -
40,077 13,558
Distributable:
Retained earnings 1,301,982 1,273,835
1,342,059 1,287,393
The regulatory reserve is maintained to comply with Bank Negara Malaysia’s
Guidelines on Financial Reporting dated 2 February 2018 which requires the Bank to
maintain in aggregate, loss allowance for non-credit impaired exposures and
regulatory reserve of no less than 1.0% of all credit exposures, net of loss allowance
for credit impaired exposures.
During the current financial year, the Group and the Bank have transferred
RM26,442,000 from their retained earnings to regulatory reserve in order to comply
with the abovementioned requirement.

69
Company No. 312552-W
16. Interest income
Group and Bank
2018 2017
RM’000 RM’000
Loans, advances and financing 106,910 77,592
Money at call and deposit placements with
financial institutions 99,521
119,053
Reverse repurchase agreements 3,718 13,600
Financial securities 100,049 46,622
Other interest income 49 10
310,247 256,877
17. Interest expense
Group and Bank
2018 2017
RM’000 RM’000
Deposits and placements of banks and other
financial institutions 32,973
11,660
Repurchase agreement 1 1
Deposits from customers 57,863 67,056
Other interest expense 17 -
90,854 78,717

70
Company No. 312552-W
18. Non-interest income
Group and Bank
2018 2017
RM’000 RM’000
Fee income:
Commissions 10,180 13,320
Service charges and fees 29,987 35,141
Guarantee fees 4,425 4,140
44,592 52,601
Fee expense:
Commissions (5,001) (4,023)
Service charges and fees (11,812) (10,190)
(16,813) (14,213)
Net fee income 27,779 38,388
Net gains from financial instruments:
Net gain arising on financial securities:
Realised gain 24,282 18,407
Unrealised gain 206 873
Net gain arising on trading derivatives:
Realised loss (19,985) (49,255)
Unrealised gain/(loss) 307,089 (236,845)
Foreign exchange (loss)/gain (146,823) 485,364
Gross dividend income 88 88
Gain on disposal of property and equipment - 84
Other income:
Other operating income, net 19,248 8,314
184,105 227,030
211,884 265,418

71
Company No. 312552-W
19. Other operating expenses
The number of employees of the Group and the Bank at the end of the year was 208
(2017: 238).
Group and Bank
2018 2017
RM’000 RM’000
Personnel costs
- Salaries, allowances and bonuses 47,275 52,453
- Contributions to Employees’ Provident Fund 7,776 8,823
- Others 13,837 6,949
Establishment costs
- Rental 2,379 2,905
- Depreciation 2,987 936
- Others 5,664 5,679
Marketing expenses 1,826 1,810
Administration and general expenses
- Intercompany charges (Note 23) 74,393 60,744
- Communication 2,197 1,924
- Auditors’ remuneration
- statutory audit fee 141 141
- other services 93 93
- Professional fees 744 9,471
- Others 9,241 20,099
168,553 172,027

72
Company No. 312552-W
20. Allowance made for impairment
Group and Bank
2018 2017
RM’000 RM’000
Expected credit losses
- loans, advances and financing (1,667) -
- cash and cash equivalents (212) -
- debt securities at FVOCI (205) -
Individual assessment allowance
- made during the year - (30)
- written back - 15
Collective assessment allowance
made during the year - (301)
(2,084) (316)
21. Related parties
Identity of related parties
For the purposes of these financial statements, parties are considered to be related
to the Group if the Group or the Bank has the ability, directly or indirectly, to control
the party or exercise significant influence over the party in making financial and
operating decisions, or vice versa, or where the Bank and the party are subject to
common control. Related parties may be individuals or other entities.
The Group has related party relationship with its holding company, other related
companies, Directors and key management personnel.
Transactions with key management personnel
Key management personnel compensation
Key management personnel compensation is disclosed in Note 24.

73
Company No. 312552-W
21. Related parties (continued)
Other significant related party transactions and balances of the Group and the Bank
are as follows:
Holding
company
Subsidiary
companies
Other
related
companies
2018 RM’000 RM’000 RM’000
Income
Interest on advances and deposits 1,811 - - 2,095
Fee income 10,659 - - 1,298
Other operating income 10,214 - 9,042
22,684 - 12,435
Expenditure
Interest on deposits 18,497 - 169
Fee expenses 354 - 10,754
Other operating expenses 70,790 - 4,398
89,641 - 15,321
Amount due from
Cash and short-term funds 198,091 - 101,098
Other assets
- Others 47,259 - 3,996
- Derivatives 134,889 - 22,575
380,239 - 127,669

74
Company No. 312552-W
21. Related parties (continued)
Holding
company
Subsidiary
companies
Other
related
companies
2018 RM’000 RM’000 RM’000
Amount due to
Deposits and placements of banks
and other financial institutions 767,396 20 21,160
Other liabilities
- Others 103,605 - 8,685
- Derivatives 197,302 - 3,151
- Interest payable 764 - 8
1,069,067 20 33,004
2017
Income
Interest on advances and deposits 131 - - 856
Fee income 9,529 - - 2,238
Other operating income 4,288 - 4,017
13,948 - 7,111
Expenditure
Interest on advances 5,464 - 38
Fee expenses 336 - 9,097
Other operating expenses 54,461 - 6,983
60,261 - 16,118

75
Company No. 312552-W
21. Related parties (continued)
Holding
company
Subsidiary
companies
Other
related
companies
2017 RM’000 RM’000 RM’000
Amount due from
Cash and short-term funds 184,000 - 645
Other assets
- Others 45,326 - 1,258
- Derivatives 359,803 - 18,754
589,129 - 20,657
Amount due to
Deposits and placements of banks
and other financial institutions 155,583 20 22,474
Other liabilities
- Others 217,124 - 9,107
- Derivatives 312,728 - 845
- Interest payable - - 8
685,435 20 32,434

76
Company No. 312552-W
22. Credit transactions and exposures with connected parties
Group and Bank
2018 2017
RM’000 RM’000
Outstanding credit exposures with connected
parties 419,077 408,470
Of which:
Total credit exposures which is non-performing - -
Total credit exposures 8,373,088 9,732,066
Percentage of outstanding credit exposures to
connected parties
- as a proportion of total credit exposures 5.01% 4.20%
- as a proportion of capital base 22.73% 22.64%
- which is non-performing 0% 0%
The above disclosure is presented in accordance with the requirements of Paragraph
9.1 of Bank Negara Malaysia’s Revised Guidelines on Credit Transaction and
Exposures with Connected Parties.
Credit transactions and exposures to connected parties as disclosed above includes
the extension of credit facilities and/or off-balance sheet credit exposures such as
guarantees, trade-related facilities and loan commitments. It also includes holdings
of equities and corporate bonds issued by the connected parties.
The credit transactions with connected parties above are all transacted on an arm’s
length basis and on terms and conditions no more favourable than those entered into
with other counterparties with similar circumstances and credit worthiness. Due care
has been taken to ensure that the credit worthiness of the connected party is not less
than that normally required of other persons.
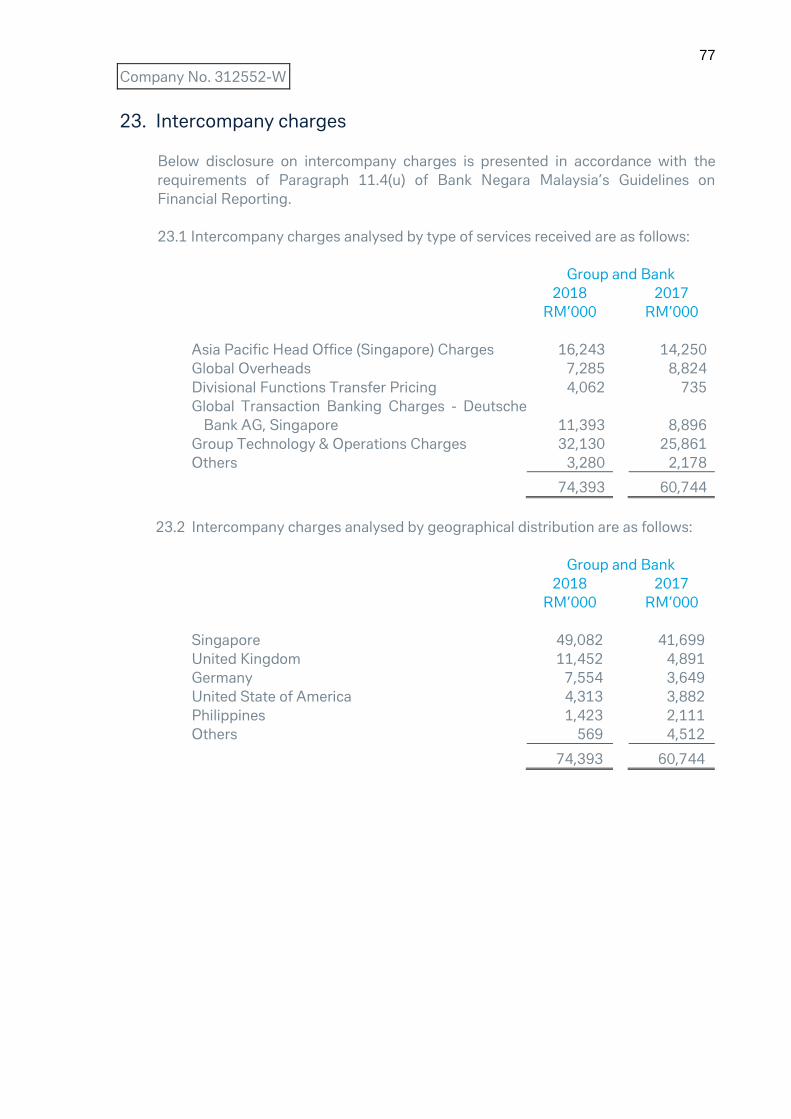
77
Company No. 312552-W
23. Intercompany charges
Below disclosure on intercompany charges is presented in accordance with the
requirements of Paragraph 11.4(u) of Bank Negara Malaysia’s Guidelines on
Financial Reporting.
23.1 Intercompany charges analysed by type of services received are as follows:
Group and Bank
2018 2017
RM’000 RM’000
Asia Pacific Head Office (Singapore) Charges 16,243 14,250
Global Overheads 7,285 8,824
Divisional Functions Transfer Pricing 4,062 735
Global Transaction Banking Charges - Deutsche
Bank AG, Singapore
11,393
8,896
Group Technology & Operations Charges 32,130 25,861
Others 3,280 2,178
74,393 60,744
23.2 Intercompany charges analysed by geographical distribution are as follows:
Group and Bank
2018 2017
RM’000 RM’000
Singapore 49,082 41,699
United Kingdom 11,452 4,891
Germany 7,554 3,649
United State of America 4,313 3,882
Philippines 1,423 2,111
Others 569 4,512
74,393 60,744

78
Company No. 312552-W
24. Key management personnel compensation
The key management personnel compensation are as follows:
Group and Bank
2018 2017
RM’000 RM’000
Executive Directors
Dato’ Yusof Annuar bin Yaacob (Chief Executive Officer)
- Salary and other remuneration
2,408
2,583
- Bonuses 808 2,545
- Benefits-in-kind
39 42
Seamus Toal
- Salary and other remuneration
-
-
- Bonuses - -
- Benefits-in-kind
- -
Non-Executive Directors
Fees
- Tunku Dato’ Mahmood Fawzy bin Tunku Muhiyiddin
- Mr Steven Choy Khai Choon
- Madam Koid Swee Lian
280
150
150
280
150
150
Other remuneration
- Tunku Dato’ Mahmood Fawzy bin Tunku Muhiyiddin
- Mr Steven Choy Khai Choon
- Madam Koid Swee Lian
54
54
51
51
52
47
3,994 5,900

79
Company No. 312552-W
24. Key management personnel compensation (continued)
The key management personnel compensation are as follows: (continued)
Group and Bank
2018 2017
RM’000 RM’000
Other key management personnel
- Short-term employee benefits 14,083 13,020
- Share-based payments 291 1,457
14,374 14,477
Other key management personnel comprise persons other than the Directors of
Group entities, having authority and responsibility for planning, directing and
controlling the activities of the entity either directly or indirectly.

80
Company No. 312552-W
25. Tax expense
Group and Bank
2018 2017
RM’000 RM’000
Current tax expense
Current year 69,412 59,500
Under/(Over) provision in prior year 1,870 (4,238)
71,282 55,262
Deferred tax expense
Origination and reversal of temporary
differences (3,677) 7,106
(Over)/Under provision in prior year (4,403) 1,356
(8,080) 8,462
63,202 63,724
Reconciliation of tax expense
Profit before tax 264,100 274,089
Tax at Malaysian tax rate of 24% 63,384 65,781
Non-deductible expenses 2,351 825
65,735 66,606
Over provision in prior year (2,533) (2,882)
63,202 63,724
Tax recognised directly in equity:
Fair value reserve (Note 10) 10 -

81
Company No. 312552-W
26. Earnings per share
Basic earnings per share
The calculation of basic earnings per share for the year ended 31 December 2018
was based on the profit attributable to ordinary shareholders and a weighted average
number of ordinary shares outstanding, calculated as follows:
Group and Bank
2018 2017
RM’000 RM’000
Profits attributable to ordinary shareholders 200,898 210,365
Weighted average number of ordinary shares
- Issued ordinary shares during the year
173,599
173,599
Group and Bank
2018 2017
(sen) (sen)
Basic earnings per share 115.7 121.2
Diluted earnings per share
The Group and the Bank have no dilution in their earnings per ordinary share in the
current financial year as the Group and the Bank do not have dilutive instruments.

82
Company No. 312552-W
27. Dividends
Dividends recognised by the Bank:
Group and Bank
Sen per
share
Total
amount
Date of
Payment
2018 RM’000
Final 2017 ordinary 89.3 155,000 11 July 2018
2017
Final 2016 ordinary 84.7 147,039 22 June 2017
After the end of the reporting period, the Directors recommended final dividend of
115.7 sen per ordinary share totalling RM200,898,000 in respect of the financial year
ended 31 December 2018. This dividend will be recognised in the subsequent
financial year upon approval by the shareholders of the Bank.
28. Operating leases
Leases as lessee
Non-cancellable operating lease rentals are payable as follows:
Group and Bank
2018 2017
RM’000 RM’000
Less than one year 2,334 559
Between one and five years 2,776 105
5,110 664
The Group and the Bank lease office premises under operating leases. The leases
typically run for a period of 3 years, with an option to renew the lease after that date.
None of the leases includes contingent rentals.

83
Company No. 312552-W
29. Capital adequacy
Group and Bank
2018 2017
RM’000 RM’000
Components of Tier 1 and Tier 2
capital are as follows:
Tier 1 capital
Paid-up share capital 531,362 531,362
Other disclosed reserves 36 -
Retained profits 1,301,982 1,273,835
Less: Deferred tax assets (35,355) (27,299)
Total common equity tier 1/Total tier 1 capital 1,798,025 1,777,898
Tier 2 capital
Expected credit losses (“ECL”)* 5,769 -
Collective assessment allowance # - 12,486
Regulatory reserve 40,000 13,558
Total capital base 1,843,794 1,803,942
Common equity tier 1/Tier 1 capital ratio 19.186% 21.332%
Total capital ratio 19.674% 21.645%
* Refers to ECL for Stage 1 and Stage 2
# Excludes collective assessment allowance which is restricted from Tier 2 capital
of the Bank of RM4,637,000 in 31 December 2017.
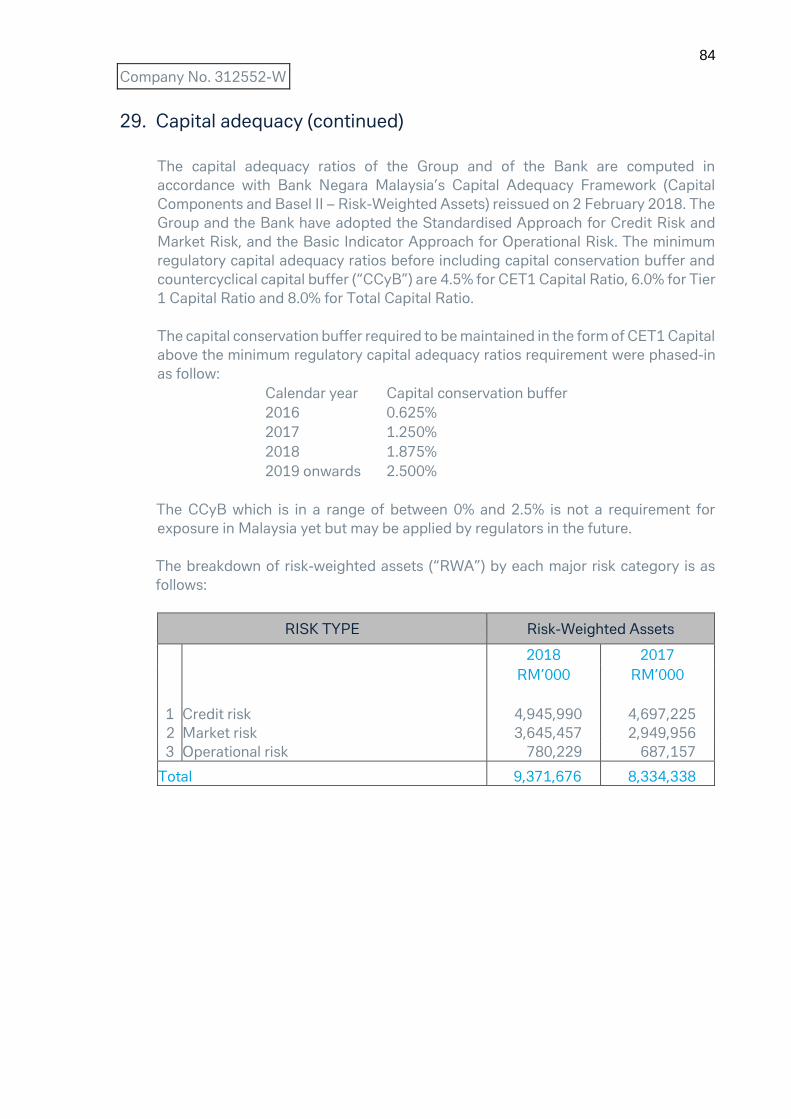
84
Company No. 312552-W
29. Capital adequacy (continued)
The capital adequacy ratios of the Group and of the Bank are computed in
accordance with Bank Negara Malaysia’s Capital Adequacy Framework (Capital
Components and Basel II – Risk-Weighted Assets) reissued on 2 February 2018. The
Group and the Bank have adopted the Standardised Approach for Credit Risk and
Market Risk, and the Basic Indicator Approach for Operational Risk. The minimum
regulatory capital adequacy ratios before including capital conservation buffer and
countercyclical capital buffer (“CCyB”) are 4.5% for CET1 Capital Ratio, 6.0% for Tier
1 Capital Ratio and 8.0% for Total Capital Ratio.
The capital conservation buffer required to be maintained in the form of CET1 Capital
above the minimum regulatory capital adequacy ratios requirement were phased-in
as follow:
Calendar year Capital conservation buffer
2016 0.625%
2017 1.250%
2018 1.875%
2019 onwards 2.500%
The CCyB which is in a range of between 0% and 2.5% is not a requirement for
exposure in Malaysia yet but may be applied by regulators in the future.
The breakdown of risk-weighted assets (“RWA”) by each major risk category is as
follows:
RISK TYPE Risk-Weighted Assets
2018 2017
RM’000 RM’000
1 Credit risk 4,945,990 4,697,225
2 Market risk 3,645,457 2,949,956
3 Operational risk 780,229 687,157
Total 9,371,676 8,334,338

85
Company No. 312552-W
30. Commitments and contingencies
The off-balance sheet exposures and their related counterparty credit risk of the
Group and of the Bank are as follows:
2018
Group and Bank
Principal
Amount
Credit
Equivalent
Amount
Risk-
Weighted
Assets
RM’000 RM’000 RM’000
Direct credit substitutes - - -
Transaction related contingent items 599,291 299,646 285,918
Short-term self liquidating trade related
contingencies 185,199 37,040 34,438
Foreign exchange related contracts
One year or less 12,088,276 279,886 221,626
Over one year to five years 1,918,247 148,283 148,283
Over five years 350,131 38,118 21,042
Interest/profit rate related contracts
One year or less 868,592 201,431 200,199
Over one year to five years 584,874 10,363 7,337
Over five years 27,063 2,165 433
Equity related contracts
One year or less - - -
Over one year to five years - - -
Over five years - - -
Credit derivatives contract
One year or less - - -
Over one year to five years - - -
Over five years - - -
OTC Derivative transactions and credit
derivative contracts subject to valid bilateral
netting agreements 77,054,912 1,600,811 351,278
Other commitments, such as formal standby
facilities and credit lines, with an original
maturity of over one year 743,120 371,560 371,560
Other commitments, such as formal standby
facilities and credit lines, with an original
maturity of up to one year 2,966,641 593,328 591,131
Any commitments that are unconditionally
cancelled at any time by the Bank without
prior notice or that effectively provide for
automatic cancellation due to deterioration in
a borrower’s creditworthiness - - -
Total 97,386,346 3,582,631 2,233,245

86
Company No. 312552-W
30. Commitments and contingencies (continued)
The off-balance sheet exposures and their related counterparty credit risk of the
Group and of the Bank are as follows (continued):
2017
Group and Bank
Principal
Amount
Credit
Equivalent
Amount
Risk-
Weighted
Assets
RM’000 RM’000 RM’000
Direct credit substitutes - - -
Transaction related contingent items 789,185 394,592 366,594
Short-term self liquidating trade related
contingencies 77,089 15,418 8,697
Foreign exchange related contracts
One year or less 10,324,163 211,993 195,970
Over one year to five years 521,424 32,969 32,969
Over five years 310,475 34,152 17,076
Interest/profit rate related contracts
One year or less 493,754 1,592 966
Over one year to five years 1,018,769 214,936 208,671
Over five years 538,386 37,823 35,399
Equity related contracts
One year or less - - -
Over one year to five years - - -
Over five years - - -
Credit derivatives contract
One year or less - - -
Over one year to five years - - -
Over five years - - -
OTC Derivative transactions and credit
derivative contracts subject to valid bilateral
netting agreements 91,265,175 1,524,326 305,035
Other commitments, such as formal standby
facilities and credit lines, with an original
maturity of over one year 575,451 287,725 287,725
Other commitments, such as formal standby
facilities and credit lines, with an original
maturity of up to one year 3,055,448 611,090 599,730
Any commitments that are unconditionally
cancelled at any time by the Bank without
prior notice or that effectively provide for
automatic cancellation due to deterioration in
a borrower’s creditworthiness - - -
Total 108,969,319 3,366,616 2,058,832

87
Company No. 312552-W
31. Capital management
The wide variety of the Group’s businesses requires the Group to identify, measure,
aggregate and allocate capital among the businesses appropriately. The Group
manages capital through a framework of principles, organisational structures as well
as measurement and monitoring processes that are closely aligned with the activities
of group divisions. While the Group capital management continuously evolves and
improves, there can be no assurance that all market developments, in particular those
of extreme nature, can be fully anticipated at all times.
The Group manages capital in a coordinated manner at all relevant levels within the
organisation. This also holds true for complex products which the Group typically
manages within the framework established for trading exposures. The structure of
capital function is closely aligned with the structure of group divisions.
The Group’s and the Bank’s regulatory capital are determined under Bank Negara
Malaysia’s revised Risk-Weighted Capital Adequacy Framework and their capital
ratios have complied with the minimum requirements set under this guideline.
Information on the Group’s and the Bank’s capital adequacy ratios, regulatory
minimum capital requirements and the components of capital base are disclosed in
Note 29.
32. Risk management
The Deutsche Bank Group (“DB Group”) has extensive risk management procedures
and policies in place. The identification, monitoring and management of all risks
within the DB Group are integrated into the DB Group-wide risk management
processes in order to optimise the risk mitigating effort. Risk management
procedures and policies are the responsibility of the DB Group Risk Committee and
encompass all types of risk which includes market risk, credit risk and liquidity risk, as
well as non-financial risks (including operational risk), and reputational risks. These
risk areas are actively managed by dedicated divisions such as the Market Risk
Management Division, Credit Risk Management Division, Liquidity Risk Management
Division and Operational Risk Management Division.

88
Company No. 312552-W
32. Risk management (continued)
Treasury is responsible for overall liquidity management of the Bank including
proposing liquidity risk limits in line with the tolerance/risk appetite applied by
Liquidity Risk Management Division. The Board regularly reviews reports from the
respective regional divisions and is made aware of the risk exposure of the Bank and
its ongoing management at each board meeting.
Risk management
The Group and the Bank has exposure to the following risks from its use of financial
instruments:
- Credit risk
- Liquidity risk
- Market risk
- Operational risk
Credit risk
Credit risk is the risk of any transactions giving rise to actual, contingent or potential
claims against any counterparty, obligor or borrower, where the Group and the Bank
bears the risk of loss if the counterparty, obligor or borrower defaults.
Risk management objectives, policies and processes for managing the risk
Policies for managing credit risk are determined by the DB Group Risk Committee,
which also delegates credit authorities to independent Risk Officers. Divisional credit
portfolio guidelines, credit strategies for the major industries, and product specific
policies are the principal instruments to determine the Bank’s risk appetite, as well as
the framework for the measurement and management of credit risk. Approval of
credit limits and management of exposure takes place within the framework of
portfolio guidelines and credit strategies.

89
Company No. 312552-W
32. Risk management (continued)
Credit risk (continued)
Exposure to credit risk, credit quality and collateral
Principal exposures to credit risk in this regard are primarily represented by the
carrying amounts of financial instruments and loans, advances and financing
portfolios in the statements of financial position. The credit exposures arising from
off-balance sheet activities have been disclosed in Note 30 to the financial
statements.
(a) Credit quality of gross loans, advances and financing
Group and Bank
2018 2017
RM’000 RM’000
Stage 1 : 12-month ECL 2,219,391 -
Stage 2 : Lifetime ECL not credit-
impaired 60,340 -
Stage 3 : Lifetime ECL credit-
impaired 2,965 -
2,282,696 -
Neither past due nor impaired - 2,401,400
Past due but not impaired - 5,507
Impaired - 2,032
- 2,408,939
Total 2,282,696 2,408,939
ECL Stage determination
(i) Stage 2: Lifetime ECL not credit-impaired
At initial recognition, loans which are not purchase or originated credit
impaired (“POCI”) are reflected in Stage 1. If there is a significant
increase in credit risk the loans are transferred to Stage 2. Significant
increase in credit risk is determined by using rating related and process
related indicators as discussed below:
Rating-related indicators:
Based on dynamic change in counterparty probability of default (“PD”)
that is linked to all transactions with the counterparty, the lifetime PD at
reporting date are compared to the expectations at the date of initial
recognition. The loans would be considered as significant deteriorated
if for the remaining lifetime of the PD of a transaction given current
expectations exceeds the PD of the relevant threshold rating.

90
Company No. 312552-W
32. Risk management (continued)
Credit risk (continued)
(a) Credit quality of gross loans, advances and financing (continued)
ECL Stage determination (continued)
(i) Stage 2: Lifetime ECL not credit-impaired (continued)
Process-related indicators:
Process-related indicators are derived using existing risk management
indicators, which allow the Bank to identify whether the credit risk of
the loans has significantly increased. Such indicators but not limited to:
a) Obligors being added mandatorily to a credit watch list;
b) Obligors being mandatorily transferred to workout status;
c) Payments being 30 days or more overdue; or
d) In forbearance
On an ongoing basis, as long as the condition for one or more of the
indicators is fulfilled and the loan is not recognised as defaulted, the
loan will remain in Stage 2. If none of the indicator conditions is any
longer fulfilled and the loan is not defaulted, the loan is transferred back
to Stage 1. In case of default, the loan is allocated to Stage 3.
(ii) Stage 3: Lifetime ECL credit-impaired
Stage 3 is based on the status of the obligor being in default. Loans are
deemed credit impaired and in Stage 3 when:
The Bank considers the obligor is unlikely to pay its credit
obligations to the Bank. Determination may include forbearance
actions, where a concession has been granted to the borrower or
economic or legal reasons that are qualitative indicators of credit
impairment; or
Contractual payments of either principal or interest by the obligor
are past due by more than 90 days.
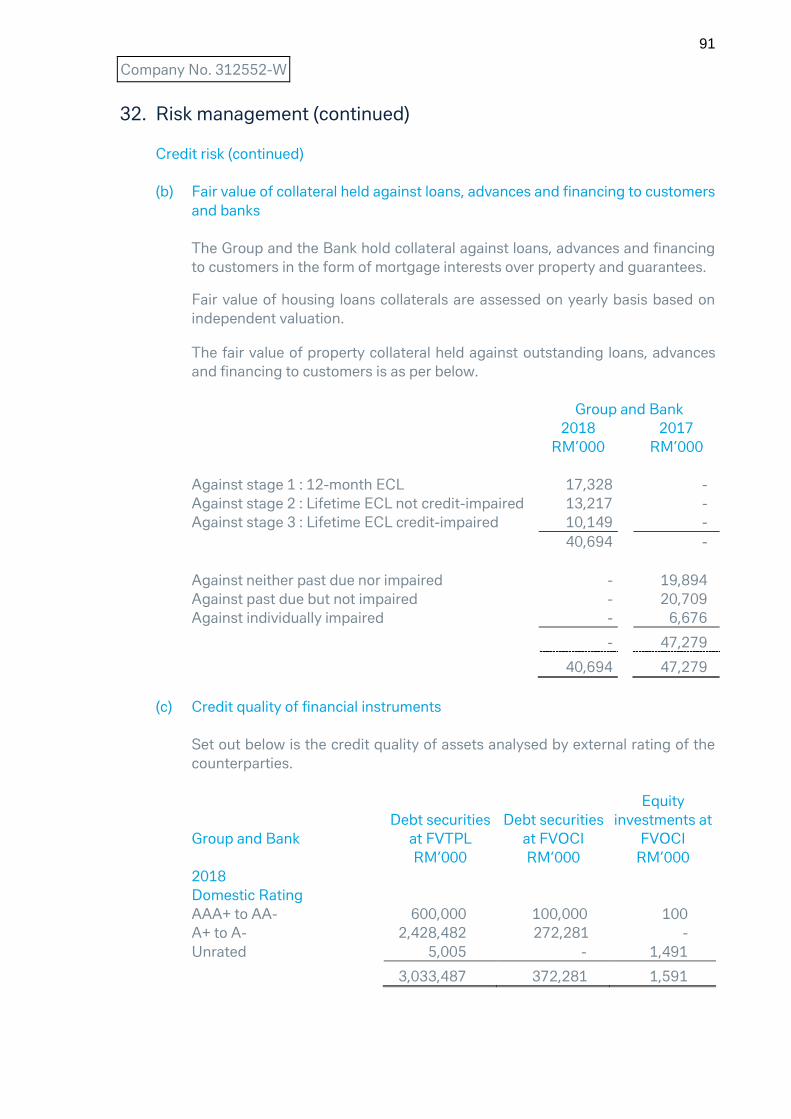
91
Company No. 312552-W
32. Risk management (continued)
Credit risk (continued)
(b) Fair value of collateral held against loans, advances and financing to customers
and banks
The Group and the Bank hold collateral against loans, advances and financing
to customers in the form of mortgage interests over property and guarantees.
Fair value of housing loans collaterals are assessed on yearly basis based on
independent valuation.
The fair value of property collateral held against outstanding loans, advances
and financing to customers is as per below.
Group and Bank
2018 2017
RM’000 RM’000
Against stage 1 : 12-month ECL 17,328 -
Against stage 2 : Lifetime ECL not credit-impaired 13,217 -
Against stage 3 : Lifetime ECL credit-impaired 10,149 -
40,694 -
Against neither past due nor impaired - 19,894
Against past due but not impaired - 20,709
Against individually impaired - 6,676
- 47,279
40,694 47,279
(c) Credit quality of financial instruments
Set out below is the credit quality of assets analysed by external rating of the
counterparties.
Group and Bank
Debt securities
at FVTPL
Debt securities
at FVOCI
Equity
investments at
FVOCI
RM’000 RM’000 RM’000
2018
Domestic Rating
AAA+ to AA- 600,000 100,000 100
A+ to A- 2,428,482 272,281 -
Unrated 5,005 - 1,491
3,033,487 372,281 1,591

92
Company No. 312552-W
32. Risk management (continued)
Credit risk (continued)
(c) Credit quality of financial instruments (continued)
Set out below is the credit quality of assets analysed by external rating of the
counterparties. (continued)
Group and Bank
Financial
assets held-
for-trading
Financial
investments
available-for-
sale
RM’000 RM’000
2017
Domestic Rating
AAA+ to AA- - 100
A+ to A- 1,445,802 -
Unrated - 1,491
1,445,802 1,591
(d) Fair value of collateral held against derivative assets
The Group and the Bank hold collateral against derivative assets to banks and
financial institutions counterparties in the form of cash of RM488,630,338
(2017: RM557,327,871) as at the reporting date.
Market risk
Market risk arises from the uncertainty concerning changes in market prices and
rates (including interest rates, foreign exchange rates and equity prices, commodity
rates and other market risks), the correlations among them and their levels of volatility.

93
Company No. 312552-W
32. Risk management (continued)
Market risk (continued)
Risk management objectives, policies and processes for managing the risk
Deutsche Bank Group entities, including the Group and the Bank, use a combination
of risk sensitivities, Value-at-Risk (“VaR”), sensitivities and stress testing metrics to
manage market risks and establish limits. Steered by the DB Group Risk Committee,
the Market Risk Management team, which is part of the DB Group’s independent risk
management function, is responsible for managing the market risk of the Bank. Limits,
set commensurate to the risk appetite in terms of VaR, are communicated to the
appropriate personnel along with the limit structure for each business division. The
majority of the interest rate risk arising from non-trading asset and liability positions
is transferred through internal hedges to Treasury and is thus managed on the basis
of Banking Book Value-at-Risk.
A summary of the VaR position of the Bank’s portfolios is as follows:
At 31
December
Average
Maximum
Minimum
RM’000 RM’000 RM’000 RM’000
2018
Interest Rate Risk:
Market Risk 2,641 2,492 4,054 1,294
Specific Risk 53 23 109 1
Foreign Exchange Risk 4,676 2,279 5,632 350
Commodity Risk 1,274 906 4,470 145
Equity Risk 650 783 3,337 183
Total VaR 5,431 3,932 6,818 1,496

94
Company No. 312552-W
32. Risk management (continued)
Market risk (continued)
Risk management objectives, policies and processes for managing the risk (continued)
A summary of the VaR position of the Bank’s portfolios is as follows (continued):
At 31
December
Average
Maximum
Minimum
RM’000 RM’000 RM’000 RM’000
2017
Interest Rate Risk:
Market Risk 3,273 3,900 8,577 2,320
Specific Risk 4 10 31 4
Foreign Exchange Risk 3,058 2,730 8,122 462
Commodity Risk 884 1,225 7,148 287
Equity Risk 2,742 2,339 5,985 66
Total VaR 5,842 5,762 9,011 3,737

95
Company No. 312552-W
32. Risk management (continued)
Market risk (continued)
Value-at-Risk (“VaR”)
VaR is a quantitative measure of the potential loss due to market movements, that
will not be exceeded in a defined period of time, and with a defined confidence level.
The Bank adopts the DB Group’s internal VaR model, which is based on Monte Carlo
Simulation technique. VaR is calculated using a 99% confidence level and a one day
holding period. One year of historical market data is used as input to calculate VaR.
Risks not in value-at-risk are monitored and assessed on a regular basis through our
Risk Not In VaR (“RNIV”) framework.
Stressed Value-at-Risk (“SVaR”) calculates a VaR based on a historical one year
period of significant market stress.
DB Group’s internal VaR model:
VaR SVaR
Methodology Monte Carlo Simulation Monte Carlo Simulation
Holding Period 1-day 1-day
Confidence
Level
99% 99%
Trade Window Most recent one year period One year period of significant
market stress (high levels of
volatility in the top value-at-
risk contributors)
DB Group regularly reviews and validates its VaR model.
Value-at-risk model is subject to known limitations, including:
(a) The use of historical data may not be a good indicator of potential future events,
particularly those that are extreme in nature. The “backward-looking” limitation
can cause value-at-risk to understate or overstate risk.
(b) Assumptions concerning the distribution of changes in risk factors, and the
correlation between the different risk factors, may not hold true, particularly
during market events that are extreme in nature. While the Group believes the
assumptions are reasonable, there is no standard value-at-risk methodology to
follow. Different assumptions may produce different results.
(c) The one day holding period does not fully capture the market risk arising during
periods of illiquidity, when positions cannot be closed out or hedged within one
day.
(d) Value-at-risk does not indicate the potential loss beyond the 99th quantile.
(e) Intra-day risk is not captured.

96
Company No. 312552-W
32. Risk management (continued)
Liquidity risk
Liquidity risk is the risk to a bank’s earnings and capital arising from the inability to
timely meet obligations when they come due without incurring unacceptable losses.
Risk management objectives, policies and processes for managing the risk
The objective of the Liquidity Management (“LM”) function is to ensure that the Bank
can fulfill its payment obligations at all times at reasonable cost, without affecting
daily operations of the Bank. All relevant and significant drivers of liquidity risk, on-
balance sheet as well as off-balance sheet, are taken into account. Prices of all asset
and liability types reflect their liquidity risk characteristics and the Bank’s cost of
funding. Liquidity management is a governance function which does not report to any
business division and which adheres to the rules and regulations issued by BNM, in
addition to the Basel Committee on Banking Supervision Principles for Sound
Liquidity Risk Management and Supervision, the German Minimum Requirements for
Risk Management (“MaRisk”) as well as the upcoming regulatory requirements on
liquidity risk under Basel III and Capital Requirements Regulation (“CRR”).
Liquidity risk is managed through the Asset and Liability Committee (“ALCO”). This
committee, chaired by the Treasurer, is responsible for both statutory and prudential
liquidity management of the Bank including the approval of liquidity risk limits which
are in line with the tolerance/risk appetite applied by Liquidity Risk Control (“LRC”).
Decisions made by the ALCO for the Bank are submitted to the Board Risk
Management Committee and Board of Directors for notification and for approval
where necessary.
Liquidity risk is monitored through local liquidity regulations issued by Bank Negara
Malaysia, such as Liquidity Coverage Ratio and the internal liquidity risk management
policy. A prudent liquidity risk model is based on two main liquidity risk models such
as stress testing and funding matrix. The Bank’s stress testing methodology
adequately reflects the Bank’s business-specific risks and complexity embedded in
its business model. Stress testing is monitored on a daily basis, reported to the ALCO
at its regular meetings.
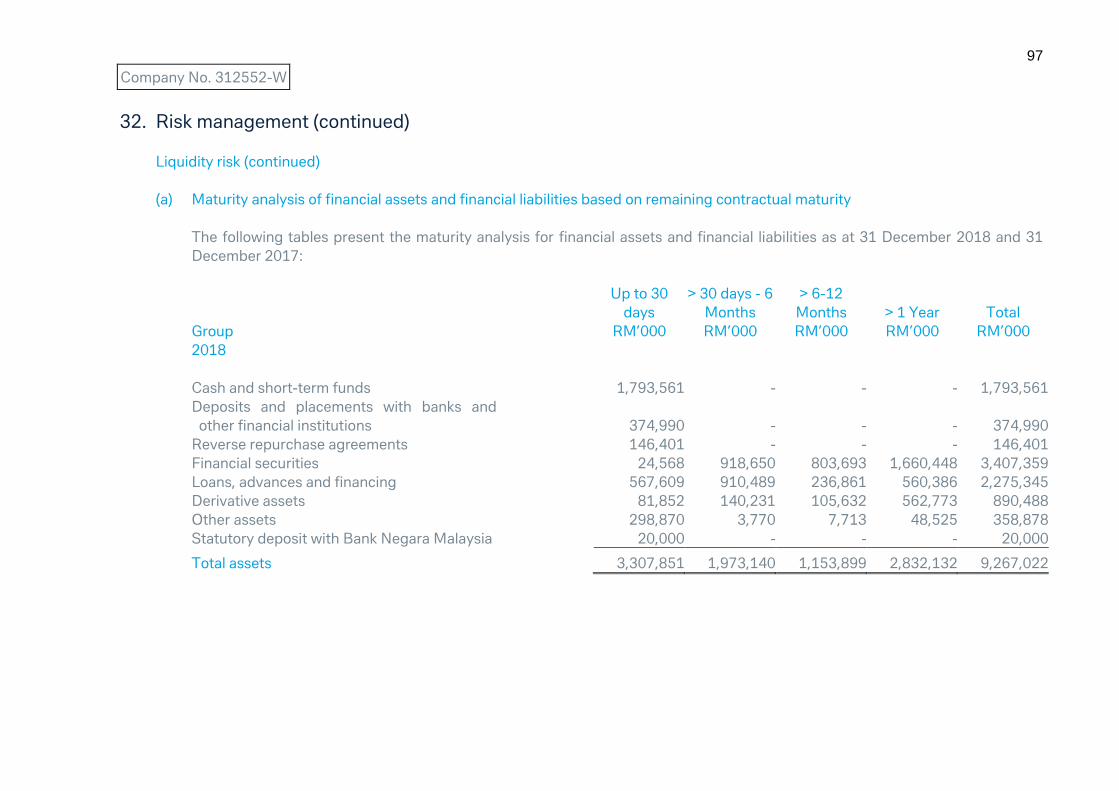
97
Company No. 312552-W
32. Risk management (continued)
Liquidity risk (continued)
(a) Maturity analysis of financial assets and financial liabilities based on remaining contractual maturity
The following tables present the maturity analysis for financial assets and financial liabilities as at 31 December 2018 and 31
December 2017:
Up to 30
days
> 30 days - 6
Months
> 6-12
Months
> 1 Year
Total
Group RM’000 RM’000 RM’000 RM’000 RM’000
2018
Cash and short-term funds 1,793,561 - - - 1,793,561
Deposits and placements with banks and
other financial institutions 374,990 - - - 374,990
Reverse repurchase agreements 146,401 - - - 146,401
Financial securities 24,568 918,650 803,693 1,660,448 3,407,359
Loans, advances and financing 567,609 910,489 236,861 560,386 2,275,345
Derivative assets 81,852 140,231 105,632 562,773 890,488
Other assets 298,870 3,770 7,713 48,525 358,878
Statutory deposit with Bank Negara Malaysia 20,000 - - - 20,000
Total assets 3,307,851 1,973,140 1,153,899 2,832,132 9,267,022

98
Company No. 312552-W
32. Risk management (continued)
Liquidity risk (continued)
(a) Maturity analysis of financial assets and financial liabilities based on remaining contractual maturity (continued)
Up to 30
days
> 30 days - 6
Months
> 6-12
Months
> 1 Year
Total
Group RM’000 RM’000 RM’000 RM’000 RM’000
2018
Deposits from customers 4,096,132 5,037 931 124,740 4,226,840
Deposits and placements of banks and
other financial institutions 1,514,300 - - - 1,514,300
Derivative liabilities 85,060 121,400 90,651 557,875 854,986
Other liabilities 645,534 88 32 - 645,654
Total liabilities 6,341,026 126,525 91,614 682,615 7,241,780

99
Company No. 312552-W
32. Risk management (continued)
Liquidity risk (continued)
(a) Maturity analysis of financial assets and financial liabilities based on remaining contractual maturity (continued)
Up to 30
days
> 30 days - 6
Months
> 6-12
Months
> 1 Year
Total
Group RM’000 RM’000 RM’000 RM’000 RM’000
2017
Cash and short-term funds 3,416,228 - - - 3,416,228
Deposits and placements with banks and
other financial institutions 333,033 - - - 333,033
Reverse repurchase agreements 69,042 - - - 69,042
Financial securities - 190,628 3,123 1,253,642 1,447,393
Loans, advances and financing 262,108 1,098,426 856,525 174,694 2,391,753
Derivative assets 132,190 264,069 197,718 708,519 1,302,496
Other assets 378,768 3,196 28 38,701 420,693
Statutory deposit with Bank Negara Malaysia 100,000 - - - 100,000
Total assets 4,691,369 1,556,319 1,057,394 2,175,556 9,480,638
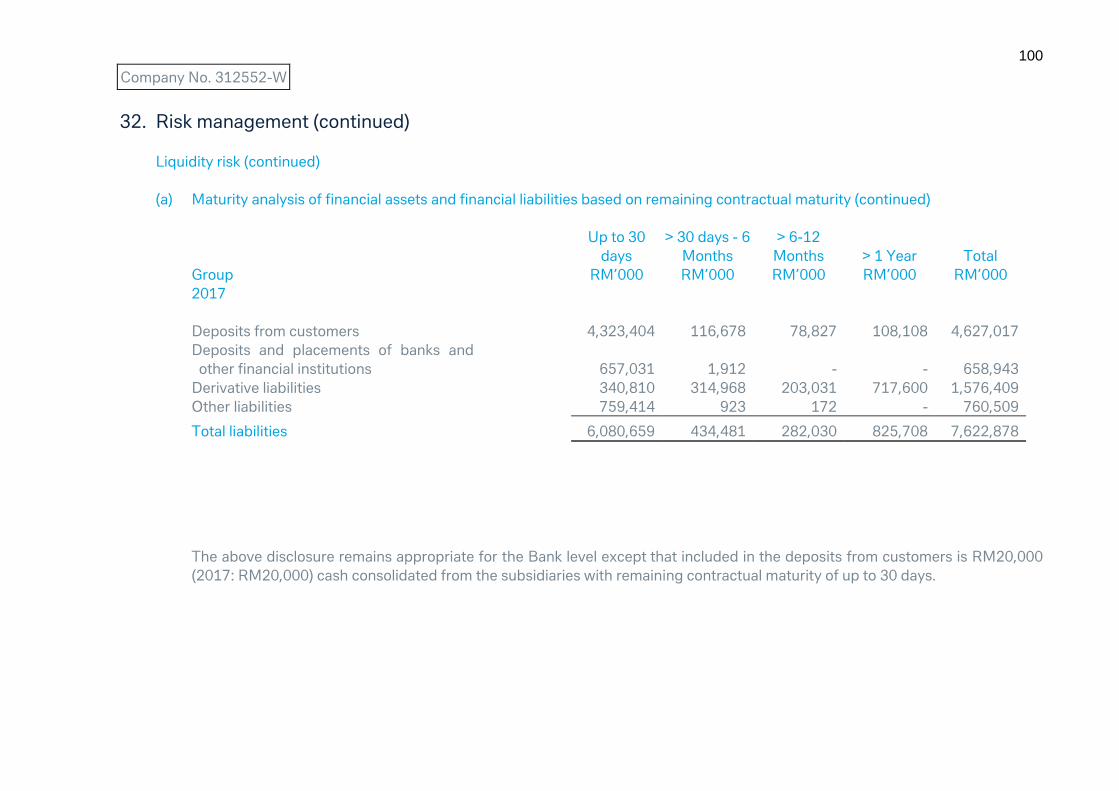
100
Company No. 312552-W
32. Risk management (continued)
Liquidity risk (continued)
(a) Maturity analysis of financial assets and financial liabilities based on remaining contractual maturity (continued)
Up to 30
days
> 30 days - 6
Months
> 6-12
Months
> 1 Year
Total
Group RM’000 RM’000 RM’000 RM’000 RM’000
2017
Deposits from customers 4,323,404 116,678 78,827 108,108 4,627,017
Deposits and placements of banks and
other financial institutions 657,031 1,912 - - 658,943
Derivative liabilities 340,810 314,968 203,031 717,600 1,576,409
Other liabilities 759,414 923 172 - 760,509
Total liabilities 6,080,659 434,481 282,030 825,708 7,622,878
The above disclosure remains appropriate for the Bank level except that included in the deposits from customers is RM20,000
(2017: RM20,000) cash consolidated from the subsidiaries with remaining contractual maturity of up to 30 days.

101
Company No. 312552-W
32. Risk management (continued)
Liquidity risk (continued)
(b) Maturity analysis of financial liabilities on an undiscounted basis
The following tables show the contractual undiscounted cash flows payable for financial liabilities by remaining contractual
maturity. The financial liabilities in the tables below will not agree to the carrying amounts reported in the statements of financial
position as the tables incorporate all contractual cash flows, on an undiscounted basis, relating to both principal and interest
payments.
Up to 30
days
> 30 days - 6
Months
> 6-12
Months
> 1 Year
Total
Group RM’000 RM’000 RM’000 RM’000 RM’000
2018
Deposits from customers 4,096,133 5,037 931 206,897 4,308,998
Deposits and placements of banks and
other financial institutions 1,514,809 - - - 1,514,809
Derivative liabilities 76,855 227,774 232,658 724,721 1,262,008
Other liabilities 645,534 88 32 - 645,654
Total liabilities 6,333,331 232,899 233,621 931,618 7,731,469
Transaction related contingent items 43,409 195,064 224,428 136,390 599,291
Short-term self liquidating trade related
contingencies 44,923 140,276 - - 185,199
Total commitment and contingencies 88,332 335,340 224,428 136,390 784,490

102
Company No. 312552-W
32. Risk management (continued)
Liquidity risk (continued)
(b) Maturity analysis of financial liabilities on an undiscounted basis (continued)
Up to 30
days
> 30 days - 6
Months
> 6-12
Months
> 1 Year
Total
Group RM’000 RM’000 RM’000 RM’000 RM’000
2017
Deposits from customers 4,323,585 117,304 79,408 141,814 4,662,111
Deposits and placements of banks and
other financial institutions 657,068 1,913 - - 658,981
Derivative liabilities 330,915 214,018 154,748 445,827 1,145,508
Other liabilities 759,414 923 172 - 760,509
Total liabilities 6,070,982 334,158 234,328 587,641 7,227,109
Transaction related contingent items 670,950 44,486 38,161 35,588 789,185
Short-term self liquidating trade related
contingencies 77,089 - - - 77,089
Total commitment and contingencies 748,039 44,486 38,161 35,588 866,274
The above disclosure remains appropriate for the Bank level except that included in the deposits from customers is RM20,000
(2017: RM20,000) cash consolidated from the subsidiaries with remaining contractual maturity of up to 30 days.
Other commitments of RM3,709,761,000 (2017: RM3,630,899,000) consist of formal standby facilities and credit lines granted
to customers by the Group and the Bank which remain undrawn as at the end of the reporting period, and are subject to drawdown
on demand by customers.

103
Company No. 312552-W
32. Risk management (continued)
Operational Risk
Operational Risk Framework
Operational risk means the risk of loss resulting from inadequate or failed internal
processes, people and systems or from external events, and includes legal risk.
Operational risk excludes business and reputational risk.
DB Group Non-Financial Risk Management (“Group NFRM”) has the responsibility for
the design, implementation and maintenance of the Operational Risk Management
Framework (“ORMF”) including the associated governance structures. DB Group
NFRM also has the responsibility for providing a cross-risk assessment and
aggregation of risks to provide a holistic portfolio view of the non-financial risk profile
of the Bank, which includes oversight of risk and control mitigation plans to return risk
within risk appetite, where required.
The Bank takes decisions to manage operational risks, both strategically as well as
in day-to-day business. Four principles form the foundation of the Operational Risk
Management Framework (“ORMF”) at Deutsche Bank:
Operational Risk Principle I: Risk owners have full accountability for their operational
risks and have to manage against a defined risk specific appetite. Risk owners are
defined to be: First Line of Defence (“LoD”) (Corporate and Investment Bank (“CIB”),
Deutsche Asset Management, Private Wealth & Commercial Clients (“PW&CC”) and
first LoD Infrastructure Functions), for all of their operational risks, and second LoD
control functions (Infrastructure Functions), for the operational risks that arise in their
own activities and processes.
104
Company No. 312552-W
32. Risk management (continued)
Operational Risk (continued)
Operational Risk Framework (continued)
Risk owners are accountable for managing all operational risks in their
business/processes with an end-to-end process view, within a defined operational risk
specific appetite and for identifying, establishing and maintaining risk owner (i.e. Level
1) controls. In addition they mitigate identified and assessed risk within the risk specific
appetite through remediation actions, insurance or by ceasing/reducing business
activities.
Divisional Control Officers, or the equivalent in infrastructure functions, support the
risk owners. They are responsible for embedding the ORMF within the relevant
business division or infrastructure function. They assess the effectiveness of the Level
1 Controls, monitor the aggregated risk profile and put the appropriate control and
mitigating actions in place within the relevant division. The Divisional Control Officers
also establish appropriate governance forums to oversee the operational risk profile
and are involved in decision making processes.
Operational Risk Principle II: Risk Type Controllers are independent second LoD
control functions that control specific risk types as identified in the Operational Risk
Type Taxonomy.
Risk Type Controllers are responsible for establishing an effective risk management
framework for the risk type they control. They define risk type taxonomy and
minimum control standards and set the risk specific appetite. Risk Type Controllers
challenge, assess and report the risks in their remit and perform Level 2 Controls,
complementary to the Level 1 Controls. Finally they establish independent
operational risk governance, and prepare aggregated reporting into the DB Group
Non-Financial Risk Committee.

105
Company No. 312552-W
32. Risk management (continued)
Operational Risk (continued)
Operational Risk Framework (continued)
Operational Risk Principle III : DB Group NFRM establishes and maintains the DB
Group Operational Risk Management Framework. DB Group NFRM develops and
maintains the DB Group's framework, defining the roles and responsibilities for the
management of operational risk across the Bank and the process to identify, assess,
mitigate, monitor, report and escalate operational risks. DB Group NFRM also
maintains the operational risk type taxonomy and oversees the completeness of
coverage of risk types identified in the taxonomy by second LoD control functions, in
line with the DB Group wide risk taxonomy standards. It also provides the tools for,
and monitors execution and results of, the DB Group’s Risk and Control Assessment
process.
DB Group NFRM also provides independent challenge of the DB Group’s operational
risk profile providing independent risk views to facilitate forward looking management
of the risks. The function independently reviews, monitors and assesses material risks
and key controls at a divisional and infrastructure level across the Bank. It further
monitors and reports on the DB Group's operational risk profile in comparison to the
DB Group Risk Appetite, to systematically identify operational risk themes and
concentrations, and to oversee that risk mitigating measures and priorities have been
agreed. DB Group NFRM establishes reporting and escalating procedures up to the
Management Board for risk assessment results and identified material control gaps,
while informing Group Audit of material control gaps.
106
Company No. 312552-W
32. Risk management (continued)
Operational Risk (continued)
Operational Risk Framework (continued)
Operational Risk Principle IV: DB Group NFRM aims to maintain sufficient capital
to underpin operational risk. DB Group NFRM is accountable for the design,
implementation and maintenance of an appropriate approach to determine a
sufficient level of capital demand for operational risk for recommendation to the
Management Board. To fulfill this requirement DB Group NFRM is accountable for
the calculation and allocation of operational risk capital demand and Expected Loss
planning under the Advanced Measurement Approach (“AMA”). DB Group NFRM is
also accountable for the facilitation of the annual operational risk capital planning and
monthly review process.
33. Financial assets and liabilities
33.1 Categories of financial instruments
The table below provides an analysis of financial instruments as at 31
December 2018 categorised as follows:
(a) Fair value through profit or loss (“FVTPL”);
(b) Amortised cost (“AC”); and
(c) Fair value through other comprehensive income (“FVOCI”)
Debt securities
Equity investments

107
Company No. 312552-W
33. Financial assets and liabilities (continued)
33.1 Categories of financial instruments (continued)
Group
Carrying
amount
AC
FVTPL
FVOCI-
Debt
securities
FVOCI-
Equity
investments
2018 RM’000 RM’000 RM’000 RM’000 RM’000
Financial assets
Cash and short-term funds 1,793,561 1,793,561 - - -
Deposits and placements
with banks and other
financial institutions 374,990 374,990 - -
-
Reverse repurchase
agreements 146,401 - 146,401 -
-
Financial securities 3,407,359 - 3,033,487 372,281 1,591
Loans, advances and
financing 2,275,345 2,275,345 - -
-
Derivative assets (Note 33.3) 890,488 - 890,488 - -
Statutory deposit with
Bank Negara Malaysia 20,000 20,000 - -
-
Other assets 358,878 358,878 - - -
9,267,022 4,822,774 4,070,376 372,281 1,591
Financial liabilities
Deposits from customers 4,226,840 4,226,840 - - -
Deposits and placements
of banks and other
financial institutions 1,514,300 1,514,300 - -
-
Derivative liabilities
(Note 33.3) 854,986 - 854,986 -
-
Other liabilities 645,654 645,654 - - -
7,241,780 6,386,794 854,986 - -

108
Company No. 312552-W
33. Financial assets and liabilities (continued)
33.1 Categories of financial instruments (continued)
The table below provides an analysis of financial instruments as at 31
December 2017 categorised as follows:
(a) Loans and receivables (“L&R”);
(b) Fair value through profit or loss (“FVTPL”) – Held-for-trading (“HFT”);
(c) Available-for-sale financial assets (“AFS”); and
(d) Financial liabilities measured at amortised cost (“FL”)
Group
Carrying
amount
L&R/
FL
FVTPL-
HFT
AFS
2017 RM’000 RM’000 RM’000 RM’000
Financial assets
Cash and short-term funds 3,416,228 3,416,228 - -
Deposits and placements
with banks and other
financial institutions 333,033 333,033 - -
Reverse repurchase
agreements 69,042 - 69,042 -
Financial securities 1,447,393 - 1,445,802 1,591
Loans, advances and
financing 2,391,753 2,391,753 - -
Derivative assets (Note 33.3) 1,302,496 - 1,302,496 -
Statutory deposit with
Bank Negara Malaysia 100,000 100,000 - -
Other assets 420,693 420,693 - -
9,480,638 6,661,707 2,817,340 1,591
Financial liabilities
Deposits from customers 4,627,017 4,627,017 - -
Deposits and placements
of banks and other
financial institutions 658,943 658,943 - -
Derivative liabilities
(Note 33.3) 1,576,409 - 1,576,409 -
Other liabilities 760,509 760,509 - -
7,622,878 6,046,469 1,576,409 -
109
Company No. 312552-W
33. Financial assets and liabilities (continued)
33.1 Categories of financial instruments (continued)
The above disclosure is also applicable for the Bank level except that included
in the deposits from customers is RM20,000 (2017: RM20,000) cash
consolidated from the subsidiaries.
33.2 Determination of fair value and the fair value hierarchy
MFRS 13, Fair Value Measurement requires each class of assets and liabilities
measured at fair value in the statements of financial position after initial
recognition to be categorised according to hierarchy that reflects the
significance of inputs used in making the measurements, in particular,
whether the inputs used are observable or unobservable as discussed in Note
2(c)(vi).

110
Company No. 312552-W
33. Financial assets and liabilities (continued)
33.2 Determination of fair value and the fair value hierarchy (continued)
33.2.1 Financial instruments carried at fair value
The following table shows the Group’s and the Bank’s financial
instruments which are measured at fair value at the reporting date
analysed by the various level within the fair value hierarchy:
Group and Bank Level 1 Level 2 Level 3
RM’000 RM’000 RM’000
2018
Financial assets
Reverse repurchase
agreements - 146,401 -
Financial securities - 3,407,359 -
Derivative assets - 870,604 19,884
- 4,424,364 19,884
Financial liabilities
Derivative liabilities - (851,814) (3,172)
2017
Financial assets
Reverse repurchase
agreements - 69,042 -
Financial securities - 1,445,802 -
Derivative assets - 1,175,818 126,678
- 2,690,662 126,678
Financial liabilities
Derivative liabilities - (1,469,206) (107,203)

111
Company No. 312552-W
33. Financial assets and liabilities (continued)
33.2 Determination of fair value and the fair value hierarchy (continued)
33.2.1 Financial instruments carried at fair value (continued)
The following table shows a reconciliation from the beginning balances
to the ending balances for fair value measurements in Level 3 of the
fair value hierarchy:
Group and Bank
2018 2017
RM’000 RM’000
Financial assets
Balance at 1 January 126,678 73,261
Total gain recognised in profit
or loss:
- Settlements (1,154) (41,833)
- Attributable to (losses)/gains recognised
relating to financial assets that
have not been realised (105,640) 95,250
Balance at 31 December 19,884 126,678
Financial liabilities
Balance at 1 January (107,203) (13,182)
Total gain recognised in profit
or loss:
- Settlements 104,701 606
- Attributable to losses recognised
relating to financial liabilities
that have not been realised (670) (94,627)
Balance at 31 December (3,172) (107,203)
The unrealised gains/(losses) have been recognised net within non-
interest income in profit or loss as shown in Note 18.

112
Company No. 312552-W
33. Financial assets and liabilities (continued)
33.2 Determination of fair value and the fair value hierarchy (continued)
33.2.2 Financial instruments not carried at fair value
In respect of cash and short-term funds, other assets (excluding
derivatives), statutory deposit with Bank Negara Malaysia, deposit
with banks and other financial institutions, deposits and placements of
banks and other financial institutions and other liabilities (excluding
derivatives), the carrying amounts in the statements of financial
position approximate their fair values due to the relatively short-
term/on demand nature of these financial instruments.
The fair values of other financial assets/liabilities, together with the
carrying amounts shown in the statements of financial position, are as
follows:
Carrying
value
Fair
value
Group RM’000 RM’000
2018
Financial assets
Loans, advances and financing 2,275,345 2,275,072
Financial liabilities
Deposits from customers 4,226,840 4,240,832
2017
Financial assets
Loans, advances and financing 2,391,753 2,391,472
Financial liabilities
Deposits from customers 4,627,017 4,735,125

113
Company No. 312552-W
33. Financial assets and liabilities (continued)
33.2 Determination of fair value and the fair value hierarchy (continued)
33.2.2 Financial instruments not carried at fair value (continued)
The disclosure is also applicable for the Bank level except that included
in the deposits from customers is RM20,000 (2017: RM20,000) cash
consolidated from the subsidiaries.
(a) Loans, advances and financing
The fair values of fixed rate loans with remaining maturity of less
than one year and variable rate loans are estimated to
approximate their carrying values. For fixed rate loans with
maturities of more than one year, the fair values are estimated
based on expected future cash flows of contractual instalment
payments and discounted at prevailing rates at reporting date
offered for similar loans. In respect of impaired loans, the fair
values are deemed to approximate the carrying values, net of
individual assessment allowance for impaired debts and
financing.
(b) Deposits from customers
The fair values for deposit liabilities payable on demand (demand
and savings deposits) or with remaining maturities of less than
one year are estimated to approximate their carrying values at
reporting date. The fair values of fixed deposits with remaining
maturities of more than one year are estimated based on
discounted cash flows using rates currently offered for deposits
of similar remaining maturities.
The fair value of loans, advances and financing and deposits from
customers shown above are classified under Level 3 within the fair
value hierarchy disclosure in accordance to MFRS 7.

114
Company No. 312552-W
33. Financial assets and liabilities (continued)
33.3 Derivative financial instruments
The following table shows the notional and market values of the derivatives
financial instruments as at 31 December 2018 and 31 December 2017:
Group and Bank
Notional
Positive
market
value
Negative
market
value
RM’000 RM’000 RM’000
2018
Foreign exchange related
contracts
Forward exchange trades 38,875,764 215,749 (195,726)
Cross currency swaps 9,519,734 548,296 (517,093)
Foreign exchange options 1,504,286 8,784 -
Interest/Profit rate related
contracts
Swaption 1,168,479 1,057 (1,503)
Interest rate swap 41,823,831 116,602 (140,664)
92,892,094 890,488 (854,986)
2017
Foreign exchange related
contracts
Forward exchange trades 40,703,030 399,094 (570,505)
Cross currency swaps 8,627,198 675,198 (683,540)
Foreign exchange options 12,163 - (273)
Interest/Profit rate related
contracts
Swaption 1,454,319 17,101 (83,492)
Interest rate swap 53,558,391 210,791 (238,498)
Credit derivatives contracts 117,045 312 (101)
104,472,146 1,302,496 (1,576,409)
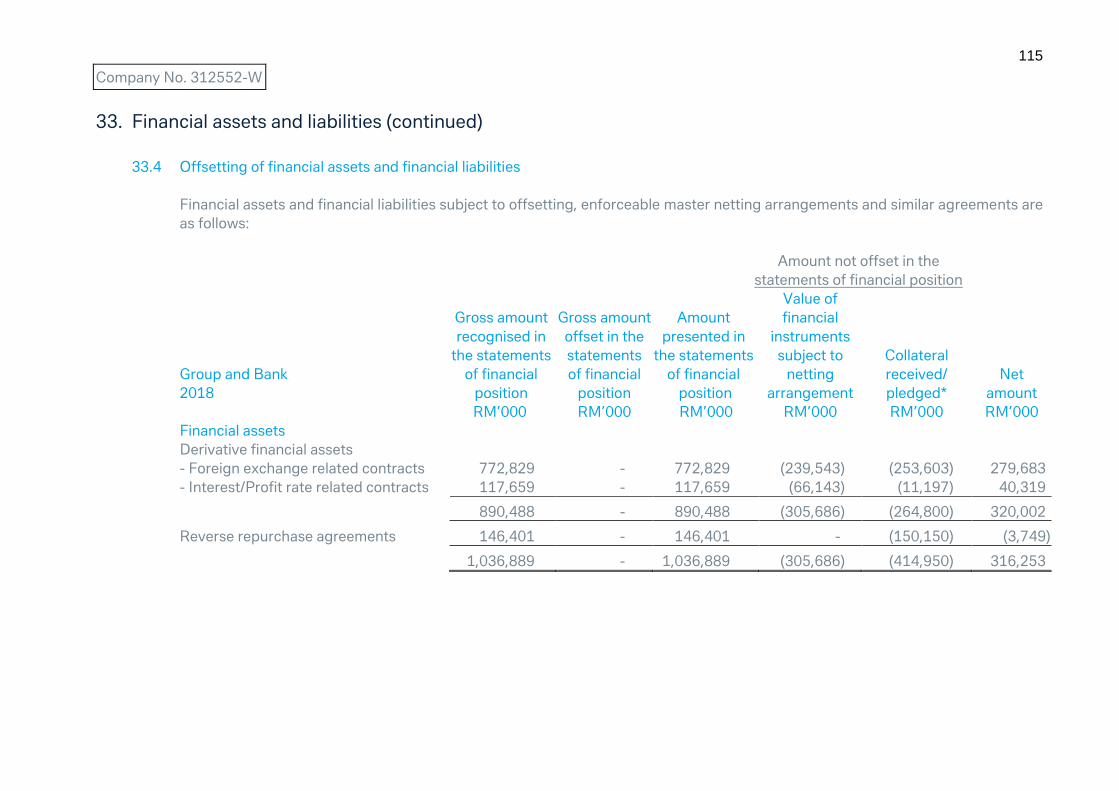
115
Company No. 312552-W
33. Financial assets and liabilities (continued)
33.4 Offsetting of financial assets and financial liabilities
Financial assets and financial liabilities subject to offsetting, enforceable master netting arrangements and similar agreements are
as follows:
Amount not offset in the
statements of financial position
Group and Bank
2018
Gross amount
recognised in
the statements
of financial
position
Gross amount
offset in the
statements
of financial
position
Amount
presented in
the statements
of financial
position
Value of
financial
instruments
subject to
netting
arrangement
Collateral
received/
pledged*
Net
amount
RM’000 RM’000 RM’000 RM’000 RM’000 RM’000
Financial assets
Derivative financial assets
- Foreign exchange related contracts 772,829 - 772,829 (239,543) (253,603) 279,683
- Interest/Profit rate related contracts 117,659 - 117,659 (66,143) (11,197) 40,319
890,488 - 890,488 (305,686) (264,800) 320,002
Reverse repurchase agreements 146,401 - 146,401 - (150,150) (3,749)
1,036,889 - 1,036,889 (305,686) (414,950) 316,253
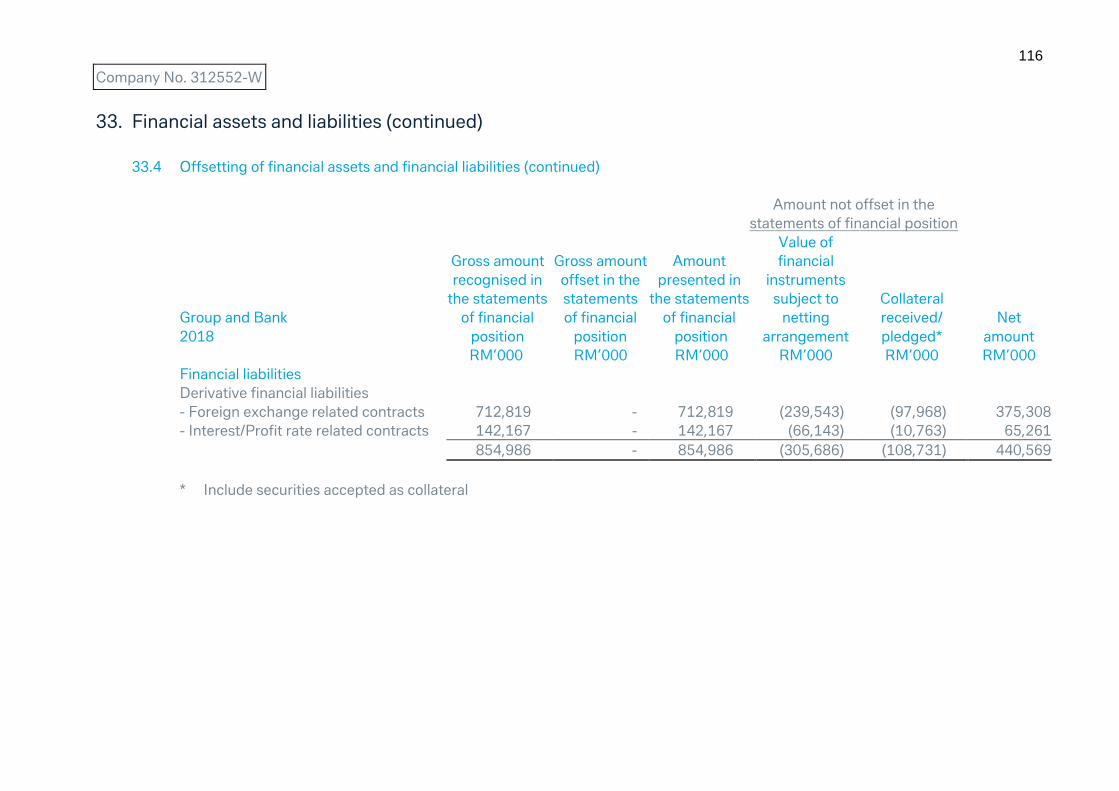
116
Company No. 312552-W
33. Financial assets and liabilities (continued)
33.4 Offsetting of financial assets and financial liabilities (continued)
Amount not offset in the
statements of financial position
Group and Bank
2018
Gross amount
recognised in
the statements
of financial
position
Gross amount
offset in the
statements
of financial
position
Amount
presented in
the statements
of financial
position
Value of
financial
instruments
subject to
netting
arrangement
Collateral
received/
pledged*
Net
amount
RM’000 RM’000 RM’000 RM’000 RM’000 RM’000
Financial liabilities
Derivative financial liabilities
- Foreign exchange related contracts 712,819 - 712,819 (239,543) (97,968) 375,308
- Interest/Profit rate related contracts 142,167 - 142,167 (66,143) (10,763) 65,261
854,986 - 854,986 (305,686) (108,731) 440,569
* Include securities accepted as collateral

117
Company No. 312552-W
33. Financial assets and liabilities (continued)
33.4 Offsetting of financial assets and financial liabilities (continued)
Amount not offset in the
statements of financial position
Group and Bank
2017
Gross amount
recognised in
the statements
of financial
position
Gross amount
offset in the
statements
of financial
position
Amount
presented in
the statements
of financial
position
Value of
financial
instruments
subject to
netting
arrangement
Collateral
received/
pledged*
Net
amount
RM’000 RM’000 RM’000 RM’000 RM’000 RM’000
Financial assets
Derivative financial assets
- Foreign exchange related contracts 1,074,292 - 1,074,292 (465,175) (1,147,804) (538,687)
- Interest/Profit rate related contracts 227,892 - 227,892 (109,792) (271,418) (153,318)
- Credit derivative contracts 312 - 312 - (346) (34)
1,302,496 - 1,302,496 (574,967) (1,419,568) (692,039)
Reverse repurchase agreements 69,042 - 69,042 - (70,400) (1,358)
1,371,538 - 1,371,538 (574,967) (1,489,968) (693,397)
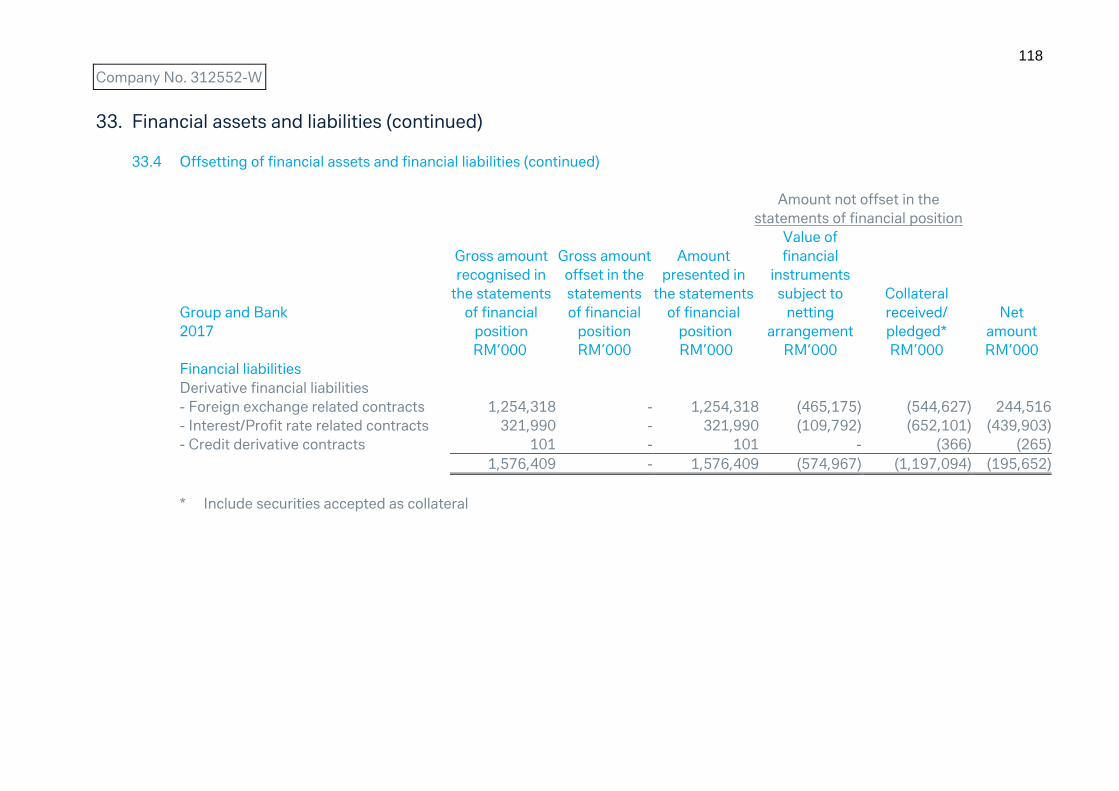
118
Company No. 312552-W
33. Financial assets and liabilities (continued)
33.4 Offsetting of financial assets and financial liabilities (continued)
Amount not offset in the
statements of financial position
Group and Bank
2017
Gross amount
recognised in
the statements
of financial
position
Gross amount
offset in the
statements
of financial
position
Amount
presented in
the statements
of financial
position
Value of
financial
instruments
subject to
netting
arrangement
Collateral
received/
pledged*
Net
amount
RM’000 RM’000 RM’000 RM’000 RM’000 RM’000
Financial liabilities
Derivative financial liabilities
- Foreign exchange related contracts 1,254,318 - 1,254,318 (465,175) (544,627) 244,516
- Interest/Profit rate related contracts 321,990 - 321,990 (109,792) (652,101) (439,903)
- Credit derivative contracts 101 - 101 - (366) (265)
1,576,409 - 1,576,409 (574,967) (1,197,094) (195,652)
* Include securities accepted as collateral

119
Company No. 312552-W
33. Financial assets and liabilities (continued)
33.4 Offsetting of financial assets and financial liabilities (continued)
Financial assets and financial liabilities are offset and the net amount is
reported in the statements of financial position when there is a legally
enforceable right to offset the recognised amounts and there is an intention
to settle on a net basis, or realise the asset and settle the liability
simultaneously.
Derivatives and reverse repurchase agreements included in the amount not
set-off in the statements of financial position relate to transactions where:
(i) the counterparty has an offsetting exposure with the Group and the
Bank and a master netting or similar arrangements is in place with a right
to set-off only in the event of default, insolvency or bankruptcy; and
(ii) cash and securities are received or cash pledged in respect of the
transaction described above.
34. Equity compensation benefits
The Bank participates in the following share and options compensation plans
operated by Deutsche Bank AG ("DB").
Share Plans
All awards represent a contingent right to receive DB common shares after a
specified period of time. The award recipient is not entitled to receive dividends
before the settlement of the award.

120
Company No. 312552-W
34. Equity compensation benefits (continued)
Deutsche Bank Share Scheme
Under the Deutsche Bank Share Scheme (“the Scheme”), selected employees are
granted deferred share rights to receive DB shares at a specific future date. These
may be granted as part of annual bonuses or as exceptional awards in the case of
sign-ons, buy-outs or as retention incentives. The compensation expense is
recognised on a straight line basis over the vesting period, which is generally three
years for the annual awards.
DB Global Share Purchase Plan
The DB Group offers a broad-based employee share ownership plan entitled Global
Share Purchase Plan (“GSPP”). The GSPP offers all active employees at participating
Deutsche Bank entities the opportunity to purchase Deutsche Bank shares in monthly
instalments over one year. At the end of the purchase cycle, the Bank matches the
acquired stock in a ratio of one to one up to a maximum of ten free shares, provided
that the employee remains at Deutsche Bank Group for another year. In total, about
12,453 staff from 20 countries enrolled in the tenth cycles that began in November
2018.
DB Equity Plan
The DB Group made grants of share-based compensation under the DB Equity Plan.
This plan represents a contingent right to receive Deutsche Bank common shares
after a specified period of time. The award recipient is not entitled to receive
dividends during the vesting period of the award.
The share awards granted under the terms and conditions of DB Equity Plan may be
forfeited fully or partly if the recipient voluntarily terminates employment before the
end of the relevant vesting period. Vesting usually continues after termination of
employment in cases such as redundancy or retirement.
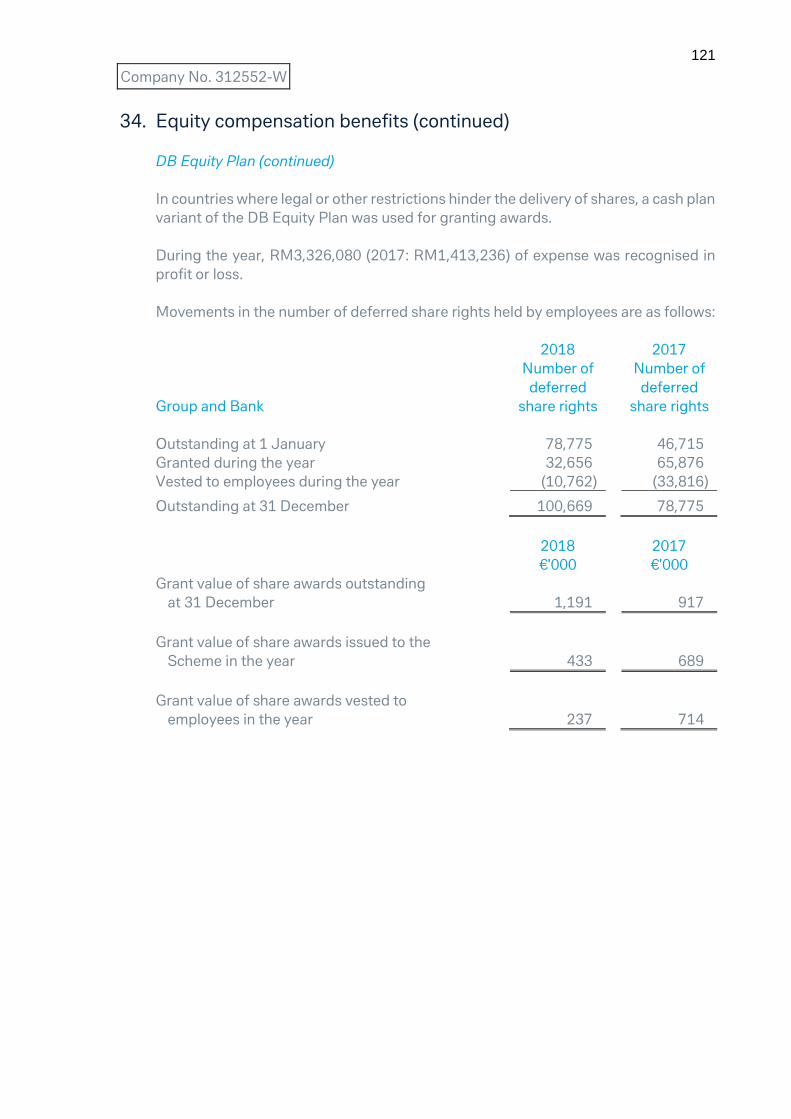
121
Company No. 312552-W
34. Equity compensation benefits (continued)
DB Equity Plan (continued)
In countries where legal or other restrictions hinder the delivery of shares, a cash plan
variant of the DB Equity Plan was used for granting awards.
During the year, RM3,326,080 (2017: RM1,413,236) of expense was recognised in
profit or loss.
Movements in the number of deferred share rights held by employees are as follows:
2018 2017
Group and Bank
Number of
deferred
share rights
Number of
deferred
share rights
Outstanding at 1 January 78,775 46,715
Granted during the year 32,656 65,876
Vested to employees during the year (10,762) (33,816)
Outstanding at 31 December 100,669 78,775
2018 2017
€'000 €'000
Grant value of share awards outstanding
at 31 December 1,191
917
Grant value of share awards issued to the
Scheme in the year 433
689
Grant value of share awards vested to
employees in the year 237
714
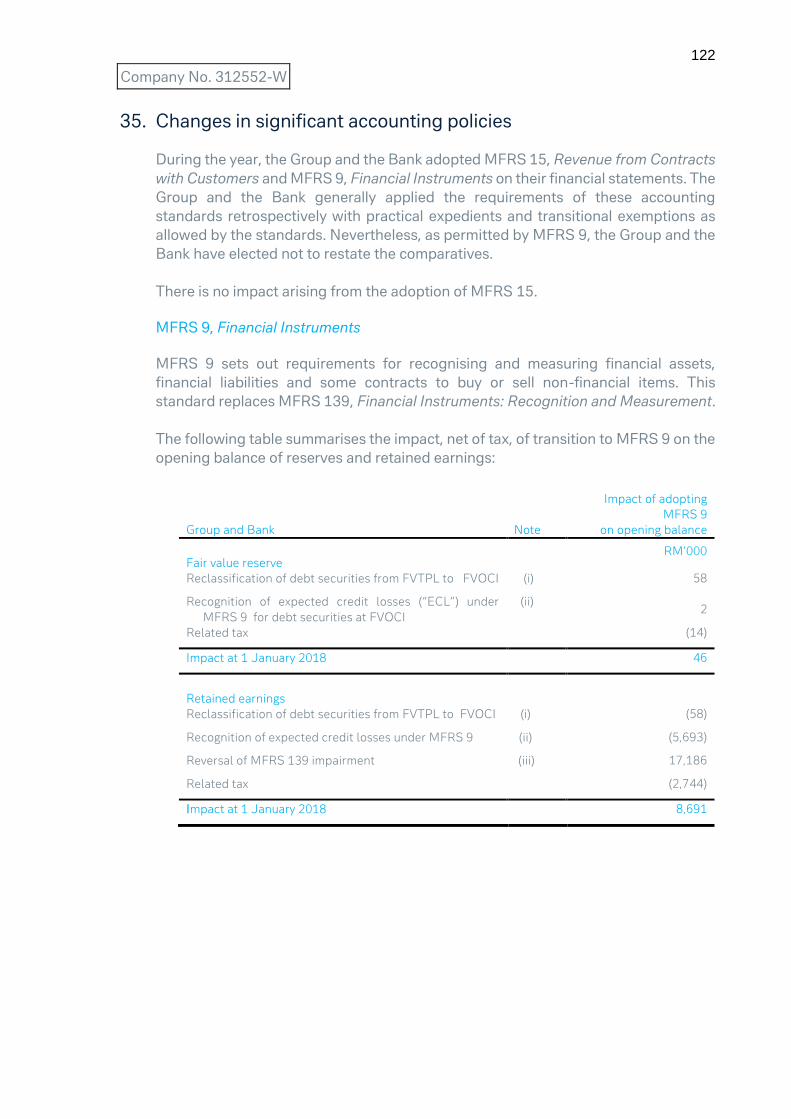
122
Company No. 312552-W
35. Changes in significant accounting policies
During the year, the Group and the Bank adopted MFRS 15, Revenue from Contracts
with Customers and MFRS 9, Financial Instruments on their financial statements. The
Group and the Bank generally applied the requirements of these accounting
standards retrospectively with practical expedients and transitional exemptions as
allowed by the standards. Nevertheless, as permitted by MFRS 9, the Group and the
Bank have elected not to restate the comparatives.
There is no impact arising from the adoption of MFRS 15.
MFRS 9, Financial Instruments
MFRS 9 sets out requirements for recognising and measuring financial assets,
financial liabilities and some contracts to buy or sell non-financial items. This
standard replaces MFRS 139, Financial Instruments: Recognition and Measurement.
The following table summarises the impact, net of tax, of transition to MFRS 9 on the
opening balance of reserves and retained earnings:
Group and Bank Note
Impact of adopting
MFRS 9
on opening balance
Fair value reserve
RM’000
Reclassification of debt securities from FVTPL to FVOCI (i) 58
Recognition of expected credit losses (“ECL”) under
MFRS 9 for debt securities at FVOCI
(ii) 2
Related tax (14)
Impact at 1 January 2018 46
Retained earnings
Reclassification of debt securities from FVTPL to FVOCI (i) (58)
Recognition of expected credit losses under MFRS 9 (ii) (5,693)
Reversal of MFRS 139 impairment (iii) 17,186
Related tax (2,744)
Impact at 1 January 2018 8,691
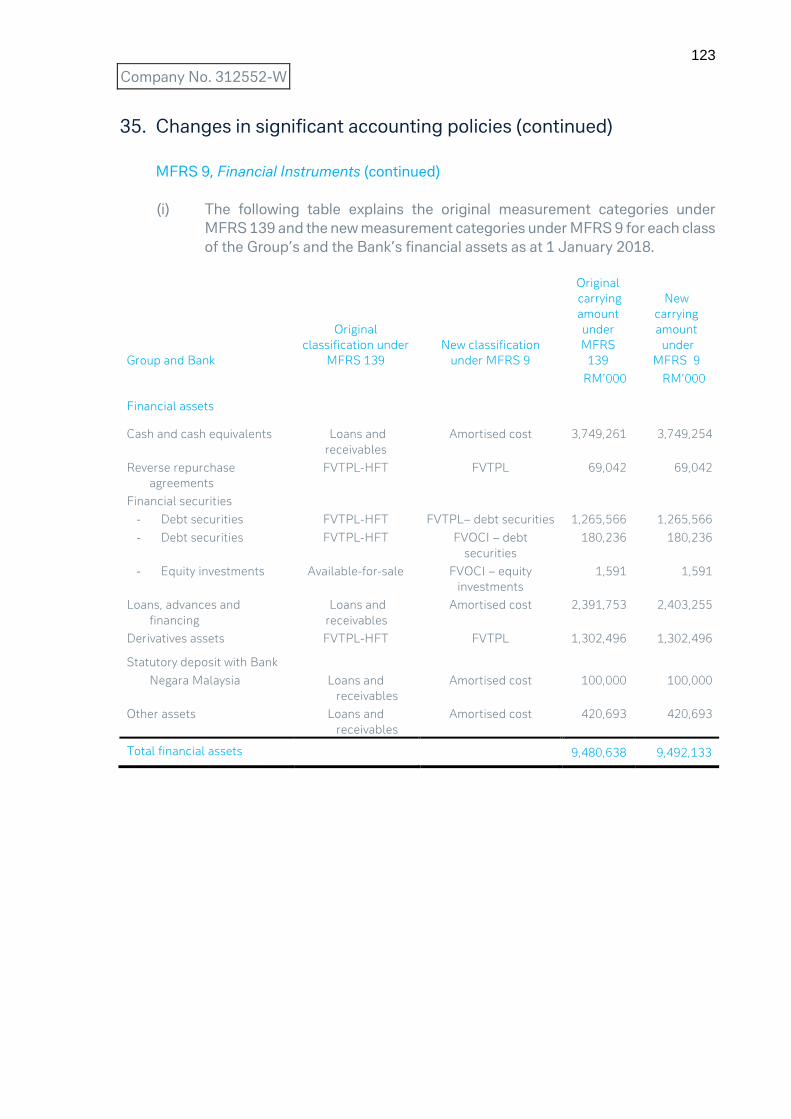
123
Company No. 312552-W
35. Changes in significant accounting policies (continued)
MFRS 9, Financial Instruments (continued)
(i) The following table explains the original measurement categories under
MFRS 139 and the new measurement categories under MFRS 9 for each class
of the Group’s and the Bank’s financial assets as at 1 January 2018.
Group and Bank
Original
classification under
MFRS 139
New classification
under MFRS 9
Original
carrying
amount
under
MFRS
139
New
carrying
amount
under
MFRS 9
RM’000 RM’000
Financial assets
Cash and cash equivalents Loans and
receivables
Amortised cost 3,749,261 3,749,254
Reverse repurchase
agreements
FVTPL-HFT FVTPL 69,042 69,042
Financial securities
- Debt securities
- Debt securities
FVTPL-HFT
FVTPL-HFT
FVTPL– debt securities
FVOCI – debt
securities
1,265,566
180,236
1,265,566
180,236
- Equity investments Available-for-sale FVOCI – equity
investments
1,591 1,591
Loans, advances and
financing
Loans and
receivables
Amortised cost 2,391,753 2,403,255
Derivatives assets FVTPL-HFT FVTPL 1,302,496 1,302,496
Statutory deposit with Bank
Negara Malaysia
Loans and
receivables
Amortised cost
100,000
100,000
Other assets Loans and
receivables
Amortised cost 420,693 420,693
Total financial assets 9,480,638 9,492,133
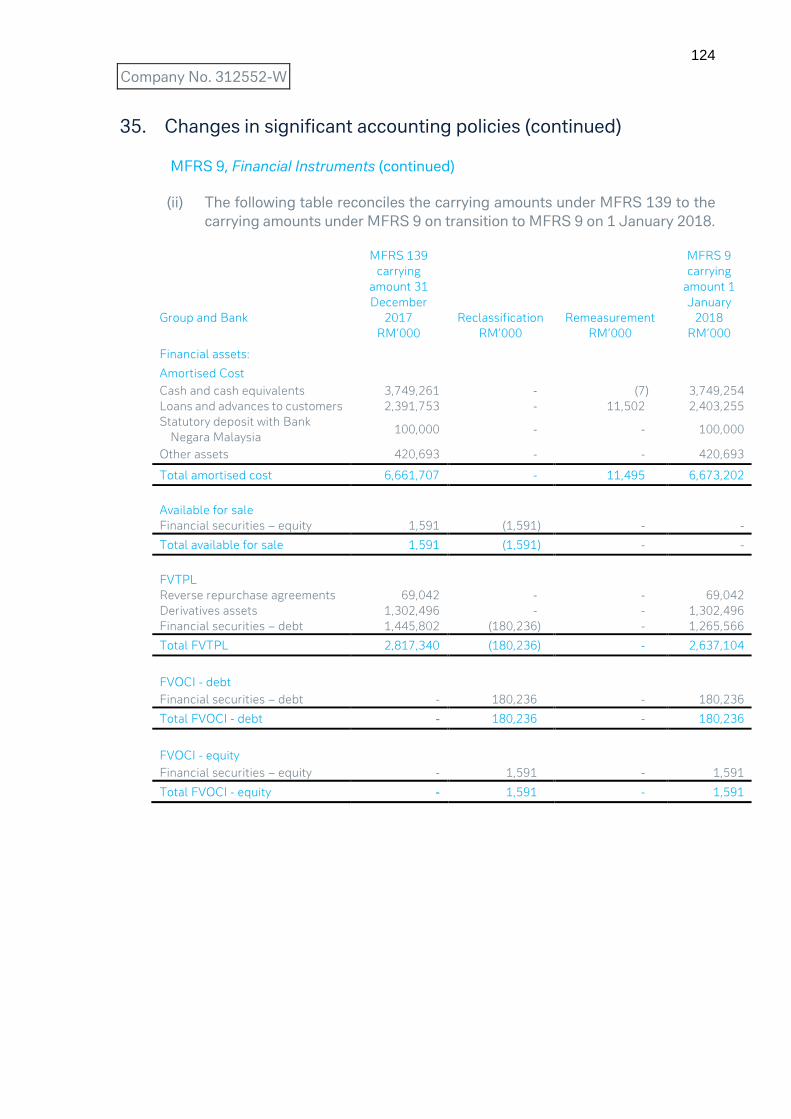
124
Company No. 312552-W
35. Changes in significant accounting policies (continued)
MFRS 9, Financial Instruments (continued)
(ii) The following table reconciles the carrying amounts under MFRS 139 to the
carrying amounts under MFRS 9 on transition to MFRS 9 on 1 January 2018.
Group and Bank
MFRS 139
carrying
amount 31
December
2017 Reclassification Remeasurement
MFRS 9
carrying
amount 1
January
2018
RM’000 RM’000 RM’000 RM’000
Financial assets:
Amortised Cost
Cash and cash equivalents 3,749,261 - (7) 3,749,254
Loans and advances to customers 2,391,753 - 11,502 2,403,255
Statutory deposit with Bank
Negara Malaysia 100,000 - - 100,000
Other assets 420,693 - - 420,693
Total amortised cost 6,661,707 - 11,495 6,673,202
Available for sale
Financial securities – equity 1,591 (1,591) - -
Total available for sale 1,591 (1,591) - -
FVTPL
Reverse repurchase agreements 69,042 - - 69,042
Derivatives assets 1,302,496 - - 1,302,496
Financial securities – debt 1,445,802 (180,236) - 1,265,566
Total FVTPL 2,817,340 (180,236) - 2,637,104
FVOCI - debt
Financial securities – debt - 180,236 - 180,236
Total FVOCI - debt - 180,236 - 180,236
FVOCI - equity
Financial securities – equity - 1,591 - 1,591
Total FVOCI - equity - 1,591 - 1,591

125
Company No. 312552-W
35. Changes in significant accounting policies (continued)
MFRS 9, Financial Instruments (continued)
(iii) Impairment of financial assets
The following table reconciles the closing impairment allowance for financial
assets in accordance with MFRS 139 and the opening ECL allowance
determined in accordance with MFRS 9 as at 1 January 2018.
Group and Bank
MFRS 139
carrying
amount 31
December
2017 Reclassification Remeasurement
MFRS 9
carrying
amount 1
January
2018
RM’000 RM’000 RM’000 RM’000
Cash and cash equivalents - - 7 7
Loans and advances to
customers 17,186 - (11,502) 5,684
Total 17,186 - (11,495) 5,691
The Group and the Bank have determined the impact of the application of
MFRS 9’s impairment requirements at 1 January 2018 and results are as
follows:
Group and Bank
RM’000
Loss allowance at 31 December 2017 under MFRS 139 17,186
Reversal of loss allowance under MFRS 139 (17,186)
Impairment recognised at 1 January 2018 on:
Cash and cash equivalent 7
Loan, advances and financing 5,684
Debt securities at FVOCI 2
Loss allowance at 1 January 2018 under MFRS 9 5,693
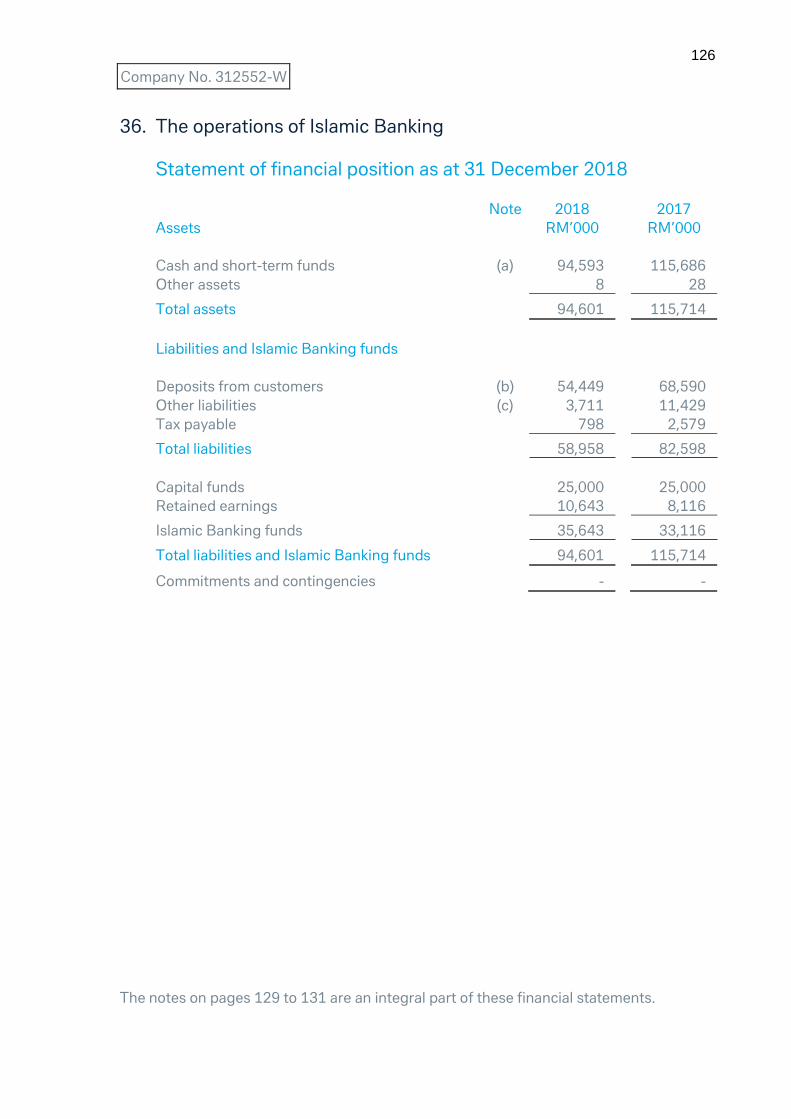
126
Company No. 312552-W
36. The operations of Islamic Banking
Statement of financial position as at 31 December 2018
Note 2018 2017
Assets RM’000 RM’000
Cash and short-term funds (a) 94,593 115,686
Other assets 8 28
Total assets 94,601 115,714
Liabilities and Islamic Banking funds
Deposits from customers (b) 54,449 68,590
Other liabilities (c) 3,711 11,429
Tax payable 798 2,579
Total liabilities 58,958 82,598
Capital funds 25,000 25,000
Retained earnings 10,643 8,116
Islamic Banking funds 35,643 33,116
Total liabilities and Islamic Banking funds 94,601 115,714
Commitments and contingencies - -
The notes on pages 129 to 131 are an integral part of these financial statements.
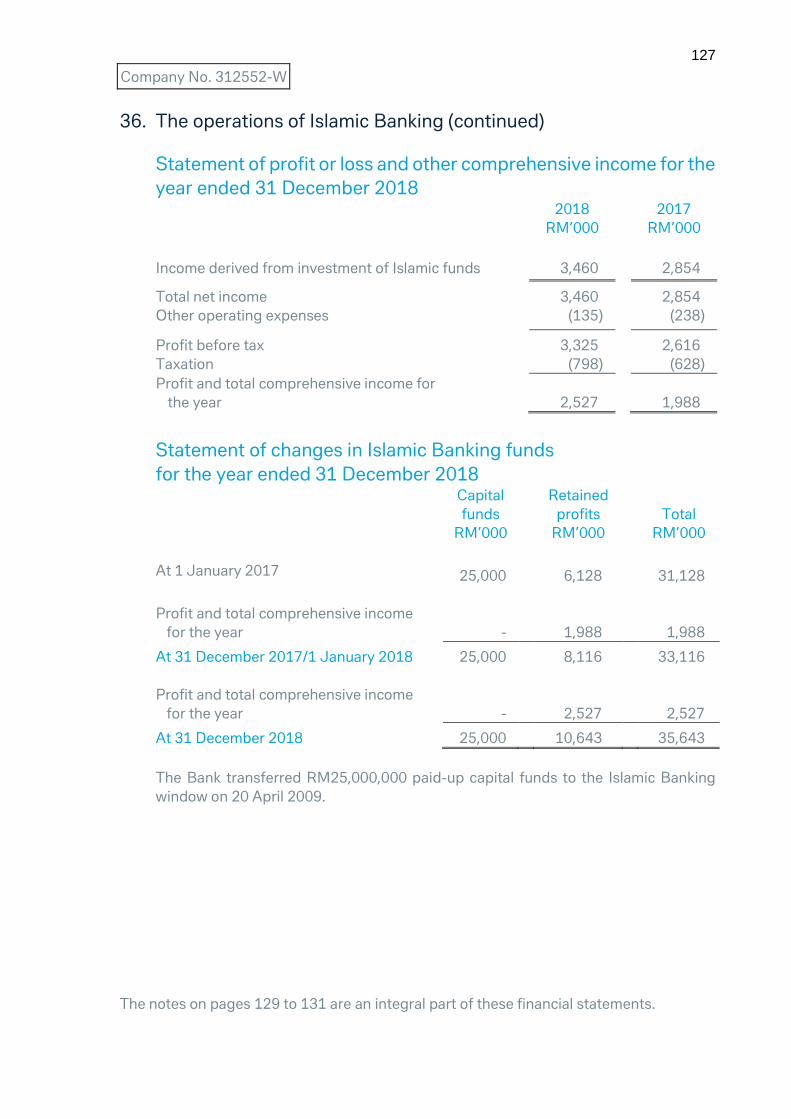
127
Company No. 312552-W
36. The operations of Islamic Banking (continued)
Statement of profit or loss and other comprehensive income for the
year ended 31 December 2018 2018 2017
RM’000 RM’000
Income derived from investment of Islamic funds 3,460 2,854
Total net income 3,460 2,854
Other operating expenses (135) (238)
Profit before tax 3,325 2,616
Taxation (798) (628)
Profit and total comprehensive income for
the year 2,527
1,988
Statement of changes in Islamic Banking funds
for the year ended 31 December 2018 Capital
funds
Retained
profits
Total
RM’000 RM’000 RM’000
At 1 January 2017 25,000 6,128 31,128
Profit and total comprehensive income
for the year
-
1,988
1,988
At 31 December 2017/1 January 2018 25,000 8,116 33,116
Profit and total comprehensive income
for the year
-
2,527
2,527
At 31 December 2018 25,000 10,643 35,643
The Bank transferred RM25,000,000 paid-up capital funds to the Islamic Banking
window on 20 April 2009.
The notes on pages 129 to 131 are an integral part of these financial statements.

128
Company No. 312552-W
36. The operations of Islamic Banking (continued)
Statement of cash flows
for the year ended 31 December 2018
2018 2017
RM’000 RM’000
Cash flows from operating activities
Profit before tax 3,325 2,616
Operating profit before working capital changes 3,325 2,616
Decrease/(Increase) in operating assets 20 (18)
(Decrease)/Increase in operating liabilities (21,859) 45,928
Cash (used in)/generated from operations (18,514) 48,526
Income taxes paid (2,579) -
Net cash (used in)/generated from operations (21,093) 48,526
Net (decrease)/increase in cash and cash
equivalents (21,093)
48,526
Cash and cash equivalents at 1 January 115,686 67,160
Cash and cash equivalents at 31 December
(Note 36(a)) 94,593
115,686
The notes on pages 129 to 131 are an integral part of these financial statements.
129
Company No. 312552-W
36. The operations of Islamic Banking (continued)
BNM had given its approval on 22 August 2007 for the Bank to conduct Islamic
Banking business under Section 124 of the Banking and Financial Institutions Act,
1989 (Now repealed and replaced by the Financial Services Act, 2013).
Shariah Committee
The Shariah Committee was established under BNM’s “Guidelines on the
Governance of Shariah Committee for the Islamic Financial Institutions” (BNM/GPS1)
to advise the Board of Directors on Shariah matters in its Islamic business operations
and to provide technical assistance in ensuring the Islamic Banking products and
services offered by the Bank and the relevant documentation are in compliance with
Shariah principles.
During the financial year ended 31 December 2018, a total of 4 meetings were held.
The Shariah Committee comprises the following members and the details of
attendance of each member was as follows:
Members Number of Shariah
meetings attended
Dr Sheikh Hussein Hamed Sayed Hassan 4/4
Dr Muhammad Qaseem 4/4
En. Mohd Hilmi bin Ramli 4/4
Basis of measurement
The financial statements of the Islamic Banking business have been prepared on the
basis consistent with that of the Group and of the Bank as disclosed in Notes 1 and 2
to the financial statements of the Group and of the Bank and have been prepared on
the historical cost basis, except as mentioned in the respective accounting policy
notes.

130
Company No. 312552-W
36. The operations of Islamic Banking (continued)
(a) Cash and short-term funds
2018 2017
RM’000 RM’000
Cash and balances with banks and other
financial institutions
94,593
115,686
(b) Deposits from customers
2018 2017
RM’000 RM’000
Non-Mudharabah
Demand deposits 54,449 68,590
(c) Other liabilities
2018 2017
RM’000 RM’000
Bills payable 12 166
Other liabilities 3,699 11,263
3,711 11,429
(d) Capital adequacy
The capital adequacy ratios of the Islamic Banking business of the Group are
computed in accordance with the Capital Adequacy Framework for Islamic
Banks (“CAFIB”). The Group’s Islamic Banking business has adopted the
Standardised Approach for Credit Risk and Market Risk, and the Basic Indicator
Approach for Operational Risk.

131
Company No. 312552-W
36. The operations of Islamic Banking (continued)
(d) Capital adequacy (continued)
Components of Tier I and Tier II capital:
2018 2017
RM’000 RM’000
Tier 1 capital
Capital funds 25,000 25,000
Retained earnings 10,643 8,116
Total common equity tier 1/Total tier 1 capital 35,643 33,116
Total Tier 2 capital - -
Capital base 35,643 33,116
Common equity tier 1/Tier 1 capital ratio 498.808% 585.865%
Total capital ratio 498.808% 585.865%
The breakdown of risk-weighted assets (“RWA”) by exposures in each major
risk category is as follows:
Risk Type Risk-Weighted Assets
2018 2017
RM’000 RM’000
1 Credit risk 938 843
2 Market risk 1,875 1,687
3 Operational risk 4,333 3,123
Total 7,146 5,653