dr. josef ackermann - db.com · dr. josef ackermann 2 february 2012 deutsche bank press and media...
TRANSCRIPT
Dr. Josef Ackermann 2 February 2012
Deutsche BankPress and Media Relations
financial transparency.
Deutsche Bank
Dr. Josef AckermannChairman of the Management Board and the Group Executive Committee
Annual Press ConferenceFrankfurt, 2 February 2012
Dr. Josef Ackermann 2 February 2012
Deutsche BankPress and Media Relations
financial transparency.
2011 at a glance
2
Record pre-tax profit in classic banking businesses
Investments in growth and a more stable earnings mix pay off
Strengthened capital position, liquidity reserves and refinancing resources
Outstanding position to continue successful course
Dr. Josef Ackermann 2 February 2012
Deutsche BankPress and Media Relations
financial transparency.
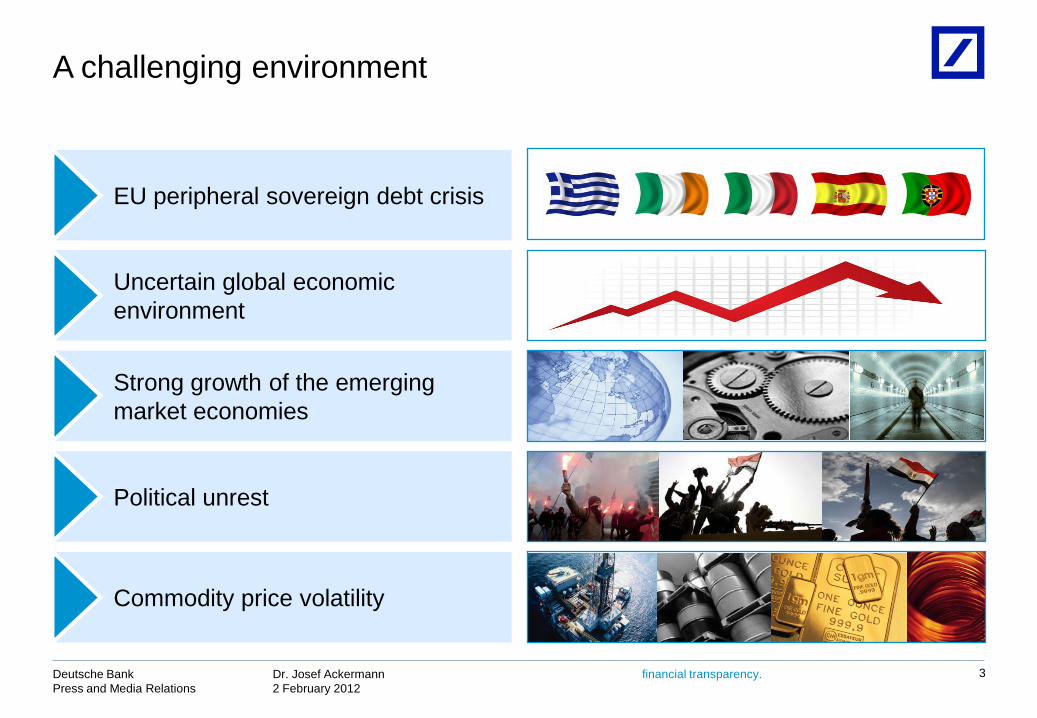
A challenging environment
3
EU peripheral sovereign debt crisis
Uncertain global economic environment
Strong growth of the emerging market economies
Political unrest
Commodity price volatility
Dr. Josef Ackermann 2 February 2012
Deutsche BankPress and Media Relations
financial transparency.
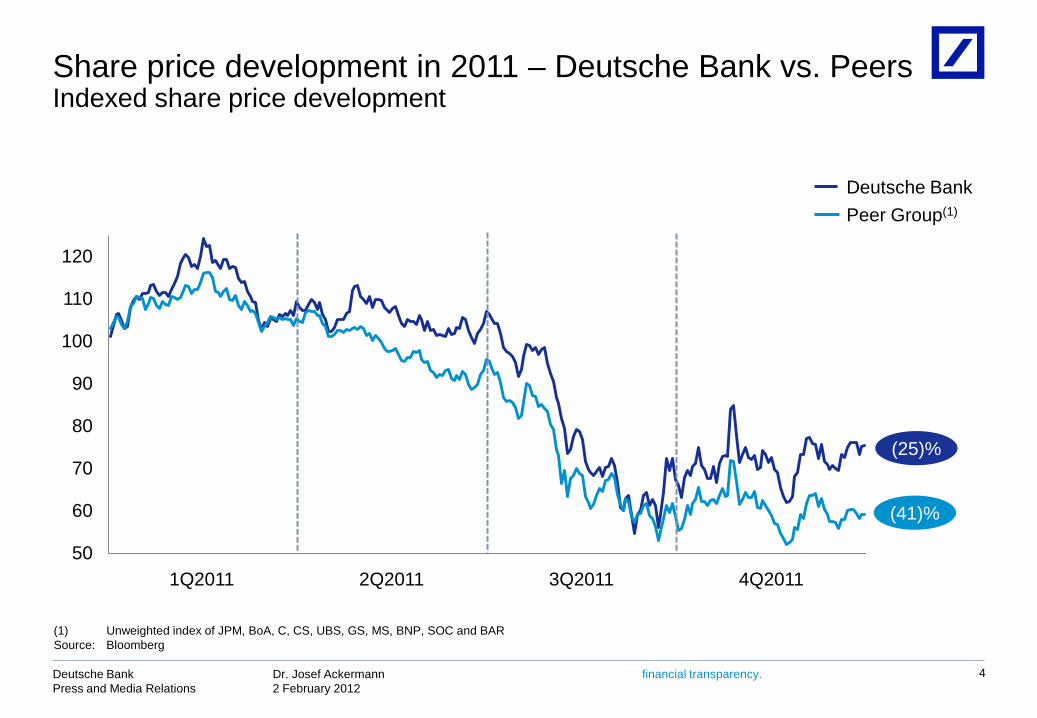
Share price development in 2011 – Deutsche Bank vs. PeersIndexed share price development
4
Deutsche BankPeer Group(1)
(25)%
(41)%
50
60
70
80
90
100
110
120
1Q2011 2Q2011 3Q2011 4Q2011
(1) Unweighted index of JPM, BoA, C, CS, UBS, GS, MS, BNP, SOC and BARSource: Bloomberg
Dr. Josef Ackermann 2 February 2012
Deutsche BankPress and Media Relations
financial transparency.
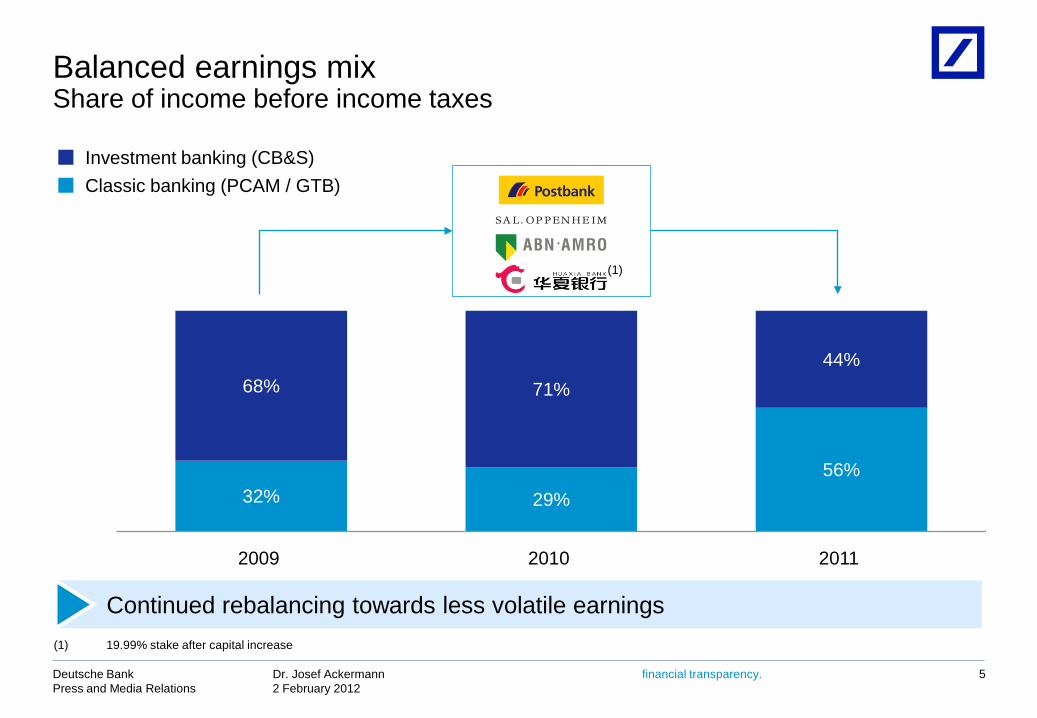
Balanced earnings mix Share of income before income taxes
5
32% 29%56%
68% 71%44%
2009 2010 2011
Classic banking (PCAM / GTB)Investment banking (CB&S)
Continued rebalancing towards less volatile earnings
(1)
(1) 19.99% stake after capital increase
Dr. Josef Ackermann 2 February 2012
Deutsche BankPress and Media Relations
financial transparency.
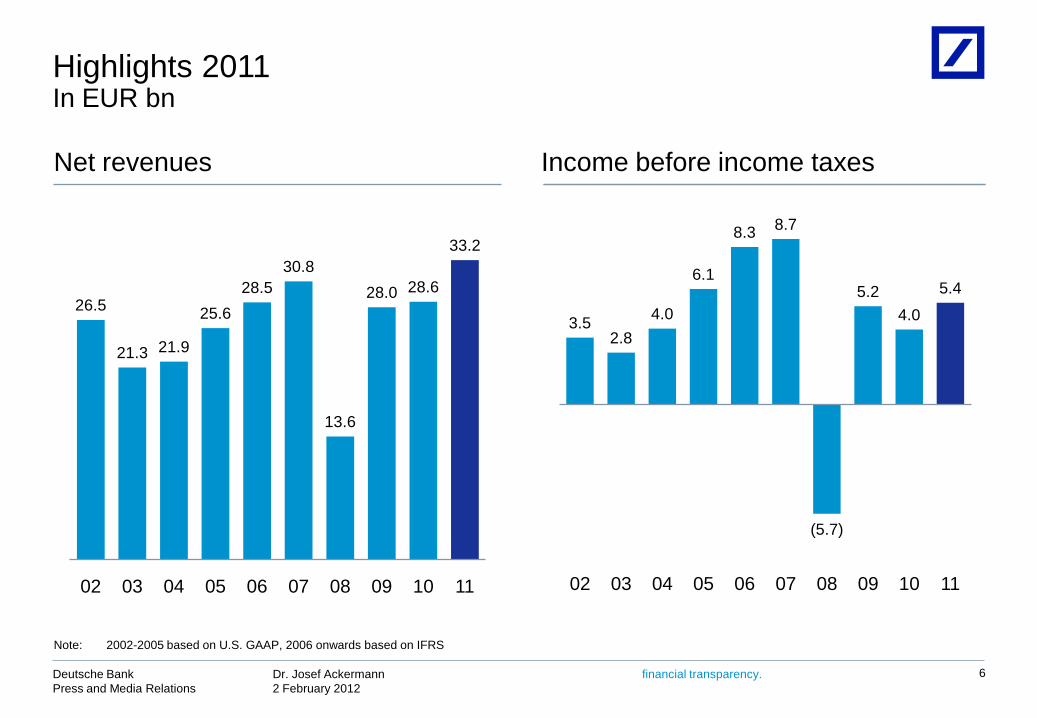
Highlights 2011In EUR bn
6
Income before income taxesNet revenues
3.52.8
4.0
6.1
8.3 8.7
(5.7)
5.24.0
5.4
02 03 04 05 06 07 08 09 10 11
26.5
21.3 21.9
25.628.5
30.8
13.6
28.0 28.6
33.2
02 03 04 05 06 07 08 09 10 11
Note: 2002-2005 based on U.S. GAAP, 2006 onwards based on IFRS
Dr. Josef Ackermann 2 February 2012
Deutsche BankPress and Media Relations
financial transparency. 7
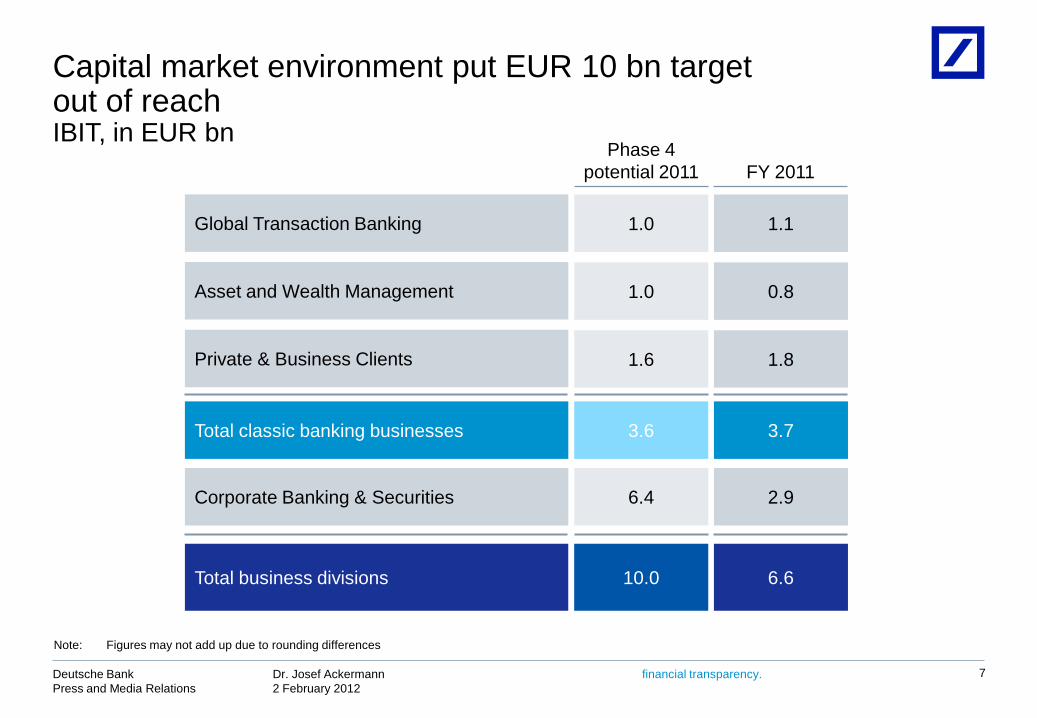
Phase 4 potential 2011 FY 2011
Private & Business Clients 1.6 1.8
Global Transaction Banking 1.0 1.1
Corporate Banking & Securities 6.4 2.9
Total business divisions 10.0 6.6
Asset and Wealth Management 1.0 0.8
Total classic banking businesses 3.6 3.7
Capital market environment put EUR 10 bn targetout of reachIBIT, in EUR bn
Note: Figures may not add up due to rounding differences
Dr. Josef Ackermann 2 February 2012
Deutsche BankPress and Media Relations
financial transparency.
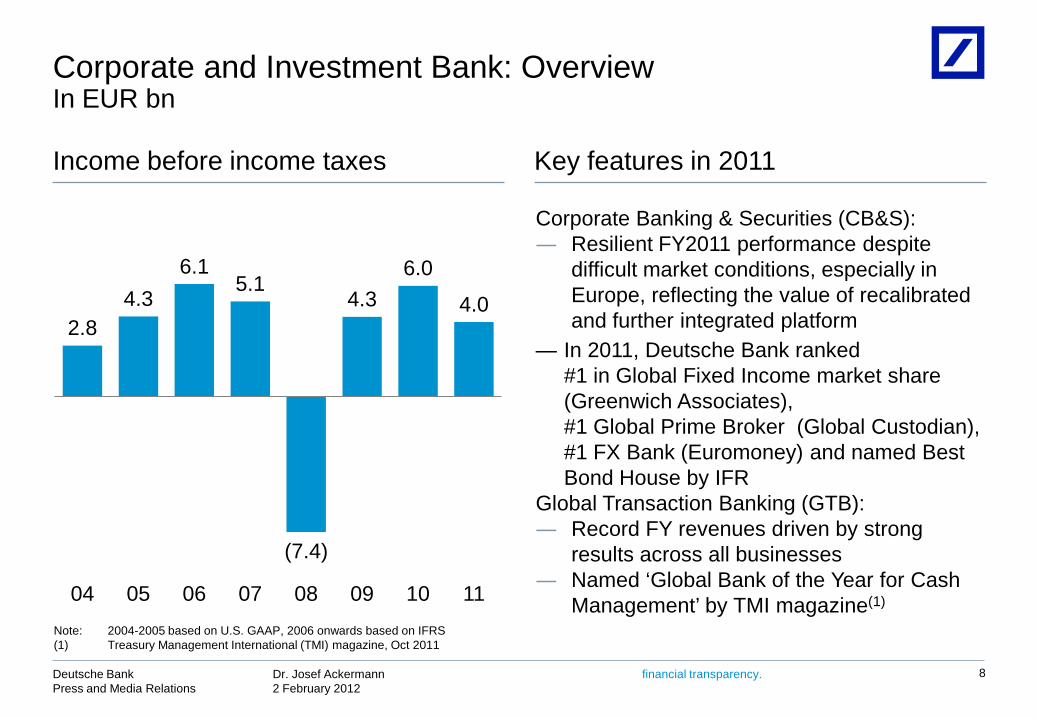
Corporate and Investment Bank: OverviewIn EUR bn
8
Key features in 2011Income before income taxes
Corporate Banking & Securities (CB&S): ― Resilient FY2011 performance despite
difficult market conditions, especially in Europe, reflecting the value of recalibrated and further integrated platform
— In 2011, Deutsche Bank ranked #1 in Global Fixed Income market share (Greenwich Associates), #1 Global Prime Broker (Global Custodian), #1 FX Bank (Euromoney) and named Best Bond House by IFR
Global Transaction Banking (GTB):― Record FY revenues driven by strong
results across all businesses― Named ‘Global Bank of the Year for Cash
Management’ by TMI magazine(1)
2.8 4.3
6.1 5.1
(7.4)
4.3 6.0
4.0
04 05 06 07 08 09 10 11Note: 2004-2005 based on U.S. GAAP, 2006 onwards based on IFRS(1) Treasury Management International (TMI) magazine, Oct 2011
Dr. Josef Ackermann 2 February 2012
Deutsche BankPress and Media Relations
financial transparency.
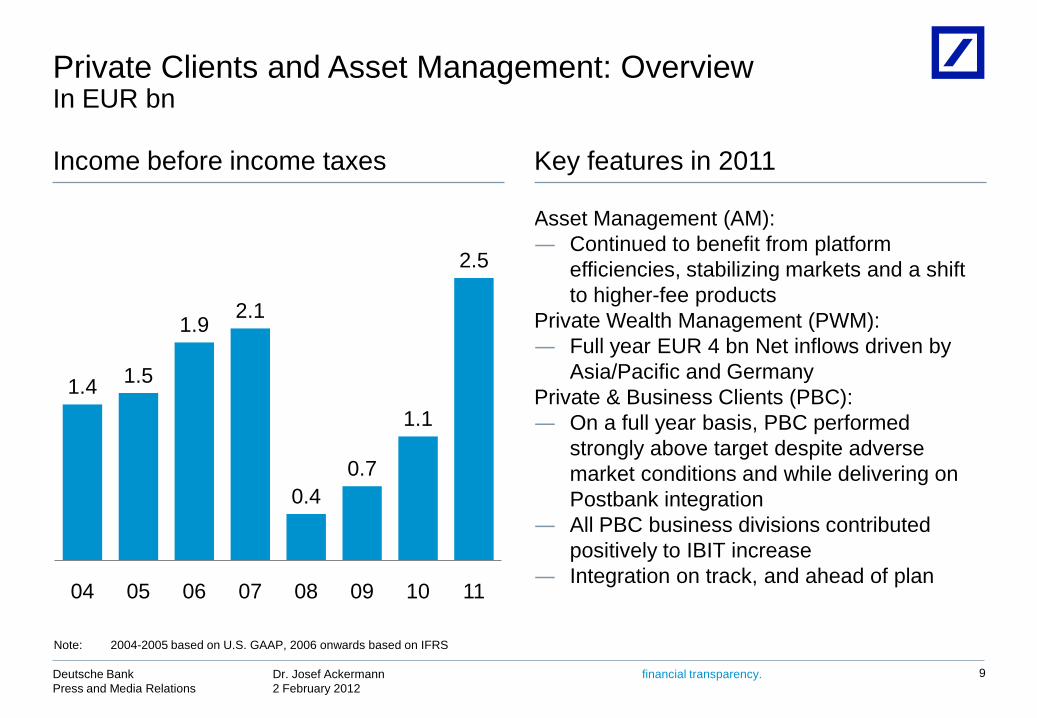
Asset Management (AM):― Continued to benefit from platform
efficiencies, stabilizing markets and a shift to higher-fee products
Private Wealth Management (PWM):― Full year EUR 4 bn Net inflows driven by
Asia/Pacific and GermanyPrivate & Business Clients (PBC): ― On a full year basis, PBC performed
strongly above target despite adverse market conditions and while delivering on Postbank integration
― All PBC business divisions contributed positively to IBIT increase
― Integration on track, and ahead of plan
Private Clients and Asset Management: OverviewIn EUR bn
9
1.4 1.5
1.9 2.1
0.4 0.7
1.1
2.5
04 05 06 07 08 09 10 11
Key features in 2011Income before income taxes
Note: 2004-2005 based on U.S. GAAP, 2006 onwards based on IFRS
Dr. Josef Ackermann 2 February 2012
Deutsche BankPress and Media Relations
financial transparency.
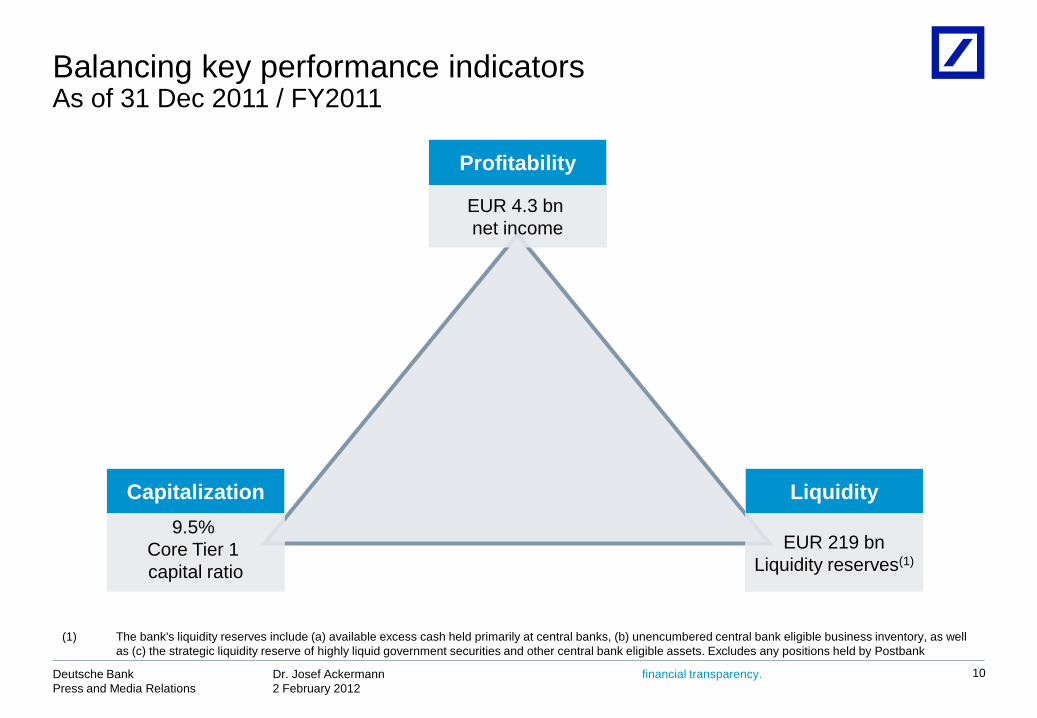
Balancing key performance indicatorsAs of 31 Dec 2011 / FY2011
10
Profitability
EUR 4.3 bnnet income
Capitalization9.5%
Core Tier 1 capital ratio
Liquidity
EUR 219 bnLiquidity reserves(1)
(1) The bank's liquidity reserves include (a) available excess cash held primarily at central banks, (b) unencumbered central bank eligible business inventory, as well as (c) the strategic liquidity reserve of highly liquid government securities and other central bank eligible assets. Excludes any positions held by Postbank
Dr. Josef Ackermann 2 February 2012
Deutsche BankPress and Media Relations
financial transparency.
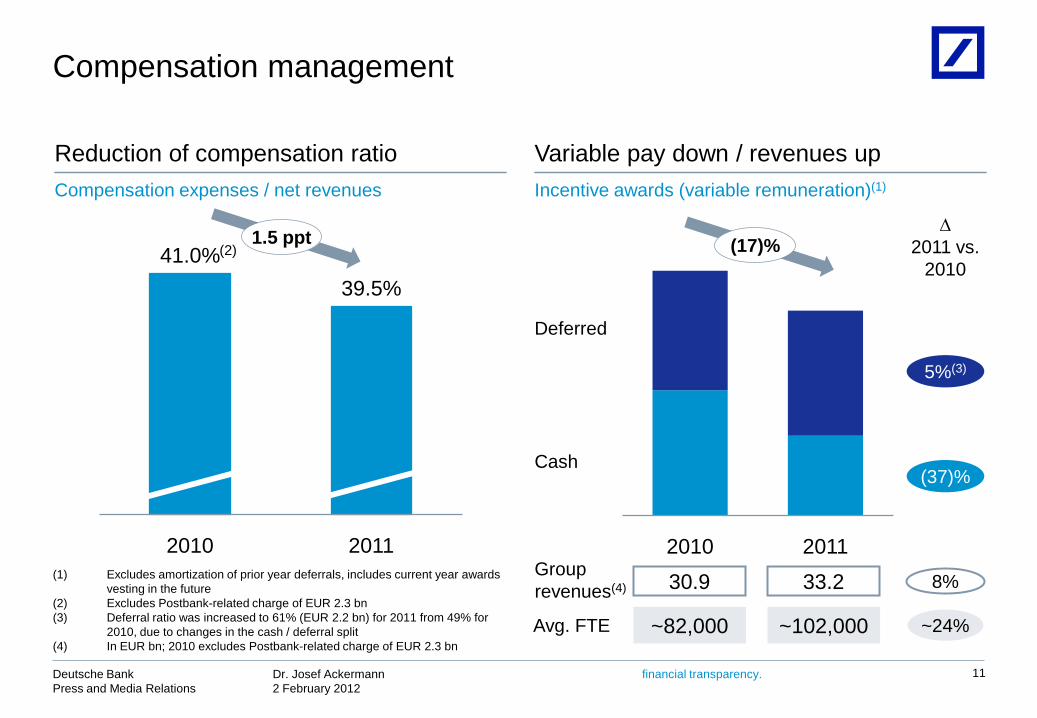
Compensation management
11
Reduction of compensation ratioCompensation expenses / net revenues
Variable pay down / revenues upIncentive awards (variable remuneration)(1)
41.0%39.5%
2010 2011 2010 2011
Cash
Deferred
∆ 2011 vs.
2010
Group revenues(4) 30.9 33.2(1) Excludes amortization of prior year deferrals, includes current year awards
vesting in the future(2) Excludes Postbank-related charge of EUR 2.3 bn(3) Deferral ratio was increased to 61% (EUR 2.2 bn) for 2011 from 49% for
2010, due to changes in the cash / deferral split(4) In EUR bn; 2010 excludes Postbank-related charge of EUR 2.3 bn
8%
1.5 ppt (17)%
~24%Avg. FTE ~82,000 ~102,000
(2)
(37)%
5%(3)
Dr. Josef Ackermann 2 February 2012
Deutsche BankPress and Media Relations
financial transparency.
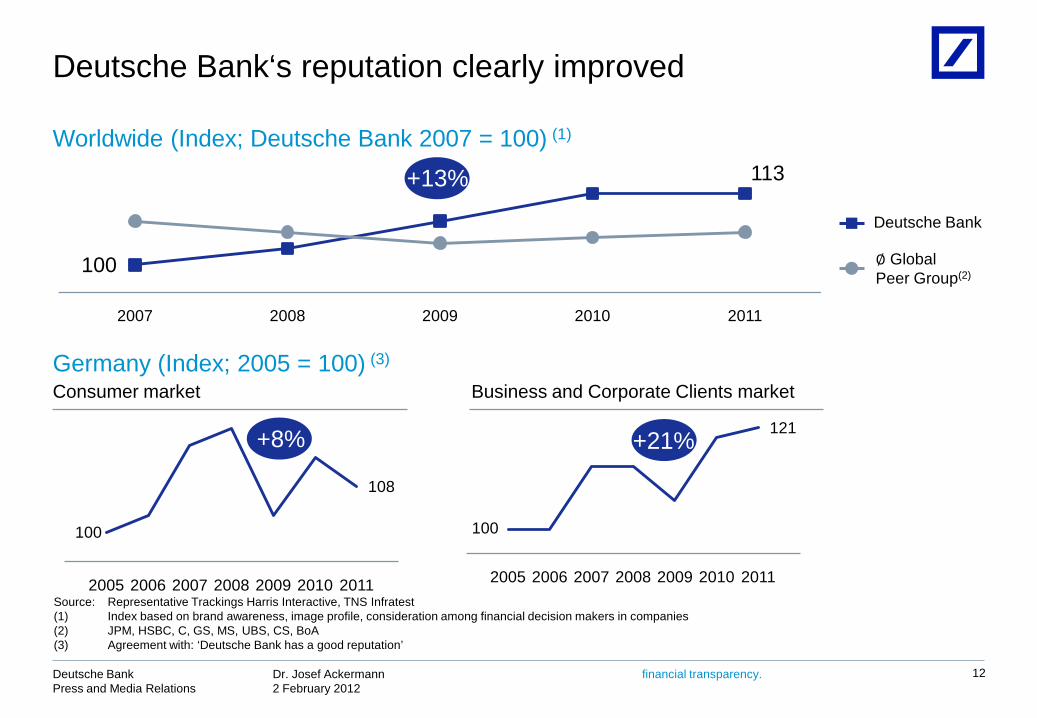
Deutsche Bank‘s reputation clearly improved
12
100
121
2005 2006 2007 2008 2009 2010 2011
+21%+8%
2007 2008 2009 2010 2011
+13%
100
108
2005 2006 2007 2008 2009 2010 2011
Germany (Index; 2005 = 100) (3)
Worldwide (Index; Deutsche Bank 2007 = 100) (1)
Deutsche Bank
∅ GlobalPeer Group(2)
Consumer market Business and Corporate Clients market
113
100
Source: Representative Trackings Harris Interactive, TNS Infratest(1) Index based on brand awareness, image profile, consideration among financial decision makers in companies(2) JPM, HSBC, C, GS, MS, UBS, CS, BoA(3) Agreement with: ‘Deutsche Bank has a good reputation’
Dr. Josef Ackermann 2 February 2012
Deutsche BankPress and Media Relations
financial transparency.
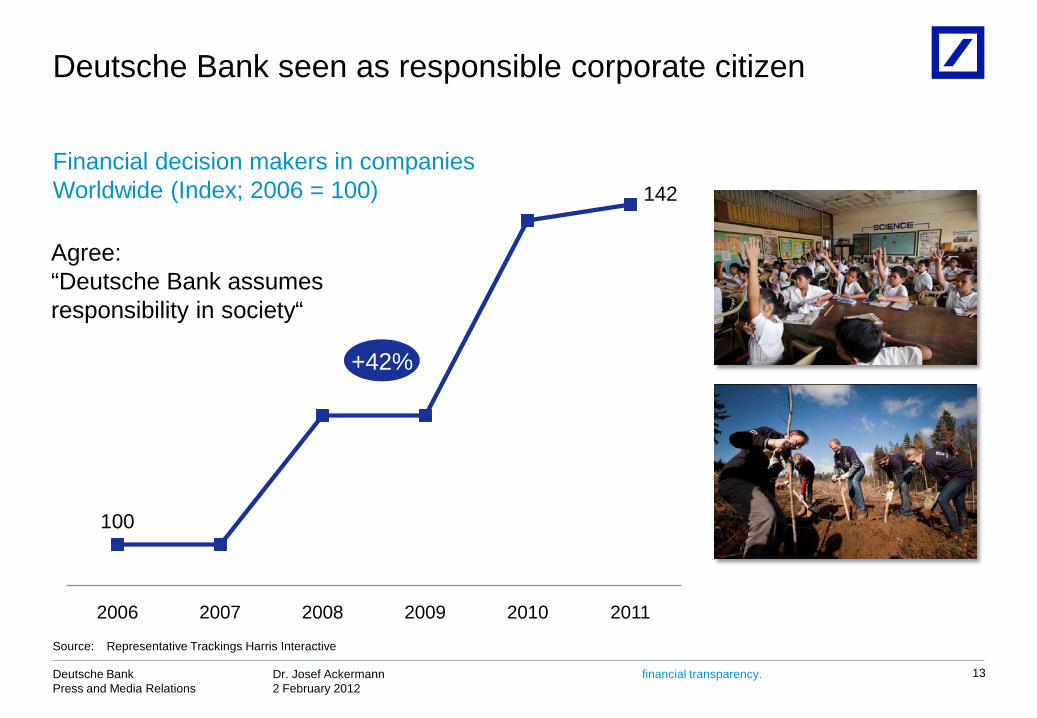
Deutsche Bank seen as responsible corporate citizen
13
100
142
2006 2007 2008 2009 2010 2011
+42%
Agree:“Deutsche Bank assumesresponsibility in society“
Financial decision makers in companiesWorldwide (Index; 2006 = 100)
Source: Representative Trackings Harris Interactive
Dr. Josef Ackermann 2 February 2012
Deutsche BankPress and Media Relations
financial transparency.
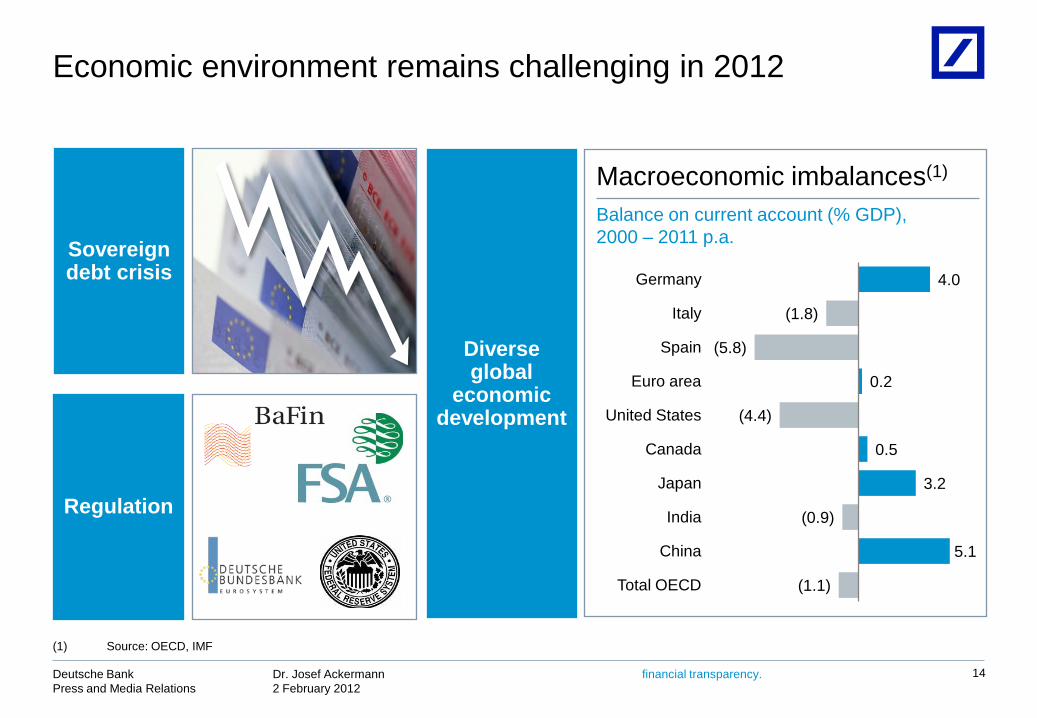
Economic environment remains challenging in 2012
14
Diverse global
economic development
Regulation
Sovereigndebt crisis
Macroeconomic imbalances(1)
Balance on current account (% GDP),2000 – 2011 p.a.
(1.1)
5.1
(0.9)
3.2
0.5
(4.4)
0.2
(5.8)
(1.8)
4.0
Total OECD
China
India
Japan
Canada
United States
Euro area
Spain
Italy
Germany
(1) Source: OECD, IMF
Dr. Josef Ackermann 2 February 2012
Deutsche BankPress and Media Relations
financial transparency.
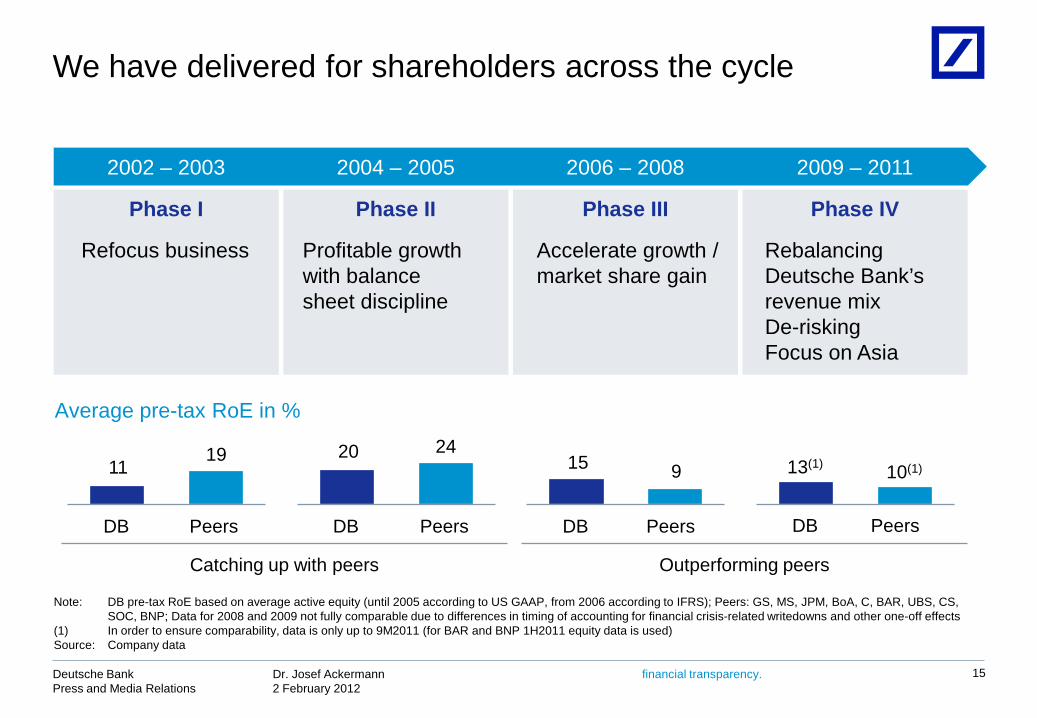
We have delivered for shareholders across the cycle
15
Note: DB pre-tax RoE based on average active equity (until 2005 according to US GAAP, from 2006 according to IFRS); Peers: GS, MS, JPM, BoA, C, BAR, UBS, CS, SOC, BNP; Data for 2008 and 2009 not fully comparable due to differences in timing of accounting for financial crisis-related writedowns and other one-off effects
(1) In order to ensure comparability, data is only up to 9M2011 (for BAR and BNP 1H2011 equity data is used) Source: Company data
Phase I Phase II Phase III Phase IV
Refocus business Profitable growth with balance sheet discipline
Accelerate growth / market share gain
2002 – 2003 2004 – 2005 2006 – 2008 2009 – 2011
Rebalancing Deutsche Bank’s revenue mixDe-riskingFocus on Asia
Average pre-tax RoE in %
Catching up with peers Outperforming peers
1119
PeersDB
20 24
PeersDB
15 9
PeersDB
10(1)
DB Peers
13(1)
Dr. Josef Ackermann 2 February 2012
Deutsche BankPress and Media Relations
financial transparency.
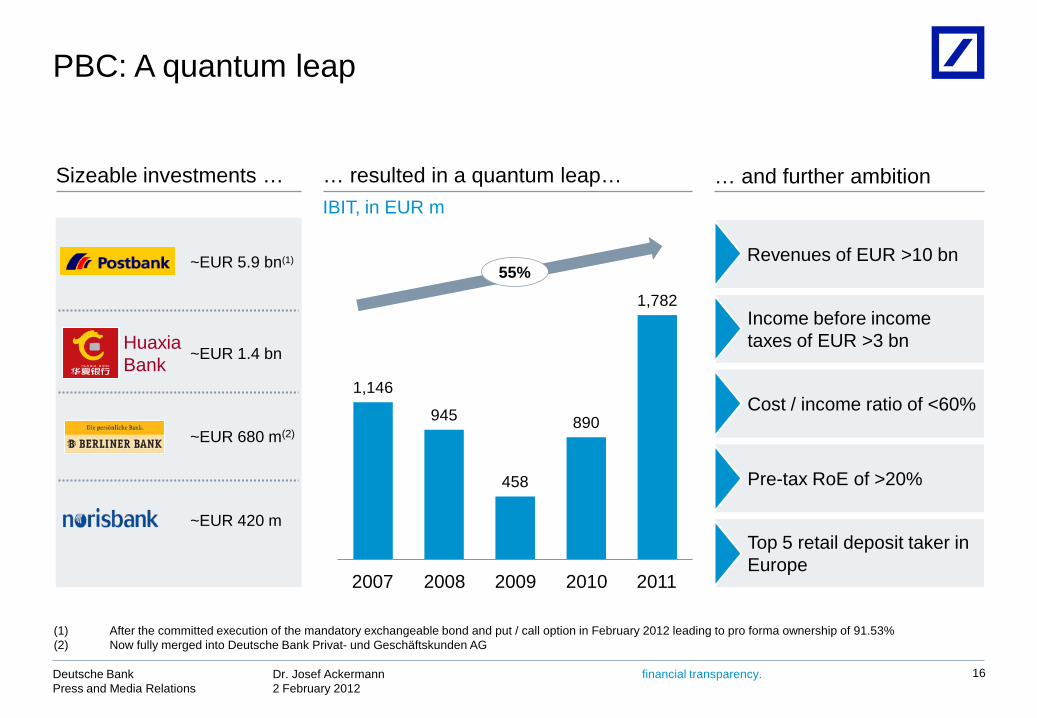
PBC: A quantum leap
16
~EUR 1.4 bn
Sizeable investments … … resulted in a quantum leap… … and further ambition
HuaxiaBank
Revenues of EUR >10 bn
Income before income taxes of EUR >3 bn
Cost / income ratio of <60%
Pre-tax RoE of >20%
Top 5 retail deposit taker in Europe
IBIT, in EUR m
~EUR 5.9 bn(1)
~EUR 420 m
~EUR 680 m(2)
55%
2007 2008 2009 2010 2011
1,146
945
458
890
1,782
(1) After the committed execution of the mandatory exchangeable bond and put / call option in February 2012 leading to pro forma ownership of 91.53%(2) Now fully merged into Deutsche Bank Privat- und Geschäftskunden AG
Dr. Josef Ackermann 2 February 2012
Deutsche BankPress and Media Relations
financial transparency.
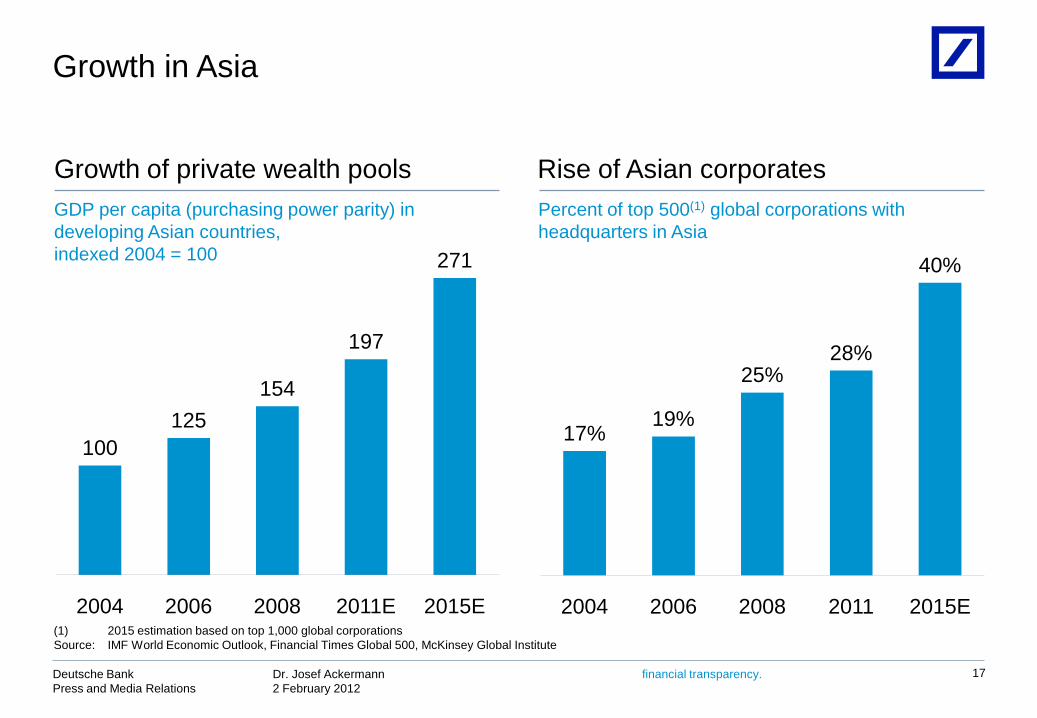
Growth in Asia
17
GDP per capita (purchasing power parity) in developing Asian countries, indexed 2004 = 100
Rise of Asian corporates Growth of private wealth poolsPercent of top 500(1) global corporations with headquarters in Asia
100125
154
197
271
2004 2006 2008 2011E 2015E
17%19%
25%28%
40%
2004 2006 2008 2011 2015E(1) 2015 estimation based on top 1,000 global corporationsSource: IMF World Economic Outlook, Financial Times Global 500, McKinsey Global Institute
Dr. Josef Ackermann 2 February 2012
Deutsche BankPress and Media Relations
financial transparency.
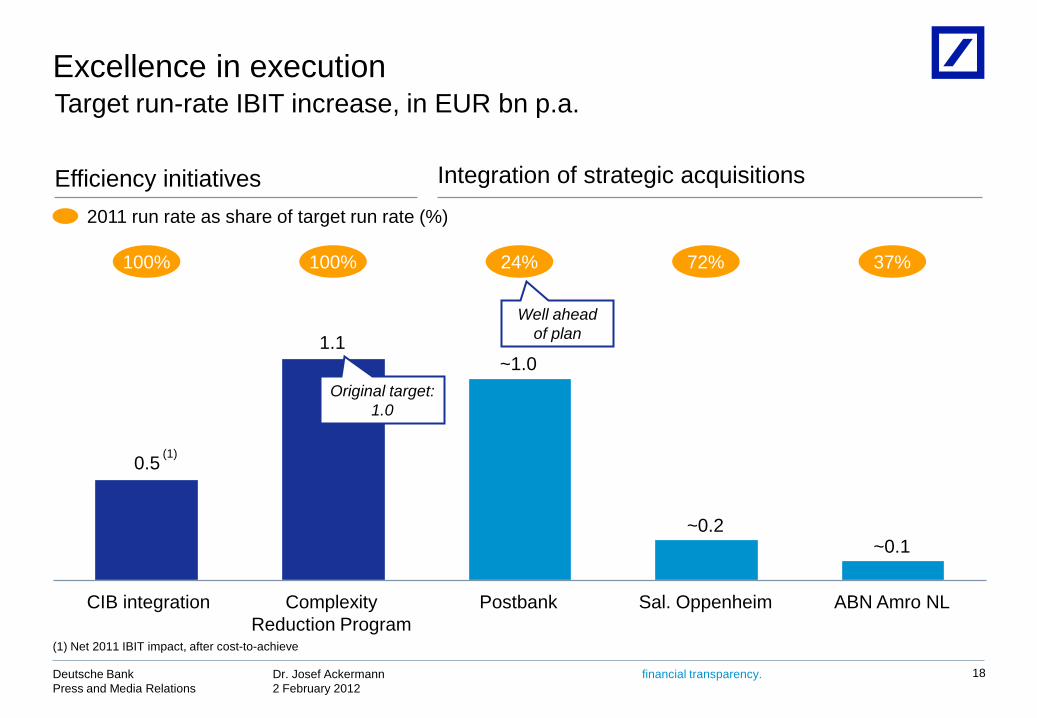
Excellence in execution
18
0.5
1.1
CIB integration Sal. OppenheimPostbank
~1.0
Complexity Reduction Program
~0.2
ABN Amro NL
~0.1
2011 run rate as share of target run rate (%)
100% 100% 24% 72% 37%
Original target:1.0
Integration of strategic acquisitionsEfficiency initiatives
(1) Net 2011 IBIT impact, after cost-to-achieve
(1)
Well aheadof plan
Target run-rate IBIT increase, in EUR bn p.a.
Dr. Josef Ackermann 2 February 2012
Deutsche BankPress and Media Relations
financial transparency.
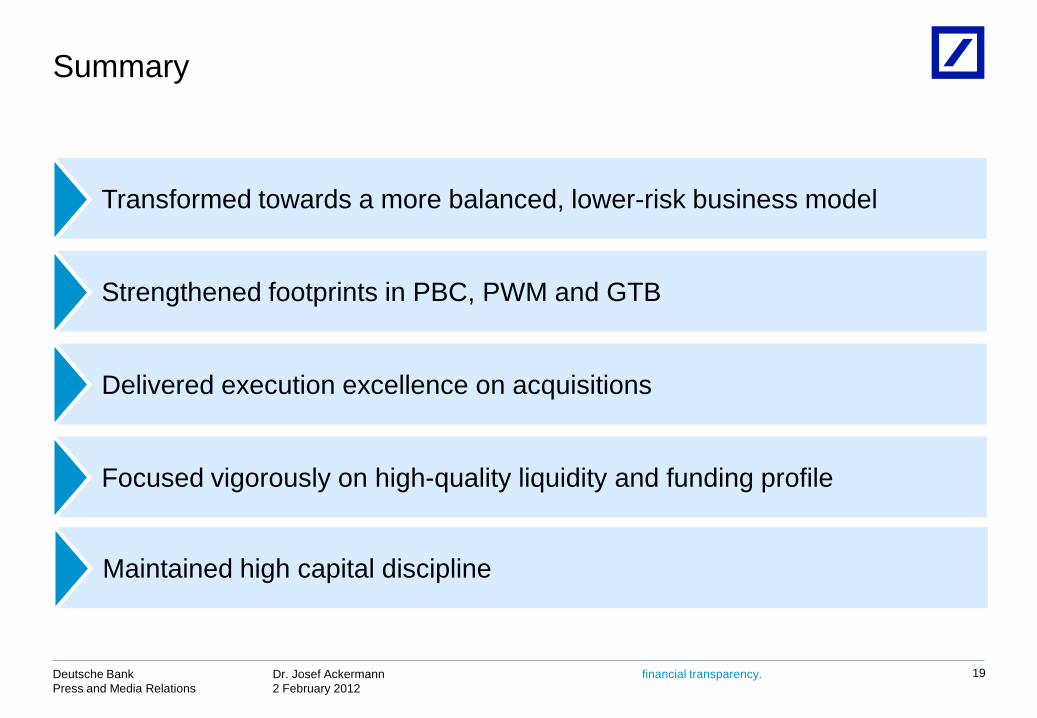
Summary
19
Transformed towards a more balanced, lower-risk business model
Strengthened footprints in PBC, PWM and GTB
Delivered execution excellence on acquisitions
Focused vigorously on high-quality liquidity and funding profile
Maintained high capital discipline
Dr. Josef Ackermann 2 February 2012
Deutsche BankPress and Media Relations
financial transparency.
This presentation contains forward-looking statements. Forward-looking statements are statements that are not historicalfacts; they include statements about our beliefs and expectations and the assumptions underlying them. Thesestatements are based on plans, estimates and projections as they are currently available to the management ofDeutsche Bank. Forward-looking statements therefore speak only as of the date they are made, and we undertake noobligation to update publicly any of them in light of new information or future events.
By their very nature, forward-looking statements involve risks and uncertainties. A number of important factors couldtherefore cause actual results to differ materially from those contained in any forward-looking statement. Such factorsinclude the conditions in the financial markets in Germany, in Europe, in the United States and elsewhere from which wederive a substantial portion of our revenues and in which we hold a substantial portion of our assets, the development ofasset prices and market volatility, potential defaults of borrowers or trading counterparties, the implementation of ourstrategic initiatives, the reliability of our risk management policies, procedures and methods, and other risks referenced inour filings with the U.S. Securities and Exchange Commission. Such factors are described in detail in our SEC Form20-F of 15 March 2011 under the heading “Risk Factors.” Copies of this document are readily available upon request orcan be downloaded from www.deutsche-bank.com/ir.
This presentation also contains non-IFRS financial measures. For a reconciliation to directly comparable figures reportedunder IFRS, to the extent such reconciliation is not provided in this presentation, refer to the 4Q2011 Financial DataSupplement, which is accompanying this presentation and available at www.deutsche-bank.com/ir.
Cautionary statements
20