deuterostome phylogeny and the sister group of the ... · deuterostome phylogeny and the sister...
TRANSCRIPT
Deuterostome Phylogeny and the Sister Group of the Chordates: Evidence from Molecules and Morphology
J. McClintock Turbeville, Joseph R. Schulz, 1 and RudoljA. Raff Department of Biology and Institute for Molecular and Cellular Biology, Indiana University
Complete coding regions of the 18s rRNA gene of an enteropneust hemichordate and an echinoid and ophiuroid echinoderm were obtained and aligned with 18s rRNA gene sequences of all major chordate clades and four outgroups. Gene sequences were analyzed to test morphological character phylogenies and to assess the strength of the signal. Maximum-parsimony analysis of the sequences fails to support a monophyletic Chordata; the uro- chordates form the sister taxon to the hemichordates, and together this clade plus the echinoderms forms the sister taxon to the cephalochordates plus craniates. Decay, bootstrap, and tree-length distribution analyses suggest that the signal for inference of deuterostome phylogeny is weak in this molecule. Parsimony analysis of morphological plus molecular characters supports both monophyly of echinoderms plus enteropneust hemichordates and a sister group relationship of this clade to chordates. Evolutionary parsimony does not support chordate monophyly. Neighbor-joining, Fitch-Margoliash, and maximum-likelihood analyses support a chordate lineage that is the sister group to an echinoderm-plus-hemichordate lineage. The results illustrate both the limitations of the 18s rRNA molecule alone for high-level phylogeny inference and the importance of considering both molecular and mor- phological data in phylogeny reconstruction.
Introduction
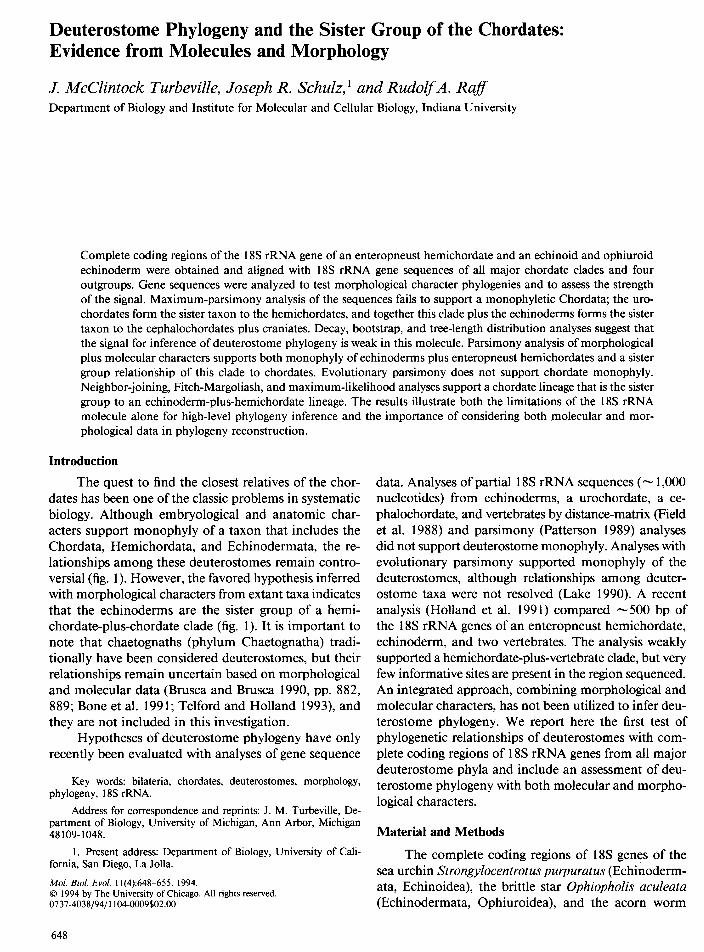
The quest to find the closest relatives of the chor- dates has been one of the classic problems in systematic biology. Although embryological and anatomic char- acters support monophyly of a taxon that includes the Chordata, Hemichordata, and Echinodermata, the re- lationships among these deuterostomes remain contro- versial (fig. 1). However, the favored hypothesis inferred with morphological characters from extant taxa indicates that the echinoderms are the sister group of a hemi- chordate-plus-chordate clade (fig. 1). It is important to note that chaetognaths (phylum Chaetognatha) tradi- tionally have been considered deuterostomes, but their relationships remain uncertain based on morphological and molecular data (Brusca and Brusca 1990, pp. 882, 889; Bone et al. 199 1; Telford and Holland 1993), and they are not included in this investigation.
Hypotheses of deuterostome phylogeny have only recently been evaluated with analyses of gene sequence
Key words: bilateria, chordates, deuterostomes, morphology, phylogeny, 18s rRNA.
Address for correspondence and reprints: J. M. Turbeville, De- partment of Biology, University of Michigan, Ann Arbor, Michigan 48109-1048.
1. Present address: Department of Biology, University of Cali- fornia, San Diego, La Jolla.
Mol. Bid. Evol. 11(4):648-655. 1994. 0 1994 by The University of Chicago. All rights reserved. 0737-4038/94/l lOS-0009$02.00
648
data. Analyses of partial 18s rRNA sequences (- 1,000 nucleotides) from echinoderms, a urochordate, a ce- phalochordate, and vertebrates by distance-matrix (Field et al. 1988) and parsimony (Patterson 1989) analyses did not support deuterostome monophyly. Analyses with evolutionary parsimony supported monophyly of the deuterostomes, although relationships among deuter- ostome taxa were not resolved (Lake 1990). A recent analysis (Holland et al. 199 1) compared -500 bp of the 18s rRNA genes of an enteropneust hemichordate, echinoderm, and two vertebrates. The analysis weakly supported a hemichordate-plus-vertebrate clade, but very few informative sites are present in the region sequenced. An integrated approach, combining morphological and molecular characters, has not been utilized to infer deu- terostome phylogeny. We report here the first test of phylogenetic relationships of deuterostomes with com- plete coding regions of 18s rRNA genes from all major deuterostome phyla and include an assessment of deu- terostome phylogeny with both molecular and morpho- logical characters.
Material and Methods
The complete coding regions of 18s genes of the sea urchin S’trongylocentrotus purpuratus (Echinoderm- ata, Echinoidea), the brittle star Ophiopholis aculeata (Echinodermata, Ophiuroidea), and the acorn worm
Deuterostome Phylogeny 649
ECHINODERMATA
HEMICHORDATA
FIG. 1 .-Hypotheses of deuterostome relationships. A, Traditional hypothesis. The Echinodermata is the sister taxon of a hemichordate- plus-chordate clade (Maisey 1986; Schaeffer 1987). B, Hypothesis indicating monophyly of Hemichordata plus Echinodermata (see Grobben 1908; Schaeffer 1987, p. 190). C, Phylogeny indicating that the Echinodermata is the sister group of the Chordata (Jefferies 1986, p. 323). This phylogeny is dependent on the hypothesis that the extinct Stylophorans are not echinoderms but possess features of echinoderms and chordates. The systematic position of these fossils continues to be disputed (Jollie 1982; Jefferies 1986, pp. 345-358; Parsley 1988). Common to all hypotheses is chordate monophyly. Deuterostome morphological synapomorphies (among others) are as follows: anus forms near site of blastopore, and mouth forms secondarily elsewhere (Ax 1989; Schaeffer 1987); and protocoel pore(s) (Balser and Ruppert 1990). Only characters from extant taxa relevant to the conflicts are plotted and, except where indicated, are from Maisey (1986) and Schaeffer (1987). 1 = Axial complex (heart/glomerulus in hemichordates; Ruppert and Balser 1986; Balser and Ruppert 1990); 2 = gill clefts; 3 = dorsal hollow nerve cord with neuropore (Bateson 1884); 4 = neurenteric canal (Siewing 1969, p. 189; Schaeffer 1987); 5 = notochord (the hemichordate stomochord is commonly interpreted as a unique feature of the group, but homology of the stomochord and the chordate notochord is still disputed; see Balser and Ruppert 1990); 6 = postanal somatic tail; 7 = endostyle; 8 = vertebrate-like actins (Vandekerckhove and Weber 1984; Kovilur et al. 1993); 9 = equivalence of fate maps; IO = somites; and 11 = differentiation of neural tube into ependymal and synaptic layers. For additional synapomoprhies of the cephalochordates plus craniates and for craniate synapomorphies, see (Maisey 1986; Schaeffer 1987). Homology of the neural gland to Hatschek’s pit and craniate adenohypophysis is doubtful (Ruppert 1990) and was excluded. For disputed fossil characters defining nodes marked by an asterisk (*) in phylogeny C, see the work of Jefferies (1986, p. 323). A comprehensive comparison of phylogeny C would require inclusion of fossil characters and taxa; however, although critical reevaluation of the conflicting interpretation of the fossil characters is prerequisite and necessary, it is beyond the scope of this contribution. Blackened blocks represent characters defining the branch; and unblackened blocks represent hypothesized losses. Outgroups are not shown. For recent alternatives that include taxa for which sequences are not yet available, see the work of Brusca and Brusca (1990, pp. 872-873) and Schram (1 991).
Saccoglossus kowalevskii (Hemichordata, Enterop- neusta) were amplified by the polymerase chain reaction (PCR) from genomic DNA templates with eukaryotic- specific 18s primers (2-22 forward, S-ACCTGGTTG- ATCCTGCCA-3’, 1865- 1847 reverse, S-TGATCCA- TCTGCAGGTTC-3’; adapted from Medlin et al. 1988). The amplified genes were ligated into a T/A vector (In- vitrogen) prior to sequencing both coding and noncoding strands. Direct sequencing of asymmetrically amplified PCR product was initially attempted for S. purpuratus, but sequencing the cloned gene was more consistent. In addition to the M 13 plasmid primers, five forward and six reverse internal primers were used,.whose sequences are as follows (numbers correspond to positions on the human sequence): 430-447, S-CGGAGARGGAGCC- TGAGA-3’; 6 1 1-626,5’-GTGCCAGCMGCCGCGG-3’; 1024-1038, 5’-ATCAAGAACGAAAGT-3’; 1324-1338, 5’-GGTGGTGCATGGCCG-3’; 1488- 1503, 5’-CAGG- TCTGTGATGCYC-3’; 445-429, 5’-TCAGGCTCCCT- CTCCGG-3’; 632-6 15, 5’-GWATTACCGCGCGGC- KGCTG-3’; 880-865, 5’-CCGAGGTCCTATTCCA-3’; 120 1- 1187, 5’-ATTCCTTTRAGTTTC-3’; 1503- 1488, 5’-GGGCATCACAGACCTG-3’; and 1708- 1692, 5’- ACGGGCGGTGTGTRC-3’.
Sequences were aligned using the SeqApp manual aligner for Macintosh (D. Gilbert, Indiana University). Alignments were refined, where possible, by using a sec- ondary-structure model of Xenopus laevis (Atmadja et al. 1984). Analyses were limited to “reliably” aligned regions (Turbeville et al. 1992; m-65%-70% similarity and greater; see Hillis and Dixon 199 1). Data were an- alyzed using the maximum-parsimony program of PAUP 3.0s and 3.1.1 (D. Swofford, Smithsonian Insti- tution), the DNADIST, FITCH, DNAML, and NEIGHBOR programs of Phylip 3.4 and 3.5~ (J. Fel- senstein, University of Washington), and the evolution- ary-parsimony program (Lake 1987) as implemented in the PAUP package. Analyses with evolutionary parsi- mony were carried out as described by Turbeville et al. ( 199 1, 1992). For parsimony analyses, the HEURISTIC search was used with random stepwise addition. Gaps were treated as missing data in all analyses. The Kimura correction to estimated distances was employed in dis- tance analyses. One hundred bootstrap replicates were performed for maximum-likelihood analysis, and 500 were run for all other analyses. The tree-length distri- bution test was carried as described by Hillis and Huel- senbeck ( 1992).
650 Turbeville et al.
Results
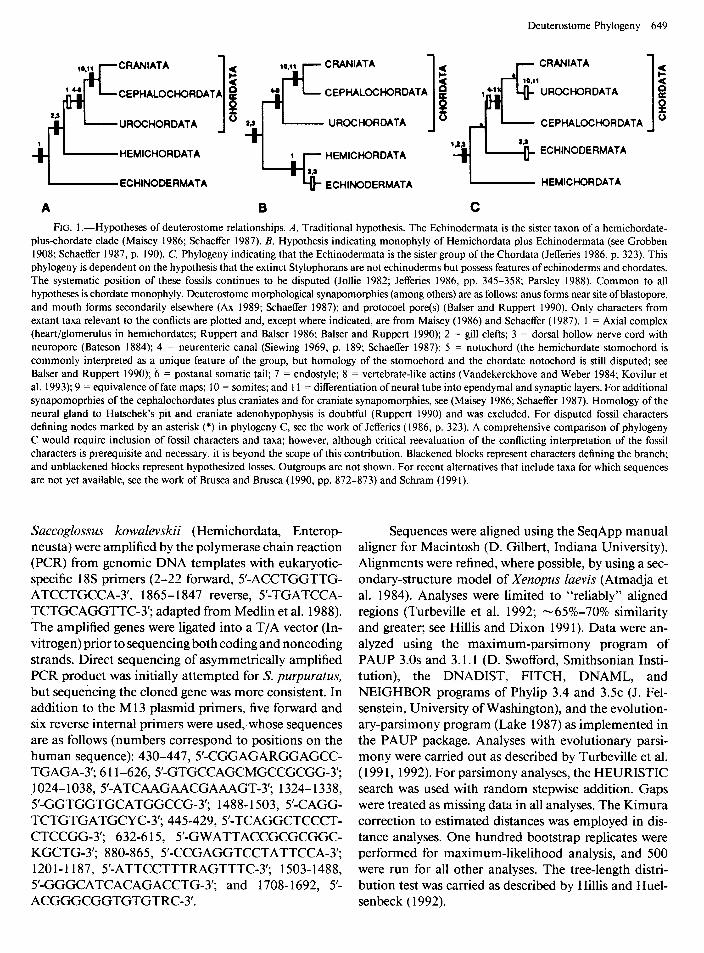
Maximum parsimony (MP) analyses of 18s se- quences alone do not support monophyly of the Chor- data, a result that is at variance with strong morpholog- ical evidence (fig. 1). The urochordates form the sister taxon to the hemichordate, and together this clade plus the echinoderms form the sister taxon to the cephalo- chordates plus craniates (fig. 2A). Support is weak for this arrangement, as indicated by bootstrap percentages and decay values (fig. 2A). The poorly supported arti- factual placement of the long-branched urochordates may be the result of their sequences converging with the most divergent nonchordate deuterostome, the enter- opneust hemichordate Saccoglossus. Chordata was monophyletic in only 16% of 500 bootstrap replicates. A monophyletic Chordata is found as three of nine equally parsimonious trees that require four additional substitutions. Two correspond to morphological phy- logeny B (fig. 1). Morphological hypotheses A and C (fig. 1) are among 45 equally parsimonious trees saved at 11 extra substitutions. Evaluation of 100 trees saved that are within 1% of the length of the shortest tree suggests further that signal for reliable phylogeny inference among the major deuterostome taxa is weak in this mol- ecule (fig. 2B).
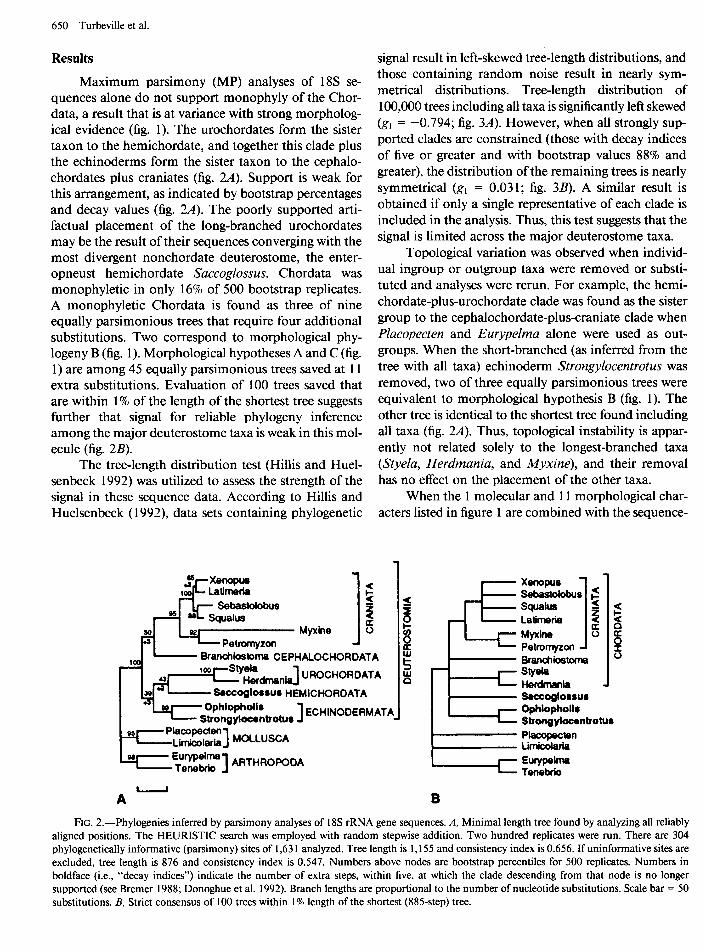
The tree-length distribution test (Hillis and Huel- senbeck 1992) was utilized to assess the strength of the signal in these sequence data. According to Hillis and Huelsenbeck ( 1992), data sets containing phylogenetic
signal result in left-skewed tree-length distributions, and those containing random noise result in nearly sym- metrical distributions. Tree-length distribution of 100,000 trees including all taxa is significantly left skewed (gl = -0.794; fig. 3A). However, when all strongly sup- ported clades are constrained (those with decay indices of five or greater and with bootstrap values 88% and greater), the distribution of the remaining trees is nearly symmetrical (gl = 0.031; fig. 3B). A similar result is obtained if only a single representative of each clade is included in the analysis. Thus, this test suggests that the signal is limited across the major deuterostome taxa.
Topological variation was observed when individ- ual ingroup or outgroup taxa were removed or substi- tuted and analyses were rerun. For example, the hemi- chordate-plus-urochordate clade was found as the sister group to the cephalochordate-plus-craniate clade when Placopecten and Eurypelma alone were used as out- groups. When the short-branched (as inferred from the tree with all taxa) echinoderm Strongylocentrotus was removed, two of three equally parsimonious trees were equivalent to morphological hypothesis B (fig. 1). The other tree is identical to the shortest tree found including all taxa (fig. 2A). Thus, topological instability is appar- ently not related solely to the longest-branched taxa (Styela, Herdmania, and Myxine), and their removal has no effect on the placement of the other taxa.
When the 1 molecular and 11 morphological char- acters listed in figure 1 are combined with the sequence-
. Bmnchioskma CEPHALOCHORDATA
9
XWlOpJS sebastolobus 2 SqUallJS 1 3 G Lathha a
Myhe 0 2 Petromyzon 8 Brandliostofna 0 Stvh Hwdman& 4 S8ccoglossu8 Ophlophollr Stmngylocontrotus Placopecten Limicolaria
FIG. 2.-Phylogenies inferred by parsimony analyses of 18s rRNA gene sequences. A, Minimal length tree found by analyzing all reliably aligned positions. The HEURISTIC search was employed with random stepwise addition. Two hundred replicates were run. There are 304 phylogenetically informative (parsimony) sites of 1,63 1 analyzed. Tree length is 1,155 and consistency index is 0.656. If uninformative sites are excluded, tree length is 876 and consistency index is 0.547. Numbers above nodes are bootstrap percentiles for 500 replicates. Numbers in boldface (i.e., “decay indices”) indicate the number of extra steps, within five, at which the clade descending from that node is no longer supported (see Bremer 1988; Donoghue et al. 1992). Branch lengths are proportional to the number of nucleotide substitutions. Scale bar = 50 substitutions. B, Strict consensus of 100 trees within 1% length of the shortest (885~step) tree.
Deuterostome Phylogeny 65 1
Tree lengths
FIG. 3.-Tree-length distributions. A, Distribution of a random sample of 100,000 trees including all taxa. B, Distribution of the re- maining 3 15 trees when all clades with decay indices >5 or bootstrap values >88% are removed with the constraint option of PAUP 3.1.1. The EXHAUSTIVE search was employed.
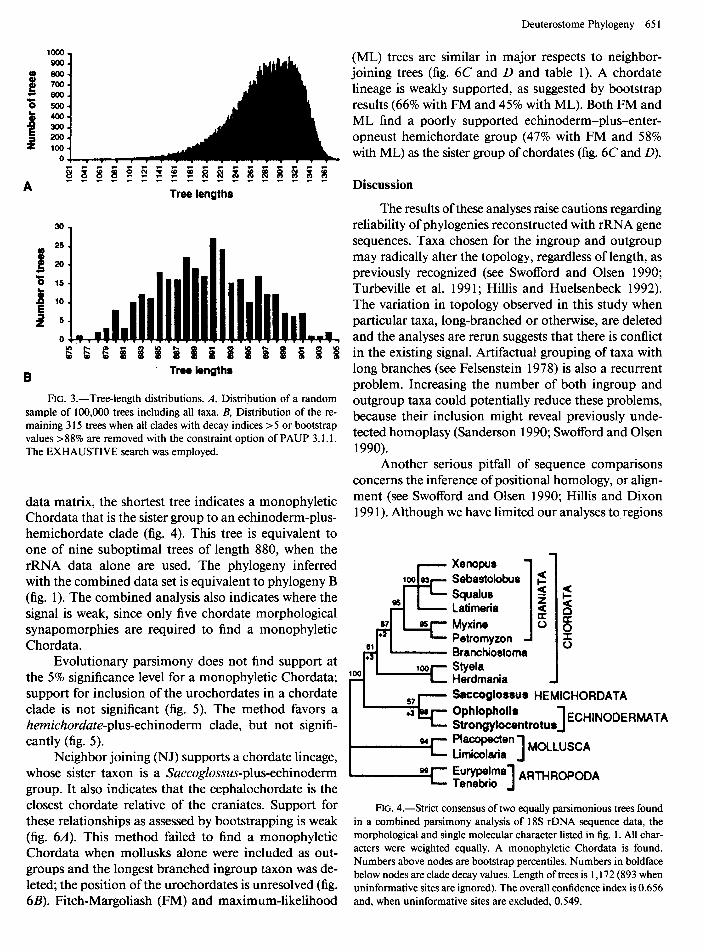
data matrix, the shortest tree indicates a monophyletic Chordata that is the sister group to an echinoderm-plus- hemichordate clade (fig. 4). This tree is equivalent to one of nine suboptimal trees of length 880, when the rRNA data alone are used. The phylogeny inferred with the combined data set is equivalent to phylogeny B (fig. 1). The combined analysis also indicates where the signal is weak, since only five chordate morphological synapomorphies are required to find a monophyletic Chordata.
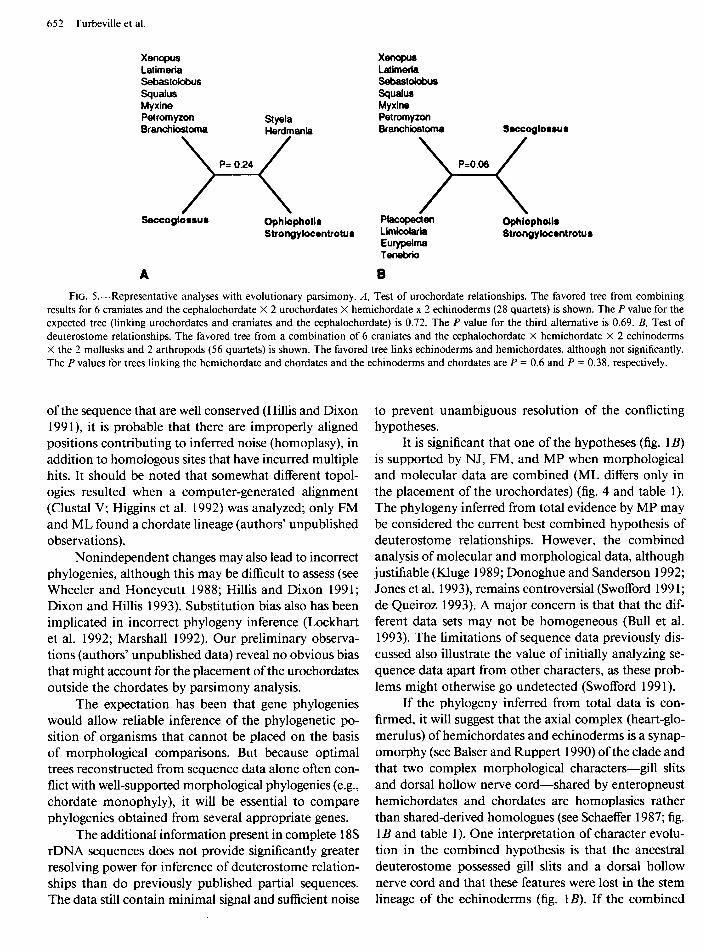
Evolutionary parsimony does not find support at the 5% significance level for a monophyletic Chordata; support for inclusion of the urochordates in a chordate clade is not significant (fig. 5). The method favors a hemichordate-plus-echinoderm clade, .but not signifi- cantly (fig. 5).
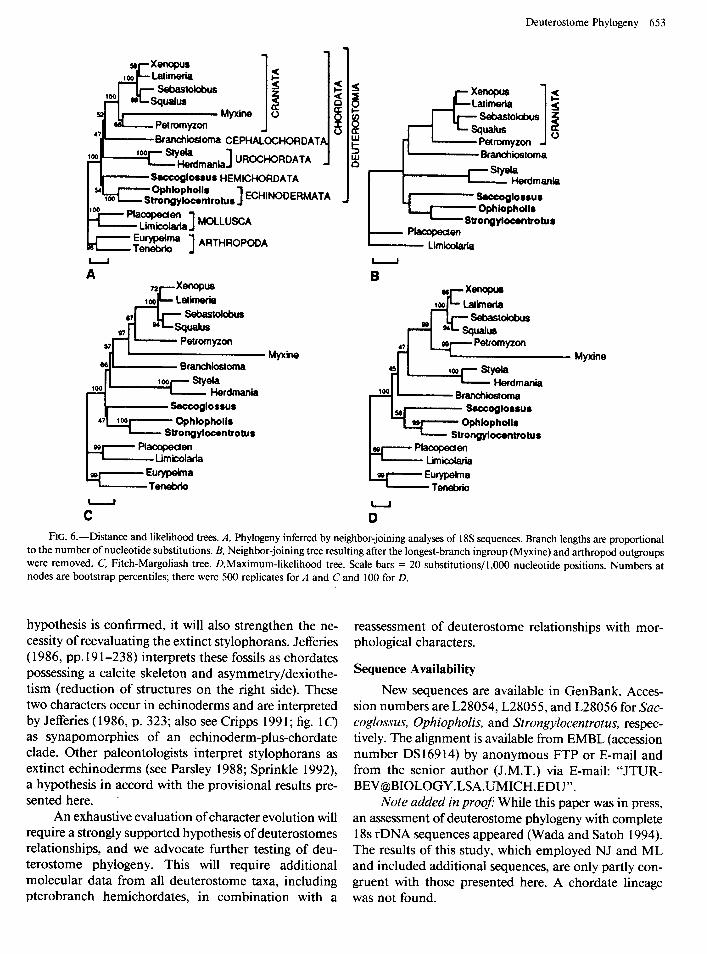
Neighbor joining (NJ) supports a chordate lineage, whose sister taxon is a Saccoglossus-plus-echinoderm group. It also indicates that the cephalochordate is the closest chordate relative of the craniates. Support for these relationships as assessed by bootstrapping is weak (fig. 6A). This method failed to find a monophyletic Chordata when mollusks alone were included as out- groups and the longest branched ingroup taxon was de- leted; the position of the urochordates is unresolved (fig. 6B). Fitch-Margoliash (FM) and maximum-likelihood
(ML) trees are similar in major respects to neighbor- joining trees (fig. 6C and D and table 1). A chordate lineage is weakly supported, as suggested by bootstrap results (66% with FM and 45% with ML). Both FM and ML find a poorly supported echinoderm-plus-enter- opneust hemichordate group (47% with FM and 58% with ML) as the sister group of chordates (fig. 6C and D).
Discussion
The results of these analyses raise cautions regarding reliability of phylogenies reconstructed with rRNA gene sequences. Taxa chosen for the ingroup and outgroup may radically alter the topology, regardless of length, as previously recognized (see Swofford and Olsen 1990; Turbeville et al. 199 1; Hillis and Huelsenbeck 1992). The variation in topology observed in this study when particular taxa, long-branched or otherwise, are deleted and the analyses are rerun suggests that there is conflict in the existing signal. Artifactual grouping of taxa with long branches (see Felsenstein 1978) is also a recurrent problem. Increasing the number of both ingroup and outgroup taxa could potentially reduce these problems, because their inclusion might reveal previously unde- tected homoplasy (Sanderson 1990; Swofford and Olsen 1990).
Another serious pitfall of sequence comparisons concerns the inference of positional homology, or align- ment (see Swofford and Olsen 1990; Hillis and Dixon 199 1). Although we have limited our analyses to,regions
Branchiostoma
S=Wllo-u~ HEMICHORDATA Ophlopholls Strongylocentrotu8 1 ECHINODERMATA
;;;?$@?I” MOLLUSCA 1 E”~~‘ma ARTHROPODA Ten&ii 1
FIG. 4.-Strict consensus of two equally parsimonious trees found in a combined parsimony analysis of 18s rDNA sequence data, the morphological and single molecular character listed in fig. 1. All char- acters were weighted equally. A monophyletic Chordata is found. Numbers above nodes are bootstrap percentiles. Numbers in boldface below nodes are clade decay values. Length of trees is 1,172 (893 when uninformative sites are ignored). The overall confidence index is 0.656 and. when uninformative sites are excluded. 0.549. I
652 Turbeville et al.
Xenopus X- Latimeria Latimeda sebastolobus sebastolokrs squaius tiww Myxine Myxine Petromyzon Sty& PelKMnyron BraflChiO6t~ Herdmania Branch&stoma Saccoglor8ur
)pz0.*4( >-- (
Saccoglorsur Ophiopholla Strongybcontrotur
PLacoQedm LimkAaria EUrypelM
Tenekio
Ophlophdis Strongyiocontrotur
A B
FIG. 5.-Representative analyses with evolutionary parsimony. A, Test of urochordate relationships. The favored tree from combining results for 6 craniates and the cephalochordate X 2 urochordates X hemichordate x 2 echinoderms (28 quartets) is shown. The P value for the expected tree (linking urochordates and craniates and the cephalochordate) is 0.72. The P value for the third alternative is 0.69. B, Test of deuterostome relationships. The favored tree from a combination of 6 craniates and the cephalochordate X hemichordate X 2 echinoderms X the 2 mollusks and 2 arthropods (56 quartets) is shown. The favored tree links echinoderms and hemichordates, although not significantly. The P values for trees linking the hemichordate and chordates and the echinoderms and chordates are P = 0.6 and P = 0.38, respectively.
of the sequence that are well conserved (Hillis and Dixon 199 1 ), it is probable that there are improperly aligned positions contributing to inferred noise (homoplasy), in addition to homologous sites that have incurred multiple hits. It should be noted that somewhat different topol- ogies resulted when a computer-generated alignment (Clustal V; Higgins et al. 1992) was analyzed; only FM and ML found a chordate lineage (authors’ unpublished observations).
Nonindependent changes may also lead to incorrect phylogenies, although this may be difficult to assess (see Wheeler and Honeycutt 1988; Hillis and Dixon 199 1; Dixon and Hillis 1993). Substitution bias also has been implicated in incorrect phylogeny inference (Lockhart et al. 1992; Marshall 1992). Our preliminary observa- tions (authors’ unpublished data) reveal no obvious bias that might account for the placement of the urochordates outside the chordates by parsimony analysis.
The expectation has been that gene phylogenies would allow reliable inference of the phylogenetic po- sition of organisms that cannot be placed on the basis of morphological comparisons. But because optimal trees reconstructed from sequence data alone often con- flict with well-supported morphological phylogenies (e.g., chordate monophyly), it will be essential to compare phylogenies obtained from several appropriate genes.
The additional information present in complete 18s rDNA sequences does not provide significantly greater resolving power for inference of deuterostome relation- ships than do previously published partial sequences. The data still contain minimal signal and sufficient noise
to prevent unambiguous resolution of the conflicting hypotheses.
It is significant that one of the hypotheses (fig. 1B) is supported by NJ, FM, and MP when morphological and molecular data are combined (ML differs only in the placement of the urochordates) (fig. 4 and table 1). The phylogeny inferred from total evidence by MP may be considered the current best combined hypothesis of deuterostome relationships. However, the combined analysis of molecular and morphological data, although justifiable (IUuge 1989; Donoghue and Sanderson 1992; Jones et al. 1993), remains controversial (Swofford 199 1; de Queiroz 1993). A major concern is that that the dif- ferent data sets may not be homogeneous (Bull et al. 1993). The limitations of sequence data previously dis- cussed also illustrate the value of initially analyzing se- quence data apart from other characters, as these prob- lems might otherwise go undetected (Swofford 199 1).
If the phylogeny inferred from total data is con- firmed, it will suggest that the axial complex (heart-glo- merulus) of hemichordates and echinoderms is a synap- omorphy (see Balser and Ruppert 1990) of the clade and that two complex morphological characters-gill slits and dorsal hollow nerve cord-shared by enteropneust hemichordates and chordates are homoplasies rather than shared-derived homologues (see Schaeffer 1987; fig. 1B and table 1). One interpretation of character evolu- tion in the combined hypothesis is that the ancestral deuterostome possessed gill slits and a dorsal hollow nerve cord and that these features were lost in the stem lineage of the echinoderms (fig. 1B). If the combined
Deuterostome Phylogeny 653
c 1 5 5
f Petru4nyzorl
0
UROCHORDATA _ Branchiostoma - ,_j-sstyela
Herdmania
Saazoglossus Ophlophotls
Strongyloconbotus P-m
ARTHROPODA Limicdaria 1 1
A B Y
100
pJfw- _ bhwia
- Gqal~ 98 sebastolobus
07 - 57 PWOmyZOfl 47
Myxine 66. Bmnchiostoma
Myxine 4!3 100 f-SW
Herdmania loo Branchiioma
Strongylocwtrotus
1 4
C D FIG. B.-Distance and likelihood trees. A, Phylogeny inferred by neighbor-joining analyses of 18s sequences. Branch lengths are proportional
to the number of nucleotide substitutions. B, Neighbor-joining tree resulting after the longest-branch ingroup (Myxine) and arthropod outgroups were removed. C, Fitch-Margoliash tree. D,Maximum-likelihood tree. Scale bars = 20 substitutions/l,000 nucleotide positions. Numbers at nodes are bootstrap percentiles; there were 500 replicates for A and C and 100 for D.
hypothesis is confirmed, it will also strengthen the ne- cessity of reevaluating the extinct stylophorans. Jefferies (1986, pp. 19 l-238) interprets these fossils as chordates possessing a calcite skeleton and asymmetry/dexiothe- tism (reduction of structures on the right side). These two characters occur in echinoderms and are interpreted by Jefferies ( 1986, p. 323; also see Cripps 199 1; fig. 1 C) as synapomorphies of an echinoderm-plus-chordate clade. Other paleontologists interpret stylophorans as extinct echinoderms (see Parsley 1988; Sprinkle 1992), a hypothesis in accord with the provisional results pre- sented here.
An exhaustive evaluation of character evolution will require a strongly supported hypothesis of deuterostomes relationships, and we advocate further testing of deu- terostome phylogeny. This will require additional molecular data from all deuterostome taxa, including pterobranch hemichordates, in combination with a
reassessment of deuterostome relationships with mor- phological characters.
Sequence Availability
New sequences are available in GenBank. Acces- sion numbers are L28054, L28055, and L28056 for Sac- coglossus, Ophiopholis, and Strongylocentrotus, respec- tively. The alignment is available from EMBL (accession number DS 169 14) by anonymous FTP or E-mail and from the senior author (J.M.T.) via E-mail: “JTUR- [email protected]”.
Note added in proof: While this paper was in press, an assessment of deuterostome phylogeny with complete 18s rDNA sequences appeared (Wada and Satoh 1994). The results of this study, which employed NJ and ML and included additional sequences, are only partly con- gruent with those presented here. A chordate lineage was not found.
654 Turbeville et al.
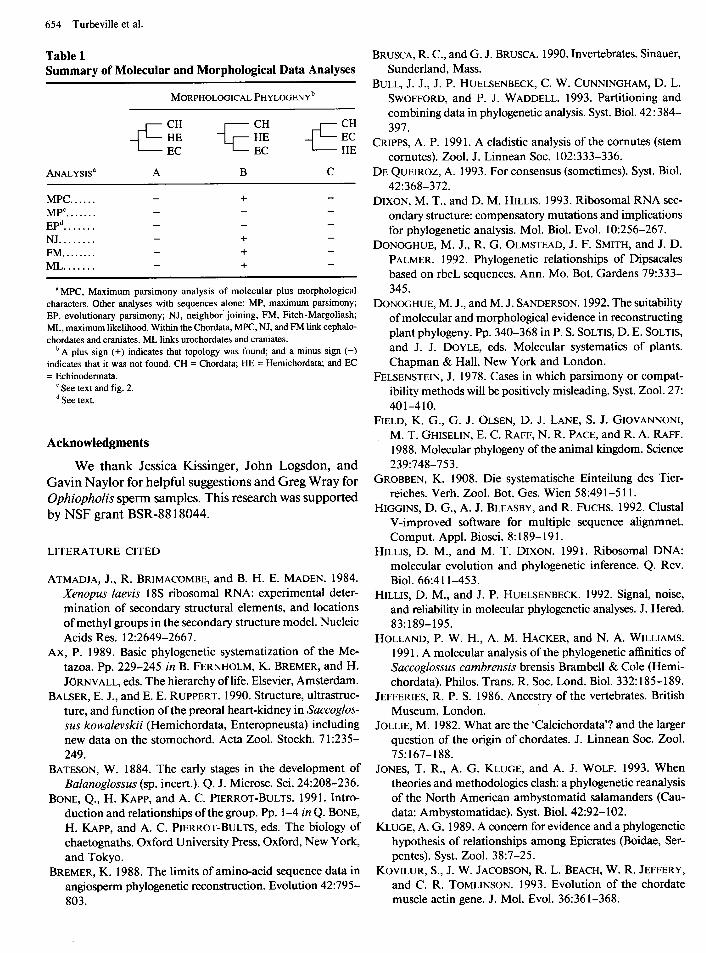
Table 1 Summary of Molecular and Morphological Data Analyses
MORPHOLOGICAL PHYLOGENY~
ANALYSIS~ A B C
MPC ...... MP”. ...... EPd. ...... NJ. ....... FM. ....... ML. ......
- + - - -
+ - - +
+ -
“MPC, Maximum parsimony analysis of molecular plus morphological characters. Other analyses with sequences alone: MP, maximum parsimony; EP, evolutionary parsimony; NJ, neighbor joining, FM, Fitch-Margoliash; ML, maximum likelihood. Within the Chordata, MPC, NJ, and FM link cephalo- chordates and craniates. ML links urochordates and craniates.
bA plus sign (+) indicates that topology was found; and a minus sign (-) indicates that it was not found. CH = Chordata; HE = Hemichordata; and EC = Echinodermata.
‘See text and fig. 2. d See text.
Acknowledgments
We thank Jessica Kissinger, John Logsdon, and Gavin Naylor for helpful suggestions and Greg Wray for Ophiopholis sperm samples. This research was supported by NSF grant BSR-88 18044.
LITERATURE CITED
ATMADJA, J., R. BRIMACOMBE, and B. H. E. MADEN. 1984. Xenupus luevis 18s ribosomal RNA: experimental deter- mination of secondary structural elements, and locations of methyl groups in the secondary structure model. Nucleic Acids Res. 12:2649-2667.
GROBBEN, K. 1908. Die systematische Einteilung des Tier- reiches. Verh. Zool. Bot. Ges. Wien 58:49 l-5 11.
HIGGINS, D. G., A. J. BLEASBY, and R. FIJCHS. 1992. Clustal V-improved software for multiple sequence alignmnet. Comput. Appl. Biosci. 8: 189- 19 1.
HILLIS, D. M., and M. T. DIXON. 199 1. Ribosomal DNA: molecular evolution and phylogenetic inference. Q. Rev. Biol. 66:4 1 l-453.
HILLIS, D. M., and J. P. HUELSENBECK. 1992. Signal, noise, and reliability in molecular phylogenetic analyses. J. Hered. 83:189-195.
AX, P. 1989. Basic phylogenetic systematization of the Me- tazoa. Pp. 229-245 in B. FERNHOLM, K. BREMER, and H. JORNVALL, eds. The hierarchy of life. Elsevier, Amsterdam.
BALSER, E. J., and E. E. RUPPERT. 1990. Structure, ultrastruc- ture, and function of the preoral heart-kidney in Succoglos- sus kowalevskii (Hemichordata, Enteropneusta) including new data on the stomochord. Acta Zool. Stockh. 71:235- 249.
HOLLAND, P. W. H., A. M. HACKER, and N. A. WILLIAMS. 199 1. A molecular analysis of the phylogenetic affinities of Succoglossus cumbrensis brensis Brambell & Cole (Hemi- chordata). Philos. Trans. R. Sot. Lond. Biol. 332: 185- 189.
JEFFERIES, R. P. S. 1986. Ancestry of the vertebrates. British Museum, London.
JOLLIE, M. 1982. What are the ‘Calcichordata’? and the larger question of the origin of chordates. J. Linnean Sot. Zool. 75:167-188.
BATESON, W. 1884. The early stages in the development of JONES, T. R., A. G. KLUGE, and A. J. WOLF. 1993. When Balanoglossus (sp. incert.). Q. J. Microsc. Sci. 24:208-236. theories and methodologies clash: a phylogenetic reanalysis
BONE, Q., H. KAPP, and A. C. PIERROT-BULTS. 199 1. Intro- of the North American ambystomatid salamanders (Cau- duction and relationships of the group. Pp. l-4 in Q. BONE, data: Ambystomatidae). Syst. Biol. 42:92- 102. H. KAPP, and A. C. PIERROT-BULTS, eds. The biology of KLUGE, A. G. 1989. A concern for evidence and a phylogenetic chaetognaths. Oxford University Press, Oxford, New York, hypothesis of relationships among Epicrates (Boidae, Ser- and Tokyo. pentes). Syst. Zool. 38:7-25.
BREMER, K. 1988. The limits of amino-acid sequence data in angiosperm phylogenetic reconstruction. Evolution 42:795- 803.
KOVILUR, S., J. W. JACOBSON, R. L. BEACH, W. R. JEFFERY, and C. R. TOMLINSON. 1993. Evolution of the chordate muscle actin gene. J. Mol. Evol. 36:361-368.
BRUSCA, R. C., and G. J. BRUSCA. 1990. Invertebrates. Sinauer, Sunderland, Mass.
BULL, J. J., J. P. HUELSENBECK, C. W. CUNNINGHAM, D. L. SWOFFORD, and P. J. WADDELL. 1993. Partitioning and combining data in phylogenetic analysis. Syst. Biol. 42 : 384- 397.
CRIPPS, A. P. 199 1. A cladistic analysis of the cornutes (stem cornutes). Zool. J. Linnean Sot. 102:333-336.
DE QUEIROZ, A. 1993. For consensus (sometimes). Syst. Biol. 42:368-372.
DIXON, M. T., and D. M. HILLIS. 1993. Ribosomal RNA sec- ondary structure: compensatory mutations and implications for phylogenetic analysis. Mol. Biol. Evol. 10:256-267.
DONOGHUE, M. J., R. G. OLMSTEAD, J. F. SMITH, and J. D. PALMER. 1992. Phylogenetic relationships of Dipsacales based on rbcL sequences. Ann. MO. Bot. Gardens 79:333- 345.
DONOGHUE, M. J., and M. J. SANDERSON. 1992. The suitability of molecular and morphological evidence in reconstructing plant phylogeny. Pp. 340-368 in P. S. SOLTIS, D. E. SOLTIS, and J. J. DOYLE, eds. Molecular systematics of plants. Chapman & Hall, New York and London.
FELSENSTEIN, J. 1978. Cases in which parsimony or compat- ibility methods will be positively misleading. Syst. Zool. 27: 401-410.
FIELD, K. G., G. J. OLSEN, D. J. LANE, S. J. GIOVANNONI, M. T. GHISELIN, E. C. RAFF, N. R. PACE, and R. A. RAFF. 1988. Molecular phylogeny of the animal kingdom. Science 239:748-753.

Deuterostome Phylogeny 655
LAKE, J. A. 1987. A rate-independent technique for analysis of nucleic acid sequences: evolutionary parsimony. Mol. Biol. Evol. 4: 167- 19 1.
- 1990. Origin of the Metazoa. Proc. Natl. Acad. Sci. . USA 87:763-766.
LOCKHART, P. J., C. J. HOWE, D. A. BRYANT, T. J. BEANLAND, and A. W. D. LARKUM. 1992. Substitutional bias confounds inference of cyanelle origins from sequence data. J. Mol. Evol. 34:153-162.
MAISEY, J. G. 1986. Heads and tails: a chordate phylogeny. Cladistics 2:201-256.
MARSHALL, C. R. 1992. Substitution bias, weighted parsimony, and amniote phylogeny as inferred from 18s rRNA se- quences. Mol. Biol. Evol. 9:370-373.
MEDLIN, L., H. J. ELWOOD, S. STICKEL, and M. L. SOGIN. 1988. The characterization of enzymatically amplified eu- karyotic 16S-like rRNA-coding regions. Gene 7 1:49 l-499.
PARSLEY, R. L. 1988. Feeding and respiratory strategies in Stylophora. Pp. 347-361 in C. R. C. PAUL and A. B. SMITH, eds. Echinoderm phylogeny and evolutionary biology. Clarendon, Oxford.
PATTERSON, C. 1989. Phylogenetic relations of major groups: conclusions and prospects. Pp. 47 l-488 in B. FERNHOLM, K. BREMER, and H. JORNVALL, eds. The hierarchy of life. Elsevier, Amsterdam.
RUPPERT, E. E. 1990. Structure, ultrastructure and function of the neural gland complex of Ascidia interrupta (Chordata, Ascidiacea): clarification of hypotheses regarding the evo- lution of the vertebrate anterior pituitary. Acta Zool. Stockh. 71:135-149.
RUPPERT, E. E., and E. J. BALSER. 1986. Nephridia in the larvae of hemichordates and echinoderms. Biol. Bull, 17 1: 188-196.
SANDERSON, M. J. 1990. Estimating rates of speciation and evolution: a bias due to homoplasy. Cladistics 6:387-391.
SCHAEFFER, B. 1987. Deuterostome monophyly and phylog- eny. Evol. Biol. 21: 179-235.
SCHRAM, F. R. 199 1. Cladistic analysis of metazoan phyla and the placement of fossil problematica. Pp. 35-46 in A. M. SIMONETTA and S. CONWAY MORRIS, eds. The early evo- lution of Metazoa and significance of problematic taxa. Cambridge University Press, Cambridge.
SIEWING, R. 1969. Lehrbuch der vergleichenden Entwick- lungsgeschichte der Tiere. Paul Parey, Hamburg.
SPRINKLE, J. 1992. Radiation of Echinodermata. Pp. 375-398 in J. H. LIPPS and P. W. SIGNOR, eds. Origin and early evolution of the Metazoa. Plenum, New York.
SWOFFORD, D. L. 199 1. When are phylogeny estimates from molecular and morphological data incongruent? Pp. 295- 333 in M. M. MIYAMOTO and J. CRACRAFT, eds. Phylo- genetic analysis of DNA sequences. Oxford University Press, Oxford.
SWOFFORD, D. L., and G. J. OLSEN. 1990. Phylogeny recon- struction. Pp. 41 l-501 in D. M. HILLIS and C. MORITZ, eds. Molecular Systematics. Sinauer, Sunderland, Mass.
TELFORD, M. J., and P. W. H. HOLLAND. 1993. The phylo- genetic affinities of chaetognaths: a molecular analysis. Mol. Biol. Evol. 10:660-676.
TURBEVILLE, J. M., K. G. FIELD, and R. A. RAFF. 1992. Phy- logenetic position of phylum Nemertini, inferred from 18s rRNA gene sequences: molecular data as a test of morpho- logical charcter homology. Mol. Biol. Evol. 9:235-249.
TURBEVILLE, J. M., D. M. PFEIFER, K. G. FIELD, and R. A. RAFF. 199 1. The phylogenetic status of arthropods, as in- ferred from 18s rRNA sequences. Mol. Biol. Evol. 8:669- 686.
VANDEKERCKHOVE, J., and K. WEBER. 1984. Chordate muscle actins differ distinctly from invertebrate muscle actins: the evolution of different vertebrate muscle actins. J. Mol. Biol. 179:391-413.
WADA, H., and N. SATOH. 1994. Details of evolutionary history from invertebrates to vertebrates, as deduced from se- quences of 18s rDNA. Proc. Natl. Acad. Sci. USA 9 1: 180 l- 1804.
WHEELER, W. C., and R. L. HONEYCUTT. 1988. Paired se- quence difference in ribosomal RNAs: Evolutionary and phylogenetic implications. Mol. Biol. Evol. 5:90-96.
SIMON EASTEAL, reviewing editor
Received January 10, 1994
Accepted February 3, 1994