determining the self sufficiency of microfinance … determining the self sufficiency of...
TRANSCRIPT

Determining the Self Sufficiency of Microfinance Institutions
by
Jacob Yaron and Ronny Manos
Yaron: School of Business, College of Management
Manos: School of Business, College of Management
Correspondence to:
Ronny Manos: School of Business, College of Management, Israel. Tel/Fax: +972 (0)3
6438753; E-mail: [email protected]
January 2007
Published: Yaron, J. and Manos, R., (2007), ‘Determining the Self Sufficiency of
Microfinance Institutions, Savings & Development, No. 2, pp 131-160

2
Determining the Self Sufficiency of Microfinance Institutions
ABSTRACT
The paper compares and discusses two commonly used methods to evaluate and measure self-
sufficiency of microfinance institutions (MFIs), namely subsidy dependence index (SDI) and
financial self sufficiency (FSS). Both the SDI and the FSS are used by the microfinance
industry as substitutes for a complete cost-benefit analysis, which demands specialised
resources and sophisticated financial methods and is therefore rarely applied. In contrast, the
SDI and FSS do not provide a complete cost–benefit analysis of the performance of MFIs.
However, they attempt to provide sufficiently meaningful performance evaluation measures
that allow society and donors, who often bear the cost of subsidising MFIs, to assess
performance. In particular the SDI and FSS evaluation methods allow comparisons to be
made among MFIs that serve similar target clientele and provide similar services. The paper
focuses on the differences between the SDI and the FSS and concludes that the latter often
underestimates the subsidy-dependence of the MFI (overestimates self-sufficiency). This
deficiency is due to inherent characteristics of the FSS methodology which the paper
elaborates on. The paper also suggests the utilization of an outreach index (OI) that should
reflect social objectives and priorities in allocating scarce public funds in supporting MFIs.
Relying on traditional financial ratios, such as return on assets (ROA) and return on equity
(ROE), is a futile practice in assessing the performance of MFIs, unless costs and income are
properly adjusted to reflect subsidies. When costs and income are not adjusted to reflect
subsidies, relying on traditional financial ratios, could often lead to meaningless or even
misleading performance assessment.
JEL Classification: G21, I38, O16
Keywords: Micro Finance Institution; Subsidy Dependence Index; Financial Self
Sufficiency; Outreach Index
3
Acronyms
CD Certificate of Deposits
CGAP Consultative Group to Assist the Poor
DCF Discounted Cash Flow
EVA Economic Value Added
FI Financial Institution
FSS Financial Self Sufficiency
IFS International Financial Statistics
MBB The MicroBanking Bulletin
MFI Micro Finance Institution
MIX Microfinance Information eXchange
OI Outreach Index
LP outstanding Loan Portfolio
ROA Return On Assets
ROE Return On Equity
RR Reserve requirements
SDFI State-owned Development Finance Institution
SDI Subsidy Dependence Index

4
1. Introduction
The microfinance industry has experienced fundamental changes since its inception in the late
1970s. From an industry dependent upon grants and subsidies, driven by political incentives,
and justified by social values, the underlining view has evolved to realise that providing
financial services to low income and poor people can be a viable business. As an example, in
the past, many governments- motivated by social views - used to cap interest rates charged on
loans to poor people. More recently, however, many policy makers have realised that capping
interest reduces the supply of loans, and results in misallocation of resources and the seizing
of big parts of subsidies embedded in concessionary loans by the relatively well to do and
influential clientele. As this practice clearly harms development, governments’ attitude
towards capping of interest rates has changed. Moreover, although most microfinance
institutions (MFIs) normally require financial assistance during earlier years, it has been
realised that to secure sustainability, to improve efficiency and to ensure ability to meet
growing demand for capital, the MFI - as it matures - must strive to become self sustainable1.
As a result, there has been a move away from State-owned Development Finance Institutions
(SDFIs) – previously dominant in many developing countries and considered the vehicle
through which social goals could be reached and priority sectors supported - towards more
diversified ownership of institutions. Indeed, SDFIs were frequently riddled with
inefficiencies and often benefited primarily the relatively rich clients at the expense of poor
people. In contrast, many of the newly emerging MFIs adopt a more economically-oriented
approach that includes sourcing finance by making and retaining earnings, attracting deposits,
increasingly borrowing from commercial sources at market rates, and tightening loan
recovery procedures to minimise bad debt. Furthermore, many commercial banks, which in
the past did not consider poor people as potential clients, now set up microfinance centres that
aim to create value by providing financial services specifically to low income households and
poor people in developing countries.
The evolution of MFIs from subsidy-based into profitable businesses has led to an increasing
number of MFIs and other entities which report and analyse the performance of MFIs, and
track MFIs’ performance progression over time. This phenomenon has highlighted the
absence of adequate assessment criteria. Indeed, in the past, poorly applied performance
indicators were relied upon to justify continuation and augmentation of SDFIs’ operations and
subsidization thereof. While indicators such as the number of people financed and amounts
lent, were applied, information was lacking on SDFIs’ losses, on their enormous arrears, on
political interventions in resource allocation, on dependence on subsidies and on ill-targeting
of clientele.
The political economy associated with concessionary lending granted to SDFIs and MFIs had
a great influence on the performance of these institutions, on their lending policies and on the
performance evaluation methods used to justify their existence. Once governments and
institutions started to understand the importance of building sustainable MFIs, initiatives to
develop well founded performance assessment criteria were embarked upon. These criteria
have since become widely-used by the MFI industry.
When endeavouring to measure the performance of MFIs there are a number of unique
features of this type of organisation that need to be considered. For example, although there
1 For example, an article titled ‘The Hidden Wealth of the Poor’ which was published in the Economist of
November 5, 2005 tells the story of the PT Bank Dagang Bali of Indonesia, which was closed in 2004 due to
fraud and insolvency. The bank used to serve poor people, many of which lost their savings as a result of the
closure.

5
may be demand by poor people for financial services, the cost of advancing many micro loans
is substantially higher than advancing a small number of bigger loans of the same overall loan
portfolio. Poor repayment rates and the impact of high inflation, which often characterise
developing countries, should also be considered. The hidden costs of grants, subsidies and
technical aid received by the MFI must likewise be properly measured. In addition, relief
from reserve requirements (RR), access to concessionary interest rates and return on equity
which is either negative or below the opportunity cost of equity capital are also unique to
many MFIs. These should not be ignored when MFI performance is measured.
Notwithstanding the difficulties involved, properly measuring the performance of MFIs may
yield some important benefits. First, measuring performance should help in transforming a
once subsidy-based industry into a profitable and sustainable one. Second, measuring
performance should make the MFI industry more attractive to private suppliers of capital thus
increasing access to sustainable sources of funds. Third, measuring performance enhances
efficiency and highlights efficient MFIs which are better positioned to achieve goals and
improve access of target clientele to a wide range of financial services. Overall, measuring
and tracking MFI performance should help to channel funds to the most efficient institutions,
thus supporting economic growth and poverty reduction.
Moreover, measuring performance is essential even for evaluating the performance of MFIs
that serve the extreme poor and have no desire or plans to become self sustainable. This is
because there are alternative ways to reach and benefit the target clientele. Measuring the
performance of MFIs should enlighten those that foot the bill of subsidies, on the cost-
effectiveness of this instrument in supporting the target clientele.
The aim of this study is to assess various performance evaluation measures that are commonly
used by the MFI industry. Section 2 reviews traditional performance measures and highlights
their shortcomings in measuring the performance of MFIs. Section 3 reviews the financial
self sufficiency index (FSS) while section 4 is devoted to the subsidy dependence index (SDI)
and to the outreach index (OI). Section 5 compares the FSS and SDI measures both
theoretically and by numerical illustrations. Section 6 concludes. It is noted at the outset that
self-sufficiency is alternatively referred to as subsidy independence or self sustainability, and
these terms are used interchangeably throughout the paper.
2. Traditional Accounting Measures of Performance
Typically upon inception - and often for many years after - MFIs rely upon scarce public
funds in the form of subsidies. Moreover, many MFIs maintain their operations on the basis
that they would receive continued subsidies indefinitely. Under these circumstances,
traditional financial ratios that are based on accounting data, unadjusted for subsidies, are
clearly inadequate to measure MFI performance. Although these traditional performance
measures may be suitable for evaluating for-profit organizations, in the case of MFIs they
provide at best a partial but often a misleading picture of performance.
Figure 1 illustrates the futility of relying on traditional financial ratios - the return on assets
(ROA) and the return on equity (ROE) - in evaluating the performance of MFIs. The
performance indicated by these two financial ratios may reflect the “true” financial outcome
of a for-profit organization that operates under commercial constraints in a competitive
market place. However, the performance of the MFI, as indicated by the unadjusted ROA and
ROE, reflects the administrative decision on the (subsidized) cost of borrowed funds. In other
words, the ROA and ROE are the residual value of the subsidies received by the MFI: they
are dependent variables disguised as independent ones.

6
Figure 1: The effect on ROA and ROE of the administrative decision on the rate of
interest paid by the MFI on its borrowed funds.
-150%
-100%
-50%
0%
50%
100%
150%
200%
0%
2%
4%
6%
8%
10
%
12
%
14
%
16
%
18
%
20
%
22
%
24
%
26
%
28
%
30
%
Interest Rate Paid by MFI on its Borrowed Funds
RO
E
-15%
-10%
-5%
0%
5%
10%
15%
20%
RO
A
Key assumptions: Equity equals 10 percent of total assets; The average annual yield obtained
on total assets is 20 percent; Administrative expenses are 6 percent of total assets.
The failure of the ROA and ROE in measuring the performance of MFIs is due to their
reliance on accounting practices that ignore the subsidies received by MFIs. Without properly
reporting and evaluating the subsidies involved, no adequate cost-benefit analysis or cost-
effectiveness analysis of the MFI can be carried out.
Furthermore, the traditional accounting measures ignore the opportunity cost of capital
employed. O’Brien (2006) suggests that in the face of the commercialization of the
microfinance industry, MFIs should adopt the valuation method used by the for-profit sector,
the discounted cash flow (DCF) method. The advantage of the DCF method over traditional
accounting measures is that it recognizes and focuses on the opportunity cost of capital.
However, as it is based on cash flows and not on accounting data, the DCF method requires
the implementation of a different data collection system to that which the organization uses to
generate its financial statements. Alternatively, the economic profit approach, a concept well-
familiar to sophisticated managers, also considers the opportunity cost of capital, while
utilizing existing accounting data to calculate profit.
The most popular performance measure, which is based on the economic profit approach, is
the economic value added (EVA) suggested by Stewart (1991). EVA is calculated as the
adjusted capital employed multiplied by the difference between the adjusted return on capital
and the weighted average cost of capital for the firm. It measures the amount by which the
profit made by the firm exceeds the return required by the suppliers of capital. EVA also
requires that accounting figures are adjusted so that profit is measured more accurately.
Indeed, Tully (1993) notes that unlike traditional accounting measures of performance, EVA
is not distorted by accounting rules.
As will be discussed later, incorporating the opportunity cost of capital into the performance
measure is even more important in the case of MFIs compared with for-profit organizations.
The SDI method endeavours to incorporate this idea, while the FSS method does not.

7
3. The FSS measure of self sustainability
Realising the inadequacy of unadjusted traditional financial ratios in measuring MFI
performance, the FSS index has been developed to assess the self-sufficiency (or subsidy
dependence) of MFIs. It is a popular assessment method used by many MFIs as well as by
some rating agencies of MFIs. Notably the FSS index is used by the Microfinance
Information eXchange (MIX), a non-profit organization concerned with supporting the MFI
industry, which regularly reports the FSS indices of leading MFIs2.
The FSS index is designed to evaluate the level of subsidy dependence of MFIs and to gauge
their progress over time towards self sufficiency. More specifically the FSS measures the
extent to which the adjusted business revenue of an MFI, including interest and fee income,
covers adjusted costs.
(1)
Expense Operating ExpenseProvision LossLoan Net Expense FinancialAdjusted
Revenue Financial Adjusted
FSS
Costs are adjusted by the FSS method as follows (for further details see chapter 8 of
Ledgerwood, 1998 and Appendix I of The MicroBanking Bulletin, (MBB), of August 2005,
or any other MBB publication):
1) Adjustment for inflation. Inflation decreases the value of monetary assets. If the MFI has
net monetary assets, then inflation erodes the real value of its equity. The FSS
methodology charges an inflation cost that is calculated as the annual inflation rate
multiplied by the difference between equity and fixed assets. The idea is that in
measuring sustainability, an MFI should maintain the real value of equity.
2) Adjustment for concessionary loans. An MFI that benefits from concessionary loans must
consider the real economic cost of subsidies embedded in such loans. Hence, to adjust for
concessionary loans, the difference between a proxy for the market deposit rate and the
average annual concessionary borrowing rate is multiplied by the value of the average
annual concessionary borrowings. This cost is added to the financial costs recorded on the
income statement.
3) Adjustment for subsidies other than in the form of concessionary loans. MFIs often
receive financial help in the form of grants or in the form of in-kind subsidies. These may
include cash donations, partial or full coverage of loan losses, technical assistance
extended at below market cost, personnel who volunteer to work for the MFI for no
salary, and so forth. The FSS methodology adjusts for the effects of these subsidies.
The FSS measures the adjusted income of the MFI relative to its adjusted costs. When
adjusted income is lower than adjusted costs, the FSS measure is below 100% and the MFI is
defined as subsidy dependent. When adjusted income exceeds adjusted cost, the MFI is
defined as self-sufficient (subsidy independent).
2 The MIX is supported by many organizations including the Consultative Group to Assist the Poor (CGAP),
Rockdale Foundation, Citigroup Foundation and many more. It collects and reports data provided by leading
MFIs, principally in its MicroBanking Bulletin (MBB), where financial data and data on self sustainability
are organized by peer groups.

8
Although the FSS is widely used (notably by MIX and the MBB), this measure of self
sufficiency suffers from four main deficiencies. The first three deficiencies relate to subsidy
elements which the FSS methodology ignores in calculating the real opportunity cost of
financial resources used by the MFI. The fourth deficiency relates to the failure of the FSS
measure to distinguish between MFIs that lend to the target clientele and those that invest in
other financial instruments. The following paragraphs explain each deficiency in detail.
A. The administration costs of mobilizing and servicing deposits.
When adjusting for the cost of funds, the FSS methodology uses the financial cost of
voluntary deposit in the country concerned as a proxy for the market cost of funds (Line 60l
of the International Monetary Fund’s International Financial Statistics - IFS). The MIX, in its
MBB publication of August 2005 notes that a different rate may better reflect the shadow cost
of subsidised loans. For instance, licensed MFIs, that are allowed to mobilize savings
deposits of their clients as an alternative source of funds, should be justified in applying a
lower shadow cost than the deposit rate reported in line 60l of the IFS. However,
administration costs or reserve requirements may increase the costs of such liabilities3.
Thus using a shadow rate to reflect the opportunity cost of subsidized borrowings correctly
highlights the cost to society of concessionary funds. However, while it is proper to consider
this rate as an important factor of the opportunity cost of concessionary borrowings, this
treatment is insufficient as it neglects to consider the administrative costs associated with
mobilizing and servicing savings. Ignoring these costs is wrong for two reasons.
First, savings facilities are expected to become more important as the microfinance industry
evolves. Indeed, although traditionally the focus of the microfinance industry has been on the
provision of microcredit, it is gradually being realised that savings facility is a financial
product that for many clients of MFIs is not less and often more important than providing
credit facilities. Holding savings accounts with MFIs, relieves many poor people from the
asymmetric information barrier they often face when trying to access credit. Specifically, the
poor often cannot offer adequate collateral and therefore cannot access credit. However,
being able to save with the MFI allows these people to create a track record that contributes to
favourable future decisions regarding their creditworthiness.
Offering savings facility also provides a source of funds for the MFI and reduces its
dependence on donors’ funds (Dowla and Alamgir, 2003). It is often the case that the natural
path of development of MFIs leads them to gradually reduce reliance on donor or state
support and built - subject to existing regulations, norms and procedures - a capital base that
increasingly relies on savings. This means that even if the costs of mobilizing and servicing
savings are currently low, they are expected to increase as the MFI matures. Moreover, as the
MFI matures, it is expected to offer more sophisticated savings services which may be more
expensive to provide. For example, Dowla and Alamgir (2003) note that as MFIs move to
offer longer-term deposit facilities the administration costs associated with providing savings
facilities become more expensive. This is because the MFI commits to making larger future
payments to savers and because longer term deposits, while improving the liquidity of the
MFI, reduce the liquidity of the saving clients4.
3 See footnote 63, page 105, Appendix 1 of the MBB of August 2005.
4 The MFI may reduce the costs of servicing savings by targeting wealthier clients. However, by so doing the
MFI diverts from its original goal of providing financial services to the poor.

9
The second reason why the administration costs of mobilizing and servicing savings cannot
be ignored is that these costs are significant even when savings accounts form only a small
fraction of the activity of the MFI. There are a number of reasons for this. First, the clients of
MFIs that offer savings facilities tend to hold small value accounts which are more costly to
maintain5. Second, these clients usually demand easy and quick access to accounts and
convenient withdrawals which, from the point of view of the MFI, is labour-intensive and
expensive. Third, MFIs that offer savings facilities usually have more savings accounts than
loan accounts. For example, Robinson (1997) notes that at BRI Indonesia there are about six
deposit accounts for every loan, while at Bank Dagang Bali there are over 30 deposit accounts
for every loan. Thus an MFI that starts to offer effective savings services can expect a solid
demand of new customers and the associated additional costs including those related to
recruiting new staff, training existing staff, enhanced reporting, and so on.
Reliable data on MFIs’ administrative costs associated exclusively with servicing deposits
and savings accounts are rare. The reason for this is accounting practice that requires
reporting on total administrative costs, irrespective of whether they occur in servicing savings
accounts, lending, or any other activities carried out by the MFI. A number of studies have
attempted to overcome this lacuna of data availability by computing the savings expense ratio
which is calculated as the administrative costs of savings measured against the outstanding
value of savings accounts. Richardson (2003) reports a savings expense ratio of 3.65% for a
group of 15 credit unions. Hirschland (2003) reports a savings expense ratio of 5% for
VYCCU, Nepal in 2000. For BRI, Indonesia, possibly the world’s best performing MFI,
Hirschland (2003) reports a savings expense ratio of 2.2% in 1996. Accordingly, assuming a
savings expense ratio in the range of 2.2% to 5%, MFIs face substantially higher costs
compared with regulated banks that serve more affluent clients with larger average value
deposits. Furthermore, this range may be compared to a nominal financial cost of deposits of
4.2%. The latter is the 2004 average nominal deposit rate for 23 MFIs whose voluntary
savings accounts amount to 20% or more of their total assets (MBB April 2006) 6
.
Thus despite the fact that reliable information on the administrative costs of servicing and
mobilizing savings by MFIs is often absent, they are evidently material. Separate reporting
on the administration costs related to the various activities of the MFI is therefore crucial in
elevating this void7. Clearly, the costs associated with providing savings facilities should not
be ignored when the shadow price of concessionary borrowings (or equity) is computed in
order to measure self sufficiency of MFIs. Using an estimated lower bound of such
administrative costs is a preferable solution to ignoring these costs altogether, as practiced by
users of the FSS methodology.
Ignoring administration costs in determining the opportunity cost of concessionary funds
would inevitably lead to significant underestimation of the subsidy dependence of the MFI.
5 The value of the average savings account held by clients of MFIs is often only a fraction of the value of the
average loan outstanding. Dowla and Alamgir (2003) report that in December 1998 members’ savings form
between 16 to 37 percent of outstanding loans for a group of MFIs in Bangladesh.
6 The average financial cost of deposit of 4.2% refers to the nominal rate and not to the real, inflation-adjusted
rate. It is the average for 23 high financial intermediation MFIs, i.e. those whose voluntary savings accounts
amount to 20% or more of their total assets. See the table on page 47 and the guide to peer groups on page 85
of the MBB of April 2006.
7 Separate reporting of the costs of the various activities can be achieved by introducing rudimentary cost
accounting. This should help the MFI to understand the cost structure of each product it offers and therefore
to more appropriately price its products. Furthermore, even if the MFI decides to utilize some subsidization,
separate reporting of the costs of each product it offers should make the MFI more attractive to donors that
are increasingly seeking institutions with sound reporting procedures.
10
This, in turn, could lead the FSS measure to indicate that a subsidy-dependent MFI has
achieved subsidy independence. Alternatively it may lead the FSS to indicate that a subsidy-
dependent MFI is closer to being self sufficient than it actually is.
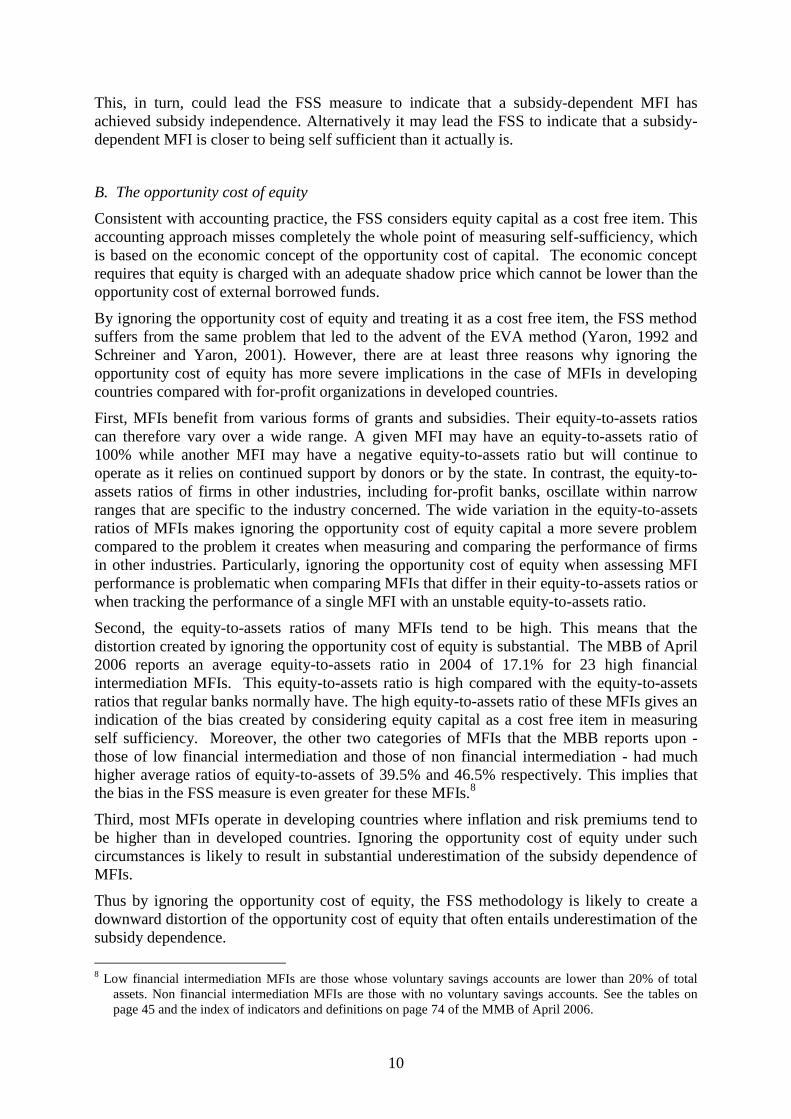
B. The opportunity cost of equity
Consistent with accounting practice, the FSS considers equity capital as a cost free item. This
accounting approach misses completely the whole point of measuring self-sufficiency, which
is based on the economic concept of the opportunity cost of capital. The economic concept
requires that equity is charged with an adequate shadow price which cannot be lower than the
opportunity cost of external borrowed funds.
By ignoring the opportunity cost of equity and treating it as a cost free item, the FSS method
suffers from the same problem that led to the advent of the EVA method (Yaron, 1992 and
Schreiner and Yaron, 2001). However, there are at least three reasons why ignoring the
opportunity cost of equity has more severe implications in the case of MFIs in developing
countries compared with for-profit organizations in developed countries.
First, MFIs benefit from various forms of grants and subsidies. Their equity-to-assets ratios
can therefore vary over a wide range. A given MFI may have an equity-to-assets ratio of
100% while another MFI may have a negative equity-to-assets ratio but will continue to
operate as it relies on continued support by donors or by the state. In contrast, the equity-to-
assets ratios of firms in other industries, including for-profit banks, oscillate within narrow
ranges that are specific to the industry concerned. The wide variation in the equity-to-assets
ratios of MFIs makes ignoring the opportunity cost of equity capital a more severe problem
compared to the problem it creates when measuring and comparing the performance of firms
in other industries. Particularly, ignoring the opportunity cost of equity when assessing MFI
performance is problematic when comparing MFIs that differ in their equity-to-assets ratios or
when tracking the performance of a single MFI with an unstable equity-to-assets ratio.
Second, the equity-to-assets ratios of many MFIs tend to be high. This means that the
distortion created by ignoring the opportunity cost of equity is substantial. The MBB of April
2006 reports an average equity-to-assets ratio in 2004 of 17.1% for 23 high financial
intermediation MFIs. This equity-to-assets ratio is high compared with the equity-to-assets
ratios that regular banks normally have. The high equity-to-assets ratio of these MFIs gives an
indication of the bias created by considering equity capital as a cost free item in measuring
self sufficiency. Moreover, the other two categories of MFIs that the MBB reports upon -
those of low financial intermediation and those of non financial intermediation - had much
higher average ratios of equity-to-assets of 39.5% and 46.5% respectively. This implies that
the bias in the FSS measure is even greater for these MFIs.8
Third, most MFIs operate in developing countries where inflation and risk premiums tend to
be higher than in developed countries. Ignoring the opportunity cost of equity under such
circumstances is likely to result in substantial underestimation of the subsidy dependence of
MFIs.
Thus by ignoring the opportunity cost of equity, the FSS methodology is likely to create a
downward distortion of the opportunity cost of equity that often entails underestimation of the
subsidy dependence.
8 Low financial intermediation MFIs are those whose voluntary savings accounts are lower than 20% of total
assets. Non financial intermediation MFIs are those with no voluntary savings accounts. See the tables on
page 45 and the index of indicators and definitions on page 74 of the MMB of April 2006.

11
C. Exemption from reserve requirements
The third factor that is missing in computing the self sufficiency of an MFI, using the FSS
methodology, is exemption from RR. Such exemptions are often awarded to MFIs,
particularly to unregulated MFIs, in countries where other formal, financial institutions (FIs)
are subject to RR. Like subsidized borrowings, exemption from RR constitutes a subsidy. It
relieves entitled MFIs from an additional cost of loanable funds which other FIs bear.
Therefore, exemption from RR should be reflected in the opportunity cost of concessionary
borrowings of MFIs. The real opportunity cost of subsidized borrowings is the sum of the
deposit rate of interest plus the rate of administration cost exclusively associated with
deposits, divided by 1 minus the rate of RR. This is the approach of the SDI method but not of
the FSS method9.
D. Reaching target clientele
The FSS measures the MFI’s adjusted income against its adjusted costs. This approach gives
no consideration to whether the subsidies invested, and the income generated, are related to
lending to the target clientele. As an extreme example, imagine that two MFIs were evaluated
to have identical FSS indices. However, the identical FSS indices could conceal the fact that
MFI A had invested 80% of its assets in loans to target clientele while MFI B had invested
80% of its assets in certificates of deposits (CD). Obviously MFI B did not serve its target
clientele as well as MFI A. However, the FSS methodology missed to identify this important
gap between the two MFIs. The problem of the FSS methodology is the fact that it does not
relate the overall subsidy to an indicator that reflects the MFI’s objective, such as outstanding
loan portfolio (LP) or income obtained on LP in servicing the target clientele.
Furthermore, the FSS methodology does not distinguish between an MFI that obtained self
sufficiency by servicing target clients and an MFI that achieved self sufficiency by investing
in commercial paper instead. The extent to which the MFI has achieved its set goals is
supposed to be captured by several other indicators to be used alongside the FSS index. In
contrast to the FSS, and as discussed below, the SDI measure resolves this problem to a large
extent, without having to rely on additional indicators.
The above discussion outlines some of the deficiencies of the FSS measure. These
deficiencies are illustrated in table 1. Table 1 is followed by a discussion of an alternative
approach to measuring MFI financial performance, the SDI-OI framework.
9 For example, assuming financial cost of 6 percent, administrative cost of 4 percent and non remunerative
reserve requirement of 10 percent, the real cost of loanable funds would be (6%+4%)/(1-0.1)=11.1%

12
Table 1: The deficiencies of the FSS method
FSS indicator Interpretation of the
FSS indicator
The distortion caused by the FSS
indicator
Two MFIs with different
equity-to-assets ratios have
identical FSS measures.
The two MFIs are equal
with respect to their
self-sufficiency.
Self sufficiency levels of the MFIs
are different. The self sufficiency
level of the MFI with lower
equity-to-assets ratio is higher.
The FSS measure of an MFI
shows a positive progression
over time. The equity-to-
assets ratio of the MFI has
also increased during the
period.
The MFI has managed
to improve its self
sufficiency over the
period.
Whether the MFI has managed to
improve its self-sufficiency over
the period is actually not known.
The improvement in the FSS
measure may be due to the upward
change in the equity-to-assets
ratio, as equity is considered a cost
free item by the FSS.
The FSS measure of the MFI
is 100%
The MFI is fully self-
sufficient.
If the MFI has equity in its capital
structure, than it is subsidy
dependent.
The FSS measure of the MFI
is lower than 100%
The MFI is not fully
self-sufficient.
The actual level of self-sufficiency
of the MFI is lower than the FSS
indicates.
The FSS measure of the MFI
is greater than 100%
The MFI has reached
full self sufficiency and
beyond.
The actual level of self-sufficiency
of the MFI is not known.
The FSS measure of MFI A,
as well as its equity-to-assets
ratio are higher than that of
MFI B.
MFI A has higher level
of self sufficiency
compared with MFI B.
It is not known which of the two
MFIs has achieved higher self
sufficiency level. If a charge is
made for the opportunity cost of
equity, MFI B may appear more
self-sufficient than MFI A.
The FSS of the MFI is 100%
and the MFI has no fixed
assets. Inflation rate is high
but the deposit rate exceeds
the inflation rate.
The MFI has reached
full self-sufficiency as
its adjusted costs were
fully covered by its
adjusted income.
The FSS measure ignores the
opportunity cost of equity. The
MFI is subsidy dependent.
Two MFIs with identical FSS
measures and identical
equity-to-assets ratios. MFI A
has LP that accounts for 80%
of its total assets while MFI
B has LP which accounts for
20% of total assets.
MFI A and MFI B have
achieved the same level
of self sufficiency.
MFI A directs a higher share of its
resources to serving the target
clientele, while achieving the same
level of self sufficiency as MFI B.
Therefore, MFI A is more cost
effective which is not recognised
by the FSS.
The MFI benefited from
concessionary funds in year
1. Its FSS is below 100%. In
year 2 the MFI fully replaced
all concessionary funds. It
achieved an FSS of 100%.
The change in the FSS
measure from year 1 to
year 2 indicates an
improvement in the self
sufficiency level of the
MFI.
The progress made towards self
sufficiency is greater than reflected
by the change in the FSS. The
reason is that the FSS of year 1
overestimated the self sufficiency
level of the MFI at that time.

13
4. Using the SDI and the OI to measure MFI performance.
The FSS is an indicator that was developed to capture the level of self sufficiency of MFIs.
Prior to the introduction of the FSS, Yaron (1992) introduced a framework for assessing MFI
performance and self sufficiency. The framework, which has gained wide acceptance among
practitioners and academics, combines two primary assessment criteria, outreach and self-
sustainability. The former is measured by the OI indicator and seeks to measure the extent to
which the MFI has reached its target clientele. The latter is measured by the SDI indicator
which, like the FSS, seeks to measure the self sufficiency or self sustainability of the MFI.
Yaron (1992) argues that using the OI alongside the SDI, is conductive in evaluating the
extent to which an MFI has reached its target clientele in an efficient manner. Moreover,
using the framework gives a reliable measure of the progress made by the MFI over time
towards subsidy independence and self sufficiency. Thus using the framework should enable
the identification of those MFIs that are likely to achieve the desired goals of expanding
incomes and/or reducing poverty.
4.1. The SDI measure of self sustainability.
The SDI is designed to measure the self-sustainability level of the MFI with a single number.
It is calculated as the annual subsidy received by the MFI, divided by the income earned by
the MFI on its average annual LP. The SDI gives an indication of the percentage by which the
average yield obtained on the MFI’s LP would have to increase in order to make it subsidy
independent. It also indicates the cost to society of subsidizing the MFI, relative to the
interest plus fees paid by the target clientele to the MFI.
Calculating the SDI is imperative in evaluating the use of subsidies to support the MFI versus
assisting the target clients through non-financial intermediation. In that sense the SDI may be
assessed in terms of matching the grant received to the income generated. Particularly, the
SDI matches the subsidy granted by society, (the numerator in the SDI measure) to the value
of fees and interest payments paid by clients (the denominator).
The SDI is normally computed in two stages. In the first stage the total annual subsidy
received by the MFI is divided by the average annual LP. For a given MFI, this provides the
annual subsidy per annual dollar of LP. In the second stage the total annual subsidy received
by the MFI is divided by the interest and fee income earned on the MFI’s LP. The second
stage gives the complete SDI measure and places the total amount of subsidies received by the
MFI in the context of its activities10
.
The amount of the annual subsidy received by the MFI is defined as:
KPmEcmAS (2)
where:
S Annual subsidy received by the MFI
A MFI concessionary borrowed funds outstanding (annual average)
10
While the nominator in the SDI formula is unchanged between the two stages, the denominator sets them
apart. The denominator in the first stage is the MFI’s LP. The denominator in the second stage is the yield
(interest and fees) earned by the MFI on its LP. The complete SDI is therefore the ratio of the total annual
subsidies received by the MFI (explicit and implicit) to the income earned on its LP.

14
m The assumed interest rate that the MFI would have to pay for borrowed funds if
access to concessionary borrowing was eliminated.
c Weighted average annual concessionary rate of interest actually paid by the MFI
on its annual average concessionary borrowed funds outstanding
E Average annual equity
P Reported annual profit before tax (adjusted, when necessary, for loan loss
provisions, inflation, and so on)
K The sum of all other annual subsidies received by the MFI (such as partial or
complete coverage by the state of operational costs of the MFI).
The complete SDI is defined as:
iLP
SSDI
(3)
where:
SDI Index of subsidy dependence of the MFI
S Annual subsidy received by the MFI (see above)
LP Average annual outstanding loan portfolio of the MFI
i Weighted average yield earned on the loan portfolio of the MFI.
If it is assumed that an increase in the lending interest rate is the only change that may
compensate for loss of subsidy, then the SDI provides a sensitivity measure of the MFI’s self
sufficiency to the annual yield it charges on its loans. Particularly under this assumption, the
SDI indicates the percentage increase in the annual yield on the MFI’s LP that is needed for
full subsidy independence to be reached. Figure 2 illustrates the point. As shown in figure 2,
at a yield on loans of just under 18%, the SDI value is 0 and the MFI is fully self sufficient.

15
Figure 2. The sensitivity of the SDI to the yield that the MFI
receives on its LP
-30%
-20%
-10%
0%10%
20%
30%
40%
50%
60%70%
80%
90%
100%
10%
11%
12%
13%
14%
15%
16%
17%
18%
19%
20%
21%
22%
23%
24%
25%
Yield on lending
SD
I
However, assuming that the only factor that influences the self sustainability of the MFI is its
lending rate is unrealistic. Indeed, the SDI measure is an accurate measure of self
sustainability as it is influenced not only by the yield obtained on the MFI’s LP but also on
interest rate spreads it faces, its loan collection rate and the administration costs it incurs in
carrying out its activities. In other words, improving any of these factors, for example saving
on costs or reducing loan losses also reduces the SDI value and indicates improvement
towards subsidy independence. Furthermore, using the SDI facilitates comparisons of MFIs
that provide similar products to similar clientele. Comparisons may be carried out within a
single country or across countries to assess the subsidy dependence of the MFIs concerned. It
can also be used to track the subsidy dependence of a given MFI over time to assess whether
it has truly progressed toward self sufficiency.
The advantage of the SDI is its simplicity and the fact that it focuses exclusively on subsidies
received measured against income obtained on LP. This may be contrasted with the FSS ratio
which measures the subsidy the MFI benefits from against all income not distinguishing
between income made on LP and other income such as investment in CD. As shown in table
1, it may be the case that income was generated by means other than lending to the target
clientele. In that case two MFIs with identical FSS measures may in fact be very different in
terms of the social justification of supporting them.
Under some circumstances striving to achieve self sustainability and to completely remove all
subsidies is not politically feasible or even economically desirable. However, even under
such circumstances, calculating the SDI measure is still warranted for three basic reasons.
First, the SDI may be seen as a tool to measure subsidy dependence and improvements
thereof over time, thereby contributing to assessing the social desirability of continued
subsidization. Second, measuring the subsidies received by the MFI is always economically
and politically desirable as it should improve resource allocation. Third computing and

16
disclosing the SDIs of MFIs provide imperative basic data to the public debate on the use of
scarce public funds.
4.2. The OI measure of outreach and the benefits of integrating the OI and the SDI in
evaluating MFIs’ performance
Yaron (1992) suggests the OI as a measure of outreach to be used alongside the SDI. The OI
seeks to measure the outreach of an MFI to the target clientele - the output of the financial
support granted to the MFI. It should reflect the social desirability of the quality and quantity
of services offered. The OI should make use of several indicators in evaluating the outreach
of the MFI. Examples include number of clients, average loan size, or the percentage of
female clients. Schreiner (2002) identifies six dimensions of outreach while Francisco et al
(2007) suggest a weighting scheme that should be applied to the various dimensions and
indicators in order to reflect the relative priority assigned to each. Given the wide variety of
competing objectives, the OI measure encourages the MFI and related donors to explicitly
define quantifiable output variables that proxy for the objectives set, and to select the relative
weights of each variable reflecting their priorities.
The OI is a hybrid (arbitrary) index that should reflect the priorities and weights assigned to
its components, which may change over time. The main advantage of the OI is that it
encourages the authorities that foot the subsidy bill to clearly clarify their objectives, priorities
and precisely define the target clientele. It also allows for a more accurate measurement of
the related costs associated with well defined products that aim at achieving the MFI’s
objectives.
Integration of the SDI and the OI provides a framework that captures the social cost and the
social output utilization of subsidies by the MFI. It can highlight the idea that a subsidy is
more socially desirable to society when it is cost effective in achieving the social objectives it
was set to achieve. For example, if the social objective that a subsidy was set to achieve is to
serve poor farmers, then the same value subsidy per dollar of LP extended to poor farmers is
more valuable to society than its equivalent per dollar of LP extended to rich farmers. Policy
makers can and should define and quantify how much higher is the value they attribute to a
dollar LP granted to poor clients compared to a dollar LP extended to a rich ones.
Figure 3 summarizes the SDI-OI framework for assessing MFI performance, by listing the
characteristics of each of its two components.

17
Figure 3: The SDI-OI framework for assessing MFI outreach and self sustainability
Measuring MFI
performance
Measuring self
sustainability
Measuring
outreach
SDI
Measures subsidies
received against interest
earned by the MFI
OI
Evaluates outreach to
clients and quality of
services offered
Examples of Subsidies:
Interest rate subsidy
on concessionary
borrowed funds
Opportunity cost of
equity
Others, including:
Reserves
requirement
exemptions;
Free equipment
provided by
government/
donors;
Government’s
assumption of
loan losses;
Free training for
staff provided by
government/
donor
Government
assumption of
foreign exchange
loans
Examples of Indicators
Market Penetration
Number and annual
growth rates of
savings and loan
accounts
Value and annual
growth rates of the
LP and deposits
Number of
branches and staff
Relative Income Level
Value of average
loan and range of
loan amounts
Percentage of rural
clients
Percentage of
women clients
Quality of Services
Transaction costs to
clients
Flexibility and
suitability of
services
Distribution
network
Source: Adapted from Yaron et al (1997)
As shown in figure 3 the OI is designed to assess the outreach or the output of the MFI while
the SDI, like the FSS, is designed to capture the level of self sustainability of the MFI. In the
following section the SDI is compared to the FSS.
5. Comparing the FSS and the SDI

18
We argue that the FSS is inferior to the SDI in accurately measuring the self sufficiency level
of MFIs. Table 2 compares the two measures and highlights the strengths of the SDI method
relative to the FSS.
Table 2: Comparing the FSS and the SDI measures of self sufficiency of MFIs.
Deficiency 1 Deficiency 2
Explaining the
deficiency of
the FSS
Equity capital is considered a cost
free item (excluding adjustment for
inflation that aims at maintaining
the real value of equity).
Administrative costs related to
savings are not considered when
estimating the opportunity cost.
Implications of
using the FSS
given the
deficiency
Principal implication: Ignoring
the opportunity cost of equity
capital and hence overestimating
the level of the MFI’s subsidy
independence.
Additional implications: The
underestimation of the level of the
MFI’s subsidy dependence
increases with:
1. The equity-to-assets ratio
(equity is measured net of fixed
costs).
2. The real (inflation adjusted)
cost of capital in the country.
Principal implication:
Underestimation of the MFI’s
subsidy dependence.
Additional implications: The
underestimation of the level of the
MFI’s subsidy dependence increases
with:
1. The administration costs of
mobilizing and servicing a
dollar of outstanding savings
2. The rate of savings to total
assets ratio.
The severity of
the FSS
deficiency
The deficiency is severe as it
hinders meaningful comparisons of
self sufficiency across MFIs or a
meaningful analysis of the progress
made towards self sufficiency by an
MFI whose equity-to-assets ratio
changes over time.
The deficiency is severe given that
MFIs’ savings accounts are normally
of small value and their owners
demand liquidity. Servicing these
accounts tends to involve relatively
high administration costs per dollar
of outstanding savings.
How the issue
is resolved by
the SDI method
Charges all financial resources,
including equity, with an
opportunity cost that reflects the
actual cost of capital.
Incorporates the administration costs
related to savings into the shadow
price applied to concessionary
borrowings and equity

19
Table 2: Comparing the FSS and the SDI measures of self sufficiency of MFIs. (continued)
Deficiency 3 Deficiency 4
Explaining the
deficiency of
the FSS
Ignores exemptions from existing
RR
Does not distinguish between MFIs
that invest a large fraction of their
assets in LP and those that divert their
assets to other investments. Two such
differing MFIs may have identical FSS
values and erroneously assessed as
having identical social performance.
Implications of
using the FSS
given the
deficiency
Principal implication:
Underestimation of the MFI’s
subsidy dependence.
Additional implications: The
underestimation of the MFI’s level
of subsidy dependence increases
with the RR ratio.
Principal implication: The identical
FSS values indicate that the two MFIs
have achieved the same level of self-
sufficiency. The FSS method ignores
the fact that the MFI with a higher
share of LP is more efficient in serving
its target clientele. Thus an MFI which
is more dedicated to its target clientele
is evaluated to equal an MFI that has
drifted away from its mission.
The severity of
the FSS
deficiency
Important when RR are high.
However, many MFIs maintain
high cash reserves in order to meet
cash demand of their clients. It is
thus possible that they meet RR
even if they are exempt.
(Assuming reserves do not have to
be deposited at the central bank.)
The deficiency can be severe when
comparing the performance of MFIs
that differ significantly in the ratio of
LP to total assets. The deficiency is
also important when measuring
progress towards self sufficiency over
time and the MFI evaluated has
increased the ratio of LP to total
assets. In that case the FSS
underestimates the progress made
towards subsidy independence over
time.
How the issue
is resolved by
the SDI
method
The SDI takes into account
exemption from RR when
computing the opportunity cost of
capital and the resulted subsidy the
MFI benefits from.
The total subsidy received is measured
against: (1) the value of LP; and (2)
the yield on LP. Hence, the SDI
reflects the degree to which the MFI
uses its resources to lend and not for
other purposes.
20
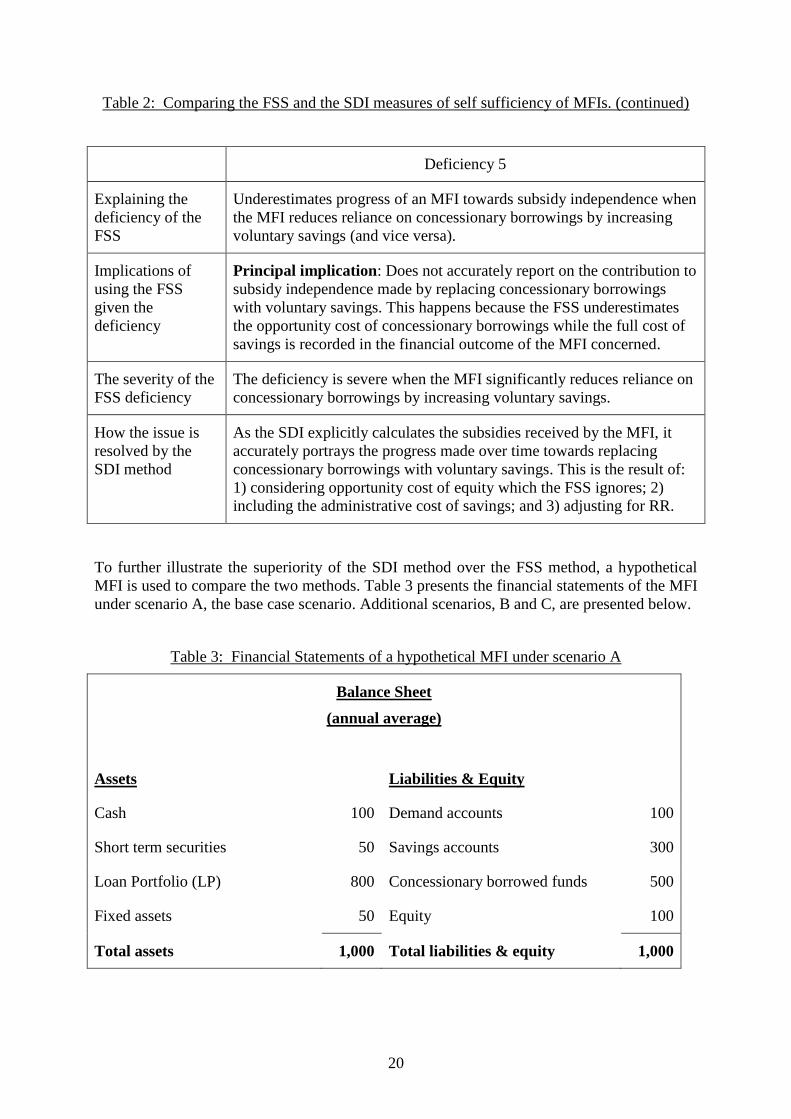
Table 2: Comparing the FSS and the SDI measures of self sufficiency of MFIs. (continued)
Deficiency 5
Explaining the
deficiency of the
FSS
Underestimates progress of an MFI towards subsidy independence when
the MFI reduces reliance on concessionary borrowings by increasing
voluntary savings (and vice versa).
Implications of
using the FSS
given the
deficiency
Principal implication: Does not accurately report on the contribution to
subsidy independence made by replacing concessionary borrowings
with voluntary savings. This happens because the FSS underestimates
the opportunity cost of concessionary borrowings while the full cost of
savings is recorded in the financial outcome of the MFI concerned.
The severity of the
FSS deficiency
The deficiency is severe when the MFI significantly reduces reliance on
concessionary borrowings by increasing voluntary savings.
How the issue is
resolved by the
SDI method
As the SDI explicitly calculates the subsidies received by the MFI, it
accurately portrays the progress made over time towards replacing
concessionary borrowings with voluntary savings. This is the result of:
1) considering opportunity cost of equity which the FSS ignores; 2)
including the administrative cost of savings; and 3) adjusting for RR.
To further illustrate the superiority of the SDI method over the FSS method, a hypothetical
MFI is used to compare the two methods. Table 3 presents the financial statements of the MFI
under scenario A, the base case scenario. Additional scenarios, B and C, are presented below.
Table 3: Financial Statements of a hypothetical MFI under scenario A
Balance Sheet
(annual average)
Assets Liabilities & Equity
Cash 100 Demand accounts 100
Short term securities 50 Savings accounts 300
Loan Portfolio (LP) 800 Concessionary borrowed funds 500
Fixed assets 50 Equity 100
Total assets 1,000 Total liabilities & equity 1,000

21
Table 3: Financial Statements of a hypothetical MFI under scenario A (continued)
Income Statement
Interest earned
On loans (15% * 800) 120
On securities (16% * 50) 8
Total Income 128
Interest paid
On savings accounts (10% * 300) 30
On borrowed funds (8% * 500) 40
Total interest paid (70)
Gross margin 58
Administrative costs (4.8% * 1,000) (48)
Profit (before tax) 10
Based on the following assumptions, table 4 below compares the FSS and SDI measures of
the hypothetical MFI:
1. Balance sheet figures are annual averages
2. Interest earned on LP is 15 percent p.a.
3. Rate of interest earned on securities is 16 percent p.a.
4. No interest is paid on demand accounts.
5. Rate of interest paid on savings accounts (the financial market rate on deposits) is 10
percent p.a.
6. Rate of interest paid on concessionary borrowed funds is 8 percent p.a.
7. The cost of mobilizing and servicing savings accounts is 2 percent of savings
8. Total cost of savings accounts (10%+2%) =12% p.a. (See assumption 5 and assumption
7. This is m in the subsidy formula of equation 2)
9. No RR exist
10. Rate of annual inflation is 0 percent.
11. Administrative cost is 4.8 percent of total assets
12. No loan losses occurred
13. No other subsidies were granted

22
Table 4: Comparison of the SDI and FSS measures of the hypothetical MFI under scenario A
The SDI
The SDI
formula is: iLP
SSDI
The subsidy,
S, is: 22010%)12100(%8%12500
12%2%10% costs servicing depositson ratemarket
])[()(
S
m
KPmEcmAS
The first
stage SDI: %75.2
800
22
LP
S
The complete
SDI is: %3.18
120
22
%15800
22
iLP
S
The FSS
Expense Operating ExpenseProvision LossLoan Net Expense FinancialAdjusted
Revenue Financial Adjusted
FSS
Adjusting the cost for concessionary
borrowings: 10%8%10500
Total adjusted costs are: 128104870
The FSS is: %100
128
128
Costs Adjusted
Revenue AdustedFSS
The top part of table 4 demonstrates how the SDI is calculated. The first stage calculation of
the SDI shows that annual subsidy per dollar of LP amounts to 2.75 cent. The complete SDI
for the MFI in the example is 18.3%. This indicates that to remove all subsidies it was
required to increase the yield obtained on LP by 18.3% (from 15%

23
to %75.17183.1%15 )11
. In other words, to eliminate the subsidy, the MFI had to achieve
interest income of 142 instead of the 120 it actually achieved. Alternatively a cost saving of
22 could have also eliminated the subsidies, as would any combination of increases in the
yield and a cost saving that amount to 22. An SDI of 18.3% also indicates that for every
dollar paid by the clients of the MFI for services rendered, 18.3 cents were granted by society
or donors.
The bottom part of table 4 shows how the FSS is calculated. The rate of inflation is assumed
to be zero and no subsidies other than those embedded in concessionary borrowings are
assumed to have been granted. Therefore the only adjustment to costs that is required is an
adjustment with respect to concessionary borrowings. The difference between the market
deposit rate (10%) and the concessionary borrowings rate (8%) is multiplied by the value of
the concessionary borrowings (500) resulting in an increase of the financial cost by $10. This
is added to the total adjusted costs in the denominator of the FSS ratio. However, while the
10% market deposit rate is included in calculating the financial cost of the MFI, the cost of
mobilizing and servicing savings (2% of the value of outstanding savings), which was
included in the SDI computation, is ignored. The FSS ratio is 100%, indicating that the MFI
has reached full self-sufficiency. This result is inconsistent with the SDI and indeed does not
accurately represent the level of the MFI’s subsidy dependence.
Three main conclusions emerge from the calculations in table 4. First, the SDI and FSS
methods deliver different results regarding the subsidy dependence of the same MFI. Second,
the FSS underestimates the subsidy dependence of the hypothetical MFI. Third, shifting from
using the FSS to using the SDI - or vice versa - is relatively easy.
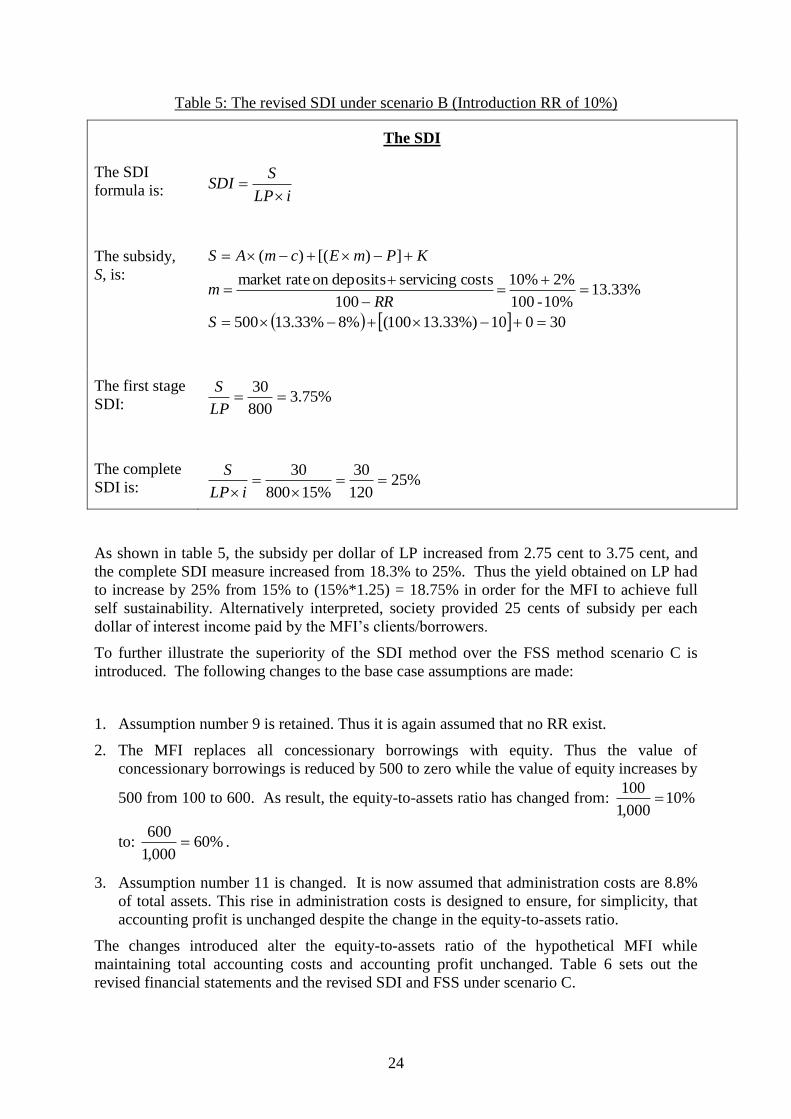
To further illustrate the superiority of the SDI over the FSS, scenario B is introduced. Under
scenario B assumption number 9, the RR assumption, is changed. It is now assumed that RR
are 10% of deposits and are non-remunerative, and the MFI enjoys exemption from RR
(which borrowers and savers bear). As the FSS ignores the subsidy implied in exemption
from RR, the FSS measure is unchanged. In contrast, as illustrated in table 5, the SDI value
has increased. The increase in the SDI measure reflects the fact that given RR, the exemption
granted to the MFI implies that it is now more subsidy-dependent.
11
Figure 2 on page 145 presents a graph of the sensitivity of the SDI measure to the yield on the MFI’s LP. This
graph is based on data related to the hypothetical MFI presented in this section. As illustrated in figure 2, the
SDI is zero and the MFI is fully self-sufficient, when the yield on LP is 17.75%.
24
Table 5: The revised SDI under scenario B (Introduction RR of 10%)
The SDI
The SDI
formula is: iLP
SSDI
The subsidy,
S, is:
30010%)33.13100(%8%33.13500
13.33%10%-100
2%10%
100
costs servicing depositson ratemarket
])[()(
S
RRm
KPmEcmAS
The first stage
SDI: %75.3
800
30
LP
S
The complete
SDI is: %25
120
30
%15800
30
iLP
S
As shown in table 5, the subsidy per dollar of LP increased from 2.75 cent to 3.75 cent, and
the complete SDI measure increased from 18.3% to 25%. Thus the yield obtained on LP had
to increase by 25% from 15% to (15%*1.25) = 18.75% in order for the MFI to achieve full
self sustainability. Alternatively interpreted, society provided 25 cents of subsidy per each
dollar of interest income paid by the MFI’s clients/borrowers.
To further illustrate the superiority of the SDI method over the FSS method scenario C is
introduced. The following changes to the base case assumptions are made:
1. Assumption number 9 is retained. Thus it is again assumed that no RR exist.
2. The MFI replaces all concessionary borrowings with equity. Thus the value of
concessionary borrowings is reduced by 500 to zero while the value of equity increases by
500 from 100 to 600. As result, the equity-to-assets ratio has changed from: %10000,1
100
to: %60000,1
600 .
3. Assumption number 11 is changed. It is now assumed that administration costs are 8.8%
of total assets. This rise in administration costs is designed to ensure, for simplicity, that
accounting profit is unchanged despite the change in the equity-to-assets ratio.
The changes introduced alter the equity-to-assets ratio of the hypothetical MFI while
maintaining total accounting costs and accounting profit unchanged. Table 6 sets out the
revised financial statements and the revised SDI and FSS under scenario C.

25
Table 6: Revised Financial Statements and comparison of SDI and FSS under scenario C
Balance Sheet
Assets Liabilities & Equity
Cash 100 Demand accounts 100
Short term securities 50 Savings accounts 300
Loan Portfolio (LP) 800 Concessionary borrowed funds 0
Fixed assets 50 Equity 600
Total assets 1,000 Total liabilities & equity 1,000
Income Statement
Interest earned
On loans (15% * 800) 120
On securities (16% * 50) 8
Total Income 128
Interest paid
On savings accounts (10% * 300) 30
On borrowed funds (8% * 0) 0
Total interest paid (30)
Gross margin 98
Administrative costs (8.8% * 1,000) (88)
Profit (before tax) 10

26
Table 6: Revised Financial Statements and comparison of SDI and FSS under scenario C
(continued)
The SDI
The SDI
formula is: iLP
SSDI
The subsidy,
S, is: 62010%)12600(%8%120
12%2%10% costs servicing depositson ratemarket
])[()(
S
m
KPmEcmAS
The first
stage SDI: %75.7
800
62
LP
S
The complete
SDI is: %7.51
120
62
%15800
62
iLP
S
The FSS
Expense Operating ExpenseProvision LossLoan Net Expense FinancialAdjusted
Revenue Financial Adjusted
FSS
Adjustment for concessionary borrowing: 0%8%100
Total adjusted costs are: 11808830
The FSS is: %5.108
118
128
Costs Adjusted
Revenue AdustedFSS
It is clear that the MFI under scenario C became less cost-effective and more subsidy
dependent (or less financially self sufficient) compared with scenario A. This is because
neither LP nor the yield obtained on LP, increased, but the administrative costs went up from
4.8% to 8.8% of total assets.
27
Comparison of scenario A in table 4 and scenario C in table 6 shows that the revised FSS
value improved from 100% to 108.5%, indicating that the MFI became more self sufficient.
In reality the opposite occurred. The main reason for this failure is that the MFI replaced
concessionary borrowings with equity. According to the FSS, the shift of 500 from
concessionary borrowings to equity fully eliminated the financial cost of concessionary
borrowings and attached a cost of zero to the increase in equity. This in turn, created a
distorted picture according to which a real increase in subsidy dependence is considered by
the FSS as improvement in self sufficiency.
In contrast to the FSS, the revised SDI value reflects the increase in subsidy dependence of
the MFI. The SDI charges a real opportunity cost to equity, while the FSS ignores the fact
that equity has an opportunity cost and therefore distorts and overestimates the MFI’s degree
of self sufficiency. The first stage SDI indicates that the subsidy per dollar of outstanding LP
increased from 2.75 cent to 7.75 cent, mirroring the substantial increase in administration
costs that were not backed by increase in LP. The complete SDI increased from 18.3% to
51.7%, a significant change of nearly 200%. The revised SDI measure indicates that the
yield on LP had to increase by 51.7%, from 15% to 22.7% for the MFI to be fully self
sufficient.
6. Conclusions
The FSS and the SDI are two popular methods used to measure the self sufficiency of MFIs.
Both methods have gained much popularity in recent years with the shift towards
commercialisation of the industry.
The current paper reviews the two methods. It finds that the FSS measure tends to
underestimate the subsidy dependence of the MFI. Alternatively put, the FSS measure tends
to overestimates the self-sufficiency of the MFI analyzed. This deficiency is demonstrated
with numerical illustrations showing that it is not a coincidence but the result of inherent traits
of the FSS methodology.
The paper discusses the main deficiencies of the FSS, which include the following:
A. When measuring the subsidy attributed to concessionary funds, the FSS methodology
ignores the significant administration costs of mobilizing and servicing deposits.
Accurate measure of the subsidy attributed to concessionary funds should consider the
administration costs associated with mobilizing and servicing deposits in determining the
opportunity cost of these funds.
B. The FSS measure treats equity as a cost free item. The only charge applies to equity
capital is a charge to account for inflation-related erosion of net monetary assets.
C. The FSS methodology ignores the cost of RR. MFIs are often exempt from RR applicable
to other FIs in the country concerned. Ignoring this exemption may therefore lead to
underestimation of the subsidy received by MFIs.
D. The FSS methodology does not distinguish between an MFI that generates its income by
lending to target clientele and an MFI that uses the subsidies received to generate income
from other sources. This is despite the fact that subsidies are clearly granted to MFIs for
the purpose of lending to the target clientele.

28
The deficiencies of the FSS methodology should convince society and donors to use the SDI
methodology to measure MFI performance. The SDI measures the value of subsidies against
the MFI’s LP and against the yield obtained on its LP. It is consistent with the objective of
supporting MFIs that benefit society, rather than supporting MFIs that “consume” subsidies
while drifting away from their mission.
The advantage of the SDI method over the FSS method is that it does not suffer from the
deficiencies that characterise the FSS method. It therefore more accurately measures the real
level of self-sufficiency of MFIs, and it tends to indicate higher level of subsidy dependence
compared with the FSS method. When real progress towards self sufficiency of an MFI is
measured over time, the SDI provides a more accurate picture of the progress compared with
the biased FSS method.
To obtain a complete view of MFI performance, the use of the OI is suggested alongside the
SDI. The OI measures the extent to which the MFI succeeded in delivering the products it was
set to deliver, to the target clientele. It is a flexible arbitrary index, designed to reflect the
priorities of those that foot the bill of supporting MFIs. The OI gives an indication of the
social desirability of supporting MFIs compared to achieving the desired social goals by other
means.
Using the SDI-OI framework should contribute substantially to understanding MFI
performance. In particular, using the SDI-OI framework is useful in highlighting the cost of
each product that is delivered by the MFI to the target clientele. Measuring the cost of each
product delivered by the MFI is important given that resources are limited, and funds
tunnelled to support MFIs could have instead been used to support the target clientele via
alternative instruments.
The SDI-OI framework should be used to review and analyze past performance as well as to
plan and budget future operations. The framework can assist in the task of allocating scarce
public funds to MFIs that are charged with achieving socially justified objectives.

29
References
Dowla, A. and Alamgir, D. (2003), ‘From Microcredit to Microfinance: Evaluation of
Savings Products by MFIs in Bangladesh’, Journal of International Development,
Vol. 15, No. 8, pp. 969-988.
Economist (2005), ‘The Hidden Wealth of the Poor’, Economist, November 5, Vol. 377 Iss.
8451, p. 3.
Francisco, M., Mascaró, Y., Mendoza, J.C. and Yaron, J. (2007), ‘Measuring Performance
and the Achievement of Social Objectives of Development Financial Institutions
(DFIs)’, World Bank Working Paper, forthcoming.
Hirschland, M. (2003), ‘Serving Small Depositors: Overcoming the Obstacles, Recognizing
the Tradeoffs’, MicroBanking Bulletin, Iss. 9, (July), pp. 3-8.
International Monetary Fund (2006), International Financial Statistics, Washington, DC:
IMF.
Ledgerwood, J. (1998), Microfinance Handbook: An Institutional and Financial Perspective,
Washington, DC: World Bank.
MIX (2005), The MicroBanking Bulletin: Special Edition on Financing, August, Iss. 11.
MIX (2006), The MicroBanking Bulletin: Focus on MFI Performance by Region, April, Iss.
12.
O’Brien, B. (2006), ‘Valuing Microfinance Institutions’, Savings and Development, Vol. 30,
No. 3, pp 275-296.
Richardson, D. (2003), ‘Going to the Barricades with Microsavings Mobilization: A View of
the Real Costs from the Trenches’, MicroBanking Bulletin, Iss. 9, (July), pp. 9-13.
Robinson, M. (1997), ‘Introducing Savings in Microfinance Institutions: When and How’,
CGAP Focus Notes, No. 8.
Schreiner, M. (2002), ‘Aspects of Outreach: A Framework for the Discussion of the Social
Benefits of Microfinance’, Journal of International Development, Vol. 14, No. 5,
pp.591-603.
Schreiner, M. and Yaron, J. (2001), Development Finance Institutions. Measuring their
Subsidy, Washington, DC: World Bank.
Stewart, G.B. (1991), The Quest for Value, New York: Harper Business.
Tully, S. (1993), ‘The Real Key to Creating Wealth’, Fortune, September 20, Vol. 128, Iss. 6,
pp. 38-44.
Yaron, J. (1992), ‘Assessing Development Finance Institutions: A Public Interest Analysis’,
World Bank Discussion Paper 174, Washington, DC: World Bank.
Yaron, J., McDonald P.B. and Piprek, G.L. (1997), ‘Rural Finance: Issues, Design, and Best
Practices’, Environmentally and Socially Sustainable Development Studies and
Monographs Series 14, Washington, DC: World Bank.