determination of the porosity of plga microparticles by ... paper determination of the porosity of...
TRANSCRIPT
RESEARCH PAPER
Determination of the Porosity of PLGA Microparticlesby Tracking Their Sedimentation Velocity Using a Flow ImagingMicroscope (FlowCAM)
A. S. Sediq1 & S. K. D. Waasdorp1 & M. R. Nejadnik1 & M. M. C. van Beers1,2 & J. Meulenaar2 &
R. Verrijk2 & W. Jiskoot1
Received: 10 December 2016 /Accepted: 8 February 2017 /Published online: 17 February 2017# The Author(s) 2017. This article is published with open access at SpringerLink.com
ABSTRACTPurpose To investigate whether particle sedimentation veloc-ity tracking using a flow imaging microscope (FlowCAM) canbe used to determine microparticle porosity.Methods Two different methods were explored. In the firstmethod the sedimentation rate of microparticles was trackedin suspending media with different densities. The porosity wascalculated from the average apparent density of the particlesderived by inter- or extrapolation to the density of asuspending medium in which the sedimentation velocity waszero. In the second method, the microparticle size and sedi-mentation velocity in one suspending fluid were used to cal-culate the density and porosity of individual particles by usingthe Stokes’ law of sedimentation.Results Polystyrene beads of different sizes were used for thedevelopment, optimization and validation of the methods. Forboth methods we found porosity values that were in excellentagreement with the expected values. Both methods were ap-plied to determine the porosity of three PLGA microparticlebatches with different porosities (between about 4 and 52%).With both methods we obtained microparticle porosity valuessimilar to those obtained by mercury intrusion porosimetry.Conclusions We developed two methods to determine aver-age microparticle density and porosity by sedimentation ve-locity tracking, using only a few milligrams of powder.
KEY WORDS flow imagingmicroscope . FlowCAM .particle analysis . PLGAmicroparticles . porosity
ABBREVIATIONSABD Area based diameterAPI Active pharmaceutical ingredientFDA Food and Drug AdministrationFOV Field of viewMIP Mercury intrusion porosimetryPBS Phosphate buffered salinePBS-T PBS containing 0.01% (w/v) polysorbate 80PLGA Poly lactic-co-glycolic acidSEM Scanning electron microscopy
INTRODUCTION
Formulating active pharmaceutical ingredients (API) in con-trolled release systems is a potent strategy to maintain druglevels for prolonged periods within the therapeutic window,which may increase the efficiency of therapy, reduce the costsand improve patient compliance and comfort (1). Owing totheir long clinical experience and favorable performance interms of biodegradability and biocompatibility, PLGAmicro-particles fulfill the needs for controlled release in the area ofparenteral pharmaceutical formulations, with a number ofFDA approved drug products on the market today (2).
The porosity or void fraction of poly lactic-co-glycolic acid(PLGA) microparticles is a critical parameter known to affectthe release kinetics of encapsulated drugs (3–5). Current ap-proaches to determine the porosity of particulate drug deliv-ery systems are based on established methods used in agricul-tural, petrochemical and constructional engineering (6).Among the available methods, mercury intrusion porosimetry(MIP) and gas (nitrogen) adsorption based methods are themost common and informative ones, because both can
Electronic supplementary material The online version of this article(doi:10.1007/s11095-017-2120-8) contains supplementary material, which isavailable to authorized users.
* W. [email protected]
1 Division of Drug Delivery Technology, Cluster BioTherapeutics, LeidenAcademic Centre for Drug Research (LACDR), Leiden University,Leiden, The Netherlands
2 Dr. Reddy’s Laboratories Ltd., IPDO, Leiden, The Netherlands
Pharm Res (2017) 34:1104–1114DOI 10.1007/s11095-017-2120-8
measure the pore size and its distribution. In addition, mer-cury porosimetry has the advantage of having certified refer-ence material and standard measurement protocols (7).However, each of these methods has a number of major draw-backs. For instance, both methods require large amounts ofsample (200–300 mg) for a single measurement. In addition,with MIP the difficulties are seen in distinguishing intra- andinterparticulate pores (8). Besides, presence of enclosed poresmay need additional MIP measurements with grinded mate-rial (9) and ink-bottle shaped and interconnected pores canlead to underestimation of the pore size (8). Toxic metal wasteis yet another reason that would make the application of MIPless favorable. In contrast to MIP, with gas adsorptionmethods both open and enclosed pores are measured; howev-er, the process of pressure equilibration may be very slow,resulting in long-lasting measurements for a single sample.Last but not least, although fully automated equipment iscommercially available for both methods, such equipment isexpensive and not available in many pharmaceuticallaboratories.
Taking into account the drawbacks of the methods de-scribed above, there is need for a more straightforward meth-od requiring small amounts of sample for deriving the overallporosity of (pharmaceutical) particulate systems. Consideringthe developments in flow imaging instruments with respect toimage quality, sizing precision and accuracy (10) and theirincreasingly widespread use in pharmaceutical laboratories,we have evaluated sedimentation velocity tracking using aflow imaging microscope (FlowCAM) for measuring the den-sity and porosity of PLGA microparticles. To our knowledge,in spite of the simplicity of the concept, a sedimentation basedapproach has not been used before to measure particle poros-ity. The velocity of a settling particle depends among otherparameters on the size of the particle and the density differ-ence between the liquid and the particle (11). The density ofeach component of a microparticle (e.g., PLGA matrix, drug,and liquid or air filling the pores) contributes proportionally tothe total microparticle density, and can therefore be used tocalculate the porosity of a microparticle.
Here we present two methods using a FlowCAM to deter-mine the porosity of PLGA microparticles. The results showthat both methods generate porosity values close to those ob-tained with MIP, but require much smaller amounts ofsample.
MATERIALS AND METHODS
Materials
Cesium chloride (CsCl), polysorbate 80 and ethanol were ob-tained from Sigma (Sigma-Aldrich, Steinheim, Germany).Phosphate buffered saline (PBS; 8.2 g/L NaCl, 3.1 g/L
Na2HPO4.12H2O, 0.3 g/L NaH2PO4.2H2O, pH 7.4) waspurchased from Braun (B. Braun Melsungen AG, Germany)and filtered with a 0.22-μm polyethersulfone-based syringe-driven filter unit (Millex GP, Millipore, Carrigtwohill,Ireland). Ultrapure water (18.2 MΩ.cm) was dispensed byusing a Purelab Ultra water purification system (ELGALabWater, Marlow, UK). Non-porous polystyrene sizingstandards of different sizes (29.8±0.4, 50.2±0.5 and 69.1± 0.8 μm) were purchased from Duke Scientific (throughThermo Scientific, Fremont, CA, USA). Three batches ofdried PLGA microparticles were kindly provided by Dr.Reddy’s Laboratories Ltd. (IPDO, Leiden, the Netherlands).One of these batches (batch 1) contained API. The other twobatches (2 and 3) were loaded with different amounts of anAPI. The microparticle batches had different porosities asmeasured with MIP, namely 4.0, 21.6, and 51.9% for batch1, 2 and 3, respectively. The residual water content and resid-ual organic solvent content of each PLGAmicroparticle batchwere found to be lower than 0.5% (w/w) and were not takeninto account.
Surface Morphometry Using Scanning ElectronMicroscopy
Scanning electron microscopy (SEM, Nova NanoSEM, FEI,Eindhoven, the Netherlands) was used for high resolution im-aging of the surface of PLGA microparticles. Microparticleswere coated with a thin layer of gold in order to increase thesurface conductivity. The instrument was operated at 15 kVand images were taken at magnifications between 50 and400×.
Sample Preparation for Sedimentation VelocityTracking
Solutions of PBS containing 0.01% (w/v) polysorbate 80(PBS-T) were prepared with varying fluid densities by addingdifferent concentrations of CsCl. Polysorbate 80 was includedto facilitate wetting of the microparticles. The concentrationof CsCl ranged from 0–75% (w/w), resulting in fluid densitiesranging from about 1000–1655 kg/m3. The density and vis-cosity of the used suspending fluids were observed to be de-pendent on the concentration of CsCl, and were taken intoaccount in further calculations. All the measurements wereperformed at room temperature. A few drops of the concen-trated polystyrene sizing standards were added to 10 mL ofthe PBS-T/CsCl solutions. For each polystyrene standard sus-pension, the sedimentation of 50–100 particles was trackedusing FlowCAM. In order to study PLGA microparticle sed-imentation, an appropriate amount of microparticles wassuspended in PBS-T/CsCl to achieve a microparticle concen-tration of about 0.25 mg/mL (corresponding to approximate-ly 7000–15,000 particle counts/mL). These relatively low
Determination of the Porosity of PLGA Microparticles 1105
particle concentrations were chosen in order to avoid physicalagglomeration and optical coincidence of settling particles.After addition of the suspending medium to the microparti-cles, the suspension was sonicated for 20 min and left at am-bient conditions for at least 3 h prior to analysis.
FlowCAM set-up for Sedimentation Velocity Tracking
A FlowCAM VS1 system (Fluid Imaging Technologies,Yarmouth, ME, USA) equipped with a 300-μm Field ofView (FOV300; 300 μm depth and 1500 μm width) cell and4× magn i f i ca t i on l en s was u sed in th i s s tudy .VisualSpreadsheet software version 3 was used to control thesystem and to process the data. Prior to each measurement,the flow cell was rinsed with 2 mL particle-free suspendingmedium corresponding to the sample being measured. Thebackground was calibrated by manually priming 0.5 mL ofthe same particle-free suspending medium. Hereafter, 1.5 mLof the sample was loaded and FlowCAM measurement wasstarted with a flow rate of 0.20 mL/min and a camera rate of10 frames/s. As soon as the sample had completely filled theflow cell and tubing (based on the volume estimated from theflow cell and tubing dimensions), the tubing was disconnectedfrom the pump and both tubing ends were clamped to create aclosed system in which there is no liquid flow. The analysis wasstopped manually as soon as a sufficient number of particleswas tracked (50 – 100 particles). The sample volume was set to10 mL in the software settings to avoid premature, automatictermination of the analysis.
Sedimentation Velocity from FlowCAM Data
In order to optimize the measurement and to minimize therisk of tracking impurities or particles with anomalous settlingbehavior, the following particle inclusion criteria were used:
1. Edge gradient (average intensity of the pixels making upthe outside border of a particle) values between 100–200 a.u. and aspect ratio values above 0.9. This criterionselects only particles that are in focus.
2. A distance of at least twice the diameter between theleft/right edge of the particle and vertical sides of the flowcell (determined with the help of X-coordinate and theknown width of the field of view). This criterion discardsparticles that undergo retardation in velocity due to theleft and right edges of the flow cell.
3. A straight vertical movement path of the particle foundwhen the X- and Y-coordinates at each image is plotted(i.e., X-coordinate does not change more than 5 pixelsduring the entire track).
4. A constant particle displacement as a function of time.
In this way, only accurately sized particles without anyunordinary settling motion were used for sedimentation veloc-ity tracking.
The particles with properties that met the aforementionedcriteria were extracted from the entire set of raw data. The Y-coordinate values (expressed in pixels) were converted to metricdistances, with the use of image scale (named calibration factorin VisualSpreadsheet). After plotting the time (in seconds)against metric displacement, the velocity was found as slope ofthe linear regression with the help of Excel 2010 software.
In addition, the average values for properties such as areabased diameter (ABD, the diameter based on a circle with anarea that is equal to the projected particle area) and aspectratio were extracted for each tracked particle.
Method I: PLGA Microparticle Porosityfrom Sedimentation Velocity in Fluids with VaryingDensities (Density-Matching Method)
The first approach that was used to derive the density and,subsequently, the porosity of analyzed particles consisted oftracking the individual particle sedimentation velocity in fluidswith different densities. For each bead or microparticle sus-pension, the sedimentation velocity of individual particles wasderived as described above. In order to normalize the derivedvelocities (v, in m/s) for particle size, they were divided by thecorresponding average square diameter (calculated fromABDvalues; d2, in m2). The resulting particle size-normalized sed-imentation velocity (v/d2, in m−1s−1) values were based on therelation between velocity and diameter found in Stokes’ law ofsedimentation, as shown in Eq. 1:
v ¼ρp−ρ f
� �18μ
gd2 ð1Þ
where ρp and ρf are the particle and fluid densities (in kg/m3),
respectively, μ is the dynamic viscosity of the fluid (in kg/m.s)and g is the gravitational acceleration (m/s2). Note that(particle size-normalized) sedimentation velocity values willbe positive for settling particles and negative for floatingparticles.
Subsequently, the average v/d2 values for each bead size orPLGAmicroparticle batch in different suspendingmedia wereplotted against the density of the corresponding suspendingmedium. Assuming that the particle would stagnate when itsdensity is equal to that of the liquid, the intercept of a linearregression with the X-axis (density axis) was taken as the av-erage particle density of the concerning polystyrene bead orPLGA microparticle batch. In case of a porous particle con-taining an API, the particle density will be the sum of thefractional densities of (i) the matrix (fPLGA×ρPLGA), (ii) theAPI (fAPI× ρAPI) and (iii) the pores (fpore× ρpore). Assumingthat the pores are filled with air (i.e., ρpore = 0; further
1106 Sediq et al.
explained in the “Discussion” section), Eq. 2 was used to cal-culate the density derived particle porosity (φ in%) (6):
φ ¼ ρsolid−ρpρsolid
100% ð2Þ
where ρsolid ¼ f API � ρAPI þ f PLGA � ρPLGA in which ρsolid isthe density of the solids, i.e., API and the PLGA matrix, andfAPI and fPLGA are the weight fractions of the API and thePLGA, respectively, in the solids content (derived from thedrug loading in percent).
Method II: PLGA Microparticle Porosityfrom Sedimentation Velocity Using Stokes’ law (StokesDerived Method)
For the second method only the particles tracked in asuspending fluid having a density close, but not equal, to theexpected particle density were used. As compared to highsedimentation velocities, low sedimentation velocities resultin more accurate density determinations, because of the largenumber of 2D-coordinate data points gained from a largenumber of images taken during the particle tracking timelapse. Subsequently, the density and resulting porosity of in-dividual particles were calculated, by means of Stokes’ law.
Bach et al. derived equations for calculating the density of asettling particle in a fluid (12). Here, we used the same ap-proach, but with porosity of the particle as the final outcome.The Stokes’ law of sedimentation was used as a starting pointfor the calculations. This formula gives a mathematical de-scription for the drag force exerted on spherical objects whenthe Reynolds number is very small (Re<< 0.1) (13). TheReynolds numbers associated with the relative flow of particlestracked in our study were calculated to be<< 0.01, usingEq. 3:
Re ¼ vdρ f
μð3Þ
Incorporating equivalent of ρp from Eq. 2 in Eq. 1, andrewriting it to porosity (%) leaves us with the following:
φ ¼ρsolid− ρ f ¼
18μvgd2
� �
ρsolid100% ð4Þ
In our calculations, in case of particle diameters equal to orlarger than 50 μm we also applied a correction for the sedi-mentation velocity with respect to the retarding effect by thepresence of the FlowCAM flow cell wall:
vwc ¼ vmeasured
1−kdD
� � ð5Þ
Here, the experimentally measured velocity (vmeasured) iscorrected for coefficient of drag (k), particle diameter (d) andthe shortest distance of the particle edge and the wall (D), toeventually gain the velocity corrected for the wall effect (vwc).The coefficient of drag depends on the shape of the spacewhere settling takes place, and had a value of 1.004 (12).
We also took into account the effect of particle shape on thesedimentation velocity. For this purpose, based on theFlowCAM and SEM images, we have used the correctionsspecifically for prolate ellipsoid shapes (14):
v ¼ vwc
83
β2−1� �
β 3β2−2� �
β2−1ð Þ12
tan−1 β2−1� �1
2� �
−β
ð6Þ
where β is the reciprocal aspect ratio. As seen in Eq. 6, thefinal velocity (v) is achieved by correcting the wall-effect-corrected velocity (vwc) using the average aspect ratio of eachparticle from the analyzed FlowCAM data.
RESULTS
Sedimentation Velocity Data Processing and Analysisset-up Using Polystyrene Beads
FlowCAM was used to determine the sedimentation velocityof microparticles in aqueous liquids. The velocity value wasthen used to derive the density of the microparticles. From thedensity and known composition of the microparticles the po-rosity was calculated. Derivation of the sedimentation criteriato include a particle in the density calculations, corrections forinfluential parameters on the sedimentation (e.g., wall andshape effect) and the validation of the method were studiedand performed by using polystyrene beads of three differentsizes. In the supplementary document the development of thefirst selection criterion (Supplementary Figure S1) and thewall correction (Supplementary Figure S2) are explained indetail.
Figure 1 shows that the experimental sedimentation veloc-ities (corrected for the wall effect) of all the polystyrene beadsare in excellent correspondence with the theoretical values.This indicates that determining the density through measure-ment of the sedimentation velocity using a FlowCAM is pos-sible for particles widely ranging in size and density difference(with respect to the suspending liquid), when applying theinclusion criteria named in “Materials and Methods” section.
The complete data set of the particles fulfilling the inclusioncriteria was extracted from the raw data and the physicaldisplacement through the field of view was visualized by plot-ting the X- and Y-coordinates, as shown in Fig. 2a. At this
Determination of the Porosity of PLGA Microparticles 1107
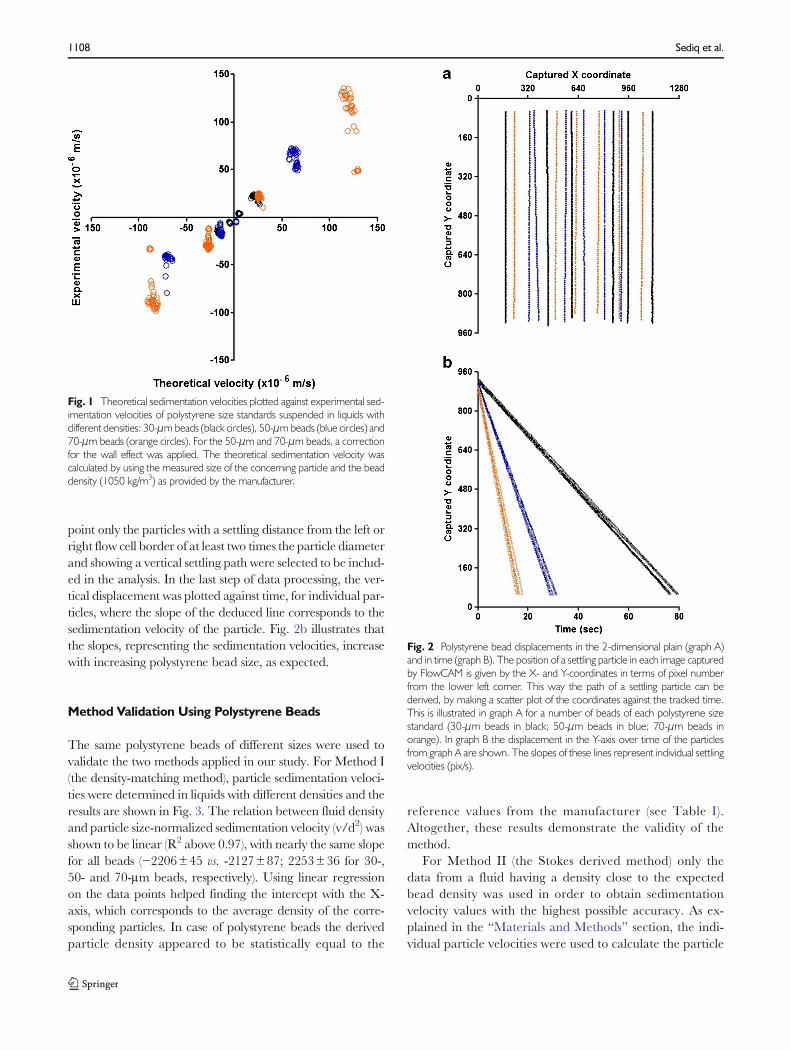
point only the particles with a settling distance from the left orright flow cell border of at least two times the particle diameterand showing a vertical settling path were selected to be includ-ed in the analysis. In the last step of data processing, the ver-tical displacement was plotted against time, for individual par-ticles, where the slope of the deduced line corresponds to thesedimentation velocity of the particle. Fig. 2b illustrates thatthe slopes, representing the sedimentation velocities, increasewith increasing polystyrene bead size, as expected.
Method Validation Using Polystyrene Beads
The same polystyrene beads of different sizes were used tovalidate the two methods applied in our study. For Method I(the density-matching method), particle sedimentation veloci-ties were determined in liquids with different densities and theresults are shown in Fig. 3. The relation between fluid densityand particle size-normalized sedimentation velocity (v/d2) wasshown to be linear (R2 above 0.97), with nearly the same slopefor all beads (−2206±45 vs. -2127±87; 2253±36 for 30-,50- and 70-μm beads, respectively). Using linear regressionon the data points helped finding the intercept with the X-axis, which corresponds to the average density of the corre-sponding particles. In case of polystyrene beads the derivedparticle density appeared to be statistically equal to the
reference values from the manufacturer (see Table I).Altogether, these results demonstrate the validity of themethod.
For Method II (the Stokes derived method) only thedata from a fluid having a density close to the expectedbead density was used in order to obtain sedimentationvelocity values with the highest possible accuracy. As ex-plained in the “Materials and Methods” section, the indi-vidual particle velocities were used to calculate the particle
Fig. 2 Polystyrene bead displacements in the 2-dimensional plain (graph A)and in time (graph B). The position of a settling particle in each image capturedby FlowCAM is given by the X- and Y-coordinates in terms of pixel numberfrom the lower left corner. This way the path of a settling particle can bederived, by making a scatter plot of the coordinates against the tracked time.This is illustrated in graph A for a number of beads of each polystyrene sizestandard (30-μm beads in black; 50-μm beads in blue; 70-μm beads inorange). In graph B the displacement in the Y-axis over time of the particlesfrom graph A are shown. The slopes of these lines represent individual settlingvelocities (pix/s).
Fig. 1 Theoretical sedimentation velocities plotted against experimental sed-imentation velocities of polystyrene size standards suspended in liquids withdifferent densities: 30-μmbeads (black circles), 50-μmbeads (blue circles) and70-μm beads (orange circles). For the 50-μm and 70-μm beads, a correctionfor the wall effect was applied. The theoretical sedimentation velocity wascalculated by using the measured size of the concerning particle and the beaddensity (1050 kg/m3) as provided by the manufacturer.
1108 Sediq et al.
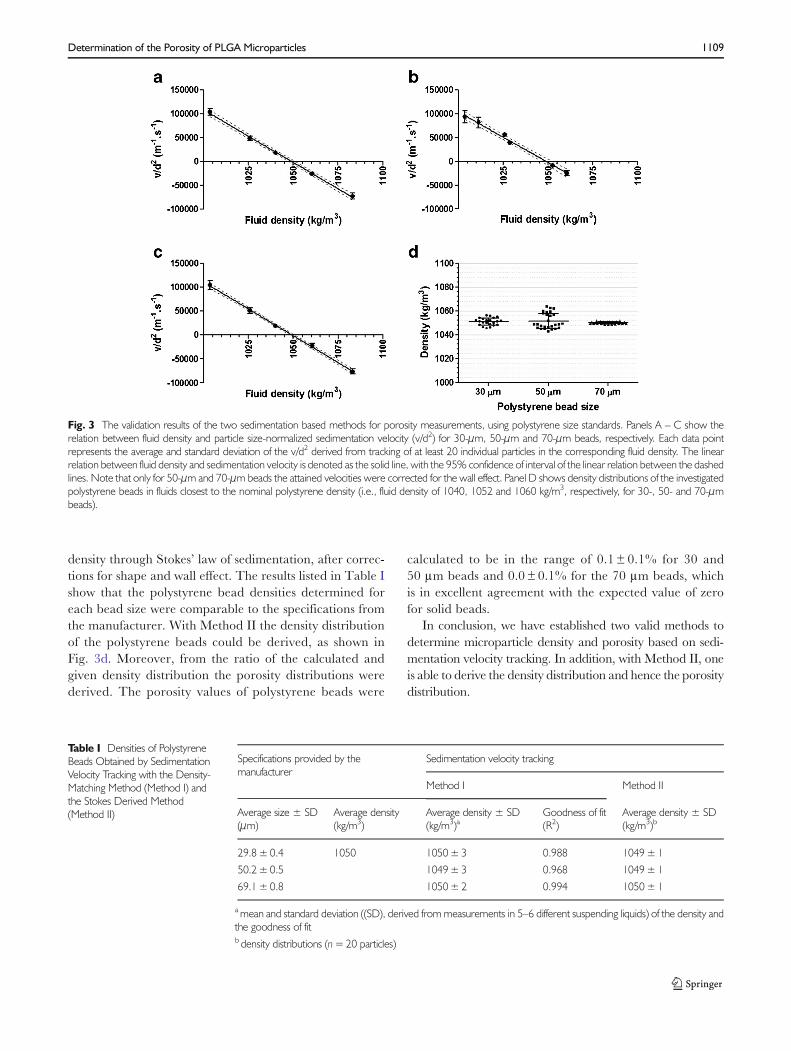
density through Stokes’ law of sedimentation, after correc-tions for shape and wall effect. The results listed in Table Ishow that the polystyrene bead densities determined foreach bead size were comparable to the specifications fromthe manufacturer. With Method II the density distributionof the polystyrene beads could be derived, as shown inFig. 3d. Moreover, from the ratio of the calculated andgiven density distribution the porosity distributions werederived. The porosity values of polystyrene beads were
calculated to be in the range of 0.1 ± 0.1% for 30 and50 μm beads and 0.0± 0.1% for the 70 μm beads, whichis in excellent agreement with the expected value of zerofor solid beads.
In conclusion, we have established two valid methods todetermine microparticle density and porosity based on sedi-mentation velocity tracking. In addition, with Method II, oneis able to derive the density distribution and hence the porositydistribution.
Fig. 3 The validation results of the two sedimentation based methods for porosity measurements, using polystyrene size standards. Panels A – C show therelation between fluid density and particle size-normalized sedimentation velocity (v/d2) for 30-μm, 50-μm and 70-μm beads, respectively. Each data pointrepresents the average and standard deviation of the v/d2 derived from tracking of at least 20 individual particles in the corresponding fluid density. The linearrelation between fluid density and sedimentation velocity is denoted as the solid line, with the 95% confidence of interval of the linear relation between the dashedlines. Note that only for 50-μm and 70-μm beads the attained velocities were corrected for the wall effect. Panel D shows density distributions of the investigatedpolystyrene beads in fluids closest to the nominal polystyrene density (i.e., fluid density of 1040, 1052 and 1060 kg/m3, respectively, for 30-, 50- and 70-μmbeads).
Table I Densities of PolystyreneBeads Obtained by SedimentationVelocity Tracking with the Density-Matching Method (Method I) andthe Stokes Derived Method(Method II)
Specifications provided by themanufacturer
Sedimentation velocity tracking
Method I Method II
Average size ± SD(μm)
Average density(kg/m3)
Average density ± SD(kg/m3)a
Goodness of fit(R2)
Average density ± SD(kg/m3)b
29.8±0.4 1050 1050±3 0.988 1049±1
50.2±0.5 1049±3 0.968 1049±1
69.1±0.8 1050±2 0.994 1050±1
amean and standard deviation ((SD), derived frommeasurements in 5–6 different suspending liquids) of the density andthe goodness of fitb density distributions (n=20 particles)
Determination of the Porosity of PLGA Microparticles 1109
Sedimentation Velocity Tracking for DeterminingPLGA Microparticle Porosity
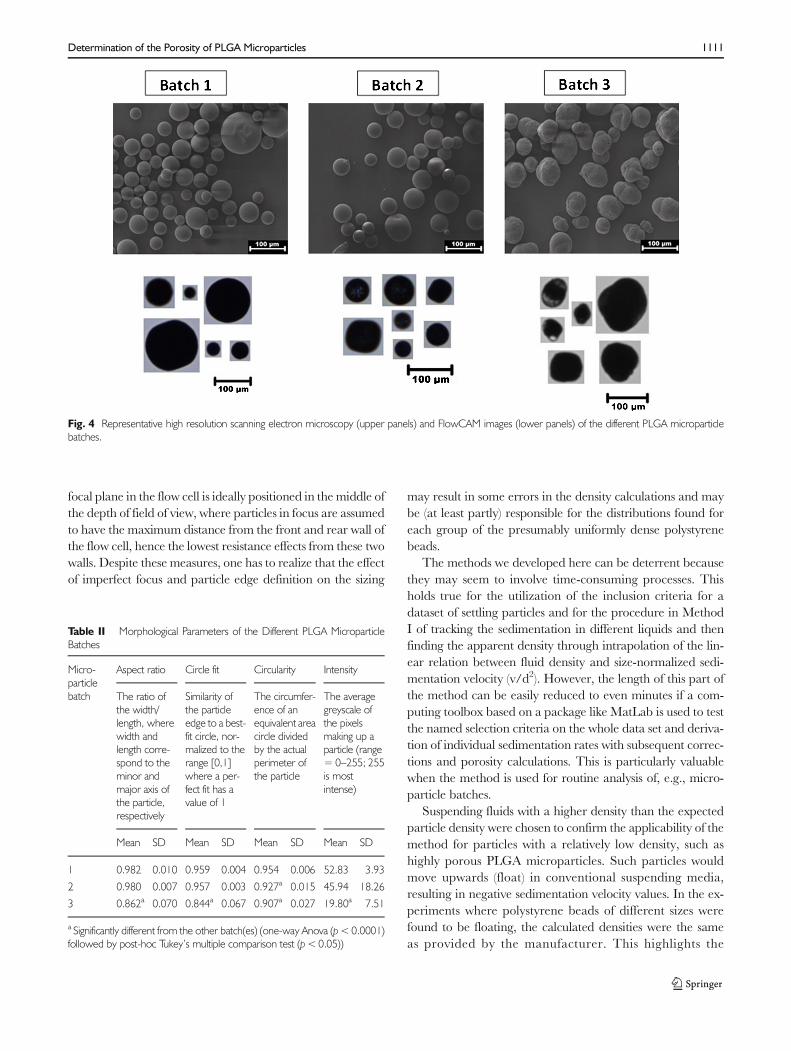
The shape of the PLGA microparticles was studied by usingthe images and morphological data provided by FlowCAM aswell as with SEM imaging (Fig. 4). Batches 1 and 2 appearedto have predominantly spherical particles with a smooth sur-face, whereas batch 3 contained mainly misshaped particles,with highly irregular surfaces. Also with FlowCAM, thesemorphological properties were distinguishable, albeit with aless detailed resolution compared to SEM. These differenceswere apparent from a number of morphological descriptors,in particular aspect ratio, circle fit, circularity, intensity andtransparency (Table II).
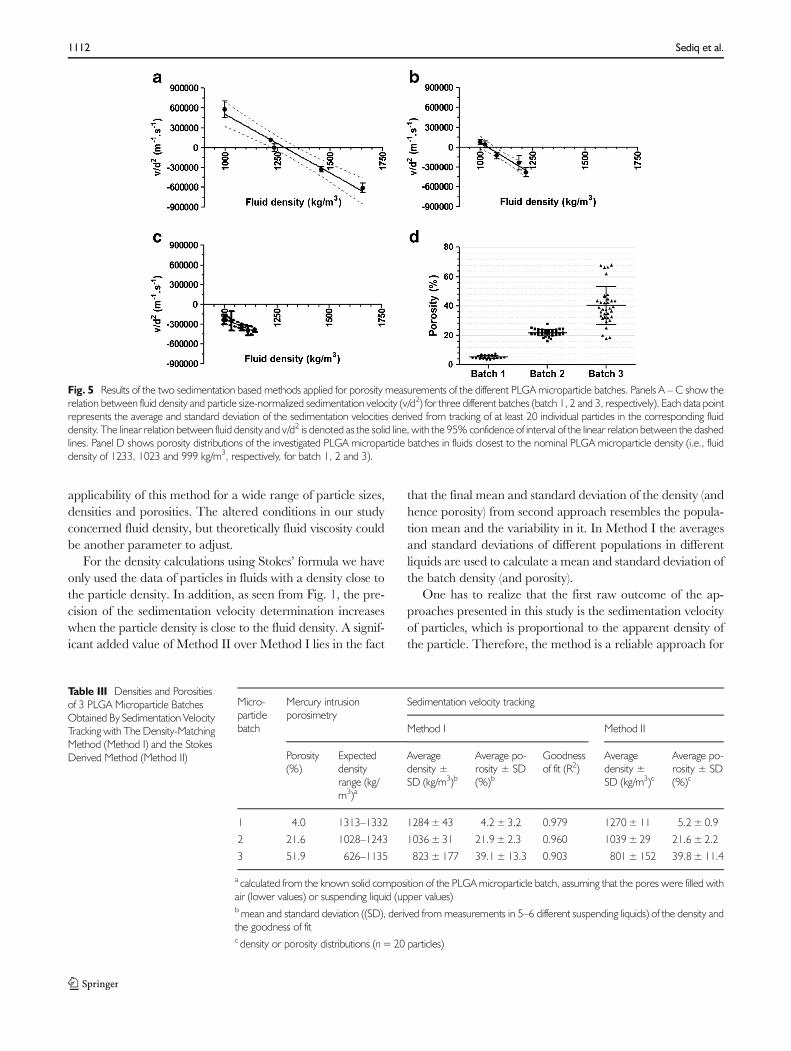
The two validated methods were then used to obtain themicroparticle porosity, derived from the density (calculated asshown in the “Materials andMethods” section), for 3 differentPLGA microparticle batches. As shown in Fig. 5a–c, for eachof the batches a linear relation was found between fluid den-sity and average v/d2, with a R2 value above 0.9. According tothe density-matching method (Method I), the regression mod-el for each batch was used to find the X-intercept,representing the average microparticle density, which resultedfor all batches in a similar porosity value as measured by MIP(Table III). Noticeably, compared to the other two batches,batch 3 showed a relatively high standard deviation for theaverage porosity. In addition, the determined porosity ofbatch 3 tended to be lower than that obtained by MIP.
For all batches, the Stokes derived method (Method II)showed similar porosity values as compared to those obtainedbyMethod I. For this purpose the results from the fluid densityclosest to the matching density value (data point closest to theX-intercept in Figure A-C) were used. Furthermore, for eachbatch the porosity distribution was derived. As shown inFig. 5d, a relatively broad porosity distribution was foundfor batch 3 as compared to the other batches.
DISCUSSION
With the increasing need for controlled drug release formula-tions, the characterization of these systems becomes increas-ingly important. This holds true in particular for the determi-nation of the porosity, for which complex and material-consuming methods such as MIP and gas adsorption are gen-erally used. In our study we have evaluated the feasibility todetermine the porosity of individual microparticles from theirsedimentation rate in a liquid. Because of its reported appli-cability for sedimentation rate determination (12), we selecteda FlowCAM for our investigation. Tracking of the sedimenta-tion velocity of microparticles becomes possible by obstructingthe liquid flow after introduction of the sample into the flowcell of the instrument.
The precision and accuracy of sizing are very important forthe purpose of obtaining the correct particle density by sedi-mentation velocity tracking. Fortunately, the methods devel-oped here do not require the counting (and sizing) of all par-ticles in the suspension, unlike in conventional applications offlow imaging microscopy where particle concentration often isan important output parameter (10). Therefore, we have ex-plored possibilities to use the image-derived data of individualparticles to select only particles that are in focus (to allowaccurate sizing) and show regular settling behavior (to enableaccurate determination of the sedimentation velocity).
This resulted in a number of inclusion criteria that wereused as indicators for the aforementioned characteristics (sizeand settling behavior). The considerable (quadratic) effect ofparticle diameter on the calculated sedimentation velocity (cf.Eq. 2) was in particular important to consider. In order todecrease potential errors related to this effect, we investigatedappropriate instrument settings for our method development.As FlowCAM offers the operator the advantage to choose themagnification, we have tested the influence of magnificationmagnitude on the sizing precision and accuracy of 5-μm and20-μm beads in an additional study (SupplementaryFigure S3). The outcome of that study indicates that the useof a lower lens magnification improves the sizing precision andaccuracy of the instrument. An additional advantage of a low-er magnification is that it would result in a larger field of view,thus in a larger sedimentation path that could be tracked,which is beneficial for the accuracy of the sedimentation ve-locity calculation.
We found the edge gradient parameter to be a useful indi-cator for focus, and therewith for accuracy of the sizing. Theintensity of the outer border of the particle determines theedge gradient value. Here, a low edge gradient number mayindicate that the edge of the particle is spread out, as thathappens with out-of-focus particles, and a very high valueindicates a very sharp contrast at the edge of the particle. Allthe pixels inside the edge border are eventually used to deter-mine the area of the particles, which in turn is used to calculatethe diameter (ABD). Our study indicates that very sharp con-trast leads to underestimation of the particle size and thereforeboth a lower and an upper limit for the edge gradient wereincluded in the particle selection criteria (100 – 200 a.u.). Theedge gradient values of the PLGA microparticles were foundto lie between 75 and 223. Polystyrene beads showed overallcomparable (very dark) greyscale intensity as the PLGA mi-croparticles that we studied. Also the refractive index ofPLGA and polystyrene do not differ that much (1.46 and1.59, respectively). In this case it is valid to consider that theedge gradient range that is chosen based on the polystyrenebead study, would be suitable for the PLGA microparticles aswell. In case one wants to study the density (and/or porosity)of more transparent microparticles, the edge gradient rangethat represents in-focus particles may differ. Furthermore, the
1110 Sediq et al.
focal plane in the flow cell is ideally positioned in the middle ofthe depth of field of view, where particles in focus are assumedto have the maximum distance from the front and rear wall ofthe flow cell, hence the lowest resistance effects from these twowalls. Despite these measures, one has to realize that the effectof imperfect focus and particle edge definition on the sizing
may result in some errors in the density calculations and maybe (at least partly) responsible for the distributions found foreach group of the presumably uniformly dense polystyrenebeads.
The methods we developed here can be deterrent becausethey may seem to involve time-consuming processes. Thisholds true for the utilization of the inclusion criteria for adataset of settling particles and for the procedure in MethodI of tracking the sedimentation in different liquids and thenfinding the apparent density through intrapolation of the lin-ear relation between fluid density and size-normalized sedi-mentation velocity (v/d2). However, the length of this part ofthe method can be easily reduced to even minutes if a com-puting toolbox based on a package like MatLab is used to testthe named selection criteria on the whole data set and deriva-tion of individual sedimentation rates with subsequent correc-tions and porosity calculations. This is particularly valuablewhen the method is used for routine analysis of, e.g., micro-particle batches.
Suspending fluids with a higher density than the expectedparticle density were chosen to confirm the applicability of themethod for particles with a relatively low density, such ashighly porous PLGA microparticles. Such particles wouldmove upwards (float) in conventional suspending media,resulting in negative sedimentation velocity values. In the ex-periments where polystyrene beads of different sizes werefound to be floating, the calculated densities were the sameas provided by the manufacturer. This highlights the
Fig. 4 Representative high resolution scanning electron microscopy (upper panels) and FlowCAM images (lower panels) of the different PLGA microparticlebatches.
Table II Morphological Parameters of the Different PLGA MicroparticleBatches
Micro-particlebatch
Aspect ratio Circle fit Circularity Intensity
The ratio ofthe width/length, wherewidth andlength corre-spond to theminor andmajor axis ofthe particle,respectively
Similarity ofthe particleedge to a best-fit circle, nor-malized to therange [0,1]where a per-fect fit has avalue of 1
The circumfer-ence of anequivalent areacircle dividedby the actualperimeter ofthe particle
The averagegreyscale ofthe pixelsmaking up aparticle (range= 0–255; 255is mostintense)
Mean SD Mean SD Mean SD Mean SD
1 0.982 0.010 0.959 0.004 0.954 0.006 52.83 3.93
2 0.980 0.007 0.957 0.003 0.927a 0.015 45.94 18.26
3 0.862a 0.070 0.844a 0.067 0.907a 0.027 19.80a 7.51
a Significantly different from the other batch(es) (one-way Anova (p<0.0001)followed by post-hoc Tukey’s multiple comparison test (p<0.05))
Determination of the Porosity of PLGA Microparticles 1111
applicability of this method for a wide range of particle sizes,densities and porosities. The altered conditions in our studyconcerned fluid density, but theoretically fluid viscosity couldbe another parameter to adjust.
For the density calculations using Stokes’ formula we haveonly used the data of particles in fluids with a density close tothe particle density. In addition, as seen from Fig. 1, the pre-cision of the sedimentation velocity determination increaseswhen the particle density is close to the fluid density. A signif-icant added value of Method II over Method I lies in the fact
that the final mean and standard deviation of the density (andhence porosity) from second approach resembles the popula-tion mean and the variability in it. In Method I the averagesand standard deviations of different populations in differentliquids are used to calculate a mean and standard deviation ofthe batch density (and porosity).
One has to realize that the first raw outcome of the ap-proaches presented in this study is the sedimentation velocityof particles, which is proportional to the apparent density ofthe particle. Therefore, the method is a reliable approach for
Fig. 5 Results of the two sedimentation based methods applied for porosity measurements of the different PLGA microparticle batches. Panels A – C show therelation between fluid density and particle size-normalized sedimentation velocity (v/d2) for three different batches (batch 1, 2 and 3, respectively). Each data pointrepresents the average and standard deviation of the sedimentation velocities derived from tracking of at least 20 individual particles in the corresponding fluiddensity. The linear relation between fluid density and v/d2 is denoted as the solid line, with the 95% confidence of interval of the linear relation between the dashedlines. Panel D shows porosity distributions of the investigated PLGA microparticle batches in fluids closest to the nominal PLGA microparticle density (i.e., fluiddensity of 1233, 1023 and 999 kg/m3, respectively, for batch 1, 2 and 3).
Table III Densities and Porositiesof 3 PLGA Microparticle BatchesObtained By Sedimentation VelocityTracking with The Density-MatchingMethod (Method I) and the StokesDerived Method (Method II)
Micro-particlebatch
Mercury intrusionporosimetry
Sedimentation velocity tracking
Method I Method II
Porosity(%)
Expecteddensityrange (kg/m3)a
Averagedensity ±SD (kg/m3)b
Average po-rosity ± SD(%)b
Goodnessof fit (R2)
Averagedensity ±SD (kg/m3)c
Average po-rosity ± SD(%)c
1 4.0 1313–1332 1284±43 4.2±3.2 0.979 1270±11 5.2±0.9
2 21.6 1028–1243 1036±31 21.9±2.3 0.960 1039±29 21.6±2.2
3 51.9 626–1135 823±177 39.1±13.3 0.903 801±152 39.8±11.4
a calculated from the known solid composition of the PLGAmicroparticle batch, assuming that the pores were filled withair (lower values) or suspending liquid (upper values)b mean and standard deviation ((SD), derived frommeasurements in 5–6 different suspending liquids) of the density andthe goodness of fitc density or porosity distributions (n=20 particles)
1112 Sediq et al.
measurement of the density of the particles as evidenced byinvestigation of the standard polystyrene beads. Deduction ofporosity from the apparent density needs some assumptions,the most important of which concerns the filling of the pores,with air or suspending fluid.
In a preliminary study we have investigated the effect of thetime lag (up to 4 days) between the preparation of the micro-particle suspension (batch 3) and the measurement. We foundthat the equilibration time did influence the density of theparticles, especially after 24 h of incubation. This may becaused by a change of pore properties due to release of theAPI and potential degradation of the PLGA. Therefore, wefixed the equilibration time to 3 h, which should be longenough for wetting of the surface of the particles and shortenough to avoid major changes in the pore properties.
Considering the hydrophobic properties of the PLGA andthe use of aqueous suspending media, one can expect that thediffusion of water through a primarily hydrophobic matrixwould be considerably delayed. The assumption of air-filledpores for the porosity calculations appeared to be fair whentheMIP data was compared to the porosity calculations basedon flow imaging experiments. The results summarized inTable III indicate that the obtained densities of the PLGAparticles from all batches are closer to those calculated fromthe MIP porosity data when pores are assumed to be filledwith air. It has to be realized, however, that partial filling ofthe pores with liquid cannot be totally ruled out and it may bea source of the relatively large SD for batch 3 compared to theother 2 batches.
Due to low nominal density of some PLGA particle batchesand the presence of air-filled pores, getting a particle densityhigher than the density of water was not possible for all parti-cles and therefore conditions for particle settling could notalways be achieved, not even in absence of cesium chloride.Decreasing density of an aqueous solution can be realized byaddition of alcohols. However, it was observed in a smallexperimental trial that the presence of ethanol caused aggre-gation of microparticles. Nevertheless, velocity measurementsin different fluids showed a good linear relation, in terms of R2
values, in particular for the first two batches, suggesting thatan extrapolation of the data points to obtain the interceptwould be justified. PLGA microparticle batch 3 showed thelowest degree of linear fit and the lowest precision of the den-sity and porosity determination. This may be due to the highlyuneven shape and surface of these microparticles compared tothe others, as well as the much higher porosity. Nevertheless,the obtained porosity was similar to the value obtained byMIP and significantly different (p<0.05) from the porositiesobtained for the other tested PLGA microparticles.
With Method II sedimentation of individual particles ismeasured (therewith porosity of individual particles) and themean and standard deviation of the investigated particle pop-ulation is calculated. The larger relative standard deviation in
the density (and hence porosity) that is seen for batch 3 mayalso be considered as an existing wide porosity distribution forthis specific batch. Therefore, the second approach providesbetter insight into the porosity details on particle level, which isan advantage over Method I and the conventional methodsfor porosity determinations.
CONCLUSION
In conclusion, we have developed, optimized and validatedtwo sedimentation velocity tracking methods to assess the po-rosity of micron sized particles. For this purpose we used aFlowCAM instrument, but it is expected that the methods canbe transferred to other flow imaging microscopes as well. Forthree batches of PLGA microparticles widely differing in po-rosity, both methods yielded porosity values that were similarto the values obtained by MIP, while requiring up to 100-foldsmaller amounts of material. The methods could therefore beuseful as a viable alternative to conventional methods for de-termining microparticle density and porosity.
ACKNOWLEDGMENTS AND DISCLOSURES
The research leading to these results has received supportfrom the Dutch Technology Foundation STW (which is partof the Netherlands Organization for Scientific Research(NWO), and which is partly funded by the Ministry ofEconomic Affairs). Wim Jiskoot is scientific advisor atCoriolis Pharma, Martinsried, Germany.
OpenAccessThis article is distributed under the terms of theCreative Commons Attribution 4.0 International License(http://creativecommons.org/licenses/by/4.0/), which per-mits unrestricted use, distribution, and reproduction in anymedium, provided you give appropriate credit to the originalauthor(s) and the source, provide a link to the CreativeCommons license, and indicate if changes were made.
REFERENCES
1. Park K. Controlled drug delivery systems: past forward and futureback. J Control Release. 2014;190:3–8.
2. Mundargi RC, Babu VR, Rangaswamy V, Patel P, AminabhaviTM.Nano/micro technologies for deliveringmacromolecular ther-apeutics using poly(D, L-lactide-co-glycolide) and its derivatives. JControl Release. 2008;125(3):193–209.
3. Klose D, Siepmann F, Elkharraz K, Krenzlin S, Siepmann J. Howporosity and size affect the drug release mechanisms from PLIGA-based microparticles. Int J Pharm. 2006;314(2):198–206.
4. Vyslouzil J, Dolezel P, Kejdusova M, Maskova E, Masek J, LukacR, et al. Influence of different formulations and process parametersduring the preparation of drug-loaded PLGA microspheres evalu-ated bymultivariate data analysis. Acta Pharm. 2014;64(4):403–17.
Determination of the Porosity of PLGA Microparticles 1113
5. Mao SR, Xu J, Cai CF, Germershaus O, Schaper A, Kissel T.Effect of WOW process parameters on morphology and burst re-lease of FITC-dextran loaded PLGA microspheres. Int J Pharm.2007;334(1–2):137–48.
6. Ezekwe N. Petroleum reservoir engineering practice. 1st ed. NewJersey: Prentice Hall; 2010.
7. Espinal L. Porosity and its measurement. In: Technology NIoSa,editor.: NIST; 2012.
8. Vay K, Scheler S, Friess W. New insights into the pore structure ofpoly(D, L-lactide-co-glycolide) microspheres. Int J Pharm.2010;402(1–2):20–6.
9. Webb PA. An Introduction to the physical characterization of ma-terials by mercury intrusion porosimetry with emphasis on reduc-tion and presentation of experimental data. MicrometricsInstrument Corp.: Norcross, Georgia; 2001.
10. Zolls S, Weinbuch D, Wiggenhorn M, Winter G, Friess W, JiskootW, et al. Flow imaging microscopy for protein particle analysis–acomparative evaluation of four different analytical instruments.AAPS J. 2013;15(4):1200–11.
11. Batchelor GK. An introduction to fluid dynamics. Cambridge,:U.P.; 1967. xviii, 615 p.
12. Bach LT, Riebesell U, Sett S, Febiri S, Rzepka P, Schulz KG. Anapproach for particle sinking velocity measurements in the 3–400mum size range and considerations on the effect of temperature onsinking rates. Mar Biol. 2012;159(8):1853–64.
13. Batchelor GK. An Introduction to Fluid-Dynamics - a Citation-Classic Commentary on an Introduction to Fluid-Dynamics byBatchelor, G.K. Cc. Phys Chem Earth. 1992; (40):8.
14. Deo S, Datta S. Stokes flow past a fluid prolate spheroid. Ind J PureAp Mat. 2003;34(5):755–64.
1114 Sediq et al.