determination of protein needs using nitrogen balance … · determination of protein needs using...
TRANSCRIPT

DETERMINATION OF PROTEIN NEEDS USING
NITROGEN BALANCE IN INFANTS IMMEDIATELY POST
CARDIOPULMONARY BYPASS SURGERY
by
Joann Elizabeth Herridge
A thesis submitted in conformity with the requirements
for the degree of Master of Science
Graduate Department of Nutritional Sciences University of Toronto
© Copyright by Joann Herridge 2013

ii
DETERMINATION OF PROTEIN NEEDS USING NITROGEN BALANCE IN INFANTS IMMEDIATELY POST CARDIOPULMONARY BYPASS
SURGERY
Joann Herridge
Masters of Science
Graduate Department of Nutritional Sciences
University of Toronto
2013
ABSTRACT
Background: The amount of parenteral protein to produce nitrogen balance in infants diagnosed
with severe heart defects undergoing cardiopulmonary bypass surgery was investigated.
Methods: Infants born at ≥36 weeks and ≤ 12 months of age were randomized to one of three
parenteral protein intakes, the control group received 1.5 g/kg/d and intervention groups
received either, 2.2 or 3.0 g/kg/d of protein, respectively. Timed 24 hour urine collections were
obtained for three consecutive days following surgery. Total urinary nitrogen was measured
through Kjeldahl analysis. Results: A significant difference was demonstrated between the
lowest protein intake level of 1.5 g/kg/d and both 2.2 g/kg/d (p ≤ 0.03) and 3.0 g/kg/d
(p ≤ 0.001), on study day 1. Nitrogen balance results were 4.0 ± 52.9 (1.5 g/kg/d), 97.0 ± 96.2
(2.2 g/kg/d) and 149.7 ± 90.9 (3.0 g/kg/d). Conclusion: Protein delivery of 1.5 g/kg/d was
insufficient to produce nitrogen balance on post-operative day 1.

iii
TABLE OF CONTENTS
Abstract ii
Table of contents iii
List of tables iv
List of figures vii
List of abbreviations viii
List of appendices ix
CHAPTER 1: INTRODUCTION AND RATIONALE 1
CHAPTER 2: LITERATURE REVIEW 5
2.1 Nitrogen Balance 5
2.1.1 Nitrogen Balance Definition 5
2.1.2 Nitrogen Balance States 5
2.1.2.1 Positive nitrogen balance 5
2.1.2.2 Negative nitrogen balance 5
2.1.2.3 Nitrogen equilibrium 6
2.1.3 Nitrogen Balance: intake and output 6
2.1.4 Nitrogen Balance Methods of Analysis 8
2.1.4.1 Kjeldahl determination of total urinary nitrogen 8
2.1.4.2 Urine urea nitrogen method 9
2.1.5 Interpretation of Nitrogen Balance 11
2.1.5.1 Interpretation of nitrogen balance in acutely ill children 12
2.2 Protein and Nitrogen Requirements in Infants 12
2.2.1 Determination of protein requirements in healthy infants 12
2.2.2 Estimated nitrogen requirements in healthy infants 13
2.3 Investigations of Protein Needs Through Nitrogen Balance in Post Surgical Infants 14
2.3.1. Nitrogen balance in critically ill children 16
2.3.2 Relationship of energy and protein intake to nitrogen balance 17
2.4 Energy Expenditure in Infants Following Surgery 18
2.4.1 Energy expenditure in children post cardiopulmonary bypass 19

iv
2.5 Energy and Protein Deficits In Critically Ill Children 21
2.5.1 Energy deficits in post surgical children 21
2.5.2 Protein deficits in post surgical infants 22
2.6 Growth Failure in Infants with Congenital Heart Disease 23
2.6.1 Birth weight in congenital heart disease 23
2.6.2 Postnatal growth and malnutrition 24
2.7 Nutritional Status and Methods of Analysis in Acute Illness 26
2.7.1 Body composition 26
2.7.2 Methods of body composition analysis 27
2.7.3 Serum protein markers of nutritional status 28
2.8 Metabolic Response to Injury and Surgical Management 28
2.8.1 Protein metabolism during injury and stress 28
2.8.2 Cardiopulmonary bypass and stress 29
2.8.3 Surgical management and glucocorticosteroids 31
2.8.4 Index of stress 32
CHAPTER 3: DETERMINATION OF PROTEIN NEEDS USING NITROGEN BALANCE
IN INFANTS IMMEDIATELY POST CARDIOPULMONARY BYPASS SURGERY 33
3.1 Introduction 33
3.1.1 Rationale 33
3.1.2 Hypothesis 34
3.1.3 Objective 34
3.2 Subjects and Methods 34
3.2.1 Subjects 34
3.2.2 Study design and protocol 35
3.2.3 Nutrition therapy 37
3.2.3.1 Parenteral nitrogen intake 37
3.2.3.2 Parenteral non-protein prescription 38
3.2.3.3 Enteral nutrition energy and protein delivery 39
3.2.4 Blood biochemistry monitoring and safety 40
3.2.5 Nitrogen collection and calculations 40
3.2.5.1 Urine collection 40
3.2.5.2 Additional urine losses 41

v
3.2.5.3 Other nitrogen losses 41
3.2.5.4 Nitrogen balance calculation 42
3.2.6 Laboratory Analyses 42
3.2.6.1 Urine analysis 42
3.2.6.2 Parenteral amino acid analysis 42
3.2.7 Collection of data 42
3.2.8 Statistical analysis 43
3.3 Results 44
3.3.1 Clinical details 44
3.3.2 Participation 44
3.3.3 Participant characteristics 45
3.3.4 Surgical characteristics and operative data 46
3.3.5 Preoperative growth status 46
3.3.6 Nutrition delivery 48
3.3.6.1 Non-protein energy delivery: Enteral and parenteral 48
3.3.6.2 Protein delivery: Enteral and parenteral 49
3.3.7 Urine samples 49
3.3.8 Nitrogen balance results 49
3.4 Discussion 53
3.4.1 Nitrogen balance 53
3.4.2 Protein adaptation 55
3.4.3 Nitrogen balance and the stress response 55
3.4.3.1 Evaluation of the stress response 57
3.4.4 Nitrogen balance and clinical factors indicated in post-operative status 57
CHAPTER 4: CONCLUSION AND FUTURE DIRECTIONS 60 REFERENCES 64 APPENDICES 74

vi
LIST OF TABLES
Table 1. Whole-body protein synthesis in humans at different life stages 13 Table 2. Oxygen consumption, carbon dioxide production, respiratory quotient, energy
expenditure and caloric intake in infants following the Norwood procedure 20 Table 3. Primene® and ProSol™ intravenous amino acid solutions composition 38 Table 4. Nitrogen balance equation 41 Table 5. Surgical characteristics and operative data 45
Table 6. Baseline characteristics 47
Table 7. Non-protein energy from parenteral and enteral nutrition 48
Table 8. Total parenteral and enteral protein intake 49
Table 9. Difference in nitrogen balance in protein intakes of 1.5, 2.2 & 3.0 g/kg/d for three study days 50

vii
LIST OF FIGURES
Figure 1. Nitrogen balance metabolic pathways 7
Figure 2. Anabolism and catabolism for energy and protein intakes in infants post cardiac surgery 16
Figure 3. Metabolic response to acute injury 30
Figure 4. Nitrogen balance study design 36
Figure 5. Participation flow chart 45
Figure 6. Effect of protein intake on nitrogen balance for 3 consecutive days 50
Figure 7. Protein intakes 1.5, 2.2, 3.0 g/kg/d versus nitrogen balance 51
Figure 8. Nitrogen balance results at each protein intake level 52

viii
ABBREVIATIONS
CHD Congenital Heart Disease CPB Cardiopulmonary bypass CRP C-reactive protein CCCU Cardiac Critical Care Unit EBM Expressed breast milk GH Growth hormone HLHS Hypoplastic left heart syndrome ICU Intensive Care Unit IGF Insulin like growth factor kg Kilogram LBM Lean body mass N Nitrogen PN Parenteral nutrition PRISM Pediatric risk of mortality REE Resting energy expenditure SD Standard deviation TUN Total urinary nitrogen UUN Urine urea nitrogen WAZ Weight-for-age z score

ix
LIST OF APPENDICES
Appendix A. Consent form Appendix B. Prosol™ and Primene® product monographs Appendix C. Parenteral nutrition volumes for nitrogen balance study Appendix D. Biochemistry monitoring and safety Appendix E. Data collection form Appendix F. Complete surgical characteristics Appendix G. Nitrogen balance: Complete data of intake and output for 3 consecutive day

1
CHAPTER 1: INTRODUCTION
1.1 Introduction
Nitrogen balance methods have been valuable clinically in assessing nutritional therapies to
determine the extent of catabolism in injury or illness in critically ill patients (2). The metabolic
response to injury is a complex series of hormonal and biochemical changes, characterized by
protein catabolism and alterations in energy needs, as determined by the degree of illness (3).
The breakdown of endogenous protein stores to provide amino acids for tissue repair, wound
healing and inflammatory markers is theorized to be an adaptive response (4). The intensity of
this response influences the extent of lean body mass (LBM) breakdown, which may have a
significant effect in infants with congenital heart disease (CHD) who present with limited
nutrient reserves. Optimal protein requirements for an infant recovering from cardiopulmonary
bypass (CPB) has not been adequately studied, consequently the amount of protein required to
limit the catabolism of LBM is unknown. Achievement of nutrition support that matches
infants’ needs following cardiothoracic surgery is essential in maintaining their metabolic
reserves throughout the initial recovery phase.
Congenital heart disease is the most common birth defect contributing to a large
percentage of mortality among infants (5). Its incidence is reported as varying between 4-50 per
1000 live births (6). During the fetal period of development, malformation in the structure of the
heart valves or associated vessels results in CHD (7). Congenital heart malformations are
divided into three classifications: simple defects that require a primary repair, moderate defects
that either undergo a primary repair or a palliative surgery and severe defects that necessitate
palliation (8). The more severe cardiac defects are referred to as cyanotic or as single ventricle
physiology. Children with these defects typically require multiple staged surgical procedures

2
that occur during the neonatal period throughout childhood, CPB is necessary in these reparative
surgeries (5, 9). Due to the invasive nature of surgeries that require CPB, the infant may
encounter significant physiological and hemodynamic changes in the immediate post-operative
period. There is a large body of literature describing the relationship between CHD and
malnutrition as characterized by poor growth and delays in achieving developmental milestones
(10-18). In one particular study malnutrition was evident in 70% of babies with cyanosis or
pulmonary over-circulation (11).
Surgical procedures place an infant at an increased risk for protein catabolism, which has
been reported as the hallmark of critical illness (19-22). There is an emerging body of literature
in the field of paediatric intensive care nutrition that attempts to evaluate body nitrogen losses as
a result of stress or trauma, including those recovering from surgery (23). It has been widely
noted that children recovering from surgery present with increased protein catabolism but are
not hypermetabolic as originally hypothesized from adult studies (4, 19, 24). Further,
complications that can arise from marked catabolism of body stores include, increased rate of
infections, delayed wound healing, multiple organ failure, prolonged mechanical ventilation,
increased length of hospital stay, increased mortality and greater health care costs (1, 25, 26).
In response to injury or stress an integrated series of events occurs during protein
metabolism, characterized by accelerated protein degradation, decreased synthesis of somatic
proteins and increased amino acid catabolism, resulting in increased body nitrogen losses (27,
28). The effects of this catabolic response to injury promotes a breakdown of somatic proteins
that support gluconeogenesis (27). It has been postulated that patients in an intensive care unit
(ICU) present with an increased rate of protein degradation which is greater than the proportion
of protein synthesis, resulting in a negative nitrogen balance (4). This breakdown of body

3
protein can enhance post-operative complications including decreased intravascular oncotic
pressure, increased severity of pleural effusions, intestinal wall oedema and ascites (10). These
complications may be intensified in infants with CHD who have not achieved adequate growth
between staged surgeries or interventions. Thus, with limited protein reserves their ability to
surmount an acute or prolonged stress response is compromised. Therefore, the evaluation of
this catabolic response is particularly important for infants with limited fat and LBM reserves
(4, 29, 30).
Quantifying the amount of protein needed to maintain body composition and to meet the
demands of surgical stress for the infant undergoing CPB is of clinical importance when
considering factors associated with increased morbidity and mortality. Protein metabolism is
affected by energy intake, amino acid intake and the underlying disease of the individual (31).
Preoperatively, infants with CHD are often characterized as having growth failure, in a
hypermetabolic state and possibly in a negative nitrogen balance (32). In consideration to this,
once hemodynamic stability has been restored post operatively, it is essential that adequate
nutrition be provided in a timely manner in an attempt to reduce nutritional deficits that could
impact recovery. Beyond the immediate recovery period nutritional insufficiency can cause
detrimental effects on body composition and growth occurring throughout various stages of the
disease process (33).
Complications that can arise from CPB surgery including, acute renal failure, liver
dysfunction, chylothorax, and necrotizing enterocolitis, present unique challenges in the
development of nutrition therapies (5). Additionally, the necessity of imposed fluid restrictions
limit the provision of optimal nutrition support. Fluid delivery is commonly restricted between
50-70% of maintenance needs (34). Furthermore, it has been extensively documented that
children who are critically ill, comprising a heterogeneous population of surgical and non-

4
surgical diagnoses, are nutritionally vulnerable, a process that if not addressed judiciously can
lead to increased physiological instability (4, 19, 33, 35). Other factors contributing to poor
nutritional delivery and growth failure are malabsorption, elevated energy expenditure, multiple
disruptions in feeding delivery, and varying clinician practices (36). These influences often
make it difficult to provide optimal, if not adequate nutrition to the acutely ill child. In due
course, poor nutrition in the ICU leads to an extended length of stay and ongoing nutritional
challenges during recovery (12).
The purpose of this intervention study was to measure nitrogen balance in post surgical
infants with congenital heart disease. The study was designed to provide graduated intakes of
parenteral amino acids to determine a sufficient amount that would indicate nitrogen retention in
this high risk group. Thus, our aim was to determine if increasing the level of parenteral protein
greater than the current clinical standard prescription of 1.5 g/kg/d would result in nitrogen
balance, in critically ill infants recovering from cardiopulmonary bypass surgery.
The literature review that follows examines topics that are integral to the interpretation
and assessment of nitrogen balance including, definitions of nitrogen balance states,
methodologies used to define balance and its interpretation. Furthermore, an understanding of
protein requirements in healthy infants and needs as studied in illness are relevant to
understanding the nitrogen input required in recovery from surgery or illness. Additionally, a
brief overview of energy expenditure in critically ill and surgical children will be described. An
interpretation of energy needs is essential when developing nutrition therapies in the
hospitalized child in order to reduce complications that are associated with energy deficits.
Adequate protein delivery in the presence of adequate energy that matches needs is necessary
for nitrogen to be utilized for tissue synthesis and not as a source of energy (37). The

5
relationship of energy to protein has an impact on nitrogen balance measurements. Nutrient
deficits are common in critically ill children and will be highlighted further in this review.
As inadequate growth is prevalent among children with CHD it deserves consideration in
the assessment of the post-surgical infant as malnutrition can impact recovery and clinical
outcomes. Several methods used in nutritional assessments and evaluations are of limited value
when attempting to understand nutrient needs of the acutely ill child. As an example, serum
protein markers are more likely better indicators of stress versus nutritional status (38).
Furthermore, measures of body composition are generally not useful assessment tools due to
technical drawbacks in an ICU setting. Due to the limitations of these methods nitrogen balance
plays an important role in the assessment of body protein catabolism.
For the purpose of determining appropriate nutrition therapy for infants susceptible to
protein catabolism, a brief description of the metabolic response to surgical stress or injury will
be reviewed. As CPB is a necessary component of surgery, the effects of its management
deserve consideration in the development of the child’s nutrition prescription. As in the
immediate post-operative critical phase of recovery infants are predisposed to LBM losses that
may be substantial (23)

6
CHAPTER 2: LITERATURE REVIEW
2.1 Nitrogen Balance
2.1.1 Nitrogen Balance Definition
Nitrogen balance is the difference between nitrogen intake and the amount of nitrogen
that is excreted from the body (39). Through this analysis, nitrogen balance studies are
performed to evaluate protein turnover (40). By calculating the difference between intake and
output a determination of equilibrium, negative or positive balance can be made.
2.1.2 Nitrogen Balance States
2.1.2.1 Positive Nitrogen Balance
When nitrogen intake is greater than output individuals are in a positive balance. This
occurs in growing children, during pregnancy, athletic training or in recovery from illness (2,
41). Nutrient requirements during these conditions have been estimated through calculating the
retention of protein required to form new tissue in addition to an estimated amount of protein
required for the body’s maintenance functions (2). In the assessment of nitrogen balance in
illness, a positive nitrogen balance indicates anabolism which is characterized by weight gain as
indicated by the repletion of fat and skeletal muscle mass and consequently results in an
increase in strength (42, 43).
2.1.2.2 Negative Nitrogen Balance
Alternatively during catabolic states, as implied in critical illness or stress, a negative
nitrogen balance is typical, whereby nitrogen intake is less than output (20). A reliance on
muscle protein stores is necessary to support the metabolic demands of the body and may result

7
in a negative nitrogen balance (44). Importantly, nitrogen excretion in catabolic patients can be
highly variable as studied in adult trauma and surgical patients (45). If a negative nitrogen
balance persists the amount of protein catabolism can impact the patient’s organs (41).
In a state of negative nitrogen balance, the primary result is an increase breakdown of
body protein to support metabolic needs (19). During periods of acute metabolic stress protein
stores catabolize, resulting in an increase in urinary nitrogen losses. An increase in free amino
acids are utilized by the liver for glucose synthesis which results in increased nitrogen in the
form of urea in the urine (19). Coss-Bu et al concluded after studying critically ill children
receiving parenteral nutrition (PN), that those in a negative nitrogen balance had high protein
oxidation rates, implying increased protein utilization under catabolic conditions (46).
Additionally, in a study conducted by Marin et al, it was determined that following major
surgery total urinary nitrogen (TUN) was 3-4 times higher in fasting subjects as a result of lean
tissue catabolism (47). One of the main goals of nutritional therapy for the post-surgical cardiac
infant is to provide adequate energy and macronutrients that will facilitate nitrogen equilibrium
and attenuate whole body protein catabolism.
2.1.2.3 Nitrogen Equilibrium
Zero nitrogen balance occurs when nitrogen intake equals output, suggesting that the
body’s protein pool is in equilibrium (23). It is presumed that individuals are in a state of
nitrogen balance when nitrogen is not retained for growth or repair of muscle tissue and is not
lost as a result of injury or starvation (48). An assumption is made that protein turnover,
described as a dynamic process of protein synthesis and protein degradation, are in equal
balance (49). For a positive nitrogen balance to occur in newborns, a protein turnover of 12.8 to

8
18.7 g/kg/d has been reported (50). This was dependent on whether the infant received either a
commercial infant formula or human milk (50).
2.1.3 Nitrogen Balance: Intake and Output
Nitrogen intake in the form of dietary protein can be found in foods, human milk, enteral
formulas or parenteral amino acids. The actual amount of nitrogen delivery depends on its
primary source as proteins contain varying mixtures of essential and non essential amino acids
that contain different proportions of nitrogen depending on their chemical structure. Thus,
quantifying the actual amino acids contained in the diet is of importance in order to accurately
determine the amount of nitrogen intake.
Nitrogen output is primarily measured in urine, non-urinary losses from stool are
generally estimated in hospitalized patients (45). However, nitrogen excretion from the body
occurs in a variety forms including losses from integument (i.e. skin, hair and sweat), and body
fluids (i.e. gastrointestinal losses) (Figure 1) (23, 40, 51). Urinary nitrogen production occurs
from deamination of amino acids that release ammonia after detoxification in the liver through
the urea cycle, generating urea as a soluble end product (52). In studies involving infants and
children following surgery, nitrogen losses are primarily measured from urine excretion.
Pencharz et al found that urea nitrogen ranged from 37-71% of TUN excretion in neonates
receiving high protein intakes of 4.4 g/kg/d (53). In an earlier study, examining urea nitrogen in
4-6 day old newborns versus adults, it was determined that over a 24 hour period that the
content of urea nitrogen was 73 mg/kg/d, and 358 mg/kg/d, respectively (54).

9
Figure 1. Nitrogen Balance Metabolic Pathways
Adaptation with permission of: American Society for Nutrition © (51)
Correction factors to account for body nitrogen losses from integument and stool have
been considered in studies investigating protein balance in critically ill children (23). In
paediatic studies these factors have been derived from adult data and modified (23). These
estimated factors used to correct for other non-urinary nitrogen losses will be revisited later in
this review. Although these losses are important to consider in the determination of total
nitrogen losses from the body, at present there doesn’t appear to be reliable evidence to support
a standard correction factor for research application in children.
2.1.4 Nitrogen Balance Methods of Analysis
Nitrogen balance can be determined through TUN, or urine urea nitrogen (UUN)
analysis (55). Total urinary nitrogen accounts for nitrogen from urea, ammonia, creatine,
creatinine, uric acid, free and bound amino acids (56). It can be measured directly by using the
traditional classical Kjeldahl technique or pyro-chemiluminescence analysis. Both of these
methods are sensitive and specific in providing precise estimates of a spectrum of nitrogenous
compounds in urine (57).
!
!"#$%&'($)#*("+,+-.)(,
/.'(&,"0'1#,
2%&$)'(#,
3')$"%4,2%&$)'(,
5)0)#,
678, 9%)", 9%'(),
#:'(;,<"'%;,("'+#;,#=)"$,
6'$%&>)(,?($":), @, 6'$%&>)(,A-$B-$,
C+&&1;,B+)-%"+;,#)0%)*&(#,,
D&+&(,
6'$%&>)(&-#,0&.B&-(1#,

10
2.1.4.1 Kjeldahl Determination of Total Urinary Nitrogen
The Kjeldahl technique for determining TUN has been widely used in adult and
paediatic studies, both in health and illness (e.g. chronic disease or post-operative recovery
states) (44). As such, it was used to measure total urinary nitrogen in this study. Using Kjeldahl
to quantify TUN, is valuable in monitoring changes to nutritional therapies (41). As available,
TUN measurements are the preferred choice of nitrogen balance determination in critically ill
patients as during injury there is a poor correlation between nitrogen losses of urea with nitrogen
losses from ammonia (19, 58).
Since 1883 the Kjeldahl method has undergone several modifications however, three
stages of nitrogen determination of biological samples are generally conducted: 1. digestion of
the sample with sulfuric acid that yield sulfate, 2. separation of ammonia from the digest by
distillation and 3. determination of the ammonia (59).
2.1.4.2 Urine Urea Nitrogen Method
Urine urea nitrogen analysis is more easily determined than using the Kjeldahl technique
however, UUN is a less accurate measurement of total nitrogen than TUN (58). In the
application of this method non-urea nitrogen constituents (i.e. ammonia, creatine, creatinine,
uric acid, free and bound amino acids) are not accounted for, instead a correction factor may be
applied to account for nitrogen losses from these sources and an additional adjustment factor
may be added to estimate nitrogen losses from other body sources (i.e. stool, integument) (58).
The UUN method has been used as a surrogate marker for TUN on the premise that 80-90% of
nitrogen is in the form of urea, as studied in adults under normal metabolic and dietary
conditions (58, 60). Predictive methods for measuring nitrogen balance through UUN have been
derived from several different groups including, healthy adults or hospitalized patients with

11
varying degrees of illness including recovering from surgery, thermal burn injuries or trauma
(45). Urinary urea nitrogen equations used to determine nitrogen balance are applied when the
more precise TUN method is unavailable.
Analysis of UUN can be performed in many institutional laboratories through a routine
blood urea nitrogen assay (60). Various calculations of UUN have been employed in an attempt
to accurately quantify nitrogen balance. A UUN formula frequently used in adult studies,
applies a correction factor of 2-4g, to include all other nitrogen sources (i.e. losses from stool,
integument, non urea forms of nitrogen and other insensible losses) (45).
Nitrogen balance: g/d = (protein intake g/d ÷ 6.25 g/d) – (UUN g/d + 2 to 4g)
A typical calculation reported in several paediatric studies to adjust for non-urea nitrogen losses
includes a factor of 1.25 (24, 61-63).
Nitrogen balance: g/d = (protein intake g/d ÷ 6.25 g/d) – (UUN g/d x 1.25)
In summary, predicted UUN equations do not appear to be standardized in the literature making
it difficult to compare results across studies.
Several investigations conducted in critically ill children have applied UUN analysis,
with or without a correction factor for non-urea nitrogenous losses and/or including an
additional factor for miscellaneous losses from the body (24, 28, 61, 62). In one particular study,
the validity of an adjusted UUN to estimate TUN was investigated in three paediatric
populations (64). In the children with closed head injuries and/or recovering from
cardiovascular surgery, UUN was multiplied by a factor of 1.25. The resultant value accounted
for only 78% of TUN, a 22% difference in nitrogen balance. This disjuncture between
calculated UUN and TUN could result in the misclassification of a child’s anabolic or catabolic

12
state. Moreover, it was revealed that adding 2 or 4 g/d nitrogen to UUN values to account for
other body losses of nitrogen, resulted in an overestimation of TUN from 97 to 232% (64).
Adding further inconsistency to determining nitrogen balance are considerations as to
whether a factor for stool and integument losses are applied. Several investigators studying
protein requirements in children, whether using UUN or TUN, have applied factors ranging
from an additional 30-75 mg/kg/d, or 2-3 g/d of nitrogen to account for other body losses (24,
27, 28, 47, 65). However, in some neonatal studies integument and stool nitrogen losses were
considered negligible and not accounted for in calculations (31, 66). Although some
investigators incorporate a factor for nitrogen losses from stool and skin, most of the studies
reviewed did not account for nitrogen losses from wounds, nasogastric suctioning, pleural
effusion, peritoneal dialysis or blood losses. It is presumed that given the complexities involved
in attempting to measure nitrogen losses from these sources, measurements are not routinely
included in nitrogen balance analysis.
The differences in TUN and UUN methodologies are important as assumptions of
estimated non-urea nitrogen losses render nitrogen balance results to be less accurate when
applying UUN analysis. During severe energy restriction or starvation, the correction factor
applied to UUN calculations requires consideration as production of renal ammonia is increased
to an extent that a factor of 2 g/d is inadequate to account for non-urea nitrogen (41).
Furthermore, when protein intake is low, urinary nitrogen excretion decreases and the content of
urea-nitrogen accounts for approximately 61-70% of TUN (41). Therefore using UUN to assess
protein status in undernourished critically ill children with impaired renal function can result in
additional errors.

13
It has been reported that UUN calculations underestimate total nitrogen losses in adult
surgical and trauma patients that are severely catabolic (45). Konstantinides et al stratified
surgical and trauma patients into four categories of stress, they analyzed a total of 315 nitrogen
balance assessments in their study analysis (58). It was determined that UUN represented a
mean of 80 ± 12% of TUN (58). Moreover, UUN values ranging from 12 to 112% of TUN were
reported (58). It was concluded that actual TUN rather than estimated UUN was a better method
for measuring nitrogen balance in stress and a correction factor of 1.25 did not consistently
account for total non-urea nitrogen constituents (58).
Furthermore, in a study of postsurgical preterm neonates receiving parenteral nutrition
both TUN and UUN methods were evaluated for 3 days after surgery (56). It was demonstrated
that UUN as a percentage of TUN was highly variable and an overestimation of 80 mg N/kg/day
was reported on the initial study day (56). In sum, UUN was not a reliable estimate of TUN for
the determination of nitrogen balance in this study sample (56). Appreciating that nitrogen
excretion is highly variable in critically ill patient’s, TUN is the preferred method for assessing
nitrogen balance when available (58). Therefore, in critically ill children, studying nitrogen
balance through determination of TUN would result in improved accuracy in defining an
anabolic or catabolic state.
2.1.5 Interpretation of Nitrogen Balance
Measurements of nitrogen balance are performed at a series of varying levels of protein
intake that are above or below an estimated requirement (40). This is important in the
determination of an adequate level of protein to support anabolism, as required for growing
children, or to understand a level of intake during illness that results in catabolism of LBM.
Measurements of nitrogen in the urine and from other body losses reflect protein turnover, thus

14
its calculation can be an index of nutritional status (44). In illness or stress, considerations in the
assessment of negative nitrogen balance include, inadequate protein and/or energy intake, the
conditions of the subject that would make them more or less catabolic, and excessive body
losses from diarrhea or fistulas (41). Ultimately, nitrogen balance determinations can improve
our understanding of the influence of surgery on protein metabolism and requirements in
stressed states (44).
2.1.5.1 Interpretation of Nitrogen Balance in Acutely Ill Children
In stress or injury, nitrogen balance measurements may not necessarily approach
equilibrium despite increased intakes. Instead, measurements can be more variable as reported
in a heterogeneous groups of critically ill children (23). Briassoulis et al conducted an
observational study in 71 acutely ill children, on day 1 of admission to the ICU all children were
in negative balance (28). Early enteral nutrition was initiated within 12 hours of admission and
recommendations for protein were attained by study day 2. By the end of the 5 day study period,
62% of children were in a positive nitrogen balance and 38% were in a negative nitrogen
balance, with a protein intake of 2.8 ± 0.17g/kg/d (28). Despite a high protein intake, some
children remained in a negative balance by the end of the study. It was reported that they were
diagnosed with either severe sepsis or multiorgan system failure (28). Negative nitrogen balance
among children in the aforementioned study has been attributed to severity of illness combined
with a severe depletion of protein stores prior to admission and in stressed states (28)
In summary, nitrogen balance has been used define protein requirements and to evaluate
the adequacy of protein intakes (57). Further, in illness, nitrogen balance is used to assess
endogenous protein breakdown as related to stress levels, and to evaluate the impact of illness or

15
surgery on protein degradation (19, 57). Accordingly, this technique can assist with monitoring
the effectiveness and adequacy of nutrition delivery (60).
2.2 Protein and Nitrogen Requirements in Infants
2.2.1 Determination of Protein Requirements in Healthy Infants
Protein requirements for healthy infants have been derived from numerous classical
nitrogen balance studies that are summarized in the Dietary Reference Intakes (39). Protein
requirements for an individual is defined as “the minimum intake of high quality dietary protein
that will provide the needs for maintenance at an appropriate body composition, and will permit
growth at the normal rate for age, assuming energy balance and normal physical activity” (39).
Scientific experts in the field of protein metabolism have developed Average Intake
requirements for the healthy term infant from birth to 6 months, which reflect the observed
mean protein intake of infants consuming an average of 780 ml of human milk (39). It is
recommended that infants receive 1.52 g/kg/d protein during this period (39). Recommendations
to support maintenance, growth and development of infants 7-12 months of age are calculated as
Estimated Average Requirements, which accounts for the median of nitrogen intake to support
nitrogen equilibrium, plus an estimate of protein utilization for growth (39). The mean protein
requirement for this age group was determined 1.0 g/kg/d (39).
Table 1 indicates the changes in whole-body protein synthesis during different stages of
life (39). Protein synthesis during infancy is approximately twice that of adults to support
growth. Greater protein requirements of infants in combination with their limited protein
reserves puts them at extreme risk during periods of acute metabolic stress (29).

16
Table 1. Whole-Body Protein Synthesis in Humans at Different Life Stages (39) Life Stage
Protein Synthesis (g/kg/d)
Newborn (preterm) Infant Adult Elderly
17.4 6.9 3.0 1.9
2.2.2 Estimated Nitrogen Requirements in Healthy Infants
Nitrogen requirements have been estimated for infants’ ages 7 to 12 months (39). This
estimate was derived using the factorial method that accounted for a median of 110 mg/kg/d of
nitrogen intake to facilitate nitrogen equilibrium for maintenance only (39). As discussed
previously, by applying estimates of protein utilization and deposition, an average protein intake
of 1.0 g/kg/d is recommended for this age group. Clungston et al estimated nitrogen
maintenance requirements from birth to 6 months of approximately 90 mg/kg/d, which was
derived from a breastfed infant model (67). Epidemiological methods used to estimate nitrogen
requirements in infant’s 3-4 months of age, indicated that nitrogen requirements were less than
170 mg/kg/d, where as the average intake was 231 mg/kg/d (68).
For infants 7 months to children 14 years of age, nitrogen measurements include a factor
for miscellaneous losses from integument or other sources (39). Dietary reference intake reports
indicate that the mean miscellaneous losses for these children range from 5-9 mg/kg/d, with a
mean of 6.5 ± 2.3 mg/kg/d (39). Taking into account this miscellaneous factor, the estimate
nitrogen intake for a 6 month old is 120 mg/kg/d, which decreases to 103 mg/kg/d by 18 months
of age (69).

17
2.3 Investigations of Protein Needs Through Nitrogen Balance in Post-surgical Infants
While protein requirements have been established for healthy infants, there continues to
be limited research investigating protein needs in infants recovering from cardiovascular surgery
in an intensive care unit. It has been hypothesized that protein requirements are higher for
children in the immediate post-operative recovery period than for those who are healthy (29).
For the infant or child recovering from illness or surgery, endogenous protein is aimed at
promoting nitrogen retention to provide substrate for tissue repair and to facilitate an
inflammatory response (29).
Several studies examining protein requirements in preterm and term infants recovering
from post gastrointestinal surgeries have been conducted (46, 56, 66, 70). For this group of
surgical infants it is important to bear in mind that an essential component of clinical
management is to provide adequate fluid for optimal energy and protein delivery. An allowance
of 100-120 ml/kg/d is recommended for an infant 24-48 hours post gastrointestinal surgery (3).
This is distinctly greater than 50-70 ml/kg/d of fluid allocated to the post-operative cardiac,
which is primarily in the form of intravenous medications. Consequently, adequate nutrition is
difficult to achieve for this group.
In a study of ventilated newborns immediately post abdominal surgery two protein
intake levels were investigated to determine if an anabolic state could be accomplished with the
delivery of parenteral nutrition (66). Nitrogen balance was determined by UUN analysis. Seven
infants were allocated to a low protein level of 1.2 ± 0.4 g/kg/d with a non-protein energy
delivery of 53.8 ± 5.3 kcals/kg/d, and six infants received 2.2 ± 0.4 g/kg/d, receiving 57.4 ± 11.4
kcals/kg/d (66). In the lower protein group, 4 infants were catabolic where as infants in the
higher protein intake group were in a positive nitrogen balance (66). Although marginal, the

18
difference in energy delivery could have influenced protein utilization however, the additional
protein could have provided a source of energy resulting in a positive nitrogen balance.
In a similar group of neonates post gastrointestinal surgery, TUN was determined by
Kjeldahl analysis (70). The researchers set out to investigate the amount of nitrogen required to
duplicate weight gain and nitrogen retention similar to those of healthy term infants (70). Infants
were studied 72 hours following surgery for a period of six days with nitrogen balance
measurements taken on the last three days of the study (70). Nitrogen delivery from PN ranged
from 290 – 570 mg/kg/d (2.3-2.7 g/kg/d of protein), with energy intakes of 87.4 ± 2.7 kcals/kg/d
(70). It was determined that increasing nitrogen intake correlated significantly with increasing
nitrogen retention for infants in this study (70).
Likewise a study conducted by Duffy and Pencharz investigated nitrogen metabolism in
neonates post gastrointestinal surgery with the provision of by parenteral protein of 2.3 or 3.9
g/kg/d (71). They showed that nitrogen intake correlated with nitrogen retention, consequently
improving apparent nitrogen utilization. It was concluded that with an energy intake of 85-90
kcals/kg/d, a higher nitrogen intake of 450 mg/kg/d would be sufficient to meet the needs of
these neonates in the immediate post-operative period (71).
In view of the aforementioned studies it could be inferred that infants with CHD
experience a similar metabolic response immediately after surgery as infants following
gastrointestinal surgery. Thus, suggesting that protein needs may be comparable and that
metabolic and hormonal differences between cardiac and gastrointestinal surgeries could alter
protein delivery in either direction, depending on the extent of catabolism. However, in view of
a recently published observational cohort study investigating nitrogen balance in post surgical
cardiac infants, it could be reasoned that protein needs may not be elevated compared to infants

19
post gastrointestinal surgery. The primary objective of the previous study was to evaluate cell
catabolism in order to establish protein and energy requirements aimed at minimizing
catabolism (1). Measurements of nitrogen excretion were performed through UUN analysis
immediately after surgery, with minimum study duration of 3 days for each child (1). The
investigators determined on study day 1 all infants were in a negative balance with protein
intakes ≤ -0.3 g/kg/d (1). Conversely, during the study period, 6 were in a positive balance while
the remaining 5 were in a negative protein balance (1). As would be expected, nitrogen balance
improved as protein intake increased from a median of -0.7 g/kg/d to 1.1 g/kg/d, indicating a
significant positive correlation between protein intake and protein balance occurred (1).
Correspondingly, energy intake was higher on the days during anabolism at a median of 54
kcals/kg/d, compared to the days where subjects were considered catabolic receiving only 17
kcals/kg/d (Figure 2) (1). It was concluded that in the acute phase after cardiac surgery, the
administration of >55 kcals/kg/d and >1.0g protein/kg/d, was associated with anabolism (1).
Figure 2. Anabolism and Catabolism for Protein and Energy intakes in Children Post Cardiac Surgery
(A) Protein intake in g/kg/d and (B) energy intake in kcals/kg/d days with anabolism compared with days of catabolism. Reproduced with permission of: Taylor and Francis Ltd. © (1)

20
2.3.1 Nitrogen Balance in Critically Ill Children
There are several studies that have examined nitrogen balance in conjunction with
energy expenditure in a heterogeneous group of critically ill children including a subset of
children with CHD. Joosten et al performed indirect calorimetry and nitrogen balance using
UUN, to evaluate institutional feeding protocol, a subset of the sample studied were diagnosed
with CHD (62). They determined that children with a higher protein intake of 2.2 ± 0.2 g/kg/d
were in a positive balance, whereas those in a negative balance received less protein at 0.9 ± 0.2
g/kg/d (62). However, protein utilization was found to be lower in the first group, the authors
concluded that this could be explained by the higher protein intake and/or the nitrogen sparing
effect of a higher fat intake (62). Median nitrogen excretion was 230 mg/kg/d (range, 68 to 493
mg/kg/d) and it was determined that 1.4 g/kg/d of protein was sufficient to promote nitrogen
equilibrium (62). Furthermore, nitrogen balance positively correlated with energy intake and
resting energy expenditure (REE), and both energy and protein intake increased with a positive
nitrogen balance (62).
In a randomized controlled trial, a comparison of protein enriched formula versus a
standard age-appropriate formula was examined over 5 days. The median age of the infants was
7 months with a mean weight of 7.7 kg of the total sample studied 73.2% were post cardiac
surgery (24). In this particular study nitrogen balance was analyzed using UUN, including an
adjustment factor of 1.25, and factoring 20% for other body losses of nitrogen (24). Positive
nitrogen balances were observed in the protein enriched group on study day 5, while balances
remained negative in the standard formula group (24).

21
2.3.2 Relationship of Energy and Protein Intake to Nitrogen Balance
The provision of adequate energy and protein that matches estimated needs is essential
when developing nutrition therapies for the hospitalized child in order to reduce complications
that may be associated with nutrient deficits. Protein contributes to energy consumption when
either the body’s limited carbohydrate stores have been utilized or during times of energy
restriction (72). Long et al first reported a relationship between energy expenditure and nitrogen
loss during injury from surgery, trauma or burns (73). The investigators found that in adults
there was a parallel increase in energy expenditure and urinary nitrogen losses during increased
periods of stress (72).
In view of the literature in critically ill children there is an association between positive
nitrogen balance with higher energy and protein intakes (23). Protein retention has been shown
to correlate with protein intake, energy intake and energy storage (73). This relationship was
demonstrated in a group of post-surgical neonates, protein retention was approximately 90% for
those receiving 2.0 g protein/kg/d and 75 kcals/kg/d of non protein energy (73). Also, it was
shown that protein retention could be improved with increasing energy intake, children
receiving an average protein intake of 2.6 g/kg/d, were in a positive balance when energy intake
exceeded expenditure by 24% (73).
A match between energy and protein delivery is required to maintain LBM stores. If an
energy deficit exists, protein, either from a breakdown of body reserves or as supplied by the
diet, will be used as a source for energy (39). Therefore the level of energy delivered determines
a change in nitrogen balance depending on an individual’s protein requirement (37). In
summary, it is important to consider disease specific influences when designing nutritional

22
therapies that will provide an adequate amount of non-protein energy for protein to be utilized
effectively.
2.4 Energy Expenditure in Infants Following Surgery
Nutrition support goals in the post-operative stage of recovery are aimed at providing
sufficient energy and protein to meet metabolic demands, with the goal of limiting catabolism of
body stores to fuel metabolic processes (34). In healthy term infants, energy requirements are
divided into those required for basal metabolism, diet induced thermogenesis, activity and
energy required for growth (74). Alternatively, energy expenditure in the post-surgical infant
varies and is directed towards the stress response. During this time growth ceases and activity is
minimal (75). As determined in several studies, post operative energy expenditure
measurements are comparable to basal metabolic rates of a healthy infant (3, 75-78). It has been
postulated that growth is supressed during major surgery due to a diversion of protein and
energy from growth to tissue repair and the production of stress mediators (22).
2.4.1 Energy Expenditure in Children Post Cardiopulmonary Bypass
The metabolic response to injury or surgery is proportional to the inciting stress,
resulting in an increase in breakdown of proteins, fats and carbohydrates (19, 79). These
processes provide substrate for tissue repair and the immune response which requires energy
(29). In the immediate hours following major abdominal operations in newborn infants, energy
expenditure increased and peaked between 2-4 hours, returning to baseline between 12-24 hours
(3). Additionally, resting energy expenditure remained unchanged for 5-7 days after surgery (3,
80). This effect was also reported by Li et al, where REE was increased in the first 8 hours
following CPB surgery, followed by a rapid decrease to a relatively stable period until muscle
relaxant medications were discontinued (81). Measuring energy expenditure throughout the

23
disease process is useful for the determination of adequate non-protein calories required to
promote protein utilization for wound healing and recovery.
In a study by DeWit et al, measured energy expenditure (MEE) performed at different
time points from 0-7 days was investigated in 21 children post cardiovascular surgery, a subset
sample was studied post CPB (82). Results revealed that there was an increase in REE of 73.6 ±
15.1 kcals/kg/d for those post CPB versus 58.3 ± 10.9 kcals/kg/d for children who did not
undergo CPB, the difference between the two was found to be statistically significant (82).
In another study, REE was measured in 27 children for three days post cardiovascular
surgery, including both palliative and corrective repairs (83). Results were similar to the
previous study for the group that did not undergo bypass surgery. Resting energy expenditure
measurements were 55 ± 8.0 kcals/kg/d. These results were found to be significant when
compared with predicted basal metabolic rate for healthy children (83).
Avitzur et al measured REE in children with cyanotic versus acyanotic disease,
calorimetry measurements were performed either through a mechanical ventilator or a canopy.
Measurements were taken on day 1 prior to surgery, and on days 1 and 5 post surgery (84).
There was no statistical difference in REE between the cyanotic or acyanotic groups on either
day 1 or 5 post surgery. Measures on day 1 were 57 ± 13 versus 58 ± 9 kcals/kg/d, and on day 5
results were 59 ± 10 versus 62 ± 10 kcals/kg/d (84). The investigators further analyzed the
results by combining data for each group in order to compare the difference in REE prior to and
following surgery, a significant difference did not occur between 58 ± 11 versus 62 ± 10
kcals/kg/d (84).
Mitchell and colleagues used the doubly labeled water method (2H218O) to measure
energy requirements one week prior to cardiovascular surgery and 6 hours after surgery. By

24
measuring the relative loss of each isotope from the body water pool, they were able to calculate
the rate of carbon dioxide production for the measurement of total energy expenditure (25).
Energy expenditure measured by indirect calorimetry, fell sharply in the second six hours
following surgery compared to REE measures prior to surgery. Additionally, energy expenditure
was significantly lower than normal healthy age matched controls (25).
Li et al studied energy expenditure in a uniform group of infants post CPB following the
Norwood procedure (a first stage surgical technique used to repair hypoplastic left heart
syndrome) (81). The sample consisted of 17 infants, ranging from 4–92 days of age (81).
Resting energy expenditure measurements were determined serially over 72 hours post CPB.
Mean REE values ranged from 39 ± 7 to 43 ± 11 kcals/kg/d, refer to Table 2 for study data
details (81). The results of this study provide an estimate of energy expenditure in a high-risk
group of infants following CPB surgery.
Table 2. Oxygen Consumption, Carbon Dioxide Production, Respiratory Quotient, Energy Expenditure and Caloric Intake in Infants Following the Norwood Procedure Day 0 Day 1 Day 2 Day 3 VO2, mL/kg/min 6.1 ± 1.5a 5.4 ± 1.1 5.4 ± 0.9 5.6 ± 0.8 VCO2, ml/kg/min 5.4 ± 1.3b 5.1 ± 1.0 5.0 ± 1.0 5.4 ± 0.8 RQ 0.89 ± 0.09b 0.93 ± 0.10 0.93 ± 0.10 0.98 ± 0.09 EE, kcal/kg/day 43 ± 11c 39 ± 8 39 ± 7 41 ± 6 Caloric intake, kcal/kg/day 3 ± 1d 14 ± 5a 31 ± 16 51 ± 16 % of caloric intake to EE 8 ± 4d 34 ± 13a 74 ± 41c 119 ± 47 p values (analysis of variance) for any difference between the 2 sequential days: a p < .001, b p < .05, c p < .01, d p < .0001. Reproduced with permission of: Lippincott, Williams and Wilkins Inc.© (81)
There are several factors that influence REE measurements in critically ill children,
including the magnitude of the stress response, the presence of infections and whether there is a
metabolic adaptation to starvation (29, 85). Also, there are the effects of sedation or muscle
relaxation, which can decrease muscle tone consequently decreasing energy required for
physical activity (84). Additionally, other factors for consideration are the differences in age,

25
weight and time of indirect calorimetry measurements. In view of these collective factors, it is
difficult to translate results from these studies to assist with developing appropriate nutritional
therapies for this unique group of infants.
2.5 Energy and Protein Deficits in Critically Ill Children
2.5.1 Energy Deficits in Post Surgical Children
A select group of investigators who measured REE post cardiac surgery also collected
data on energy delivery. Results are consistent across studies, indicating that a deficit in energy
delivery occurs in the immediate postsurgical period. In one particular study the results of MEE
compared to the delivered energy indicated that on post operative day 1 children required 67.8
kcals/kg/d however, received only 15.9 kcals/kg/d (82). A trend of increasing energy delivery
was observed over a week, with energy intake surpassing MEE by day 6/7, however did not
reach statistical significance presumably due to the small sample size (82).
Consistent with results from the previous study, other investigators have shown a
significantly lower energy delivery compared to measured REE in their study populations at
approximately 40 to 55 kcals/kg/d (1, 81). As indicated in Table 2, minimal energy intakes
existed on days 0 and 1 however, by day 3 energy intake exceeded MEE (81).
A study conducted by Rogers et al examined the adequacy of nutritional support in
critically ill children. In this study 43% of the children were cardiac surgical patients, with a
median age of 0.8 months and a median energy intake 31.3% of estimated energy requirements
(86). An important finding was that the cardiac surgical group of children were fasted longer,
had more inadequate nutrition and a more pronounced fluid restriction compared to the non-
cardiac group of children (86). Furthermore, 62% of patients had feeds stopped or interrupted
for surgery, procedures or multiple extubation attempts which again was found to be more

26
significant in the cardiac group (86). Of nutritional concern, only 50% of the children in the
study achieved full estimated energy requirements after a median of 7 days in the ICU (86).
2.5.2 Protein Deficits in Post Surgical Infants
Protein deficits following cardiac surgery have been reported in a limited number of
studies. In an investigation of growth hormone/insulin-like growth factor -1 and its relationship
to nitrogen balance in a group of post surgical cardiac infants, protein intakes on study days 1, 2
and 7 were 0, 0.6 and 1.8 g/kg/d, respectively (87). Similarly, Li et al reported low protein
intakes on study days 1 and 2 that increased by day 3, at 0.2 ± 0.2, 0.6 ± 0.5 and 0.9 ± 0.5 g/kg/d
(81). In another investigation it was identified that catabolism occurred at a low protein intake of
0.1 g/kg/d (range 0-1.0 g/kg/d) throughout a three day study period (1).
A typical reason for nutrient deficits following cardiac surgery is the common practice of
restricting fluids due to hemodynamic instability, which is often a contraindication to the
provision of enteral nutrition (88). Once the infant is medically stable, feeding intolerance can
limit delivery of optimal enteral feeding. Although post-pyloric feeding has been associated
with improved enteral delivery, there are instances when inserting a naso-duodenal or jejunal
tube isn’t possible due to the child’s clinical status (89). Additionally, anecdotal observations of
attempts to place a tube in the correct position can be unsuccessful. Other factors impeding
enteral delivery include, delaying feeds due to inaudible bowel sounds, feeding interruptions for
diagnostic tests or multiple extubations, high gastric residual volumes and tube displacement
(86, 90). While parenteral nutrition is the next logical step to providing adequate nutrition,
intravenous access may be unavailable due to medication infusions required to maintain cardiac
output, which may or may not be compatible with PN. Collectively, these factors cannot be
predicted or circumvented thus catabolism may be intensified in the critically ill infant.
27
A combination of insufficient energy intake with a persistent catabolic state may have
longer term consequences of contributing to poor growth post-operatively. Unfortunately,
cumulative energy and protein deficits for a subset of acutely ill infants may be unavoidable in
the immediate post surgical period due to prolonged medical instability. Consequences of this
include a reduction in body nutrient reserves that can contribute to respiratory compromise and
cardiac arrhythmias (29).
Following cardiovascular surgery, particularly for children requiring CPB, there are
ongoing challenges to providing adequate nutrition to meet both energy and protein needs. In
the immediate period after operation, nutritional needs can be altered by an intense stress
response (91). Also, medication infusions essential in the management of a patient’s
hemodynamic status limit fluid availability for the delivery of nutrition to provide adequate
energy and protein during a critical period.
2.6 Growth Failure in Infants with Congenital Heart Disease
There is a large body of literature examining growth impairment and challenges in
providing sufficient nutrition to children with CHD (92). The infant with CHD may not shadow
the same growth and development patterns as the healthy infant. Growth challenges for this
fragile group can begin in utero and extend from infancy into childhood (15). Advancements in
surgical procedures, combined with early interventions after birth has increased the number of
survivors resulting in a growing population of children with associated morbidities (93). As
demonstrated in several studies, a high incidence of growth delays occurs following the first
palliative surgery for infants with hypoplastic left heart syndrome (HLHS), a cyanotic heart
disease (36). Contributing factors to nutritional compromise associated with surgery are the type
of surgery, post-operative clinical management and residual cardiac anatomic or hemodynamic
abnormalities (93).
28
2.6.1 Birth Weight in Congenital Heart Disease
At birth, evidence of compromised growth occurring in utero is apparent for many infants
diagnosed with CHD as indicated by lower birth weights (94, 95). In a population based case-
control trial, the Baltimore-Washington Infant Study, the relationship between birth weight for
infants with CHD was compared to a control group (94). It was revealed that within most
diagnostic categories a greater percentage of infants with CHD demonstrated a lower birth
weight (birth weight ≤ 2500g) in comparison to controls (94). The authors noted that infants
with HLHS were more likely to be small for gestational age than those in other categories (94).
Similarly, Kramer et al examined birth weights of 843 infants with CHD to a healthy reference
group. The investigators also reported that a greater proportion of infants with CHD were
classified as small for gestational age, defined as a birth weight <10th percentile (≤ 2500g) (95).
Birth weight classifications are important in the assessment and development of nutrition
care plans as depending on the cardiac lesion surgical repair for a lower birth weight neonate
may be necessary in the first week of life. Thus, it is critical to ensure appropriate nutrition
delivery prior to and immediately following surgery for this vulnerable group. There are
conflicting opinions regarding the timing of total corrective surgical repair for low birth weight
neonates (96, 97). Waiting for somatic growth to occur prior to surgery for improved outcomes
isn’t fully supported in the surgical literature (97). Further, delaying repair by relying on
supportive therapy or palliative surgeries that do not require CPB has been associated with
higher morbidity (96). Although it has been reported that birth weight and gestational age do not
impede successful surgical outcomes, age and low weight are considered important risk factors
(9, 96). Low birth weights of infants with complex single ventricle defects (i.e. HLHS) are
recognized as being at a higher risk for mortality (9).
29
2.6.2 Postnatal Growth and Malnutrition
A high incidence of protein-energy malnutrition in children with CHD has been
described (11). There are multiple factors contributing to growth failure and the onset of
malnutrition, including inadequate intake, ineffective utilization of energy, increased energy
expenditure with increased respiratory rate, and decreased absorption, occurring especially
during stress or infectious episodes (11, 12, 32). As reparative surgery is necessary for many
infants with CHD, its implications on growth and recovery are worthy of careful consideration.
In a study of hospitalized children with CHD, acute and chronic wasting was investigated
retrospectively, it was found that in those ranging from birth to adolescence, 33% suffered from
acute wasting, while 64% were growth stunted due to chronic malnutrition (11). Approximately
79% of the sample showed failure to gain weight (11). Another study investigating malnutrition
in 89 infants and children with heart lesions, found that 65% of the them were below the 5th
percentile for weight and 41% were below the 5th percentile for height (18). Moderate to severe
malnutrition was more common in those patients with pulmonary hypertension (18).
Several studies have investigated preoperative and postoperative nutritional status by
analyzing weight-for-age z scores (WAZ) (10, 12, 93, 98-100). Adverse consequences of protein
energy malnutrition in post-surgical infants with HLHS was investigated by Kelleher et al, it
was reported that low WAZ scores were consistent with malnutrition following stage one
palliation repair (12). A meaningful finding from this study was that during hospitalization in
the infant’s first month of life, median weight at discharge was unchanged from admission.
Additionally, 50% of all infants were severely underweight when readmitted for major
cardiovascular surgery (12). Of importance, the authors found that those who received PN
during initial hospitalization had significantly higher WAZ scores at discharge (12).

30
In a retrospective study of post surgical infants who had a Glenn procedure (surgical
technique) the average age at the time of operation was 5 months (10). The infants’ median
weight was 5.7kg, with a reported WAZ score of -1.3 (10). Between surgeries, 89% of infants
failed to meet average daily weight gain goals of 22.5g/d, the median daily weight gain was
reported to be 16.5g/d (10). This group also investigated WAZ scores in a population of infants
with two-ventricle physiology. Likewise, median age-for-weight score decreased from -0.2 at
surgery to -1.2 at discharge (100). And a considerable decline in growth velocity occurred
between birth and hospital discharge (100). One of the factors reported to be associated with
decreased z scores was delayed post-operative nutrition (100).
In a recent prospective cohort study, investigators examined post-operative growth in
infants with functionally univentricular hearts, the most common diagnosis was HLHS (93).
Despite a mean birth weight of 3.3 kg, it was reported that 23% of infants within all diagnostic
groups were defined as small for gestational age (93). On average, the change in WAZ scores
from surgery to discharge resulted in a -1.5 decrease (93). Similar to the previous study an
increased rate of growth failure occurred by hospital discharge (93).
Reporting from these studies serves to highlight that growth failure in CHD and
consequently nutritional deficiencies are characteristics of disease for this high risk population.
Between surgical periods there are reports of infants having difficulties achieving weight gain
goals and adequate nutritional intake (10, 12). The question remains as to whether instituting
timely and adequate nutrition immediately following surgery, in an attempt to limit catabolism
of body mass stores, will impact postoperative growth outcomes and length of stay.

31
2.7 Nutritional Status and Methods of Analysis in Acute Illness
In the immediate post-operative period growth is not expected or deemed a goal of
nutrition therapy for the critically ill child. Standard objective measurements of nutritional status
for a patient in an intensive care unit may be difficult to obtain due to their medical management
and fluctuating clinical status. The aim of nutritional therapy during this period is directed
towards nitrogen equilibrium in an attempt to maintain body nutrient stores. Nitrogen balance
techniques provided an assessment of relative body protein losses during periods of stress. As
reported, a corresponding change occurs between the rate of weight loss and the rate of nitrogen
loss (101). Evidence of LBM losses as indicated by negative nitrogen balance could further
impact the clinical status of those with preexisting malnutrition, or with compromised
respiratory function, especially if a negative balance persist (23).
2.7.1 Body Composition
Estimates of body composition in infants have been revised, based on recent studies and
data from the National Center of Health Statistics (102). Body protein in both males and females
from birth to 12 months is approximately 12.2 to12.9% of body weight (102). In comparison to
the protein stores of a healthy adult of approximately18%, an infant’s body protein is
considerably less (103). This appreciable difference is crucial given the implications on growth
and development when adequate amounts of protein are not supplied, particularly when
compounded by periods of acute illness or stress.
In order to support the catabolic demands as a result of injury, infants rely on their
carbohydrate and fat stores (29). Carbohydrate stores remain constant throughout the life span
and do not provide adequate reserve and lipids provide a source of substrate depending on the
fat mass of the individual (29). As fat deposition occurs with growth, the cardiac infant failing to
32
thrive has limited stores to support a stress response or to rely on during periods of starvation.
Consequently, the infant with CHD is more likely to be affected by the adverse effects of
surgical injury or stress in the presence of reduced stores and higher baseline metabolic
requirements (29).
2.7.2 Methods of Body Composition Analysis
Measurements of body composition to evaluate nutritional status incorporates an
analysis of fat mass and fat free mass, which can be performed through imaging techniques or
simple anthropometry (102). Methods used for anthropometric analysis include measuring mid
arm circumference and tricep skinfolds (39). In a study of infants following cardiac surgery,
skinfold measurements were obtained prior to surgery and at ICU discharge. It was reported that
these measures were not significantly different between each time and were not valuable
indicators of nutritional status in the acute phase following surgery (1). More sensitive methods
of body composition analysis include, bioelectrical impedance analysis, dual-energy X-ray
absorptiometry, computerized tomography and measurements obtained through BodPod air
displacement plethysmography (104, 105). To our knowledge these body composition analyses
have not been routinely performed in critically ill children.
Appreciating the clinical status and environment of the post-operative severely ill infant,
obtaining accurate body composition analysis would be problematic. For example, bedside
measure of anthropometrics and bioelectrical impedance analysis have low sensitivity and
reproducibility due to abnormal hydration status during an acute period following surgery (104).
Other sensitive measures of body composition are generally performed in research laboratory
settings and are inconvenient as they cannot be performed at the bedside (104). The indications

33
for these methods may be better suited for healthy individuals or those with chronic disease as
measurements can be easily measured on those deemed to be more clinically stable.
When considering the limited LBM stores of an infant and superimposing the association
of catabolism with worsening clinical outcomes, there is significant value in performing
nitrogen balance assessments to determine catabolism for a postoperative group that is at risk for
increased complications (104). For the preservation of LBM, maintaining nitrogen equilibrium
would be a fundamental component of nutrition therapy for infants recovering from CPB
surgery. Parenteral nutrition serves as a nutrition support modality that can immediately provide
energy and macronutrients to lessen the adverse effects of body mass breakdown.
2.7.3 Serum Protein Markers of Nutritional Status
In addition to body composition analysis, other methods of assessing protein status are
by evaluating biochemical measures of visceral proteins. Albumin and prealbumin are not
considered to be reasonable markers of nutritional status in an acutely stressed state due to,
increased synthesis of acute phase reactants, with a corresponding decrease in visceral protein
synthesis (106, 107). Low levels of these transport proteins are indicators of illness severity
rather than nutritional status (34). Furthermore, there are other factors that alter serum albumin
levels including, infection, surgery, dehydration, protein losses and the administration of
albumin or other blood derivatives (24).
Another acute phase protein that is a biomarker of acute and chronic inflammation is
C-reactive protein (CRP) (108). It has been suggested that changes in the hepatic synthesis of
CRP is proportional to the degree of surgical stress (19, 25). In a study conducted by Mitchell et
al the acute phase response of CPB in children was investigated through examining the changes
in plasma proteins and other metabolites (25). It was found that CRP concentrations increased

34
12 hours following cardiopulmonary bypass reaching a peak at 48 hours, returning to normal by
day 5 (25). The duration of time for CRP levels to normalize is significant as it indicates a
reasonably prolonged stress response.
2.8 Metabolic Response to Injury and Surgical Management
2.8.1 Protein Metabolism During Injury and Stress
During periods of stress there is a redistribution of amino acids from skeletal muscle
tissue to the wound or to tissues involved in the inflammatory response (29). Amino acids are
released from endogenous protein stores for the synthesis of enzymes, acute phase proteins and
glucose (19). The catabolism of muscle stores to provide glucose for gluconeogenesis and
proteins for inflammation is considered a short term adaptive response (4). During the acute
recovery period the degree of protein turnover for an infant is greater than it is for a child who is
stable, with a reported 25% increase in protein degradation following surgery (71). As
previously highlighted in this review, studies performed in surgical neonates have shown that
increasing energy and protein improves protein balance by stimulating protein synthesis, despite
a constant rate of protein degradation (71). In critical illness both the breakdown and synthesis
of whole body protein are increased however, during the stress response, breakdown is greater
than synthesis (4). Similar to critically ill adults, acutely ill children present in negative nitrogen
balance and show clinical signs of weight loss and skeletal muscle wasting (29).
2.8.2 Cardiopulmonary Bypass and Stress
In designing nutritional therapies for the post-operative infant the metabolic and
physiologic effects of surgery require careful attention. The response to injury has been
described as catabolic, involving the mobilization of body substrate to provide metabolic

35
intermediates that support stress induced processes (Figure 3) (19, 25). The acute metabolic
stress response following surgery is characterized by the following, an alteration in the
endocrine-metabolic environment, release of cytokines, increase in protein breakdown, lipolysis,
glycogenolysis and increased oxygen consumption (47). Tissue damage elicited from cardiac
surgery occurs from CPB, hypothermia and conventional surgical stress (25). Cardiopulmonary
bypass stimulates an inflammatory response that is activated by the CPB circuit components
coming into contact with blood (109). Other influences on inflammation are ischemia-
reperfusion injury, heparin-protamine interactions, release of endotoxins and the surgical insult
(109). Although the mechanisms of this inflammatory response are beyond the scope of this
review it is important to appreciate that biological changes resulting from CPB contribute to
significant systemic effects, ranging from postoperative edema to more severe multiorgan
dysfunction (109).
Figure 3. Metabolic response to acute injury
!"#$%&'()*+",-&.,"*#&*(./0+1***
!
"#$%&'()
Energy REE !
Cytokine – TNF ! Counter regulatory hormones !
Growth hormone ! IGF -1 "
CRP – C-reactive protein, IGF-1 – insulin like growth factor 1, REE – resting energy expenditure, TNF – tumor necrosis factor, U3MH urinary 3-methylhistidine Adapted and reproduced from: Lipincott, Williams and Wilkins. © (19)
Carbohydrate & Fatty Acid Oxidation !
Visceral proteins Albumin ", prealbumin "
!
Acute phase reactants C reactive protein !
!
Gluconeogenesis Total urinary nitrogen !
Muscle U3MH "
!

36
It has been hypothesized that the acute phase response occurs as a reaction to tissue
injury and has an immunological and protective role (25). Consequences of an intense stress
response following CPB are activation of the immune-neuroendocrine axis and inflammatory
cascade (29, 91). Further, complex alterations in hormonal and metabolic processes cause an
increase in catabolic hormones (epinephrine, nor-epinephrine, glucagon, cortisol), and a
decrease in anabolic hormones (insulin and insulin like growth factor-1) (19). As a result of
counter-regulatory hormone release hyperglycaemia occurs due to an increase in hepatic glucose
production and insulin resistance, which are common after surgery (91).
The direct actions of growth hormone (GH) are facilitated by insulin like growth factor 1
(IGF-1) (87). Accordingly, increased protein catabolism occurs from changes in the GH-IGF-1
axis, which stimulates growth through an increase in amino acid uptake, protein synthesis and
cell proliferation and/or differentiation (87). In a study by Balcells et al, GH/IGF axis and its
relationship to nitrogen balance was examined in children undergoing cardiac surgery (87).
Differences in urinary GH excretion throughout the study period reached statistical significance
however did not correlate with nitrogen balance. It was reported that UUN was elevated
throughout the study demonstrating a negative nitrogen balance (87).
Another consideration associated with the effects of surgery is the post-operative
inflammatory response that causes a release of amino acids from muscle tissue initiating the
synthesis of proteins to regulate this response (110). The protein changes that occur have been
referred to as anabolic inefficiency, whereby net protein loss exceeds protein body mass gain,
resulting in negative nitrogen balance (110). Interpreting the concentrations of plasma amino
acids to understand this process is problematic as levels vary considerably depending on the
intensity and duration of critical illness, along with the patient’s existing metabolic and
nutritional status (110).

37
If an acute or prolonged inflammatory stress response does not respond to medical
management it may greatly influence the degree of body mass breakdown, and impact
nutritional therapies designed to moderate this response. The effects and management of CPB
are also important to consider in the development of nutritional therapies, which are directed at
achieving nitrogen balance after surgery. Providing early post-operative nutritional support may
assist with stimulating anabolism needed for repair of tissues and to enhance the immune
response (106).
2.8.3 Surgical Management and Glucocorticoidsteroids
Glucocorticoids are often indicated in order to reduce the inflammatory response to
CPB, in an attempt to decrease the incidence of postoperative complications (9). Administering
corticosteroids preoperatively is reported as beneficial in inhibiting the cellular inflammatory
response, decreasing proinflammatory to inflammatory interleukin ratios and minimizing tissue
edema (111-113). Postoperatively, in the presence of low cardiac output hydrocortisone is
provided to improve the patient’s hemodynamic status (114).
In a randomized prospective blinded study of infants with CHD, it was hypothesized that
administration of dexamethasone prior to surgery would reduce inflammatory mediator release
and improve their post-operative course (115). Serum measurements of interleukin–6 and
tumour necrosis factor–alpha during CPB were significantly lower in the treatment group versus
the control group (115). Also, it was reported that the treatment group had fewer infectious
episodes and improved respiratory gas exchange, resulting in fewer days of mechanical
ventilation and an earlier discharge from the ICU (115). Similar findings were concluded in a
recent study conducted by Heying et al, interleukin–6 concentrations in the group treated with
dexamethasone were significantly lower than controls (116). While at the same time serum

38
concentrations of interleukin–10 were higher in the treatment group at the end of CPB and one
hour after surgery (116). The authors concluded that corticosteroids given prior to CPB assisted
with minimizing the inflammatory response (116).
As shown in both animal and adult studies, corticosteroids result in protein wasting,
which is attributed to an increase in protein breakdown or a decrease in synthesis (117). The
effect of dexamethasone on protein metabolism was studied in a group of preterm infants with
bronchopulmonary dysplasia. The investigators found a positive correlation between nitrogen
excretion and dexamethasone (117). This effect was demonstrated in neonates receiving high
doses, resulting in impaired weight gain and lower nitrogen balance measurements due to an
increase in proteolysis versus a decrease in synthesis (117). This study highlights the importance
of dose dependent corticosteroid medications and the impact on body protein catabolism. And
raises the question as to whether administration of steroids results in increase catabolism during
surgery, which may influence the nutrition prescription designed to provide optimal support.
2.8.4 Index of Stress
Severity of illness scores has been evaluated in several studies examining nitrogen
balance in critically ill children. The pediatic risk of mortality (PRISM) score is composed of 14
physiological variables with 23 variable ranges (118). A higher score is an indicator of greater
stress. Investigators studying nitrogen balance in critically ill children analyzed PRISM scores
to distinguish the level of stress, it was suggested that higher nitrogen excretion may have
occurred due to elevated stress as indicated by a mean PRISM score of 10 ± 7 points (46).
Additionally, in a similar group of children, a median PRISM score of 7 indicated a moderate
severity of illness (62). The evaluation of this score contributes to a greater understanding of a
subject’s level of stress and the possibility of increased catabolism

39
3.0 CHAPTER 3: DETERMINATION OF PROTEIN NEEDS USING NITROGEN BALANCE IN INFANTS IMMEDIATELY POST CARDIOPULMONARY BYPASS SURGERY 3.1 Introduction
3.1.1 Rationale
In 2012, at the Hospital for Sick Children, there were approximately 178 corrective cardiac
surgeries requiring CPB in infants’ ≤1 year of age diagnosed with severe heart defects.
Currently, for this unique surgical paediatric population there is limited research to suggest the
amount of energy and protein required to produce nitrogen balance in the immediate post-
operative period. As children with moderate to severe CHD present with growth failure, the
delivery of adequate nutrition during all phases of their disease course is important, particularly
in the post surgical period where energy and protein deficits occur (81, 93).
At the onset of this present study no one to our knowledge had investigated protein
needs through TUN in this post operative group. However, there were several studies
investigating nitrogen balance in infants following gastrointestinal surgeries. As a result, the
infants from these studies were considered as a reference group for our research. It remains
unknown as to whether CPB induces a comparable, if not a heightened, stress response in
infants following cardiopulmonary bypass surgery compared to those recovering from
gastrointestinal surgery. Appreciating the differences in surgical techniques it would seem
prudent to infer that our current standard protein delivery of 1.5 g/kg/d would be insufficient to
produce a state of nitrogen balance in infants post CPB.
Therefore, the purpose of this research was to evaluate graded levels of protein intake to
determine a level required to prevent negative nitrogen balance. In this study nitrogen balance

40
was determined using the Kjeldahl technique to analyze the pattern of TUN excretion in
relation to parenteral protein intake in infants immediately following CPB.
3.1.2 Research Hypothesis
Increasing parenteral protein greater than the current clinical practice of 1.5 g/kg/d will
result in positive nitrogen balance in critically ill infants recovering from cardiopulmonary
bypass surgery.
3.1.3 Objective
To measure nitrogen balance in a group of post surgical infants with congenital heart
disease, in response to graded intakes of protein. The control group will receive the standard
prescription of 1.5 g/kg/d and the intervention groups will receive 2.2 and 3.0 g/kg/d,
respectively.
3.2 SUBJECTS AND METHODS
3.2.1 Subjects
Infants were recruited from the Cardiac Critical Care Unit at The Hospital for Sick
Children between, September 2009 to July 2011. Infants less than 12 months of age post CPB
surgery were screened to determine study eligibility. To be enrolled in the study infants needed
to be born ≥ 36 weeks gestation and weighing ≥ 2.5 kg, at the time of recruitment. For the study
to occur it was expected that each subject would have a urinary catheter in place for up to 72
hours post surgery and central intravenous access for the infusion of a concentrated PN solution.
Exclusion criteria for this study consisted of hepatic failure defined as alanine amino
transferase and aspartate transaminase ≥ 500 UL and an international normalized ratio ≥ 2.5 (not

41
accounted for by therapeutic anticoagulation), renal failure was defined as serum creatinine
levels twice the upper limit of normal for age (≤36 mmol/L), a diagnosis of sepsis, confirmed by
a positive blood culture treated with antibiotics, and excessive blood loss from chest tubes at 5
ml/kg/hr, for ≤ 6 hours following admission to the Cardiac Critical Care Unit, as indicated by
the need for frequent blood transfusions. Additionally, those requiring Extra Corporeal
Membrane Oxygenation support were not eligible for this study.
The study protocol, consent and data collection forms were approved by the Human
Research Ethics Committee, at The Hospital for Sick Children (Toronto, Canada). Permission
was obtained from the Director of the Critical Care Unit and attending physician before subject
enrolment proceeded. Written informed consent was obtained from parent(s) of children in the
postoperative period (Study Consent Form, Appendix A).
3.2.2 Study Design and Protocol
Our research design was a prospective, randomized intervention study. Each infant
enrolled into the study was block randomized to one of three protein intake levels, the control
group received a standard protein delivery of 1.5 g/kg/day, and the intervention groups received
2.2 or 3.0 g/kg/day, respectively. The three protein levels were designed to determine a
difference in TUN production between levels.
The second and third levels of protein delivery were chosen based on previous studies
performed in infants fed similar levels post gastrointestinal surgery (66, 70, 119). We concluded
that 3.0 g/kg/d, would be the highest level that could be realistically achieved given current fluid
restrictions. The second level of 2.2 g/kg/d was the mid-point to determine if a difference in
nitrogen balance could be detected. The two intervention levels were studied in an effort to
determine with greater accuracy a protein level sufficient to produce nitrogen equilibrium.

42
Eligible infants were initiated on parenteral nutrition post CPB. The prescription of
energy and protein remained constant throughout the study period. Following an adaptation
period on PN, three successive timed 24-hour urine collections were completed for nitrogen
balance analyses. Refer to figure 4, for an outline of the study design.
Figure 4. Nitrogen Balance Study Design
Infants admitted to CCCU post CPB surgery
N = 27
1.5 g/kg/d n=9
2.2 g/kg/d n= 9
3.0 g/kg/d n=9
Nitrogen Balance 1st 24 hour - urine collection
Nitrogen Balance 2nd 24 hour - urine collection
Nitrogen Balance 3rd 24 hour - urine collection
Non-protein calories 40 ± 5 kcals/kg/d
PN adaptation
Subject block randomized to parenteral protein intake

43
3.2.3 Nutrition Therapy
3.2.3.1 Parenteral Nitrogen Intake
All infants were initiated on ProSol™ (Baxter Healthcare, Toronto, Canada) amino acid
solution. Three infants were changed to Primene® (Baxter Healthcare, Toronto, Canada)
(Appendix B, product monographs) (120, 121). A change to Primene® occurred during the study
period for its reduced acetate content in response to an infant’s acid-base balance status.
Composition details of each amino acid solution are shown in Table 3.0, Primene® is primarily
indicated for neonates weighing less than 5.0 kg due to its improved amino acid profile of
essential and non-essential amino acids (121). Alternatively, ProSol™ is a concentrated amino
acid solution generally used for children in the Cardiac Critical Care Unit (CCCU) who are fluid
restricted. Given the reality of significant fluid restrictions of the infants in our study and the
need to prioritize volumes to provide essential drugs and blood products, ProSol™ was selected
for its higher amino acid concentration in less fluid.
Except for their protein content, the amino acid content of the PN solutions were
essentially comparable as they are composed of a mixture of essential and non-essential amino
acids necessary for metabolism (Table 3). According to Pierro, the ideal quantitative
composition of amino acids remains controversial and there doesn’t appear to be convincing
data to support the selection of one amino acid solution over another, for newborn infants (22).
Indicator amino acid studies performed in TPN-fed piglets and infants have contributed to our
understanding of parenteral requirements and based on the results of these studies it has been
reported that current commercial preparations are not ideal (122).
Protein delivery was calculated based on the infants preoperative weight or birth weight,
depending on the measure that was available at the time of study, as daily weights were not

44
measured in the immediate post-operative period due to medical instability and technical
difficulties. Pre-operative weight measures were performed on Scaletronix Paediatic Scale 4802.
Table 3. Primene® and ProSol™ Intravenous Amino Acid Solution Compositions
ProSol™ 20% amino acid solution
Primene®
10% amino acid solution Amino Acid
g/100ml Nitrogen g/100ml
Amino Acid g/100ml
Nitrogen g/100ml
Isoleucine 1.08 0.115 0.67 0.072 Leucine 1.08 0.115 1.00 0.107 Valine 1.44 0.172 0.76 0.091 Lysine 1.35 0.259 1.10 0.211 Methionine 0.76 0.071 0.24 0.023 Phenylalanine 1.00 0.085 0.42 0.036 Threonine 0.98 0.115 0.37 0.044 Tryptophan 0.32 0.044 0.20 0.027 Arginine 1.96 0.631 0.84 0.270 Histidine 1.18 0.320 0.38 0.103 Alanine 2.76 0.434 0.80 0.126 Aspartic Acid 0.6 0.063 0.60 0.063 Cysteine 0 0 0.19 0.022 Glutamic Acid 1.02 0.097 1.00 0.095 Glycine 2.06 0.384 0.40 0.075 Proline 1.34 0.163 0.30 0.037 Serine 1.02 0.136 0.4 0.053 Tyrosine 0.05 0.004 0.04 0.003 Taurine Ornithine HCl
0 0
0 0
0.06 0.32
0.007 0.053
Product Monograph Total Amino Acids
20
10
Total Nitrogen 3.209 1.516 University of Guelph Laboratory Total Nitrogen
2.961
1.415
3.2.3.2 Parenteral Non-Protein Prescription
In this investigation the amount of non-protein energy was determined by results from a
study performed at our institution. We considered the participant and surgical characteristics of
the population studied by Li et al, comprising of infants diagnosed with single ventricle
physiology who had CPB surgery. This group closely matched the population of interest for this

45
study. The measured REE of the infants in Li’s study of 40 ± 5 kcals/kg/d was used in this study
protocol.
Parenteral solutions were prepared at The Hospital for Sick Children in the parenteral
pharmacy. The prescription was comprised of non-protein energy as dextrose providing 7.50
g/kg/d (or 5.2 mg/kg/min, glucose infusion rate), and Intralipid® 30% intravenous fat emulsion
(Fresenius Kabi, Sweden), providing 1.44 g/kg/d. The summation of these substrates provided
non-protein calories of 40 ± 5 kcals/kg/d. Parenteral volume required to support this study
design ranged from 26-42 ml/kg/d, depending on the infant’s weight and level of protein
investigated (Appendix C). Additional parenteral energy delivered from intravenous
medications suspended in 5% dextrose was recorded and calculated for inclusion into total
parenteral energy intake.
Minerals, trace elements and vitamins were provided according to The Hospital for Sick
Children’s standard parenteral additions for age (123).
3.2.3.3 Enteral Nutrition Energy and Protein Delivery
When it was deemed safe to feed by the attending physician, enteral nutrition was
initiated through a nasogastric feeding tube placed during surgery. Enteral nutrition was started
when the infant’s hemodynamic status was stable as indicated by the delivery of inotrope
medications (i.e. norepinephrine, epinephrine, vasopressin) at doses ≤ 0.05 µ/kg, and if there
were no concerns of gastrointestinal compromise. In the CCCU enteral feeding is not routinely
initiated with the infusion of high doses of inotrope medications (i.e. ≥ 0.05 µ/kg), as the
potential for reduced intestinal blood flow attributed to these medications increases the risk of
necrotizing enterocolitis (124). When these medications were infused at doses ≤ 0.05 µ/kg

46
minimal volume feeds were initiated as per postoperative feeding guidelines at 1ml/kg every
three hours. Advancement of enteral nutrition was dependent on the infant’s clinical status.
Enteral nutrition was in the form of expressed breast milk (EBM) or commercially
prepared infant formula. Intake volumes were recorded throughout the study period. The
calories delivered enterally were included with parenteral energy delivery for the determination
of total energy intake. The amount of nitrogen contained in the protein delivered from either
EBM or infant formula was accounted for in nitrogen input calculations.
3.2.4 Blood Biochemistry Monitoring & Safety
Blood samples were drawn from an arterial line or a central venous line into heparin-
coated tubes as per CCCU routine biochemistry post-operative protocol and for PN monitoring
(Appendix D). Biochemical values were recorded throughout the study period. To monitor
tolerance to the higher levels of protein delivery blood urea nitrogen, creatinine and acid base
blood gases were recorded.
3.2.5 Nitrogen Collection and Calculations
3.2.5.1 Urine Collection
Following an adaptation period on the PN prescription, the first timed 24 hour urine
collection for TUN was initiated. In hospitalized patients it has been recommended to use 3
consecutive complete 24 hour urine collections to account for intra-subject variation of urinary
nitrogen excretion (66). Urine was collected from a closed system urinary bag that was attached to
a urinary Foley catheter placed in the infant during surgery as part of routine care. Urine samples
were collected in a container with 30% hydrochloric acid, approximately 1ml per 50ml of urine.
Hydrochloric acid was used to prevent bacteria from breaking down urinary nitrogen. This acid

47
was added to the collection bottle in the lab using universal precautions for handling biological
and chemical substances.
Following the completion of each 24 hour collection, the amount of urine was measured in
a volumetric flask, recorded and two representative aliquot samples were stored at -200C until
analysis.
3.2.5.2 Additional Urine Losses
Urine leakage around the catheter site is common, this occurs due to the limitations of
catheter positioning and/or in combination with high doses of diuretic therapy that results in
increased urine output. Urine voided into the diaper was estimated as the difference between the
weight of the wet diaper to that of a dry diaper, for recording into the patient’s chart in millilitre
measurements. These losses were recorded for each subject and added to the daily urine output as
measured in the lab, under the assumption that the concentration of urinary nitrogen would be
standard throughout a 24 hour period.
3.2.5.3 Other Nitrogen Losses
In this population of infant’s nitrogen losses from stool, sweat and skin are considered
negligible (31). As these losses are considered inconsequential to nitrogen balance calculations
they were not measured in this study. Blood losses post-operatively vary depending on amount
of chest tube output and blood taken for biochemical analysis as dictated by the patient’s
medical status. Due to technical difficulties in quantifying this source of nitrogen loss it was not
considered in this study.

48
3.2.5.4 Nitrogen Balance Calculation
Nitrogen balance was calculated as nitrogen intake minus nitrogen excretion, expressed
as mg/kg/d. Refer to table 4, for intake and output parameters of the nitrogen balance equation.
Table 4. Nitrogen Balance Equation
Nitrogen Intake Nitrogen Calculation
Parenterala (PN) Primene® ProSol™
NI (mg/kg/d) = [(0.1415g N x amino acid intake g/d) x 1000]/weight (kg) NI (mg/kg/d) = [(0.1481g Nb x amino acid intake g/d) x 1000]/weight (kg)
Enteral (EN) Human Milk Standard Cow’s Milk Infant Formula
NI (mg/kg/d) = [0.16g Nc x protein intake g/d) x1000] /weight (kg)
Nitrogen Output NO (mg/kg/d) = (Total Urinary Nitrogen as quantified by Kjeldahl mg/ml x
urine output ml/d)/weight (kg)
Nitrogen Balance Equation
Dietary Nitrogen from PN & EN (NI) – Total Urinary Nitrogen (NO) = NB
N – Nitrogen, NB – nitrogen balance, NI – nitrogen intake, NO – nitrogen output a From Guelph Laboratory analysis, Primene® and Prosol™ b 20% ProSol™, contains 2.961g N per 100ml, therefore 10% ProSol™ (to balance 10% Primene®) provides1.481gN per100ml c A standard factor of 16% nitrogen (or 6.25g protein contains 1g of nitrogen) content in protein was applied to all forms of EN
3.2.6 Laboratory Analyses
3.2.6.1 Urine Analysis
Urine samples were analyzed for TUN at the Agriculture and Food Laboratory facility at
the University of Guelph using Kjeldahl method (125). All samples were packaged in dry ice for
shipment to the laboratory. Total nitrogen analysis was performed using Kjeldahl digestion and
automated spectrophotometric determination. This method was separated into three steps
digestion, distillation and titration. Each urine sample (1ml) was oxidized by heating and
refluxing sulphuric acid in the presence of an added catalyst (peroxide). The ammonium

49
sulphate was reacted with sodium hypochlorite to form chloramine, which then reacted with
phenol to form the final blue product, indophenol. The colour was proportional to the quantity
of ammonia present in the distillate as measured on a spectrophotometer against a known
standard curve (125).
3.2.6.2 Parenteral Amino Acid Analysis
For quality control purposes pure samples of Primene® and ProSol™ amino acid
solutions were sent to Guelph laboratory for nitrogen determination using the Kjeldahl method
as previously described. These results were compared to the composition of amino acids
published from the manufacture’s product monograph. For ProSol™ comparative results of
Guelph’s analysis and the manufacturers product monograph was within 7.7% (2.961 versus
3.209g N/100ml) and for Primene® there was a difference of 6.7% (1.415 versus 1.516g
N/100ml) (table 3). In this study, total nitrogen content of the parenteral samples as quantified at
Guelph laboratory were used in our study calculations, in accordance with applying the same
analysis used for the determination of nitrogen in the study urine samples.
3.2.7 Collection of Data
The following data were collected from review of the medical records including,
demographic data consisting of: gestational age, age at time of surgery, gender, chromosome
abnormalities and as available anthropometric measures of, birth weight, length and head
circumference, preoperative weight, length and head circumference and weight at CCCU
discharge. Additional data encompassing, date and time of surgery, sternal closure and urinary
catheter removal was recorded. Surgical data consisted of, surgical diagnosis, type of surgery,
CPB time and aortic cross clamp time. Other data recorded were stooling episodes, steroid

50
medications, antibiotics, and blood products given as packed red blood cells (PRBC) or frozen
free plasma (FFP). See Appendix E, for data collection forms.
Urine output volume to the nearest millilitre as measured in the laboratory was recorded
daily. Plus additional volume from voided urine in the infants diaper as measured by nursing
staff and entered into the patient’s chart was recorded.
Nutrition data collected daily during the study period were parenteral volume delivery,
dextrose delivery from medications and the type and amount of enteral nutrition as recorded in
the patient’s medical chart.
3.2.8 Statistical Analyses
The primary outcome variable was the change in nitrogen balance between protein
levels. In order to calculate the sample size, subject sample sizes from two nitrogen balance
studies in infants post gastrointestinal surgery were used for comparison to determine an
appropriate sample size for this study (66, 70). Group sample sizes were calculated to detect a
-0.075 standard deviation (SD) change in nitrogen balance between protein levels, with an 80%
power at an alpha level of 0.05. An estimated total sample size of 27 infants, 9 per group, was
required to show a difference.
Using the General Linear Model, age, preoperative weight and non-protein energy
delivery was analyzed to determine if differences existed in our study population. All statistical
analyses were performed with SAS software (version 9.1: SAS Institute Inc., Cary, NC, USA).
Results were considered significant at p < 0.05.
To determine distribution of the data, diagnostic plots of the residuals were performed.
An interaction test was done between protein levels and intake days. From Fit Test statistics

51
ANOVA was conducted using ProcMix (SAS code), controlling for subject, protein intake and
days of study. Testing for interaction between protein levels and days of study with subject and
time as a repeated measure. Data for all variables are expressed as mean ± SD.
3.3 RESULTS
3.3.1 Clinical Details
Infants were mechanically ventilated throughout the study period and received
analgesics and sedatives, with or without inotropes and/or neuromuscular blockade medications.
Parenteral nutrition was initiated within 29.6±11.5 hours post CPB. Parenteral nutrition infused
for a period of 14.9±1.0 hours until the first timed 24 urine collection was initiated. This time
period was defined as the PN adaptation period. Following the first 24 hour urine collection two
successive timed 24-hour urine collections were completed for nitrogen balance analyses.
3.3.2 Participation
As shown in figure 5, 32 families were approached to participate in the study. Informed
consent was obtained for 25 infants. Reasons for refusal to participate were, not interested in
research n=2, already consented to several studies n=3, unknown n=2. There were no
withdrawals from the study, 21 infants completed three study days. Reasons for incomplete
collections were central line removal (n=1), urinary catheter removal (n=2), one infant was
excluded due to early removal of the urinary catheter.

52
Figure 5. Participation Flow Chart
3.3.3 Participant Characteristics
The study sample consisted of 16 infants (< 1 month of age), 2 infants (1-3 months), 3
infants (4-6 months), and 3 infants (7-12 months). The average age of the infants was 2.2
months (range 2 to 281 days). There was no statistical difference in the ages between protein
groups (p=0.76). There were two infants with Di George syndrome (randomized to 3.0 g/kg/d
protein group). Cardiac malformations are common in infants with Trisomy 21 and 22q11.2
deletion (5). Without literature to suggest that protein needs of those diagnosed with Trisomy 21
or 22 would be altered after surgery, these infants were screened for inclusion into this study.
During the extended course of their CCCU admission two infants died (randomized to 1.5
g/kg/d protein group) however, not during the study period. The median post-operative length of
CCCU stay was 16 days (range 6-41 days). Refer to Table 6.0 for complete details of participant
characteristics.
Approached N = 32
Declined participation n = 7
• Unknown reason, n=2 • Did not want to participate in research, n=2 • Participating in several studies, n=3
Provided consent
n = 25
Completed
3 study days n = 21
Excluded n = 1
Urinary catheter removed
Completed
2 study days, n = 2 1 study day, n = 1

53
3.3.4 Surgical Characteristics and Operative Data
Surgical characteristics and operative data are summarized in table 5. In the 1.5 g/kg/d
group, 5 of the 8 infants were diagnosed with HLHS. There was only one infant with this defect
in each of the intervention groups. See Appendix F, for complete surgical details.
In the 2.2 g/kg/d protein group, the median operative CPB time was the highest at 166
minutes (IQR 117.5). Additionally, this group had the longest aortic cross clamp time at a
median of 129 minutes (IQR 135).
Table 5. Surgical Characteristics and Operative Data
Diagnosis Protein Groups g/kg/d n=24
1.5 2.2 3.0
Dextrocardia 1 Double outlet right ventricle 1 1 Double inlet right ventricle 1 1 Hypoplastic left heart syndrome 5 1 1 Interrupted aortic arch 1 1 L-atrial isomerism 1 Severe aortic stenosis 1 Shones complex 1 Tetralogy of Fallot 2 Total anomalous pulmonary venous defect 1 1 1 Transposition of the great arteries 1 Truncus arteriosis 1 Operative Procedure Times, minutes Median (IQR)
Cardiopulmonary bypass 135 (44.5) 166 (117.5) 104 (71.5) Aortic cross clamp 56 (32) 129 (135) 75 (33)

54
3.3.5 Perioperative Growth Status
The nutritional status of the infants in this study was examined through anthropometric
measurement z scores for birth weight and surgical weight-for-age, surgical length-for-age and
surgical weight-for-length. Using the World Health Organization reference standards that reflect
the expected pattern of growth in healthy breast-fed infants, a z score of “0” represents the 50th
%ile of weight for age, and a z score of -2 is approximately at the 3rd%ile (93). No statistically
significant difference was found in the surgical weights of infants across feeding groups
(p=0.20). Surgical length-for-weight z scores revealed that growth deficits were more
pronounced in the 3.0g/kg/d group (Table 6).
Table 6. Baseline Characteristics
Characteristics Protein Groups g/kg/d Mean ± SD
1.5 n=8
2.2 n=8
3.0 n=8
Age of enrolment, mo 2.8 ± 3.4 2.1 ± 3.0 1.6 ± 2.5
Male gender, n 4 5 5
Gestational age at birth, wk 38.3 ± 1.9 38.6 ± 1.7 38.5 ± 1.5
Anthropometrics
Birth weight, kg, n 3.22 ± 1.2 (7) 3.27 ± 0.2 (8) 3.12 ± 0.9 (7)
Birth weight-for-age z score -1.25 ± 1.22 -0.12 ± 0.45 0.19 ± 0.93
Surgery weight, kg 4.61 ± 2.0 3.66 ± 0.6 3.56 ± 0.5
Surgery weight-for-age z score -0.65 ± 1.67 -1.53 ± 2.26 -1.04 ± 3.27
Surgery length, cm 55.4 ± 8.12 50.4 ± 5.20 52.9 ± 3.79
Surgery length-for-age z score, n -1.02 ± 2.34 (7) -1.25 ± 1.49 (7) -0.70 ± 2.73 (8)
Surgery weight-for-length z score, n -0.13 ± 1.22 (6) 0.34 ± 1.99 (7) -1.35 ± 1.55 (8)
Differences between groups for categorical variables were assessed using General Linear Model, results were considered significant at p≤0.05. No statistically significant differences were found.

55
3.3.6 Nutrition Delivery
3.3.6.1 Non-protein Energy Delivery: Enteral and Parenteral
Parenteral non-protein energy delivery was similar across groups, closely matching the
protocol prescription of 40 ± 5 kcals/kg/d as shown in table 7. Additionally, intravenous
dextrose delivery from medications provided approximately 9% of total calories within each
protein level. There was no difference in total energy intake from both PN and EN, among the
three groups (p=0.46).
Throughout the study period EN accounted for 4.3% to 6.5% of total calories, depending
on the group. Of the 24 infants, 12 received EBM, 7 received standard infant formula, and 2
received a combination of EBM and infant formula. For infants receiving 1.5g/kg/d protein,
enteral volume intake over 3 days ranged from 4 to 68ml/d. Intake volumes ranged from 4 to
45ml/d and 3 to 35ml/d for those receiving 2.2 and 3.0 g/kg/d, respectively. Only one infant in
each group did not receive EN throughout the study period.
Table 7. Non-protein Energy from Parenteral and Enteral Nutrition, kcals/kg/d
Protein Groups kcals/kg/d Mean ± SD
1.5 2.2 3.0 Parenteral nutrition 39.5 ± 1.7 39.1 ± 2.3 39.3 ± 1.7
Enteral nutrition 3.0 ± 2.4 2.1 ± 0.8 2.8 ± 1.6
Intravenous dextrose 5% 4.4 ± 3.0 3.3 ± 1.9 4.2 ± 1.5
Total Non-protein Energya 46.6 ± 5.1 44.3 ± 4.2 46.3 ± 4.0 a Differences between groups for total energy intake were not statistically significant as determined by GLM.

56
3.3.6.2 Protein Delivery: Enteral and Parenteral
Parenteral protein delivery approximately matched the prescription levels as designed in
the study protocol (Table 8). Due to minimal enteral volume delivery of EBM or standard infant
formula, protein from these sources did not significantly contribute to total nitrogen intake.
Table 8. Total Parenteral and Enteral Protein Intake, g/kg/d
Protein Groups g/kg/d Mean ± SD
1.5 2.2 3.0 Parenteral protein 1.40 ± 0.02 2.00 ± 0.09 2.76 ± 0.08
Enteral protein, (*) 0.08 ± 0.06 (16) 0.07 ± 0.03 (12) 0.08 ± 0.04 (15) *Number of day’s enteral feeds received throughout study period
3.3.7 Urine Samples
Urine samples were collected from 24 infants with complete 3 day urine output data for
21. Twenty four hour urine outputs were completed on 2 infants for 2 days and for 1 on a single
study day. A total of 68 nitrogen balance measurements were analyzed. The ranges of urine
output, including amounts voided into the diaper, for each protein intake group was 33-263
ml/kg/d (1.5 g/kg/d protein), 24-214 ml/kg/d (2.2 g/kg/d protein) and 67-210 ml/kg/d (3.0 g/kg/d
protein).
3.3.8 Nitrogen Balance Results
A statistical difference was demonstrated on study day 1 between protein intakes
1.5 g/kg/d and both the intervention levels of protein, 2.2 g/kg/d (p≤ 0.03) and 3.0 g/kg/d,
(p ≤ 0.001). However, 2.2 g/kg/d protein was not significantly different from 3.0 g/kg/d on this
study day. No statistical difference was found between protein intake levels on study days 2 or 3
(Table 9).
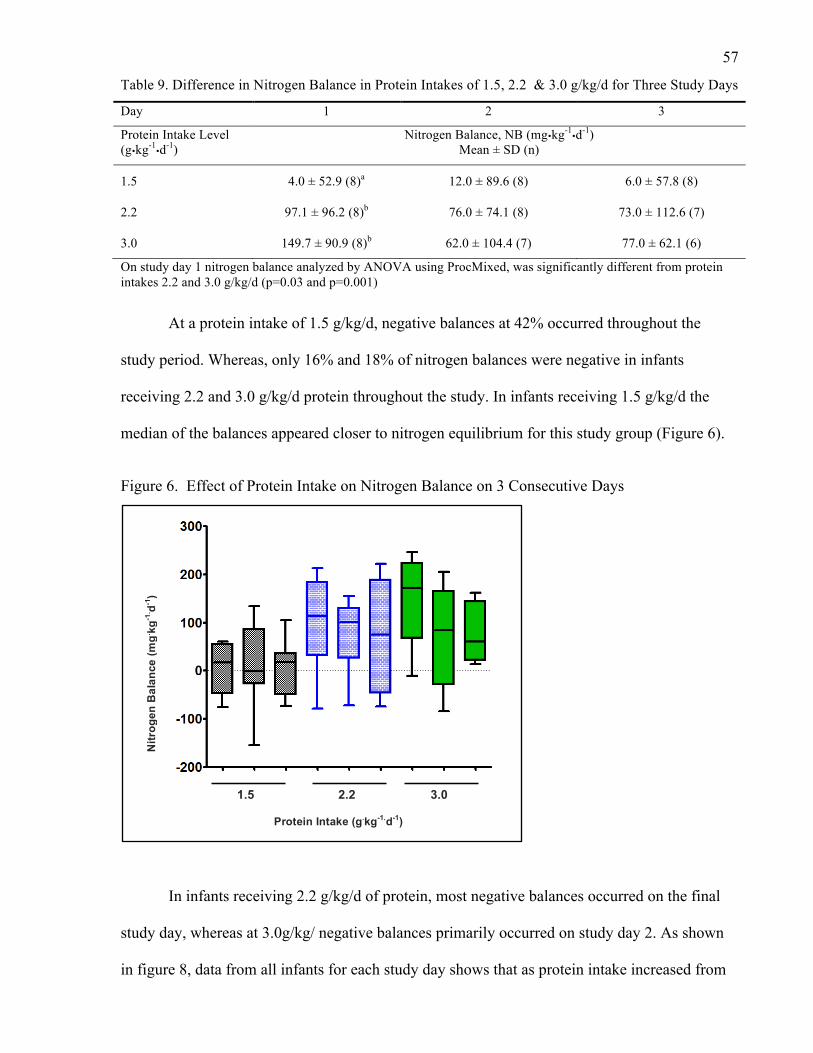
57
Table 9. Difference in Nitrogen Balance in Protein Intakes of 1.5, 2.2 & 3.0 g/kg/d for Three Study Days
Day 1 2 3
Protein Intake Level (g�kg-1
�d-1) Nitrogen Balance, NB (mg�kg-1
�d-1) Mean ± SD (n)
1.5 4.0 ± 52.9 (8)a 12.0 ± 89.6 (8) 6.0 ± 57.8 (8)
2.2 97.1 ± 96.2 (8)b 76.0 ± 74.1 (8) 73.0 ± 112.6 (7)
3.0 149.7 ± 90.9 (8)b 62.0 ± 104.4 (7) 77.0 ± 62.1 (6)
On study day 1 nitrogen balance analyzed by ANOVA using ProcMixed, was significantly different from protein intakes 2.2 and 3.0 g/kg/d (p=0.03 and p=0.001)
At a protein intake of 1.5 g/kg/d, negative balances at 42% occurred throughout the
study period. Whereas, only 16% and 18% of nitrogen balances were negative in infants
receiving 2.2 and 3.0 g/kg/d protein throughout the study. In infants receiving 1.5 g/kg/d the
median of the balances appeared closer to nitrogen equilibrium for this study group (Figure 6).
Figure 6. Effect of Protein Intake on Nitrogen Balance on 3 Consecutive Days
In infants receiving 2.2 g/kg/d of protein, most negative balances occurred on the final
study day, whereas at 3.0g/kg/ negative balances primarily occurred on study day 2. As shown
in figure 8, data from all infants for each study day shows that as protein intake increased from
!
!
1.5 2.2 3.0
Protein Intake (g.kg-1.d-1)
Nitr
ogen
Bal
ance
(mg. kg
-1. d-1
)

58
1.5 g/kg/d there was a corresponding increase in nitrogen balance measurements at higher
protein intakes.
Figure 7. Protein Intakes 1.5, 2.2, 3.0 g/kg/d, versus Nitrogen Balance (NB)
The spread of the data for each level of protein intake illustrates wide variability (Figure
8). The most noticeable variation in nitrogen balance occurred at a protein intake of 1.5 g/kg/d,
with 5 infants in a negative balance on different study days. Additionally, the magnitude of
negative balance was most prominent at this level with a measurement of -155 mg/kg/d.
Whereas negative balances at protein levels 2.2 and 3.0 g/kg/d, were -79 and -84 mg/kg/d,
respectively.
At the intervention protein intakes (2.2 and 3.0 g/kg/d), only two infants were in a
negative balance at each level throughout the study period. The positive nitrogen balance ranges
for these groups were 12-222 and 6-247 mg/kg/d, respectively. Whereas the balance range for
infants receiving 1.5 g/kg/d was, 6-133 mg/kg/d. Refer to Appendix G, for complete nitrogen
balance data.

59
Figure 8. Nitrogen Balance Results for Each Protein Intake Level
A) Nitrogen Balance on Days 1, 2 and 3 for Protein Intake 1.5 g.kg-1.d-1
B) Nitrogen Balance on Days 1, 2 and 3 for Protein Intake 2.2 g.kg-1.d-1
C) Nitrogen Balance on Days 1, 2 and 3 for Protein Intake 3.0 g.kg-1.d-1

60
3.4 DISCUSSION
3.4.1 Nitrogen Balance
The present study was performed to assess an amount of protein delivery that would
result in nitrogen balance in a group of surgical infants with severe cardiac defects following
CPB. To our knowledge this is the first study to investigate three different parenteral protein
intakes using TUN analysis to determine nitrogen balance in this unique paediatric population.
As the effects of surgical injury are dynamic processes with considerable inter-patient
unpredictability, the examination of three protein intake levels provided valuable information on
balance measurements at each level, which has clinically relevant implications on the design of
future nutrition prescriptions.
In this study, a statistical difference in the mean nitrogen balances between infants
receiving 1.5 g/kg/d and both 2.2 (p<0.03) and 3.0 g/kg/d (p < 0.001), occurred on the first day
after surgery. However, no statistical significance occurred between 2.2 g/kg/d and 3.0 g/kg/d
on this study day. Also, no differences in nitrogen balances were found between protein levels
on study days 2 or 3. For the purpose of designing nutrition prescriptions aimed at providing a
sufficient amount of protein in the least amount of fluid, a finding of 2.2 g/kg/d is more
achievable in this clinical setting. The subject sample size in this study could have limited the
ability to determine a difference on study days 2 and 3.
An observed trend of increasing positive balances was noted between the lowest level of
protein intake and the intervention levels, 58% of balances were positive at an intake of 1.5
g/kg/d, whereas, at higher intakes of 2.2 and 3.0 g/kg/d the percentages of positive balances
increased to 83% and 81%, respectively. These findings support previous research that
demonstrated nitrogen balance improves with increasing protein provision (110). Coss-Bu et al
61
examined this trend in a group of critically ill children, at an average protein intake of 2.8 g/kg/d
versus 1.7 g/kg/d, there was an association with positive balances at the higher intake (46).
Additionally, in a similar group it was demonstrated that children with a protein intake of 2.2 ±
0.2 g/kg/d were in a positive balance, which was significantly higher than those receiving 0.9 ±
0.2 g/kg/d, who were in a negative balance (62). Of note, energy delivery in these studies was
approximately 60-78 kcals/kg/d. In a study of post-surgical cardiac infants, an association of a
positive balance occurred with increasing amounts of protein, from a median of -0.7 g/kg/d to
1.1 g/kg/d (1). Yet, in this study energy intake was substantially lower at 55 kcals/kg/d (1). In
summary, these studies infer that positive nitrogen balances occur at several different protein
intakes within a range of energy intakes.
The objective of this study was to determine nitrogen balance in order to assess a level of
protein that would indicate reduced catabolism for infants following CPB surgery. Infants
receiving the standard protein prescription of 1.5g/kg/d appeared to be in a more exaggerated
negative balance throughout the study period. This may be considered clinically relevant, if
approximately half of the infants receiving 1.5 g/kg/d were catabolic, it would seem judicious to
design a prescription containing a higher level of protein of 2.2 g/kg/d, to ensure equilibrium or
positive balance. This level of protein may be necessary to maintain nutrient reserves during
periods of acute stress.
Limitations inherent in nitrogen balance methods pertain to the accuracy of the
measurements, false positive balances are made due to the overestimation of intake and the
underestimation of losses (39). Further, incomplete measurement of losses could erroneously
result in a positive nitrogen balance. Although losses from skin and stool after surgery are
reported as negligible and may not contribute greatly to nitrogen output, other losses consisting

62
of blood, pleural or peritoneal drainage may contain a quantifiable source of nitrogen that could
alter overall nitrogen balance. It is conceivable that accounting for these collective losses may
have had a significant effect on balance measurements resulting in a greater number of infants
presenting in negative balance. Therefore, the apparent balances observed in this study could
have potentially been artificially positive.
At each level of protein intake positive balances occurred throughout study days 1 to 3,
with an energy delivery of approximately 44 to 47 kcals/kg/d. Positive balance measurements
occurred at the standard protein level of 1.5 g/kg/d, implying that energy provision was adequate
to promote anabolism for some infants. The amount of energy delivery in this study is
reasonably consistent with the results of the study conducted by Teixeira-Cintra et al, who
demonstrated that children recovering from cardiovascular surgery were anabolic receiving a
median of 1.1g/kg/d protein and 55 kcals/kg/d (1). Although the amount of protein required to
achieve nitrogen balance was slightly lower than our standard prescription, the investigators in
the previous study employed UUN analysis to determine nitrogen balance, which has been
shown to underestimate nitrogen excretion, resulting in false-positive balances (44).
3.4.2 Protein Adaptation
A possible explanation for not finding statistical significance between each of the study
days could be due to the period of acclimation to the parenteral protein intake. The significant
differences between the intervention protein intake levels on day 1 was no longer evident on
days 2 or 3, which may have been due to a continuing adaptation process occurring on study day
1. In this study, the adaptation time on PN was 14.9 ± 1.0 hour prior to starting the first 24 hour
urine collection. From PN initiation to study day 2 the average time of PN delivery was 53.6 ±
11.5 hours. If considering the dynamic changes in protein flux occurring in the body, a more
accurate nitrogen balance may have been detected by study day 3, as protein adaptation may
63
have occurred by this final study day. In a study of critically ill children, nitrogen balance was
studied once their diets had equilibrated for 48 hours (27). In some very early adult studies
nitrogen balance was used to determine protein requirements after a 5-7 day period of
stabilization on a tested level of protein (126). However, these studies were performed in
healthy individuals consuming solid food diets.
Ideally, it would be rigorous to study TUN in critically ill children for a longer period, of
5 to 7 days, to ensure protein adaptation has occurred. However, in an intensive care setting this
is generally not feasible as clinical care dictates early urinary catheter removal to minimize the
incidence of infection, which would make urine collections more difficult to obtain.
Additionally, during recovery there would be several changes in a patient’s metabolic status due
to alternations in medical management, nutrition practices and activity levels. These factors
could possibly add greater variability to balance results making it difficult to interpret the
results.
3.4.3 Nitrogen Balance and the Stress Response
Negative balances occurring at the higher protein intake levels of 2.2 and 3.0 g/kg/d may
be explained by an ongoing stress response or a change in clinical status causing more stress on
one day versus another. It is probable that continuing hormonal and metabolic alterations post
operatively persisted. As discovered by Briassoulis et al, studying a group of critically ill
children, despite a protein intake of 2.8 ± 0.17 g/kg/d, negative nitrogen balance occurred by
study day 5, it was suggested that contributors to these findings were the presence of sepsis or
multi-organ failure (28). Although the infants in the current study were excluded in the presence
of these inciting stresses an underlying mild degree of infection could have resulted in

64
catabolism however, this was not fully examined. In this study, three infants were investigated
for sepsis, though cultures were unrevealing. Of note, each of these infants was in a positive
nitrogen balance throughout the study period.
Further, as previously mentioned, the amount of protein required to maintain nitrogen
balance in critically ill patients depends on their level of stress, severity of the inflammatory
response and organ function (46). Nitrogen excretion is related to the degree of injury and
metabolic status of the patient. Studies evaluating UUN in acutely ill children have reported a
range of nitrogen losses between 170 - 254 mg.kg-1.d-1 (46). Correspondingly, in a study
measuring TUN, the average amount of nitrogen excretion in a similar paediatric population was
higher at 347 mg.kg-1.d-1 (46). In this study, the average TUN across the study days and within
each protein intake level was 269 mg.kg-1.d-1 (range 88-542 mg.kg-1.d-1), these results are
consistent with studies in critically ill children that report a variable range of balances.
Nevertheless, it is problematic to compare our results to those of other studies due to a
compilation of factors consisting of: varying methods of nitrogen analysis, distinctly different
diagnoses, variances in stress levels and differences in subject ages, and weights.
Another factor that may have contributed to increased stress in the infants presenting in
negative balance, is the procedure of sternal closures performed at the patient’s bedside. For
patients who return to the ICU with an open sternum, closure can be delayed for several days
after CPB, depending on their hemodynamic and pulmonary stability. As reported in the
literature, blood glucose levels, an indicator of stress, increase following sternotomy (127).
Thus, it is likely that a similar response occurs during sternal closure. Of the 24 infants studied 6
had an open sternum throughout the study period. During this time 56% of the balances were
negative. The inability to perform sternal closures on these select infants may imply a greater
degree of illness, which could be indicative of increased stress. Interestingly, none of the infants
65
who had chest closures either prior to the study or on days 1 or 2 were in a negative nitrogen
balance. Perhaps suggesting that they were less acutely ill, with the study prescription meeting
their energy and protein needs on those days.
3.4.3.1 Evaluation of the Stress Response
In this study PRISM scores were measured for 84% of the study days. These scores were
within a similar range regardless as to whether the infants were in a positive or negative balance,
7-32 (median 15) and 9-28 (median 18), respectively. Those in a negative balance did not
present with higher PRISM scores as might be expected. A study in critically ill children
reported scores ranging from 6-18, with lower scores found in those receiving EN implying that
they were less acutely ill (46). By comparison, the median PRISM scores in the infants in this
study were relatively high, inferring that infant’s post CPB exhibit a greater stress response than
those studied in a heterogeneous population of critically ill children.
3.4.4 Nitrogen Balance and Clinical Factors Indicated in Post-operative Status
The relationship between nitrogen balance and clinical variables was not examined in
this study. However, other investigators have considered the effects of medications, severity of
illness, creatinine height index and stress mediators (1, 20). Consideration to these factors can
be valuable in enhancing an understanding of the stress response occurring in infants post CPB.
Thus, these factors may guide clinicians in developing improved nutrition therapies aimed at
reducing catabolism of body mass stores.
In one particular study, investigators collected data on vasoactive agents and
neuromuscular blockade medications. They found that patients supported on these drugs were in
a more negative nitrogen balance, which was statistically significant on study day 5 (28). It was

66
proposed that the study patients were enduring a prolonged stress state, hence were more acutely
ill given that these medications were still required by day 5 of their ICU admission (28). The
infants in this investigation received a combination of vasoactive and neuromuscular blockade
medications during the study period however, these were not accounted for in our final analysis.
As suggested in the literature, for an accurate determination of nitrogen balance all body
losses of nitrogen should be accounted for in calculations (45). In this study infants sweat losses
were considered minimal and stool losses were minor. Stooling episodes were recorded for 13
inants. There were no stools recorded on 69% of the total study days. Only one infant in the 2.2
g/kg/d group presented with excessive stooling on days 1 and 2 of the study (8 and 6 episodes
per day), nitrogen balance results were positive on both days. Despite the infant being in a
positive nitrogen balance it is likely that stooling output contributed to a degree of nitrogen loss.
Additionally, other non-routinely measured losses from chest tubes, peritoneal drains and blood
may have added to increased nitrogen losses that were not captured in this study. Collectively,
these introduce a level of error, through an underestimation of nitrogen losses more infants
could have been in a negative balance had these losses been considered.
Another potential miscalculation could have occurred from measurements of urine
voided into an infant’s diaper. As this volume could not be accurately collected, it may have
influenced the content of urinary nitrogen output. In a study by Helms et al, for a collection to
be complete at least 80% of actual urine output was required for measurement (56). In the
infants in this study, 89% of voided volumes into the diaper were less than 20% of a total urine
collection on a given day. Possible factors to account for an increase in voided volumes could
have been due to increase doses of furosemide (diuretic) to promote diuresis for chest closure, in
combination with technical aspects of urinary catheter positioning that would result in leakage
around the tube.

67
Also, at the onset of this study we set out to examine nitrogen balance in a narrow age
group of infants from 0-3 months. Due to difficulties with recruitment our sample population of
infants was expanded to 12 months of age. At the time of operation our study sample had WAZ
scores ranging from approximately -0.70 to -1.2, indicating a degree of growth impairment
(table 6), which is in agreement with the current literature (12, 32, 128). In consideration to an
infant’s age there is generally a corresponding higher weight and thus better nutritional status
prior to surgery may occur for older infants than with younger ones. Although at surgical
admission mean WAZ scores were low across all groups there were some infants in this study
who had adequate weight measures for age and perhaps better stores to rely on during periods of
stress.
Clinical factors that challenge approaches to nutrition therapy in the immediate period
are fluid restrictions and gastrointestinal intolerance (86). Post operatively fluid intake is strictly
controlled, given the nature of severe fluid restrictions in the management of this surgical group
designing nutrition prescriptions that provide adequate protein in the least amount of fluid is
paramount to an infant’s recovery. As suggested by Skillman et al, haemodynamic instability
can limit nutrition delivery, thus the time to return to a stable state may require the institution of
PN therapy (88). Additionally, it has been shown that children receiving PN had improved WAZ
scores at discharge (12). Although a shorter time receiving parenteral nutrition was associated
with a decrease in WAZ scores (12). Parenteral nutrition is a viable form of therapy to offset
some of the challenges associated with nutrient deficits in this vulnerable group. Concentrated
amino acid solutions can deliver sufficient amounts of protein to promote nitrogen balance as
was demonstrated in this study.
Moreover, certain aspects of nutrition provision in an ICU require thoughtful
consideration. As reported in the literature, cardiac patients were fasted for longer and

68
experienced greater feeding interruptions, which were identified as main barriers to providing
estimated energy requirements (86). Also, as widely stated, protein energy malnutrition exists
among children with cardiac disease resulting in a greater prevalence of acute and chronic
wasting (11, 12, 86). In view of this, it seems rather primary that nitrogen balance is achieved
post-operatively to potentially lessen further nutritional deficits. Therefore, a combination of
providing PN with EN, or PN when enteral feeding is contraindicated is ideal and has been
justifiably supported in the literature (12, 90). In this study we were able to achieve adequate
delivery of protein and energy to promote a positive nitrogen balance through the use of
concentrated amino acid and lipid solution.

69
CHAPTER 4: CONCLUSION AND FUTURE DIRECTIONS
4.1 Conclusion
Nutrition delivery is largely inadequate in paediatric intensive care units resulting in an
increase prevalence of malnutrition in critically ill children (4). Deficits in protein and energy in
children with CHD have been elucidated in several studies (1, 81, 82, 87). It is increasingly
being appreciated that nutrition is necessary in the maintenance of body composition, metabolic
and physiological functioning in critically ill infants, including those with CHD (86). Due to a
scarcity of studies investigating protein needs in infants immediately post CPB this study was
designed to determine a level of protein that would produce nitrogen balance after surgery in a
nutritionally vulnerable population.
This distinct group of infants with CHD are reported as being nutritionally compromised
prior to surgery, which can be exacerbated by operative stress that results in biological and
physiological alterations, that accelerates body mass breakdown (129). Consequently,
inadequate nutritional therapy can result in unfavourable outcomes if not provided timely after
surgery. An understanding of protein balance is clinically useful especially for a population that
is at risk for marked catabolism during an acute or prolonged stressed state. Of clinical
importance, one of the findings emerging from this study was that infants receiving 1.5 g/kg/d
of protein were in a more negative balance than those receiving the higher protein intakes of 2.2
and 3.0 g/kg/d. In view of our study findings and considering that other protein containing fluid
losses were not measured, a protein intake of 2.2 or 3.0 g/kg/d, appears to be more clinically
appropriate to ensure nitrogen balance occurs. Additionally, these higher amounts may be
required in the development of nutrition therapies that are designed to assist with reducing
cumulative energy and protein deficits.
70
As positive nitrogen balances occurred equally at both 2.2 and 3.0g/kg/d of protein, it
would be reasonable to suggest that providing 2.2 g/kg/d of protein, in light of current fluid
restrictions, is clinically feasible and appropriate for this post operative population. The
findings of this study have important implications for future clinical practice as aiming for a
provision of 2.2 g/kg/d of parenteral protein can potentially minimize the breakdown of body
stores in infants post CPB surgery. This is significant in the development of nutrition
prescriptions that are intended to reduce negative effects associated with suboptimal nutrition
and to facilitate metabolic processes during periods of stress.
Rogers et al studied a group of critically ill children with cardiac disease compared to
those without CHD. They reported that the cardiac group younger than 1 month of age had
significantly lower intakes meeting only 31.3% of REE versus 64.8% in the non cardiac group
(86). They were also less likely to receive full estimated energy requirements during their ICU
stay, they were fasted longer (1-4 days), and experienced significantly more feeding
interruptions (86). Not surprisingly, they had a longer duration of stay in the ICU at a median of
7.5 days. Additionally, WAZ scores from ICU discharge were significantly less than on
admission and did not improve prior to hospital discharge (86). It is evident from this study, and
including other studies that investigated WAZ scores postoperatively, that inadequate nutrition
in the post-operative period negatively impacts growth (10, 12, 93, 99, 130).
Anderson et al performed a retrospective study examining nutrition and growth data
from 44 surgical centers in the United States. Results revealed that following the Norwood
procedure for infants diagnosed with HLHS, the median time to full enteral feeds was 13 days
(4-77 days) (99). The authors noted considerable variation in growth between surgeries from
different cardiac centers as evidence from varying nutritional practices from one site to another

71
(99). Given the significant duration of time to reach full enteral feeding, the institution of PN in
the early period following surgery may be essential to compensate for potential nutritional
deficits.
As indicated previously, to our knowledge there is no reliable evidence to suggest
protein requirements for infants post cardiovascular surgery. Recommendations for protein
intake in critically ill children have been proposed by the American Society of Parenteral and
Enteral Nutrition (ASPEN), suggesting that children 0-2 years of age, should receive 2-3 g/kg/d
of protein (131). However, these guidelines were based on non-randomized cohort with
historical controls or case series, uncontrolled studies and expert opinion (131). Furthermore,
the critically ill population that these recommendations are intended encompass a heterogeneous
group of diagnosis and are not specific to surgical infants with CHD. In consideration to the
results of this study, providing a protein delivery of 2.2 g/kg/d after CPB surgery could be
essential to reduce the effects of adverse developmental outcomes that may be associated with
nutritional deficits during a critical recovery period.
4.2 Future Directions
In regard to the results of this study, a number of suggestions can be made for future
research endeavours. The definition of nitrogen balance is simplified to nitrogen intake minus
output, however protein metabolism is more complex. The processes of protein degradation and
synthesis results in a dynamic series of protein turnover (29). Nitrogen balance techniques do
not define intermediary metabolism (132). Contemporary techniques used to determine protein
requirements can assist with contributing to an improved understanding of protein turnover. The
use of stable isotopes or indicator amino acid oxidation methods have been employed in the
evaluation of amino acid utilization in both health and disease (126). These methods have been

72
used sporadically in studies in critically ill children and could hold further benefit in
investigations of protein metabolism in infants post CPB (66).
As protein metabolism is dependent on energy metabolism the role of achieving nitrogen
balance requires examining protein and energy intake concurrently. Future research could
therefore investigate protein-energy nutrition therapy to include defined nutrition prescriptions
based on REE and RQ measurements as determined through indirect calorimetry. Presumably
goal directed energy and protein nutrition support could possibly result in improved clinical
outcome measures such as growth and length of hospital stay.
Likewise, an examination of clinical factors would assist with providing a further
understanding of the acute stress response during the immediate post-operative period.
Incorporating serial monitoring of clinical indicators such as, severity index scores (i.e. PRISM)
may contribute to describing the degree of stress. Also, the evaluation of stress mediators,
including acute phase proteins (i.e. CRP, fibrinogen), pro-inflammatory and anti-inflammatory
markers (i.e. interleukin–1, 6, 10, and tumour necrosis factor alpha) may hold further benefit. In
sum, a severity of illness index score and biological markers could provide valuable data
contributing to an enhanced understanding of the cardiac infant’s stress response in the
immediate post surgical period.
The goal of nutrition support in critically ill infants is to promote tissue synthesis and to
reduce catabolism of body stores for the maintenance of body composition and to support organ
function. Providing an appropriate level of protein is crucial to supporting optimal recovery in
the immediate period after surgery (34, 61). It is anticipated that the results from this study have
contributed to an emerging body of literature that aims to understand protein needs in this
nutritionally fragile group of infants. Ultimately, it is hoped that this study will add to an

73
exciting area of research and stimulate further studies in nutritional support therapies designed
to aid in improved outcomes for this high-risk population of infants with CHD.

83
REFERENCES:
1. Teixeira-Cintra MA, Monteiro JP, Tremeschin M, Trevilato TM, Halperin ML, Carlotti AP. Monitoring of protein catabolism in neonates and young infants post-cardiac surgery. Acta Paediatr 2011;100:977-982.
2. Hegsted DM. Balance studies. J Nutr 1975;May:307-311.
3. Jones MO, Pierro A, Hammond P, Llyod DA. The metabolic response to operative stress in infants. J Pedatr Surg 1993;28:1258-1263.
4. Mehta N, Jaksic T: The Critically Ill Child. In: Nutritional Aspects of Specific Disease States. Volume Part V. 4 ed. Hamilton, Ontario: BC Decker Inc, 2008; 663-673.
5. Roman B. Nourishing little hearts: Nutritional implications for congenital heart disease. Pract Gastroenterol 2011;98:11-34.
6. van der Linde D, Konings EE, Slager MA, Witsenburg M, Helbing WA, Takkenberg JJ, Roos-Hesselink JW. Birth prevalence of congenital heart disease worldwide: a systematic review and meta-analysis. J Am Coll Cardiol 2011;58:2241-2247.
7. Smith P. Primary care in children with congenital heart disease. J Pediatr Nurs 2001;16:308-319.
8. Dooley KJ, Bishop L. Medical management of the cardiac infant and child after discharge. Crit Care Nurs Q 2002;25:98-1004.
9. Laussen P. Neonates with congenital heart disease. Curr Opin Pediatrics 2001;13:220-226.
10. Anderson JB, Beekman RH 3rd, Border WL, Kalkwarf HJ, Khoury PR, Uzark K, Eghtesady P, et al. Lower weight-for-age z score adversely affects hospital length of stay after the bidirectional Glenn procedure in 100 infants with a single ventricle. J Thorac Cardiovasc Surg 2009;138:397-404.
11. Cameron JW, Rosenthal A, Olson AD. Malnutrition in hospitalized children with congenital heart disease. Arch Pediatr Adolesc Med 1995;149:1098-1102.
12. Kelleher DK, Laussen P, Teixeira-Pinto A, Duggan C. Growth and correlates of nutritional status among infants with hypoplastic left heart syndrome (HLHS) after stage 1 Norwood procedure. Nutrition 2006;22:237-244.
13. Leitch C. Growth, nutrition and energy expenditure in pediatric heart failure. Prog Pediatr Cardiol 2000;11:195-202.
14. Nicholson GT, Clabby ML, Kanter KR, Mahle WT. Caloric Intake During the Perioperative Period and Growth Failure in Infants With Congenital Heart Disease. Pediatr Cardiol 2012.
15. Peterson RE, Wetzel GT. Growth failure in congenital heart disease: where are we now? Curr Opin Cardiol 2004;19:81-83.
84
16. Schwarz SM, Gewitz MH, See CC, Berezin S, Glassman MS, Medow CM, Fish BC, et al. Enteral nutrition in infants with congenital heart disease and growth failure. Pediatics 1990;86:368-373.
17. Schuurmans FM, Pulles-Heintzberger CFM, Gerver WJM, Kester ADM, Forget P-PH. Long-term growth of children with congenital heart disease: a retrospective study. Acta Paediatr 1998;87:1250-1255.
18. Varan B, Tokel K, Yilmaz G. Malnutrition and growth failure in cyanotic and acyanotic congenital heart disease with and without pulmonary hypertension. Arch Dis Child 1999;81:49-52.
19. Chwals WJ. Metabolic response to surgery in neonates. Curr Opin Pediatr 1994;6:334-340.
20. Briassoulis G, Zavras N, Hatzis I. Malnutrition, nutritional indices, and early enteral feeding in critically ill children. Nutrition 2001;17:548-557.
21. Cheatham ML, Safcsak K, Brzezinski SJ, Lube MW. Nitrogen balance, protein loss, and the open abdomen. Crit Care Med 2007;35:127-131.
22. Pierro A, Eaton S. Metabolism and nutrition in the surgical neonate. Semin Pediatr Surg 2008;17:276-284.
23. Bechard LJ, Parrott JS, Mehta NM. Systematic review of the influence of energy and protein intake on protein balance in critically ill children. J Pediatr 2012;161:333-339 e331.
24. Botran M, Lopez-Herce J, Mencia S, Urbano J, Solana MJ, Garcia A. Enteral nutrition in the critically ill child: comparison of standard and protein-enriched diets. J Pediatr 2011;159:27-32 e21.
25. Mitchell I, Brady L, Black J, Jamieson M, Pollock J, Logan R. The acute phase response to cardiopulmonary bypass in children. Perfusion 1996;11:103-112.
26. Thibault R, Pichard C. Nutrition and clinical outcome in intensive care patients. Curr Opin Clin Nutr 2010;13:177-183.
27. Coss-Bu JA, Jefferson LJ, Walding D, Yadin D, Smith E, Klish WJ. Resting energy expenditure and nitrogen balance in critically ill pediatric patients on mechanical ventilation. Nutrition 1998;14:649-652.
28. Briassoulis G, Tsorva A, Zavras N, Hatzis T. Influence of an aggressive early enteral nutrition protocol on nitrogen balance in critically ill children. Journ Nutr Biochem 2002;13:560-569.
29. Agus M, Jaksic T. Nutritional support of the critically ill child. Curr Opin Pediatr 2002;14:470-481.
30. Heird WC, Driscoll JM, Schullinger JN, Grebin B. Intravenous alimentation in pediatric patients. J Pediatr 1972;80:351-372.

85
31. Thureen PJ, Anderson AH, Baron KA, Melara DL, HAY WW, Fennessey PV. Protein balance in the first week of life in ventilated neonates receiving parenteral nutrition. Am J Clin Nutr 1998;68:1128-1135.
32. Forchielli ML, McColl R, Walker WA, Lo C. Children with congenital heart disease: A nutrition challenge. Nutr Rev 1994;52:348-353.
33. Hulst J, van Goudoever J, Zimmerman L, Hop W, Albers M, Tibboel D, Joosten K. The effect of cumulative energy and protein deficiency on anthropometric parameters in a pediatric ICU population. Clin Nutr 2004;23:1381-1389.
34. Owens JL, Musa N. Nutrition support after neonatal cardiac surgery. Nutr Clin Pract 2009;24:242-249.
35. Pollack MM, Ruttiman UE, Wiley JS. Nutritional depletions in critically ill children: Associations with physiological instability and increased quantity of care. J Parenter Enteral Nutr 1985;9:309-313.
36. Braudis NJ CM, Beaupre K, Thomas KC, Hardiman G, Laussen P, Gauvreau K, Thiagarajan RR. Enteral feeding algorithm for infants with hypoplastic left heart syndrome poststage I palliation. Pediatr Crit Care Med 2009;10:460-466.
37. Kreymann G, DeLegge MH, Luft G, Hise ME, Zaloga GP. The ratio of energy expenditure to nitrogen loss in diverse patient groups--a systematic review. Clin Nutr 2012;31:168-175.
38. Leite HP FM, de Carvalho WB,, AC dCC. Serum albumin and clinical outcome in pediatric cardiac surgery. Nutrition 2005;21:553-558.
39. Institute of Medicine. Dietary Reference Intakes for Energy, Carbohydrate, Fibre, Fat, Fatty Acids, Cholesterol, Protein and Amino Acids. In. Washington DC: The National Academies Press; 2005. p. 589-768.
40. Garlick P. Protein requirements of infants and children. Nestle Nutrition Workshop Series, Pediatric Program 2006;58:39-50.
41. Gibson RS: Assessment of Protein Status. In: Priniciples of Nutrition Assessment. New York, NY: Oxford University Press, 1990; 326-332.
42. Walsh TS: The Metabolic Response to Injury. In: Bradbury AW FJ, Garden OJ, , ed. Principles and Practice of Surgery. 5 ed. Philadelphia: Churchill Livingstone, 2007; 1-12.
43. Winthrop AL FR, Smith J, Heim T. Analysis of energy and macronutrient balance in the postoperative infant. J Pediatr Surg 1989;24:686-689.
44. Skogerboe K, Labbe R, Rettmer R, Sundquist J, Gargett A. Chemiluminescent measurement of total urinary nitrogen for accurate calculation of nitrogen balance. Clin Chem 1990;36:725-755.

86
45. Dickerson RN, Tidwell AC, Minard G, Croce MA, Brown RO. Predicting total urinary nitrogen excretion from urinary urea nitrogen excretion in multiple-trauma patients receiving specialized nutritional support. Nutrition 2004;21:332-338.
46. Coss-Bu JA, Klish WJ, Walding D, Stein F, Smith E, LJ J. Energy metabolism, nitrogen balance, and substrate utilization in critically ill children. Am J Clin Nutr 2001;74:664-669.
47. Marin V, JesÚs Rebollo J, Castillo-Duran C, Lopez M, Sanabria M, Moraga F, Castro F, et al. Controlled study of postoperative parenteral nutrition in children. J Pediatr Surg 1994;34:1330-1335.
48. Bingham S, Cummings JH. The use of 4-amino benzoic acid as a marker to validate the completeness of 24-hr urine collections in man. Clin Sci 1983;64:629-635.
49. Waterlow JC. The mysteries of nitrogen balance. Nutr Res Rev 1999;12:25-54.
50. Pencharz PB, Farri L, Papageorgiou A. The effets of human milk and low protein formulae on the rates of total body protein turnover and urinary 3-methyl-histidine excretion of preterm infants. Clinical Science 1983;64:611-616.
51. Tome D, Bos C. Dietary protein and nitrogen utilization. J Nutr 2000;130:1868S-1873S.
52. Lehninger A, Nelson D, Cox M. Principles of Biochemistry 2nd ed. New York, NY: Worth Publishers Inc., 1993.
53. Pencharz PB, Steffee WP, Cochran W, Scrimshaw NS, Rand WM, Young VR. Protein metabolism in human neonates: nitrogen-balance studies, estimated obligatory losses of nitrogen and whole-body turnover of nitrogen. Clin Sc Mol Med 1977;52:485-498.
54. Diem K, Lentner C. Scientific Tables. 7 ed. Basle, Switzerland: Ciba-Geigy Ltd, 1971.
55. Rodriquez DJ, Frederik RD, Clevenger W, Osler TM, Demarest GB, Fry DE. Obligatory negative nitrogen balance following spinal cord surgery. J Parenter Enteral Nutr 1991;15:319-322.
56. Helms R, Mowatt-Larssen C, Boehm K, Christensen M, Hughes M, Fernandes E, Storm M. Urinary nitrogen constituents in the postsurgical preterm neonate receiving parenteral nutrition. J Parenter Enteral Nutr 1993;17:68-72.
57. Konstanditinides F, Boem K, W R. Pyrochemiluminescence: real time, cost-effective method for determining total urinary nitrogen in clinical nitrogen-balance studies. Clin Chem 1988;34:18-20.
58. Konstantinides F, Konstantinides N, Li J, Myaya M, Cerra F. Urinary urea nitrogen: too insensitive for calculating nitrogen balance studies in surgical clinical nutrition. J Parenter Enteral Nutr 1991;15:189-193.
59. Fleck A. Total nitrogen determination. In: Two hundred and thirteenth scientific meeting. Eighty-fifth Scottish meeting; 1969; Glasgow, Scotland; 1969.

87
60. Flatt JP, Blackburn GL, Bistrian BR. Urinary urea excretion and evaluation of nitrogen balance. J Parenter Enteral Nutr 1992:191-192.
61. van Waardenburg DA, de Betue CT, Goudoever JB, Zimmermann LJ, Joosten KF. Critically ill infants benefit from early administration of protein and energy-enriched formula: a randomized controlled trial. Clin Nutr 2009;28:249-255.
62. Joosten KFM, Verhoeven JJ, Hazelzet JA. Energy expenditure and substrate utilization in mechanically ventilated children. Nutrition 1999;15:444-448.
63. Chaloupecky V, Bohumil H, Tlaskal T, Kostelka M, Kucera V, Janousek J, Skovranek J, et al. Nitrogen balance, 3-methylhistidine excretion, and plasma amino acid profile in infants after cardiac operations for congenital heart defects: The effect of early nutritional support. J Thorac Cardiovasc Surg 1997;114:1053-1060.
64. Boehm KA, Helms RA, Storm MC. Assessing the validity of adjusted urinary urea nitrogen as an estimate of total urinary nitrogen in three pediatric populations. J Parenter Enteral Nutr 1994;18:172-176.
65. Briassoulis G FO, Hatzi E, Papassotiriou I, Hatzis T. Early enteral administration of immunonutrition in critically ill children: results of a blinded randomized controlled clinical trial. Nutrition 2005;21:799-807.
66. Reynolds RM, Bass KD, Thureen PJ. Achieving positive protein balance in the immediate postoperative period in neonates undergoing abdominal surgery. J Pediatr 2008;152:63-67.
67. Clugston G, Dewey KG, Fjeld C, Reeds P, Scrimshaw NS, Tontisirin K, Waterlow JC, et al. Report of the working group on protein and amino acid requirements. Proceedings of IDECG Workshop. Eur J Clin Nutr 1994;50.
68. Roth RM, Castillo L. Macronutrient Requirement for Growth: Protein/Amino Acid. Third ed. Hamilton, Ontario: BC Decker Inc, 2008.
69. Roth E, Druml W. Plasma amino acid imbalance: dangerous in chronic diseases? Curr Opin Clin Nutr 2011;14:67-74.
70. Zlotkin SH. Intravenous nitrogen intake requirements in full-term newborns undergoing sugery. Pediatics 1984;73:493-496.
71. Duffy B, Pencharz P. The effects of surgery on the nitrogen metabolism of parenterally fed human neonates. Pediatric Research 1986;20:32-35.
72. Long CL, Schaffel N, Geiger JW, Schiller WR, Blakemore WS. Metabolic response to injury and illness: Estimation of energy and protein needs from indirect calorimetry and nitrogen balance. J Parenter Enteral Nutr 1979;3:452-456.
73. Pierro A, Carnielli V, Filler RM, Smith J, Heim T. Characteristics of protein sparing effect of total parenteral nutrition in the surgical infant. J Pediatr Surg 1988;23:538-542.

88
74. Butte NF. Energy requirements for infants and children. Switzerland: Nestle Nutrition Worksop Series; 2006.
75. Framson CM, LeLeiko NS, Dallal GE, Roubenoff R, Snelling LK, Dwyer JT. Energy expenditure in critically ill children. Pediatr Crit Care Med 2007;8:264-267.
76. Bechard LJ, Ziegler J, Duggan C. Is energy expenditure of infants predictable after surgery?: A review of the evidence. ICAN: Infant, Child, & Adolescent Nutrition 2010;2:170-176.
77. Jones MO, Pierro A, Garlick PJ, McNurlan MA, Donnell SC, Llyod DA. Protein metabolism kinetics in neonates: Effects of intravenous fat and carbohydrate. J Pedatr Surg 1995;30:458-462.
78. Chwals WJ. Predicted energy expenditure in critically ill children: Problems associated with increased variability. Crit Care Med 2000;28:2655-2656.
79. Chwals WJ LR, Jamie A, Charles BJ. Stratification of injury severity using energy expenditure response in surgical infants. Journ Pediatr Surg 1995;30:1161-1164.
80. Shanbhogue RLK, Lloyd DA. Absence of hypermetabolism after operation in the newborn-infant. J Parenter Enteral Nutr 1992;16:333-336.
81. Li J, Zhang G, Herridge J, Holtby H, Humpl T, Redington AN, Van Arsdell GS. Energy expenditure and caloric and protein intake in infants following the Norwood procedure. Pediatr Crit Care Med 2008;9:55-61.
82. De Wit B, Meyer R, Desai A, Macrae D, Pathan N. Challenge of predicting resting energy expenditure in children undergoing surgery for congenital heart disease. Pediatr Crit Care Med 2010;11:496-501.
83. Gebara BM, Gelmini M, Sarnaik A. Oxygen consumption, energy expenditure and substrate utilization after cardiac surgery in children. Crit Care Med 1992;20:1550-1554.
84. Avitzur Y, Singer P, Dagan O, Kozer E, Abramovitch D, Dinari G, Shamir R. Resting energy expenditure in children with cyanotic and noncyanotic congenital heart disease before and after open heart surgery. J Parenter Enteral Nutr 2003;27:47-51.
85. Scrimshaw NS. Criteria for valid nitrogen balance measurements and protein requirements. Eur J Clin Nutr 1996;50:S196-197.
86. Rogers EJ, Gilbertson HR, Heine RG, Henning R. Barriers to adequate nutrition in critically ill children. Nutrition 2003;19:865-868.
87. Balcells J, Moreno A, Audi L, Roqueta J, Iglesias J, Carrascosa A. Growth hormone/insulin-like growth factors axis in children undergoing cardiac surgery. Crit Care Med 2001;29:1234-1238.
88. Skillman HE, Wischmeyer PE. Nutrition therapy in critically ill infants and children. J Parenter Enteral Nutr 2008;32:520-534.

89
89. Mehta NM, McAleer D, Hamilton S, Naples E, Leavitt K, Mitchell P, Duggan C. Challenges to optimal enteral nutrition in a multidisciplinary pediatric intensive care unit. J Parenter Enteral Nutr 2010;34:38-45.
90. de Neef M GV, Dral A, Lindeboom R, Sauerwein HP, Bos AP. Nutritional goals, prescription and delivery in a pediatric intensive care unit. Clin Nutr 2008;27:65-71.
91. Cabrera AG, Prodhan P, Bhutta AT. Nutritional challenges and outcomes after surgery for congenital heart disease. Curr Opin Cardiol 2010;25:88-94.
92. Alaedeen DI, Queen AL, Leung E, Liu D, Chwals WJ. C-Reactive protein-determined injury severity: Length of stay predictor in surgical infants. J Pediatr Surg 2004;39:1832-1834.
93. Medoff-Cooper B, Irving SY, Marino BS, Garcia-Espana JF, Ravishankar C, Bird GL, Stallings VA. Weight change in infants with a functionally univentricular heart: from surgical intervention to hospital discharge. Cardiol Young 2011;21:136-144.
94. Rosenthal GL, Wilson DP, Permutt T, Boughman JA, Ferencz C. Birth weight and cardiovascular malformations: A population-based study. Am J Epidemiol 1991;133:1273-1281.
95. Kramer HH, Trampisch HJ, Rammos S, Giese A. Birth weight of children with congenital heart disease. Eur J Pediatr 1990;149:752-757.
96. Reddy VM, McElhinney DB, Sagrado T, Parry AH, Teitel DF, Hanley FL. Results of 102 cases of complete repair of congenital heart defects in patients weighing 700 to 2500 grams. J Thorac Cardiovasc Surg 1999;117:324-331.
97. Weinstein S, Gaynor JW, Bridges ND, Wernovsky LM, Godinez RI, Spray TL. Early Survival of Infants Weighing 2.5 Kilograms or Less Undergoing First-Stage Reconstruction for Hypoplastic Left Heart Syndrome. Circulation 1999;100:II-167-II-170.
98. Vogt KN, Manlhiot C, Van Arsdell G, Russell JL, Mital S, McCrindle BW. Somatic growth in children with single ventricle physiology impact of physiologic state. J Am Coll Cardiol 2007;50:1876-1883.
99. Anderson JB, Iyer SB, Schidlow DN, Williams R, Varadarajan K, Horsley M, Slicker J, et al. Variation in growth in infants with a single ventricle. J Pediatr 2012;161:16-21.
100. Anderson JB, Marion BS, Irving SY, Garcia-Espana JF, Ravishankar C, Stallings VA, Medoff-Cooper B. Poor post-operative growth in infants with two-ventricle physiology. Cardiol Young 2011;21:421-429.
101. Kinney JM, Elwyn DH. Protein metabolism and injury. Annu Rev Nutr 1983;3:433-466.
102. Fomon SJ, Nelson SE. Body composition of the male and female reference infants. Annu Rev Nutr 2002;22:1-17.
103. Shew SB, Keshen TH, Jahoor F, Jaksic T. The determinants of protein catabolism in neonates on extracorporeal membrane oxygenation. J Pediatr Surg 1999;34:1086-1090.

90
104. Thibault R, Genton L, Pichard C. Body composition: why, when and for who? Clin Nutr 2012;31:435-447.
105. Parker L, Reilly JJ, Slater C, Wells JC, Pitsiladis Y. Validity of six field and laboratory methods for measurement of body composition in boys. Obes Res 2003;11:852-858.
106. Chwals WJ, Fernandez ME, Charles BJ, Schroeder LJ, Turner CS. Serum visceral protein levels reflect protein-calorie repletion in neonates recovering from major surgery. J Pediatr Surg 1992;27:317-321.
107. Cristina M, Barbosa-Silva G. Subjective and objective nutritional assessment methods: what do they really assess? Curr Opin Clin Nutr Metab Care 2008;11:248-254.
108. Sierros V, Fleming R, Cascioli M, Brady T. The prognostic value of C-reactive protein in long-term care patients requiring prolonged mechanical ventilation. Chron Respir Dis 2009;6:149-155.
109. Allan CK, Newburger JW, McGrath E, Elder J, Psoinos C, Laussen PC, del Nido PJ, et al. The relationship between inflammatory activation and clinical outcome after infant cardiopulmonary bypass. Anesth Analg 2010;111:1244-1251.
110. Hoffer LJ, Bistrian BR. Appropriate protein provision in critical illness: a systematic and narrative review. Am J Clin Nutr 2012;96:591-600.
111. Jansen NJ, van Oeveren W, van den Broek L, Oudemans-van Straaten HM, Stoutenbeek CP, Joen MC, Roozendaal KJ, et al. Inhibition by dexamethasone of the reperfusion phenomena in cardiopulmonary bypass. J Thorac Cardiovasc Surg 1991;102:515-525.
112. El Azab SR, Rosseel PM, de Lange JJ, Groeneveld ABJ, van Strik R, van Wijk EM, Scheffer GJ. Dexamethasone decreases the pro- to anti-inflammatory cytokine ratio during cardiac surgery. Br J Anaesth 2002;88:496-501.
113. von Spiegel T, Giannaris S, Wietasch GJK, Schroeder S, Buhre W, Schorn B, Hoeft A. Effects of dexamethasone on intravascular and extravascular fluid balance in patients undergoing coronary bypass surgery with cardiopulmonary bypass. Anesthesiology 2002;96:827-834.
114. Verwij EJ, Hogenbirk K, Roest AA, van Brempt R, Hazekamp M, de Jonge E. Serum cortisol concentration with exploratory cut-off values do not predict the effects of hydrocortisone administration in children with low cardiac output after cardiac surgery. Interact Cardiovasc Thorac Surg 2012;15:685-689.
115. Bronicki RA, Backer CL, Baden HP, Mavroudis C, Crawford SE, Green TP. Dexamethasone reduces the inflammatory response to cardiopulmonary bypass in children. Ann Thorac Surg 2000;69:1490-1495.
116. Heying R, Wehage E, Schumacher K, Tassani P, Haas F, Lange R, Hess J, et al. Dexamethasone pretreatment provides antiinflammatory and myocardial protection in neonatal arterial switch operation. Ann Thorac Surg 2012;93:869-876.

91
117. Van Goudoever JB, Wattimena JDL, Carnielli VP, Sulkers EJ, Degenhart HJ, Sauer PJJ. Effects of dexamethasone on protein metabolism in infants with bronchopulmonary dysplasia. J Pediatr 1994;124:112-118.
118. Pollack MM, Ruttiman UE, Getson PR. Pediatric risk of mortality (PRISM) score. Crit Care Med 1988;16:1110-1116.
119. Duffy B, Pencharz P. The effect of feeding route (IV or oral) on the protein metabolism of the neonate. Am J Clin Nutr 1986;43:108-111.
120. Corporation BHC. 20% ProSol (Amino Acid) Injection. In. Mississauga, Canada; (updated 2007; cited 2001 June 29).
121. Corporation B. Primine 10% Amino Acids IV Infusion. In: Ltd BHCP, editor. Australia; 2011.
122. Brunton JA, Shoveller AK, Pencharz PB, Ball RO. The indicator amino acid oxidation method identified limiting amino acids in two parenteral nutrition solutions in neonatal piglets. J Nutr 2007;137:1253-1259.
123. SickKids. Guidelines for the Administration of Enteral and Parenteral Nutrition. In. Third ed. Toronto, Ontario: SickKids; 2007.
124. Giannone PJ, Luce WA, Nankervis CA, Hoffman TM, Wold LE. Necrotizing enterocolitis in neonates with congenital heart disease. Life Sci 2008;82:341-347.
125. Munro HN, Fleck A: Analysis of tissues and body fluids for nitrogenous constituents. In: Munro HN, ed. Mammalian protein metabolism. Volume Vol. III. New York: Academic Press, 1969; 423-525.
126. Pencharz PB, Ball RO. Different approaches to define individual amino acid requirements. Annu Rev Nutr 2003;23:101-116.
127. Anand KJS, Sippell WG, Aynsley-Green A. Randomized trial of fentanyl anaesthesia in preterm babies undergoing surgery: Effects of the stress response. Lancet 1987.
128. Medoff-Cooper B, Naim M, Torowicz D, Mott A. Feeding, growth, and nutrition in children with congenitally malformed hearts. Cardiol Young 2010;20 Suppl 3:149-153.
129. Schmeling D, Coran A. Hormonal and metabolic response to operative stress in the neonate. J Parenter Enteral Nutr 1991;15:215-238.
130. Daymont C, Neal A, Prosnitz A, Cohen MS. Growth in children with congenital heart disease. Pediatrics 2013;131:e236-242.
131. Mehta NM, Compher C. A.S.P.E.N. Clinical guidelines: nutrition support of the critically ill child. J Parenter Enteral Nutr 2009;33:260-276.
132. Kopple JD. Use and limitations of the balance technique. J Parenter Enteral Nutr 1987;11:79S-85S.

92
Appendix A
Research Consent Form
555 University Avenue Toronto, Ontario, Canada M5X 1G8 Research Consent Form for Parents or Guardian Consenting for Child Title of Research Project: Determination of protein needs using nitrogen balance in infant’s immediately post cardiothoracic surgery. Investigator(s): Principal Investigator: Dr. Paul Pencharz, MB ChB PhD MD FRCPC Division of Gastroenterology (416) 813 - 7733 Co-investigators: Joann Herridge, RD Heart Centre/Cardiac Critical Care (416) 813 - 6193 Dr. Steven Schwartz, MD FRCPC Heart Centre/Cardiac Critical Care (416) 813 - 6186 Purpose of the Research: This study is being performed to improve the nutrition care of infants with congenital heart disease who will be fed through a vein following surgery. A solution given into a vein is called parenteral nutrition; it contains protein, fat, carbohydrate, vitamins and minerals. This solution is necessary when an infant cannot be given any or enough of their mother’s breast milk or infant formula. Parenteral nutrition is provided to make sure a child will receive the nutrients they need after surgery. There is limited information about how much protein babies require in parenteral solutions after their heart has been surgically repaired. We are studying different amounts of protein that can be added to these solutions. To measure how much protein a child may need we calculate the amount of protein going into the body and subtract the amount coming out of the body in the urine. The goal of this study is to determine the best amount of protein that will help an infant recover and grow after surgery. Description of the Research: Infants participating in this study will be placed into one of three groups. We will determine the group that your child will be in through rolling a dice. Each group will be given a different amount of protein. Your child will receive one level of protein and this level will be studied for an expected time of three days. The type of protein solution that your baby will be given is routinely provided to infants in the Cardiac Critical Care Unit. When the medical team decides it is safe for your baby to feed through a tube in their nose, he or she will be started on either mother’s breast milk or a standard infant formula, as you prefer. Standard feeding guidelines will be followed to ensure the feeds are delivered safely while your baby is recovering. We will be calculating the amount of protein in these feeds in addition to the protein in the parenteral solution that your baby is receiving. Your child’s urine will be collected for an expected three days or more while he or she is receiving the protein solution during the study. A tube for withdrawing urine will be put into your child during surgery; this is a routine procedure. Urine will be collected in a container that is attached to this tube. After we have measured the amount of protein in your child’s urine we will discard it by following the hospital’s safe procedures.
Subjects

84 We will be reviewing your child’s chart and will be observing the results of the blood samples that are taken as part of his/her routine post-operative care. We do not require additional blood samples and the results will help us to understand if your child is tolerating his/her nutrition solution. Along with this we will monitor any fluids/medications that your baby is receiving through an intravenous line. Also, as part of our study which is normal practice of care for all babies after cardiac surgery we will check your baby’s medical record to find out information about your baby’s diagnosis and the type of cardiac surgery he or she had, his or her weight history, length and head circumference. If this information is not in your baby’s medical chart, we will ask you to provide this information, if possible. Throughout the study the individual conducting the research (Joann Herridge, study coordinator) will be helping with the extra attention your child will be receiving. After the study is completed the research data will be destroyed. Potential Harms: We know of no harm that taking part in this study could cause your child. Potential Benefits To individual subjects: Your child will not benefit directly from participating in this study. However, it will provide information that should result in the design of better solutions for future children in need of parenteral nutrition. Parents who have participated in other studies performed by our lab have found the additional contact with health care professionals during the study period extremely helpful. At your request we will provide study results in a format that you prefer. To society: The study results may provide information about the amount of protein required to reduce body protein breakdown following surgery in a group of infants with congenital heart disease. This can help with designing better nutrition plans for infants that need intravenous nutrition solutions. Confidentiality: We will respect your privacy. No information about who you are (your child is) will be given to anyone or be published without your permission, unless required by law. For example, the law could make us give information about you if a child has been abused, if you have an illness that could spread to others, if you or someone else talks about suicide (killing themselves), or if the court orders us to give them the study papers. Sick Kids Clinical Research Monitors, employees of the funder or sponsor, or the regulator of the study may see your health record to check on the study. By signing this consent form, you agree to let these people look at your records. We will put a copy of this research consent form in your patient health record and give you a copy as well. The data produced from this study will be stored in a secure, locked location. Only members of the research team (and maybe those individuals described above) will have access to the data. This could include external research team members. Following completion of the research study the data will be kept as long as required then destroyed as required by Sick Kids policy. Published study results will not reveal your identity. Participation: If you choose to let your child take part in this study you can take your child out of the study at anytime. The care your child gets at Sick Kids will not be affected in any way by whether you take part in this study. New information that we get while we are doing this study may affect your decision to take part in this study. If this happens, we will tell you about this new information. And we will ask you again if you still want to be in the study.

85 During this study we may create new tests, new medicines, or other things that may be worth some money. Although we may make money from these findings, we cannot give you (your child) any of this money now or in the future because your child took part in this study. If your child becomes ill or are harmed because of study participation, we will treat your child for free. Your signing this consent form does not interfere with your legal rights in any way. The staff of the study, any people who gave money for the study, or the hospital are still responsible, legally and professionally, for what they do. Alternatives to participation: If you choose not to participate in the study, your baby will receive the standard amount of protein in their parenteral nutrition solution. This standard solution is provided to infants as part of routine clinical treatment. Sponsorship: The funder of this research is provided by Dr. Pencharz CIHR amino acid and metabolism grant. Conflict of interest: I, and the other research team members have no conflict of interest to declare. Consent : “By signing this form, I agree that: 1) You have explained this study to me. You have answered all my questions. 2) You have explained the possible harms and benefits (if any) of this study. 3) I know what I could do instead of having my child take part in this study. I understand that I have the
right to refuse to let my child take part in the study. I also have the right to take my child out of the study at any time. My decision about my child taking part in the study will not affect my child’s health care at Sick Kids.
4) I am free now, and in the future, to ask questions about the study. 5) I have been told that my child’s medical records will be kept private except as described to me. 6) I understand that no information about my child will be given to anyone or be published without first
asking my permission. 7) I have read and understand pages 1-5 of this consent form, I agree, or consent, that my child___________________ may take part in this study.” _________________________________ Printed Name of Parent/Legal Guardian Parent/Legal Guardian’s signature & date _________________________________ Printed Name of person who explained consent Signature of Person who explained consent & date Printed Witness’ name (if the parent/legal guardian Witness’ signature & date not read English) Who do I call if I have questions or problems? If you have any questions or concerns at anytime during the study, please contact the study coordinator, Joann Herridge at (416) 813-6193 or pager (416) 235-9515. If you need to contact someone about medical issues related to the study, please contact Dr. Steven Schwartz at (416) 813–6186. If you have questions about your rights as a research subject in a study or who to contact in the event of injuries during a study, please call the Research Ethics Manager at 416-813-5718.

86
Appendix B
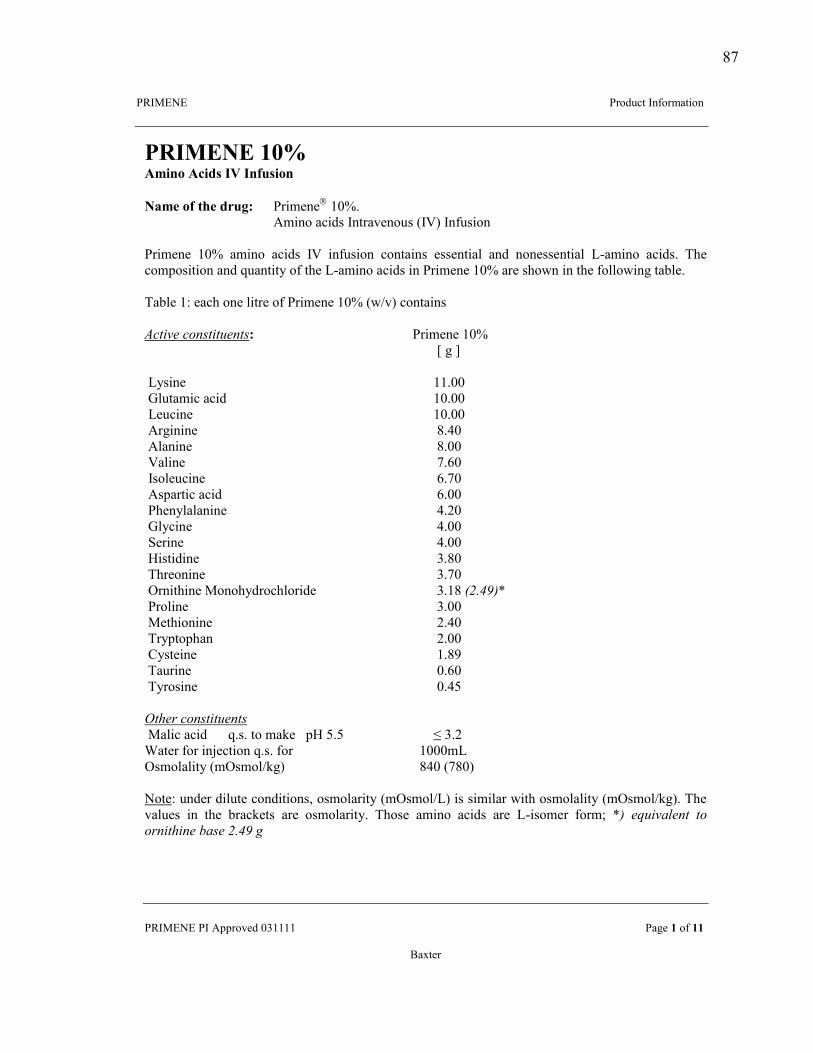
87
!"#$%&%' ' '''!()*+,-'#./)(01-2).'''
!!"#$%&%'!#'344()56*'789999'''''''''''''''''''''''''''''''''''' !1:6'!')/'!!' '
;1<-6('' ''
"#$%&'&(!)*(+,-./(+0-12($3($.452-/.'''6,7(/4(897(1:5;<( (!(206.6 '97=>'
!302.)'1,2*?'#.-(156.)+?'@#AB'#./+?2).'''(!(206.6' 97=' 102.)' 1,2*?' #A' 2./+?2).' ,).-12.?' 6??6.-21C' 1.*' .).6??6.-21C' DE102.)' 1,2*?>' FG6',)04)?2-2).'1.*'H+1.-2-I')/'-G6'DE102.)'1,2*?'2.'!(206.6'97='1(6'?G)J.'2.'-G6'/)CC)J2.:'-1KC6>'''F1KC6'9L'61,G').6'C2-(6')/'!(206.6'97='@JM5B',).-12.?'("#$%&'!#()*$%$+')$*<( ( ( (((((((((('''''''!(206.6'97=''''''''''''''' ' ' '' ' ' ' ' ' ' N':'O' ' ' '''DI?2.6'' ' ' ' ''''''''''' '''''''''''99>77' ' ''''''''''''''PC+-102,'1,2*'' ' ' '''''''''' '''''''''''97>77' ' ' ''D6+,2.6' ' ' ' ' '''''''''''97>77' ' ' ''3(:2.2.6' ' ' ' ' ' Q>R7' ' ' ''3C1.2.6' ' ' ' ' ' Q>77' ' ' ''A1C2.6'' ' ' ' ' ''''''''''''S>T7' ' ' ''#?)C6+,2.6' ' ' ' ' ' T>S7' ' ' ' ''3?41(-2,'1,2*' ' ' ' ' ' T>77' ' ' ''!G6.IC1C1.2.6'' ' ' ' ' R>U7' ' ' ''PCI,2.6' ' ' ' ' ' R>77' ' ' ''V6(2.6'' ' ' ' ' ' R>77' ' ' ''W2?-2*2.6' ' ' ' ' ' 8>Q7' ' ' ''FG(6).2.6' ' ' ' ' ' 8>S7' ' ' ''X(.2-G2.6'$).)GI*(),GC)(2*6''' ' ' 8>9Q',-./012! ' ' ''!()C2.6' ' ' ' ' ' 8>77' ' ' ''$6-G2).2.6' ' ' ' ' ' U>R7' ' ' ''F(I4-)4G1.' ' ' ' ' ' U>77' ' ' ''YI?-62.6'' ' ' ' ' ' 9>QZ' ' ' ''F1+(2.6' ' ' ' ' ' 7>T7' ' ' ''FI()?2.6' ' ' ' ' ' 7>R[' ' ' ''3$4'5!#()*$%$+')$*' ' '''$1C2,'1,2*''' H>?>'-)'01\6'''4W'[>[' ' ''''''''''' ' ' ' ' ']1-6('/)('2.^6,-2).'H>?>'/)('''''''''''''''''''' '''''''97770D' ' ''''''''''X?0)C1C2-I'@0X?0)CM\:B' ' ' '''''''QR7'@SQ7B'''''''''''''''''''''''''''''(&)-6L'+.*6('*2C+-6',).*2-2).?_')?0)C1(2-I'@0X?0)CMDB'2?'?202C1('J2-G')?0)C1C2-I'@0X?0)CM\:B>'FG6'51C+6?' 2.' -G6' K(1,\6-?' 1(6' )?0)C1(2-I>' FG)?6' 102.)' 1,2*?' 1(6' DE2?)06(' /)(0`' 21! '6+%&78')$! $(!(5)%$4%)'!97*'!-./0!:''(((

88
Appendix C
Parenteral Volumes for Nitrogen Balance Study
Parenteral Volume of ProSol and 30% Lipids for Nitrogen Balance Study
Weight (kg) Protein g/kg/d
AA /Dextrose ml/hr
30% Lipids ml/hr Volume ml/hr Volume
ml/d Volume* ml/kg/d
3.0 – 3.5 1.5 2.7 – 3.6 0.6 – 0.7 3.3 – 4.3 80 - 103 26
2.2 3.4 – 4.0 0.6 – 0.7 4.0 – 4.7 96 - 113 32
3.0 4.7 – 5.5 0.6 – 0.7 5.3 – 6.2 127 - 149 42
4.0 - 4.5 1.5 4.2 – 4.7 0.8 – 0.9 5.0 – 5.6 120 – 134 26
2.2 4.6 – 5.2 0.8 – 0.9 5.4 – 6.1 130 – 146 32
3.0 6.3 – 7.0 0.8 – 0.9 7.1 – 7.9 170 – 190 42
5.0 – 5.5 1.5 5.2 – 5.7 1.0 – 1.1 6.2 – 6.8 149 – 163 26
2.2 5.7 – 6.3 1.0 – 1.1 6.7 – 7.4 161 – 178 32
3.0 7.8 – 8.6 1.0 – 1.1 8.8 – 9.7 211 – 238 42
6.0 – 6.5 1.5 6.3 - 6.8 1.2 – 1.3 7.5 – 8.1 180 - 194 26
2.2 6.9 – 7.4 1.2 – 1.3 9.1 – 9.8 213 – 235 32
3.0 9.4 – 10.2 1.2 – 1.3 11.9 – 12.9 288 – 310 42
7.0 – 7.5 1.5 7.3 – 7.8 1.4 – 1.5 8.7 – 9.3 206 - 223 26
2.2 8.0 – 8.6 1.4 – 1.5 9.4 – 10.1 226 - 242 32
3.0 10.9 – 11.7 1.4 – 1.5 12.3 – 13.2 295 - 317 42
8.0 – 8.5 1.5 8.3 – 8.9 1.6 – 1.7 9.9 – 10.6 238 - 254 26
2.2 9.2 – 9.7 1.6 – 1.7 10.8 – 11.4 259 - 274 32
3.0 12.5 – 13.3 1.6 – 1.7 14.1 – 15.0 338 - 360 42
9.0 – 9.5 1.5 9.4 – 9.9 1.8 – 1.9 11.2 – 11.8 269 - 283 26
2.2 10.3 – 10.9 1.8 – 1.9 12.1 – 12.8 290 - 307 32
3.0 14.1 – 14.8 1.8 – 1.9 15.9 – 16.7 382 - 401 42
10.0 – 10.5 1.5 10.4 – 10.9 2.0 – 2.1 12.4 – 13.0 298 - 312 26
2.2 11.5 - 12.0 2.0 – 2.1 13.5 – 14.1 324 - 338 32
3.0 15.6 – 16.4 2.0 – 2.1 17.6 – 18.5 422 - 444 42
11.0 – 11.5 1.5 11.5 – 12.0 2.2 – 2.3 13.7 – 14.3 329 - 343 26
2.2 12.6 – 13.2 2.2 – 2.3 14.8 – 15.6 355 - 374 32
3.0 17.2 – 18.0 2.2 – 2.3 19.4 – 20.3 413 - 487 42
12.0 1.5 12.5 2.4 14.9 358 26
2.2 13.8 2.4 16.2 389 32
3.0 18.8 2.4 21.2 509 42
*Note: volume ml/kg/d provides non-protein calories 40±5 kcals/kg/d

89
Appendix D
Parenteral Nutrition and Post-operative Biochemistry Data Collection
Cardiac Routine Post-operative Biochemistry Arterial Blood Gases BUN – Blood urea nitrogen PT CRP Lactate Creatinine PTT Glucose ALT, AST, GGT INR Sodium, potassium, ionized calcium, magnesium
Complete blood count (CBC) Fibrinogen
The biochemistry investigation schedule can be performed every 2-4 hours on days 0-2, and every 4-6 hours on days 2-4; the timing of blood analysis and the biochemical values monitored is dictated by the patient’s hemodynamic status and biochemical results Monitoring Schedule for Stable Patients on Parenteral Nutrition Parameter
At start of therapy Monday Thursday
Glucose Yes Yes Yes
Electrolytes Yes Yes Yes
Intralipid Level No Yes Yes
Complete blood count No Yes No
BUN, phosphate, calcium, magnesium, conjugated bilirubin, albumin
Yes
Yes
No
AST, ALT, alkaline phosphatase, creatinine, acid base
Yes
If indicated
If indicated
Study Biochemistry Data Recorded Arterial blood gases Glucose ALT WBC Arterial mixed venous saturation INR AST Blood urea nitrogen (BUN) Intralipid level GGT Creatinine Complete Blood Count CRP* * as available Additional data collected: PRISM score (as available)

90
Appendix E
University of Guelph Amino Acid Analysis
!"#$%&
'()*+,+-,./012
!"#$%&"'( )*+),-"#,+)
13%4567&6%"89:;8.$$;829<$%9&$%=
-./01221$34
567889:;!!<=>;:6-?9@6!9-<AB9A:<C=!;8567889:;!!<=>;DDD9E8<F;!-<GH97F;G6!68G6I9689JD>9+KL
>?@8?ABC/>128.A!8B/DE8D?/2F!@0
AG:"%H-./01&&"'9MN(
?O$3"(9P+Q9L+R,SPDP@TU(9999999P+Q9L+R,PVS)-T0#W13X9=T&"(98$&9X1Y"39!"Z"1Y"'9=T&"(9)*+),7.X,)L99
>$&978EI"7;9J7804&%$3":K8L9M&"
)*+),-"#,+)99+)(*P9
=T&"97.&O$%1["'(9
B9N#7"8/F
0$&"!"M67&B#"54N": >"M&B9N#74:3888;9&"8O88&4N"
D74":&8B9N#7"8/F
+\P+DG$&TW9B]"W'TOW981&%$X"3
^9_"&6&O"%?!<J;8;***+ 9
)\VQ+G$&TW9B]"W'TOW981&%$X"3
^9_"&6&O"%?!6-6C***) 9
G"2&90"&O$'`2a(
-.#"%Y12$%(999981Z$WTT29-ZO%1"%9J-Z999D+V9L)R9+)QL9"U&\9DS)+D99932ZO%1"%b.$X."W#O\ZT
A:;J,*RV9
>J4M8%"#$%&8N9=8:$&8<"8%"#%$;65";8"P5"#&84:8Q6778G4&J$6&8G%4&&":89##%$R978<=829<$%9&$%=8B"%R45"MS8>J"M"8&"M&8%"M67&M8#"%&94:8$:7=8&$8&J"8M#"54N":M8&"M&";S
?%13&"'(
?TX"9+9$c9+
)*+),-"#,+)!"#$%&'(&#)*+,-*.//-*0+1/#+(/#2*3*4&)'567*89**9:;*<=>*3*???@"&)'56'+1A)#B$%)A@%/C

91
Appendix F
Data Collection Forms
Determination of protein needs using nitrogen balance in infants immediately post cardiopulmonary bypass surgery Inclusion Criteria: All inclusion criteria must be answered yes to be eligible
Yes No 1. Clinical decision to initiate parenteral nutrition based on determination by medical team Yes No 2. Gestational age ≥ 36 weeks
Yes No 3. Weight ≥ 2500 grams Yes No 4. Indwelling urinary catheter for urine collection Yes No 5. Central venous access for parenteral nutrition Exclusion Criteria: To be monitored throughout study period Yes No 1. Hepatic failure defined as ALT and AST >500 UL, with an INR >2.5, not accounted for by
therapeutic anticoagulation Yes No 2. Renal failure defined as creatinine 2x the upper limit of normal for age. Yes No 3. Sepsis defined as a clinical confirmation of a positive blood culture as a systemic infection
treated with antibiotics Yes No 4. Excessive blood loss from chest tubes (5 ml/kg/hr) that has not resolved within six hours following admission to the CCCU; as indicated by the need for frequent blood transfusion
Yes No 5. Requiring extracorporeal membrane oxygenation (ECMO) support.
Enrolment date and time: └───┴───┘ │ └──────┘ │ └───┴───┘ └───┴───┘ : └───┴───┘ D D MON Y Y H H M M Randomization date and time: └───┴───┘ │ └──────┘ │ └───┴───┘ └───┴───┘ : └───┴───┘ D D MON Y Y H H M M

92
Demographic and Baseline Information 1. Age: _____ weeks 2. Gestational age: weeks 3. Age at time of surgery: weeks 4. Date & Time of CCCU Admit: _____/_____/________ at _______: _______ DD MM YYYY HH MM 5. Date & Time of Subject Enrolment: _____/_____/________ at _______: _______ DD MM YYYY HH MM 6. Gender: Female Male
Chromosome abnormality: 7. Admission Diagnosis:
6. Surgical Procedure:
Anthropometrics 1. Birth weight: kg
Birth length: cm
Birth head circumference: cm
2. Preoperative weight: kg
Preoperative length: cm
Preoperative head circumference: cm
3. CCCU discharge weight: kg

93
Nutrition DA PN Adaptation Period PN START date & time: _____/_____/________ at _______: ______ DD MM YYYY HH MM PN END date & time: _____/_____/________ at _______: _______ DD MM YYYY HH MM Amino Acid Dextrose Lipid Content g/L
Rate: ml/hr
Total volume mL/d
Hours given HH:MM
______ : _______
______ : _______
______: _______
PN D1 PN study solution START date & time: _____/_____/________ at _______:_______ DD MM YYYY HH MM PN study solution END date & time: _____/_____/________ at _______: _______ DD MM YYYY HH MM Amino Acid Dextrose Lipid Content g/L
Rate: ml/hr
Total volume ml/d
Hours given HH:MM
______ : _______
______ : _______
______: _______
Notes:
EN D1 EN START date & time: _____/_____/________ at _______: _______ DD MM YYYY HH MM Enteral Feed Protein g/ml Calories /ml Volume ml/d
Notes:

94 Medications Containing Dextrose D1 Medication Dextrose content Volume ml/d
PN D2 PN Study solution START date & time: _____/_____/________ at _______: ______ DD MM YYYY HH MM PN Study solution END date & time: _____/_____/________ at _______: _______ DD MM YYYY HH MM Amino Acid Dextrose Lipid Content g/L
Rate: ml/hr
Total volume ml/d
Hours given HH:MM
______ : _______
______ : _______
______: _______
Notes:
EN D2 EN START date & time: _____/_____/________ at _______: _______ DD MM YYYY HH MM Enteral Feed Protein g/ml Calories /ml Volume ml/d
Notes:
Medications Containing Dextrose D2 Medication Dextrose content Volume ml/d

95 PN D3 PN study solution START date & time: _____/_____/________ at _______:_______ DD MM YYYY HH MM PN study solution END date & time: _____/_____/________ at _______: _______ DD MM YYYY HH MM Amino Acid Dextrose Lipid Content g/L
Rate: ml/hr
Total volume ml/d
Hours given HH:MM
______ : _______
______ : _______
______: _______
Notes:
EN D3 EN START date & time: _____/_____/________ at _______: _______ DD MM YYYY HH MM Enteral Feed Protein g/ml Calories /ml Volume
ml/d
Notes:
Medications Containing Dextrose D3 Intravenous Medications Dextrose content Volume ml/d

96 Urine collection Day 1
Start Date & Time
Stop Date &Time
Daily
Volume ml
____/_____/___ @_______:_______ DD MM YYYY HH MM
_____/_____/___ _ @____:_______ DD MM YYYY HH MM
Collection: Complete Yes No Reason collection incomplete: Time not studied / volume loss:
Day 2
Start Date & Time
Stop Date &Time
Daily
Volume ml
____/_____/___ @_______:_______ DD MM YYYY HH MM
_____/_____/___ _ @____:_______ DD MM YYYY HH MM
Collection: Complete Yes No Reason collection incomplete: Time not studied / volume loss:
Day 3
Start Date & Time
Stop Date &Time
Daily
Volume ml
____/_____/___ @_______:_______ DD MM YYYY HH MM
_____/_____/___ _ @____:_______ DD MM YYYY HH MM
Collection: Complete Yes No Reason collection incomplete: Time not studied / volume loss:
Urinary catheter removal date & time: _____/_____/______ at _______:_______ DD MM YYYY HH MM

97 Biochemistry (Insert additional pages for each day required) Date: ____/_ _/___ DD MMYYYY
_____:______ HH MM
_____:______ HH MM
____:______ HH MM
____:______ HH MM
____:______ HH MM
____:______ HH MM
pH mm Hg
C02 mm Hg
Bicarbonate mmol/L
Base Excess mmol/L
Arterial Mixed Venous Saturation %
Lactate mmol/L
Glucose mmol/L
BUN mmol/L
Creatinine mol/L
AST U/L
ALT U/L
CRP* mg/L
Intralipid Level g/L
WBC x10∧9/L
INR
*CRP – recorded as available Blood Products (Transfusions) No. Transfusions per day Volume
ml/d D1 D2 D3 D1 D2 D3
Packed Red Blood Cells Fresh Frozen Plasma Medications Antibiotics Drug Date & Time Initiated Reason
_____/_____/____ at _______:______ DD MM YYYY HH MM
_____/_____/____ at _______:______ DD MM YYYY HH MM
_____/_____/____ at _______:______ DD MM YYYY HH MM

98