determination of planting crops using...
TRANSCRIPT
DETERMINATION OF PLANTING CROPS USING SATELLITE DATA AT SHONAI PLAIN IN JAPAN
Genya SAITO1, Kuniaki UTO1, Kei OYOSHI2, Yutaka KANEKO2, Yosei MIZUKAMI2,
Kazufumi KOBAYASHI3, Yuka SASAKI4, and Jun SATO5
1Innovative Research Initiatives, Tokyo Institute of Technology J3-153, 4259 Nagatsuta-cho, Midori-ku, Yokohama, 226-8502, Japan
E-mail: [email protected] 2Earth Observation Research Center, Japan Aerospace Exploration Agency
2-1-1 Sengen, Tsukuba, 305-8505, Japan 3Remote Sensing Technology Center of Japan
Tokyu Reit Toranomon Bldg. 2F, 3-17-1 Toranomon, Minato-ku, Tokyo 105-0001, Japan Faculty of Agriculture, Yamagata University
1-23 Wakabacho, Tsuruoka, Yamagata 997-8555, Japan Tsuruoka College, National Institute of Technology
104 Sawada, Inooka, Tsuruoka, Yamagata 997-8511, Japan
KEY WORDS: Crop monitoring, Crop determination, Satellite data, SAR, Optical sensor ABSTRACT: GEOGLAM covers the four major cereals of wheat, soybean, corn and rice. Rice is producing and consuming in Asia about 90% of the whole world. The Asian Space Agency and Asian Agricultural Organizations built Asia-RiCE (Asia-Rice Crop Estimation and Monitoring initiative) at framework of GEOGLAM. Shonai Plain was set up as a test field area in Japan. At beginning work, we try to determination of planted crops using satellite data. Recently, in Asian countries, GIS is spread widely and agricultural field polygon is commonly used. Crop determination using the polygon is becoming popular. Normally, fields are used without changing, but sometimes, one field is divided two or three fields, and two or three fields are integrated one field. It is necessary to overlay satellite image and the polygon, and to check with fitting or not. In case of mismatch, field polygon must be corrected. Simultaneously with this confirmation work for each field polygon, the optical satellite data were classified as water surface ‘water’, vegetation as ‘vegetation’, bare soil as ‘soil’ and ‘cannot determination’. In the SAR image, we classify 4 degrees, as small scattering of the water surface '0', scattering slightly larger than the water surface '1', larger than the water surface '2', and large scattering '3’. The crop determination is performed according to the following standard using to the time series data Rice: Almost water surface at rice planting time and following several weeks. In summer, there is large vegetation. Wheat: There is large vegetation at rice planting time, and small vegetation at summer. Soybean: There is small vegetation at rice planting time, and large vegetation in summer. Grasses: There is large vegetation at rice planting time and at summer. Using this evaluation criteria, we performed the crop classifications in Shonai Pain, and the correct answer rates are more than 95% 1. INTRODUCTION At the Meeting of G20 Agriculture Ministers in 2011 at Paris1), an action plan concerning food price fluctuation and agriculture was adopted the importance of the international community to tackle the increase of agricultural production, improvement of productivity and improvement of market transparency. Among them, the launch of the Global Agricultural Monitoring Initiative (Group on Earth Observations Global Agricultural Monitoring: GEOGLAM) was determined. GEOGLAM aims to utilize satellite data, to make timely and openly crop situation and yield prediction information. GEOGLAM covers the four main cereals of wheat, soybean, corn and rice, but since rice is produced and consumed by about 90% in Asia. The Asian space agencies and agricultural organizations have been the center, and inside of GEOGLAM. We conducted the Asia-Rice Crop Estimation and Monitoring (Asia-RiCE) started at monitoring rice paddies2)-4). Shonai plain is famous paddy area and rice was planned in the plain more than one thousand years. Recently in Japan, rice is over produced, and soybean and wheat are planted paddy fields. Shonai Plain is typical agricultural area in Japan. We set up the Shonai plain as a test field in Japan and tried to identify crops by satellite data in the Shonai Plain paddy field. The plan of using satellite data and the results of early stage in the project are reported in this conference.
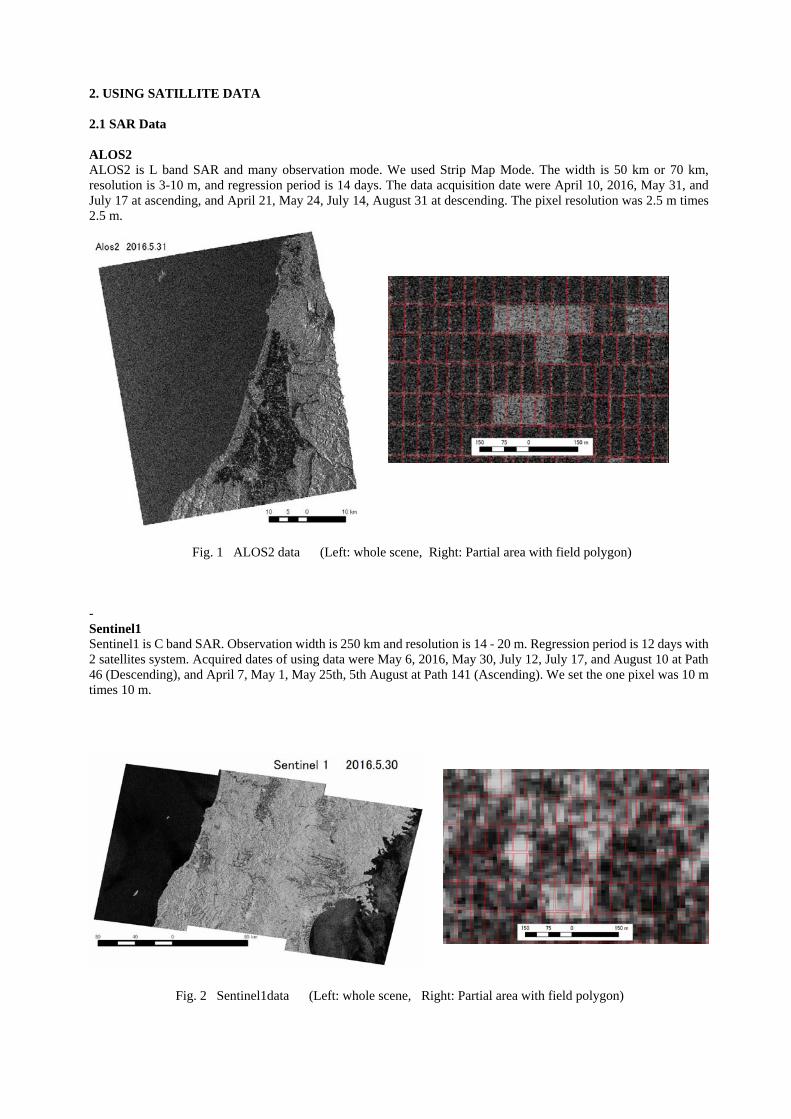
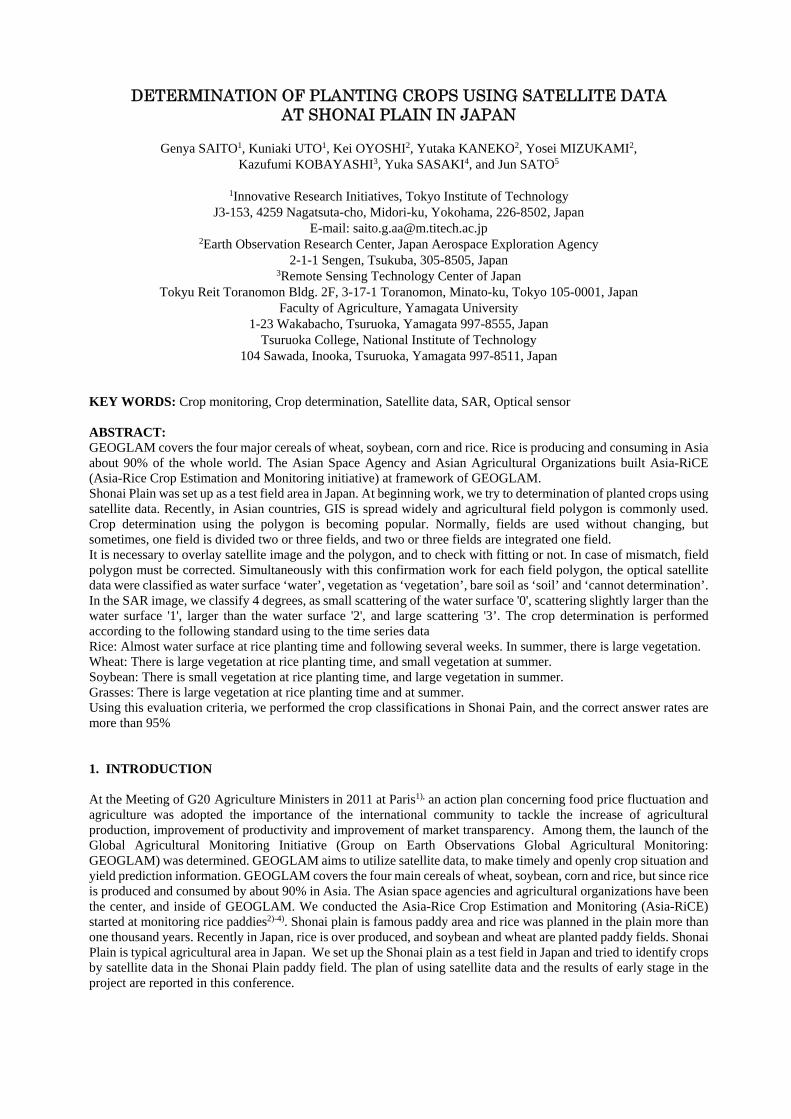
2. USING SATILLITE DATA 2.1 SAR Data ALOS2 ALOS2 is L band SAR and many observation mode. We used Strip Map Mode. The width is 50 km or 70 km, resolution is 3-10 m, and regression period is 14 days. The data acquisition date were April 10, 2016, May 31, and July 17 at ascending, and April 21, May 24, July 14, August 31 at descending. The pixel resolution was 2.5 m times 2.5 m. Fig. 1 ALOS2 data (Left: whole scene, Right: Partial area with field polygon) - Sentinel1 Sentinel1 is C band SAR. Observation width is 250 km and resolution is 14 - 20 m. Regression period is 12 days with 2 satellites system. Acquired dates of using data were May 6, 2016, May 30, July 12, July 17, and August 10 at Path 46 (Descending), and April 7, May 1, May 25th, 5th August at Path 141 (Ascending). We set the one pixel was 10 m times 10 m. Fig. 2 Sentinel1data (Left: whole scene, Right: Partial area with field polygon)

2.2 Optical Sensor Data Sentinel 2 Observation width is 290 km, and blue / green / red / near infrared band are 10 m resolutions. Regression period is 10 days, and 5 days with 2 satellite. The data and the processing software for the data are opened by ESA. Acquired dates of using data are April 23, 2016, May 3, May 23, and August 11. We downloaded compressed data from ESA site using the Sentinels Scientific Data Hub (Now: the Copernicus Open Access Hub), decompress the data, made color composite images using the Sentinel Application Platform (SNAP) software, and extract necessary area using ArcGIS. Color composite images of r= red, g=near infrared, b=blue are made and 1 pixel of the image was set to 10 m x 10 m. Fig. 3 Sentine2 data (Left: whole scene, Right: Partial area with field polygon) Landsat 8 Observation width is 185 km. The resolution is multiband 30 m and panchromatic band 15 m, and it can be resolved to 15 m for RGB by pan sharpening. Regression period is 16 days. Acquired dates of using data are April 25, 2016, June 12, July 30, and August 31. Geocoded data are opened at USGS. We downloaded from USGS site using Earth Explorer and performed band combining, extracted necessary area, and pan-sharpened with ArcGIS. At final data, one pixel was 15 m x 15 m and three bands (RGB). Fig. 4 Landsat8 data (Left: whole scene, Right: Partial area with field polygon)
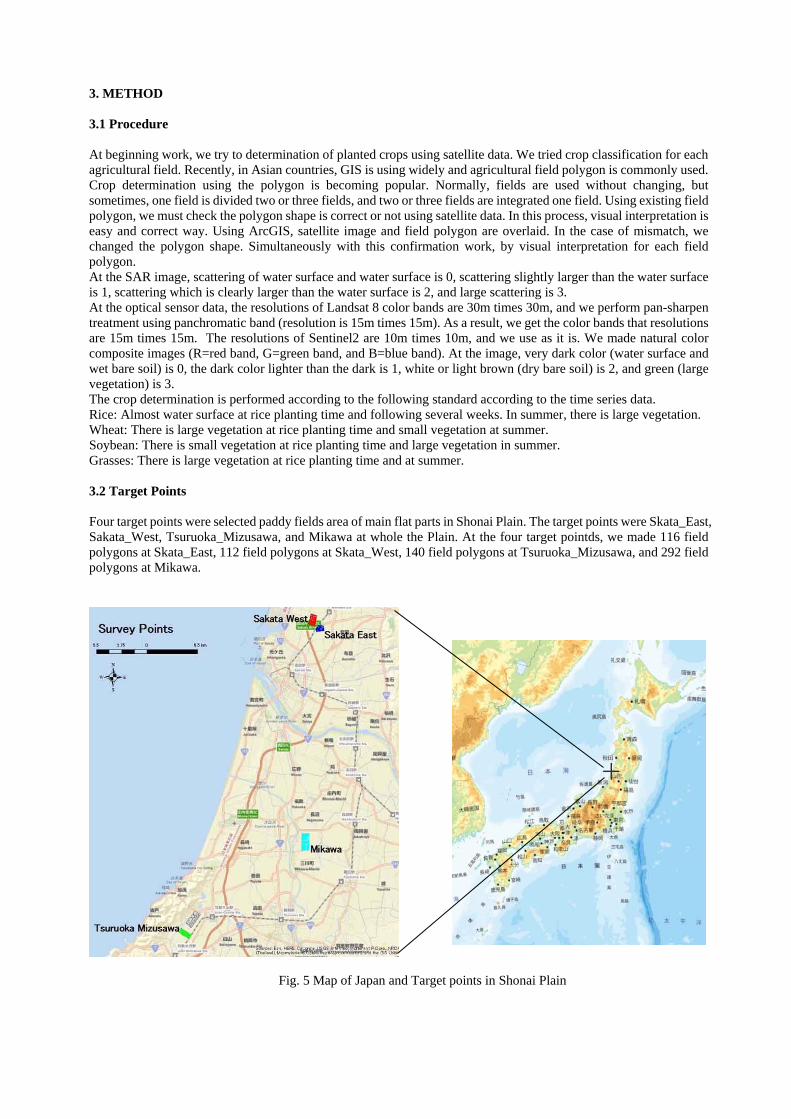
3. METHOD 3.1 Procedure At beginning work, we try to determination of planted crops using satellite data. We tried crop classification for each agricultural field. Recently, in Asian countries, GIS is using widely and agricultural field polygon is commonly used. Crop determination using the polygon is becoming popular. Normally, fields are used without changing, but sometimes, one field is divided two or three fields, and two or three fields are integrated one field. Using existing field polygon, we must check the polygon shape is correct or not using satellite data. In this process, visual interpretation is easy and correct way. Using ArcGIS, satellite image and field polygon are overlaid. In the case of mismatch, we changed the polygon shape. Simultaneously with this confirmation work, by visual interpretation for each field polygon. At the SAR image, scattering of water surface and water surface is 0, scattering slightly larger than the water surface is 1, scattering which is clearly larger than the water surface is 2, and large scattering is 3. At the optical sensor data, the resolutions of Landsat 8 color bands are 30m times 30m, and we perform pan-sharpen treatment using panchromatic band (resolution is 15m times 15m). As a result, we get the color bands that resolutions are 15m times 15m. The resolutions of Sentinel2 are 10m times 10m, and we use as it is. We made natural color composite images (R=red band, G=green band, and B=blue band). At the image, very dark color (water surface and wet bare soil) is 0, the dark color lighter than the dark is 1, white or light brown (dry bare soil) is 2, and green (large vegetation) is 3. The crop determination is performed according to the following standard according to the time series data. Rice: Almost water surface at rice planting time and following several weeks. In summer, there is large vegetation. Wheat: There is large vegetation at rice planting time and small vegetation at summer. Soybean: There is small vegetation at rice planting time and large vegetation in summer. Grasses: There is large vegetation at rice planting time and at summer. 3.2 Target Points Four target points were selected paddy fields area of main flat parts in Shonai Plain. The target points were Skata_East, Sakata_West, Tsuruoka_Mizusawa, and Mikawa at whole the Plain. At the four target pointds, we made 116 field polygons at Skata_East, 112 field polygons at Skata_West, 140 field polygons at Tsuruoka_Mizusawa, and 292 field polygons at Mikawa. Fig. 5 Map of Japan and Target points in Shonai Plain

4. RESULTS AND DISCUSSIONS The ranking scores of each field condition at the satellite image were filled in the excel tables, and we judged using standard mentioned .at “3.1 Procedure”. The water surface meant low backscatter at SAR and dark at optical data. At high vegetation, there were some backscatters in SAR image, and green color at the natural color composite of optical data. We listed Alos2 images of observing at 31 May 2016 just after trans-planting rice period, and at 2 August 2016 maximum growth stage of rice. Landsat8 data of four target points. We also listed Landsat8 data of observing at 12 June 2016 and 30 July 2016 that were between two Alos2 data. We made confusion matrixes and calculated user’s accuracy, producer’s accuracy, and overall accuracy, and listed as table 2- table 8. At the tables, we indicated number of fields. Table 1 Excel Table for Classify
4.1 Sakata East At the target point of Sakata East, there were some mistakes of rice to soybean. The reason of the mistake was there was no water in the rice paddy fields at 31 May. At the forage rice, direct seeding at non-flooding paddy was performed. At the case, flooding paddy was maybe at early June. Using Landsat8 data acquired 12 June, the mistake was corrected. Using SAR and optical data, one mistake was not supposed vegetable and another was very narrow field. Fig. 6 Alos2 images and field polygon at Sakata East
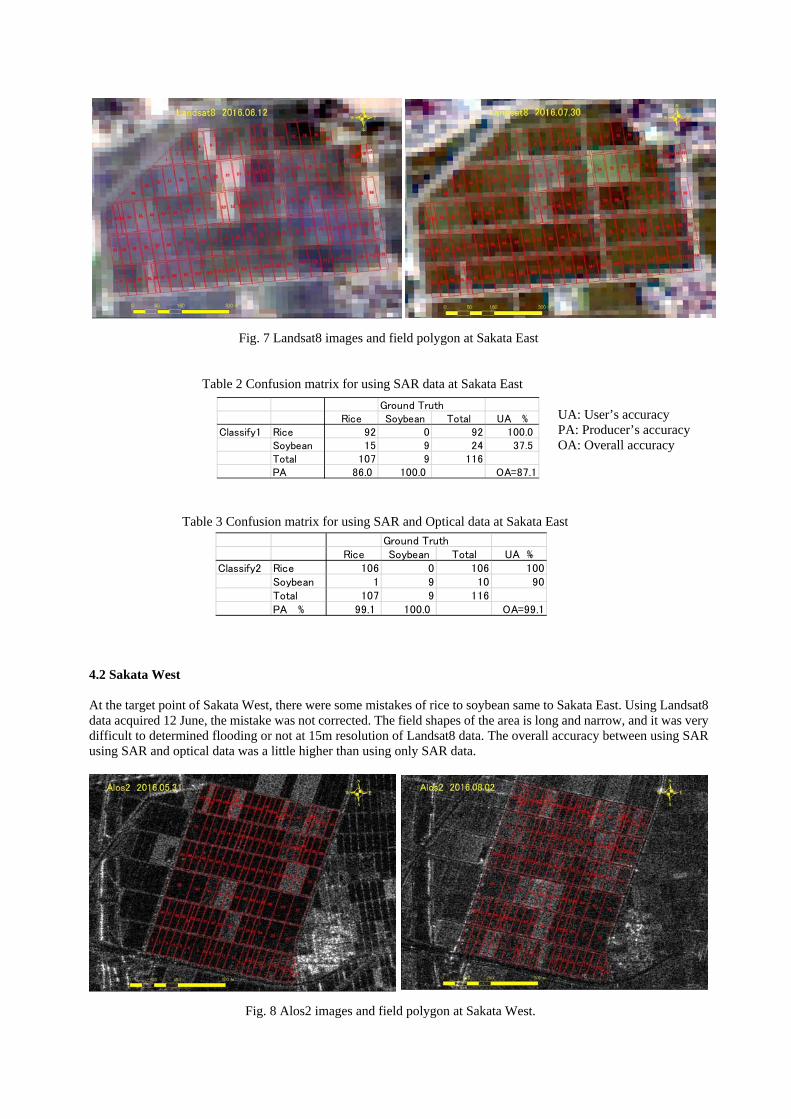
Fig. 7 Landsat8 images and field polygon at Sakata East Table 2 Confusion matrix for using SAR data at Sakata East UA: User’s accuracy PA: Producer’s accuracy OA: Overall accuracy Table 3 Confusion matrix for using SAR and Optical data at Sakata East 4.2 Sakata West At the target point of Sakata West, there were some mistakes of rice to soybean same to Sakata East. Using Landsat8 data acquired 12 June, the mistake was not corrected. The field shapes of the area is long and narrow, and it was very difficult to determined flooding or not at 15m resolution of Landsat8 data. The overall accuracy between using SAR using SAR and optical data was a little higher than using only SAR data. Fig. 8 Alos2 images and field polygon at Sakata West.
Ground TruthRice Soybean Total UA %
Classify1 Rice 92 0 92 100.0Soybean 15 9 24 37.5Total 107 9 116PA 86.0 100.0 OA=87.1
Ground TruthRice Soybean Total UA %
Classify2 Rice 106 0 106 100Soybean 1 9 10 90Total 107 9 116PA % 99.1 100.0 OA=99.1
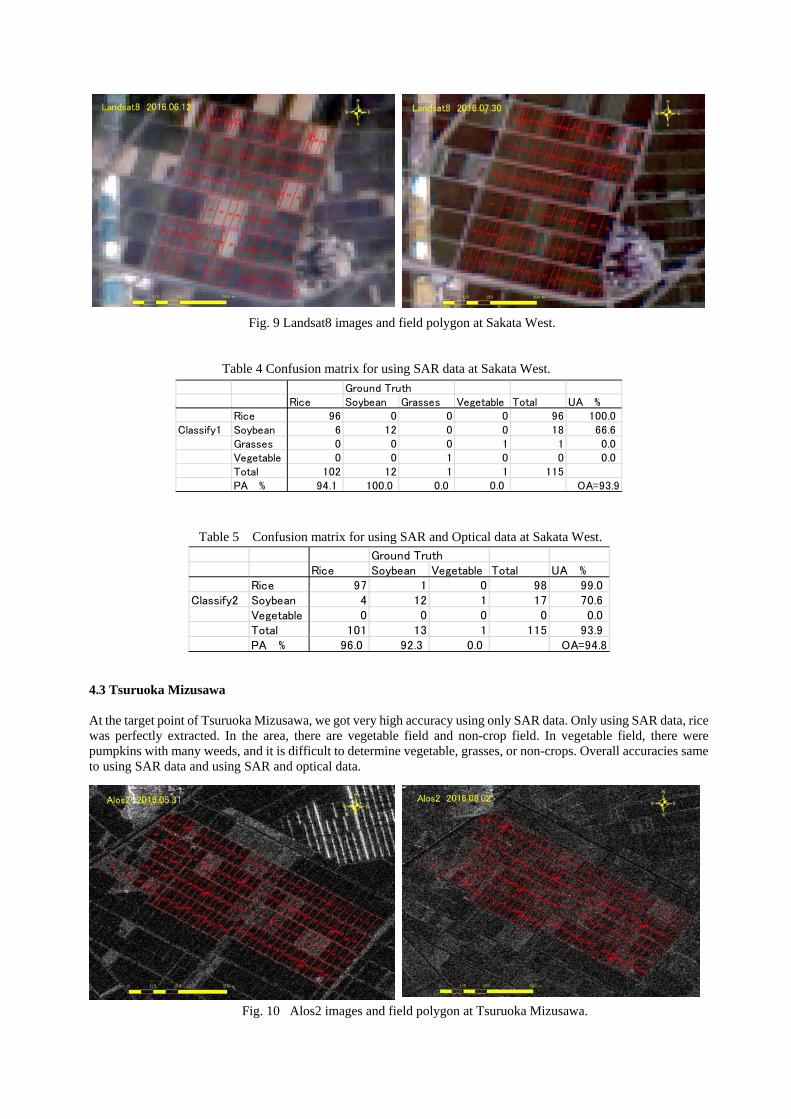
Fig. 9 Landsat8 images and field polygon at Sakata West. Table 4 Confusion matrix for using SAR data at Sakata West. Table 5 Confusion matrix for using SAR and Optical data at Sakata West. 4.3 Tsuruoka Mizusawa At the target point of Tsuruoka Mizusawa, we got very high accuracy using only SAR data. Only using SAR data, rice was perfectly extracted. In the area, there are vegetable field and non-crop field. In vegetable field, there were pumpkins with many weeds, and it is difficult to determine vegetable, grasses, or non-crops. Overall accuracies same to using SAR data and using SAR and optical data. Fig. 10 Alos2 images and field polygon at Tsuruoka Mizusawa.
Ground TruthRice Soybean Grasses Vegetable Total UA %
Rice 96 0 0 0 96 100.0Classify1 Soybean 6 12 0 0 18 66.6
Grasses 0 0 0 1 1 0.0Vegetable 0 0 1 0 0 0.0Total 102 12 1 1 115PA % 94.1 100.0 0.0 0.0 OA=93.9
Ground TruthRice Soybean Vegetable Total UA %
Rice 97 1 0 98 99.0Classify2 Soybean 4 12 1 17 70.6
Vegetable 0 0 0 0 0.0Total 101 13 1 115 93.9PA % 96.0 92.3 0.0 OA=94.8
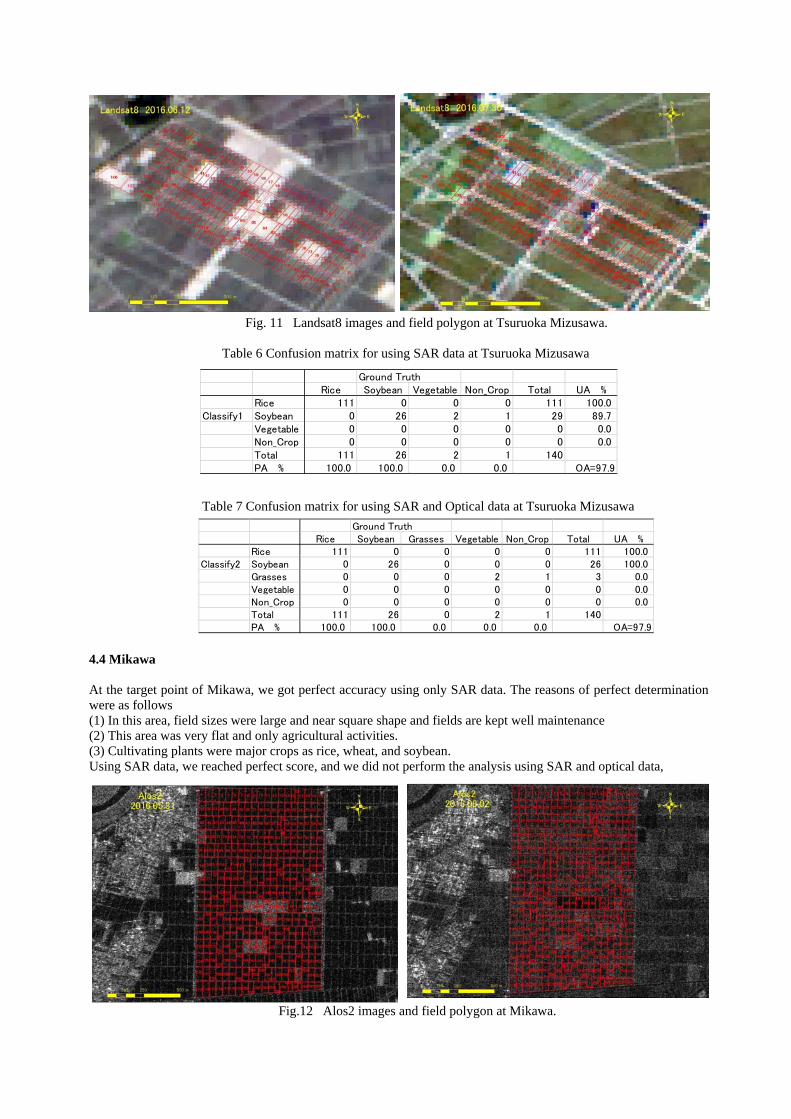
Fig. 11 Landsat8 images and field polygon at Tsuruoka Mizusawa. Table 6 Confusion matrix for using SAR data at Tsuruoka Mizusawa Table 7 Confusion matrix for using SAR and Optical data at Tsuruoka Mizusawa 4.4 Mikawa At the target point of Mikawa, we got perfect accuracy using only SAR data. The reasons of perfect determination were as follows (1) In this area, field sizes were large and near square shape and fields are kept well maintenance (2) This area was very flat and only agricultural activities. (3) Cultivating plants were major crops as rice, wheat, and soybean. Using SAR data, we reached perfect score, and we did not perform the analysis using SAR and optical data, Fig.12 Alos2 images and field polygon at Mikawa.
Ground TruthRice Soybean Vegetable Non_Crop Total UA %
Rice 111 0 0 0 111 100.0Classify1 Soybean 0 26 2 1 29 89.7
Vegetable 0 0 0 0 0 0.0Non_Crop 0 0 0 0 0 0.0Total 111 26 2 1 140PA % 100.0 100.0 0.0 0.0 OA=97.9
Ground TruthRice Soybean Grasses Vegetable Non_Crop Total UA %
Rice 111 0 0 0 0 111 100.0Classify2 Soybean 0 26 0 0 0 26 100.0
Grasses 0 0 0 2 1 3 0.0Vegetable 0 0 0 0 0 0 0.0Non_Crop 0 0 0 0 0 0 0.0Total 111 26 0 2 1 140PA % 100.0 100.0 0.0 0.0 0.0 OA=97.9

Fig. 13 Landsat8 images and field polygon at Mikawa
Table 8 Confusion matrix for using SAR data at Mikawa REFFERENCE 1) Meeting of G20 Agriculture Ministers, 2011, Action plan on food price volatility and agriculture. Inhttp://agriculture.gouv.fr/IMG/pdf/2011-06-23_-_Action_Plan_-_VFinale.pdf, Paris, France, 22-23, June 2011. 2) Asia-RiCE team, 2012, GEOGLAM Work Plan: Asia-Rice Crop Estimation & Monitoring (Asia-RiCE) Component. In http://www.asia-rice.org/files/workplan.pdf. 3) S. Sobue, K. Oyoshi, Y. Kaneko, T. Nagano, T. Okumura, N. Tomiyama, Asian Rice Crop Monitoring for GEO-GLAM ACRS 2013 4) K. Oyoshi, N. Tomiyama, T. Okumura, S. Sobue, and J. Sato: Rice-Planted Areas Using Time-Series Synthetic Aperture Radar Data for the Asia-RiCE Activity, J, Paddy and Water Environment, 1/10 (2015)
Ground TruthRice Soybean Wheat Total UA %
Rice 273 0 0 273 100.0Classify1 Soybean 0 12 0 12 100.0
Wheat 0 0 7 7 100.0Total 273 12 7 292PA % 100.0 100.0 100.0 OA=100.0