determination of heme in microorganisms using hplc-ms/ms ... · determination of heme in...
TRANSCRIPT

RESEARCH PAPER
Determination of heme in microorganisms using HPLC-MS/MSand cobalt(III) protoporphyrin IX inhibition of heme acquisitionin Escherichia coli
Jonas Fyrestam1& Conny Östman1
Received: 21 June 2017 /Revised: 11 August 2017 /Accepted: 28 August 2017 /Published online: 17 October 2017# The Author(s) 2017. This article is an open access publication
Abstract One of the main threats to the achievements inmodern medicine is antimicrobial resistance. Moleculartargeting of bacterial acquisition mechanisms of heme hasbeen suggested to be an alternative to antibiotics. In the pres-ent study, HPLC-MS/MS combined with a simple clean-upbased on liquid-liquid extraction has been developed and eval-uated for simultaneous determination of heme and porphyrinheme precursors in microorganisms. Experimental design wasused to optimize the extraction parameters, to obtain a methodwith high recovery, low matrix effects, and high precision.The effects of additives in the culture medium on the biosyn-thesis of heme were studied using Escherichia coli as a modelmicroorganism. 5-Aminolaevulinic acid and hemin increasedthe heme concentration in E. coli by a factor of 1.5 and 4.5,respectively. Addition of 5-aminolaevulinic acid bypassed theE. coli negative feedback control of heme biosynthesis, whichled to high amounts of intracellular porphyrins. The highheme concentration obtained when hemin was used as a cul-ture additive shows that E. coli has an uptake of heme from itssurroundings. In contrast, addition of cobalt protoporphyrinIX to the growth medium reduced the amount of heme inE. coli, demonstrating this compound’s ability to mimic realheme and inhibit the heme acquisition mechanisms.
Keywords Heme acquisition . Heme analysis . Escherichiacoli . HPLC-MS/MS . Antimicrobial resistance . Porphyrins
Abbreviations5-ALA 5-Aminolevulinic acid hydrochlorideCo-PPIX Cobalt protoporphyrin IXLB Lysogeny brothOD600 Optical density at 600 nm
Introduction
Increasing antimicrobial resistance among pathogens has beenpointed out by the World Health Organization to be a problemso serious that it threatens the achievements of modern med-icine [1]. In recent years, it has been proposed that targetingthe mechanisms that take part in the acquisition of iron couldbe an important complement to antibiotics. In the long run,this could help to decrease the amount of antibiotics usedwhich is themain reason for increased antimicrobial resistanceagainst antibiotics worldwide [2–9].
Iron acts as a crucial cofactor in many important biologicalprocesses such as respiration and DNA synthesis and is essen-tial for most living organisms [10, 11]. Pathogenic bacteria areno exception, and to cause a disease, they need to acquire ironfrom their hosts [12]. In vertebrates, the majority of iron ispresent bound to a porphyrin ring, i.e., heme (Fig. 1) [2].Vertebrates have developed strategies to limit bacterial accessof free iron during an infection, a process often known as iron-withholding [13]. Transferrin and lactoferrin, two proteinswith a high affinity for iron, are synthesized in excess duringthe first stage of an infection to reduce the levels of free ironavailable for pathogens that are required for their survival.These mechanisms are reducing free iron to negligible
Electronic supplementary material The online version of this article(https://doi.org/10.1007/s00216-017-0610-5) contains supplementarymaterial, which is available to authorized users.
* Conny Ö[email protected]
1 Division of Analytical and Toxicological Chemistry, Department ofEnvironmental Science and Analytical Chemistry, StockholmUniversity, Svante arrheniusväg 16C, 106 91 Stockholm, Sweden
Anal Bioanal Chem (2017) 409:6999–7010DOI 10.1007/s00216-017-0610-5

amounts, below 10−18 M [2]. As a response to these iron-withholding processes, bacteria have developed differentstrategies to acquire iron from their host. Pathogens start toproduce and release compounds into the extracellular mediumto scavenge heme or iron from a number of sources. Gramnegative bacteria produce and excrete proteins (hemophores)that bind to heme. These proteins have high affinity for hemeand they return to specific receptors located in the outer mem-brane of the bacteria [14]. Bacteria also have heme acquisitionsystems with receptors that recognize heme and transport itinto the cell via ATP-binding cassette transporters [15, 16].
A number of non-iron metalloporphyrins have previouslyshown to be potent antimicrobial compounds [9, 17–19]. Aputative cause of this toxicity to pathogens is that these com-pounds chemically mimic real heme. In this way,metalloporphyrins can be a substrate for the heme acquisitionmechanisms and taken up by the cell. Inside the cell, thesemolecules are partitioned into the cell membrane, displacingheme and inhibiting respiration [17, 19].
Accurate determinations of heme are essential to widen ourunderstanding of how different microbes acquire heme.Although heme is of great importance for microbial survival,there are currently no validated methods for selective determi-nation of trace levels of heme in microorganisms. Often, un-specific methods are used such as UV-Vis absorption spectros-copy [20]. Heme has previously been determined by HPLC inplant cells and cyanobacteria [21], as well as in phyto- andbacterioplankton [22], but the analytical methods used in thesestudies lack sufficient evaluation to accurately determineheme.
The aim of this study was to develop and evaluate an ana-lytical method for the extraction, clean-up, and analysis ofheme utilizing HPLC-MS/MS using Saccharomyces
cerevisiae and Escherichia coli as model microorganisms.The method was applied to determine heme in E. coli and itsrelation to microbial synthesis and/or acquisition of hemewhen grown using different culturing conditions.
Experimental
Chemicals
Formic acid (≥ 98%), tris(hydroxymethyl)aminomethane(Tris), ferrous sulfate, magnesium sulfate, and separate stan-dards of protoporphyrin IX (purity ≥ 95%), protoporphyrin IXcobalt chloride, 5-aminolaevulinic acid hydrochloride (purity≥ 97%), and hemin from porcine (purity ≥ 97%) were obtainedfrom Sigma-Aldrich (Schnelldorf, Germany). HPLC-grademethanol, acetone, and acetonitrile were purchased fromRathburn Chemicals Ltd. (Walkerburn, Scotland). Analytical-grade hydrochloric acid (37%) and dimethylformamide (DMF)were obtained from VWR International (Fontenay-sous-Bois,France). Ethylenediaminetetraacetic acid disodium dihydratesalt (EDTA) and sodium chloride of reagent grade were ac-quired from Scherlab S.L. (Sentmenat, Spain). A Synergy 185water purification system from Millipore (Molsheim, France)was used to produce deionized water at 18 MΩ cm. Porphyrinacid chromatographic marker kit (CMK-1A) containing10 ± 1 nmol of each of six porphyrins (mesoporphyrin IX,coproporphyrin I, 5-carboxylporphyrin I, 6-carboxylporphyrinI, 7-carboxylporphyrin I, and uroporphyrin I) were obtainedfrom Frontier Scientific Inc. (Logan, UT, USA). S. cerevisiaewas used for method validation and it was obtained fromJästbolaget (Sollentuna, Sweden). E. coli NovaBlue was ob-tained from the Department of Biochemistry and Biophysicsat Stockholm University.
Culturing and harvest of E. coli
E. coli was cultivated in sterile Miller lysogeny broth (LB) at37 °C. To determine the influence of different additives onheme and iron acquisition mechanisms in E. coli, the LB me-dium was supplemented with five additives: Fe(II)SO4, he-min, 5-aminolevulinic acid hydrochloride (5-ALA), and pro-toporphyrin IX cobalt chloride. The influence of cultivationtime was also investigated. The different culture conditionsare listed in Table 1.
E. coli was allowed to grow to stationary phase for 60 h;thereafter, the different additives were added for individualexperiments and grown for additional 24 h (samples 2–5 inTable 1). In sample 5 (Table 1), cobalt protoporphyrin IX’s(Co-PPIX) ability to inhibit E. coli hemin acquisition wasinvestigated. Culture was allowed to grow for 60 h, and thenCo-PPIX was added and grown for an additional 1 h. Heminwas added and the culture was grown for 24 h. Estimation of
Fig. 1 Chemical structure of heme
7000 Fyrestam J., Östman C.
sample sizes was made by measuring the optical density at600 nm (OD600) using an UV-Vis spectrophotometer (ThermoFisher Scientific, Stockholm, Sweden).
For the further experiments, the microorganisms were har-vested by taking 2 mL aliquots of cultures and centrifuge at13,200×g for 5 min. After removal of the supernatant, thepellets were washed two times with 2 mL 0.4% NaCl to re-move remaining cultivation broth. The pellets were then sub-jected to the sample preparation described below.
Sample preparation
Approximately 100 mg (wet weight) of S. cerevisiae and3 mg (dry weight) of E. coli were put in 15-mL Falcon™tubes together with 1 mL of Tris-EDTA buffer (pH 7.2) andstirred for 1 h at room temperature using a shaker (IKAVXRVibrax, Staufen, Germany) at 1600 RPM. Samples were puton ice and treated with ultrasonication (Sonics Vibracell,Newtown, CT, USA) for 5 min with 1 s pulse. Three millili-ters of acetonitrile was added to the sample which then wasvortexed for 5min and subsequently subjected to centrifuga-tion at 2500×g for 5 min, making a pellet of precipitatedproteins. The acetonitrile containing unpolar interferingcompounds, as well as porphyrins, was removed and can beana lyzed fo r porphyr in con ten t . Then , 4 mL ofacetonitrile:1.7 M HCl (8:2, v/v) was added to the pellet andput in a shaker for 20 min, extracting heme from the proteinsinto the acetonitrile. To create a two phase liquid-liquid sys-tem, 1 mL of saturated MgSO4(aq) and 0.1 g of NaCl(s) wereadded. The solution was vortexed for 5 min and centrifugedat 2500×g for 5 min. The top organic layer was put in a vialand, if necessary, diluted with pure acetonitrile prior to anal-ysis. A blank and a standard used for quantification purposes
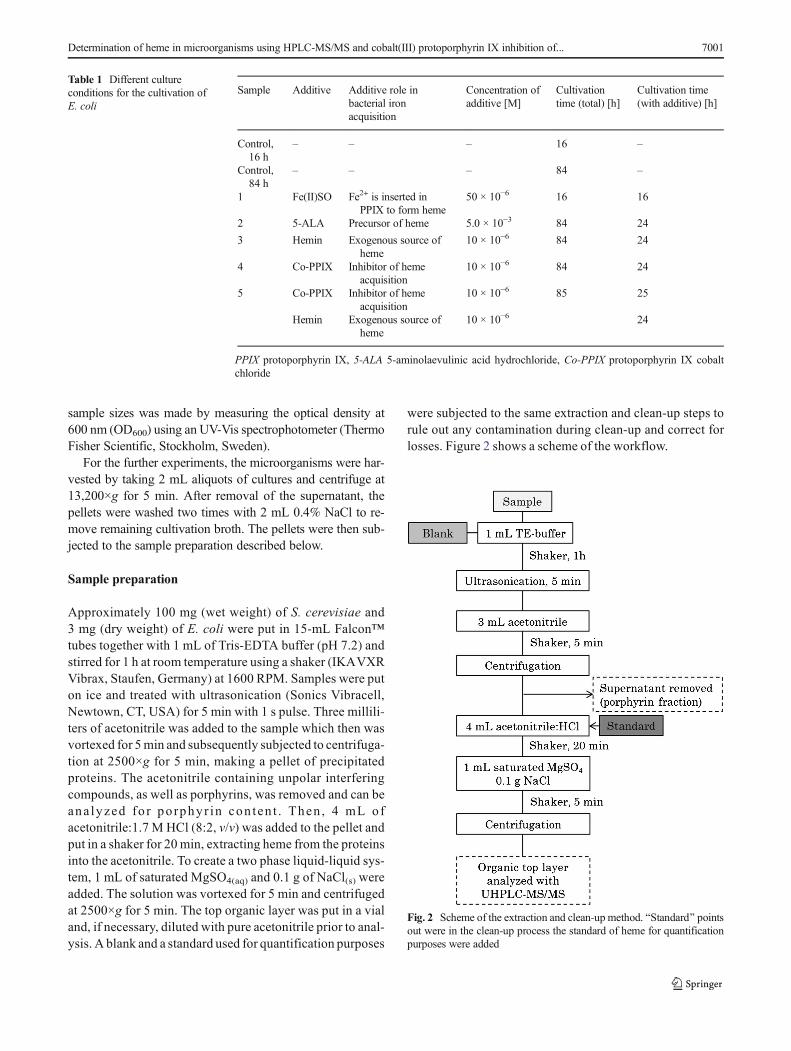
were subjected to the same extraction and clean-up steps torule out any contamination during clean-up and correct forlosses. Figure 2 shows a scheme of the workflow.
Table 1 Different cultureconditions for the cultivation ofE. coli
Sample Additive Additive role inbacterial ironacquisition
Concentration ofadditive [M]
Cultivationtime (total) [h]
Cultivation time(with additive) [h]
Control,16 h
– – – 16 –
Control,84 h
– – – 84 –
1 Fe(II)SO Fe2+ is inserted inPPIX to form heme
50 × 10−6 16 16
2 5-ALA Precursor of heme 5.0 × 10⁻³ 84 24
3 Hemin Exogenous source ofheme
10 × 10−6 84 24
4 Co-PPIX Inhibitor of hemeacquisition
10 × 10−6 84 24
5 Co-PPIX Inhibitor of hemeacquisition
10 × 10−6 85 25
Hemin Exogenous source ofheme
10 × 10−6 24
PPIX protoporphyrin IX, 5-ALA 5-aminolaevulinic acid hydrochloride, Co-PPIX protoporphyrin IX cobaltchloride
Fig. 2 Scheme of the extraction and clean-up method. BStandard^ pointsout were in the clean-up process the standard of heme for quantificationpurposes were added
Determination of heme in microorganisms using HPLC-MS/MS and cobalt(III) protoporphyrin IX inhibition of... 7001
LC-MS/MS analysis
The analyses of heme, hemin, and porphyrins were performedon a Xevo TQ-S tandemmass spectrometer (MS/MS) coupledto a high performance liquid chromatograph Acquity I-Classsystem (Waters). An ACE 3 C18 column (2.1 × 50 mm,Advanced Chromatography Technologies Ltd., Aberdeen,Scotland), placed in a column oven (50 °C), was used forthe separation with a gradient elution using water and aceto-nitrile with 0.1% formic acid (FA) as mobile phases. Signalsfrom all analytes were acquired in positive electrospray mode(ESI+) and multiple reaction monitoring (MRM) with threecompound-specific transitions for each analyte, all transitionsused as quantifier and qualifier ions. The mass spectrometerwas tuned by direct infusion of a standard solution with aconcentration of 2 μMof the analytes. The dwell time for eachtransition was automatically set by the software to be 0.012 sin order to get approximate 12 data points over a peak with awidth of 4 s.
Liquid chromatography and mass spectrometry parametersare presented in Table 2.
Linearity and limit of detection
An 11-point calibration curve of hemin was made by injec-tions of a standard solution in the range of 5–250 pmol toinvestigate the linear relationship between analyte concentra-tion and instrumental response. Each level was injected intriplicate and analyzed in MRM mode. Limit of detection(LOD) was determined by injections of 0.75 pmol hemin(n = 7). The signal (S) was defined as the mean area of thesereplicate injections and the noise (N) defined as the standarddeviation. Limit of detection were defined as three times thesignal to noise ratio (S/N).
Optimization of heme extraction
A full factorial central composite face design with three centerpoints was used to optimize the extraction conditions of hemefrom S. cerevisiaewith acetonitrile as the organic solvent. Theevaluated factors were time of extraction (1, 20, and 40 min),percentage of acetonitrile (33, 66, and 99%, v/v), and molarconcentration of HCl (0.1, 1, and 2 mol/dm3) using 17 exper-iments. A total weight of 0.8 g S. cerevisiaewas put in 3mL ofTris/EDTA buffer for digestion during 1 h and further lysed byultrasonication for 5 min (1 s pulse). Aliquots of 100 μL weretransferred to 0.5 mL micro vials and 400 μL of differentacetonitrile/HCl mixtures was added and was immediatelyvortexed for 1, 20, or 40 min. Immediately after vortexing,the micro vials were centrifuged at 13,200×g and the super-natant transferred to vials and analyzed for heme content. Theexperimental data were processed using MODDE software(ver. 10.0.0; MKS Umetrics, Umeå, Sweden).
Protein precipitation efficiency
Five different solvent mixtures were selected for evaluation oftheir ability to precipitate proteins from S. cerevisiae. Acetone,acetonitrile, and methanol solutions were mixtures of 80%organic solvent together with 20% 1.7 M HCl (v/v). Pureacetonitrile as well as 1.7 M HCl were also evaluated.
S. cerevisiae was lysed as described above, and 100 μLyeast extract was added to 200 μL of precipitation solvent in1.5 mL micro vials, vortexed for 20 s, and left to stand for10 min. Solutions were centrifuged at 13,200×g for 5 min.Measurement of the protein concentration was done with aspectrophotometer (Waters) using the Bradford micro proteinassay at a wavelength of 595 nm. Absorbances before andafter protein precipitation were used to calculate the proteinprecipitation efficiency by the equation;
Absorbance before precipitation−Absorbance after precipitationAbsorbance before precipitation
� 100%
Bovine serum albumin standards were used to check thelinear response of the spectrophotometer. The experimentswere performed in triplicate with three absorbance measure-ments of each sample.
Stability of heme in different solvents
Storage stability of hemin in room temperature was investi-gated using six solvents and solvent mixtures: 100% acetoni-trile, 1 M NaOH, 6 M formic acid, deionized water,acetonitrile:1.7 M HCl (8:2, v/v), and the organic top layerfrom the liquid-liquid extraction when using acetonitrile asdescribed above. Hemin standards dissolved in the six sol-vents were put in the autosampler tray and analyzed daily induplicate during 7 days. For each analytical run, a volumetricstandard was used to account for day to day variations ininstrumental response.
Results and discussion
Optimization of heme extraction
Acetone extraction has been used to extract heme from samplematrices such as plants [20, 23] and algae [24] and is generallyadopted as the standard procedure for heme extraction. Theextractions are normally carried out in 80% acetone contain-ing 20% of 0.6–2.1 M HCl [20]. However, acetonitrile hasseveral advantages compared to acetone as a solvent. It haslower elution strength in reversed phase LC columns, makingit more suitable to inject without extensive band broadening ofthe peaks on reversed phase columns. It also has a lower UVcutoff wavelength, making it more suitable for the detection
7002 Fyrestam J., Östman C.
with UV-vis, and it has been shown to possess better proteinprecipitation properties when the aim has been to removeproteins from the sample matrix [25]. For these reasons, ace-tonitrile was selected as a candidate solvent for optimizationof heme extraction.
The experiments were evaluated using the MODDE soft-ware, and the coefficient plot showed that only two factorswere significantly affecting the extraction efficiency of heme(p ≤ 0.05): the molar concentration of HCl and the percentageof acetonitrile. Surprisingly, the extraction time was found not
Table 2 Conditions for the LC-MS/MS analyses HPLC ESI-MS/MS conditions
Chromatographic conditions Electrospray conditions
Column dimensions 2.1 × 50 mm Ionization mode ESI (+)
Stationary phase C-18 Capillary voltage 3500 V
Particle size 3 μm Source temperature 150 °C
Column temperature 50 °C Desolvation temperature 650 °C
Mobile phase A ACN/H20 Desolvation gas flow 650 L/h
5:95 + 0.1% FA
Mobile phase B ACN/H20
95:5 + 0.1% FA
Flow rate 1 mL/min
Injection volume 5 μL
Autosampler temperature 5 °C
Gradient MS/MS conditions
Time [min] B% Dwell time 0.012 s
Initial 20 MS/MS MRM
5.00 100
5.50 100 Compound Transition CV CE
5.51 20 Uroporphyrin 831 > 727 10 112
6.00 20 831 > 623 10 112
831 > 655 10 112
7-Carboxylporphyrin 787 > 623 8 118
787 > 682 8 120
787 > 670 8 120
6-Carboxylporphyrin 743 > 639 18 110
743 > 507 18 110
743 > 521 18 110
5-Carboxylporphyrin 699 > 463 4 120
699 > 495 4 108
699 > 639 4 90
Coproporphyrin 655 > 522 10 120
655 > 536 10 120
655 > 595 10 102
Hemin 616 > 482 64 120
616 > 497 64 116
616 > 557 64 82
Mesoporphyrin 568 > 478 2 102
568 > 508 2 74
568 > 449 2 74
Protoporphyrin 563 > 444 20 110
563 > 489 20 96
563 > 504 20 78
CV cone voltage, CE collision energy
Determination of heme in microorganisms using HPLC-MS/MS and cobalt(III) protoporphyrin IX inhibition of... 7003
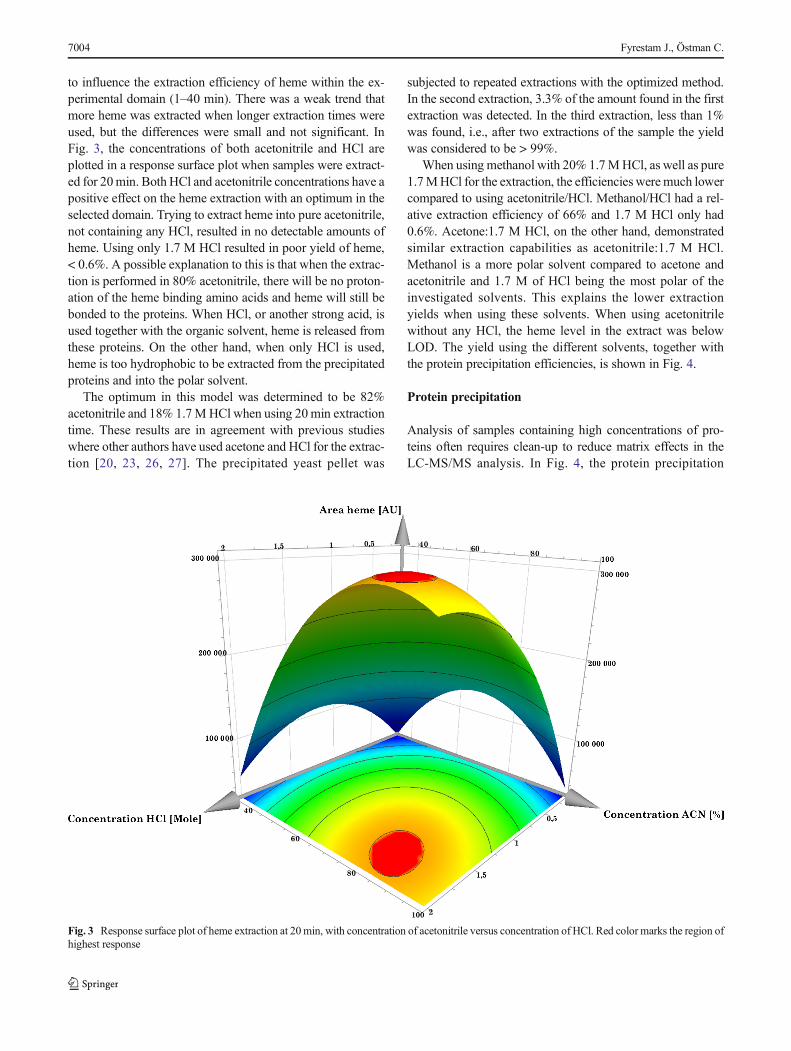
to influence the extraction efficiency of heme within the ex-perimental domain (1–40 min). There was a weak trend thatmore heme was extracted when longer extraction times wereused, but the differences were small and not significant. InFig. 3, the concentrations of both acetonitrile and HCl areplotted in a response surface plot when samples were extract-ed for 20min. Both HCl and acetonitrile concentrations have apositive effect on the heme extraction with an optimum in theselected domain. Trying to extract heme into pure acetonitrile,not containing any HCl, resulted in no detectable amounts ofheme. Using only 1.7 M HCl resulted in poor yield of heme,< 0.6%. A possible explanation to this is that when the extrac-tion is performed in 80% acetonitrile, there will be no proton-ation of the heme binding amino acids and heme will still bebonded to the proteins. When HCl, or another strong acid, isused together with the organic solvent, heme is released fromthese proteins. On the other hand, when only HCl is used,heme is too hydrophobic to be extracted from the precipitatedproteins and into the polar solvent.
The optimum in this model was determined to be 82%acetonitrile and 18% 1.7MHCl when using 20min extractiontime. These results are in agreement with previous studieswhere other authors have used acetone and HCl for the extrac-tion [20, 23, 26, 27]. The precipitated yeast pellet was
subjected to repeated extractions with the optimized method.In the second extraction, 3.3% of the amount found in the firstextraction was detected. In the third extraction, less than 1%was found, i.e., after two extractions of the sample the yieldwas considered to be > 99%.
When using methanol with 20% 1.7MHCl, as well as pure1.7MHCl for the extraction, the efficiencies weremuch lowercompared to using acetonitrile/HCl. Methanol/HCl had a rel-ative extraction efficiency of 66% and 1.7 M HCl only had0.6%. Acetone:1.7 M HCl, on the other hand, demonstratedsimilar extraction capabilities as acetonitrile:1.7 M HCl.Methanol is a more polar solvent compared to acetone andacetonitrile and 1.7 M of HCl being the most polar of theinvestigated solvents. This explains the lower extractionyields when using these solvents. When using acetonitrilewithout any HCl, the heme level in the extract was belowLOD. The yield using the different solvents, together withthe protein precipitation efficiencies, is shown in Fig. 4.
Protein precipitation
Analysis of samples containing high concentrations of pro-teins often requires clean-up to reduce matrix effects in theLC-MS/MS analysis. In Fig. 4, the protein precipitation
Fig. 3 Response surface plot of heme extraction at 20min, with concentration of acetonitrile versus concentration of HCl. Red color marks the region ofhighest response
7004 Fyrestam J., Östman C.

efficiencies of the solvent mixtures are shown. The most effi-cient precipitant was 100% acetonitrile which precipitated100.5% (± 0.6) of the proteins present in the S. cerevisiaeextracts. This is in agreement with other studies where aceto-nitrile has been reported to be the most efficient precipitant toproteins in blood plasma [25, 28]. Methanol:1.7 M HCl (8:2,v/v) precipitated 82.4% (± 1.0) of the total protein content,while acetonitrile:1.7 M HCl (8:2, v/v) had a precipitationefficiency of 75.4% (± 4.1). Acetone:1.7 M HCl (8:2, v/v)and 1.7 M HCl had the lowest protein precipitation efficiencywith 61.5% (± 0.2) and 62.0% (± 1.8), respectively. All deter-minations of protein precipitation efficiencies are averagevalues from three replicates.
Clean-up and stability of heme
One of the most crucial problems to overcome in hemeanalysis utilizing LC-MS/MS instrumentation is the abilityof heme to form aggregates and precipitate in aqueous so-lutions [29, 30]. When a standard of hemin was analyzedafter having been dissolved in MQ water and left for 24 h atroom temperature, the hemin concentration had decreasedwith 28%. Increasing as well as decreasing the pH withNaOH and formic acid made hemin aggregate quicker.After 24 h in 1 M of NaOH and in 6 M formic acid, thehemin content had decreased to 52 and 45%, respectively.This makes the analysis of heme from microorganismsproblematic since the optimized extraction solvent requiresthe addition of an acid in order to extract heme from theheme proteins. When hemin was stored in 100% of aceto-nitrile, it was more stable and had only decreased 6% after1 week of storage in room temperature. However, whenhemin was put in the solvent composition used for the
optimized extraction procedure (acetonitrile:1.7 M HCl(8:2, v/v)), it aggregates and the concentration decreasedto 85%within 24 h, and after 1 week, only 49% of the hemincontent remained un-aggregated.
The poor yield of heme into pure acetonitrile can be used inthe clean-up process of microbiological samples. Adding100% acetonitrile to the lysate will remove hydrophobic in-terfering substances after centrifugation and removal of thesupernatant (porphyrin fraction). Heme will still be bond tothe sedimented proteins and can subsequently be extractedwith the optimized extraction solvent.
To stabilize heme in the extraction solvent, 1 mL of satu-ratedMgSO4(aq) and 0.1 g of NaCl(s) were added. A two-phasesystem with acetonitrile in the top layer and the aqueous so-lution in the bottom layer was formed. Polar interfering sub-stances distributed into the aqueous layer and were removedfrom the sample, while heme partitioned into the organic sol-vent. No heme could be detected in the lower aqueous layer. Astability test of hemin dissolved in this organic top layer solu-tion showed no decrease of hemin after 1 week of storage inroom temperature. The stability of hemin in all the testedsolvents is shown in Fig. 5.
Methods for determination of heme in various biologicalmatrices have been presented in the literature. However, theaggregation and precipitation of heme has not been consideredand/or the analytical methods lack sufficient validation[31–35]. This raise questions for the accuracy in reportedvalues of heme concentrations. The method presented herehas solved the problem with heme aggregation andprecipitation demonstrated by stability during at least 1 weekof storage in room temperature. Further evaluation is needed ifsamples are stored for a longer time and/or at higher as well aslower temperatures.
Fig. 4 Relative yield (bars) ofheme from S. cerevisiae usingdifferent extraction solvents andtheir protein precipitationefficiency (lines). Error barsrepresent the standard deviationfor triplicate
Determination of heme in microorganisms using HPLC-MS/MS and cobalt(III) protoporphyrin IX inhibition of... 7005

Analysis of heme with HPLC-MS/MS
Chromatographic separation
In Fig. 6, a chromatogram is shown for the HPLC-MS/MSanalysis of hemin and heme precursors (porphyrins). Allcompounds are baseline separated within 4 min. Total runtimefor one sample, including pre- and post-runs to clean andcondition the column, is 6 min. In other methods where heme
has been separated with HPLC, the chromatographic run nor-mally takes between 15 and 45 min [22, 33, 36, 37].
Linearity and detection limit
The calibration curve showed nonlinear characteristics with asignificant curvature in the concentration range 5–250 pmol.This pattern of hemin linearity was demonstrated on two dif-ferent mass spectrometers with electrospray ionization and isprobably explained by signal saturation in the electrospray athigh concentrations [38]. To be able to model the data in inthis concentration range, it is recommended to use a polyno-mial curve fitting of second degree (R2 > 0.99). A linear cal-ibration curve (R2 > 0.98) was obtained when limiting theconcentration range to 5–100 pmol (Fig. S1 in ElectronicSupplementary Material (ESM)).
Limit of detection was determined at 0.2 pmol of injectedhemin. The LOD is the lowest concentration of an analyte thatthe analytical process can reliably differentiate from back-ground levels [39]. A low LOD is of importance when apply-ing this method to other microorganisms that are not as easy toculture as S. cerevisiae, thus yielding smaller sample sizes.Wehave not been able to find any reported LOD values fromprevious studies, but we consider 0.2 pmol to be low for thiskind of matrices.
Matrix effect
Approximately 150 mg (wet weight) of S. cerevisiae was putthrough the sample preparation steps with the only differencethat the acetonitrile used in the liquid-liquid extraction did notcontain any HCl, thus not extracting any heme from the yeastcells. In this way, an analyte-free matrix was created close to a
Fig. 5 Hemin stability during7 days when dissolved in sixdifferent solvents. Ax is the arearatio to a volumetric standard atthe investigated day and A0 is thearea ratio to a volumetric standardat day 0. Organic top layer is thesolvent used in the liquid-liquidextraction
Fig. 6 Total reconstructed ion chromatogram from the HPLC-MS/MSanalysis of a standard mixture of porphyrins and hemin. UP,uroporphyrin; 7P, 7-carboxylporphyrin; 6P, 6-carboxylporphyrin; 5P, 5-carboxylporphyrin; CP, coproporphyrin; Hemin; MPIX, mesoporphyrinIX; PPIX, protoporphyrin IX. Flow rate = 1 mL/min. Injectionvolume = 5 μL. Detection: MRM using three compound-specifictransitions for each analyte
7006 Fyrestam J., Östman C.

real sample matrix. The analyte-free matrix was spiked withhemin to a concentration of 15 μM. The response obtainedfrom the HPLC-MS/MS analysis was compared to a referencestandard dissolved in pure extraction solvent. The resultsshowed that the matrix effect was low, with a value of106 ± 3% which was not significantly different from 100%(p ≤ 0.05). The low matrix effect demonstrates that the clean-up procedure is efficient in removing interfering compounds,and the reproducibility and accuracy could be considered ashigh.
Precision and recovery
The intraday precision was determined at three different con-centration levels, 0.015, 0.15, and 15 μM, in an analyte-freematrix produced as described above. Each concentration levelwas injected in triplicate and the average intraday variationwas low and found to be 6 ± 5%.
Three different concentration levels, 0.15, 1.50, and15.00 μM, were put through the clean-up steps describedabove to determine the recovery. The signal responses werecompared to a standard dissolved in the same solvent compo-sition. The average recovery for the three different concentra-tion levels was found to be 89 ± 9%.
Application of the method
Determination of heme in S. cerevisiae
To demonstrate the applicability of the developed method,samples of approximately 100 mg (wet weight) ofS. cerevisiae were put through the extraction and clean-upsteps described in the BExperimental^ section. Heme wasidentified and quantified in all the samples with an averageconcentration of 51 ± 5 nmol/g. A chromatogram of hemeanalysis in S. cerevisiae can be seen in ESM Fig. S2. Whenthe porphyrin fraction in the liquid-liquid extraction was ana-lyzed, two isomers of coproporphyrin (I and III) and protopor-phyrin IX were detected in all samples.
Effect of additives and time of cultivation on the hemeconcentration in E. coli
When E. coli was analyzed with different additives and cul-turing length, the heme concentrations were shown to be af-fected (Fig. 7). Addition of Fe2+ ions added to the LB brothhad however no significant increase in heme concentrations(235 ± 10 nmol/g) compared to the control (231 ± 7 nmol/g).The length of culturing time has previously been shown toaffect the concentration of heme and porphyrins in studies ofother microorganisms [40, 41]. When culturing E. coli for84 h, the heme concentration increased to 418 ± 37 nmol/gand compared to the control cultured for 16 h. This
corresponds to an increase in the heme concentration with afactor of 1.8.
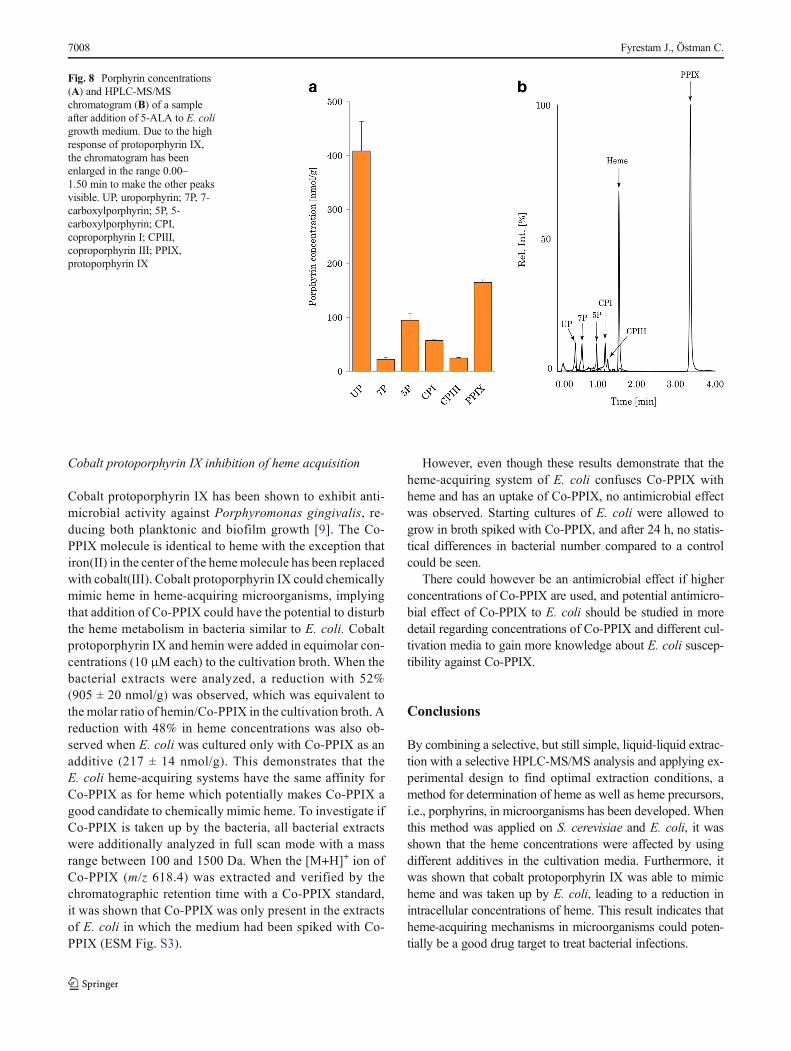
The de novo synthesis of heme is tightly regulated by anegative feedback control. High heme concentrations insidethe cell will inhibit the 5-aminolaevulinic acid synthase activitywhich is the rate-limiting step in heme biosynthesis. Addingexogenous 5-ALA to the growth medium will bypass the neg-ative feedback control, and if the bacteria have all the necessaryenzymes for heme biosynthesis, a higher concentration of hemeis expected.When E. coliwas grown in a mediumwith 5.0 mMof 5-ALA, the heme concentration was 642 ± 41 nmol/g, whichis a 53% increase compared to the 84-h control (p ≤ 0.05). Thisresults show that E. coli has the ability to synthesize heme from5-ALA, and this is further emphasized when the bacterial ex-tracts were analyzed for porphyrins. In all the other bacterialexperiments, only protoporphyrin IX and coproporphyrin couldbe detected at low concentrations. When 5-ALAwas added tothe growth medium, uroporphyrin, 7-carboxylporphyrin, 5-carboxylporphyrin, coproporphyrins I and III, as well as proto-porphyrin IX were detected in high concentrations (Fig. 8).
Hemin was added to the growth medium to investigate ifE. coli has the ability to acquire heme from its surroundings.When grown in a heme-enriched medium, the heme concen-tration in E. coli increased substantially compared to the con-trol. A 4.5-fold increase in heme concentration was observed,reaching a concentration of 1874 ± 161 nmol/g. The bacterialpellets were washed twice with NaCl solution prior the clean-up process in order to remove any heme-containing broth andthe final wash solution was analyzed for heme. No heme couldbe detected in the last washing solution. High concentrationsof heme in these samples show that E. coli has a high affinityfor exogenous heme.
Fig. 7 Heme concentrations in E. coliwith different culturing conditions
Determination of heme in microorganisms using HPLC-MS/MS and cobalt(III) protoporphyrin IX inhibition of... 7007
Cobalt protoporphyrin IX inhibition of heme acquisition
Cobalt protoporphyrin IX has been shown to exhibit anti-microbial activity against Porphyromonas gingivalis, re-ducing both planktonic and biofilm growth [9]. The Co-PPIX molecule is identical to heme with the exception thatiron(II) in the center of the hememolecule has been replacedwith cobalt(III). Cobalt protoporphyrin IX could chemicallymimic heme in heme-acquiring microorganisms, implyingthat addition of Co-PPIX could have the potential to disturbthe heme metabolism in bacteria similar to E. coli. Cobaltprotoporphyrin IX and hemin were added in equimolar con-centrations (10 μM each) to the cultivation broth. When thebacterial extracts were analyzed, a reduction with 52%(905 ± 20 nmol/g) was observed, which was equivalent tothe molar ratio of hemin/Co-PPIX in the cultivation broth. Areduction with 48% in heme concentrations was also ob-served when E. coli was cultured only with Co-PPIX as anadditive (217 ± 14 nmol/g). This demonstrates that theE. coli heme-acquiring systems have the same affinity forCo-PPIX as for heme which potentially makes Co-PPIX agood candidate to chemically mimic heme. To investigate ifCo-PPIX is taken up by the bacteria, all bacterial extractswere additionally analyzed in full scan mode with a massrange between 100 and 1500 Da. When the [M+H]+ ion ofCo-PPIX (m/z 618.4) was extracted and verified by thechromatographic retention time with a Co-PPIX standard,it was shown that Co-PPIX was only present in the extractsof E. coli in which the medium had been spiked with Co-PPIX (ESM Fig. S3).
However, even though these results demonstrate that theheme-acquiring system of E. coli confuses Co-PPIX withheme and has an uptake of Co-PPIX, no antimicrobial effectwas observed. Starting cultures of E. coli were allowed togrow in broth spiked with Co-PPIX, and after 24 h, no statis-tical differences in bacterial number compared to a controlcould be seen.
There could however be an antimicrobial effect if higherconcentrations of Co-PPIX are used, and potential antimicro-bial effect of Co-PPIX to E. coli should be studied in moredetail regarding concentrations of Co-PPIX and different cul-tivation media to gain more knowledge about E. coli suscep-tibility against Co-PPIX.
Conclusions
By combining a selective, but still simple, liquid-liquid extrac-tion with a selective HPLC-MS/MS analysis and applying ex-perimental design to find optimal extraction conditions, amethod for determination of heme as well as heme precursors,i.e., porphyrins, in microorganisms has been developed. Whenthis method was applied on S. cerevisiae and E. coli, it wasshown that the heme concentrations were affected by usingdifferent additives in the cultivation media. Furthermore, itwas shown that cobalt protoporphyrin IX was able to mimicheme and was taken up by E. coli, leading to a reduction inintracellular concentrations of heme. This result indicates thatheme-acquiring mechanisms in microorganisms could poten-tially be a good drug target to treat bacterial infections.
Fig. 8 Porphyrin concentrations(A) and HPLC-MS/MSchromatogram (B) of a sampleafter addition of 5-ALA to E. coligrowth medium. Due to the highresponse of protoporphyrin IX,the chromatogram has beenenlarged in the range 0.00–1.50 min to make the other peaksvisible. UP, uroporphyrin; 7P, 7-carboxylporphyrin; 5P, 5-carboxylporphyrin; CPI,coproporphyrin I; CPIII,coproporphyrin III; PPIX,protoporphyrin IX
7008 Fyrestam J., Östman C.

However, no antimicrobial effect of Co-PPIX onE. coli couldbe shown, but this will be a subject to further investigations.
Acknowledgments This material is based upon the work supported bythe Swedish Research Council, contract No. K2014-70X-22533-01-3.We thank Dr. Christoph Loderer, Department of Biochemistry andBiophysics at Stockholm University, for kindly providing us with E. coli.
Compliance with ethical standards
Conflict of interest The authors declare that they have no conflict ofinterest.
Open Access This article is distributed under the terms of the CreativeCommons At t r ibut ion 4 .0 In te rna t ional License (h t tp : / /creativecommons.org/licenses/by/4.0/), which permits unrestricted use,distribution, and reproduction in any medium, provided you giveappropriate credit to the original author(s) and the source, provide a linkto the Creative Commons license, and indicate if changes were made.
References
1. World Health Organization. Antimicrobial resistance: global reporton surveillance.WorldHealth Organization; 2014. Availible at: http://www.who.int/drugresistance/documents/surveillancereport/en/.Accessed 15 May 2016.
2. Skaar EP. The battle for iron between bacterial pathogens and theirvertebrate hosts. PLoS Pathog. 2010;6(8):e1000949.
3. Russo TA, McFadden CD, Carlino-MacDonald UB, Beanan JM,Olson R, Wilding GE. The siderophore receptor iron of extraintes-tinal pathogenic Escherichia coli is a potential vaccine candidate.Infect Immun. 2003;71(12):7164–9.
4. Afonina G, Leduc I, Nepluev I, Jeter C, Routh P, Almond G, et al.Immunization with the Haemophilus ducreyi hemoglobin receptorHgbA protects against infection in the swine model of chancroid.Infect Immun. 2006;74(4):2224–32.
5. Stranger-Jones YK, Bae T, Schneewind O. Vaccine assembly fromsurface proteins of Staphylococcus aureus. Proc Natl Acad Sci U SA. 2006;103(45):16942–7.
6. Alteri CJ, Hagan EC, Sivick KE, Smith SN, Mobley HL. Mucosalimmunization with iron receptor antigens protects against urinarytract infection. PLoS Pathog. 2009;5(9):e1000586.
7. Contreras H, Chim N, Credali A, Goulding CW. Heme uptake inbacterial pathogens. Curr Opin Chem Biol. 2014;19:34–41.
8. Kelson AB, Carnevali M, Truong-Le V. Gallium-based anti-infec-tives: targeting microbial iron-uptake mechanisms. Curr OpinPharmacol. 2013;13(5):707–16.
9. Olczak T, Maszczak-Seneczko D, Smalley JW, Olczak M. Gallium(III), cobalt (III) and copper (II) protoporphyrin IX exhibit antimi-crobial activity against Porphyromonas gingivalis by reducingplanktonic and biofilm growth and invasion of host epithelial cells.Arch Microbiol. 2012;194(8):719–24.
10. Cherayil BJ. The role of iron in the immune response to bacterialinfection. Immunol Res. 2011;50(1):1–9.
11. Rouault TA. Pathogenic bacteria prefer heme. Science.2004;305(5690):1577–78.
12. Anzaldi LL, Skaar EP. Overcoming the heme paradox: heme tox-icity and tolerance in bacterial pathogens. Infect Immun.2010;78(12):4977–89.
13. Weinberg ED. Iron and infection. Microbiol Rev. 1978;42(1):45–66.14. Wandersman C, Delepelaire P. Bacterial iron sources: from
siderophores to hemophores. Annu RevMicrobiol. 2004;58:611–47.
15. FathMJ, Kolter R. ABC transporters: bacterial exporters. MicrobiolRev. 1993;57(4):995–1017.
16. Braun V. Iron uptake by Escherichia coli. Front Biosci. 2003;8:s1409–21.
17. Hammer ND, Reniere ML, Cassat JE, Zhang Y, Hirsch AO, IndriatiHood M, et al. Two heme-dependent terminal oxidases powerStaphylococcus aureus organ-specific colonization of the vertebratehost. MBio. 2013;4(4). doi:https://doi.org/10.1128/mBio.00241-13.
18. McLean KJ, Munro AW. Drug targeting of heme proteins inMycobacterium tuberculosis. Drug Discov Today. 2017;22(3):566–75.
19. Wakeman CA, Stauff DL, Zhang Y, Skaar EP. Differential activa-tion of Staphylococcus aureus heme detoxification machinery byheme analogues. J Bacteriol. 2014;196(7):1335–42.
20. Espinas NA, Kobayashi K, Takahashi S, Mochizuki N, Masuda T.Evaluation of unbound free heme in plant cells by differential ace-tone extraction. Plant Cell Physiol. 2012;53(7):1344–54.
21. Lubben M, Morand K. Novel prenylated hemes as cofactors ofcytochrome oxidases. Archaea have modified hemes A and O. JBiol Chem. 1994;269(34):21473–9.
22. Gledhill M. The determination of heme b in marine phyto-andbacterioplankton. Mar Chem. 2007;103(3):393–403.
23. Stillman LC, GassmanML. Protoheme extraction from plant tissue.Anal Biochem. 1978;91(1):166–72.
24. Weinstein JD, Beale SI. Biosynthesis of protoheme and heme aprecursors solely from glutamate in the unicellular red algaCyanidium caldarium. Plant Physiol. 1984;74(1):146–51.
25. Polson C, Sarkar P, Incledon B, Raguvaran V, Grant R.Optimization of protein precipitation based upon effectiveness ofprotein removal and ionization effect in liquid chromatography–tandem mass spectrometry. J Chromatogr B. 2003;785(2):263–75.
26. Schneegurt MA, Beale SI. Biosynthesis of protoheme and heme afrom glutamate in maize. Plant Physiol. 1986;81(4):965–71.
27. Thomas J, Weinstein JD. Measurement of heme efflux and hemecontent in isolated developing chloroplasts. Plant Physiol.1990;94(3):1414–23.
28. Saleh A, Bruno O, Granelli I, Edlund P. Digestion of enolase andcarbonic anhydrase as model proteins for therapeutic proteins in bloodplasmawith immobilized thermolysin and quantification of some of thepeptides by LC/LC–MS/MS. Chromatographia. 2014;77(1–2):59–74.
29. Brown SB, ShillcockM, Jones P. Equilibrium and kinetic studies ofthe aggregation of porphyrins in aqueous solution. Biochem J.1976;153:279–85.
30. Bommer JC, Hambright P. General laboratory methods for tetrapyr-roles. In: Smith MWAG, editors. Heme, chlorophylls and bilins:methods and protocols. Totowa: Humana Press; 2002. p. 39–69.
31. Honey DJ, Gledhill M, Bibby TS, Legiret F, Pratt NJ, Hickman AE,et al. Heme b inmarine phytoplankton and particulate material fromthe North Atlantic Ocean. Mar Ecol Prog Ser. 2013;483:1–17.
32. Gledhill M. The detection of iron protoporphyrin (heme b) in phy-toplankton and marine particulate material by electrosprayionisation mass spectrometry—comparison with diode array detec-tion. Anal Chim Acta. 2014;841:33–43.
33. Gorchein A, Lord G, Lim C. Isolation and characterization of freehaem from the shell gland of quail and hen. Biomed Chromatogr.2012;26(3):355–7.
34. Wakamatsu J, Odagiri H, Nishimura T, Hattori A. Quantitative de-termination of Zn protoporphyrin IX, heme and protoporphyrin IXin Parma ham by HPLC. Meat Sci. 2009;82(1):139–42.
35. Espinas NA, Kobayashi K, Takahashi S, Mochizuki N, Masuda T.Evaluation of unbound free heme in plant cells by differential ace-tone extraction. Plant Cell Physiol. 2012 Jul;53(7):1344–54.
36. Lim C, Rideout J, Peters T. High-performance liquid chromatogra-phy of dicarboxylic porphyrins and metalloporphyrins: retentionbehaviour and biomedical applications. J Chromatogr A.1984;317:333–41.
Determination of heme in microorganisms using HPLC-MS/MS and cobalt(III) protoporphyrin IX inhibition of... 7009
37. Kwon SJ, de Boer AL, Petri R, Schmidt-Dannert C. High-levelproduction of porphyrins in metabolically engineered Escherichiacoli: systematic extension of a pathway assembled fromoverexpressed genes involved in heme biosynthesis. ApplEnviron Microbiol. 2003 Aug;69(8):4875–83.
38. Cech NB, Enke CG. Practical implications of some recent studies inelectrospray ionization fundamentals. Mass Spectrom Rev.2001;20(6):362–87.
39. Shah VP, Midha KK, Dighe S, McGilveray IJ, Skelly JP,Yacobi A, et al. Analytical methods validation: bioavailability,
bioequivalence, and pharmacokinetic studies. J Pharm Sci.1992;81(3):309–12.
40. Fyrestam J, Bjurshammar N, Paulsson E, Mansouri N, Johannsen A,Östman C. Influence of culture conditions on porphyrin productionin Aggregatibacter actinomycetemcomitans and Porphyromonasgingivalis. Photodiagn Photodyn Ther. 2017;17:115–23.
41. Kjeldstad B, JohnssonA, Sandberg S. Influence of pH on porphyrinproduction in Propionibacterium acnes. Arch Dermatol Res.1984;276(6):396–400.
7010 Fyrestam J., Östman C.