determination of effective porosity of mudrocks-a feasibility study
TRANSCRIPT
ORNUGWPO-019
Determination of Effective Porosity of Mudrocks-A Feasibility Study
Joachim Dorsch

.
I 1 This report has been reproduced directly from the best available copy.
Available to DOE and DOE contractors from the Office of Scientific and Techni- cal Information, P.O. Box 62, Oak Ridge, TN 37831; prices available from (615) 576-8401, FTS 626-8401.
Available to the public from the National Technical Information Service. U.S. Department of Commerce. 5285 Port Royal Rd.. Springfield. VA 22161.
This report was prepared as an account of work sponsored by an agency of the United States Government. Neither the United States Government nor any agency thereof, nor any of their employees, makes any warranty, express or implied. or assumes any legal liability or responsibility for the accuracy, corn pleteness, or usefulness of any information, apparatus, product, or process dis- closed, or represents that its use would not infringe privately owned rlghts. Reference herein to any specific commercial product, process, or BBTYICB by trade name, trademark. manufacturer, or otherwise, does not necessarily m a t i - tute or imply its endorsement, recommendation, or favoring by the United States Government or any agency thereof. The views and opinions of authors expressed herein do not necessarily state or reflect those of the United States Government or any agency thereof.
ORNL/G WPO-019
Determination of Effective Porosity of Mudrocks - A Feasibility Study
Joachim Dorsch
Environmental Sciences Division, Oak Ridge National Laboratory, Oak Ridge, TN 37831-6352
Date Issued-November, 1995
Prepared by the Environmental Sciences Division Oak Ridge National Laboratory
Prepared for Groundwater Program Office
under budget and reporting code EU 2010301 OAK RIDGE NATIONAL LABORATORY
Oak Ridge, Tennessee 37831-6285
LOCKHEED MARTIN ENERGY RESEARCH, COW. for the
US DEPARTMENT OF ENERGY under contract DE-AC05-960R22464
m=@bY

4

Page
Figures .... ....................................................................................... .. ........ .... . . ... .. .... ..1v
Tables .. ........................... * .................................. * ..................................................... v
Acknowledgments .......................................................................................................... v
.. Executive Summary ........ ..... ... . .. .. ... .. .. .. .. .. ... .. .. . . .. ... .. .. .. ..... .. .. .. . . ... .. .... .. ..... .. . . .. .. ..... .. .. .... vi1
Introduction ..................................................................................................................... 1 Purpose ......................................................................................................... 1
Porosity ......................................................................................................... 2 Classification of Fine-grained Clastic Sedimentary Rocks
A Framework for Mudrock Porosity at the ORR
..... .. . .. .. .. .. ..... .. ... .. .. . . .2
............................................. 4
Techniques for Measurement of Porosity .............................................. ...................... 12 Optical Methods ............................................................................................ 12
methodology . .. .. .. .. . . .. .. . . . . . .. .. . . . . .. . . . . . .. .. .. . . . . . . . .. .. . . .. .. . . . . . . . . . .. . . . . . . . . . .. . . . . . . .. . . .12 possible problems and sources of error . .. .. . . . .. . . . . . .. . . .. . . . . . .. . .. .. . . . .. .. . . .12 cost ....................................................................................................... 12 evaluation: accuracy and significance of porosity values
principle ........................................................................................... 12
and of optical observations ....................................................... 13
Immersion-Saturation Method ................................................................... 15 principle ........................................................................................... 15 methodology . .. ... . . . .. .. . . , .. . . . . . . .. . . . . . .. -. . . .. .. . . . . . . . . . .. .. . . .. . . . . . . . . . .. .. . . . .. . . . . . . . . . . .. . . .15 possible problems and sources of error . ......................, ................... 16 cost ....... ...... .. .. . ...... .. .... .. ..... .. .. .. .. .. ..... . ....... .... .. ..... .... .. . . ..... ...... .. .... .... . .. 17 evaluation: accuracy and significance of porosity values ............... .. . .17
Radial Diffusion-Cell Method ................................................................... 19 principle ................................................................................ 19 methodology . .... .. .. . . . . .. . . . , . .. . . . . .. .. . .. .. . . . . . . .. . . . . . .. . . .. .. . . . .. . . . . .. .. .. . . . .. .. . . . . .. . . . . . .. 19 possible problems and sources of error ........................................... 21
.. 11

cost ....................................................................................................... 22 ................... 22 evaluation: accuracy and significance of porosity values
Mercury Porosimetry ........................................................................................... 23 prinaple ........................................................................................... 23 methodology ........................................................................................... 23 possible problems and sources of error ........................................... 29 cost ....................................................................................................... 30 evaluation: accuracy and sigruficance of porosity values ................... 30
Helium Porosimetry ........................................................................................... 32 principle ........................................................................................... 32 methodology ........................................................................................... 32
....................................................... 33 possible problems and sources of error ........................................... 35 cost ....................................................................................................... 36 evaluation: accuracy and significance of porosity values ................... 36
CORAL - experimental set up
Recommendations ....................................................................................................... 37
References ................................................................................................................... 39
Appendix I More detailed Outline of Analytical Procedures ............................... 43 Immersion-Saturation Method ................................................................... 44 Helium Porosimetry ........................................................................................... 47 Mercury Porosimetry ........................................................................................... 48 Dryxng Method ........................................................................................... 50
Appendix II: Addresses of Laboratories and Service Companies ............................... 53
7
Appendix III: Notations and Formulas ................................................................... 54
, .. ... 111

Page
1
2
3
4
5
6
7
8
9
Stratigraphic sections for the Kingston thrust sheet and the Copper Creek and Whiteoak Mountain thrust sheets on the ORR. .................... 5
Relationship between water content/porosity of freshly deposited sediment in different sedimentary environments to grain size. ........................................................................................................ 7
Porosity of mud and mudrock in relation to burial depth. ............................... .8
Pore-size distribution for mudrock samples from different depths in the Beaufort-Mackenzie basin. ....................................................... .9
Decrease of effective porosity $e and of mean pore size dhg with depth in mudrock samples from the Beaufort-Mackenzie basin. ....... 10
Porosity profile adjacent to a natural fracture surface in granite. ................... 11 Typical diffusion cell used for the effective porosity measurement with the radial diffusion-cell method. ....................................................... 19
Capillary-pressure curves, plotting the measured injection pressure and/or the calculated pore-throat diameter versus the amount/volume of intruded mercury. ...................................................... .24
Illustration of the importance of pore throats for controlling access to pores. ......................................................................................... ..25
10 Unimodal distribution of nanopores (0.3-60 nm) characteristic of tight mudrocks. ................................................................... 28
11 Sketch of the analytical set up at CORAL used for the determination of effective porosity at the Institute of Gas Technology at Chicago. ............................................................................... 34
12 Example of sample retrieval for different kinds of petrophysical measurements. .................................................................. .43
13 Plotting of degree of saturation (Sr) versus time (t). .............................. .46
i v

Tables
Table Page
1 Classification of mudrocks ................................................... .. ........................... 3
WcnowledPmentS
I would like to extent my thanks to the numerous individuals from petroleum and service companies, research laboratories, and academia, who freely answered questions concerning petrophysics over the phone or through e-mail and regular mail. Special thanks must be extended to Dr. T. J. Katsube at the Geological Survey of Canada for his advise. RaNaye 8. Dreier, William E. Sanford, and Brandon E. Dugan are thanked for critically reading an earlier draft of this report resulting in significant improvements. The support from the Y-12 HSE&A-Division, administered through W. Kevin Jago, and from the X-10 Environmental Restoration Groundwater OU, administered through Richard H. Ketelle, is most gratefully acknowledged.
V

v i

Matrix diffusion is believed to be an important transport process within the double-porosity (primary sedimentary porosity and secondary fracture porosity) mudrock-dominated stratigraphic units on the Oak Ridge Reservation (OM). Effective porosity is identified as an important parameter for evaluating and modeling matrix diffusion as a transport process.
This report identifies, summarizes and evaluates several petrophysical techniques, which can be used to determine the effective porosity of mudrock. Most of the techniques found their original application in the petroleum industry for the evaluation of reservoir rocks.
Petrophysical techniques which are identified as useful in generating quantitative data on effective porosity of mudrock encompass: the water-immersion method, helium porosimetry, mercury porosimetry, and the radial diffusion-cell method. The water- immersion method, and helium and mercury porosimetry are well established techniques. They determine the effective porosity over a sample size of commonly less than ca. 6 an3 (ca. 15 grams). The radial diffusion-cell method, on the other hand, is a recent technique, which is not yet tested on lithified mudrock. It also provides effective porosity data integrated over a much larger volume.
specialized laboratories. The water-immersion and the radial diffusion-cell method can readily be set up at the Environmental Sciences Division (ESD) at the Oak Ridge National Laboratory (ORIW. These methods are also much less expensive than helium and mercury porosimetry, in part because the necessary equipment is already available at ESD.
Helium and mercury porosimetry are very sophisticated techniques that require
Effective porosity values derived from the water-immersion method, helium porosimetry and mercury porosimetry are generally judged to be reliable. Mercury porosimetry will provide the added advantage of providing quantitative data on the porethroat sizes of the analyzed mudrock. The physical constraints imposed by the pore throats as the narrowest pathways within the interconnected pore system can impact diffusion rate. Furthermore, the size of the pore throats might cause exclusion of certain contaminant species from invading the matrix-pore space.
vii

viii
1
oductrpn
Purpose
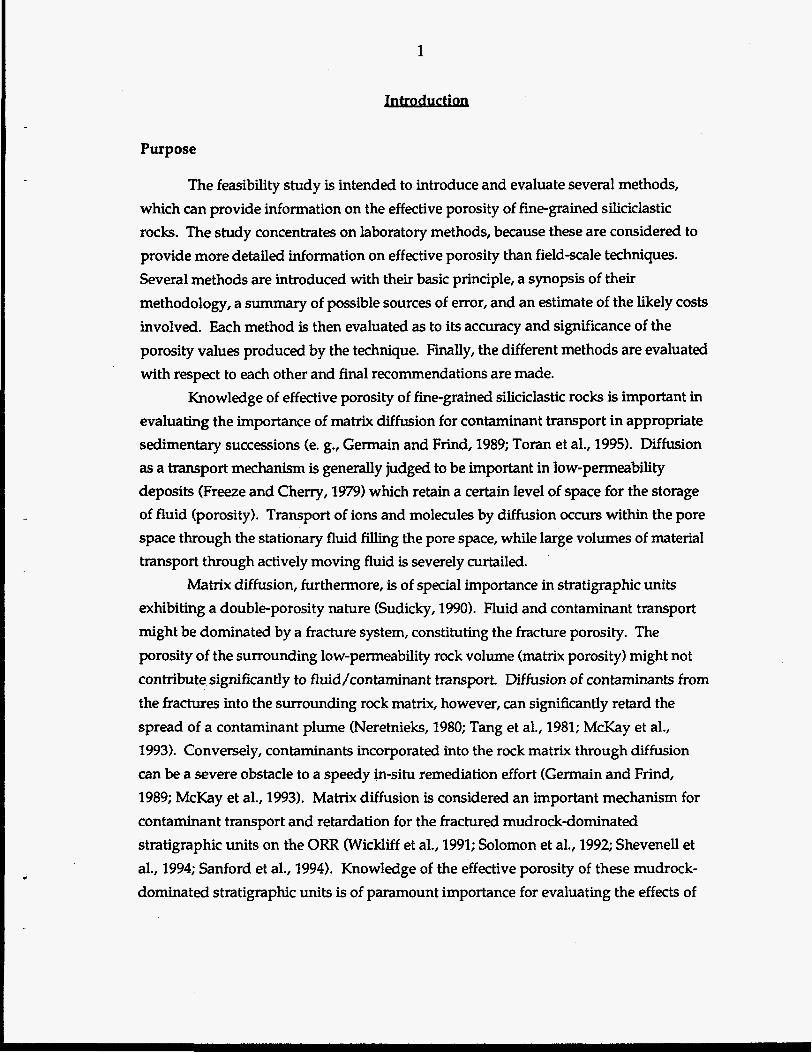
The feasibility study is intended to introduce and evaluate several methods, which can provide information on the effective porosity of fine-grained siliciclastic rocks. The study concentrates on laboratory methods, because these are considered to provide more detailed information on effective porosity than fieldscale techniques. Several methods are introduced with their basic principle, a synopsis of their methodology, a summary of possible sources of error, and an estimate of the likely costs involved. Each method is then evaluated as to its accuracy and significance of the porosity values produced by the technique. Finally, the different methods are evaluated with respect to each other and final recommendations are made.
Knowledge of effective porosity of fine-grained siliciclastic rocks is important in evaluating the importance of matrix diffusion for contaminant transport in appropriate sedimentary successions (e. g., Germain and Frind, 1989; Toran et al., 1995). Diffusion as a transport mechanism is generally judged to be important in low-permeability deposits (Freeze and Cherry, 1979) which retain a certain level of space for the storage of fluid (porosity). Transport of ions and molecules by diffusion occurs within the pore space through the stationary fluid filling the pore space, while large volumes of material transport through actively moving fluid is severely curtailed.
exhibiting a double-porosity nature (Sudicky, 1990). Fluid and contaminant transport might be dominated by a fracture system, constituting the fracture porosity. The porosity of the surrounding low-permeability rock volume (matrix porosity) might not contribute significantly to fluid/contaminant transport. Diffusion of contaminants from the fractures into the surrounding rock matrix, however, can significantly retard the spread of a contaminant plume (Neretnieks, 1980; Tang et al., 1981; McKay et al., 1993). Conversely, contaminants incorporated into the rock matrix through diffusion can be a severe obstacle to a speedy in-situ remediation effort (Gemain and Frind, 1989; McKay et al., 1993). Matrix diffusion is considered an important mechanism for contaminant transport and retardation for the fractured mudrockdominated stratigraphic units on the ORR (Wickliff et al., 1991; Solomon et al., 1992; Shevenell et al., 1994; Sanford et al., 1994). Knowledge of the effective porosity of these mudrock- dominated stratigraphic units is of paramount importance for evaluating the effects of
Matrix diffusion, furthermore, is of special importance in stratigraphic units

2
matrix diffusion, and for the prediction of contaminant behavior and the design of remediation measures (Toran et al., 1995).
Classification of Fine-Grained Clastic Sedimentary Rocks
Much confusion exists concerning the classification of fine-grained clastic sedimentary rocks. The classification scheme adopted for this report (tab. 1) is derived from Blatt et al. (1980). According to these authors, mudrock should be used as a general term for fine-grained clastic sedimentary rocks composed of silt, clay, or a mixture thereof, possessing fissility or not (Blatt et al., 1980). Shale, according to this scheme, is a suffix restricted to those fine-grained clastic sedimentary rocks exhibiting fissility (tab. 1).
Porosity
The total volume of a rock sample (Vb) is the sum of the volume of its solid material (grains: Vg) and the volume of its pore or void space Wp) (v. Engelhardt, 1960). Porosity of a rock commonly is defined as the percentage of rock volume consisting of voids UY pores. Porosity as a basic physical property of a rock, therefore, constitutes a measure of volume of pore space which is potentially available for the storage and/or passage of a fluid. Two types of porosity can be distinguished:
1) total porosiiy +
2) effecfive porosity @E
I$= = total porosity I$, = effective porosity V = volume of pore space VP V - volume of the sdid sample material: volume of pins.
= volume of interconnected pore space P!'" b - bulk sample volume
g- . Porosity, as the ratio of volume of pore/void space to total volume of the rock
sample, is commonly expressed as a fraction or, when multiplied by 100, as a

3
4
percentage. Total porosity refers specifically to the cumulative void space of a rock sample, whereas effective porosity refers only to the interconnected void space. Effective porosity is the type of porosity believed to be important for diffusive processes in the low-permeability sedimentary rocks at the ORR, because the interconnected water-filled pore space can be used by diffusion for efficient material transport.
Another measure of pore space in a rock is void ratio e
e = Vp [or Vpinterll Vg
e = void ratio.
Porosity and void ratio are related through (v. Engelhardt, 1960):
@T [or @El = e l (1 + e) e = @T [or @El l ( 1 - @T [or
or
e = void ratio t$= = total porosity.
A Framework for Mudrock Porosity at the ORR
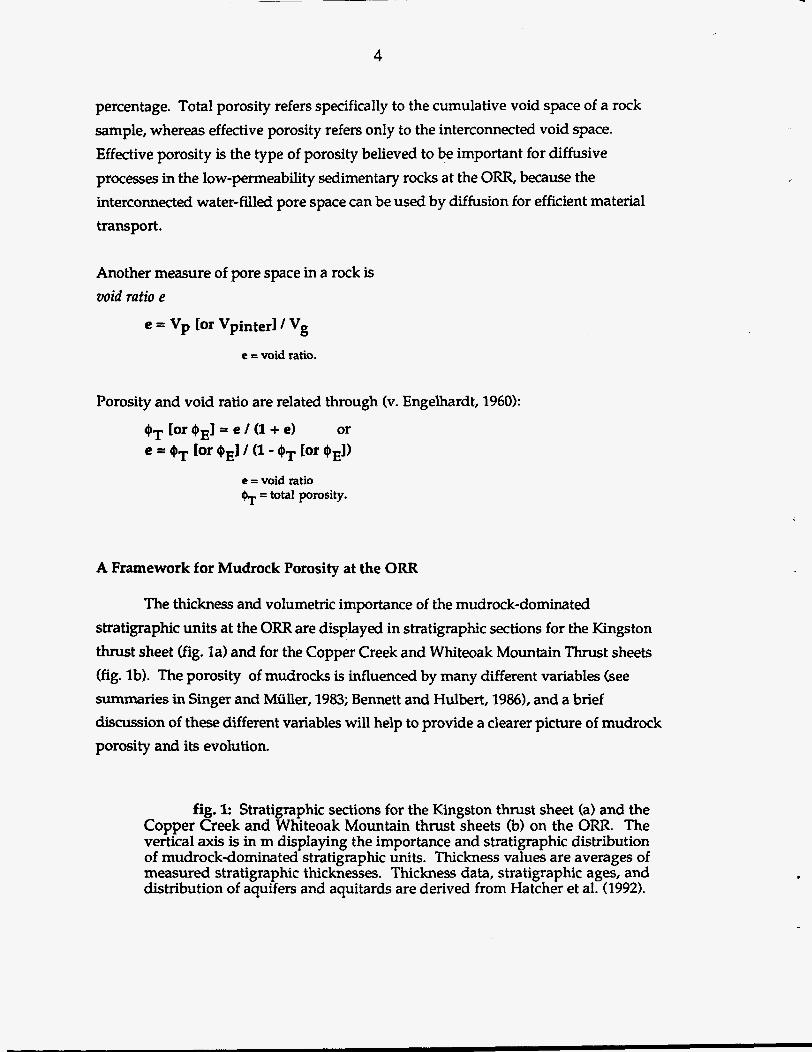
The thickness and volumetric importance of the mudrock-dominated stratigraphic units at the ORR are displayed in stratigraphic sections for the Kingston thrust sheet (fig. la) and for the Copper Creek and Whiteoak Mountain Thrust sheets (fig. lb). The porosity of mudrocks is influenced by many different variables (see summaries in Singer and Muller, 1983; Bennett and Hulbert, 19861, and a brief discussion of these different variables will help to provide a clearer picture of mudrock porosity and its evolution.
fig. 1: Stratigraphic sections for the Kingston thrust sheet (a) and the Copper Creek and Whiteoak Mountain thrust sheets (b) on the ORR. The vertical axis is in m displaying the importance and stratigraphic distribution of mudrock-dominated stratigraphic units. Thickness values are averages of measured stratigraphic thicknesses. Thickness data, stratigraphic ages, and distribution of aquifers and aquitards are derived from Hatcher et al. (1992).
.

5
Ft. Payne F a Chattanooga Sh
Rtxkwood Fm.
Sequatchie Fm. ReedsviUe Sh.
Nashville Gp.
Stones River Gp.
Knox Gp.
Maynardvilleh.
Nolichucky Sh
Maryvilleh. R ersvillesh. R3edge Ls. Pumpkin VaUey Sh.
Rome Fm.
hydrogeologlc units
aqui fd
mn+mudrockdomlnated mudddominated
Moccasin Fm.
Witten Fm. Bowen Fm. Benbolt 6 Wardell Fm.
Rockdell Fm. Fleanor Sh.
m
b)
Blackford Fm. h Eidson Mb.
Knox Gp.
Maynardville Ls.
Nolichucky 5h.
Maryville Ls. Rogemdle Sh. Rutledge Ls. Pumplun Valley Sh.
Rome Fm.
m
a) t

6
Upon deposition, mud possesses a high initial porosity as great as 90% (e. g., Singer and Miiller, 1983). Initial porosity is strongly influenced by the amount of clay- size material within the mud (the higher the clay content the higher is the initial porosity; fig. 2), the clay-mineral composition (different specific surface areas for different clay minerals), and especially by the original depositional fabric. The original depositional fabric, in turn, is strongly influenced by the ambient environmental conditions (salinity, water turbulence, biogenic activity, particle concentration and size) at the time of sedimentation.
The initial porosity is altered soon after sedimentation, for example through biogenic activity, seismicity, or water movement (turbulence, currents, wave loading). The most important reduction of initial porosity in mud/mudrocks, however, occurs through compaction (figs. 3,4,5), which changes the depositional fabric by mechanical rearrangement of clay particles (e. g., Bennett and Hulbert, 1986). Precipitation and/or dissolution of cements within the existing fabric is commonly spotty in mudrocks and usually occurs at a later burial stage (note, however, 'early' calcite concretions) (Bennett and Hulbert, 1986). The occurrence of late-stage cements can add significantly to the reduction of (effective) porosity of mudrocks (Katsube et al., 1992a).
'Shales' (mudrocks in our terminology) possess an unimodal pore-size distribution (Katsube, 1992; Katsube and Best, 1992; Katsube and Issler, 19931, with the mean pore size decreasing with burial depth due to compaction (Katsube and Williamson, 1994; Katsube and Issler, in preparation; figs. 4,5). The rate of this decrease in mean pore size is variable from basin to basin. The rate is reduced, for example, in basins of rapid subsidence (Katsube and Issler, in preparation; Katsube and Williamson, 1994). The pore space is considered to be interconnected and isolated pores are probably rare in mudrocks (Katsube et al., 1991).
Katsube and Williamson, 1994) report some interesting observations obtained from tight 'shales' from a burial depth of 4400-5600 m. They report that nanopores (13.0 - 14 nm in width) constitute the main interconnected pore space in these tight shales (they consider nanopores as the pore throats). The nanopores/pores are characterized by a unimodal size distribution of 0.3 - 60 nm, with mean pore sizes/modes of 2.7 - 11.5 nm. These are some of the smallest pore sizes known from any rocks (Katsube et al., 1991). Pores larger than 25 nm exist in these tight mudrocks, but are rare and/or isolated (Katsube et al., 1992a; Katsube and Williamson, 1994). Katsube (1992) and Katsube et al. (1992a), furthermore, showed that 83% f 4% of the effective porosity of these tight 'shales' is contributed by nanopores.
Katsube and co-workers (Katsube, 1992; Katsube et al., l990,1991,1992a, b;

7
P
0 0 0 In
calculated porosity (%) 0 0 0 8 , o d
8
0
1.5
n
E
5 s 3.0 P Q, 'c)
4.5
6.0 0 20 40 60
porosity (%)
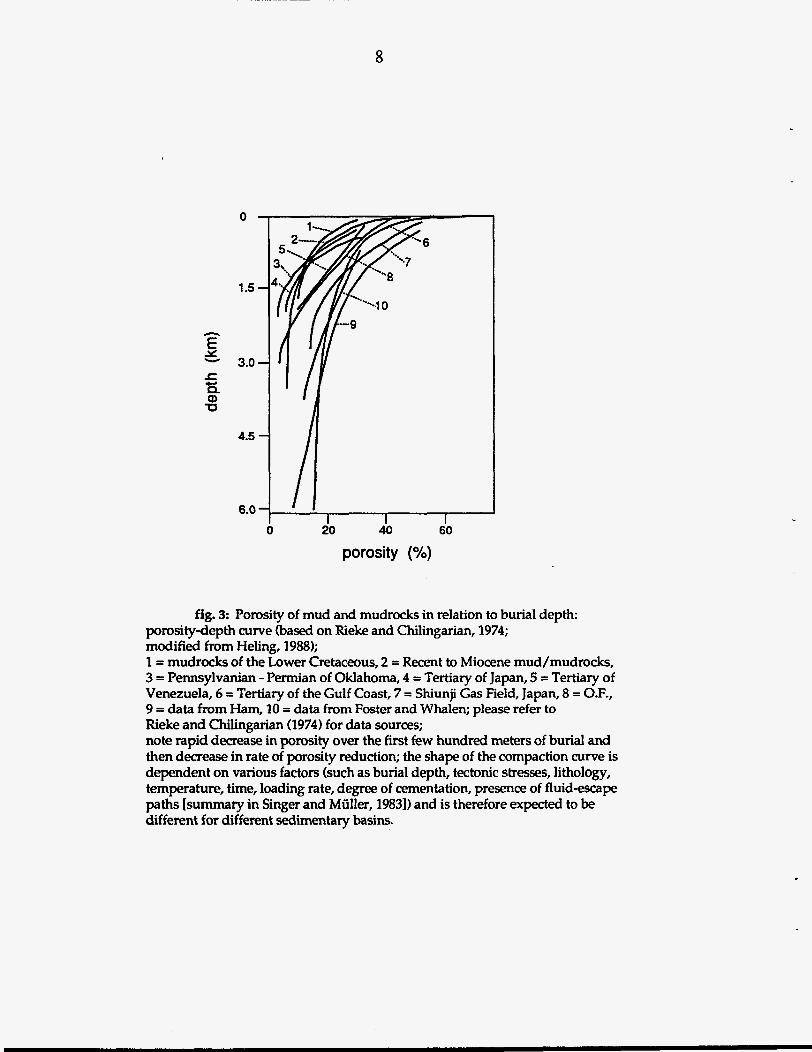
fig. 3: Porosity of mud and mudrocks in relation to burial depth: porositydepth curve (based on Rieke and Chilingarian, 1974; modified from Heling, 1988); 1 = mudrocks of the Lower Cretaceous, 2 = Recent to Miocene mud/mudrocks, 3 = Pennsylvanian - Permian of Oklahoma, 4 = Tertiary of Japan, 5 = Tertiary of Venezuela, 6 = Tertiary of the Gulf Coast, 7 = Shiunji Gas Field, Japan, 8 = O.F., 9 = data from Ham, 10 = data from Foster and Whalen; please refer to Rieke and Chilingarian (1974) for data sources; note rapid decrease in porosity over the first few hundred meters of burial and then decrease in rate of porosity reduction; the shape of the compaction curve is dependent on various factors (such as burial depth, tectonic stresses, lithology, temperature, time, loading rate, degree of cementation, presence of fluid-escape paths [summary in Singer and Muller, 19831) and is therefore expected to be different for different sedimentary basins.

9
0.001 0.01 0.1 1 10 poresire range @m)
fig. 4 Pore-size distribution for mudrock samples from different depths in the Beaufort-Mackenzie basin (normally compacted zones); pore sizes (in p) were obtained by mercury porosimetry; note: unimodal pore-size distribution, decrease in porosity with burial depth, narrowing of pore-size range with burial depth, and decrease in pore-size median with burial depth (from Katsube and Williamson, 1994).

10
o = porosity @e (%)
0
1
E *
3
4
0 10 2 0 3 0 4 0 5 0 8 0
I O 1 7 I 1 i . 2593 m
c p. 0 4
3116m L 0.001 0.01 0.1 1 10
dhg (m) 0 50 100 150
x = mean pore size d b (nm)
g fig. 5 Decrease of effective porosity Qe and of mean pore size dh with depth in mudrock samples from the Beaufort-Mackenzie basin; histograms display pore sizes and (unimodal) pore-size distribution for depths of 0.999,2.593, and 3.116 km, and the change in pore-size distribution with depth (based on Katsube and Best, 1992; from Katsube and Williamson, 1994).

1 1
8.0
7.0
n
8 6.0 Et
2? ‘iij 5.0 E 8
X v
4.0
3.0
An interesting observation is reported by Melnyk and Skeet (1986). They showed an increase in effective porosity through an alteration zone along a traverse from parent rock to a natural fracture, but also a slight decrease in effective porosity immediately at the fracture when compared to the alteration zone (fig. 6) . Although these measurements were undertaken on a granite sample, it is interesting to investigate whether a similar phenomenon can also be observed in mudrocks when moving closer to a fracture. Especially important is the interface between fracture and rock body where the available entry/open porosity provides access for contaminants (by diffusion) into the rock matrix. A decrease in effective porosity at the fracture surface in a mudrock seems highly probable, given that a fracture can serve as a flow conduit with the possibility of precipitation and introduction of mineral cement (calcite, quartz, etc.) into the pore space of the adjacent rock body. Effective porosity of mudrocks might be significantly different (reduced by cementation directly at the fracture surface, increased by weathering at a distance from the fracture surface) in the vicinity of a fracture when compared with the surrounding rock body.
O m ) replicate samples - 0 m o 0
m
.
.
0 - P .
I
O m 0
Q m m 0 0 . 0
U
Distance from Fracture Surface [mml
fig. 6 Porosity profile adjacent to a natural fracture surface in granite (modified from Melnyk and Skeet, 1986).

1 2
ues for Measurement of Po-
Optical Methods
principle Porosity is determined based on optical investigation of thin sections.
methodolom Several closely similar methodologies are available, but basically the
determination of porosity with optical methods roots in the classic petrographic technique of point counting. Variations in the basic methodology are provided by the difference in thin sections used and their optical investigation. There are: a) standard thin sections and the standard polarizing microscope, b) polished thin sections and the scanning electron microscope (SEMI, and c) polished thin sections and the transmission electron microscope (TEM). The SEM can also be applied to freshly broken mudrocks (investigating the face broken perpendicular to bedding). The investigation and point counting can be simplified and enhanced by various image-enhancing techniques.
possible Droblems and sources of error # subjectivity of the investigator; # thin section preparation: preparation of thin sections from finegrained sedimentary
rocks is not as straightforward as from other sedimentary rocks; plucking of small, rigid grains during sample preparation can artificially induce additional porosity, and thereby can provide a major source of erroneous porosity values;
porosity, because also isolated pores are counted;
sedimentary rocks?
/
# measurement of 'total optical porosity' (TOP); TOP does not conform to effective
# to what degree is it possible to accurately define and image pores in fine-grained
- cost The most significant costs are generated through the preparation of thin sections.
Mudrocks are very tricky to prepare for optical analysis and expert preparation- technique is required. This is especially true for polished thin sections for SEM and TEM analysis. Petrographic analysis can be camed out at ORNL. A standard petrographic microscope coupled with a point counter is readily available, but access to SEM and TEM and expert help has to be secured separately at ORNL (and Y-12). Use of image-

1 3
enhancing techniques wilI make additional money necessary. Money will be used to purchase the necessary commercial software (including training) and computer, should suitable hardware not be available at ORNL.
evaluation: accuracv and significance of uorosihr values and of optical observations The major problem with optical techniques is, of course, that they are measuring
total optical porosity (TOP). TOP is different from effective porosity, and should yield porosity values larger than effective porosity values. This can be explained by the fact that optical techniques also image and tabulate isolated or pocket pores (either completely isolated within the rock matrix or isolated from the rest of the pore space through diagenetic plugging of the pore connections). These pores are by nature not linked to the interconnected pore space and, therefore, are not part of the interconnected effective porosity. The less isolated pore space exists within any given mudrock the closer the values of TOP and (true) effective porosity should be.
space in mudrocks does not contain much isolated pore space. This claim, however, awaits verification by further study (Katsube and Williamson, 1994).
characterization of mudrock-dominated stratigraphic units. The techniques provide an important source of information on the diagenetic history of the rocks, detail on the amount and type of coarser grained material, on grain-size sorting, pore structure and pore distribution. The type, occurrence, spatial and temporal distribution of diagenetic phases are important aspects of the petrophysical character of the deposits. Optical techniques also can serve to visualize pores in two dimensions and might help to identify the occurrence of isolated pores, pore occlusion, and of pocket or blind pores. Apart from detailing the characteristics of 'primary' (sedimentary) pores, also the contribution of 'secondary' pores (e. g., microcracks/microfractures) to matrix porosity might be addressed. All of these aspects of direct observation help in the interpretation of results obtained from laboratory-based petrophysical techniques (see below). They can, furthermore, serve as important pieces of evidence for petrophysical predictions for rocks in areas not yet characterized sedimentologically.
A study by Davies et al. (1991) displays the data which can be obtained through optical methods. It includes information on detrital and diagenetic phases, mudrock microfabrics, total (optical) porosity, extent of diagenetic modifications (e. g., cementation, dissolution, recrystallization), particle size and sorting, and pore structure (e. g., size, shape, internal surface characteristics). Davies et al. (1991) also point out
It is important to note the claim of Katsube et al. (19911, however, that the pore
Optical techniques, nevertheless, serve as an important tool for the overall

1 4
the discrepancy between porosity values obtained through optical and petrophysical techniques. This discrepancy might be either related to a faulty petrophysical method or to the optical porosity incorporating a large amount of pores not part of the interconnected pore network. Either explanation emphasizes the need to carefully evaluate measurement techniques and data output.

1 5
Immersion-Saturation Method
Much basic work to improve and standardize this technique was carried out recently. The technique was and is heavily used by researchers of the Geological Survey of Canada (GSC) in order to obtain porosity data for mudrocks. The methodology employed by researchers from the GSC roots in the claim that complete re-saturation of mudrocks with liquid can be accomplished. This results in obtaining meaningful and accurate values of mudrock porosity, which compare favorably with porosity values obtained by other techniques. The principal references for the immersion-saturation method following the GSC can be found in the publications of Katsube and his various co-workers. The immersion-saturation method was employed earlier, albeit with a different procedural protocol, by Goldstrand et al. (in review) on carbonate rocks from part of the Knox aquifer at the ORR.
principle
difference in sample weight between the fully saturated state and the dry state of the sample.
The basic tenet of the immersion-saturation method is the determination of the
methodology The immersion-saturation method is a simple technique of determining porosity.
The porosity type measured is (most likely) effective porosity. Re-saturation of the sample with a liquid (deionized water) is believed to penetrate all of the interconnected pore space (Katsube et al., 1992b; Katsube, 1992; Katsube, pers. comm.).
Effective porosity can be calculated by:
ki = effective porosity (determined with the Immers. Sat. Method) 3, = bulk density of the rock sample Ww = sample weight wet wd = sample weight dry a, = bulk density of the pore water.
The density of a rock sample can be obtained using the following equation:
v b = bulk volume of sample

1 6
(this can easily be determined b caliper on a regularly shaped sample
formula to obtain v b of an irregular shaped sample [same core, etc.]). [e.&,. cylinder]; a, obtained in t K, 's way can be used/inserted in above
Effective porosity can also be calculated from:
V - pore Volume of sample: = Ww - Wd) I a, v b =bulk volume of sample.
a, = bulk density of water P-
The following analytical procedural steps for the immersion-saturation method are taken from Katsube and Scromeda (1991) and Katsube et al. (1992b). For a more detailed outline of the procedural steps see the appendix. Optimum conditions (e. g., drying temperatures, timing; see appendix) were detected by conducting the different parts of the analytical procedure in discrete increments, with sample weighing after each increment.
1) mcuum drying: drying and degassing sample under vacuum at room temperature 2) vacuum saturation: saturation of the sample: water is added to the vacuum chamber;
the sample is left immersed under atmospheric pressure until weighing (W, 1; 3) oven drying: drying of sample (heating at 105% to 116% ) before weighing (Wd);
possible uroblems and sources of error # re-saturation: is water really penetrating all of the available interconnected pore
## if not, what is the lower limit of pore-throat sizes accessed by re-immersion? are space?
pores sheltered from immersion (and hence not imaged), because of small entry-pore throats?
# mudrock samples have to be indurated enough, so that they do not disintegrate when
# immersion liquid used: possible swelling of clay minerals with deionized water; is a
immersed in water;
brine better? does this (besides less/no clay-mineral swelling) also help prevent sample disintegration?
# sample shape: the sample shape should conform to a simple geometry, such as a cylinder, for an easy and accurate determination of the dimensions and shape of the sample with a caliper; results of the measurements will form the basis for an accurate determination of the bulk sample volume;

1 7
## drying technique: optimum conditions have to be determined; # optimum conditions for each procedural step have to be determined; they might be
# surface drying of sample following saturation: is all surface wetness removed, is no different for different basinal mudrocks, formations, etc.;
pore water removed, is no surface water added?
- cost The immersion-saturation method is by far the least expensive measuring
technique covered in this report. The porosity measurements can be carried out at ORNL, as soon as a laboratory is set up and equipped. Equipment has to be purchased and includes as major items: a balance, a vacuum chamber with vacuum pump, and a laboratory oven. Most of it, however, is already available, because earlier porosity studies on carbonates (Goldstrand et al., in review) used a similar procedure. The experiments and measurements need a careful experimenter, but this can be handled with a minimal amount of training. After the experimental set up and procedural steps are established the laboratory should provide a speedy supply of effective porosity data.
evaluation: accuracv and simificance of Dorositv values The accuracy of the effective porosity values obtained with the immersion-
saturation method depends on a) the complete saturation of the sample, and b) the exact determination of the wet (saturated) and dry (oven-dried) sample weight (Melnyk and Skeet, 1986).
The use of a humidity-controlled oven might not be as crucial for the immersion- saturation method than it might be for other methods. Both helium and mercury porosimetry employ drying before pore space is invaded and characterized. Faulty oven-drying can destroy/create porosity and therefore could introduce a significant error to the measurements. The question of what ‘types of waters’ (pore water, adsorbed water, structural water; see section on drying methods in Appendix I) should be characterized, however, sti l l has to be determined, and the drying technique has to be selected thereafter.
Based on cross examinations on different and same samples using repeated measurements, different measurement methods on same and similar samples, and same measurement methods with altered procedural steps (temperature, duration, etc.), Katsube et al. (1992b) concluded that results can be interpreted “to generally show relatively good consistency between porosities obtained by diferent methods, diferent procedures

1 8
and different laboratories, except when damage is considered to have occurred as a result of repeated measurements” (p. 119). These findings support the contention that the immersion-saturation method provides (reasonably) accurate and reproducible results of effective porosity of mudrocks.
Effective porosity values obtained with the immersion-saturation method characterize the porosity over the extent of the sample. This should always be kept in mind. Other potential samples close by (from the same core) can yield deviating values for effective porosity, even if this core appears perfectly homogeneous. The values obtained generdy will provide a good estimate of the effective porosity for a larger volume of rock (the size of the volume characterized in this way depends on the homogeneity of the chosen volume). Extrapolation of the exucf effective porosity values obtained from a small sample volume to a larger rock volume (of variable chosen size), however, should always be treated with caution. This note of caution applies equally to other ‘spot sample’ methods (i. e., mercury porosimetry, helium porosimetry).
Penetration of water into pores and evacuation of water out of pores is important for the immersion-saturation method. Katsube (1992) reports the results of experiments and claims that water can invade pores smaller than 3 nm. A good correlation with effective porosity values obtained through other methods is interpreted to indicate that water both penetrates and can be evacuated from all nanopores (Katsube, 1992; Katsube et al., 1992b).

1 9
Radial Diffusion-Cell Method
principle
cylindrical reservoir into the surrounding body of rock of finite dimensions. The method is based on the radial diffusion of a dissolved tracer in water from a
methodoloev A cylindrical sample core of known dimensions is set up with an internal (axial)
reservoir of known dimensions (fig. 7). A tracer of known concentration/quantity is injected into the axial reservoir. The original (pre-injection) concentration of this tracer in the sample core is known, and the change in concentration within the reservoir is monitored. Solute migration within the sealed cylindrical core sample is possible only by matrix (molecular) diffusion.
fig. 7: Typical diffusion cell used for the effective porosity measurement with the radial diffusion-cell method; L = length of the full core section used (typically 70 cm), rL = full core radius, rR = radius of the central reservoir
(from Novakowski and van der Kamp, unpubl. manuscript).

2 0
The effective porosity can be detennined with the radial diffusioncell method in different ways:
1 :directly (Novakowski and van der Kamp, unpubl. manuscript)
VM = volume of water present in the core sample VR = volume of the reservoir CDR(-) = dimensionless residence concentration at equilibrium: CRKO
(CR = reservoir concentration; CO = initial reservoir concentration),
$Ew = (effective) porosity determined with the Radial Diffusion Method L = len h of core sample rL = ragus of core sample rR = radius of reservoir VM = (s. above) value calculated with formula above;
2) with use of the semi-quantitative model (Novakowski and van der Kamp, unpubl. manuscript:
will be calculated from SI)
Bx = dimensionless mixing coefficient of the reservoir. VR I (R e 'yR rR) VR = volume of reservoir yR = cross sectional area through which diffusion occurs
rR = radius of reservoir R = retardation factor
[porosity surface area of reservoir]
rDL = dimensionless radius of the core sample: rL / rR CDR(..) = dimensionless residence concentration at equilibrium;
3) through effective pore volume with initial solute concentration known (van der Kamp et al., unpubl. manuscript)
Vpe = effective pore volume: VPe = M, I - C;, qo = initial pore water concentration of constituent (tracer) x M, = total mass of constituent (tracer) x added to reservoir & = pore water concentration of constituent (tracer) x at time n
Vb = total (bulk) volume of the core sample;

2 1
note: there appear to be different values for effective porosity depending on the tracer used. Van der Kamp et al. (manuscript) attribute this to a variety of possible effects, such as ion exclusion, excluded pores, bound water, cation and anion exchange, precipitation, and dissolution.
possible Droblems and sources of error # the proposed technique (laboratory and field scale) is not yet tested and applied; # ensuring sample and pore space saturation: samples have to be sealed when retrieved;
they have to come from the saturated groundwater-zone; # experimental design: a combination of design parameters has to be chosen which will
ensure that very reliable results are obtainable in the shortest amount of time; # experimental set up: the manufactured equipment must be good enough to not
interfere with experiments/measurements; # tracer: must exhibit a conservative behavior within sedimentary rock environments
(i.e., no chemical interaction with the rock body, no decay or degradation); # drilling of reservoir: avoiding clogging of entrance pores by drilling 'cake;' clean up
needed without creation of its own porosity (damage of sample core); # measurement of dimensions (radii/diameters, sample lengths, volumes): this is
probably not quite as influential as for the other laboratory porosity-measurement techniques;
# basic material has to be tested for use in experimental set up; # isolation of core: how snugly has the silicon jacket (or other material) to fit? # question of waters: pore water, adsorbed water, and structural water (part of
structure of clay minerals); diffusion OCCUTS within water of interconnected pore space; pore water with free water diffusion coefficient; how important is adsorbed water? should this also be characterized? diffusion coefficient for the latter is not the free water diffusion coefficient;
# minimizing storage time following core retrieval to prevent fluid loss; # cleanliness during sample preparation and measurements; ## influence of changing temperature and pressure: from original site of sample to the
laboratory (any influence on pore-water chemistry or porosity?); # determination of initial concentration of tracer in pore water (prior to injection of test-
tracer amount), and accuracy of it; # different effective porosities for different constituents/ tracers: ensure to use a proven
conservative tracer; compare data only with data obtained with the same tracer (then: what about data obtained with different laboratory methods?).

2 2
There are no fixed costs at present. Service companies do not provide porosity measurements based on the radial diffusion-cell method, because this method is new and as of yet untested. The experimental set up appears to be simple enough that experiments can be carried out at ORNL (laboratory measurements only; field experiments are a completely different aspect and are not dealt with in this report). Laboratory space is necessary to carry out experiments undisturbed. Furthermore, raw material for manufacturing of equipment (reusable), time of technician to manufacture this equipment (either on-site or off-site), and equipment ordered from catalogues (reusable) has to be paid for. A pilot study is underway to investigate, among many other aspects, the experimental set up of this porosity-measurement technique, the equipment needed, and the performance of the equipment.
evaluation: accuracv and simificance of Dorositv values It is claimed that an accurate determination of effective porosity can be
performed (Novakowski and van der Kamp, unpubl. manuscript; van der Kamp et al., unpubl. manuscript). The technique (experimental set up and calculations) is untested as of today, except for experiments carried out on Pleistocene glacial clay deposits. A test of the technique and its application to fine-grained clastic sedimentary rocks seems warranted. The technique is attractive because of its simplicity, the apparent low costs, and the claim of an accurate determination of effective porosity.
Effective porosity values obtained with the radial diffusion-cell method provide an integration over a larger sample volume when compared to the 'spot-sample' effective porosity values obtained with the immersion-saturation method, the helium-porosimetry or the mercury-porosimetry methods. Possible problems arising with this technique might involve the degree of sample heterogeneity, the minimum size of the sample required for experiments, and the apparently deviating effective porosity values obtained with different tracers (van der Kamp et al., unpubl. manuscript). Furthermore, the availability of suitable core material (especially the prerequisite of saturation) is an important factor in influencing the accuracy of the obtained effective porosity values.

2 3
Mercury Porosimetry
principle
pressure steps. The required pressures to force mercury into the sample correspond to the size of openings (pore throats, pores) within the sample. The injection-pressure steps and the discrete volumes of intruded mercury are tabulated.
Forceful injection of a non-wetting liquid (mercury) into a sample in discrete
methodology
the basic methodology is provided by Kopaska-Merkel(1991). This account provides the background information for much of the following synopsis. Other pertinent sources are Rootare (1970), Wardlaw (1976), Kopaska-Merkel (19881, Amthor et al. (19881, and Wardlaw et al. (1988).
An excellent summary of the mercury-porosimetry method, its applications and
Mercury porosimetry is camed out with the use of the mercury porosimeter. Only a small sample is required for analysis. Mercury, a non-wetting liquid, does not invade pore space unless pressure is provided. The mercury porosimeter provides the means for controlled mercury intrusion with varying intrusion pressures. With each increasing pressure step successively smaller pore throats are accessed by mercury. Mercury porosimetry finally provides capillary-pressure curves that plot the measured amount of intruded mercury (capacitance) versus measured injection pressure (fig. 8). The amount of intruded mercury can be converted to volume of mercury, and the injection pressure can be converted to diameter of pore throats (with the Washburn Equation). Mercury porosimetry, therefore, provides quantitative information on the distribution of pore-throat sizes. The sizes of pore throats are important, because they control access to larger pores. Pores of the same size might be accessed through throats of different sizes, but mercury enters the pore space only after a certain injection pressure is reached (fig. 9). The pore space with the larger sized pore throat will be accessed earlier than the pore space of equal size but with a smaller entry-pore throat (fig. 9).

2 4
injection pressure Pi -
0 P a L
z 5u 1,
- ponrthroat diameter d
fig. 8 Capillary pressure curves, plotting the measured injection pressure and/or the calculated pore-throat diameter versus the amountlvolume of intruded mercury; the upper curve is a cumulative intrusion curve, where the total amount of intruded mercury can be read at the right side end of the curve; the lower plot is an incremental intrusion curve showing the amount/volume of mercury intruded at the chosen consecutive pressure steps; arrows point toward higher values; note the poresize distribution obtained in this way: it is unimodal which is typical for mudrocks (Katsube, 1992; Katsube and Best, 1992; Katsube and Issler, 1993); note that larger pore throats are invaded earlier at lower injection pressures.

2 5
Pil Pi2
fig. 9 Illustration of the importance of pore throats for controlling access to pores; pores of the same size (V = volume) are accessed by pore throats of different sizes (d = diameter); mercury enters the pore throat only after a large enough injection pressure (= Pi) is reached to force mercury through the pore throat; the pore accessed by the larger pore throat will be invaded earlier at a lower injection pressure than the pore of equal size but with a smaller entry-pore throat.
Washburn Equation
into pores to the pore-size diameter greater or equal to d (e. g., Katsube and Issler, 1993). For cylindrical pore shapes, assumed to characterize the pore system in mudrocks (Katsube and Issler, 19931,
The Washburn Equation relates the amount of pressure required to force mercury
d =throat size y = interfaaal (surface) tension (for Hg/vacuum = 0.48 N/m) 9 = contact angle (for Hg/vacuum = 30 7 p = intrusion pressure (psia).
With the help of the Washburn Equation a corresponding pore-throat size can always be calculated from a measured injection pressure.

2 6
Determination of effective porosity Katsube and Issler (1993) provide an outline of the basic procedural steps to
determine effective porosity based on mercury porosimetry. This is the methodology employed by the Geological Survey of Canada for its studies on mudrockdominated basinal sections.
The mercury-injection pressure is increased successively in discrete steps (e. g., 56 steps from 0.14 to 420 m a ) , equally dividing the available pressure range provided by the apparatus. Following each step, time is allotted for equilibration of the system, that is there is no change in volume of mercury taken up by the sample with time. Experience shows that this equilibrium time is about 40 s for high pressure steps (p > 0.7 MPa) and 10 s for low pressure steps (p < 0.7 MPa) for finegrained sedimentary rocks. For each pressure step the volume of mercury intruding the sample is noted.
According to Katsube and Issler (1993), each discrete pressure step corresponds to a certain pore size (more correctly: to a certain pore-throat size), based on the Washburn Equation, and the volume of mercury intruding the sample at each pressure step can be converted into the porosity for that pore size (more correctly: for that pore- throat size and for pores accessed through pore throats of that size).
Partial porosity refers to the porosity contributed by each discrete poresize range (Katsube and Issler, 1993). It is calculated for each poresize range by using the volume of the intruded mercury at this size range and the bulk volume of the sample. The sum of all partial porosities gives the effective porosity $Em as determined by mercury porosimetry. Katsube and bsler (1993) split @Em into a $Em1 (sum of an @a from pore sizes 110 pm) and a @Em2 (sum of all $a from pore sizes 1250 pm). The reason for this split is that $- might contain measurement errors (e.g., errors induced by the space left between sample and penetrometer wall) more likely than @Eml, which is more likely to reflect the effective porosity of the sample.
Alternatively, the effective porosity $Em can be determined by using the
cumulative volume of intruded mercury (obtained at the conclusion of the experiment following the application of highest pressure) and converting this cumulative volume to porosity (i.e., sidestepping the calculation of partial porosities @a and summing these
up) by maximum cumulative intrusion volume divided by bulk sample volume (e. g., Amthor et al., 1988):
@Em = VHgintr. vb V H ~ ~ ~ . = max. cummulative intruded volume of mercury vb = bulk sample volume.

2 7
The bulk-sample volume can be determined by caliper or any other appropriate method. Melas and Friedman (1992) use a method employing the mercury porosimeter directly:
V en = volume of penetrometer (to be determined by calibration runs) V&. = volume of mercury; = MH 1 DH 8 8 D H ~ = density of mercury
M H ~ = mass of mercury; = MI - Mp MI = mass (penetrometer+sample+memry? M2 = mass (penetrometer+sample)
as a non-wetting liquid mercury will/should not penetrate pore space without applied pressure (even pores at the sample surface).
For a more accurate determination of effective porosity of a mudrock based on mercury porosimetry, Katsube (1992) suggests the determination of 'missing porosity' A@ (fig. 10). A@ is defined as that part of the effective porosity of a sample which cannot be characterized by mercury porosimetry, because of equipment limitations. The mercury porosimeter is limited at the higher pressure steps. The smallest sized nanopore throats might therefore not be accessed with the available pressures. The corrected (not measured!) effective porosity, as determined from mercury-injection data, is:
QEmc = corrected effective porosity based on mercury porosimetry & = effective pomsity based on mercury pomsimetry AI$ = 'missing porosity'.
The 'missing porosity' is estimated by fitting a normal distribution curve to the nanopore (-throat) size distribution (fig. 101, assuming that the nanopore (-throat) sizes exhibit an unimodal distribution (Katsube, 1992). The extent of the curve-fitting (i. e., the size of A@ ) depends directly on the analytical capabilities of the mercury porosimeter used.
manipulation steps, and can provide a variety of outputs based on data analysis. Some types of output offered include: incremental and cumulative pore-throat sizes, average and median pore-throat size, apparent skeletal density, and others.
The computer attached to the mercury porosimeter provides a series of data

28
1 .o
0 1 10 lo2 103
pore size d (nm)
fig 10: Unimodal distribution of nanopores (0.3 - 60 nm) characteristic of tight mudrocks; A@ = 'missing porosity', hP = nanopore porosity, %m = effective porosity based on mercury porosimetry, porosity based on mercury porosimetry (based on Katsube, 1992; from Katsube and Williamson, 1994).
= corrected effective
Pore-throat sizes The determination of pore-throat sizes and their distribution is an important
aspect of mercury porosimetry with regard to diffusion as a transport process. The pore throats are the smallest and narrowest pathways within the interconnected pore network of a mudrock. Material transport by diffusion is accomplished within this interconnected pore network. Therefore, the physical constraints provided by the narrowest pathways can significantly impact diffusion as a transport mechanism by influencing diffusion rate. Furthermore, the pore throats can put a size limit on diffusion by denying access to the matrix-pore space to contaminant species too large for the dimensions of the pore throats.

2 9
possible Droblems and sources of error # inexperienced laboratory technicians; # 'philosophy' of the service company /laboratory; # temperature control: mercury expands/contracts with changing temperature; # size of penetrometer (sample chamber): more than 5% of the penetrometer-stem
volume should be occupied by the sample during experiments; # accurate determination of volume of penetrometer: this necessitates the very accurate
calibration of the penetrometer (series of calibration runs; recommended accuracy = 0.001 cm3);
# correction for differential compression (due to exposure to high pressures) and differential expansion (due to temperature increase at high pressures) by use of 'blank analyses;'
# lower detection limit of equipment: smallest available nanopores might not be characterized (and therefore be neglected);
# neglect of 'missing' porosity; it is imperative to determine 'missing' porosity in order to obtain meaningful effective porosity values with mercury porosimetry (Katsube, 1992); the extent of uncharacterized pore space depends on the capabilities of the mercury porosimeter;
# ensuring that equilibrium conditions have been reached for each step of mercury injection (especially important for the tortuous pore system of mudrocks);
# selection of appropriate values for contact angle and mercury-surface tension (to be used in the Washburn Equation);
# pore-shape concept: cylindrical vs. sheet-like pore shapes; is chosen pore-shape concept really closely resembling the pore shape in mudrocks?
# determination of sample bulk volume; # for the ORR: are there fluids present in the rocks which are wetting or partially
wetting (i.e., wetting phases spread out on and covering the pore walls which do not 'bead up' like non-wetting phases)?
# presence of continuous open fractures; # development of induced microfractures at higher injection pressures? # boundary effect: enhanced access of mercury to pores and pore throats exposed at
the sample margin (rapid intrusion of mercury at lower injection pressures); # shielding effect: small pore throats near the sample margin might shield larger pore
throats within sample from mercury intrusion until the marginal small pores are intruded;

3 0
# apparent mercury intrusion: caused by either compression of mercury, or by intrusion of mercury into microscopic crevices of the penetrometer.
- cost Mercury porosimetry is a very sophisticated technique. Handling of mercury,
furthermore, is potentially hazardous. The method, therefore, should be performed at specialized service companies/laboratories with experienced technicians. Projected costs are ca. $400/sample 0. Katsube, pers. comm.). Prices might be variable and negotiable, though, and a survey of commercial service companies should be conducted. The ORNL-Metals & Ceramics Divison has state-of-the-art equipment and information about analysis costs should be obtained. Former supervisor Dr. L. Fuller would charge $100/sample, but the laboratory capacity and equipment time is severely limited because of ongoing research; new supervisor Dr. T. Burchell would charge more (approaching $400/sample), but with no restriction on sample number (it is important to investigate, however, whether expertise in handling of mudrocks already exists at the Metals & Ceramics Division).
evaluation: accuracv and simificance of porosity values Detailed evaluation of machine error was not camed out for the Autopore II
9220. Calculations for a precursor model (Pore Sizer 9305) yielded a measurement accuracy for volume of intruded mercury of fo.0015 cm3 (Kopaska-Merkel, 19881. The error for the Autopore II 9220 should be smaller, but certainly not larger, than this value (Kopaska-Merkel, 1991 1.
The accuracy of porosity determination with mercury porosimetry will be increased substantially by estimation and incorporation of 'missing' porosity values (Katsube, 1992). This 'missing porosity' depends solely on the capacity of the porosimeter used: the greater the capacity of the mercury porosimeter, the more complete should be the characterization of the interconnected pore space within a sample. Calculation of the 'missing porosity' requires a curve-fitting procedure (as described in Katsube, 1992) using the acquired incremental capillary-pressure curve. The resulting estimated effective porosity (i.e., the sum of the statistically estimated 'missing porosity' based on the incremental capillary-pressure curve and the total intruded volume of mercury based on the cumulative capillary-pressure curve) compares favorably with effective porosity values obtained with the immersion-saturation method (Katsube, 1992; Katsube et al., 1992b).

3 1
The derivation of mudrock porethroat sizes and their distribution is an additional plus of mercury porosimetry. The small porethroat sizes might impose physical constraints on diffusion as a transport mechanism. They might severely influence diffusion rate and might cause the exclusion of certain contaminant species from invading the matrix-pore space because of their size.

3 2
Helium Porosimetry
principle
volume V or pressure p causes a commensurate change in pressure or volume, given that the temperature T remains constant. Important for helium porosimetry: an increase in available volume causes the gas (helium) to expand resulting in the decrease in gas pressure.
Based on the Boyle-Mariotte Law: p x V = const. (T = const.). A change in
methodolow In principle there are two different ways to determine porosity with expanding
helium (much detailed information is contained in Luffel and Howard, 1988, and American Petroleum Institute, 1960):
1) helium expands isothermally into a core plug (rubber-sealed on the sides and ends, with low sleeve pressure) from a gas reservoir of known reference volume and helium pressure, until equilibrium pressure is reached. From the new gas pressure Vp (pore volume) can be calculated. Vb (bulk volume) is then determined by either caliper (measuring the dimensions of the core plug) or by immersion of the core plug in mercury (either measuring volume of mercury displaced from a pycnometer, or measuring the buoyant force).
Derivation of porosity
kg = effective porosity as determined by He-porosimetry Vbbm. = bulk volume measured through Hg-immersion Vp = pore volume;
2) the core plug is placed into a steel chamber of known volume. Helium isothermally expands into the chamber from a reservoir of known volume and pressure until equilibrium pressure is reached. From the new gas pressure Vg (grain volume) can be calculated. This method is significantly faster than method 1, because helium can permeate over a larger exposed surface area.
If Vp was measured directly (s. method 2):
= vp / (Vp + vg, QEg

3 3
V -grainvolume vpb I bulk sample volume vb: vbc = vbi-. = (Vp + Vg ): these a11 should correspond; Vbc = bulk volume measured with caliper.
CORAL - emenmental set up based predominantly on Randolph, 1983; Soeder and Randolph, 1987; Soeder, 1988; Soeder and Chowdiah, 1990; note: specific information on sample- preparation techniques [for mudrocks] are contained in Soeder, 1988: 118; Soeder and Chowdiah, 1990 422).
CORAL stands for gomputer-Qperated gock analysis laboratory. It provides high precision core analysis and is housed at the Institute of Gas Technology (IGT) in Chicago, Illinois. Measurement of porosity is based on the methods outlined above, using a gas (He, N). Listed advantages of the CORAL experimental set up include: # higher precision than other helium porosimeters; # electronic data acquisition, electronic tabulation and interpretation; # stable temperature control: the entire system is contained within an isothermal chamber
(temperature stability to within O.O3'C, at a normal operating temperature of 355 X [81.85'C = machine operating temperature?]);
# gas-flow rates (min. of 10-6 cm3/s) are accurately monitored; # four simultaneous measurements are possible; # application of confining hydrostatic pressure to simulate "reservoir" conditions (max.
69 MPa = 10 000 psi).
CORAL is at its best when a suite of parameters is determined for the samples. Measuring only one property (e. g., porosity) is less advantageous, because 8-12 hours are required to obtain temperature stability following sample changes. A highly simplified diagram of the general set up for porosity (and permeability) determination are given in fig. 1 1.

3 4
fig. 11: Sketch of analytical set up at CORAL used for the determination of effective porosity at the Institute of Gas Technology at Chicago (from Randolph, 1983).

3 5
possible Droblems and sources of error (summarized from Luffel and Howard, 1988) Aspects which have to be considered during a) sampling, b) sample preparation,
and c) experiments/measurements:
# condition of the core plug (cleanliness; approaching shape of cylinder [length measurements with caliper at different positions should be within 0.003 cm/0.001 in.; top and bottom ends should be within 0.1" of perpendicular to coreplug axis], edges should not be eroded, not be chipped, etc.): important especially for caliper measurements (core plug should be of sufficient size/dimensions);
# a general problem which affects samples used for any of the petrophysical measurement techniques: evaluation of the possibility of microfracturing during a) coring and b) return of samples from depth to surface;
## V p determination (rubber-sleeve method): core ends should be plane and smooth and perpendicular to core-plug axis; rubber sleeve has to conform to core-plug grain texture, and should have just the right amount of sleeve pressure ('pressing' rubber sleeve onto core plug); allow enough time to reach pressure equilibrium;
## exact calibration of reference volume, dead volume, and pressure gauge; # ability to maintain constant temperature around measurement apparatus
# adsorption of gas on grain surfaces; ## measurement of v b with mercury immersion: possibility of trapped air at the core
plug/mercury-interface (remember: mercury is a non-wetting liquid); possible measurement errors when determining amount of mercury displaced (in pycnometer) or weighing buoyant force;
cylinder, the higher the inaccuracy in Vb will be; fractured and/or chipped samples are not suited for caliper measurement at all;
(c0.3"C/c0.5"F);
# measurement of Vb with caliper: the more deviant the core plug is from an exact
# larger volume core plugs yield more accurate porosity values; # proper drying method (see appropriate chapter below); ## periodic repeat tests (on 10-20% of the samples); # cross check: Vbc should very closely match Vb obtained through adding of measured
# inexperienced laboratory technicians; ## 'philosophy' of the service company /laboratory.
v p + vg;

3 6
- cost Helium porosimetry is a very sophisticated technique. It has to be carried out at
service companies. CORAL and its advantages are provided at the Institute of Gas Technology UGT) in Chicago. Current cost estimates per sample are are not provided by IGT. According to the latest information from IGT (Misra, pers. comm.; Chowdiah, pers. comm.), CORAL is W i g disassembled and moved to a new location. Running of ORR- samples will necessitate to assemble CORAL again, which would be figured into the overall costs (but wouldn't CORAL be assembled anyway ?). The final costs also depend on the number of samples to be analyzed: the more samples the cheaper the costs per sample. Other service companies/laboratories charge ca. $30/sample 0. Katsube, pers. comm) using helium porosimetry, but probably do not follow the analytical guidelines set forth for CORAL.
evaluation: accuracy and simificance of Dorositv values It is claimed that (effective) porosity can be measured with an accuracy o f f
2.0% (Soeder, 1988). Because it is more advantageous to measure several petrophysical parameters concurrently with CORAL, it appears to be appropriate to add other measurements than (effective) porosity to the experiments. The measurement of permeability is an obvious choice, given that a) the costs are not inflated, and b) that core plugs were obtained horizontally (that means parallel to either bedding or stratification). As was the case for mercury porosimetry and for the immersion- saturation method, the measured effective porosity obtained by helium porosimetry characterizes a sample volume the size of a standard core plug, or the size of a disk cut from the plug.
Issler and Katsube (1994) claim that helium porosimetry values are more reflective of the total interconnected pore space (effective porosity) than values obtained by mercury porosimetry. According to these authors, then, helium porosimetry should be emphasized over mercury porosimetry. Values for effective porosity published by workers of the Geological Survey of Canada (Katsube and co-workers) involved the type of helium porosimetry available at commercial service companies. It has to be investigated in how far these service companies supply the technological sophistication obtained by CORAL. The final decision between CORAL and a service company has to be based on the costs involved and on an independent investigation into the capabilities of helium porosimeters (and philosophy) provided by service companies. Despite these considerations, values of effective porosity obtained by helium porosirnetry are generally considered as "good numbers."

3 7
Of general importance for the samples shipped out to commercial or other laboratories (i.e., core-analysis procedures not performed in personam) is:
a) a shared responsibility in the progress of the analyses (with quality control, based on every aspect available*), and
b) a close contact between the principal investigator and the laboratory carrying out the measurements (Luffel and Howard, 1988). Luffel and Howard (1988), furthermore, list a series of recommendations which should be fulfilled by any analytical laboratory: # repeat tests; ## checking the consistency of results; # availability of all individual Vp. Vg. and Vb measurements; ## reporting of caliper measurements; # reporting of dry weights; ## reporting of all data from repeat measurements; # reporting of all anomalous results; # access to a laboratory diary;
Prepeat tests on 10-20% of the samples; comparison of obtained porosity values to other available data [permeability, grain density, lithology]; consistency of data; comparison to auxiliary data [wireline logs, familiarity with rocks]) (Luffel and Howard, 1988).
The most promising techniques for measurement of effective porosity of
1) immersionsaturation method 2) radial diffusiontell method 3) helium porosimetry 4) mercury porosimetry.
mudrocks appear to be:
The accuracy of the different techniques might be variable. Certain researchers emphasize one technique, while others dismiss the same. Much research within this area of petrophysics is being conducted at the moment, the state of the art seems to be 'in flux' (based on readings and especially on conversations with researchers in academia, petroleum companies, petrophysical service companies, and Geological Surveys).

3 8
Should the immersion-saturation method perform accurately, it would be by far the most attractive technique, because it is relatively simple and inexpensive. It has to be evaluated, however, as to its suitability for ORR-mudrocks (e. g., the possibility of sample disintegration).
experimental set up is established, it should be a relatively simple and inexpensive technique. In order to establish diffusion cells it needs, however, cores of a "certain" length and diameter which must have been sealed upon recovery. The other three methods (1,3,4), in contrast, can work with much less sample material. The radial diffusion-cell method has not yet been tested and verified. Experiments to evaluate set up/design, experimental procedures and accuracy are needed. It also has to be investigated whether ORR-mudrocks are useful for this method. The method, furthermore, provides effective potosity integrated over a larger volume (no chips, no plugs, but core of decimeter length) in contrast to the %pot" measurements of the other methods.
The radial diffusiontell method appears to be promising. As soon as the
Methods 1 and 2 are comparatively simple and straightforward enough to be set up at ORNL. Methods 3 and 4 are sophisticated and very complicated. Service companies are needed to conduct the analyses. Therefore, these methods are more expensive. It is important to check and "control" the service laboratories before and during analyses.
Helium porosimetry generally is cheaper than mercury porosimetry. Helium porosimetry provides effective porosity values, whereas mercury porosimetry provides pore-throat sizes and size distribution. The latter needs corrections for obtaining accurate effective porosity values (see work by Katsube, Issler). The extent of the corrections depends on the capabilities of the mercury porosimeter used in the experiments.
A pilot study is necessary to: a) test laboratory set ups (1,2), b) test techniques (1,2), c) establish technique (21, d) generate numbers for a cross-comparison (1,2,3,4), and sensitivity-interpretation assessment. Eventually, the pilot study should be expanded to a larger, systematic and comprehensive effective porosity study of a chosen mudrock-dominated stratigraphic unit on the ORR.

3 9
References
American Petroleum Institute (1960): Recommended Prucfices for Core-analysis Procedure. API Recommended Practice 40 (RP 40), 1st ed., American Petroleum Institute, Washington, D.C., 55 p.
Amthor, J. E., Kopaska-Merkel, D. C., and Friedman, G. M. (1988): Reservoir characterization, porosity, and recovery efficiency of deeply buried Paleozoic carbonates: Examples from Oklahoma, Texas and New Mexico. Carbonates and Evaporites, v. 3, p. 33-52.
Bennett, R. H., and Hulbert, M. H. (1986): Clay Microstructure. International Human Resources Development Corporation, Boston, 161 p.
Blatt, H. , Middleton, G. V., and Murray, R. C. (1980): Origin of sedimentary Rocks. Prentice- Hall, Englewood Cliffs, NJ, 782 p.
Bush, D. C, and Jenkyns, R. E. (1970): Proper hydration of clays for rock property determinations. Journal of Petroleum Technology, July, p. 800 - 804.
Davies, D. K., Bryant, W. R., Vessell, R. K. and Burkett, P. J. (1991): Porosities, permeabilities, and microfabrics of Devonian shales. In: Bennett, R. H., Bryant, W. R., and Hulbert, M. H., eds., Microstructures of Fine-grained Sediments, p. 109-1 19.
Drost-Hansen, W. (1991): Some effects of vicinal water on the sedimentation process, compaction, and ultimate properties of sediments. In: Bennett, R. H., Bryant, W. R., and Hulbert, M. H., eds., Microstructures of Fine-grained Sediments, p. 259-266.
Engelhardt, W. von (1960): Der Porenruum der Sedimente. Springer-Verlag, Berlin-Gottingen- Heidelberg, 207 p.
Jewy, 6@f p. Freeze, R. A., and Cherry, J. A. (1979): Groundwater. Prentice-Hall, Englewood Cliffs, New
Germain, D., and Frind, E. 0. (1989): Modelling of contaminant migration in fracture networks: Effects of matrix diffusion. Proceedings International Symposium on Contaminant Transport in Groundwater, Stuttgart, Germany (April 19891, p.
Goldstrand, P. M., Dreier, R. B., and Menefee, L. S. (in review): Porosity Development in the Copper Creek Dolomife and Mqnardvi lk Limestone, Bear Creek Valley, Tennessee. ORNL/TM.
Grim, R. E. (1962): Applied Clay Mineralogy. McGraw-Hill, New York, 422 p.
Hatcher, R. D., Jr., Lemiszki, P. J., Dreier, R. B., Ketelle, R. H., Lee, R. R., Lietzke, D. A., McMaster, W. M., Foreman, J. L., and Lee, S. Y. (1992): Status Report on the Geology of the Oak Ridge Resmution. ORNL/TM-12074, 247 p.
Heling, D. (1988): 5. Ton- und Siltsteine. In: Fiichtbauer, H., ed., Sedimente und Sedimentgesteine. Schweitzerbart, Stuttgart, p. 185-231.
Issler, D. R., and Katsube, T. J. (1994): Effective porosity of shale samples from the Beaufort- Mackenzie Basin, northern Canada. In: Current Research, Part €?. Geological Survey of Canada, p. 19-26.

4 0
Katsube, T. J. (1992): Statistical analysis of poresize distribution data of tight shales from the Scotian Shelf. In: Current Research, Part E . Geological Survey of Canada, Paper-lE, p. 365-372.
Katsube, T. J., and Best, M. E. (1992): Pore structure of shales from the Beaufort-Mackenzie Basin, Northwest Territories. In: Current Research, Part E . Geological Survey of Canada, Paper 92-1E, p. 157-162.
Katsube, T. J., and Issler, D. R. (1993): Pore-size distributions of shales from the Beaufort- Mackenzie Basin, northern Canada. In: Current Research, Part E . Geological Survey of Canada, Paper-lE, p. 123-132.
Katsube, T. J., and Scromeda, N. (1991): Effective porosity measuring procedure for low porosity rocks. In: Current Research, Part E . Geological Survey of Canada, Paper 91-1E, p. 291- 297.
Katsube, T. J., and Williamson, M. A. (1994): Shale petrophysics and basin charge modeling. In: Current Research, Part D. Geological Survey of Canada, Paper 94-1D, p. 179-188.
Katsube, T. J., Mudford, B. S., and Best, M. E. (1991): Petrophysical characteristics of shales from the Scotian Shelf. Geophysics, v. 56, p. 1681-1689.
Katsube, T. J., Murphy, T. B., Best, M. E., and Mudford, B. S. (1990): Pore structure characteristics of low permeability shales from deep formations. In: Proceedings of the 1990 SCA (Society of Core Analysts) 4th Annual Technical Conference. Dallas, Texas, SCA-9010, p. 1-21.
Katsube, T. J., Scromeda, N., and Williamson, M. (1992b): Effective porosity from tight shales from the Venture gas field, offshore Nova Scotia. Geological Survey of Canada, Paper 92-1D, p. 111-119.
Katsube, T. J., Williamson, M., and Best, M. E. (1992a): Shale pore structure evolution and its effect on permeability. In: Symposium Volume ZZZ of the Thirty-Third Annual Symposium of the Society of Professional Well Log Analysts (SPWLA). The Society of Core Analysts Preprints, Oklahoma City, Oklahoma, Paper SCA-6214, p. 1-24.
Technology, November, p. 2483-2491. Keelan, D. K. (1982): Core analysis for aid in reservoir description. Journal of Petroleum
Kopaska-Merkel, D. C. (1988): New applications in the study of porous media: Determination of pore-system characteristics on small fragments (part I). Northeastern Environmental Science, v. 7, p. 127-142.
Kopaska-Merkel, D. C. (1991): Analytical Procedure and Experimental Design for Geological Analysis of Reservoir Heterogeneity using Mercury Porosimetry. Alabama Geological Survey Circular 153,29 p.
Kopaska-Merkel, D. C., and Amthor, J. E. (1988): Very high-pressure porosimetry as a tool in
Krushin, J. (1994): Entry porethroat size of nonsmectite shales. American Association of Petroleum Geologists Annual Meeting, New Orleans, Abstracts with Programs, p.
reservoir characterization. Carbonates and Evaporites, v. 3, p. 53-63.

4 1
Luffel, D. L., and Howard, W. E. (1988): Reliability of laboratory measurement of porosity in tight gas sands. SPE Formation Evaluation, December, p. 705-710.
McKay, L. D., Gillham, R. W., and Cherry, J. A. (1993): Field experiments in a fractured clay till 2. Solute and colloid transport. Water Resources Research, v. 29, p. 3879-3890.
Meade, R H. (1966): Factors influencing the early stages of compaction of clays and sands - review. Journal of sedimentary Petrology, v. 36, p. 1085-1 101.
Melas, F. F., and Friedman, G. M. (1992): Petrophysical characteristics of the Jurassic Smackover Forination, Jay field, Conecuh embayment, Alabama and Florida. American Association of Petroleum Geologists Bulletin, v. 76, p. 81-100.
Melnyk, T. W., and Skeet, A. M. M. (1986): An improved technique for the determination of rock porosity. Canadian Journal of Earth Sciences, v. 23, p. 1068-1074.
Muller, G. (1967): Diagenesis in argillaceous sediments. In: Larsen, G., and Chilingarian, G. V., eds., Diagenesis in Sediments 1. Elsevier, Amsterdam, p. 127-178.
Neretnieks, I. (1980): Diffusion in the rock matrix: An important factor in radionuclide retardation? Journal of Geophysical Research, v. 85, p. 4379-4397.
Novakowski, K. S., and Van der Kamp, G. (unpubl. manuscript): A new method for measurement of porosity, apparent diffusivity and adsorption in geological materials. Water Resources Research, 20 p., 7 figs.
Randolph, P. L. (1983): Porosity and permeability of Mesaverde Sandstone core from the U.S. DOE multiwell experiment, Garfield County, Colorado. Paper SPE/DOE 11765 presented at the 1983 SPE/DOE Symposium on low-permeability Gas Reservoirs, Denver, March 14-16, p. B3-Bl4.
Rieke, H. H. 111, and Chilingarian, G. V., eds. (1974): Compaction of Argillaceous Sedimenfs. Developments in sedimentology 16, Elsevier, Amsterdam, 424 p.
Rootare, H.M. (1970): A review of mercury porosimetry. In: Hirschhorn, J.S., and Roll, K.H., eds., Advanced Experimental Techniques in Powder Metallurgy. Plenum Press, New York, p. 225-253.
Sanford, W. E., Jardine, P. M., and Solomon, D. K. (1994): Examining matrix diffusion in fractured shales with noble gases. Geological Society of America Abstracts with Programs, v. 26, p. A362.
Scromeda, N., and Katsube, T. J. (1993): Effect of vacuumdrying and temperature on effective porosity determination for tight rocks. In: Currenf Research, Part E. Geological Survey of Canada, Paper-lE, p. 313-319.
Shevenell, L. M., Moore, G. K., and Dreier, R. B. (1994): Contaminant spread and flushing in fractured rocks near Oak Ridge, Tennessee. Ground Water Monitoring & Remediation, v. 14, p. 120-129.
Singer, A., and Muller, G. (1983): Diagenesis in argillaceous sediments. In: Larsen, G., and Chilingarian, G. V., eds., Diagenesis in Sedimenfs and Sedimenfary Rocks 2. Elsevier, Amsterdam, p. 115-212.
4 2
Soeder, D. J. (1986): Laboratory drying procedures and the permeability of tight sandstone core. SPE Formation Evaluation, February, p. 16-22.
M e r , D. J. (1988): Porosity and permeability of eastern Devonian gas shales. SPE Formation Evaluation, v. 3, p. 116-138.
soeder, D. J., and Chowdiah, P. (1990): Pore geometry in high- and low-permeability sandstones, Travis Peak Formation, East Texas. SPE Formation Evaluation, December, p. 421-430.
M e r , D. J., and Randolph, P. L. (1987): Porosity, permeability, and pore structure of the tight Mesaverde Sandstone, Piceance Basin, Colorado. SPE Formation Evaluation, June, p. 129-136.
Solomon, D. K., Moore, G. IC, Toran, L. E., Dreier, R. B., and McMaster, W. M. (1992): Status Report: A Hydrologic Framework for the Oak Ridge Reservation. ORNL/TM-12026. Oak Ridge National Laboratory, Oak Ridge, Tenn., variously paginated.
Sudicky, E. A. (1990): The Laplace transform Galerkin technique for efficient timecontinuous solution of solute transport in double-porosity media. Geoderma, v. 46, p. 209-232.
Tang, D. H., Frind, E. O., and Sudicky, E. A. (1981): Contaminant transport in fractured porous media: Analytical solution for a single fracture. Water Resources Research, v. 17, p. 555-564.
Toran, L, Sjoreen, A., and Moms, M. (1995): Sensitivity analysis of solute transport in fractured porous media. Geophysical Research Letters, vol. 22, p. 1433-1436.
Van der Kamp, G., van Stempvoort, D. R., Wassenaar, L. I. (unpubl. manuscript): A diffusion method for studying the aqueous geochemistry and effective porosity of cylindrical cores, 16 p., 6 figs., 6 tabl.
Wardlaw, N. C. (1976): Pore geometry of carbonate rocks as revealed by pore casts and capillary pressure. American Association of Petroleum Geologists Bulletin, v. 60, p. 245-257.
Wardlaw, N. C., McKellar, M., and Yu, Li (1988): Pore and throat size distribution determined by mercury porosimetry and by direct observation. Carbonates and Evaporites, v. 3, p. 1-15.
Wickliff, D. S., Solomon, D. K., and Farrow, N. D. (1991): Preliminay invesfigation of processes that affect source term identification. ORNL/ER 59, Oak Ridge National Laboratory, Oak Ridge, Tenn., 31 p.
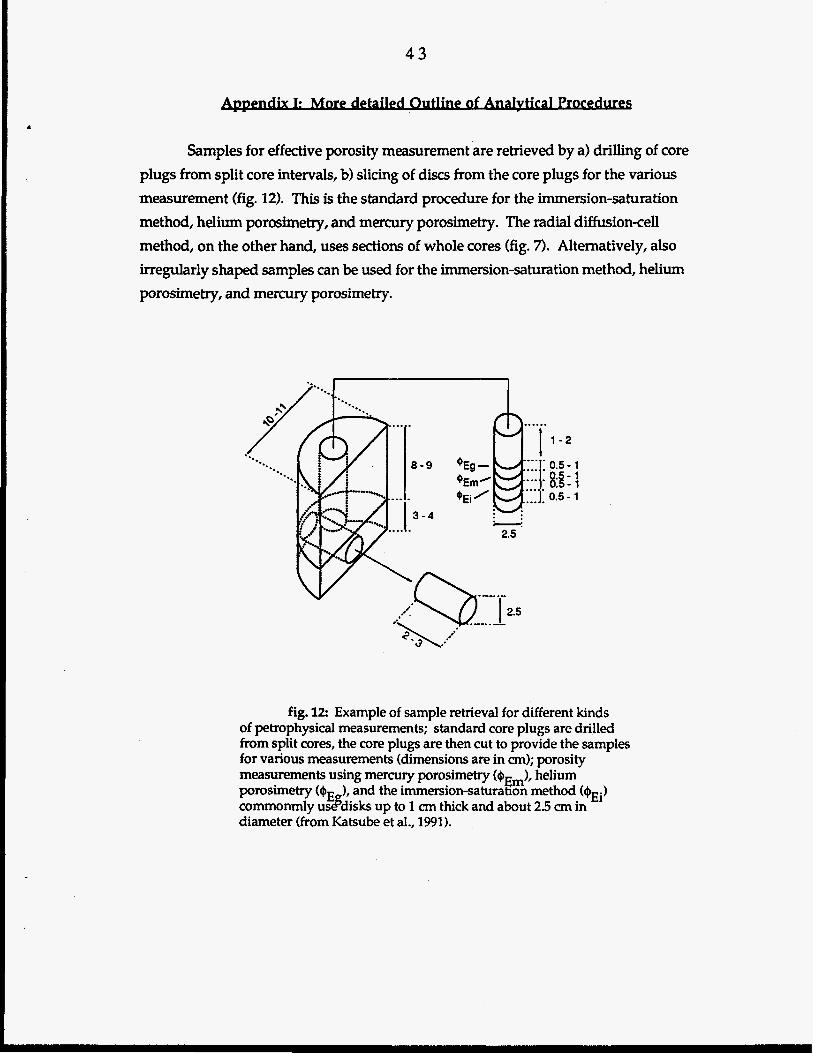
43
Samples for effective porosity measurement are retrieved by a) drilling of core plugs from split core intervals, b) slicing of discs from the core plugs for the various measurement (fig. 12). This is the standard procedure for the immersion-saturation method, helium porosimetry, and mercury porosimetry. The radial diffusion-cell method, on the other hand, uses sections of whole cores (fig. 7). Alternatively, also irregularly shaped samples can be used for the immersion-saturation method, helium porosirnetry, and mercury porosimetry.
1 - 2
0.5- 1 82: 't 0.5- 1
fig. 12: Example of sample retrieval for different kinds of petrophysical measurements; standard core plugs are drilled from split cores, the core plugs are then cut to provide the samples for various measurements (dimensions are in an); porosity measurements using mercury porosimetry (e porosimetry ($E ), and the immersion-saturahon method (%i) commonmly usgdisks up to 1 cm thick and about 2.5 cm in diameter (from Katsube et al., 1991).
1, helium Em

\
4 4
Immersion-Saturation Method (from Katsube and Scromeda, 1991; Katsube et al., 1992b; optimum durations from Katsube et al., 1992b)
1) Vacuum Drying # drying the sample at room temperature (sample is "air dried"); # plaang the sample into glass beaker with tweezers; # placing beaker into vacuum chamber; # applying vacuum at 760 mm Hg (duration: period chosen arbitrary); # sample is weighed (sensitivity of balance: f 0.1 mg); # sample is returned for (a) period(s) of additional vacuum drying
(period durations are variable), followed by weighing; this procedure is repeated until a constant weight is reached (duration: suggested optimum total vacuum-drying time = 735 mid;
question: selection of period durations: can we go with suggested (total) optimum duration from the onset to shorten experiments? minimize considerably the repeat periods? (this holds also for the other procedural steps).
2) Vacuum Saturation # applying vacuum for degassing of sample (duration: 15 min) # saturation of sample: introducing saturation liquid (deionized and destilled
water) to the vacuum chamber (duration: until vacuum chamber is filled with liquid);
# applying vacuum for degassing of sample (duration: 15 mid; # sample left under atmospheric pressure (duration: variable, suggested period
# weighing of sample: removal of the sample from beaker, outer area is dried 1-60 min);
with kimwipe (no sheen left on the sample surface indicative of moisture films); note: keep this drying process consistent from sample to sample!
## sample is returned to beaker, immersed under atmospheric pressure for (a) period(s) (variable min), and weighing procedure is repeated; this is to be continued until a constant weight is obtained (indicating fuZZ saturation: W,); (suggested optimum total saturation time = 285 min).
L
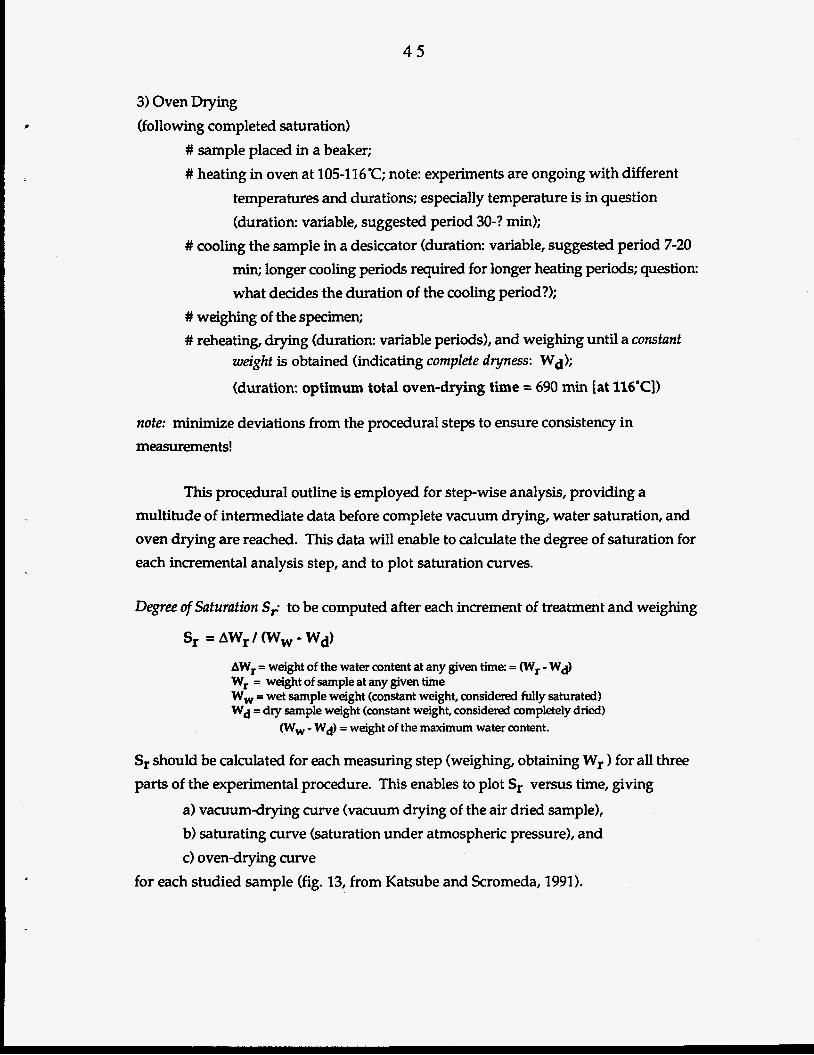
4 5
3) Oven Drying (following completed saturation)
# sample placed in a beaker; # heating in oven at 105-116°C; note: experiments are ongoing with different
temperatures and durations; especially temperature is in question (duration: variable, suggested period 30-? min);
min; longer cooling periods required for longer heating periods; question: what decides the duration of the cooling period?);
# cooling the sample in a desiccator (duration: variable, suggested period 7-20
# weighing of the specimen; # reheating, drying (duration: variable periods), and weighing until a consfant
weighf is obtained (indicating complete dryness: Wd);
(duration: optimum total oven-drying time = 690 min [at 116'CI)
nofe: minimize deviations from the procedural steps to ensure consistency in measurements!
This procedural outline is employed for step-wise analysis, providing a multitude of intermediate data before complete vacuum drying, water saturation, and oven drying are reached. This data will enable to calculate the degree of saturation for each incremental analysis step, and to plot saturation curves.
Degree of Saturation S; to be computed after each increment of treatment and weighing
AW, = weight of the water content at any given time: = (Wr - Wd) W, = weight of sample at any given time W, = wet sample weight (constant weight, considered fully saturated) wd = dry sample weight (constant weight, considered completely dried)
Ww - wd) = weight of the maximum water content.
Sr should be calculated for each measuring step (weighing, obtaining Wr for all three parts of the experimental procedure. This enables to plot Sr versus time, giving
a) vacuum-drying curve (vacuum drying of the air dried sample), b) saturating curve (saturation under atmospheric pressure), and c) oven-drying curve
for each studied sample (fig. 13, from Katsube and Scromeda, 1991).

4 6
0 50 100 duration timet (min)
150
fig. 13: Plotting degree of saturation (SJ versus time 0); fs represents the saturation curve (#I, tD the oven-drying curve (o), and tI the vacuumdrying curve (x) (from Katsube and Scromeda, 1991).
Melnyk and Skeet (1986) use a different analytical procedure. According to these authors the sample is dried in a vacuum chamber for 2448 hrs, equilibrated to laboratory air for 60 min (no condensation of water into pore space?), and then weighed. This procedure is to be repeated until a constant (k 0.5 mg) weight is obtained (Wd, is not obtained by/after oven-drying!). This is followed by degassing of the
sample under vacuum, and immersion of the sample in degassed deionized water within the vacuum cell. W, (water-saturated surfacedry weight) is obtained through the establishment of drying curves, and W, (submerged sample weight) is obtained using
a buoyancy method. Effective porosity, then, is determined according to the equations provided (Melnyk and Skeet, 1986, p. 1069). An interesting discussion on obtaining the 'water-saturated but surface dry weight' from drying curves is included.

4 7
Helium Porosimetry (via CORAL) (the most detailed description of the experimental set up can be found in Randolph, 1983; details on sample preparation specifically for mudrocks are outlined by Soeder, 1988, and Soeder and Chowdiah, 1990; the following summary is based on the mentioned references)
1) Sample Preparation: # horizontal plug drilled from a core (horizontal, Le., parallel to
stratificatiodbedding, is necessary for permeability determination, but is not as important for porosity determination); coolant: tap water; diamond coring bit diameter: 1.5 in (3.8 an); plug: 1 in (2.5 cm) in diameter and ca. 5-6 cm in length;
squaring off of ends with light sanding (400-grit carborundum paper); # trimming ends of plug flat (thin diamond blade of a metallurgical saw);
## caliper measurement of dimensions of core plug; # weighing of core plug.
2) Oven Drying # in controlled-relativehumidity oven, with intermittent weighing (duration:
variable, until weight of sample is constant, temperature: 60% [140T], relative humidity: 45%);
stabilization is reached). ## dry weight: weighing of sample under a tared inverted beaker (after weight
3) CORAL ## covering sample with a rubber sleeve (modified technique: using thin lead
## establish confining pressure, activation of temperature control system for
## system left overnight (check for leaks, achieving temperature stability); ## increase in confining pressure; # porosity (and other) measurements are carried out: a detailed account of this
procedure is provided by Randolph (19831, but is not summarized here; estimation of "reservoir" stress.
sheaths), inserting into coreholder of CORAL;
isothermal enclosure;

4 8
Mercury Porosimeby (the brief notes on mercury porosimetry are taken from Kopaska-Merkel, 1991, which are based in part on information provided by the manufacturer of the porosimeter)
The porosimeter used at the Metals & Ceramics Division at ORNL (supervisor: formerly Dr. L Fuller, now Dr. Tim Burchell), and also at the Geological Survey of Alabama (supervisor: Dr. D, Kopaska-Merkel), is the Autopore I1 9220 manufactured by Micromeritics Instrument Corporation. Mercury porosimetry with the Autopore II provides the possibility to determine porosity more accurately, because the pressure range available ensures that the available pore-throat size range will be covered (Kopaska-Merkel and Amthor, 1988, for carbonate rocks). Most commercial service laboratories do not possess these capabilities and, therefore, most of their porosity values should be considered as suspect (Kopaska-Merkel, 1991). A wide range of possible intrusion pressures is especially important for the study of mudrocks given their small pore-throat sizes.
injection pressures ranging from 1.5 psia (0.01 MPa) to 60 000 psia (414 MPA) (90 000 psia according to L. Fuller, pers. com.). Injection pressure can be increased or decreased incrementally, allowing the separate reading of a maximum of 250 pressure steps and correlated capacitance (amount of intruded mercury) values. The computer is programmed with certain run conditions (such as pressure steps, equilibrium times, etc.) specified by the operator and the investigator. Data output is variable and a wide variety of data displays are available.
The Autopore II is a computer-controlled mercury porosimeter. It can generate
1) Decisions to be made # determination of appropriate equilibrium times (conservative values); # determination of the number of pressure steps and pressure increments (design of
# selection of a maximum specific-intrusion volume; this causes the apparatus to collect pressure tables);
additional data points, if there is a lot of intrusion between already planned data points.
2) Sample Preparation # sample size: has to fit into penetrometer, can be very small; # cleaning and drying of sample (the "proper" drying technique should be selected); # determining the dimensions of the sample (caliper);

4 9
# weighing of clean and dry sample.
3) Analysis ## sample put into penetrometer (sample chamber), sealed off; # weighing of penetrometer (containing sample); # application of vacuum to penetrometer; # introduction of mercury and filling of penetrometer; # incremental increase in injection pressure causing corresponding intrusion of mercury
into sample; conducting low pressure and high pressure experiments, with weighing of penetrometer in-between.
5 0
Drying Method
The process of drying can introduce errors to the determination of porosity and/or permeability of clay-rich material. The drying of mudrocks in preparation for measurement experiments or as part of the measurement experiments should be carefully evaluated. In all cases of laboratory investigations the drying procedure used should be reported. The standard drying procedures during core analysis involve suggested operating temperatures of 116°C (at atmospheric pressure) or 93°C (under vacuum) (American Petroleum Institute, 1960; Scromeda and Katsube, 1993).
Different types of water can be distinguished for clay-rich material such as mudrocks (Grim, 1962; Bush and Jenkins, 1970; Scromeda and Katsube, 1993). The first type of water is the pore water (free water), i.e. the water contained within the pore space of the rock. A second type is water adsorbed to clay minerals (adsorbed water), whose (about) three molecular layers closest to the clay mineral should be considered as part of the clay mineral (nonordinary/nonliquid water) and not as part of the open pore space (Grim, 1962; Bush and Jenkins, 1970). The properties of this nonordinary water are strongly modified by the adjacent solid surface (Grim, 1962; Bush and Jenkins, 1970; Drost-Hansen, 1991). A third type of water is the crystal-lattice water (structural water), which is an integral part of the clay mineral (Grim, 1962; Bush and Jenkins, 1970). Pore water and adsorbed water will be lost in an unhumidified oven at temperatures of 180°F (82°C) or higher (>1OO"C according to Scromeda and Katsube, 1993), whereas the crystal-lattice water will be lost at temperatures above 570°F (> 300°C) (Bush and Jenkins, 1970).
40% relative humidity and at an operating temperature between 140-145°F (60-63OC). This will ensure that 1 to 2 molecular layers of adsorbed water (nonordinary water) are retained at clay minerals (as part of the clay mineral) and that the pore water and excessive adsorbed water - not part of the clay mineral - is driven off. Measurement of porosity on samples dried in this fashion will most closely characterize porosity under reservoir conditions (Bush and Jenkins, 1970; Soeder, 1986). Following Keelan (19821, Soeder (1986) used a humidity-controlled oven with operating conditions of 45% relative humidity and 145°F (63°C) for preparation of samples to be run at CORAL. Samples to be analyzed for effective porosity at CORAL (using helium porosimetry) most likely will be treated in the same way. Drylng of mudrocks at lower temperatures without control of relative humidity will simply slow down the rate of dehydration and eventually will lead to a complete loss of all adsorbed water (Bush and Jenkins, 1970).
Bush and Jenkins (1970) recommend the use of a humidity-controlled oven run at

5 1
It is important to know the type of clay minerals present in the samples to be analyzed. Keelan (1982) reported that different species of clay minerals exhibit different degrees of 'sensitivity' to the drying procedure. He ranks montmorillonite as the clay mineral most sensitive to drying, with chlorite being only slightly sensitive, and illite and kaolinite as almost insensitive to drying.
Soeder (1986) pointed out that smectites (such as montmorillonite) and mixed- layer smectite/illite collapse and change chemically and physically to illite during complete drying in a non-humidity-controlled oven. This substantially increases the permeability (and porosity) of the sample. Knowledge of the clay-mineral composition of the samples (stratigraphic unit), therefore, is very important. Extreme care should be taken, if smectites are present (e. g., Krushin, 1994).
An aspect to consider, however, is that diffusion of chemical species will occur through the whole cross section of water available between the physical confines provided by the framework minerals (clay minerals, quartz, feldspar, etc.). The water- cross section, accordingly, would comprise the normal pore water and the adsorbed water including the few molecular layers of nonordinary water. It should also be considered, however, that the properties of the nonordinary water differ from the properties of the pore water (bulk or ordinary water). This is even more complicated, if one adopts the notion of vicinal water, where solid surfaces exert modifying influence upon water beyond the 2 to 5 molecular layers of nonordinary water to up to 50 molecular diameters (Drost-Hansen, 1991). The changed properties of the water- molecule layers along solid surfaces, when compared to pore water (bulk/ordinary water properties), will likely influence the diffusion characteristics of chemical species (e. g., Drost-Hansen, 1991). According to Drost-Hansen (1991) vicinal water, in fact, is the likely type of water contained within the pore spaces of finegrained sedimentary rocks, given the small pore sizes and the proximity of the confining solid surfaces of the framework minerals holding up the pores. The thickness of the nonordinary water (and of vicinal water) can be estimated by assuming a thickness of about 0.25 nm for one molecular layer of water (Bush and Jenkins, 1970; Soeder, 1986).
Scromeda and Katsube (1993), on the other hand, dismiss drying of mudrocks at temperatures below 100°C. They claim that it is necessary to dry rock samples at operating temperatures above 100°C (either under vacuum or at atmospheric pressure) in order to drive off all adsorbed water. Drying at operating temperatures below 100°C most likely will prevent the measurement of true effective porosity (Scromeda and

5 2
Katsube, 1993). Should drying according to the specification of the Geological Survey of Canada (Scromeda and Katsube, 1993) not physically alter mudrock samples (presence/absence of smectites) and also drive off all of the adsorbed water (including the nonordinary water), then it appears to be the technique most promising for determining the true effective porosity of mudrocks.
less susceptible to any possible negative modifications imposed by the drying procedure than are unconsolidated or weakly consolidated clayey sediments (Bennett and Hulbert, 1986).
To end on a positive note: indurated fine-grained siliciciastic rocks are by far
4
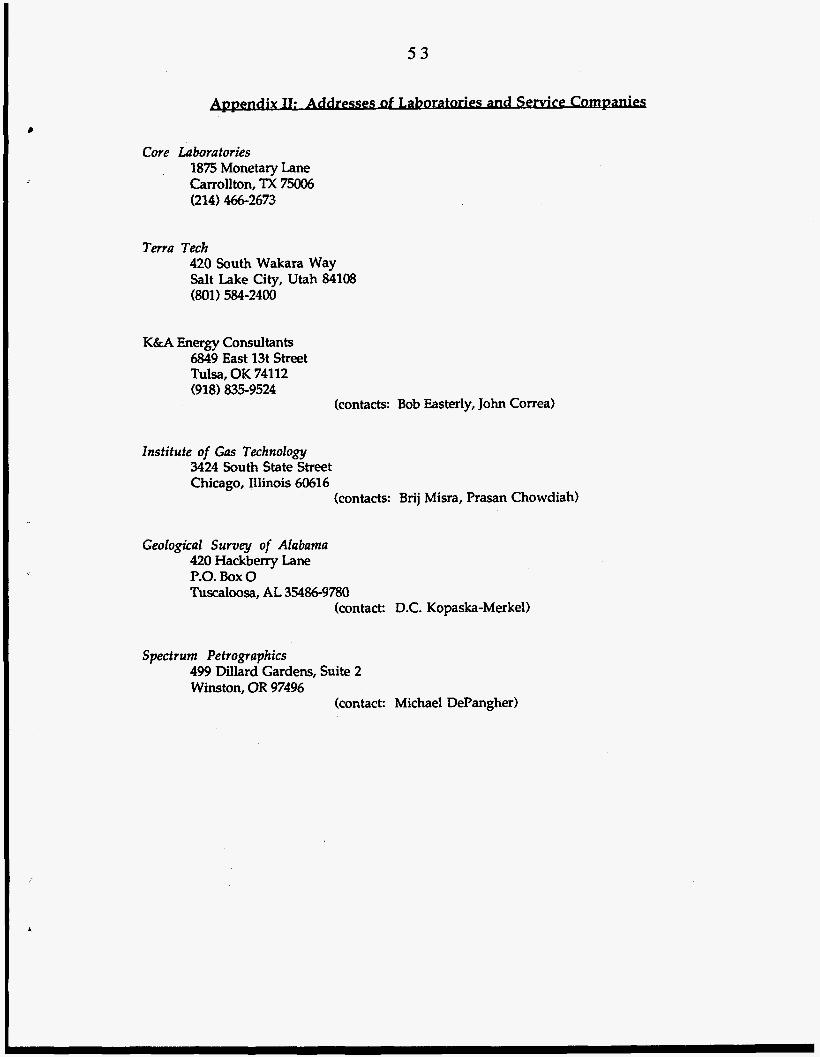
53
Core Laboratories 1875 Monetary Lane Carrollton, TX 75006 (214) 466-2673
Terra Tech 420 South Wakara Way Salt Lake City, Utah 84108 (801) 584-2400
K&A Energy Consultants 6849 East 13t Street Tulsa, OK 74112 (918) 835-9524
(contacts: Bob Easterly, John Correa)
lnstitute of Gas Technology 3424 South State Street Chicago, Illinois 60616
(contacts: Brij Misra, Prasan Chowdiah)
Geological Survey of Alabama 420 Hackberry Lane P.O. Box 0 Tuscaioosa, AL 35486-9780
(contact: D.C. Kopaska-Merkel)
Spectrum Petrographics 499 Dillard Gardens, Suite 2 Winston, OR 97496
(contact: Michael DePangher)

5 4
III: N o t & i o n s i m U W m x h
Volumes
Vp = pore volume (volume of pore space)
Vb = bulk volume (bulk sample volume) Vphter = volume of interconnected pore space
Vb- = bulk volume measured through Hg-immersion Vbc = bulk volume measured with caliper v b = wd /a
a = bulk density of the rock sample wd = sample weight dry
Vg = grain volume (volume of the soZid sample material: volume of gains)
v p = v b - v g Vb -> Vbc = Vb-, = (Vp + Vg 1: these all should correspond
Porosities
Qr = total porosity $E = effective porosity QO = (total) optical porosity (TOP)
Void Ratio e = Vp [or Vpintal / Vg
e = void ratio
Relationship between Porosity and Void Ratio: t+ [or $El = e / ( l +e) e = $= [or $El (1 - % [or $El)
Effective Porosities
A. hg = effective porosity measured with helium porosimetry (g = gas)
1) @ F ~ = v p 1 V b h .
2) $Eg = v p / (Vp + Vg'
3) hg = ( V b b . - vg) 1 Vbimm.

5 5
B. = effective porosity measured with mercury porosimetry (m = mercury)
d = (4y cos6) / p (Washburn Equation) d = throat size y = interfacial (surface) tension (for Hg/vacuum = 485 dynedcm) 6 = contact angle (for Hg/vacuum = 130: measured in Hg) p = intrusion pressure (psia).
2) hc = corrected effective porosity measured with mercury porosimetry =4)Em+A@
A@ = 'missing porosity'
v b = Vpen - VHg (using the mercury porosimeter) Vpen = volume of penetrometer (to be determined by calibration runs) V H ~ = volume of mercury; = MHg / D H ~
DHg = density of mercury Me = mass of mercury; = MI - M2
M1 = mass (penetrometer+samplemercury") M2 = mass (penetrometer+sample)
* as a non-wetting liquid mercury will/should not penetrate pore space without applied pressure (even pores at the sample surface).
C. 4)Ew = effective porosity measured with the radial diffusion-cell method (w = 'Waterloo')
1) VM = WR 1 cDR(m)l * VR VM = volume of water present in the core sample VR = volume of the reservoir CDR(-) = dimensionless residence concentration at equilibrium: CR / CO
(CR = reservoir concentration; CO = initial reservoir concentration)
f hen:
( P E ~ = V M / It ( 1 ~ ~ - 1 ~ ~ ) L L = length of core sample rL = radius of core sample rR = radius of reservoir VM = (s. above) value calculated with formula above
2) QEw calculated from GI 81 = CDR(m) [~DL' - 11 1 2 cDR(m)l
131 = dimensionless mixing coefficient of the reservoir: VR / (R * yR* rR) VR = volume of reservoir
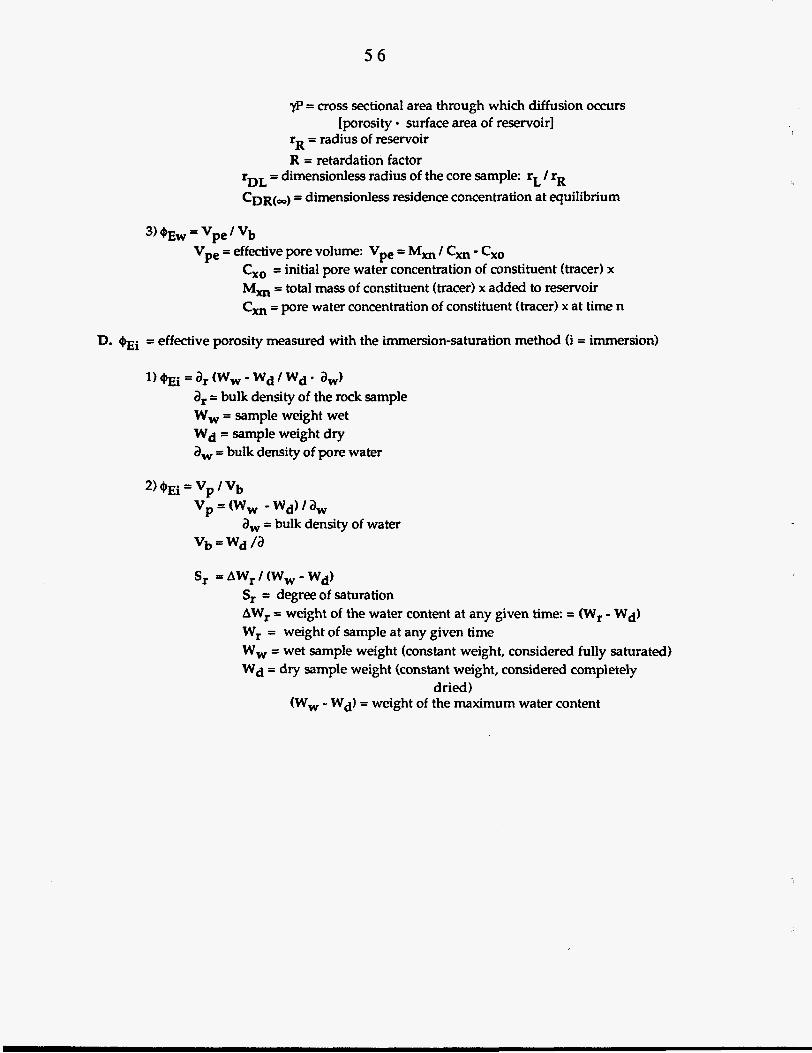
5 6
yFj = cross sectional area through which diffusion occurs
rR = radius of reservoir R = retardation factor
[porosity surface area of reservoir]
rDL = dimensionless radius of the core sample: rL / rR CDR(=) = dimensionless residence concentration at equilibrium
3) @E, = Vpe 1 v b Vpe = effective pore volume: Vpe = M, / C, - Cx0
Cx0 = initial pore water concentration of constituent (tracer) x M, = total mass of constituent (tracer) x added to reservoir C, = pore water concentration of constituent (tracer) x at time n
D. hi = effective porosity measured with the immersion-saturation method (i = immersion)
1) hi = a, (w,-wd/ wd a,) a, = bulk density of the rock sample W, = sample weight wet wd = sample weight dry a, = bulk density of pore water
Sr = AWr / (Ww - wd) S, = degree of saturation AW, = weight of the water content at any given time: = (Wr - Wd) Wr = weight of sample at any given time W, = wet sample weight (constant weight, considered fully saturated) Wd = dry sample weight (constant weight, considered completely
dried) (W, - wd) = weight of the maximum water content

5 7
Internal Distribution
1. Ashwood, T. L., 1505, M M 3 6 2. L. D. Bates, 1001, MS-7169 3. F. P. Baxter, 3504, MS-6317 4. D. M. Borders, 1509, MS-6400 5. H. L. Boston, 4500-N, MS-6200 6. H. M. Braunstein, 130MIT, MS-6282 7. A. J. Caldanaro, 1509, MS-6400 8. J. B. Cannon, 4500-N, MS-6189 9. R. B. Qapp, 1509, M W 0 0 10. K. W. Cook, 1330, MS-7298 11. T. L. Cothron, C-72 12. N. H. Cutshall, C207, MS-7172 13. J. H. Cushman, 1059, MS-6422 14. M. F. P. DeLozier, 1037, MS-7355 15. A. F. Diefendorf, 1509, MS-6400 16. W. E. Doll, 1509, MS-6400 17 - 21. J. Dorsch, 1509, MS-6400 22. R. B. Dreier, 1509, MS-6400 23. T. 0. Early, 1509, MS-6400 24. T. A. Fontaine, 1505, MS-6028 25. J. M. Forstrom, 0303-8, MS-7314 26. C. W. Francis, 3504, MS-6317 27. D. W. Frazier, 4500-N, MS-6198 28. B. J. Frederick, 4500-N, MS-6204 29. D. E. Fowler, 1505, MS-6035 30. S. B. Garland, 11,7078-B, MS6402 31. C. W. Gehrs, 1505,6036 32. P. L. Goddard, 1330, MS-7298
34. C. S. Haase, 1330, MS-7298 35. R. D. Hatcher, Jr., 1509, MS-6400 36. D. S. Hicks, 1505,6036 37. S. G. Hildebrand, 1505, MS-6037 38. Lucius Holder, Jr., 3001, MS-6029 39. D. D. Huff, 1509, MS-6400 40. G. K. Jacobs, 1505, MS-6036 41. W. K. Jago, 9207, MS-8225 42. B. R. James, 1509, MS-6400 43. P. M. Jardine, 1505, MS-6038
33. J.-P. GWO, 4500-N, MS-6203
44. S. B. Jones, 9207, MS-8225 45. P. Kanciruk, 0907, MS-6490 46. R. H. Ketelle, 4500N, MS-6185 47. B. L. Kimmel, 45004, MS-6125 48. A. J. Kuhaida, 7078-B, MS-6402 49. R. R. Lee, 4500-N, MS-6185 50. S. Y. Lee, 1505, Ms6038 51. P. J. Lemiszki, 1509, MS-6400 52. R. S. Loffman, 45004, MS-6102 53. R. J. Luxmoore, 1505, MS-6038 54. J. F. McCarthy, 1505, MS-6036 55. L. W. McMahon, 9116, MS-8098 56. G. R. Moline, 1509, MS-6400 57. C. M. Momssey, 1505, MS-6035 58. P. J. Mulholland, 1505, MS-6036 59. J. B. Murphy, 4500-N, MS-6198 60. C. E. Nix, 6026-C, MS-6395
62. J. E. Nyquist, 1509, MS-6400 63. F. S. Patton, Jr., 1001-B, MS-7169 64. T. hrucker, 105MIT, MS-6452 65. D. E. Reichle, 4500-N, MS-6253 66. C. T. Rightmire, 1509, MS-6400 67. M. Rosenthal, 4500-N, MS-6241 68. T. H. Row, 4500-N, MS-6254 69. W. E. Sanford, 1509, MS-6400 70. F. E. Sharples, 1505, MS-6036 71. L. G. Ship, 0303-8, MS-7314 72. R. L. Siegrist, 1505, MS-6038 73. D. S. Shriner, 1505, MS-6038 74. E. D. Smith, 1505, Ms-6038 75. B. P. Spalding, 1505, MS-6036 76. S. H. Stow, 1505, MS-6035 77. M. F. Tardiff, 4500-N, MS-6198 78. L. E. Toran, 1509, MS-6400 79. J. R. Trabalka, 3047, MS-6020 80. R. I. Van Hook, 4500-N, MS-6241 81. J. C. Wang, 4500-N, MS-6185 82. D. R. Watkins, 3504, MS-6317
61. M. J. NOIT~S, 9983-AH, MS-8247

5 8
83 - 87. D. B. Watson, 1509, MS-4400 88. 0. R. West, 1505, MS6036 89. R. K. White, 1330, MS-7298 90. S. L. Winters, 1509, Ms-6400 91. T. F. Zondlo, 1509, MS-6400 92 - 96. ESD Library
97. Central Research Library 98. ORNL-Y-12 Technical Library 99 - 100. .Laboratory Records Dept. 101. Laboratory Records, ORNL-RC 102. ORNL Patent Office
External Distribution
103. Jerry Archer, Geraghty & Miller Inc., 97 Midway Lane, Oak Ridge, TN 37830
104. Richard Amseth, SAIC, 301 Laboratory Rd., Oak Ridge, TN 37830
105. Ernest Beauchamp, C-260 Jackson Plaza, MS-7614, R13, Oak Ridge, TN 37830
106. Robert Benfield, TDEC/DOE Oversight, 761 Emory Valley Rd., Oak Ridge, TN 37830
107. G. W. Bodenstein, USDOE-OR Federal Bldg., Oak Ridge, TN 37830
108. Paul Craig, Environmental Consulting Engineers, P.O. Box 22668, Knoxville, TN 37933
109. S. N. Davis, 6540 Box Canyon Drive, Tucson, AZ 85745
110. Director, Center for Management, Utilization, and Protection of Water Resources, Tennessee Technological University, P.O. Box 5082, Cookeville, TN 38505
111. S. G. Driese, Department of Geological Sciences, University of Tennessee, Knoxville, TN 37996
112. B. E. Dugan, Department of Civil and Mineral Engineering, University of Minnesota,
113. R. N. Farvolden, Waterloo Center for Groundwater Research, University of Waterloo,
114. J. F. Franklin, College of Forest Resources, Anderson Hall AR-10, University of
115. P. M. Goldstrand, Department of Geological Sciences, MS-172, University of Nevada,
Minneapolis, MN 55455
Waterloo, Ontario N2L-361, CANADA
Washington, Seattle, WA 98185
Reno, NV 89557
116. Jim Harless, TDEC/DOE Oversight, 761 Emory Valley Rd., Oak Ridge, TN 37830
117. R. C. Harriss, Institute for the Study of Earth, Oceans, and Space, University of New Hampshire, Durham, NH 03824
118. P. HoffmaM, Department of Energy
119. G. M. Hornberger, Dept. of Environmental Sciences, University of Virginia, Charlottesville, VA 22903

5 9
f
L
I
120. G. Y. Jordy, Office of Program Analysis, Office of Energy Research, ER-30, G-226, USDOE,
121. H. E. Julian, TVA Engineering Laboratory, P.O. Drawer E, Noms, TN 37828
122. T. J. Katsube, Geological Survey of Canada, Mineral Resources Division, 601 Booth Street,
Washington, D.C. 20545
Ottawa, Ontario, CANADA KIA OE8
123. 0. C. Kopp, Department of Geological Sciences, University of Tennessee, Knoxville, TN 37996
124. P. E. Lamoreaux & Assoc. Inc., P.O. Box 2310, Tuscaloosa, AL 35403
125. Changsheng Lu, Jacobs ER Team, 125 Broadway Ave. Oak Ridge, TN 37830
126. L. D. McKay, Department of Geological Sciences, University of Tennessee, Knoxville, TN
127. W. M. McMaster, 1400 West Racoon Valley Rd.
128. Manager, CH2M Hill, 599 Oak Ridge Turnpike, Oak Ridge, TN 37830
129. Manager, HSW Environmental Consultants, 687 Emory Valley Rd., Oak Rdge, TN 37830
130. Manager, Radian/Lee Wan Assoc., 120 South Jefferson Circle, Oak Ridge, TN 37830
37996
131. Manager, Systematic Management Services, 673 Emory Valley Rd., Oak Ridge, TN 37830
132. G. K. Moore, Route 4, Box 927, Waynesboro, TN 38485
133. Ronit Nativ, Dept. of Soil and Water Sci., Faculty of Agriculture, Hebrew University of Jerusalem, P.O. Box 12, Rehovot 76100, ISRAEL
134. M. J. Neton, Geologic & Environmental Services, 701 Cherokee Blvd., Suite G, Chattanooga, TN 37405
135. Chudi Nwangwa, TDEC/DOE Oversight, 761 Emory Valley Rd., Oak Ridge, TN 37830
136. R. H. Olsen, Microbiology & Immunology Dept., University of Michigan, Medical Sciences 11, #5605,1301 East Catherine St., Ann Arbor, MI 48109-0620
137. A. Patrinos, Environmental Sciences Division, Office of Health & Environmental
138. R Pawlowicz, Bechtel, 151 Lafayette Dr. Oak Ridge, TN 37830
Research, ER-74, USDOE, Washington, D.C. 20585
139. W. K. Puff, Dames and Moore, 575 Oak Ridge Turnpike, Oak Ridge, TN 37830
140. J. F. Quinlan, Quinlan and Assoc., P.O. Box 110539, Nashville, TN 37222
141. E Quinones, Chief, Tennessee District, WRD, U.S. Geological Survey, 810 Broadway, Suite 500, Nashville, TN 37203
142. G. D. Reed, Dept. of Civil Engineering, University of Tennessee, 62 Perkins Hall, Knoxville, TN 37996-2010
143. D. Shults, Tennessee Dept. of Environment and Conservation, Div. of Radiological Health,
144. W. C. Sidle, Environmental Protection Division, USDOE-OR, P.O. Box 2001, Oak Ridge,
TERRA Bldg., 150 Ninth Ave. North, Nashville, TN 37243-1532
TN 37831-8739

6 0
145. J. Smoot, Dept. of Civil Engineering, University of Tennessee, 62 Perkins Hall, Knoxville,
146. D. K. Solomon, 2381 Beacon Drive, Salt Lake City, Utah 84108
TN 37996-2010
147. F. J. Wobber, Environmental Sciences Division, Office of Health & Environmental Research, Office of Energy Research, ER-74, USDOE, Washington, D.C. 20585
148. J. Young, Camp Dresser & McGee, Suite 500,800 Oak Ridge Turnpike, Oak Ridge, TN 37830
149. S. C. Young, Environmental Consulting Engineers, P. 0. Box 22668, Knoxville, TN 37933
150. Office of Assistant Manager for Energy Research & Development, USDOE-OR, P.O. Box
151 - 153. Office of Scientific & Technical Information, P.O. Box 62, Oak Ridge, TN 37831
2001, Oak Ridge, TN 37831-8600