determinants of private savings in turkeymeea.sites.luc.edu/volume14/pdfs/saving study_v_eas… ·...
TRANSCRIPT
Topics in Middle Eastern and African Economies
Vol. 14, September 2012
102
DETERMINANTS OF PRIVATE SAVINGS AND INTERACTION
BETWEEN PUBLIC & PRIVATE SAVINGS IN TURKEY
Eser Pirgan Matur
Ali Sabuncu Sema Bahçeci
General Directorate of Economic Modeling and Strategic Research, T.R. Ministry of Development
JEL classification: E20, E21, E23
Topics in Middle Eastern and African Economies
Vol. 14, September 2012
103
1. Introduction
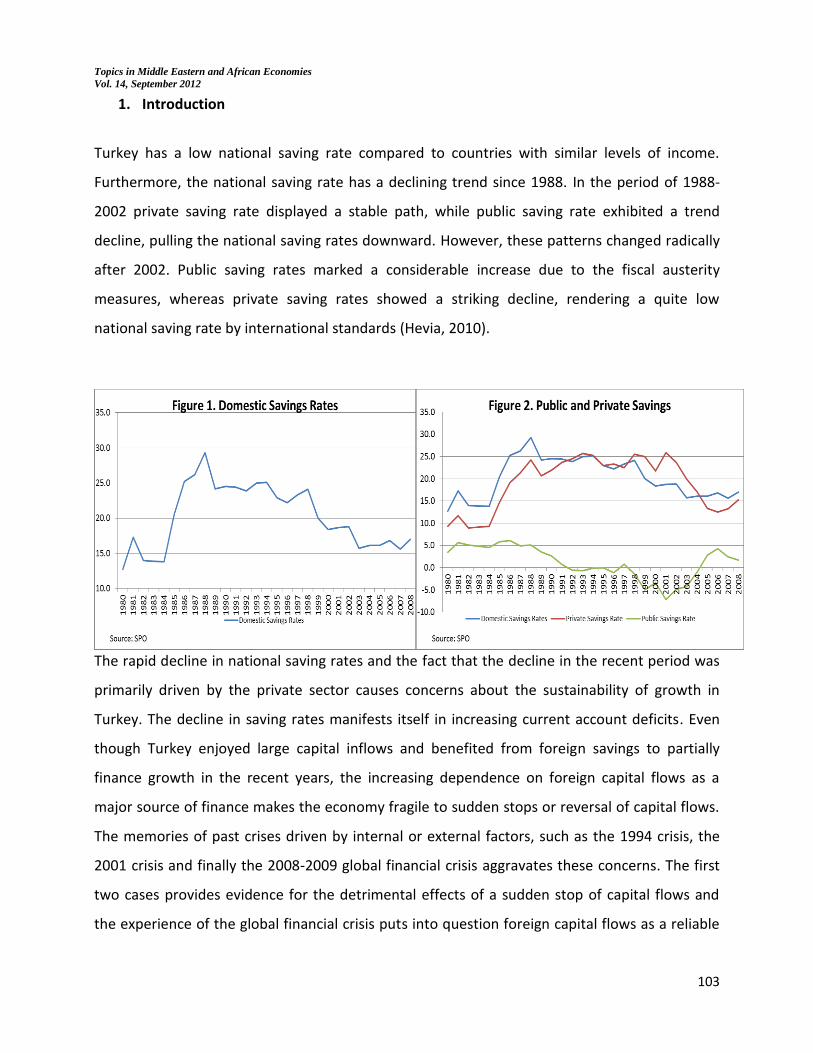
Turkey has a low national saving rate compared to countries with similar levels of income.
Furthermore, the national saving rate has a declining trend since 1988. In the period of 1988-
2002 private saving rate displayed a stable path, while public saving rate exhibited a trend
decline, pulling the national saving rates downward. However, these patterns changed radically
after 2002. Public saving rates marked a considerable increase due to the fiscal austerity
measures, whereas private saving rates showed a striking decline, rendering a quite low
national saving rate by international standards (Hevia, 2010).
The rapid decline in national saving rates and the fact that the decline in the recent period was
primarily driven by the private sector causes concerns about the sustainability of growth in
Turkey. The decline in saving rates manifests itself in increasing current account deficits. Even
though Turkey enjoyed large capital inflows and benefited from foreign savings to partially
finance growth in the recent years, the increasing dependence on foreign capital flows as a
major source of finance makes the economy fragile to sudden stops or reversal of capital flows.
The memories of past crises driven by internal or external factors, such as the 1994 crisis, the
2001 crisis and finally the 2008-2009 global financial crisis aggravates these concerns. The first
two cases provides evidence for the detrimental effects of a sudden stop of capital flows and
the experience of the global financial crisis puts into question foreign capital flows as a reliable

Topics in Middle Eastern and African Economies
Vol. 14, September 2012
104
and stable source of finance. All of these experiences underline the importance of national
savings.
Therefore, understanding the dynamics behind savings and the possible policy options to
increase the national savings rate is of interest both to researchers and policy makers.
The purpose of this paper is first to identify the policy and non-policy determinants of private
savings rates in the Turkish economy by using new saving data series for 1980-2008 period
produced by SPO. Then, the interaction between public and private savings will be investigated
in order to determine potential fiscal policy options to increase domestic savings in Turkey.
The theoretical and empirical literature on savings is quite comprehensive. While part of the
empirical literature focuses on cross-country analysis, the rest of the related literature focuses
on country-specific characteristics. Cross-country analyses generally rely on macro data sets to
identify the dynamics of savings, whereas at the country level it is possible to encounter studies
that utilize either household level data or macro data.
Loayza, Schmidt-Hebbel and Serven (2000), which uses a very large country data set, provides
one of the most comprehensive framework for the analysis of savings and it was used as the
departure point of the empirical analysis of private savings in this paper. Özcan-Günay-Ertaç
(2003), IMF (2007) and Van Rijckeghem (2010) also have findings relevant for the discussion
regarding the interaction between private savings and fiscal variables in the Turkish case. Our
work improves on previous studies with a new data set and a larger time-span.
The next section briefly reviews consumption theories and potential determinants of private
savings in Turkey. Section 3 discusses the data and estimation results for the benchmark model.
Section 4 elaborates the interaction between fiscal policy and private savings. Section 5
summarizes the concluding remarks.
Topics in Middle Eastern and African Economies
Vol. 14, September 2012
105
2. Determinants of Private Savings in Turkey
Saving can be defined as part of disposable income that is not allocated to consumption.
Therefore consumption and saving decisions of economic agents in one period are
simultaneously taken. Economic agents intend to increase their utility through their
consumption decisions. However, usually they do not only focus on consumption today, but also
on their future consumption. Therefore, the consumption decisions of economic agents are
taken in an intertemporal framework and they are dynamically linked. Savings of individuals
help them shift resources between different periods of their life-time in order to smooth their
consumption path. This implies that savings are also determined in an intertemporal framework
and can be regarded as deferred consumption.
The saving decisions of rational agents are, therefore, expected to reflect the forward looking
intertemporal utility maximization. Private agents consider their whole life span or planning
horizon, their wealth and expected incomes in each period, relative prices in the economy, their
preferences and how they value consumption in different periods and decide on how much to
consume/save from their contemporaneous income. This framework broadly defines the
essential setup of Life Cycle Hypothesis developed by Irving Fisher, Roy Harrod, Albert
Ando and Franco Modigliani. This hypothesis has intensively been referred in the analysis of
consumption and saving patterns and implies that unconstrained individuals consume a
constant percentage of the present value of their life time income, due to the consumption
smoothing motive.
Even though the Life Cycle Hypothesis does not explain consumption behavior to full extent,
most of the more contemporaneous theories of consumption share its essence, i.e.
consumption decisions are regarded in an intertemporal framework and consumption
smoothing surfaces as an important motive. Therefore, in this paper, we don’t rely on a
structural model of consumption/saving decisions, but rather we follow an empirical approach
using a reduced form model for savings. This allows us to include several important potential
determinants of savings proposed by different theories.
Topics in Middle Eastern and African Economies
Vol. 14, September 2012
106
Given the intertemporal framework of consumption/saving decisions, saving behavior is
potentially influenced by several factors. These factors are roughly grouped as income and
growth variables, demographic variables, financial variables, uncertainty variables and
government policy variables (Loayza, Schmit-Hebbel and Serven (2000), Ozcan, Gunay, and Ertac
(2003)). In order to analyze the significance of potential determinants and their partial impact
on Turkish private savings, several policy and non-policy variables are chosen from each group
in the empirical specification to be explained later. Before the account of empirical specification
and estimation results, a brief explanation of the mechanisms through which the factors in each
group may affect the private savings will be provided.
Income and Growth Variables:
The subsistence-consumption theories suggest that the higher per capita disposable income
leads to higher saving rate. According to this view, a lower level of income is associated with a
higher marginal propensity to consume at the household level and implies low saving rates at
the national level. As the level of per capita income increases in an economy, the possibilities for
savings increase. Indeed, several empirical studies indicate that countries with higher income
level tend to have higher saving rates.
However, regarding the effect of income growth on saving rate, there is no consensus in
economic theory. According to life-cycle hypothesis, an increase in income growth would
increase aggregate savings through increasing the savings of people that participate in the labor
force compared to the dissavings of people who are out of the labor force. On the other hand,
according to permanent income hypothesis an increase in income growth would lead to an
increase in future and permanent income expectation and impel consumption today.
Competing theories of consumption has different expectations regarding the impact of income
growth on savings and therefore, this impact is much more an empirical question in this regard.
Demographic Variables:
Topics in Middle Eastern and African Economies
Vol. 14, September 2012
107
The age distribution of the population, dependency ratios, life expectancy, labor force
participation rate and urbanization rate are some of the variables commonly investigated in
saving analysis. Private agents will arrange their saving patterns across different periods of their
life. Changes in life expectancy would also influence the saving decisions as it may change the
relative spans of active working and non-working periods. The higher percentage of elder
people in a population would normally decrease the saving rate as they are not part of the
active labor force anymore and represent the part of the population that is expected to finance
their consumption out of their past savings (part of the population that are expected to
dissave). On the other hand, the higher young dependency ratio may have dual effects on saving
and consumption behavior. It may increase the consumption of families for child care and force
families to save for the future expenses of their kids such as their education.
Labor force participation rate reflects the active part of the population and therefore is
expected to increase savings. In the Turkish case we focus particularly on female labor force
participation rate as this variable is very low compared to other countries and has a potential to
increase. Urbanization ratio can affect the saving behavior through the precautionary saving
behavior. Increased urbanization is expected to decrease the requirement for precautionary
savings which is more relevant in rural areas since rural population is relatively more prone to
income volatility.
Financial Variables:
One of the most important financial variables relevant for saving behavior is the real interest
rate. However, it has theoretically ambiguous impact on savings due to opposing substitution
and income effects associated with a change in the real interest rate. Firstly, an increase in real
interest rates reduces the present value of future income flows and therefore has a negative
impact on savings (income effect). However, at the same time it increases the net return on
savings and makes savings more attractive today. In other words, it leads to a postponement of
consumption and has a positive impact on savings (substitution effect). Therefore, the net
Topics in Middle Eastern and African Economies
Vol. 14, September 2012
108
impact of real interest rates is determined by the relative strength of these two opposing effects
and is an empirical question.
The degree of development of the financial sector also has important implications for savings.
The depth of the financial sector, diversity of financial instruments available for savings, and the
efficiency of the financial sector are important factors that are expected to have a positive
impact on savings. In this paper the depth of the financial sector is proxied by the relative size of
broad money compared to GDP.
However, the development of the financial sector also has an expected negative impact on
savings. As the financial sector develops, the liquidity and borrowing constraints faced by agents
in the economy are relaxed. It becomes easier to use external finance in order to shift resources
between different periods. The immediate impact of this opportunity is to reduce savings. The
liquidity and borrowing constraints in an economy are usually measured by the availability of
credits and therefore an increase in the relative size of credits, which represents the relaxation
of the liquidity constraints, is expected to have a negative impact on savings.
Uncertainty Variables:
Uncertainty and risks about the future give rise to precautionary saving motives for risk-averse
agents. In order to safeguard against future unexpected negative income shocks, individuals
prefer saving today. Since the instability of the economy is synonymous to more frequent
income shocks, it exacerbates the saving motive. Instability in an economy may be proxied by
several variables including growth volatility, real exchange rate volatility, real interest rate
volatility and inflation. In this paper, we use the inflation rate as a proxy for the instability of
the economy and expect this variable to have a positive impact on savings.
Government Policy Variables:
Public savings are part of the overall savings in an economy and together with private savings
constitute national savings. Besides its direct impact on savings due to this identity, it also
Topics in Middle Eastern and African Economies
Vol. 14, September 2012
109
affects the private savings, since public savings has a direct bearing on private disposable
income.
In addition to the public saving rate, details and characteristics of taxation and other
government policies are also relevant for private savings. In this paper we intend to focus
particularly on some government policy variables as potential influential factors for private
savings. A more detailed exposition of the interplay between government policies and private
savings will follow in further sections of the paper.
3. Data and Estimation Results
In this paper, we estimate a reduced form model for savings in order to identify the relevant
explanatory variables for private savings in the Turkish case. This allows us to include several
important potential determinants of savings.
Explanatory variables considered in the analysis are as follows1:
Public saving rate,
Per capita real income,
Growth rate of per capita real income,
Inflation,
Real exchange rate,
The ratio of banking credits to the private sector to GDP,
The ratio of broad monetary base to GDP,
Real interest rates,
Old dependency ratio,
Young dependency ratio,
Urbanization rate,
Female labor force participation rate.
1 The definitions and sources of the data are explained in the Appendix.
Topics in Middle Eastern and African Economies
Vol. 14, September 2012
110
The sample period used in the estimation is 1980-2008, since 1980s mark a dramatic structural
change in Turkish economy. Starting from 1980s, Turkey moves from a relatively closed
economy setting to an open economy environment. Basically, the trade regime undergoes a
dramatic change; Turkey moves from an import substituting industrialization strategy to an
export oriented growth period and the restrictions in the domestic financial system, such as
interest rate ceilings are removed gradually in the same period. We consider that these changes
mark a regime shift with an impact on the determination of private savings and therefore do our
analysis for the post-1980 period2.
Majority of the variables we propose as potential determinants of private savings in Turkey are
I(1) variables, the results of the unit root tests are provided in the Appendix. Given the fact that
we don’t work with stationary data, our strategy for estimation can be described as follows:
First, we estimate a full version of the model using the level (or log level) of the proposed
variables. Then, we reduce the model eliminating the variables which are not statistically
significant in the full version to ensure that possible interactions between explanatory variables
do not distort the estimated coefficients. We obtain our benchmark model at the end of this
process (Equation 1 in Table 1). The benchmark model uses ex-ante real interest rates (nominal
interest rates deflated by inflation at the same period) as a determinant of private saving
decisions. In order to see the impact of different conceptions of real interest rates, we also
estimate the benchmark model with a more forward looking interest rate measure (nominal
interest rates deflated by the average inflation of the same period and the one-step-ahead
inflation rate) (Equation 1* in Table 1).
2 It could even be possible to restrict the sample to post-1989, which corresponds to capital account liberalization
for Turkey, since financial liberalization increases the possibilities for using foreign savings to finance investment
and growth. However, due to the limitation of working with annual data, we preferred to have a longer sample
period.

Topics in Middle Eastern and African Economies
Vol. 14, September 2012
111
The full model verify our theoretical expectations, however there are many variables with
statistically insignificant coefficients. The step-wise exclusion of insignificant variables yields the
following benchmark model:
Private Saving Rate = -0.96 – 0.38 (Public Saving Rate) +0.21(Per capita Income) -0.15(Per capita
Income Growth) +0.04(Inflation) -0.37(Private Credit/GDP) +0.15(Real Interest Rate) –4.64(Old
Dependency Rate)
The results of the benchmark model verify our theoretical expectations:
Public saving rate has a negative impact on private savings, i.e. increases in public
savings are partially offset by a fall in private savings. This part is discussed in detail in
the following section.
Per capita real income has a positive and statistically significant relation with private
savings.
Growth of per capita income has a negative impact in line with the expectations of
permanent income hypothesis and intertemporal theories of consumption.
Inflation, which represents uncertainty in our model, has a positive impact on savings
due to precautionary saving motives.
An increase in the banking credits to the private sector indicates the relaxation of
liquidity constraints of individuals and therefore has a negative impact on savings.
Considering the real interest rates, we observe that the positive substitution effect
outweighs the negative income effect in the case of Turkey and real interest rate has a
positive impact on private savings.
Old dependency ratio has a negative impact on private savings as expected.
In order to test for a relevant long run relationship between the above variables, we also test
for the stationarity of the error term of our benchmark model and find that the error term is
stationary at 99 percent confidence level. The result of the unit root test is given in the
Appendix.

Topics in Middle Eastern and African Economies
Vol. 14, September 2012
112
In order to further strengthen the statistical relevance of our results, we also undertake a
cointegration analysis considering the benchmark model and these results also indicate that
there is cointegration between our variables. The results of the Johansen cointegration tests for
the benchmark model and model 1* are given in the Appendix.
4. Interaction Between Public and Private Savings
One of the main aims of this study is to identify the interaction between public and private
savings in Turkey.
A specific version of the intertemporal theories of consumption comes up with the idea of a
complementary relationship between private and public savings. If the households give their
consumption decisions in an intertemporal framework where they try to maximize their life-
time utility under the life-time budget constraint and there is no impediment to shifting their
resources between periods during their life-time (like borrowing constraints etc.), the
consumption decision taken today will only be affected by factors that change the life-time
budget constraint of the household (assuming no shocks to preferences). If these agents are
rational, they internalize the actions of the government in their budget constraint. In this case,
changes in fiscal policy, such as increasing/decreasing tax rates today will imply higher/lower
debt levels in the future and an accompanying tax increase/decrease to repay existing debt.
Under this setting, the discounted value of future taxes will not change and will not have an
impact on the life-time budget constraint of households, leaving their consumption decisions
intact today.
The fact that consumption is not affected by changes in taxes (or government saving) implies
that private savings (disposable income minus net taxes minus private consumption) reduces
exactly by the same amount as the change in government savings. This suggests that there is
one-to-one negative relationship between private and public savings, which is called full
Ricardian equivalence. However, the underlying assumptions of full Ricardian equivalence are
Topics in Middle Eastern and African Economies
Vol. 14, September 2012
113
very restrictive and are usually not satisfied in practice and it is rejected in most empirical
studies3. Even though there is very little support for full Ricardian equivalence, the degree of
relevance of this proposition is of interest to policy makers.
In international studies covering different developed and developing countries with different
time spans, the estimated Ricardian offset coefficients lie in a wide range. Lopez, Hebbel and
Serven (2000) reports a range between -0.35 and -0.77. In empirical estimations for Turkey, the
Ricardian offset coefficients also range between -0.42 and -0.774. In this exercise, we come up
with a Ricardian offset coefficient between -0.38 and -0.58, which is on the lower side of
previous estimations for Turkey. The estimation results indicate that there might be some room
for increasing national savings through increasing public savings in Turkey. However, it should
be noted that increasing public savings might have its own costs if it is achieved through
reducing productive expenditures of the government.
Having identified public savings as one of the important determinants of private savings, we can
consider the direct impact of different fiscal policy tools. We perform two types of experiments
in this regard. In the first experiment, we remove public saving from our benchmark model and
try to see the impact of different policy tools one at a time. These results are given in Table 1.
The results indicate that increasing taxes on goods and services have a positive impact on
private savings. The increase in taxes penalizes/discourages consumption through increasing the
effective price of consumption goods, leading to an increase in the private saving rate. Similarly,
the impact of an increase in the ratio of total tax revenues also has a positive impact on private
savings. We think that this result is closely related with the fact that taxes on goods and services
have a very high share in total tax revenues in Turkey (around 60 per cent in recent years).
However, when these results are considered from a policy perspective, they don’t offer much
3 See Corbo and Schmidt-Hebbel (1991) for a detailed literature survey.
4 Caroline Van Rijckeghem (2010) finds an offset coefficient of -0.63 in her key specification; Metin Özcan, Günay,
Ertaç (2003) finds an offset coefficient between -0.42 and -0.656; IMF (2007) finds an offset coefficient between -
0.72 and -0.77.
Topics in Middle Eastern and African Economies
Vol. 14, September 2012
114
room for a policy intervention to increase private savings given the already very high share of
indirect taxes in total tax revenues.
Another important fiscal variable is the ratio of social security premiums. Social security
premiums can be considered as involuntary savings as registration in the social security system
is obligatory in Turkey. On one hand an increase in the ratio of social security premiums might
cause a shift from private saving accounts to public saving accounts. However, given that the
ratio of informality is very high in Turkey, even though registration in the social security system
is obligatory, an increase in the ratio of social security premiums might also reflect an increase
in the importance given to pension systems by economic agents. Therefore, it might also reflect
a taste for longer term savings. In that case, we might expect a positive relationship between
the ratio of social security premiums and private savings. In the equation, the sign of the ratio of
social security premiums is positive, but it is statistically insignificant.
Another important expenditure item in the budget has been interest payment for many years in
Turkey. Throughout the 1990s real interest rates in Turkey increased to unsustainable levels and
the share of interest rate payments to GDP climbed to unacceptable levels. High real interest
rates and high transfers in the form of interest payments had an important impact on economic
decisions in Turkey for a quite long time period. For this reason, the impact of the ratio of
interest payments to GDP is also important, even though it is not a direct policy variable for
governments at a given point in time. From our empirical results, we observe that the ratio of
interest payments has a positive and statistically significant relation with the ratio of private
savings in Turkey. When we further disaggregate interest payments as domestic interest
payments and foreign interest payments, we observe that this positive and significant
relationship can be attributed to domestic interest payments and that foreign interest payments
have no significant impact on private savings, as expected.
If we compare the results of the benchmark model with model 6 and model 7 (where interest
payments and domestic interest payments are included), we can realize that the coefficient of
Topics in Middle Eastern and African Economies
Vol. 14, September 2012
115
the real interest rate variable is smaller for model 6 and 7. Since Turkey experienced a vicious
cycle of higher debt burden-higher interest payments-higher real interest rates in at least one
third of our sample period, the real interest rates and the ratio of interest payments to GDP
displays a similar pattern and the interest payment variable captures some part of the impact of
real interest rates. We can infer from these results that very high interest rates (and
accompanying high interest payments) creates a strong motive for private savings. This finding
can explain part of the rapid fall in private savings in recent years.
5. Concluding Remarks
When we consider all the findings regarding the relationship between fiscal variables and
private savings, we can claim that increasing public savings might create some room for
increasing national savings. However, increasing public savings can only be considered as a real
policy option as long as the extra saving in the public sector comes from unproductive
expenditures. Productive expenditures, which support future growth, can not be considered as
a good source for increasing savings, since the development level of a country (the level of per
capita income) plays a very important role for savings. On the other hand, increasing indirect
taxes does not seem to be a feasible tool given the very high share of indirect taxes in tax
revenues in Turkey.
All in all, fiscal policy in Turkey does not have a very promising role for increasing savings. This
finding is in line with previous studies which find that the ability of policy to affect the private
saving rate is limited in Turkey (Caroline Van Rijckeghem, 2010). Previously, tools such as debt
tax and interest taxation have been proposed as relevant fiscal policy options to increase private
savings (Caroline Van Rijckeghem, 2010).
Even though fiscal policy does not seem to have a large room to influence private savings, it
should be underlined that it might have a very important role to play in supporting the growth
process. Higher growth might lead to a reduction of savings in the short run; however increases

Topics in Middle Eastern and African Economies
Vol. 14, September 2012
116
in the level of income will pay in the longer term in terms of savings. Given the argument that
higher growth precedes higher savings and countries that undergo growth transitions do end up
with permanently higher saving rates (Gavin, Hausmann and Talvi, 1997; Rodrik, 2000), the
policy should focus on removing the impediments to growth and reducing the vulnerability
resulting from low savings during the transition period. In order to reduce the vulnerability
associated with excessive dependence on external finance, other areas of macroeconomic
policy like monetary and exchange rate policy might have a role to play.
Topics in Middle Eastern and African Economies
Vol. 14, September 2012
117
REFERENCES
Corbo V. and Schmidt-Hebbel K. (1991), “Public Policies and Saving in Developing Countries”, Journal of Development Economics, 36, pp. 89-115.
Gavin, M, Hausmann, R. and Talvi, E. (1997), “Saving behavior in Latin America: Overview and Policy Issues”, Inter-American Development Bank, W.P. 346.
Hevia, Constantino (May 2010), “Saving in Turkey: An International Comparison” Paper presented at the World Bank Workshop on Country Economic Memorandum on Savings and Growth.
IMF (November 2007), “ Safe to Save Less? Assessing the Recent Decline in Turkey’s Private Saving Rate“, Turkey: Selected Issues IMF Country Report No. 07/364.
Loayza, Norman, Klaus Schmit-Hebbel, and Luis Serven (2000), “Saving in Developing Countries: An Overview,” World Bank Economic Review, Vol.14 (No.3), pp.393-414.
Lopez, Hebbel and Serven (2000), “How Effective is Fiscal Policy in Raising National Saving?”, The Review of Economics and Statistics, 82(2), pp. 226-238.
Ozcan, K.M., Gunay, A.M. and Ertac, S. (2003), “Determinants of Private Saving Behavior in Turkey” Applied Economics, 35, pp 1405-16.
Rodrik, Dani (2000), “Saving Transitions”, The World Bank Economic Review, Vol.14, no:3, pp.481-507.
Van Rijckeghem C. (2010), “Determinants of Private Saving in Turkey: an Update”, manuscript.

Topics in Middle Eastern and African Economies
Vol. 14, September 2012
118
Table 1. Determination of Private Savings and Relation with Fiscal Variables-I
Full 1 1* 2 3 4
Constant 0.084247 (0.9722)
-0.964908 (0.0077)
-0.659300 (0.0356)
-0.255215 (0.5905)
-0.807578 (0.0445)
-0.805561 (0.0432)
Public Saving Rate -0.375580 (0.3497)
-0.382620 (0.0685)
-0.577872 (0.0056)
Per Capita Real Disposable Income
0.363412 (0.0766)
0.211057 (0.0001)
0.181960 (0.0002)
0.109853 (0.1040)
0.180057 (0.0019)
0.179947 (0.0017)
Per Capita Real D. Income Growth Rate
-0.105872 (0.2700)
-0.150054 (0.0551)
-0.093777 (0.2292)
-0.148486 (0.0398)
-0.199182 (0.0257)
-0.199043 (0.0270)
Inflation 0.026754 (0.1391)
0.037305 (0.0002)
0.026321 (0.0018)
0.055220 (0.0000)
0.053067 (0.0000)
0.052446 (0.0000)
Banking Credits to Private Sector/ GDP
-0.443724 (0.0406)
-0.373262 (0.0047)
-0.244229 (0.0234)
-0.210978 (0.1068)
-0.398192 (0.0004)
-0.394779 (0.0004)
Real Interest Rate 0.124462 (0.1799)
0.149911 (0.0074)
0.112257 (0.0162)
0.138458 (0.0002)
0.172456 (0.0001)
0.173222 (0.0002)
Old Dependency Ratio
-9.789768 (0.0829)
-4.644540 (0.0000)
-5.793699 (0.0000)
-8.600438 (0.0000)
-5.396133 (0.0006)
-5.334212 (0.0006)
Real Exchange Rate -0.051354 (0.3376)
M2Y / GDP 0.151964 (0.4719)
Young Dependency Ratio
-0.982400 (0.4603)
Urbanization Rate -1.663951 (0.3354)
Female Labor Force Participation Ratio
0.231073 (0.2674)
Total Tax / GDP
1.586410 (0.0048)
Indirect Tax / GDP 0.825925 (0.0655)
Tax on Goods / GDP 0.841432 (0.0690)
Social Security Premiums / GDP
Interest Payments / GDP
Domestic Int. P. /GDP
Foreign Int. P. /GDP
Observations 29 29 29 29 29 29
R2 0.930884 0.925285 0.917573 0.942373 0.923954 0.923446
Adj-R2 0.879047 0.900380 0.890097 0.923164 0.898606 0.897928

Topics in Middle Eastern and African Economies
Vol. 14, September 2012
119
Table 1. Determination of Private Savings and Relation with Fiscal Variables-I (Continued)
Full 1 5 6 7 8
Constant 0.084247 (0.9722)
-0.964908 (0.0077)
-1.225451 (0.0009)
-0.787638 (0.0259)
-0.713071 (0.0396)
-1.373275 (0.0000)
Public Saving Rate -0.375580 (0.3497)
-0.382620 (0.0685)
Per Capita Real Disposable Income
0.363412 (0.0766)
0.211057 (0.0001)
0.233134 (0.0002)
0.188785 (0.0002)
0.182915 (0.0002)
0.251691 (0.0000)
Per Capita Real D. Income Growth Rate
-0.105872 (0.2700)
-0.150054 (0.0551)
-0.174441 (0.0421)
-0.150936 (0.0433)
-0.151262 (0.0366)
-0.177429 (0.0627)
Inflation 0.026754 (0.1391)
0.037305 (0.0002)
0.053100 (0.0000)
0.035812 (0.0001)
0.033440 (0.0003)
0.050475 (0.0000)
Banking Credits to Private Sector/ GDP
-0.443724 (0.0406)
-0.373262 (0.0047)
-0.519869 (0.0000)
-0.253032 (0.0582)
-0.233693 (0.0684)
-0.490337 (0.0014)
Real Interest Rate 0.124462 (0.1799)
0.149911 (0.0074)
0.195192 (0.0005)
0.105566 (0.0537)
0.098781 (0.0656)
0.176321 (0.0056)
Old Dependency Ratio
-9.789768 (0.0829)
-4.644540 (0.0000)
-3.951622 (0.0001)
-5.575233 (0.0001)
-5.939053 (0.0001)
-3.532414 (0.0001)
Real Exchange Rate -0.051354 (0.3376)
M2Y / GDP 0.151964 (0.4719)
Young Dependency Ratio
-0.982400 (0.4603)
Urbanization Rate -1.663951 (0.3354)
Female Labor Force Participation Ratio
0.231073 (0.2674)
Total Tax / GDP
Indirect Tax / GDP
Tax on Goods / GDP
Social Security Premiums / GDP
0.612880 (0.4540)
Interest Payments / GDP
0.478315 (0.0093)
Domestic Int. P. /GDP
0.550594 (0.0050)
Foreign Int. P. /GDP
1.403678 (0.5144)
Observations 29 29 29 29 29 29
R2 0.930884 0.925285 0.916313 0.933015 0.934862 0.917220
Adj-R2 0.879047 0.900380 0.888417 0.910687 0.913149 0.889626

Topics in Middle Eastern and African Economies
Vol. 14, September 2012
120
Table 2. Determination of Private Savings and Relation with Fiscal Variables-II
Full 1 1* 2a 3a 4a
Constant 0.084247 (0.9722)
-0.964908 (0.0077)
-0.659300 (0.0356)
-0.224022 (0.6454)
-0.573440 (0.1185)
-0.570031 (0.1107)
Public Saving Rate -0.375580 (0.3497)
-0.382620 (0.0685)
-0.577872 (0.0056)
-0.103605 (0.6996)
-0.309779 (0.1744)
-0.313790 (0.1665)
Per Capita Real Disposable Income
0.363412 (0.0766)
0.211057 (0.0001)
0.181960 (0.0002)
0.107449 (0.1232)
0.154875 (0.0034)
0.154627 (0.0026)
Per Capita Real D. Income Growth Rate
-0.105872 (0.2700)
-0.150054 (0.0551)
-0.093777 (0.2292)
-0.140003 (0.0532)
-0.161611 (0.0518)
-0.161011 (0.0541)
Inflation 0.026754 (0.1391)
0.037305 (0.0002)
0.026321 (0.0018)
0.051394 (0.0001)
0.042186 (0.0001)
0.041564 (0.0001)
Banking Credits to Private Sector/ GDP
-0.443724 (0.0406)
-0.373262 (0.0047)
-0.244229 (0.0234)
-0.188839 (0.1684)
-0.284851 (0.0114)
-0.281072 (0.0104)
Real Interest Rate 0.124462 (0.1799)
0.149911 (0.0074)
0.112257 (0.0162)
0.131289 (0.0014)
0.142568 (0.0025)
0.142805 (0.0027)
Old Dependency Ratio
-9.789768 (0.0829)
-4.644540 (0.0000)
-5.793699 (0.0000)
-8.448573 (0.0001)
-5.735748 (0.0002)
-5.689693 (0.0002)
Real Exchange Rate -0.051354 (0.3376)
M2Y / GDP 0.151964 (0.4719)
Young Dependency Ratio
-0.982400 (0.4603)
Urbanization Rate -1.663951 (0.3354)
Female Labor Force Participation Ratio
0.231073 (0.2674)
Total Tax / GDP
1.458202 (0.0414)
Indirect Tax / GDP
0.636149 (0.1617)
Tax on Goods / GDP
0.644016 (0.1685)
Social Security Premiums / GDP
Interest Payments / GDP
Domestic Int. P. /GDP
Foreign Int. P. /GDP
Observations 29 29 29 29 29 29
R2 0.930884 0.925285 0.917573 0.942950 0.930236 0.929911
Adj-R2 0.879047 0.900380 0.890097 0.920130 0.902330 0.901876

Topics in Middle Eastern and African Economies
Vol. 14, September 2012
121
Table 2. Determination of Private Savings and Relation with Fiscal Variables-II (Continued)
Full 1 5a 6a 7a 8a
Constant 0.084247 (0.9722)
-0.964908 (0.0077)
-1.037614 (0.0045)
-0.730786 (0.0482)
-0.687216 (0.0570)
-0.943293 (0.0127)
Public Saving Rate -0.375580 (0.3497)
-0.382620 (0.0685)
-0.426717 (0.1043)
-0.124218 (0.5976)
-0.072796 (0.7659)
-0.365591 (0.0748)
Per Capita Real Disposable Income
0.363412 (0.0766)
0.211057 (0.0001)
0.225320 (0.0003)
0.182150 (0.0007)
0.179654 (0.0006)
0.202480 (0.0009)
Per Capita Real D. Income Growth Rate
-0.105872 (0.2700)
-0.150054 (0.0551)
-0.157706 (0.0547)
-0.142748 (0.0620)
-0.146499 (0.0513)
-0.138907 (0.1260)
Inflation 0.026754 (0.1391)
0.037305 (0.0002)
0.033848 (0.0249)
0.033805 (0.0003)
0.032492 (0.0005)
0.038339 (0.0000)
Banking Credits to Private Sector/ GDP
-0.443724 (0.0406)
-0.373262 (0.0047)
-0.375843 (0.0062)
-0.237688 (0.0891)
-0.226839 (0.0904)
-0.331282 (0.0524)
Real Interest Rate 0.124462 (0.1799)
0.149911 (0.0074)
0.143358 (0.0172)
0.104501 (0.0618)
0.098878 (0.0720)
0.139927 (0.0247)
Old Dependency Ratio
-9.789768 (0.0829)
-4.644540 (0.0000)
-4.629154 (0.0001)
-5.595666 (0.0001)
-5.916547 (0.0001)
-4.437580 (0.0000)
Real Exchange Rate -0.051354 (0.3376)
M2Y / GDP 0.151964 (0.4719)
Young Dependency Ratio
-0.982400 (0.4603)
Urbanization Rate -1.663951 (0.3354)
Female Labor Force Participation Ratio
0.231073 (0.2674)
Total Tax / GDP
Indirect Tax / GDP
Tax on Goods / GDP
Social Security Premiums / GDP
-0.376897 (0.6938)
Interest Payments / GDP
0.408079 (0.0699)
Domestic Int. P. /GDP
0.502411 (0.0467)
Foreign Int. P. /GDP
1.029327 (0.6076)
Observations 29 29 29 29 29 29
R2 0.930884 0.925285 0.925652 0.933713 0.935083 0.926469
Adj-R2 0.879047 0.900380 0.895913 0.907198 0.909116 0.897057
Topics in Middle Eastern and African Economies
Vol. 14, September 2012
122
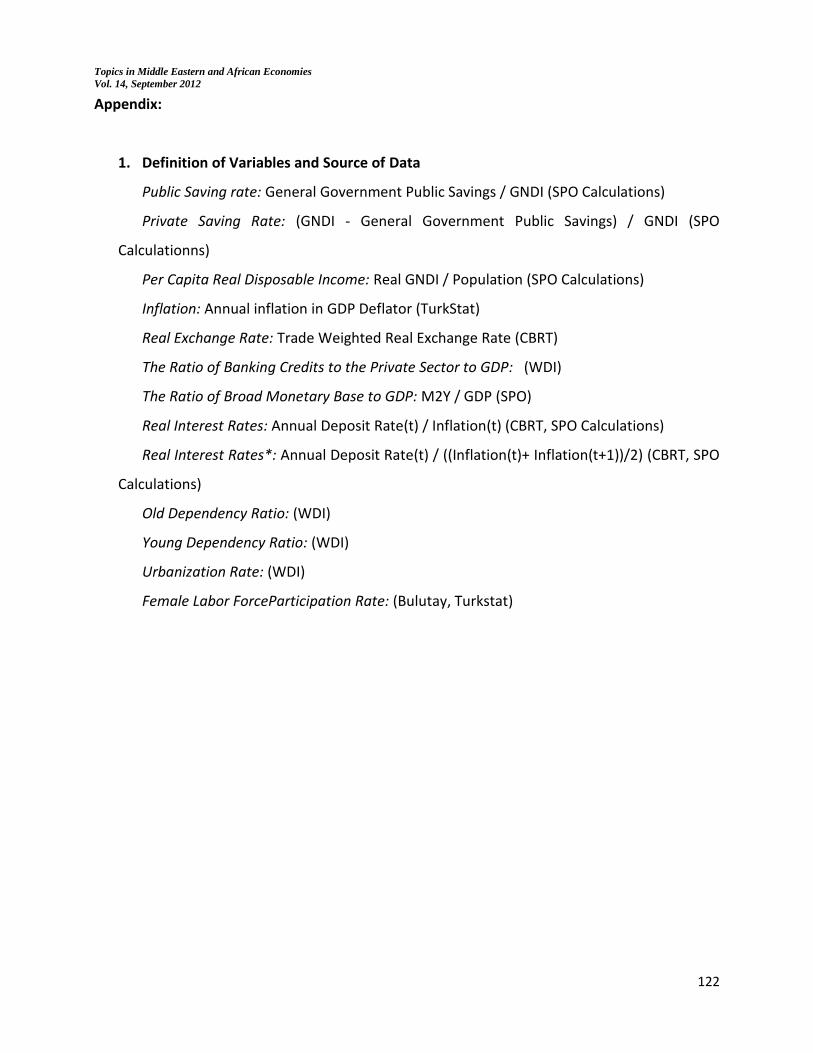
Appendix:
1. Definition of Variables and Source of Data
Public Saving rate: General Government Public Savings / GNDI (SPO Calculations)
Private Saving Rate: (GNDI - General Government Public Savings) / GNDI (SPO
Calculationns)
Per Capita Real Disposable Income: Real GNDI / Population (SPO Calculations)
Inflation: Annual inflation in GDP Deflator (TurkStat)
Real Exchange Rate: Trade Weighted Real Exchange Rate (CBRT)
The Ratio of Banking Credits to the Private Sector to GDP: (WDI)
The Ratio of Broad Monetary Base to GDP: M2Y / GDP (SPO)
Real Interest Rates: Annual Deposit Rate(t) / Inflation(t) (CBRT, SPO Calculations)
Real Interest Rates*: Annual Deposit Rate(t) / ((Inflation(t)+ Inflation(t+1))/2) (CBRT, SPO
Calculations)
Old Dependency Ratio: (WDI)
Young Dependency Ratio: (WDI)
Urbanization Rate: (WDI)
Female Labor ForceParticipation Rate: (Bulutay, Turkstat)

Topics in Middle Eastern and African Economies
Vol. 14, September 2012
123
2. Unit Root Test of Related Variables
Null Hypothesis: The series has unit-root
With an intercept and linear trend
With an intercept
Variable ADF Test Statistic
p-value ADF Test Statistic
p-value
Private Saving Rate -1.132248 0.9057 -1.298038 0.6167
Public saving rate -1.463647 0.8189 -1.354783 0.5901
Per capita real disposable income
-3.024755 0.1429 0.111091 0.9611
Per Capita Income Growth Rate
-5.923515 0.0002 -5.913169 0.0000
Inflation -1.336426 0.8580 -0.873003 0.7823
Real interest rates -5.396441 0.0007 -5.115851 0.0003
Real interest rates* -5.498795 0.0006 -4.889264 0.0005
Real exchange rate -2.804529 0.2070 -1.882609 0.3354
Banking Credits to Private Sector/ GDP
-1.204489 0.8908 -0.837718 0.7931
M2Y / GDP -1.165061 0.8992 0.544504 0.9854
Old dependency ratio -4.935923 0.0023 -2.895282 0.0582
Young dependency ratio -3.319950 0.0830 -2.528229 0.1198
Urbanization Rate -2.474226 0.3373 -3.751086 0.0084
3. Unit Root Test of the Residual of the Benchmark Model
Null Hypothesis: The residual series from the Benchmark Model has unit-root
Augmented Dickey –
Fuller Test Statistic
p-value
Benchmark Model (Eqn. 1) -3.798295 0.0005
Benchmark Model (Eqn. 1*) -4.025184 0.0003

Topics in Middle Eastern and African Economies
Vol. 14, September 2012
124
4. Johansen Cointegration Test for the Benchmark Model
Benchmark Model 1
Sample (adjusted): 1977 2008
Included observations: 32 after adjustments
Trend assumption: Linear deterministic trend
Series: PRSRATE/100 PUBSRATE/100 LOG(GNDIPC) LOG(INFGDPDEF) RIR1/100
Exogenous series: DPCR_GDP/100 ODEP/100
Warning: Critical values assume no exogenous series
Lags interval (in first differences): 1 to 1
Unrestricted Cointegration Rank Test (Trace) Hypothesized Trace 0.05
No. of CE(s) Eigenvalue Statistic Critical Value Prob.** None * 0.782387 95.16173 69.81889 0.0001
At most 1 0.487937 46.36054 47.85613 0.0686
At most 2 0.458170 24.94271 29.79707 0.1635
At most 3 0.149038 5.333033 15.49471 0.7725
At most 4 0.005255 0.168614 3.841466 0.6813 Trace test indicates 1 cointegrating eqn(s) at the 0.05 level
* denotes rejection of the hypothesis at the 0.05 level
**MacKinnon-Haug-Michelis (1999) p-values
Unrestricted Cointegration Rank Test (Maximum Eigenvalue) Hypothesized Max-Eigen 0.05
No. of CE(s) Eigenvalue Statistic Critical Value Prob.** None * 0.782387 48.80120 33.87687 0.0004
At most 1 0.487937 21.41782 27.58434 0.2518
At most 2 0.458170 19.60968 21.13162 0.0805
At most 3 0.149038 5.164418 14.26460 0.7209
At most 4 0.005255 0.168614 3.841466 0.6813 Max-eigenvalue test indicates 1 cointegrating eqn(s) at the 0.05 level
* denotes rejection of the hypothesis at the 0.05 level
**MacKinnon-Haug-Michelis (1999) p-values
1 Cointegrating Equation(s): Log likelihood 289.5709 Normalized cointegrating coefficients (standard error in parentheses)
PRSRATE/100 PUBSRATE/100 LOG(GNDIPC) LOG(INFGDPDEF) RIR1/100
1.000000 0.707664 -0.360926 -0.019557 0.956376
(0.57356) (0.09140) (0.02536) (0.12815)
Topics in Middle Eastern and African Economies
Vol. 14, September 2012
125
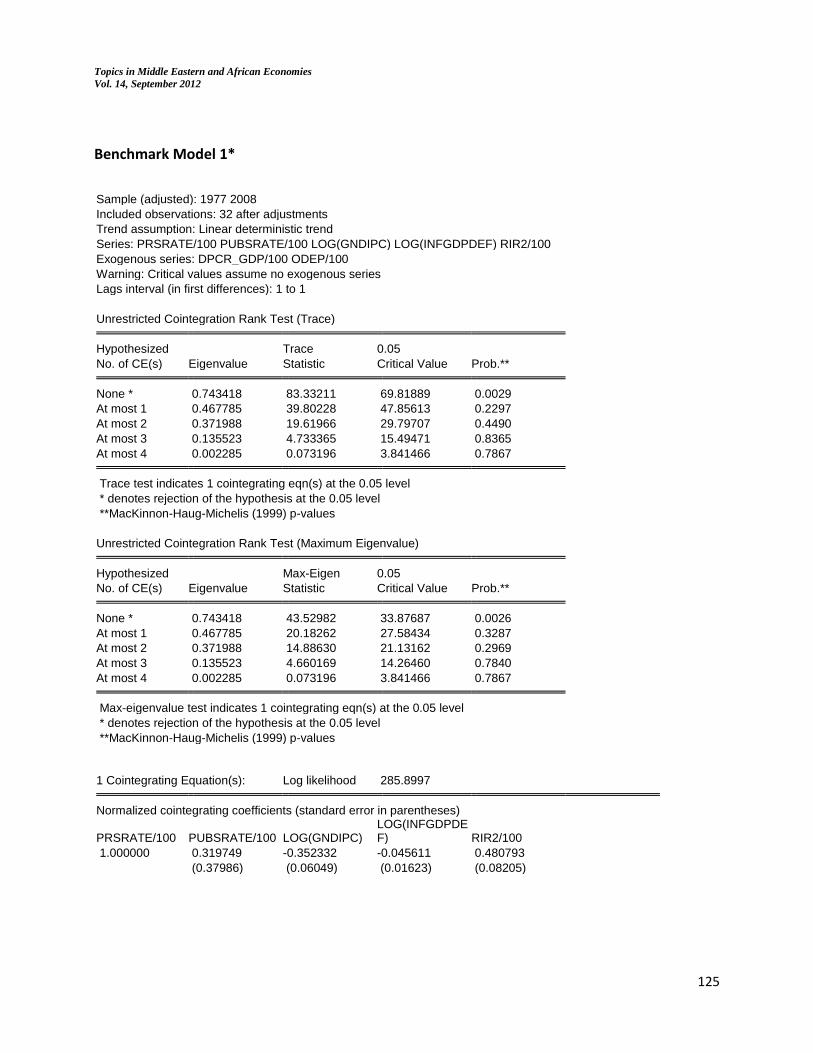
Benchmark Model 1*
Sample (adjusted): 1977 2008
Included observations: 32 after adjustments
Trend assumption: Linear deterministic trend
Series: PRSRATE/100 PUBSRATE/100 LOG(GNDIPC) LOG(INFGDPDEF) RIR2/100
Exogenous series: DPCR_GDP/100 ODEP/100
Warning: Critical values assume no exogenous series
Lags interval (in first differences): 1 to 1
Unrestricted Cointegration Rank Test (Trace) Hypothesized Trace 0.05
No. of CE(s) Eigenvalue Statistic Critical Value Prob.** None * 0.743418 83.33211 69.81889 0.0029
At most 1 0.467785 39.80228 47.85613 0.2297
At most 2 0.371988 19.61966 29.79707 0.4490
At most 3 0.135523 4.733365 15.49471 0.8365
At most 4 0.002285 0.073196 3.841466 0.7867 Trace test indicates 1 cointegrating eqn(s) at the 0.05 level
* denotes rejection of the hypothesis at the 0.05 level
**MacKinnon-Haug-Michelis (1999) p-values
Unrestricted Cointegration Rank Test (Maximum Eigenvalue) Hypothesized Max-Eigen 0.05
No. of CE(s) Eigenvalue Statistic Critical Value Prob.** None * 0.743418 43.52982 33.87687 0.0026
At most 1 0.467785 20.18262 27.58434 0.3287
At most 2 0.371988 14.88630 21.13162 0.2969
At most 3 0.135523 4.660169 14.26460 0.7840
At most 4 0.002285 0.073196 3.841466 0.7867 Max-eigenvalue test indicates 1 cointegrating eqn(s) at the 0.05 level
* denotes rejection of the hypothesis at the 0.05 level
**MacKinnon-Haug-Michelis (1999) p-values
1 Cointegrating Equation(s): Log likelihood 285.8997 Normalized cointegrating coefficients (standard error in parentheses)
PRSRATE/100 PUBSRATE/100 LOG(GNDIPC) LOG(INFGDPDEF) RIR2/100
1.000000 0.319749 -0.352332 -0.045611 0.480793
(0.37986) (0.06049) (0.01623) (0.08205)