determinants of private investment decision using tobit
TRANSCRIPT

European Journal of Business, Economics and Accountancy Vol. 7, No. 2, 2019 ISSN 2056-6018
Progressive Academic Publishing, UK Page 18 www.idpublications.org
DETERMINANTS OF PRIVATE INVESTMENT DECISION USING
TOBIT ANALYSIS: CASE STUDY OF DESSIE AND KOMBULOCHA
CITY-ETHIOPIA
Uvaneswaran S M
Wollo University - Dessie
ETHIOPIA
Hussien Fentaw Ayele
Wollo University- Dessie
ETHIOPIA
ABSTRACT
Private investment is a crucial pre-requisite for economic growth because it allows
entrepreneurs to set economic activity in motion by bringing resources together to produce
goods and services. Ethiopian Government provides opportunities to private investment but
still there are many challenges in terms of cost and investment risks. There is a need to
conduct research on micro level factors affecting private investment in Ethiopia particularly
with Dessie and kombolcha City Administration. For this purpose, 130 private investors are
selected based on started operation and implementation stages in their investment activities as
willing and non-willing investors and also used both primary and secondary data.
Econometric Method of analysis was adopted using Tobit Model and also employed
descriptive analysis to analyze the survey data. The results of the research showed that firm
size, education, access to land, interest rate, legal system and corruption were the most
important determinants of private investment in the study area. Based on these, the
Government and Ministry of Finance and Economic Development should formulate polices
to expand the education activities to more regions, introduce proactive land development and
administration procedure, make loans available at reasonable interest rate etc. to control
investment challenges and make economically prosperity nation.
Keywords: Private Investor, startups and implementation stages, Tobit Model, Willing and
non-Willing Investor.
JEL Code: C39, G29, M13
INTRODUCTION
Ethiopia is one of the poorest countries in the world. It is among least–developed countries
and ranked 170 out of 177 countries in the UNDP human development index of 2003
(UNDP, 2005). The Ethiopian economy is highly dependent on agriculture, which in turn
depends on nature. Over 85% of the employment is generated in this sector and it accounts
for about 52% of GDP and 90% of the export earnings. The industrial sector on the other
hand accounts for about 12% of GDP (Alemayehu Geda and Befkadu, 2002).
The private sector is the main engine of growth in market economies. It is expected to deliver
sustained growth when combined with conductive environment for the private sector to
develop. Private investment is increasingly important for creating employment, raising
growth rates and reducing poverty. Not only the expansion of private production capacity
matters for economic growth; the productivity gains that result from capital deepening and
modernization are important as well (OECD, 2005).
European Journal of Business, Economics and Accountancy Vol. 7, No. 2, 2019 ISSN 2056-6018
Progressive Academic Publishing, UK Page 19 www.idpublications.org
Ethiopia is now strongly seeking investment in all sectors in general and in agro processing
sub sector in particular from foreign as well as domestic sources. The Foreign Direct
Investment (FDI) which most of the time takes the form of private investment is expected to
bring entrepreneurial skills and new technologies in addition to capital. Private Sector
Development (PSD) is about enabling the enhanced utilization of labor and other resources of
the country through the growth of private business by providing enabling environment both
in domestic and overseas markets (MoFED, 2000).
A close look at the evolution of private investment in Ethiopia reveals that during 1992-2006
the Federal Investment Commission and Regional Investment Offices have licensed 18,769
investment projects with a planned initial investment capital of Birr 222.25 billion (EAI,
2006).Ethiopia has been implementing the Sustainable Development and Poverty Reduction
Program (SDPRP) since 2001, as an on-going commitment of the Government and, as a
framework for strategies and policy formulations. The program is under implementation
based on the Agricultural Development Led Industrialization (ADLI) policy of the country.
This is accompanied by civil service and justice system reforms, aimed to achieve good
governance, decentralization and empowerment and, institutional capacity building (Teigist,
2006).
Ethiopia provides many opportunities for profitable investment primarily due to the large
domestic market, favorable climate, and availability of cheap labor force. However, there are
many challenges facing the private sector growth in Ethiopia. Poor infrastructure,
bureaucratic regulations, and limited access to finance constrain the growth of the private
sector. All of these challenges increase the costs and risks associated with investing in
Ethiopia. In light of these challenges, the private sector needs to work in partnership with
government and civil society to create the appropriate enabling environment for sustainable
business growth (UNDP, Unleashing Entrepreneurship : Making Business Work for the Poor,
2004).
In the UNCTAD survey for Africa, Ethiopia is ranked third from the bottom (ahead only of
Uganda and Malawi) in terms of perceptions of its attractiveness for foreign direct investment
between 2000-2003 and its progress in improving the business environment during the same
period was ranked fifth from the bottom only ahead of Zimbabwe, Zambia, Malawi, and
Angola (UNCTAD, World Investment Report, 2004).
Therefore, Private investment is at the heart of growth and poverty reduction, creating
opportunities and employment, increasing the choice and lowering the cost of goods and
services, and providing a source for tax revenue. Private sector in Ethiopia is still in an early
stage of growth, having been discouraged during the Derg regime. Most private businesses
are family businesses, although some larger private companies are now managed by
professional managers and boards of directors. Over the last ten years, a number of
businesses including banks, insurance companies, hotels, travel agencies, manufacturing
industries, real estates, health and education institutions, commercial farms and others have
been set up by private investors. This paves the way to explore the current state of the private
investment activities and the attendant constraints in the Dessie and Kombolcha City
Administrations
LITERATURE REVIEW
Empirical studies conducted in Africa, Asia and Latin America have established the critical
linkage between investment and the rate of growth (Ghura D. a., 1996), (Collier, 1999).

European Journal of Business, Economics and Accountancy Vol. 7, No. 2, 2019 ISSN 2056-6018
Progressive Academic Publishing, UK Page 20 www.idpublications.org
Throughout the 1990s, the ratio of total gross domestic investment to gross domestic product
in Asia, which experienced a high average rate of growth compared with the rest of the
world, was about 27 percent, while in Latin America and sub-Saharan Africa the
corresponding ratios were 20 percent and 17 percent, respectively (Herandez-Cato, 2000).
Econometric evidence indicates that private investment has a stronger, more favorable effect
on growth rather than government investment, probably because private investment is more
efficient and less closely associated with corruption (Ghura D. H., 1996,1997,1999). It was
reported that the ratio of private investment to GDP in the sub-Saharan African countries
which had experienced poor rates of growth in the 1990s was less than 10 percent, compared
with 16 percent in Latin America, 18 percent in advanced countries and 16.5 percent in newly
industrialized countries in Asia (Herandez-Cato, 2000).
Neude (2000) investigated the determinants of investment and exports of South African
Manufacturing Firms based on data from 61 manufacturing firms. Their findings showed that
labor costs were high in comparison to other African countries where similar surveys were
conducted. The capital intensity for large firms was comparable to the capital intensity of
large firms in Zimbabwe, but was significantly higher than that observed in Ghana or
Mauritius. Given that labor productivity was comparable, but capital intensity and monthly
wages were significantly higher than those observed for Mauritius, the authors suggested that
South African firms might face a cost disadvantage vis-à-vis successfully exporting firms
located in Mauritius.
Getachew (1997)in his study on the determinants of private industrial investment in Ethiopia
reported that severe constraining factors to private manufacturing investment included
market, financial, infrastructure, policy, technology and input related factors. He further
noted that the root causes for these problems were many and interdependent and the degree of
severity of these problems was found to be independent of location of the enterprises.
Kaufmann (2003) have analyzed the business environment in Ethiopia in 2002. Among their
conclusions were that the business climate in Ethiopia was inferior to the corresponding
situation in sub-Saharan Africa in terms of “Voice and Accountability”, “Political Stability”,
“Government Effectiveness” and “Regulatory Quality”, whereas the Ethiopian situation
regarding “Rule of Law” and “Control of Corruption” was better in comparison with the sub-
Saharan average.
The majority of reviews considered the factors relating to socio-economic and cultural to
identify the determinants of private investment and also applied to other African countries
and capital of Ethiopia. Further, the certain factors were not considered in firm level
characteristics and Investment climate. Hence, the researcher fills the gap to ascertain the
determinants of Private Investment in Ethiopia particularly in Dessie and Kumbolcha.
METHODOLOGY
In this research, both quantitative and qualitative designs were employed. To select sample
respondents precisely, a probability sampling technique was used because the individual
investor is actually responsible for making decisions on investment activities. Because of
heterogeneity among investor groups, stratification of the private investors was found to be
imperative.

European Journal of Business, Economics and Accountancy Vol. 7, No. 2, 2019 ISSN 2056-6018
Progressive Academic Publishing, UK Page 21 www.idpublications.org
Accordingly, the population of the study was private investors in Dessie and Kombolcha city
that is registered and licensed by Amhara National Regional State Investment Bureau
(ANRSIB). Total population of such investors was about 501 (ANRSIB, 2017).More
specifically, the main stratification criterion was the status of their investment project.
Stratum 1 encompassed investors who started operation and the total number of investors
categorized under this stratum was 130. Stratum 2 consisted of investors who were in the
implementation stage of their investment project and their total number was 126. Stratum 3
was composed of investors who were in the pre-implementation stage of their investment
project and the total number of investors under this category was 245.
In the final stage sample investors were selected randomly using probability proportional to
sample size sampling techniques. Since in proportional sampling the number of samples
drawn from each stratum is proportional to the size of the stratum, 34, 33 and 63 private
investors were randomly selected from stratum 1, stratum 2 and stratum 3, respectively. The
total number of sample investors selected for this study added up to 130. Using the
appropriate sample size (n) was determined by the formula (Panneerselvam, 2004).
(
)
n=130
Where z α = standard normal distribution take value of 1.96
σ =standard deviation of investment return from previous study which is 58.27
D= desired accuracy to mean mostly assume 10
In this study both primary and secondary data were gathered for analytical purpose. The
structured questionnaire was administered to the 130 selected sample investors in the study
area. Secondary data include detailed information about approved private investment by
Amhara National Regional State Investment Bureau and Dessie and Kombolcha City
Administration Investment offices for the period under consideration. Moreover, other
relevant government and non-government organizations like the Ministry of Finance and
Economic Development (MoFED), Central Statistical Authority (CSA), Industrial Project
Service (IPS) were also used as sources of secondary data.
The dependent variable of this study is the amount of initial investment capital. This refers to
the total initial capital in Birr, registered for investment activities. This is a continuous
variable that will help to capture the preference of an investor to participate in investment
activities by contributing money, labor, time and his entrepreneurial ability.
The Investors who are started operations or under the implementation phase were categorized
as “willing” investors. The amount of capital that an investor registered while obtaining
his/her investment permit is used to measure the intensity of capital use for the investment
project in question. This variable takes a value of greater than zero for those investors who
had started operation or under the implementation phase. Whereas, those investors who were
in the pre-implementation stage or those who did not start any investment activity by the time
the survey was conducted were categorized as “non-willing” investors so that their initial
registered investment capital was censored to zero.
The independent variables of the study are those variables which have associations with
private investment decision. Thus, 16 variables were identified to have direct/and indirect
effect on private investment decision. The potential explanatory variables, which were
European Journal of Business, Economics and Accountancy Vol. 7, No. 2, 2019 ISSN 2056-6018
Progressive Academic Publishing, UK Page 22 www.idpublications.org
hypothesized to influence investors‟ decision on private investment in the study area, were
classified in to two, namely firm level characteristics and investment climate indicators. Firm
level characteristics included in this study are ownership structure (OWRST), level of
education (EDLEV), firm size (FIMSZ), source of investment finance (SORIF), and access to
adequate credit (ACACR). Whereas, the investment climate indicators considered in this
study include interest rate(INTRT), access to infrastructure facility(ACINF), access to
land(ACLND), legal system (LEGSY), bureaucratic red tape (BEURT), corruption(CORUP),
access to adequate market(ACCMK), source of raw material(SORRM), cost of raw material
(COSRM), practice of competitors (PRACO) and political instability(POLIN).
Econometric model
There are three types of regression models under the limited dependent variable models.
These are censored or Tobit regression, Truncated regression and Sample Selection
regression models. Inferring the characteristics of a population from a sample drawn from a
restricted part of the population is known as truncation. A truncated distribution is the part of
an untruncated distribution that is above or below some specified value (Green, 2000)
whereas a sample in which information on the regressed is available only for some
observation is known as censored sample. Therefore, the Tobit model shown below is a
censored regression model because it is possible to view the problem as one where
observations of the dependent variable (Y*) at or below zero are censored (Johnston, 1997).
While, truncation changes the sample size, censoring does not.
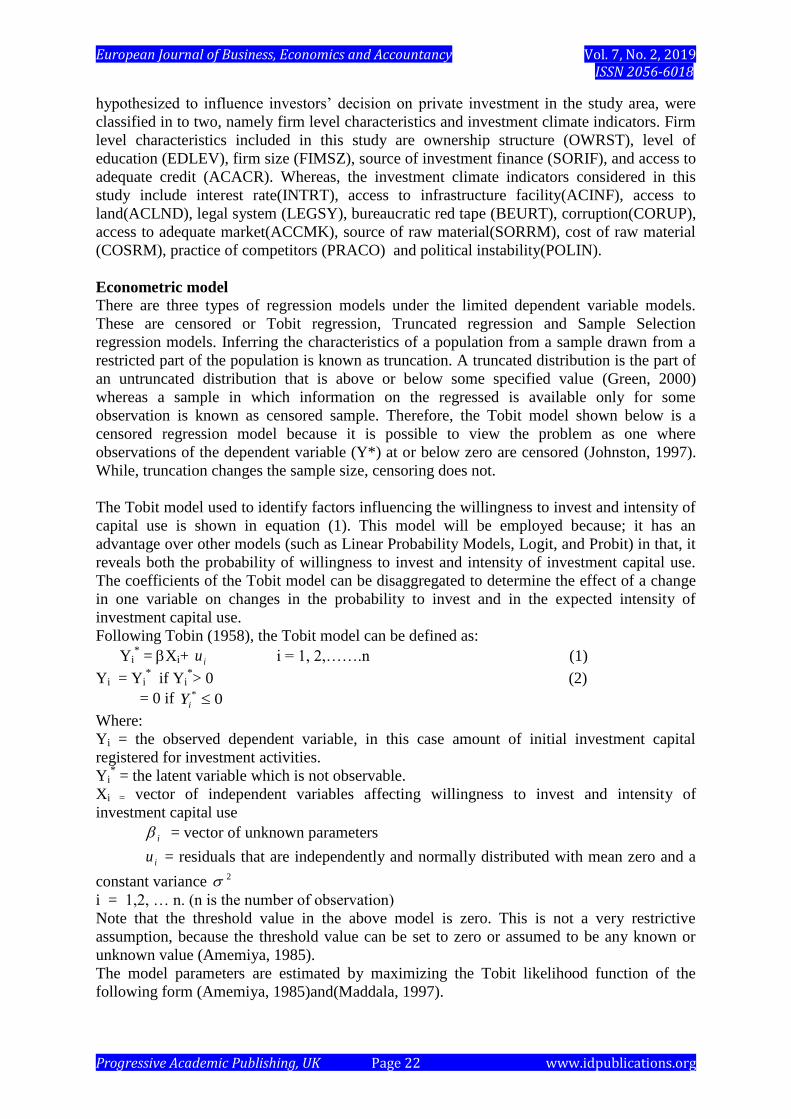
The Tobit model used to identify factors influencing the willingness to invest and intensity of
capital use is shown in equation (1). This model will be employed because; it has an
advantage over other models (such as Linear Probability Models, Logit, and Probit) in that, it
reveals both the probability of willingness to invest and intensity of investment capital use.
The coefficients of the Tobit model can be disaggregated to determine the effect of a change
in one variable on changes in the probability to invest and in the expected intensity of
investment capital use.
Following Tobin (1958), the Tobit model can be defined as:
Yi* = Xi+ iu i = 1, 2,…….n (1)
Yi = Yi* if Yi
*> 0 (2)
= 0 if 0* iY
Where:
Yi = the observed dependent variable, in this case amount of initial investment capital
registered for investment activities.
Yi* = the latent variable which is not observable.
Xi = vector of independent variables affecting willingness to invest and intensity of
investment capital use
i = vector of unknown parameters
iu = residuals that are independently and normally distributed with mean zero and a
constant variance 2
i = 1,2, … n. (n is the number of observation)
Note that the threshold value in the above model is zero. This is not a very restrictive
assumption, because the threshold value can be set to zero or assumed to be any known or
unknown value (Amemiya, 1985).
The model parameters are estimated by maximizing the Tobit likelihood function of the
following form (Amemiya, 1985)and(Maddala, 1997).

European Journal of Business, Economics and Accountancy Vol. 7, No. 2, 2019 ISSN 2056-6018
Progressive Academic Publishing, UK Page 23 www.idpublications.org
L =0*
yi
1
iii XY
0*
Yi F
ii X (3)
Whereas: and F are the density probability function and cumulative distribution function of
Yi*, respectively.
0*
iY
Means the product over those i for which Yi* 0, and
0*iY
means the
product over those i for which Yi*>0.
A SPSS_v20 software was employed to run the Tobit model. It may not be sensible to
interpret the coefficients of a Tobit in the same way as one interprets coefficients in an
uncensored linear model (Johnston, 1997). Hence, one has to compute the derivatives of the
estimated Tobit model to predict the effects of changes in the exogenous variables.
The Tobit coefficients do not directly give the marginal effects of the associated independent
variables on the dependent variable. But their signs show the direction of change in
probability of investment and the intensity of investment capital use as the respective
explanatory variable changes (Amemiya, 1985).
Mc Donald, (1980) proposed the following techniques to decompose the effects of
explanatory variables into the probability to invest and intensity of investment effects. Thus,
a change in Xi (explanatory variables) has two effects: it affects the conditional mean of Yi*
in the positive part of the distribution, and it affects the probability that the observation will
fall in that part of the distribution. This decomposition approach is used in this study.
1. Change in the probability (willingness) to invest as independent variable Xi changes is:
iX
ZF )( (z)
i (4)
2. The marginal effect of an explanatory variable on the expected value of the dependent
variable is:
(5)
Where,
ii X is denoted by z, following (Maddala, 1997)
3. The change in intensity of capital use for investment with respect to a change in an
explanatory variable among those who invested:
i
ii
X
YYE
)0/( *
=
2
)(
)(
)(
)(1
zF
zf
zF
zfZi (6)
Whereas: F (z) is the cumulative normal distribution of Z, (z) is the value of the derivative
of the normal curve at a given point (i.e., unit normal density), Z is the z-score for the area
under normal curve, is a vector of Tobit maximum likelihood estimates and is the
standard error of the error term.
Diagnosis of multicollinearity
Before proceeding with the estimation of the specified model, the variance inflation factor
(VIF) technique was used to evaluate the degree of multicolinearity among the continuous
explanatory variables. In this case, a series of „test‟ regressions are run such that each
continuous explanatory variable is regressed on all other continuous explanatory variables,
the coefficient of determination R2 being computed in each case. If an approximate linear
relationship exists among the explanatory variables, then this should show up a „large‟ value
of Ri2 in at least one of the test regressions. In such a case, one may drop Xi from the model,
provided it does not lead to a serious specification bias (Gujarati, 1995).
izFX
Y
i
i )()(

European Journal of Business, Economics and Accountancy Vol. 7, No. 2, 2019 ISSN 2056-6018
Progressive Academic Publishing, UK Page 24 www.idpublications.org
Following (Gujarati, 1995), VIF is defined as:
Where:
Xj = the jth
explanatory variable regressed on the other explanatory variables.
R2
j = the coefficient of determination in the (auxiliary) regression of Xj on the remaining
repressors.
As a rule of thumb, if the VIF of a variable exceeds 10 (this will happen if R2 exceeds 0.90),
that variable is said to be highly collinear and it can be concluded that multicolinearity is a
problem (Gujarati, 1995).
Similarly, Contingency Coefficients were computed to check for the degree of association
among the discrete variables. A contingency coefficient is a measure of association from
cross-classification data and is computed as:
2
2
nC
(8)
Where:
C= coefficient of contingency;
2 = a Chi-square random variable; and
n = total sample size.
With respect to the decision criteria, a value of 0.75 or more is judged to indicate a stronger
relationship among qualitative variables (Healy, 1984).
RESULTS
The sample investors are categorized into two groups that who are reported have operation
and implementation stage of their investment project at the time of study were categorized as
“willing” investors whereas; those investors who reported to have pre-implementation stage
were classified as “non-willing
Table 1: Types of Approved Investment Projects and its capital
Source: Computed by Author, 2019
Accordingly, out of 130 sample investors 67 and 63 were categorized as “willing” and “non-
willing”, respectively. In this study it was found that 51% of the “willing”, 49% of the “non-
willing”.
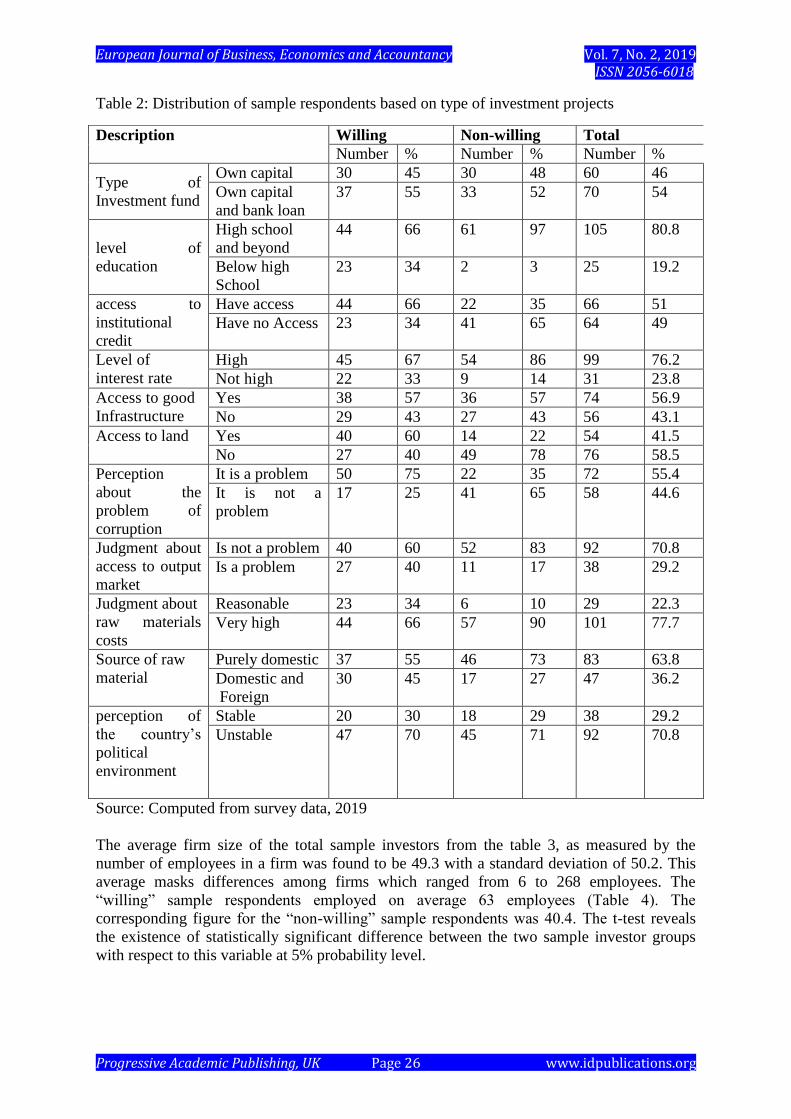
From the Table 2 shows about willing and non-willingness of investors, out of 130 sample
investors, 60 (46 %) reported that they fully financed their investment projects from their
own savings. Whereas the rest (54 %) reported that they used both their savings and bank
loans to finance their investment projects. In this respect, the survey results show that 66% of
the “willing”, 97% of the “non-willing” and 80.8% of the total sample respondents had a
high school and beyond level of education. The results of the survey indicate that 66% of the
Investment
Project status
Approved investment projects Investment capital
Number % In million Birr %
Operation 126 25 1111.8 11.4
Implementation 130 26 1033.4 10.5
Pre-implementation 245 49 7652.7 78.1
Total 501 100 9797.9 100
21
1
j
jR
XVIF
(7)
European Journal of Business, Economics and Accountancy Vol. 7, No. 2, 2019 ISSN 2056-6018
Progressive Academic Publishing, UK Page 25 www.idpublications.org
“willing” and 35% of the “non-willing” investors reported to have had access to institutional
credit. Whereas, 34 % of the “willing” and 65% of the “non-willing” sample respondents
reported that they had no access to institutional credit due to collateral problem, bureaucracy,
corruption or inadequate credit. Moreover, 67% of the “willing” and 86% of the “non-
willing” sample respondents believed that the prevailing interest rate was high and other
sample respondents reported that the interest rate was not high. The survey results reveal that
57 % of the “willing” and 57% of the “non-willing” sample respondents reported that they
had access to well develop infrastructure. Analysis of the survey data shows that 60% of the
“willing” and 22% of the “non- willing” sample respondents reported that they had access to
land. The survey results show that 75% of the “willing” and 35% of the “non-willing” sample
investors reported that they perceived corruption as a serious problem. Accordingly, 60% of
the “willing” and 83%
of the “non-willing” sample respondents had the feeling that output market access was not a
problem. A great majority of the total sample respondents (77.7%), the “willing” sample
investors (66%) and the “non-willing” sample investors (90%) reported that the costs of raw
materials were quite high. In this respect, the sample respondents were asked to express their
views on Political stability/instability at the national level nearly 70% of the “willing”, 71%
of the “non-willing” and 70.8% of the total sample respondent reported that political
instability was a serious problem in the country.
European Journal of Business, Economics and Accountancy Vol. 7, No. 2, 2019 ISSN 2056-6018
Progressive Academic Publishing, UK Page 26 www.idpublications.org
Table 2: Distribution of sample respondents based on type of investment projects
Source: Computed from survey data, 2019
The average firm size of the total sample investors from the table 3, as measured by the
number of employees in a firm was found to be 49.3 with a standard deviation of 50.2. This
average masks differences among firms which ranged from 6 to 268 employees. The
“willing” sample respondents employed on average 63 employees (Table 4). The
corresponding figure for the “non-willing” sample respondents was 40.4. The t-test reveals
the existence of statistically significant difference between the two sample investor groups
with respect to this variable at 5% probability level.
Description Willing Non-willing Total
Number % Number % Number %
Type of
Investment fund
Own capital 30 45 30 48 60 46
Own capital
and bank loan
37 55 33 52 70 54
level of
education
High school
and beyond
44 66 61 97 105 80.8
Below high
School
23 34 2 3 25 19.2
access to
institutional
credit
Have access 44 66 22 35 66 51
Have no Access 23 34 41 65 64 49
Level of
interest rate
High 45 67 54 86 99 76.2
Not high 22 33 9 14 31 23.8
Access to good
Infrastructure
Yes 38 57 36 57 74 56.9
No 29 43 27 43 56 43.1
Access to land Yes 40 60 14 22 54 41.5
No 27 40 49 78 76 58.5
Perception
about the
problem of
corruption
It is a problem 50 75 22 35 72 55.4
It is not a
problem
17 25 41 65 58 44.6
Judgment about
access to output
market
Is not a problem 40 60 52 83 92 70.8
Is a problem 27 40 11 17 38 29.2
Judgment about
raw materials
costs
Reasonable 23 34 6 10 29 22.3
Very high 44 66 57 90 101 77.7
Source of raw
material
Purely domestic 37 55 46 73 83 63.8
Domestic and
Foreign
30 45 17 27 47 36.2
perception of
the country‟s
political
environment
Stable 20 30 18 29 38 29.2
Unstable 47 70 45 71 92 70.8
European Journal of Business, Economics and Accountancy Vol. 7, No. 2, 2019 ISSN 2056-6018
Progressive Academic Publishing, UK Page 27 www.idpublications.org
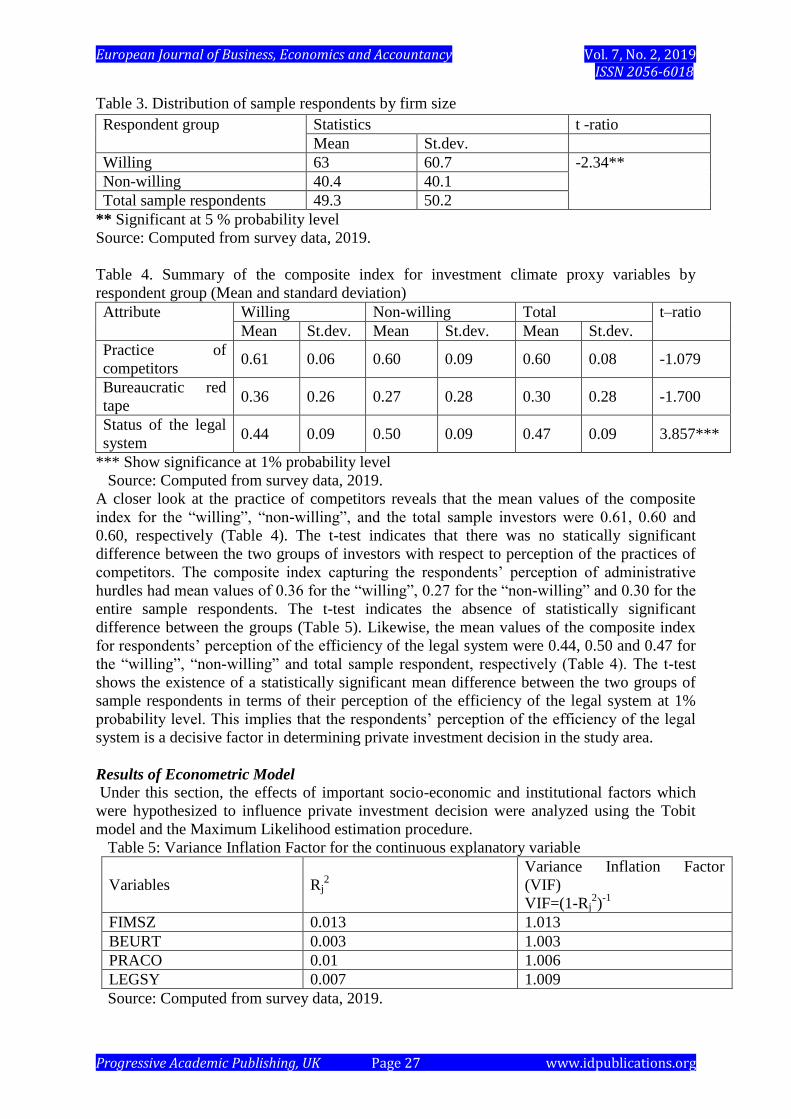
Table 3. Distribution of sample respondents by firm size
** Significant at 5 % probability level
Source: Computed from survey data, 2019.
Table 4. Summary of the composite index for investment climate proxy variables by
respondent group (Mean and standard deviation)
Attribute Willing Non-willing Total t–ratio
Mean St.dev. Mean St.dev. Mean St.dev.
Practice of
competitors 0.61 0.06 0.60 0.09 0.60 0.08 -1.079
Bureaucratic red
tape 0.36 0.26 0.27 0.28 0.30 0.28 -1.700
Status of the legal
system 0.44 0.09 0.50 0.09 0.47 0.09 3.857***
*** Show significance at 1% probability level
Source: Computed from survey data, 2019.
A closer look at the practice of competitors reveals that the mean values of the composite
index for the “willing”, “non-willing”, and the total sample investors were 0.61, 0.60 and
0.60, respectively (Table 4). The t-test indicates that there was no statically significant
difference between the two groups of investors with respect to perception of the practices of
competitors. The composite index capturing the respondents‟ perception of administrative
hurdles had mean values of 0.36 for the “willing”, 0.27 for the “non-willing” and 0.30 for the
entire sample respondents. The t-test indicates the absence of statistically significant
difference between the groups (Table 5). Likewise, the mean values of the composite index
for respondents‟ perception of the efficiency of the legal system were 0.44, 0.50 and 0.47 for
the “willing”, “non-willing” and total sample respondent, respectively (Table 4). The t-test
shows the existence of a statistically significant mean difference between the two groups of
sample respondents in terms of their perception of the efficiency of the legal system at 1%
probability level. This implies that the respondents‟ perception of the efficiency of the legal
system is a decisive factor in determining private investment decision in the study area.
Results of Econometric Model
Under this section, the effects of important socio-economic and institutional factors which
were hypothesized to influence private investment decision were analyzed using the Tobit
model and the Maximum Likelihood estimation procedure.
Table 5: Variance Inflation Factor for the continuous explanatory variable
Variables Rj2
Variance Inflation Factor
(VIF)
VIF=(1-Rj2)-1
FIMSZ 0.013 1.013
BEURT 0.003 1.003
PRACO 0.01 1.006
LEGSY 0.007 1.009
Source: Computed from survey data, 2019.
Respondent group
Statistics t -ratio
Mean St.dev.
Willing 63 60.7 -2.34**
Non-willing 40.4 40.1
Total sample respondents 49.3 50.2
European Journal of Business, Economics and Accountancy Vol. 7, No. 2, 2019 ISSN 2056-6018
Progressive Academic Publishing, UK Page 28 www.idpublications.org
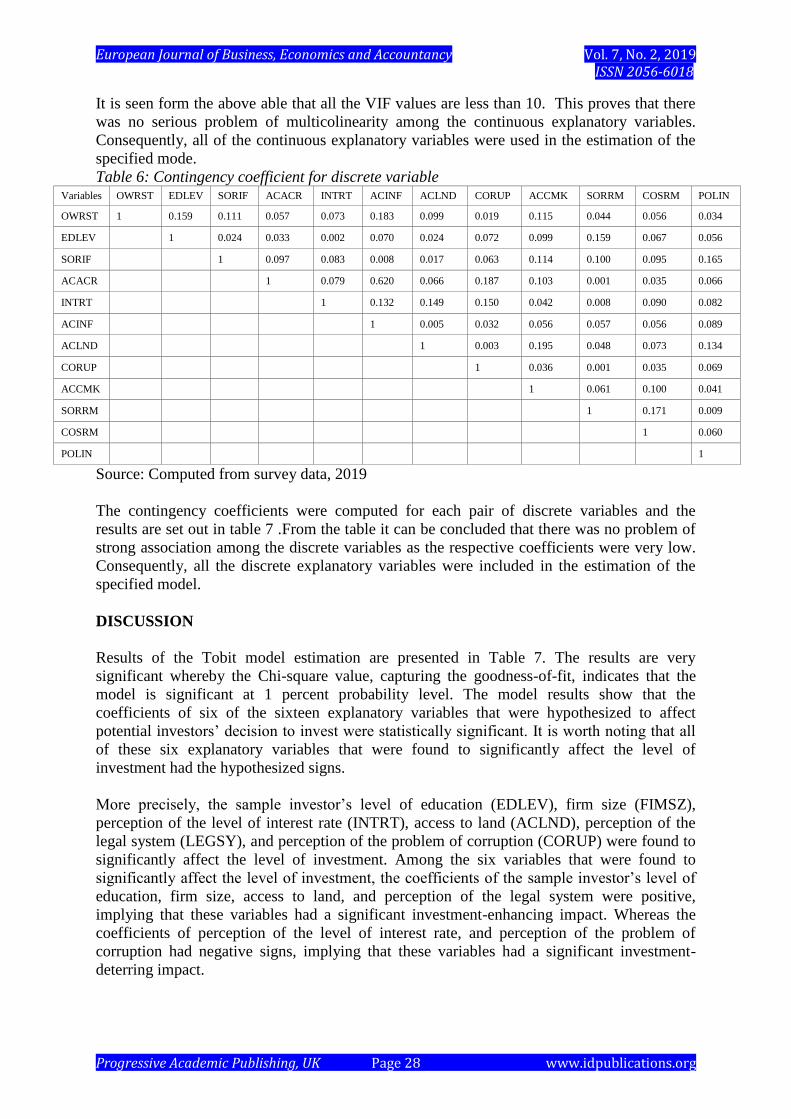
It is seen form the above able that all the VIF values are less than 10. This proves that there
was no serious problem of multicolinearity among the continuous explanatory variables.
Consequently, all of the continuous explanatory variables were used in the estimation of the
specified mode.
Table 6: Contingency coefficient for discrete variable Variables OWRST EDLEV SORIF ACACR INTRT ACINF ACLND CORUP ACCMK SORRM COSRM POLIN
OWRST 1 0.159 0.111 0.057 0.073 0.183 0.099 0.019 0.115 0.044 0.056 0.034
EDLEV 1 0.024 0.033 0.002 0.070 0.024 0.072 0.099 0.159 0.067 0.056
SORIF 1 0.097 0.083 0.008 0.017 0.063 0.114 0.100 0.095 0.165
ACACR 1 0.079 0.620 0.066 0.187 0.103 0.001 0.035 0.066
INTRT 1 0.132 0.149 0.150 0.042 0.008 0.090 0.082
ACINF 1 0.005 0.032 0.056 0.057 0.056 0.089
ACLND 1 0.003 0.195 0.048 0.073 0.134
CORUP 1 0.036 0.001 0.035 0.069
ACCMK 1 0.061 0.100 0.041
SORRM 1 0.171 0.009
COSRM 1 0.060
POLIN 1
Source: Computed from survey data, 2019
The contingency coefficients were computed for each pair of discrete variables and the
results are set out in table 7 .From the table it can be concluded that there was no problem of
strong association among the discrete variables as the respective coefficients were very low.
Consequently, all the discrete explanatory variables were included in the estimation of the
specified model.
DISCUSSION
Results of the Tobit model estimation are presented in Table 7. The results are very
significant whereby the Chi-square value, capturing the goodness-of-fit, indicates that the
model is significant at 1 percent probability level. The model results show that the
coefficients of six of the sixteen explanatory variables that were hypothesized to affect
potential investors‟ decision to invest were statistically significant. It is worth noting that all
of these six explanatory variables that were found to significantly affect the level of
investment had the hypothesized signs.
More precisely, the sample investor‟s level of education (EDLEV), firm size (FIMSZ),
perception of the level of interest rate (INTRT), access to land (ACLND), perception of the
legal system (LEGSY), and perception of the problem of corruption (CORUP) were found to
significantly affect the level of investment. Among the six variables that were found to
significantly affect the level of investment, the coefficients of the sample investor‟s level of
education, firm size, access to land, and perception of the legal system were positive,
implying that these variables had a significant investment-enhancing impact. Whereas the
coefficients of perception of the level of interest rate, and perception of the problem of
corruption had negative signs, implying that these variables had a significant investment-
deterring impact.
European Journal of Business, Economics and Accountancy Vol. 7, No. 2, 2019 ISSN 2056-6018
Progressive Academic Publishing, UK Page 29 www.idpublications.org
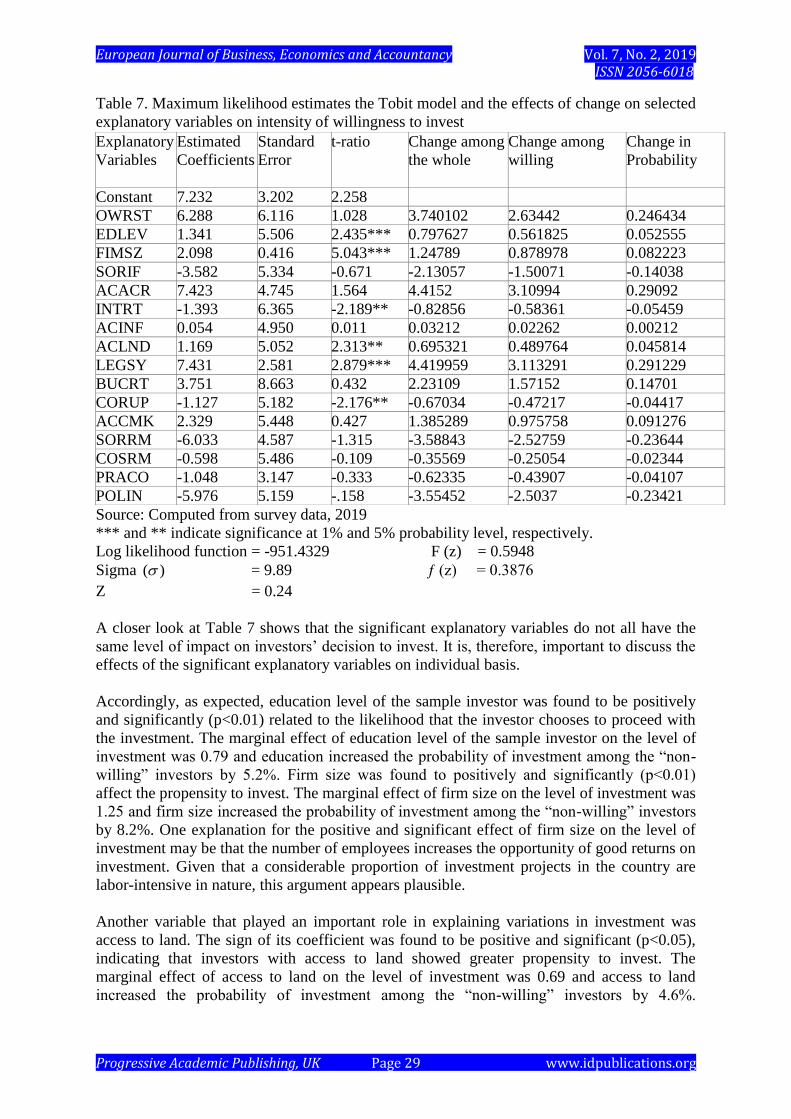
Table 7. Maximum likelihood estimates the Tobit model and the effects of change on selected
explanatory variables on intensity of willingness to invest
Source: Computed from survey data, 2019
*** and ** indicate significance at 1% and 5% probability level, respectively.
Log likelihood function = -951.4329 F (z) = 0.5948
Sigma )( = 9.89 ƒ (z) = 0.3876
Z = 0.24
A closer look at Table 7 shows that the significant explanatory variables do not all have the
same level of impact on investors‟ decision to invest. It is, therefore, important to discuss the
effects of the significant explanatory variables on individual basis.
Accordingly, as expected, education level of the sample investor was found to be positively
and significantly (p<0.01) related to the likelihood that the investor chooses to proceed with
the investment. The marginal effect of education level of the sample investor on the level of
investment was 0.79 and education increased the probability of investment among the “non-
willing” investors by 5.2%. Firm size was found to positively and significantly (p<0.01)
affect the propensity to invest. The marginal effect of firm size on the level of investment was
1.25 and firm size increased the probability of investment among the “non-willing” investors
by 8.2%. One explanation for the positive and significant effect of firm size on the level of
investment may be that the number of employees increases the opportunity of good returns on
investment. Given that a considerable proportion of investment projects in the country are
labor-intensive in nature, this argument appears plausible.
Another variable that played an important role in explaining variations in investment was
access to land. The sign of its coefficient was found to be positive and significant (p<0.05),
indicating that investors with access to land showed greater propensity to invest. The
marginal effect of access to land on the level of investment was 0.69 and access to land
increased the probability of investment among the “non-willing” investors by 4.6%.
Explanatory
Variables
Estimated
Coefficients
Standard
Error
t-ratio Change among
the whole
Change among
willing
Change in
Probability
Constant 7.232 3.202 2.258
OWRST 6.288 6.116 1.028 3.740102 2.63442 0.246434
EDLEV 1.341 5.506 2.435*** 0.797627 0.561825 0.052555
FIMSZ 2.098 0.416 5.043*** 1.24789 0.878978 0.082223
SORIF -3.582 5.334 -0.671 -2.13057 -1.50071 -0.14038
ACACR 7.423 4.745 1.564 4.4152 3.10994 0.29092
INTRT -1.393 6.365 -2.189** -0.82856 -0.58361 -0.05459
ACINF 0.054 4.950 0.011 0.03212 0.02262 0.00212
ACLND 1.169 5.052 2.313** 0.695321 0.489764 0.045814
LEGSY 7.431 2.581 2.879*** 4.419959 3.113291 0.291229
BUCRT 3.751 8.663 0.432 2.23109 1.57152 0.14701
CORUP -1.127 5.182 -2.176** -0.67034 -0.47217 -0.04417
ACCMK 2.329 5.448 0.427 1.385289 0.975758 0.091276
SORRM -6.033 4.587 -1.315 -3.58843 -2.52759 -0.23644
COSRM -0.598 5.486 -0.109 -0.35569 -0.25054 -0.02344
PRACO -1.048 3.147 -0.333 -0.62335 -0.43907 -0.04107
POLIN -5.976 5.159 -.158 -3.55452 -2.5037 -0.23421
European Journal of Business, Economics and Accountancy Vol. 7, No. 2, 2019 ISSN 2056-6018
Progressive Academic Publishing, UK Page 30 www.idpublications.org
Similarly, the proxy for the efficiency of the legal system was positively and significantly
(p<0.01) related to the level of investment, implying that, other things being equal, if
potential investors have positive opinion about the efficiency of the legal system, investment
is more likely to occur. In other words, the positive and significant coefficient of LEGSY is a
clear indication that the efficiency of the legal system is highly valued by potential investors.
The marginal effect of the variable legal system on the level of investment was 4.42 and this
variable increased the probability of investment among the “non-willing” investors by 29.1%.
As illustrated in Table 7, the coefficient of the perception of the level of interest rate is
negative and significant (p<0.05), implying that higher interest rate does not increase
potential investors‟ propensity to invest. The marginal effect of this variable on the level of
investment was -0.83 and this same variable decreased the probability of investment among
the “non-willing” investors by 5.4%. As expected, investors‟ perception of the prevalence of
corruption was estimated to have a significant (p<0.05) investment-deterring effect. This
result is consistent with the view that corruption impedes investment and thus economic
growth. The marginal effect of corruption on the level of investment was -0.67 and the
variable corruption decreased the probability of investment among the “non-willing”
investors by 4.4%.
Intensity of capital use for investment activities
The second part of the Tobit model measures the extent of capital use with respect to a unit
change of the explanatory variables among the “willing” group. The marginal effects of the
significant explanatory variables of the censored regression on the level of investment by the
“willing” investors are presented in the 6th
column of Table 7.
The effect of change in the education level of sample investors increases the intensity of
capital use by 0.56 million Birr among the “willing” investors. In the same manner, the
change in firm size increases the extent of capital use by 0.88 million Birr among the
“willing” group. As expected, access to land influences the level of capital use positively. In
general, land accessibility increases the intensity of capital use by 0.49 million Birr among
the “willing” investors. Perception of the efficiency of the legal system by sample
respondents is another important variable, which significantly affected the level of capital
use. The existence of an efficient legal system increases the extent of capital use by 3.11
million Birr among the “willing” group.
On the contrary, corruption and interest rate have a negative effect on the extent of capital use
for investment. Holding other variables constant, the perception of the problem of corruption
reduces the intensity of capital investment by 0.47 million Birr among the “willing”
investors. Likewise, the fact that “willing” investors believe that the official bank interest rate
is high would decrease the extent of their capital use by 0.58 million Birr.
CONCLUSION AND RECOMMENDATION
The econometric results show that the level of private investment in Dessie and Kombolcha
City Administration was significantly and positively influenced by firm size, investor‟s level
of education, access to land and perception of the efficiency of the legal system by the sample
investors. However, the perception of the level of interest rate by the sample investors and the
problem of corruption were found to be negatively and significant related to the level of
investment, implying that these variables had deleterious effects on the level of private
investment in the study areas. The coefficients of the other variables, namely ownership
structure, source of investment fund, access to institutional credit, access to infrastructure,
European Journal of Business, Economics and Accountancy Vol. 7, No. 2, 2019 ISSN 2056-6018
Progressive Academic Publishing, UK Page 31 www.idpublications.org
access to adequate and reliable market, cost of raw materials, source of raw materials,
bureaucratic red tape, practice of competitors and political instability were not significant. It
can be concluded that can be drawn from this study is that micro level factors coupled with a
favorable socio-political environment situations are essential ingredients for promoting
private investment at operational level.
Based on the results, some policy implications are suggested to promote private investment in
the study areas. The research indicates that education attainment is an important determinant
of private investment in the study areas. This result is consistent with the findings of several
studies (Smith, 2004; Kefay, 2005) carried out in many developing countries that have
concluded that investing in human resources development is essential for poverty reduction,
efficient utilisation of available resources, and economic development. The demand for
competent and experienced professionals has always been high in Ethiopia. To address the
problem of skilled manpower, the Ethiopian Government is engaged in reorganizing higher
education institutions, including expansion of higher education activities to more regions and
increasing institutional independence.
To encourage private investment in Dessie and Kombolcha City Administrations should
introduce proactive land development and administration procedure, for accessing land for
private investment.
The level of interest rate was found to have a significant investment-deterrent effect in the
study areas. The implication is that a comprehensive measure to make loans available at
reasonable interest rate is more capable of attracting private investment.
The problem of corruption and inefficiency of the legal system were found to have
deleterious effects on private investment in the study areas. To create a favorable institutional
environment, the investors‟ rights should be protected, laws and contracts are enforced, and
public authorities and government officials discharge their responsibilities with transparency
and accountability, must be given priority. In a nutshell, issues related to the legal system and
corruption should be considered as an integral part of economic development policy
formulation and implementation.
REFERENCES
1. Alemayehu Geda and BefekaduDegefe, 2002. Explaining African Growth
Performance: The Case of Ethiopia. Paper Presented on AERC Growth Research
Workshop, May 23- 25, 2002, Nairobi, Kenya.
2. Amemiya, T., 1985. Advanced Econometrics. T.J Press, Padstow Ltd, Great Britain.
3. Collier, P. and Gunning, J.W., 1999. Explaining Africa Economic Performance,
Journal of economic Literature, 37, March. pp. 64-111.
4. EIA (Ethiopian Investment Agency), 2006. “Statistics on Investment in Ethiopia
during the Period 1992-2006”, unpublished, (data obtained on request).
5. Ghura, D., 1997. Private Investment and Endogenous Growth: Evidence from
Cameroon, IMF Working Paper 97/165, USA.
6. Ghura, D. and Hadjimichael, M.T., 1996. Growth in Sub-Saharan Africa, Staff Papers,
International Monetary Fund. No. 43. USA.
European Journal of Business, Economics and Accountancy Vol. 7, No. 2, 2019 ISSN 2056-6018
Progressive Academic Publishing, UK Page 32 www.idpublications.org
7. Getachew Mekonnen, 1997. Determinants of Private Industrial Investment in Ethiopia.
An M.Sc. Thesis Presented to the School of Graduate Studies of Addis Ababa
University.
8. Green, J. and Villanvera,D., 1991. Private Investment in Developing Countries: An
Empirical Analysis. IMF Staff Papers 38, pp.33-58.
9. Gujarati, D., 1995. Basic Econometrics. Third edition. McGraw Hill, Inc. New York.
10. Healy, F.J., 1984. Statistics: A Tool for Social Research. Wadsworth Publishing
Company,California.
11. Herandez-Cato, E., 2000. Raising Growth and Investment in Sub-Saharan Africa:
What Can be Done? Policy Discussion Paper: PDP/00/4, International Monetary
Fund,
Washington, D. C.
12. Johnston, J. and Dinardo, J., 1997. Econometrics Methods. 4th
ed., McGraw-Hill
Companies, Inc, New York.
13. Kaufmann, D., Kraay A., and Mastruzzi, M., 2003. Government Matters III:
Government Indicators for 1996–2002, June 30, 2003, Washington, D.C.:World Bank
14. Kefay Baye, 2005. Determinants of private investment at national and regional level
with
particular reference to Dire Dawa and Harai Regional States. An MSc Thesis
Presented to the School of Graduate Studies of Alemay University.
15. Maddala, G.S.,1997. Limited Dependent and Qualitative Variables in Econometrics.
Cambridge University Press.
16. Mc Donald, J.F. and. Moffit, R.A., 1980. The Use of Tobit Analysis. Review of
Economics and Statistics 62: 318-320.
17. MoFED (Ministry of Finance and Economic Development), 2000. Sustainable
Development and Poverty Reduction Programme. Addis Ababa, Ethiopia.
18. Neude, W., Oostendorp, R., and Serumaga-ZakeP., 2000. Determinants of Investment
and Exports of South African Manufacturing Firms: Firm-Level Survey Results. St.
Catherine‟s College, University of Oxford.
19. OECD, 2005. Mobilizing Private Investment for Development: Policy Lessons on the
Role of ODA, Paris.
20. Panneerselvam,R 2004, “Research Methodology,” Prentice- Hall India (P) Ltd., New
Delhi
21. Smith, R. E., 2004. Land Tenure, Fixed Investment, and Farm Productivity: Evidence
from Zambia‟s Southern Province, World Development, 32 (10):1641-1661.
22. Teigist Lemma, 2006. Case study on Ethiopia. Addis Abada, Ethiopia.
23. UNCTAD (United Nations Conference on Trade and Development), 2004. World
Investment Report. Geneva.
24. UNDP (United Nations Development Program), 2004. Unleashing Entrepreneurship:
Making Business Work for the Poor, Report to the Secretary General of the United
Nations by the Commission on Private Sector and Development, UNDP, New York.
25. World Bank, 2005b. Ethiopia Private Sector Development: Accelerating Employment
Growth Washington, DC: The World Bank.