determinants of economic performance and networking...
TRANSCRIPT

DETERMINANTS OF ECONOMIC PERFORMANCE AND NETWORKING
PATTERNS OF SETTLEMENTS IN ANTALYA REGION
A THESIS SUBMITTED TO
THE GRADUATE SCHOOL OF NATURAL AND APPLIED SCIENCES
OF
MIDDLE EAST TECHNICAL UNIVERSITY
BY
SELÇUK SERTESEN
IN PARTIAL FULFILLMENT OF THE REQUIREMENTS
FOR
THE DEGREE OF MASTER OF SCIENCE, IN REGIONAL PLANNING
IN
CITY AND REGIONAL PLANNING
SEPTEMBER 2009

Approval of the thesis
DETERMINANTS OF ECONOMIC PERFORMANCE AND NETWORKING PATTERNS OF SETTLEMENTS IN ANTALYA REGION
submitted by SELÇUK SERTESEN in partial fulfillment of the requirements for the degree of Master of Science in Regional Planning, in City and Regional Planning Department, Middle East Technical University by, Prof. Dr. Canan ÖZGEN ________________ Dean, Graduate School of Natural and Applied Sciences Prof. Dr. Melih ERSOY ________________ Head of the Department, City and Regional Planning
Prof. Dr. Ayda ERAYDIN ________________ Supervisor, City and Regional Planning, METU
Examining Committee Members Assoc. Prof. Dr. Serap KAYASÜ _______________________ City and Regional Planning Dept., METU Prof. Dr. Ayda ERAYDIN _______________________ City and Regional Planning Dept., METU Assist. Prof. Dr. Tanyel ÖZELÇĐ ECERAL _______________________ City and Regional Planning Dept., GAZI UNIV. Assist. Prof. Dr. Çiğdem VAROL _______________________ City and Regional Planning Dept., GAZI UNIV. Hediye Nur HASIRCI _______________________ Joint Program Assistant, UNDP Date: 04 / 09 / 2009

iii
I hereby declare that all information in this document has been obtained and
presented in accordance with academic rules and ethical conduct. I also declare that,
as required by these rules and conduct, I have fully cited and referenced all material
and results that are not original to this work.
Name, Last Name: Selçuk SERTESEN
Signature :

iv
ABSTRACT
DETERMINANTS OF ECONOMIC PERFORMANCE AND NETWORKING
PATTERNS OF SETTLEMENTS IN ANTALYA REGION
SERTESEN, Selçuk
M.S., Department of City and Regional Planning in Regional Planning
Supervisor: Prof. Dr. Ayda ERAYDIN
September 2009, 120 pages
Effects of globalization transform the forms of relations between settlements and it
also changed the relations between capital and labor. In this global era performances
of individual settlements became crucial in the absence of old hierarchic boundaries.
But individual performances of settlements are not enough to integrate the global
system. A New type of spatial organization appeared which is called networking to
enhance complementary and cooperative relations crucial for synergy. The spatial
reflexions of this transformation process are city regions.
This study aims to determine the factors affecting economic performance and
networking patterns of settlements in Antalya Region with the use of quantitative
research methods.
Key Words: Economic performance, networking, city regions

v
ÖZ
ANTALYA BÖLGESĐNDEKĐ YERLEŞMELERĐN EKONOMĐK
PERFORMANSLARINI VE ARALARINDAKĐ AĞ ĐLĐŞKĐLERĐNĐ
BELĐRLEYEN FAKTÖRLER
SERTESEN, Selçuk
Yüksek Lisans, Şehir ve Bölge Planlama Bölümü, Bölge Planlama
Tez Yöneticisi: Prof. Dr. Ayda ERAYDIN
Eylül 2009, 120 sayfa
Küreselleşmenin etkileri yerleşmeler arası ilişki biçimlerini, aynı zamanda da
sermaye ve işgücü arasındaki ilişkileri dönüştürmektedir. Hiyerarşik sınırların
kaybolduğu bu küresel çağda yerleşmelerin ekonomik performansları önem
kazanmıştır. Fakat bireysel performanslar küresel sistemle bütünleşmek için yeterli
değildir. Yerleşmeler arası tamamlayıcı ve işbirlikçi ilişkileri sağlayarak sinerji
yaratan ve ağlar olarak tanımlanan yeni bir ilişki biçimi ortaya çıkmıştır. Bu küresel
dönüşüm sürecinin mekandaki yansımaları ise kent bölgelerdir.
Bu çalışma kent bölge bağlamında, yerleşmelerin ekonomik performanslarını ve
birbirleri ile kurdukları ağ ilişkilerini niceliksel araştırma yöntemleri kullanarak
ortaya çıkarmayı amaçlamaktadır.
Anahtar Kelimeler: Ekonomik performans, ağ ilişkileri, kent bölge

vi
ACKNOWLEDGEMENTS
First of all I should express my gratitude to Prof. Ayda Eraydın, the supervisor of the
thesis, not only for her valuable suggestions, comments, patience and positive
attitude from the beginning to the end of the thesis, but also for her guidance and
support in my academic studies since 2005. She has always been the model to me
both as a person and as an academic.
I owe thanks to Emin Dedeoğlu who always encouraged me about my academic
studies.
In addition, I would like to thank to my colleagues and friends, Emre Koyuncu and
Çetin Haşar who also supported and encouraged me.
I should also thank to Metin Özarslan and Bülent Dinçer from State Planning
Organization who provided me the data crucial for the theses and Burak Beyhan who
has an important role on my academic choices.
A special word of thanks to my classmates from METU RP 501 Studio Group of
2006 with whom we produced an important part of the analysis together which
established the bases of my research. In addition, I owe thanks to all my dear friends
for their friendship and supports.
Finally, I am greatly indebted to my parents, Şükran and Ali Sertesen for their
sacrifice, support and guidance throughout my education and for their willingness to
endure with me the most difficult stages of the thesis with endless patience.
vii
TABLE OF CONTENTS
ABSTRACT ........................................................................................................... iv
ÖZ ........................................................................................................................... v
ACKNOWLEDGEMENTS .................................................................................... vi
TABLE OF CONTENTS ....................................................................................... vii
LIST OF FIGURES ................................................................................................. x
LIST OF TABLES ................................................................................................ xiii
CHAPTER
1. INTRODUCTION ............................................................................................. 1
2. ECONOMIC PERFORMANCE AND NETWORKING IN CITY REGION
CONTEXT .............................................................................................................. 4
2.1 City Region Theory ........................................................................................ 4
2.1.1 Emergence and Popularity of City Regions ............................................... 4
2.1.2 Definitions of City Regions ...................................................................... 6
2.1.3 Advantages of city region ........................................................................10
2.1.4 Critiques to city regions ...........................................................................12
2.2 Economic Performance of Settlements ..........................................................14
2.2.1 Input variables affecting economic performance ......................................15
2.2.1.1 Innovativeness, learning and human resources .................................15
2.2.1.2 Infrastructure and local business environment ..................................16
2.2.1.3 Sectoral trends, specialization and firms ...........................................18
2.2.1.4 Institutional milieu and networking ..................................................19
2.2.2 Output Indicators of Economic Performance ...........................................19
2.2.3 Review of Studies on Economic Performance of Cities............................21
2.3 Network Metaphor ........................................................................................23
2.3.1 The differences between hierarchic, heterarchic and networking relations
........................................................................................................................25

viii
2.3.2 Urban policy networks ............................................................................26
2.3.3 Contributions of policy networks to effective governance .......................30
2.3.4 Networks for High Economic Performance .............................................31
2.4 Sources of Urban Attractivity in Actual Networks .........................................34
3. METHODOLOGY............................................................................................38
3.1 Methods used in the previous related studies .................................................38
3.2 Hypotheses ....................................................................................................40
3.3 Methods used to test the hypotheses ..............................................................41
4. DYNAMICS OF ANTALYA AS A NEWLY EMERGING CITY REGION ....43
4.1 Endogenous Dynamics in Global Transformation Process .............................43
4.1.1 Distribution of Economic Activities in the Region ..................................43
4.1.2 Inter Regional Spatial Concentrations of Basic Sectors in Antalya City
Region ............................................................................................................45
4.1.3 Employment Structure and Changing Population Patterns .......................50
4.2 Policies and support schemes to enhance integration to global economy ........55
4.2.1 Public Policies and New Institutional Setup to Enhance Tourism ............56
4.3 Outcomes of the spatial dynamics..................................................................59
5. NETWORKING AND ECONOMIC PERFORMANCE IN ANTALYA REGION
...............................................................................................................................61
5.1 Data Analysis on Networking Structure of Antalya City Region ....................61
5.1.1. Network of Human Flows ......................................................................63
5.1.1.1 Network of Human Flows for Work .................................................63
5.1.1.2 Network of Human Flows for Public Services ..................................64
5.1.1.3 Network of Human Flows for Leisure, Recreation or Visiting ..........65
5.1.2 Joint Activity Networks in Antalya Region .............................................65
5.1.2.1 Network of partnership and cooperation ...........................................66
5.1.2.2 Network of knowledge sharing and consultancy ...............................67
5.1.2.3. Network of Common Project ...........................................................68
5.1.2.4 Network of Common investment ......................................................68
5.1.2.5 Network of machinery and technical assistance ................................69

ix
5.1.2.6 Network of Financial Support ..........................................................70
5.1.2.7 Network of common cultural activity ...............................................71
5.2 Econometric Model to Determine Factors Affecting Economic Performance
and Positions of Settlements in Antalya City Region ...........................................72
5.2.1 Model Description, Variables and Data ...................................................72
5.2.2 Data Analysis on Attractivity of Settlements ...........................................79
5.2.3 Data analysis on Centrality of Settlements in Policy Networks and its
determinants.....................................................................................................85
5.2.4 Data analysis on Economic Performance of Settlements ..........................94
5.2.5 Relations between different measures of attractivity, economic
performance and centrality in policy networks ............................................... 100
5.3 Findings of the econometric models ............................................................ 103
5.3.1 Findings of the econometric model related to economic performances of
settlements .................................................................................................... 103
5.3.2 Findings of the econometric model related to attractivity of settlements 105
5.3.3 Findings of the econometric model related to centrality in policy networks
...................................................................................................................... 107
6. CONCLUSION ................................................................................................ 110
REFERENCES ..................................................................................................... 115

x
LIST OF FIGURES
Figure 1 Spatial Distributions of Economic Sectors .................................................44
Figure 2 Spatial Distribution of Agriculture Sector .................................................46
Figure 3 Spatial Distribution of Manufacturing Sector ............................................47
Figure 4 Spatial Distribution of Mining Sector ........................................................48
Figure 5 Spatial Distribution of Construction Sector ...............................................49
Figure 6 Spatial Distribution of Tourism Sector ......................................................50
Figure 7 Development of Employment Percentages ................................................51
Figure 8 Population Distribution in 1950.................................................................52
Figure 9 Population Distribution in 2000.................................................................53
Figure 10 Population increase rate 1990-2000 .........................................................54
Figure 11 Sub-regions of Antalya City Region ........................................................60
Figure 12 Degree centrality analysis for the category of people coming to work in a
coordinated way ..............................................................................................63
Figure 13 Degree centrality analysis for the category of people coming for public
services in a coordinated way ..........................................................................64
Figure 14 Degree centrality analysis for the category of people coming for leisure,
entertainment or visiting in a coordinated way .................................................65
Figure 15 Degree centrality analysis for the category of partnership and cooperation
in a coordinated way .......................................................................................66
Figure 16 Degree centrality analysis for the category of knowledge sharing and
consultancy in a coordinated way ....................................................................67
Figure 17 Degree centrality analysis for the category of common projects in a
coordinated way ..............................................................................................68
Figure 18 Degree centrality analysis for the category of common investment in a
coordinated way ..............................................................................................69

xi
Figure 19 Degree centrality analysis for the category of machinery and technical
assistance in a coordinated way .......................................................................70
Figure 20 Degree centrality analysis for the category of financial support in a
coordinated way ..............................................................................................71
Figure 21 Degree centrality analysis for the category of common cultural activity in a
coordinated way ..............................................................................................71
Figure 22 Centrality in policy networks by centrality in flows in year 2006.............79
Figure 23 Number of telecom subscribers per home by centrality in flows in year
2006 ................................................................................................................80
Figure 24 Percentage of industrial employment by centrality in flows in year 2006 .81
Figure 25 Public expenditure per capita by centrality in flows in year 2006.............82
Figure 26 Level of Employment and Percentage of Industrial Employment by
Centrality in Total Flows .................................................................................83
Figure 27 Krugman Specialization Index and Infant Mortality Rate by Centrality in
Total Flows .....................................................................................................84
Figure 28 Ratio of woman literacy and ratio of university graduates to population by
centrality in total flows ....................................................................................85
Figure 29 Centrality in total flows by centrality in total policy networks .................86
Figure 30 Percentage of industrial employment by centrality in total policy networks
........................................................................................................................87
Figure 31 Public expenditure per capita by centrality in total policy networks .........88
Figure 32 Level of employment and percentage of financial employment by
centrality in policy networks ...........................................................................89
Figure 33 Ratio of working woman to total employment and ratio of entrepreneurs to
total employment by centrality in policy networks ...........................................90
Figure 34 Krugman’s Specialization Index and location quotient for high-tech sector
........................................................................................................................91
Figure 35 Ratio of woman literacy and ratio of university graduates to population by
centrality in total policy networks ....................................................................92

xii
Figure 36 Number of telecom subscribers per home and infant mortality rate by
centrality in policy networks ...........................................................................93
Figure 37 Administrative Status by Centrality in Policy Networks ..........................93
Figure 38 Krugman’s Specialization Index by Level of Employment in 2000..........94
Figure 39 Number of telecom subscribers per home by level of employment ..........95
Figure 40 Percentage of financial employment by level of employment ..................96
Figure 41 Centrality in total flows and centrality in policy networks by level of
employment ....................................................................................................97
Figure 42 Ratio of woman literacy and ratio of university graduates to population by
level of employment ........................................................................................97
Figure 43 Ratio of working woman and ratio of entrepreneurs to total employment by
level of employment ........................................................................................98
Figure 44 Public expenditure per capita and infant mortality rate by level of
employment ....................................................................................................99
Figure 45 Percentage of industrial employment by level of employment ............... 100

xiii
LIST OF TABLES
Table 1 Sources of economic performance ..............................................................22
Table 2 Sources of urban attractivity .......................................................................37
Table 3 Distribution of Economic Sectors in Districts .............................................45
Table 4 The share of public investment expenditures of Antalya City Region
according to Turkey-2001 prices .....................................................................55
Table 5 The share of Investment Incentives Certificates of Antalya City Region
according to Turkey, 2001 Prices ....................................................................56
Table 6 Variables used in the models ......................................................................77
Table 7 Correlation Coefficients Between Different Variables used in the models. 101
Table 8 Findings of the model .............................................................................. 104
Table 9 Findings of the model .............................................................................. 106
Table 10 Findings of the model ............................................................................. 108

1
CHAPTER 1
INTRODUCTION
Effects of globalization changed traditional relations between settlements and urban
networking became one of the key notions gaining importance. According to
Giddens (2001) globalization represents a transformation of space and time through
the emergence of modern information and communication technologies. Old
traditional relations between capital and labor or management relations within a
specific national or regional boundary are being loosened. Related to this change
nation states have faced with a certain loss of significance and new heterarchic
structure of global urban system occurred. Hierarchical relations represented by
traditional “administrative town walls” do not just limit the economic potential of the
city but are also responsible for inadequate allocation and distribution of resources in
the region as a whole. The traditional hierarchical relations between cities are no
longer appropriate and the newly emerging spatial relational metaphor is urban
networks. (Knox, 1995, p.6)
There is need for a new urban equilibrium that can be called “concerted” region
which aims to reach beyond local boundaries. Today’s decision making actors and
institutions are not homogeneous but they have a vertically and horizontally
complex, multilevel structure and act according to their interests and motives.
Implementation of urban and regional policies needs vertical and horizontal political
interaction. New models of active cooperation between administrations emerge
because of this need. Networks are one of these models as well as new forms of
2
cooperation between local authorities. (Arndt, Gawron, Jahnke, 2000)
Network type of relations is needed to go beyond one sided dualisms like state-
market or public-private. Hierarchies and pure market relations are replaced with
networking type of relations. Belonging to a network is a source of power in this era
and there is a blurring border between competitiveness and cooperation, cities should
compete, co-operate and create functional networks at the same time. (Sotarauta,
Linnamaa 1998)
Again with globalization, patterns of production and trade in manufactured goods
have shifted towards the new international division of labor in which the
multinational enterprises are taking place in the locations where labor cost is low
such as newly industrialized countries and in less developed countries. Meanwhile
developed nations consider the sectors which they will have competitive advantage
and to sustain this competitive advantage. (Lever, 1999)
Cities are confronting fiercer competition than before. (Sotarauta, Linnamaa 1998)
Cities, regions and nations have no option than being competitive in order to survive
in the new global marketplace which is forged by the new information and
knowledge driven economy. (Gardiner et al) In addition to this, it is evident that
some regions grow faster and show a better ability to develop new economic
activities than other regions. Income and employment generated within boundaries of
those regions exceed others, in other words, they perform better. (Begg 1999,
Boschma, 2004) The reason why they are more successful is explained by their
economic performance.
Increasing international mobility of capital and more open national markets, which
are results of globalization, made notion of economic performance of cities core
increasing foreign direct investment. Emergence of new markets increased the
pressures on costs, economic insecurity and risk of instability. In such an topics of
3
regional development. Declining trade barriers, falling transport costs and the growth
of transnational corporations resulted in rising exports, imports and environment
improving the efficiency of firms’ internal processes and to enhance the quality and
value of their products, which is productivity, is closely related with economic
performance.
Improving economic performance has become a key issue for regional and economic
policies trying to meet the challenges of global competition and mainstream regional
development policy is focused on increasing performance of cities and regions
instead of convergence between regions. Standard of living and prosperity of a
region can be defined as a target of these policy making efforts. Begg, (1999)
considers the importance of improved economic performance as the path to
economic nirvana.
In such an era that economic performance and networking are two popular notions of
regional development, defining the determinants of economic performance and
networking patterns of settlements in an urban network gains importance. The aim of
this thesis is to explore the factors affecting the economic performance and
networking patterns of settlements (in terms of attractivity and centrality in policy
networks) in an urban network in city region context. To achieve this aim, after
analyzing city region literature, determinants of economic performance and centrality
in a network are reviewed from the related literature. Then, for Antalya Region,
spatial sectoral differentiations, factors affecting the economic performance and
positions of settlements in the entire network are examined.

4
CHAPTER 2
ECONOMIC PERFORMANCE AND NETWORKING IN
CITY REGION CONTEXT
The aim of this chapter is to discuss firstly city region approach which is defined by
networks. Secondly, it focuses on the factors affecting the economic performance of
individual settlements in a city region. As a result of global transformation process
individual performances of settlements are not enough to enhance the unity and
settlements cannot enjoy the benefits of city regions unless they are not a member of
the network. So the theoretical chapter continues with the network metaphor and the
determinants of networking patterns.
2.1 City Region Theory
City regions can be seen as a spatial reflexion of the trends stated in the introduction
chapter, so the literature related to this study starts with city region approach.
2.1.1 Emergence and Popularity of City Regions
One of the factors that positively affect the popularity of city region is the devolution
processes. In 1960s-70s the world was dominated by strongly centralized
governments and the type of policy making was top-down oriented. Over the past
three decades this structure transformed and regionalist tendencies emerged. So the
transfer of power, authority and resources increased the importance of city regions.
(Pose, 2008)

5
The concept of city region became popular recently in academic and policy
environments. The point of departure can be defined as increasing importance of
dense nodes of human labor around which socio-economic activities are located. The
concept is also related closely with “new regionalism” approach which defines city
region as adequate special scale for sustaining economic governance. The human
labor stated above is usually located in relatively large cities with systems of medium
sized cities in close proximity and in relation with its semi-urban and rural
hinterland.
The popularity of the concept can also be seen as a reaction to the views of
globalization that emphasizes the “location no longer matters” idea. Increasing
mobility of factors of production did not undermine the need for urban
concentrations instead it provoked city region and according to Scott (et. al 2001)
they became the “regional motors of global economy” and dynamism and proximity
of city regions positively affect the wealth of semi urban and rural population.
Again with globalization, central governments’ ability to deal with varied demands
of all localities is decreasing. This transformation of central governments and as a
result increasing importance of sub-national actors and units created a multiscalar
structure and city regions have a crucial role in this game. With this transformation
of sectoral to territorial approach, need for policy diversity and innovation for
localities, need for bottom-up and horizontal coordination gained importance. (Pose,
2008)
Liberalization of the investment flows is another reason of the rise of city regions.
Displacement of hierarchic international relations with heterarchic ones made
international competition possible which is one of the basic features of the new
regionalism.

6
Unlike many recent predictions, geography does not disappear; on the contrary
globalization makes geographical differences and specialization more apparent. It
seems as a paradox that improvements in transportation and communication
technologies reduces the boundaries of space on one hand but on the other hand
dense urban agglomerations tend to continue to increase in size and importance. The
reason of this is that the networking structures that are crucial in this new global
geography are still associated with locationally dependent costs and results of this
networking are often synergistic outcomes such as clusters. (Scott, 2001)
According to Scott, city region are presented as selective “windows of locational
opportunity” for developing a specialized reordering of economic activity. Scott
2001 explains the reasons of the massive recent expansion of the city regions as:
Circumstance that many of the leading sectors of capitalism today are
organized as dense and intensively localized networks of producers with
powerful endogenous growth mechanisms and with an increasing global
market reach.
Finally, regional level has indirectly been promoted by:
• Policies to create a “Europe of Regions”
• Proposals on spatial planning and EU Structural Funds
• Interterritorial cooperation at the regional level through the INTERREG IIC
initiative
• European Spatial Development Perspective
2.1.2 Definitions of City Regions
All definitions of city region include a core city in relation with its hinterland by
7
functional ties. These ties include a combination of economic housing markets, travel
to work, marketing or retail catchment factors. But the essence of the dominant core,
semi urban and rural hinterland has been modified to a multicore structure making
the city region a polycentric geographical unit. Different definitions related to city
region concept are given below.
Tewdwr-Jones & McNeill, 2000
We have defined ‘city–region’ to refer to: a strategic and political level of
administration and policy making, extending beyond the administrative
boundaries of single urban local government authorities to include urban
and/or semi-urban hinterlands. This definition includes a range of institutions
and agencies representing local and regional governance that possess an
interest in urban and/or economic development matters that, together, form a
strategic level of policy making intended to formulate or implement policies
on a broader metropolitan scale.
Ache, 2000
The city region transcends the local level (as the basic administrative unit) and
also goes beyond the city level. In a spatial sense, the city region is very much
like a conurbation or metropolitan area. Most importantly, the city region is
far more of a complex system than a monolithic entity. The evolving city
region constitutes a political and economic power field comprised of a variety
of cultures and societies.
Scott, 2001
From a geographic point of view, global city-regions constitute dense
polarized masses of capital, labor, and social life that are bound up in intricate
ways in intensifying and far-flung extranational relationships. As such, they
8
represent an outgrowth of large metropolitan areas—or contiguous sets of
metropolitan areas—together with surrounding hinterlands of variable extent
which may themselves be sites of scattered urban settlements. In parallel with
these developments, embryonic consolidation of global city-regions into
definite political entities is also occurring in many cases, as contiguous local
government areas (counties, metropolitan areas, municipalities, etc.) club
together to form spatial coalitions in search of effective bases from which to
deal with both the threats and the opportunities of globalization.
Vermeijden, 2001
The ‘city region’ [denotes] a spatial hierarchy of satellite towns surrounding a
central core city, on which the satellite settlements would depend for both
employment and services.
Davoudi, 2003, p. 986
The concept of city region (which is consistent with Geddes’ original
definition of conurbation and Gras’ concept of ‘metropolitan economy’)
moves beyond such distinction and covers not only the commuting hinterland
of the city but also the whole area which is economically, socially, and
culturally dominated by the city.
Scott & Storper, 2003
The city-regions are locomotives of the national economies within which they
are situated, in that they are the sites of dense masses of interrelated economic
activities that also typically have high levels of productivity by reason of their
jointly-generated agglomeration economies and their innovative potentials.

9
ODPM, 2005
The concept of the city-region can be understood as a functionally inter-
related geographical area comprising a central, or Core City, as part of a
network of urban centers and rural hinterlands. A little bit like the hub (city)
and the spokes (surrounding urban/rural areas) on a bicycle wheel.
Hildreth & Clark, 2005
A city-region is essentially about the economic, social and environmental
reach of the city into its hinterland. It is not a homogenous concept with clear
boundaries. But it recognizes that decisions taken by people – where to live,
work, travel to work, shop, visit for entertainment and leisure – and the
economic activity by firms and investors – with customers and suppliers –
means that there are important economic, environmental and social
interdependencies between the city and it’s neighboring towns and commuter
hinterland. These relationships are not usually accounted for local authority
administrative boundaries.
In scope of this thesis, the crucial aspects of city regions include:
• a spatial reflection of global transformation trends
• dense and localized networks within global market reach (networks that are
basics of city region formation, includes high level of contact, cooperation
and information exchange and so they produce the institutional capacity of
the region)
• local decision making authorities
• dynamism and prosperity of the core positively affects semi urban and rural
population
• relations beyond administrative borders

10
• coordination and cooperation for competitive power
2.1.3 Advantages of city region
Nowadays city regions are emphasized in terms of their functionality for creativity,
innovation, development and competition in the global world. (Jones and Ward,
2007) Urban agglomeration creates the ability of cities to function as centers of
learning, innovation and creativity. Because cities are locations for dense
transactions of many interdependent activities, including new transactional
experiences, information creation and circulation. (Scott, 2001) Agglomeration
creates positive externalities like development of cooperation networks and labor
markets, sharing of strategic assets, infrastructures and resources. (Jones and Ward,
2007) Scott and Storper (2003) emphasizes importance of city regions as:
The most striking forms of agglomeration in evidence today are the super-
agglomerations or city regions that have came into being all over the world in
the last few decades …These city regions are locomotives of the national
economies within which they are situated
Usually boundaries of a city region do not match existing administrative borders and
in the most cases it is larger than the administrative divisions and it is not fixed in
time-it changes. With the rise of city regions, greater coordination and improved
governance is needed. Smaller territories make horizontal coordination a crucial
aspect within the actors of the unit and so vertical coordination with national level.
(Pose, 2008)
Proponents of city regions support the idea that territories of a city region are not
only its physical location but also include entities which are results of common
interests. Another idea supported by proponents of city region is that it is the

11
economic locomotive of the globalized world and the welfare of their territories
depends on their success. Finally, they think that city region is the ideal scale of
policy making and intervention.
According to Jacobs (1854) rather than the nations, cities are the agents of wealth
creation with their strong trade relations which are specialized in different sectors. As
a result of this specialization, competition occurs and she states that because of these
reasons, city regions are more functional economic entities than nation states. City
regions are also political entities because they can include autonomously developed
regulatory and decision making capacities.
In large and heterogeneous nation states, it is hard for the central government to
respond to the local needs and priorities. City regions respond to local needs and
priorities better than the national level governments. The entire city region is seen as
a functional economic entity and there is a complementarity between the interests of
its core and periphery makes any intervention at city region level beneficiary for the
whole region.
Another advantage of city region is that it is a good scale for policy innovation
because of its internal diversity, initiatives to innovate at regional level increases
when its welfare depends on its own dynamism and the risky structure of innovation
makes it easy to operate at regional level to diminish the level of uncertainty and
potential costs of failure. (Pose, 2008)
Another positive factor for policy implementation at city regions a perfect match
between boundaries of city region and administrative unit which reduces the
institutional costs and risks of governance.

12
Last advantage of city region approach is the proximity between decision makers,
citizens and stakeholders. As a result of this proximity regular interaction,
transparency and accountability, level of social capital, local capital and trust
increases. (Pose, 2008)
Social and institutional factors in regional development and growth have gained
importance recently so institutions and networks are placed at the core of policy
attempts. Larger, wealthier and more accessible city regions have higher potential to
fulfill the advantages of city region approach. They include more efficient
institutions and active civil societies. (Pose, 2008)
Allmendinger and Jones (2000) describe the success of a region as follows:
The success of a particular region, therefore, is not only dependent on the
existence of advantageous physical assets or resources, but also arises through
the emergence of socially and institutionally mediated forms of selective co-
operation between actors
2.1.4 Critiques to city regions
Although being a functional economic entity, the role of politics and diverse forms of
governance and political participation that are crucial factors for success stories in
city regions are not clearly defined and they “might” emerge in city regions. But the
proponents of city region approach see it as an autonomous political and economic
space. (Jones and Ward, 2007)
Oppositions to city region approach include continued significance of national state
power for regional competitiveness strategies. This view suggests that regions have
limited capacities to act politics of territory and crisis management and the linkage

13
between state and political economy of scale is very crucial. (Etherington and Jones,
2009) Emphasis is on the core of the city region at the expense of secondary cities,
smaller towns and rural areas. It downplays the importance of national governments’
role in reducing regional disparities. (Etherington and Jones, 2009)
Policy making at city region level may be difficult because of the financial
constraints. In most cases city region do not have significant tax rising powers and
rely on transfers from the central government so their financial capacity is limited.
Another disadvantage is that the policy making in some areas may be inefficient in
regional scale because of inadequate demographic and economic base of the city
region. Costs increase when providing some services at regional level and benefits
decrease with respond to national scale. (Pose, 2008)
Capacity constraints of smaller, poorer and less influential city regions are another
disadvantage of city region approach. They rely on weaker tax bases, have less
access to financial markets, and command less influence over central governments.
so they have less competitive power with the reduction of the role of central states.
City region approach also generates a number of practical problems related to the
policy implementation. Clearly identifying which actors should be involved in the
participatory process, issues of leadership and responsibility, problems of defection
and enforcement and the scale of functional areas that city region policies should
deal with are some of these problems. Another problem may arise with high level
involvement of non-local players such as central government and international
institutions which diminishes the governance, sustainability and empowering nature
of city region approach. Policy making in city region level have certain risks and
benefits. The success of the process depends on the starting conditions of the
territories and the governance structure of the territory. (Pose, 2008)

14
In general city region strategies tend to pay insufficient attention to redistributional
consequences of competitive policies. (Etherington and Jones, 2009) According to
Andrew E. G instead of this approach that directly defines city region as an
autonomous political and economic space, city region should be seen as an integral
component of state. “not an input, not an output, but part of the process and politics
of state re-territorialization.
2.2 Economic Performance of Settlements
To define the economic performance of cities, it is necessary to employ various
related concepts. Begg (1999), states that economic performance, competitiveness,
full employment of resources and productivity in a city have the same meaning.
All of the factors that affect the economic performance of regions are not under the
direct control of urban regions. National taxation policies, tariffs, macro economic
conditions, incentive policies etc. are some of these external factors. However, global
forces are changing this situation and these external factors are becoming less
important. For example, tariff policies are losing importance because of trade
liberalization or decentralization processes are resulting in devolution of
responsibility of critical competitiveness factors to local level. (Webster and Muller,
2000)
In the globalized world, international competition cannot be explained through a one
sided approach. Indicators like economic output, the rate of economic growth, export
market shares and the balance of trade are not enough to define the competitiveness
of localities. Economic output is no longer depends on the countries and regions
themselves due to transfer of capital, goods and profits between multinational
companies. (Lengley, 2003)

15
The factors of economic performance are defined from various authors and in
various contexts. To define the factors affecting the economic performance of a
location, input variables are defined; and to measure economic performance of a
location output (target) variables are defined.
2.2.1 Input variables affecting economic performance
Economic performance of settlements in an urban network can be seen as the
cumulative outcome of a number of input factors like which can be grouped under
four headings which are i) Innovativeness, learning and human resources, ii)
infrastructure and local business environment, iii) sectoral trends and specialization
and firms and iv) institutional milieu and networking. (Lengley, 2003; Kresl and
Singh, 1998; Budd,and Hirmis 2004, Sotarauta, Linnamaa 1998, Turok, 2004, Lever,
1999, Cheshire, 1996)
2.2.1.1 Innovativeness, learning and human resources
In the long term, regions ability to respond to any kind of technological, business,
environmental or other challenges depends on the innovational environment it has
and innovation and learning factor is related with the capacity of firms to develop
new processes and products. Fast introduction of innovations and new technologies,
successful R&D activities and their fast and wide-ranging distribution are one of the
most effective factors to increase competitiveness. Due to development of research,
innovation, education and training, spillover of scientific and technological
advantages can be produced. Also access to different networks makes it easy to learn,
to benefit from experience of others.

16
Human resources include skill levels, availability and cost of labor. In successful
regions, skills of the workforce and the share of educated and skilled labor in total
population are high. According to Webster and Muller, 2000, the ability of an urban
region to move up value chains is directly related with its human resources. Effective
education system that can flexibly adjust to changing demands of labor markets are
essential for development of human capital and have also positive effects on
competitiveness. Human resource of a region is not only measured by education
level, training facilities, and skills but also other attributes like entrepreneurship,
creativity and risk tolerance are important. As a result level of human capital and
investments in human capital are crucial factors for regional high economic
performance.
2.2.1.2 Infrastructure and local business environment
Infrastructure is important to meet the needs of local sectors and clusters.
Infrastructure and local environment includes supply, quality and the cost of factors
of production like human capital, availability of property and complementary
services, availability and diversity of subcontractors, quality and cost of transport,
communication, information and other infrastructure networks. Diamond and
Spence’s (1989) survey of 190 business establishments shows that an efficient and
up-to-date transaction-facilitating infrastructure is vital to a growth-oriented
economy. In recent years, telecommunication facilities are increasingly seen as a
vital tool for business administration as they can handle massive flows of
information and transactions concurrently to provide spatial integration of different
sectors of economic activity (Wong, 1998). Geographical location and accessibility
of regions are important to overcome the problems like limited range of opportunities
and high travel costs. Transport and communications infrastructure helps to reduce

17
the effects of geographical limitations providing access to potential markets and
suppliers. Also availability of education and training services is a part of this factor
because it shapes the labor supply which is a crucial factor of production.
Deficiencies in this basic infrastructure make a region less competitive.
Importance of the local environment which influences the willingness of mobile
workers to locate in the city has also influence on the productivity, innovativeness
and dynamism of local business and so the economic performance of the region.
Besides attracting firms, attracting the human capital by influencing the willingness
of mobile workers to locate in the city, a city needs attraction of the locality
(amenity) is a crucial factor. The business environment of a region includes factors
that are outside the direct control of the firm, but it has a significant influence on the
economic performance of the region. It includes social and environmental factors
like the quality of the residential accommodation, urban environment and quality of
life, climate conditions, pollution levels, public safety, health and education facilities,
recreational and cultural facilities etc. These factors necessitate a high public sector
capacity which can be defined as:
The ability of the permanent administrative machinery of the government to
implement policies, deliver services and provide policy advise to decision
makers (Polidano 2000, 805)
Taxes and charges determined by the authorities affect costs of production and so the
attractiveness of the localities. Lastly, social cohesion can be regarded as a positive
factor of competitiveness under this title.
The reason why local business environment including infrastructure and local
environment is an important factor of competitiveness is that it directly affects the
input costs of the employers in the area and once achieved it becomes a

18
distinguishing attribute that make an urban region desirable to investors when other
factors are perceived to be equal. (Webster and Muller, 2000)
2.2.1.3 Sectoral trends, specialization and firms
The competition between countries is for world market shares and from this
viewpoint for most cities probability of success lies in specialization. The workforce
of successful regions typically concentrates in sectors with high value added like
information technology, financial services, and telecommunications and high tech
industries. In these sectors productivity and employment usually increases and so the
economic performance of the region. In the short term, economic performance
depends on the economies structure and on its sectoral specialization.
Inherited mix of industries which is the outcome of this historical development of the
city has positive effects on city’s capacity to attract new activities. Doeringer et al.
(1987) find that industrial mix interacting with national trends is the most significant
influence on a state’s short- and long-term economic performance in the US. This
inheritance of the city shapes sectoral trends. Aggregate performance of the national
economy, long term structural changes and national policy changes can affect
sectoral trends and so performance of cities.
Company characteristics are also another determinant of economic performance.
Ownership and decision-making power of companies positively affect the
performance if they are indigenously owned with respect to those of under external
control. The size of companies in combination with the sectoral mix has an influence
on economic performance. SME’s constitute an important source for it. Flexible and
adoptable characteristics of SME’s make them responsible for generating
employment in the region. In the globalized world, using information technology and
networks, SME’s are acting as independent global players. Rapid start-up rates and

19
high survival rates are also desirable characteristics for urban economic performance.
2.2.1.4 Institutional milieu and networking
Institutional milieu is one of the key factors explaining the economic performance of
successful regions (Porter, 1990). Efficient cooperation among existing institutions
and efficiency of administrative services has a direct affect on regional performance.
‘Partnership’ and ‘synergy-building’ have been repeatedly emphasized by regional
policy documents such as the competitiveness White Paper (HM Government, 1993).
Institutional milieu includes business culture, governance and policy frameworks and
network behavior. According to Webster and Muller, (2000):
Development of competitiveness is largely a product of networking, which is based on, and creates social capital.
Social capital is defined as the features of social organizations like trust, norms, and
networks that can improve the efficiency of society by facilitating coordinated
actions. The contributions of networking to economic performance are the topic of
the next chapter.
2.2.2 Output Indicators of Economic Performance
When different competitiveness factors are brought together, they determine “urban
economic performance”. Connected with employment rate and productivity, urban
performance leads to increase in standard of living and so the quality of life. These
variables of employment rate, productivity and standard of living may be considered
as outputs of a good urban performance.

20
To measure the economic performance of a region literature also defines output
variables say depend on the input variables explained above. Most commonly used
output variables for measuring competitiveness are per capita GDP, labor
productivity, employment rate and economic openness (exports and imports)
(Lengley 2003).
Beside this, in a study Kresl and Singh (1998) used variables like growth of urban
economies population, growth of business services receipts. Huggins used earnings
(full-time wages) and unemployment figures to define competitiveness. Cheshire
1996 used variables of migration in addition to these variables to define
competitiveness of cities.
Output variables help us to know about economic performance of a region but it is
not enough to suggest policies to improve performance of that region. The basic
motivations behind efforts to improve performance are creation of employment
opportunities and increasing efficiency (productivity). So policy makers need to
know about the factor variables affecting economic performance of a region.
In addition to these output variables, Kresl (1995) determines six attributes which
signal a competitive city: i) The jobs created should be high-skill, high-income jobs,
ii) production should evolve towards environmentally benign goods and services, iii)
production should be concentrated in goods and services with desirable
characteristics, like high income elasticity of demand, iv) the rate of economic
growth should be appropriate to achieve full employment without generating the
negative aspects of overstressed markets, v) the city should specialize in activities
that will enable it to gain control over its future- that is, to choose among alternative
futures rather than passively accepting its lot, vi) the city should be able to enhance
its position in the urban hierarchy.

21
2.2.3 Review of Studies on Economic Performance of Cities
Empirical studies use a variety of variables to define input and output indicators for
economic performance of settlements. Most of them used multivariate regression
analysis and four this study its important to list the factors used in those quantitative
analysis. Following table introduces a list of these variables:

22
Table 1 Sources of economic performance
Source Variables
Begg, 1999 Sectoral trends, company characteristics, business environment,
innovativeness and learning.
Lengyel, 2003 Development factors: Research and technological development, small
and medium sized enterprises, foreign direct investment, infrastructure
and human capital, institutions and social capital
Success determinants: Economic structure, innovative activity,
regional accessibility, skills of workforce, decision centers,
environment
Kresl and Singh, 1998 Attractivity of the location for its non-inhabitants, growth of
manufacturing value added, investments in plant and equipment, in
human capital and in infrastructure
Budd and Hirmis, 2004 Labor market conditions and transport costs, company size, research
and intensity, innovative capacity and export orientation, the degree of
institutional embeddedness, government structures and demonstration
effects
Huggins, 2000 Business density (firms per capita), knowledge based business (as a
percentage of all business) and economic participation (activity rates)
Lever, 1999 Specialization, sustainability and quality of life, civic leadership,
flexibility in labor force, a responsive public sector, effective public
private partnerships and entrepreneurial milieu
Cheshire et al., 1996 Economic growth, unemployment rates and migration
Source: Author’s own elaboration

23
2.3 Network Metaphor
The relationships among settlements no longer occur only on the basis of territorial
hierarchy-type relationships, driven by non-overlapping market logics, as
Christaller’s central place theory. Other new types of non-territorial and long-
distance relationship emerge, among cities of the same size, and of different or
similar specialization patterns which are called network element of a polycentric
region. (Capello, 2000)
Usually planning policy concepts referring to polycentric urban regions use network
metaphor. This metaphor of network emphasizes the complex and strong
relationships between cities and thus the coherence and unity of the region. In
addition networks are closely related with terms such as economies of scale, critical
mass and synergy. Networks are made up of nodes (cities, households, firms,
organizations and individuals), linkages between the nodes (infrastructure,
relationships, ties), flows (people, goods, information, capital) and meshes. (Meijers,
2005)
In polycentric urban regions, cities seem to have coalesced in functional and
morphological terms into larger and more dispersed regional urban systems.
Polycentric urban regions are often defined as collections of historically distinct and
both administratively and politically independent cities located in close proximity
and well connected through infrastructure. There are a lot of synonyms of polycentric
urban regions. Multicore city regions, network cities, city networks and
polynucleated metropolitan regions are some of these synonyms. Also, there exist
earlier concepts about polycentrism which are dispersed city, megalopolis or the
regional city. (Meijers, 2005)
Networks can be grouped under two headings: club type networks and web type

24
networks. In club networks actors share a common objective, activity or service,
while also having parallel interests and transaction chains. On the other hand web
type of networks is characterized by different activities of the actors. These are
complementary instead of similar and they are linked in a serial way. Club type
networks are also called synergy networks and web type of networks are called
complementarity networks. In club networks, horizontal synergy can be achieved and
in web network, vertical synergy is achieved. In the case of horizontal synergy, the
synergy derives from the co-operation leading to economies of scale and so called
positive network externalities. (Meijers, 2005)
Urban regions may be characterized as club networks when cities having similar
characteristics join forces to achieve some kind of a common objective or common
interests. This co-operation generates economies of scale. Port cities or tourist cities
are examples of this kind. Polycentric urban regions resemble web networks when
the individual cities perform different economic roles and host complementary urban
facilities, activities, residential and working environments. Web type of networks has
more relevance for polycentric urban regions.
Many spatially restricted numbers of towns form a systematic unit through functional
relations like complementary urban functions or economic exchange or through
interactions of people, money, goods or information. In addition to this, urban
networks are defined through political cooperation between the municipalities.
Instead of independence of municipal actors, the concept of urban networks
necessitates less hierarchy between actors, so complementarity is needed and it
concentrates on multiple interactions. The prime hypothesis for the current relevance
of urban networks in European spatial and regional policy is that networking
structures seem particularly suited to reflecting multiple interaction and dependence
and respond flexibly to the demands of globalization and regionalization, structural
economic change. Compared to a development strategy based on certain functional

25
entities or notion of central places theory, networks do not depend on a territorial
logic, instead depend on a logic based on long distance competition and cooperation
regardless of distance barrier. Instead of transport costs and economies of scale, in
the network logic economies of vertical and horizontal integration and network
externalities are the main forces shaping the spatial organization of functions and
urban areas. Networks have a priority which is not to equip a single hub but to
initiate joint projects based on cooperation and communication. (Arndt, Gawron,
Jahnke, 2000)
2.3.1 The differences between hierarchic, heterarchic and networking relations
The structure and the mode of coordination between or within organizations are
related to the distinction between hierarchy and networking. According to Ansell
(2000):
A hierarchy is a pyramid of officers in which coordination is achieved
through vertical chains-of-command with higher level officers directing
the behavior of the officers below them. In contrast, network forms of
organizations operate horizontally as well as vertically and achieve
coordination through mutual adjustments rather than through command.
It is important also to define the difference between heterarchic and hierarchic
relations. The capacity of lower level units to have relationships with multiple higher
level centers as well as lateral links with units at the same organizational level
distinguishes heterarchy from a hierarchy. Kontopoulos (1993) states that while a
hierarchy is a “many-to-one” type of structural aggregation; heterarchy is a “many-
to-many” type of a relationship between different nodes in a social structure and
many-to-many type of relations offers dense networks and so high degrees of
connectivity.

26
Network has a multilateral character rather than bilateral where more frequently and
more systematically the many-to-one mapping is violated, the more the term network
becomes a distinctive concept.
An actor with high centrality in a network acts as a “facilitator”, “broker” or
“strategy maker” to bring other dispersed actors together to engage in mutually
beneficial cooperation. (Provan and Milward, 1995). In a hierarchical form of
activity central actor acts as a “gatekeeper” between noncommunicating parties. But
in a many-to-many type of relation, the central actor probably may act as a
“gateway” than a “gatekeeper”, creating and facilitating direct relationships between
communicating parties.
2.3.2 Urban policy networks
Origins of policy networks go back to 1950s. Lowi’s iron triangle comprised of a
government agency, a congress committee and an interest group (in north American
political system) can be thought as an early form of urban policy networks. Peters
(1996), describes iron triangles as exchange relationships between actors who are
aware of their mutual functional dependency for achieving success. Jordan states that
the idea of policy networks emerged in 1950s and 60s regular contacts between
individual interest groups, bureaucratic agencies and government. Private interest
involved in the sub-governments could become dominant. They could control their
members and could capture the government agency which is supposed to regulate
their activities which is called the agency capture. Theodore Lowi (1969) states that
there is a triangular nature between central government, congressional committee and
the interest group which is symbiotic. According to Peters (1986) the actors in the
iron triangle need each other. Pressure group needs government to have better service
for its members and to protect its connection with government. Government agency
need pressure group for political support. But iron triangles have also seen as a limit

27
to full expression of a democratic political system and in 1970’s pluralist model has
gained importance again. Heclo 1978 stressed the importance of issue networks
which is a form of more loosely tightened policy networks, a communication
network of interested parties. According to him instead of iron triangles which are
the closed to circles of control there exists fairly open issue networks. (Marsh, 1998)
Before networking approach, central place theory which was used to provide
infrastructure and services optionally based on specific points in all sub regions
based on hierarchical system of cities and communities. But urban networks go
beyond this simple model. Policy networks emerged in 1980’s as an attempt to build
a coherent theory and analytical toolbox through which consistent theories could be
carried out. Recently the concept became a normative model for policy making.
There are significant differences in the way the concept used in U.S, British or
German literature. But, all authors see policy networks as a key feature of modern
polities. (Marsh, 1998)
In today’s increasingly complex environment where the hierarchical coordination is
very difficult and potential of deregulation is limited due to market failures,
governance became more and more only feasible within policy networks in which
public and private actors are linked in a non-hierarchical way to exchange resources
and to coordinate their interest and actions.
Policy networks symbolize being against hierarchical and market forms of
governance. Hierarchies are described as a system which has strong central
coordination by government with tight public private relations which is too rigid to
respond to increasing requirements of policy effectiveness, efficiency and equity. On
the other hand market form of relations mean a system with no coupling and all
actors interact among interest maximizing rationales. The regulation associated with

28
market forms of governance do not protect society from market failures, therefore
policy networks are identified as the optimal solution for policy making and delivery.
Kickert (1997) states that policy network model is a democratic one. The government
is no longer seen as a superior, directive role but as one actor among a number with
roughly equal power. Sorensen and Torfing, 2005, describe this situation as:
In the wake of the many reports on government failure and the market
failure, public authorities are now aim to govern society by involving
different kinds of citizens, professionals, voluntary organizations, labor
market organizations and private firms in self regulating networks.
Policy networks are between these two models (hierarchical and market forms of
governance) and provide environment for loose structural coupling, interactions
between autonomous actors to generate negotiated consensus, shared value and
improve strategic coordination and problem solving capacity. Policy networks are
seen as a response to the increasing interdependence between state and private sector.
Interorganizational and intergovernmental partnerships gain importance in public
policy making and public administration. (Pierre, 1997) Within this perspective:
The policy network has therefore become an institutional innovation for
governance in a time of complexity and fragmentation.
From a managerial point of view Hertting (2004) explains the necessity of policy
networks he emphasizes the importance of lack of cooperation instead of lack of
control.

29
A policy network can be defined as:
A set of relatively stable relationships which are of non-hierarchical
and independent nature linking a variety of actors who share common
interests with regard to a policy and who exchange resources to pursue
these shared interests acknowledging that cooperation is the best way
to achieve common goals. (Besussi, 2006)
This definition is the only one which different actors agree on. But there is variety of
perspectives on understanding of policy networks:
Firstly, some authors understand policy networks as a useful metaphor. (Dowding,
1995) to describe the fact that policy making involves many and different actors
while others see policy networks as a theory and model capable of explaining policy
dynamics and outcomes (Carlsson, 2000).
Secondly, there is a debate between qualitative and quantitative analytical
approaches. (Marcussen and Olsen, 2005) Authors from both sides see policy
networks as an analytical tool. While quantitative approach ( Brinton and Provan,
1998, Knoke 1990-1996) uses network analysis to understand and describe the
structural properties of networks measured in terms of centrality, structural
equivalence or cohesion; qualitative approach (Bevir and Rhodes, 2003; Hay 2002)
focuses on the processes and on the contents of the interaction, using discourse
analysis and in depth interviews.
Last discussion on policy networks is between the authors from U.S. and Britain that
describe policy networks as a typology of interest intermediation and
intergovernmental organization and the authors from Europe that identify policy

30
networks as a specific and emerging form of governance. Rhodes (1981) states that
structural relationships between political institutions are the crucial elements in a
policy network rather than the interpersonal relations between individuals in those
institutions. Policy networks are a model of interest group representation which is
superior to pluralism and corporatism. In contrast Kickert and Klijn (1997) view
policy networks as a real change in structure of polity and as a new form of
governance because neither hierarchy nor markets are appropriate forms of
governance in a world characterized by increasing independence between the state
and the private sector. They suggest that the distinction between the state and the
civil society has been dissolved and this change necessitates a new form of
governance. Government organizations are no longer the central steering actor in
policy activities.
The model developed by Marsh and Rhodes in 1992 argues that the network
structures can define the agenda and outcomes of a policy network. Network’s
membership and distribution of resources among members lead to the definition of
different types of policy networks which have their extreme cases in policy
communities (tight policy networks) and issue networks (loose policy networks).
For many authors accountability and legitimacy deficit of policy networks are
important problems.
2.3.3 Contributions of policy networks to effective governance
The promise of policy networks is to produce more effective and legitimate policies
“without resting upon the authority and limitations of a single representative body”.
There are two contributions of policy networks to effective governance.
First contribution of policy networks to effective governance is that it enables the

31
proactive policy making via the participation of different actors and determining the
existing problems early, in other words it provides a certain degree of flexibility and
adjustment to the complexity of existing conditions. (Kooiman, 2000)
Second contribution is its ability to gather information about the policy and the
actors. Last contribution is that policy networks enables consensus building so limits
the implementation resistance. (Marin and Mayntz, 1991)
Not only policy networks blur the boundaries between state and the
society but they also expose policy making process to uncontrollable and
particularistic power games.
It is also seen as a “contribution to the territorially organized institutions of
representative democracy” (Sorensen and Torfing, 2005).
2.3.4 Networks for High Economic Performance
Administrative boundaries shape the policy formulation and implementation and
public administration tends to be organized in a territorial hierarchy. However many
spatial issues these days requires an approach that is formulated and applied at
multiple scales and across several administrative tiers. This is called governance
instead of government. Networking is one of the basic reflections of this new era.
Creating synergy is the basic contribution of networking to regional development.
The idea of synergy means being more than the sum of the parts and it is a central
objective in policies for polycentric urban regions. It is often popularly formulated as
1+1>2 which can be explained as the rise in the performance of a network through
efficient and effective interaction. Synergy provides economies of scale without
incurring the costs or agglomeration diseconomies that these large metropolises

32
entail. The economies of scale of a network apply only to the participants in the
network. Externalities exist when the cost of participating in the network is less than
the benefits of the co-operation. Network externalities are the main economic
advantages of network behavior. Network externality is a matter of exploiting scale
economies in complementary relationships and synergic effects in cooperative
activities achieved through participation in the network. From this point of view,
network externalities are club goods, can be achieved only by those economic actors
who are partners in the economic and spatial network. To generate synergy in a
region there should be co-operation and complementarity networks. Externalities are
present in both types of networks. Networks of cooperation result in regional
organizing capacity and its functioning leads to horizontal synergy. Networks of
cooperation are generally achieved in club type of networks. Meijers (2005) explains
this situation as:
So what is needed is regional organizing capacity which is the ability to
coordinate developments regionally through a more or less institutionalized
frame work of co-operation, debate, negotiation and decision making in pursuit
of regional interest in which a multitude of public and private stakeholders
participate. The externalities that may arise depend on the utilization and
functioning of such frameworks. Synergy requires a high level of interaction
which will generate the necessary network cohesion to make up for the
increased interdependency.
When economic roles of cities differentiate, in urban facilities, in business and
residential milieus coupled with a regional demand, it makes complementary
networking possible and leads to vertical synergy which is the surplus value
following from agglomeration or specialization effects. This type of a synergy results
from a specialization process, redistributing resources and activities among the
participating actors according to their competence. This means that the individual

33
performance of actors improves as they can focus their efforts on their core activities,
abandoning non-core activities unnecessarily absorbing energy. There are two
preconditions for generating complementarity.
• There must be differentiation in the supply of activities and/or places
• The geographical markets of demand for the activities or places must at least
partly overlap
It can also be emphasized that complementary networks are generally achieved in
web type of networks. Arndt, Gawron, Jahnke, (2000) describe this situation as:
The underlying assumption is that conurbations in particular do not today
offer the best organizational form for systems of towns seeking to create an
order founded on special directions and spatial distributions. Rather, location
quality of the overall region is served by a network of reciprocal and
complementary relationships which dispenses with a graded hierarchy.
Another contribution of urban networks to economic performance of cities is about
developing competence. Urban networks allow member settlements to achieve
locally unavailable know-how for efficient and advanced urban policies, managed in
a co-operative way with other members. Technical innovation (for example, new
techniques for a more efficient management of urban traffic) and new organizational
solutions for urban policy management (participative processes for common projects
among institutions, and with citizens, as well as intersectional approaches to the
solution of urban issues) embodied in success stories previously experienced by
partners, easily become a strategic starting-point for locally successful urban policies
for other member settlements. These advantages reflect the rationale for network
behavior: they are all achieved via a network behavior. The achievement of new

34
information in specific urban projects may easily represent a solution to a contingent
urban problem (for example, management of new policies, like waste disposal); the
achievement of a wider market through synergy networks is a more strategic medium
term goal, strengthening the position of the city in international urban competition. In
this perspective, the competence goal represents the most strategic aim for city
participation in a network, achieved through a joint co-operative effort with similar
cities with similar problems. (Capello, 2000)
2.4 Sources of Urban Attractivity in Actual Networks
Human flows are one of the main categories that can be defined as actual networks.
In the context of this study it is crucial to determine the factors affecting human
flows and making settlement more attractive for people.
Some cities have grown into mega cities and some into uncontrolled sprawl; others
have seen their centers decline with populations moving to the suburbs. In such
times, questions of the sources of urban attractivity draw greater attention.
(Chen and Coulson, 2002)
Differences related to growth and income of cities play an important role on their
attractivity. Settlements with rapid growth rates attract more human flows than
declining settlements (Gaag and Wissen, 2000). Gross city product (GDP at the city
level) is an important indicator of this king of attraction. A positive influence on
urban attractivity is expected because human flows are directed from lower to higher
income areas. A high level of salary is also a similar source of attraction.
Employment rate in cities is another source of attraction because a high
unemployment rate set barriers against mobile people looking for a job.

35
Another source of urban attractivity is ratio of proprietors which can be defined as a
ratio of private single-owner businesses in a city. A higher value indicates a more
conducive growth environment for private businesses as well as a greater potential
for the attraction of people looking for a job. For example, in China, private
businesses have become the major source of new jobs and the major employers of
surplus labor from the state as well as the rural sectors. These private businesses have
been less discriminatory against rural migrants than state enterprises. Moreover, a
greater value of this indicator also indicates a better survival environment for human
flows aiming to settle in the city. (Chen and Coulson, 2002)
Another indicator of high urban attractivity is the level of foreign direct investment.
This variable is expected to exert a positive pull on human flows into the cities
because of its effect on creating employment opportunities and boosting income.
Moreover, this indicator also strongly related with a city’s location, policy treatment
and historical development.
The availability of public transport is a direct indicator of quality of life in cities. An
efficient public transport makes the city more accessible people. So a positive
relation between urban attractivity and public transport is expected.
Level of public expenditures per capita can also be added among sources of urban
attractivity because it has positive effect on quality of urban life, assuming that
higher expenditures correlate with better public amenities, health care system,
schools (Chen and Coulson, 2002).
Findlay et al.’s study of livability in British cities aims to provide a map of where the
best quality of life can be found and a set of comparable indicators to measure the
performance of a city in attracting human flows (Findlay et al., 1998,). According to

36
this study, main characteristics of urban attractivity in terms of quality of life include
low crime, pollution and cost of living rates, racial harmony, and good health and
shopping facilities. In another study, sources of attractivity for young knowledge
workers are determined as amenities, environmental quality and social tolerance.
(Florida, 2002). Florida states the importance of these factors as:
The new economy dramatically transforms the role of the environment and
natural amenities from a source of raw material and a sink for waste disposal to
a key component of the total package required to attract talent and in doing so
generate economic growth (Florida, 2000, p. 5).
In another study cited by McCann in 2004, determinants of human flows between
settlements are defined as low crime rate, clean water, plentiful doctors, clean air,
many hospitals, good schools, housing appreciation, low property taxes, strong state
government, low income taxes
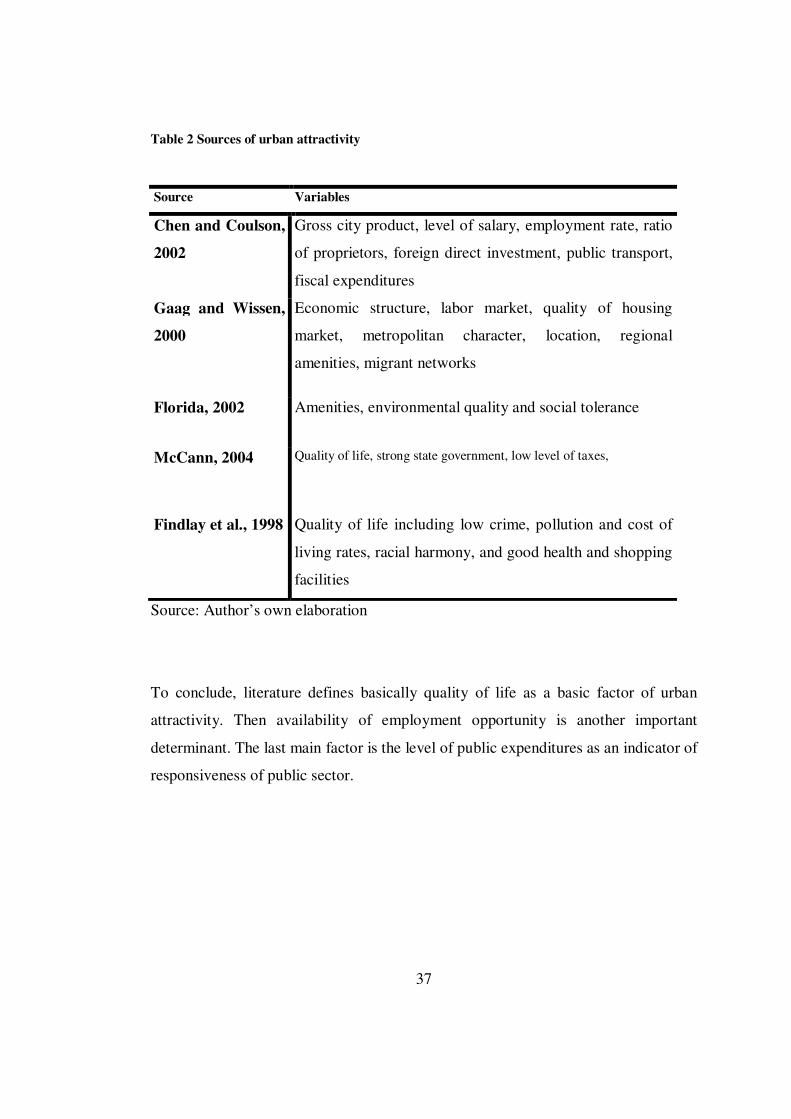
37
Table 2 Sources of urban attractivity
Source Variables
Chen and Coulson,
2002
Gross city product, level of salary, employment rate, ratio
of proprietors, foreign direct investment, public transport,
fiscal expenditures
Gaag and Wissen,
2000
Economic structure, labor market, quality of housing
market, metropolitan character, location, regional
amenities, migrant networks
Florida, 2002 Amenities, environmental quality and social tolerance
McCann, 2004 Quality of life, strong state government, low level of taxes,
Findlay et al., 1998 Quality of life including low crime, pollution and cost of
living rates, racial harmony, and good health and shopping
facilities
Source: Author’s own elaboration
To conclude, literature defines basically quality of life as a basic factor of urban
attractivity. Then availability of employment opportunity is another important
determinant. The last main factor is the level of public expenditures as an indicator of
responsiveness of public sector.
38
CHAPTER 3
METHODOLOGY
As expressed in the introduction section, the aim of this thesis is to explore the
factors affecting the differences of performance and positions of settlements in an
urban network. To achieve this aim, firstly determinants of having a higher central
position and better economic performance in a network are reviewed from the related
literature.
In this section, first, research methods that were used in the previous related studies
are reviewed. Second, main hypothesis and sub hypothesis of this thesis is explained.
Third, the research methodology that the study is based on is introduced. The model
that is designed to test the first three hypotheses is explained before the section on
the case study.
3.1 Methods used in the previous related studies
To define the structure of a network, the measures should rely on soft data such as
key informant interviews, focus groups, surveys and polls. An example of this kind
of empirical work is made by Ayda Eraydın (et al. 2007). In that study to define
networking structure in Đzmir City Region, a survey conducted to 39 municipalities
and data is collected on joint activities between them. Then social network analysis is
used to describe the relations.
In a study of Turin geographical school, France, researchers tried to reveal

39
empirically the network linkages among the centers in the Po Valley. The method
used was measuring the shifts between the actual and theoretical sectoral mix in each
centre. Existence of direct complementary relationships is mainly inferred in the case
where couples of neighboring centers of similar size present relatively a very high
and very low employment share in some sectors.
In another study made by Bocconi Economics University and Polytecnical
University, Italy, a flow data (square matrix of telephone communication data among
157 regional districts in 1990) was used. A network relationship between two centers
was hypothesized to exist when actual communication flows exceeded significantly
the interaction that was expected on the basis of a doubly-constrained entropy model.
(Camagni and Salone, 1993)
The study of Meijers, 2005, data source was National information system on
employment and it contains 1996 and 2002 data on the number of jobs. As a research
method, correspondence analysis used to analyze the differentiation in the economic
roles of cities in a famous polycentric urban region: Randstad. As a result, the
complementary and cooperative relations are defined in that urban network.
(Aimin) Chen and N. (Edward) Coulson, 2002, used multiple regression analysis to
define factors affecting human flows. The variables that they used were listed under
the title of “Sources of Urban Attractivity in terms of Human Flows”.
Kresl and Singh (1998) used 1992 census data to rank major U.S. metropolitan areas
and used variables: growth of retail sales, growth of manufacturing value added,
growth of business services receipts in multiple regression analysis.
In another study, (Ben) Gardiner et al.2004 used output per employed worker as a
measure of productivity for European Union Nuts 2 regions. He reached the data

40
from Eurostat Region database.
(Cecilia) Wong, 1998, carried out an empirical research to ascertain the perceptions
of policymakers concerning the importance of different factors to the success of local
economic development. Key public- and private-sector actors in local economic
development organizations in the North West and the Eastern regions of UK were
asked in a survey to rank the 11 factors according to their relative importance to local
economic development. It was then followed up by 22 in-depth, semi-structured
interviews with selective participants. The study was completed by summarizing the
survey findings.
3.2 Hypotheses
To define the determinants of having a higher central position and better economic
performance in an urban network, major and sub hypotheses are determined
according to the related literature and these hypotheses are tested in the case study
chapter.
Major hypothesis of this study is:
Hypothesis I: “Economic performance of a settlement depends on its endogenous
dynamics, resources and its networking patterns”.
Sub hypotheses are:
Hypothesis II: “Attractivity of a settlement depends on its position in policy
networks, its economic structure and its infrastructure.”

41
Hypothesis III: “Position of a settlement in policy networks depends on its economic
characteristics and its attractiveness”.
Hypothesis IV: “Although economic characteristics and attractivity determines the
position of a settlement in policy networks, administrative borders limit the level of
interaction between settlements.”
3.3 Methods used to test the hypotheses
Analysis in this study includes a descriptive part concentrated on the spatial-
economic differences in Antalya City Region indicating specialization patterns which
is crucial in city region literature. In this descriptive part location quotient analysis is
used as a research method. This chapter also includes maps and tables on
employment structure, population distribution. Finally an overview of public
interventions to the region is given in the descriptive chapter.
After descriptive analysis on Antalya City Region, networking patterns are analyzed
based on the survey results of 1821 settlements of Antalya City Region conducted by
staff of METU, City and Regional Planning Department in 2006. Social network
analysis is employed based on this data with the help of UCINET 6 software.
Description of the survey that network analysis is based is presented under the
heading: 5.1 Data Analysis on Networking Structure of Antalya City Region
The most widely used method to define factors affecting economic performance and
networking pattern is an econometric analysis tool which is multivariate regression
analysis. Three models are designed to test the first three hypotheses. Before testing
1 Although the survey results include 182 settlements in the region, this study is designed as a district level study
because of lack of data in sub district level and 39 districts included in the analyses.

42
the three models data analysis are performed on the relations between output
indicators of attractivity, centrality in policy networks and economic performance
and other input variables. The aim of this data analysis is to check whether there is an
auto-correlation problem in the data that may violate the models or not. Model
description, variables and data information is presented under the heading: 5.2
Econometric Model to Determine Factors Affecting Economic Performance and
Positions of Settlements in Antalya City Region

43
CHAPTER 4
DYNAMICS OF ANTALYA AS A NEWLY EMERGING
CITY REGION2
The aim of this chapter is to make a description of Antalya Region focusing on the
inter-regional differentiations on sectoral distribution and population distribution
with the use of different analysis methods. It also includes important public
interventions (investments, land allocations, sectoral development plans) which
affects these structural and spatial differences. These differences play an important
role in city region formation if the different specialized nodes in the city region
complement each other and create the synergy.
4.1 Endogenous Dynamics in Global Transformation Process
4.1.1 Distribution of Economic Activities in the Region
Economic activities in the region range in different sectors which are agriculture,
retail and wholesale trade, construction, transportation and insurance, manufacturing,
mining, electricity and social services.
2 The analysis on spatial distributions of sectors in the region and the population distribution are based
on the studies done by METU- RP 501 Studio Group in 2006.

44
Figure 1 Spatial Distributions of Economic Sectors
Source: The analysis done by METU- RP 501 Studio Group in 2006.
The above map reveals the specialization of each settlement via correspondence
analysis produced in regional planning studio of METU Regional Planning Masters
Program in 2006. This map shows that in 2000, in the six of the settlements
agriculture played an important role. However, while five of these settlements are
specialized only in agriculture, in Gönen also the sector of manufacturing is better
developed than in average. Four settlements are specialized in only wholesale and
retail trade. Twenty settlements show a distinct economical structure which could not
be identified using Correspondence Analysis. Antalya is the settlement that is
specialized in construction, transportation, and insurance sectors, while eight

45
settlements are specialized in the sector of mining, manufacturing, electricity, and
social services. The specialization patterns of 39 districts are summarized below.
Table 3 Distribution of Economic Sectors in Districts
Sectors Number of Specialized
Districts
Agriculture 5
Agriculture and Manufacturing 1
Wholesale and Retail Trade 4
Mining, manufacturing, electricity, and social
services.
8
Construction, Transportation, Insurance 1
Distinct Economic Structure 20
Source: The analysis done by METU- RP 501 Studio Group in 2006.
4.1.2 Inter Regional Spatial Concentrations of Basic Sectors in Antalya City
Region
To understand the inter-regional spatial differentiations in the region the location
quotient analysis for 2000 gives important insights. First of all agriculture which is
one of the basic sectors (although it loses its importance as seen in the next table) for
the region does not have a certain spatial concentration.

46
Figure 2 Spatial Distribution of Agriculture Sector
Source: The analysis done by METU- RP 501 Studio Group in 2006.
However, manufacturing, mining, and construction sectors concentrate in the east
and north of the region and as stated under Employment Structure and Changing
Patterns heading these sectors are the declining sectors (not as much as agriculture
sector). The spatial concentrations of these settlements are presented in the below
figures.

47
Figure 3 Spatial Distribution of Manufacturing Sector
Source: The analysis done by METU- RP 501 Studio Group in 2006.
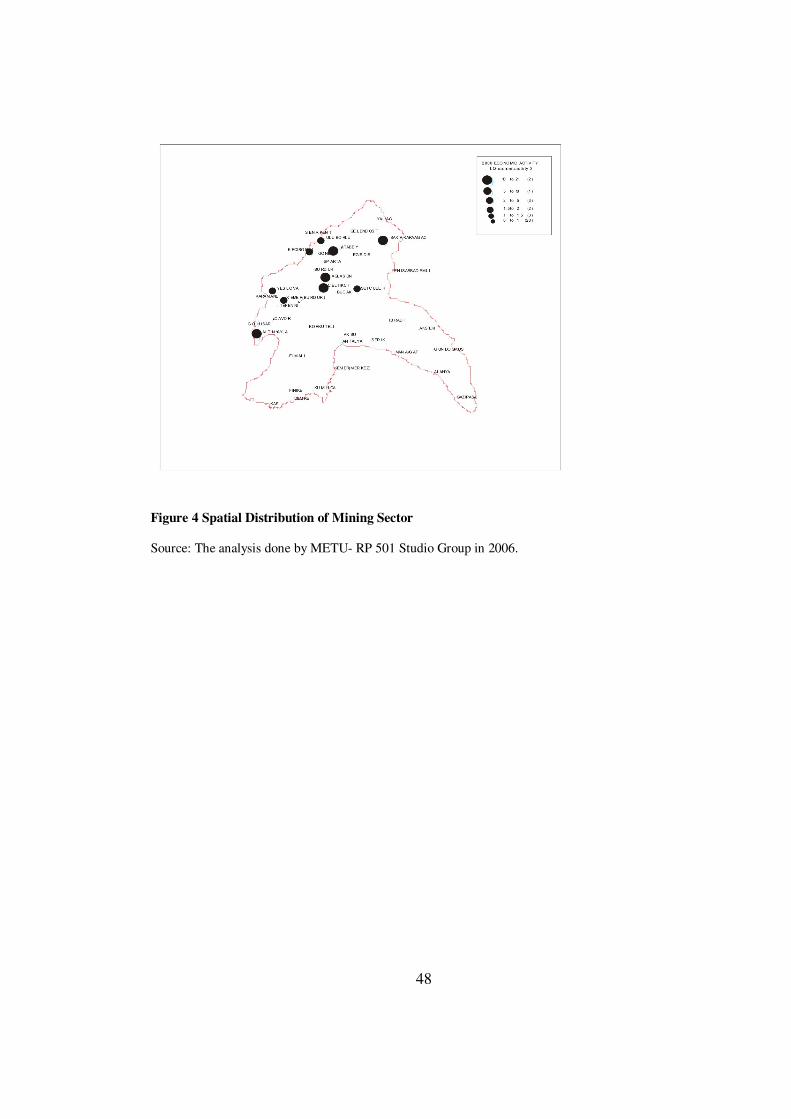
48
Figure 4 Spatial Distribution of Mining Sector
Source: The analysis done by METU- RP 501 Studio Group in 2006.

49
Figure 5 Spatial Distribution of Construction Sector
Source: The analysis done by METU- RP 501 Studio Group in 2006.
Another spatial concentration is seen in the coastal area in the retail and wholesale
trade sector due to the tourism developments presented in the figure:

50
Figure 6 Spatial Distribution of Tourism Sector
Source: The analysis done by METU- RP 501 Studio Group in 2006.
As an implication from the spatial distributions of the different sectors, it can be
determined that the sectoral concentrations are available in the region, especially
divided between the north and the coastal areas.
4.1.3 Employment Structure and Changing Population Patterns
In order to see how different sectors have gained or lost importance in Antalya City
Region, the following diagram shows the percentages of the different sectors3 in the
3 Sectors: 1: Agriculture, 2: Mining, 3: Manufacturing, 4: Electricity, gas, water, 5: Construction, 6:
Retail and wholesale trade, 7: Transportation, communication, 8: Insurance, 8: Social services, 10:
Other

51
years 1985, 1990 and 2000 according to the structure of all employees within all the
settlement in the regions in these years.
Figure 7 Development of Employment Percentages
Source: The analysis done by METU- RP 501 Studio Group in 2006.
It is seen that the biggest sector through all the years is the sector of social services.
Though there has been a relative loss of importance between 1985 and 1990, in the
year 2000 this sector covers 33,5% of all employees.
In the second point of importance it is seen that some changes took place between
1985 and 2000. Most striking is the loss of importance of the agricultural
employment from 15.7% in 1985 to 7,9% in 2000. The winner of this transformation
is the sector of retail and wholesale trade which has steadily grown from 13,8% in
1985 up to 24,5% in 2000.
Smaller sectors that gained more importance are transportation/ communication and
insurance. Manufacturing faced a slightly decreasing development, while the

52
construction sector remained on the level around 9%, though it had more importance
in the year 1990. While the small sector of electricity, gas and water was growing,
the mining sector decreased from 0,5% to 0,2% in 2000.
Population distribution is another important indicator of spatial differentiations in
Antalya City Region. From 1950 to 2000 there is a significant change in the
distribution of population in the region.
Figure 8 Population Distribution in 1950
Source: The analysis done by METU- RP 501 Studio Group in 2006.
In 1950s, it can be seen that, city centers of Antalya, Isparta and Burdur are also
population attraction centers. According to population distribution in 1950, 20% of
people in Antalya city region are living in city centers and costal part of the city
region is less populated than northern part of the region. Result of this may be lack of
tourism activities.

53
Figure 9 Population Distribution in 2000
Source: The analysis done by METU- RP 501 Studio Group in 2006.
In year 2000 it can be seen that the population of the settlements in coastal region
and the northern of the region are increasing rapidly because of the economic
development in coasts. Actually, we can say that the settlements which are on the
surroundings of the motorways developed much more than others.

54
Figure 10 Population increase rate 1990-2000
Source: The analysis done by METU- RP 501 Studio Group in 2006.
Looking at the population increase rates, it can be seen that the population in the
settlements which are in coastal area, the northern of the region, the centre of the
cities increased much more than the other settlements. Their rates which are between
the 1990s and 2000 are over the average population increase rate for the region.
However, the rates of the other settlements, for example, in the inner regions, rural
areas, decreased because of migration to the other regions. Their rates are under the
average population increase rate for the region. Therefore, it can be said that new
attractive settlements have been occurred in coastal area, northern area between these
years and so the spatial context of the region has started to change from mono-centric
to poly-centric structure. The migration from inner regions to coastal areas and the
northern areas have been experienced.

55
4.2 Policies and support schemes to enhance integration to global economy
Transformation of economic, social and spatial configuration of Antalya City Region
depends on the investments and interventions that support tourism and infrastructure.
In Antalya tourism region, beside the support of government, the support of private
initiatives has also a crucial role in designing the spatial organization which is shaped
by tourism investments. The share of public investments in the region is not very
high. But it can be understood from the table that there is an increasing trend
between 1990 and 2001.
Table 4 The share of public investment expenditures of Antalya City Region according to
Turkey-2001 prices
1990 1991 1992 1993 1994 1995 1996 1997 1998 1999 2000 2001
REGION
TOTAL 0,95 0,63 0,82 0,9 1,04 1,13 1,3 1,66 1,61 1,42 1,2 1,48
TURKEY
TOTAL 100 100 100 100 100 100 100 100 100 100 100 100
Source: Öztürk, H.E 2008, The Role of Local and Global Networkıng For Tourısm Fırms and Clusters: The Case of Antalya, METU
However, public investments are important for Antalya City Region. It is the 11th
and one of the priorly supported tourism provinces after the underdeveloped
provinces by the government. As a result some of the important public institutions
are located in Antalya. These institutions are General Directorate of Highways,

56
Hydraulic Works, Rural Services and Bank of Provinces. In addition to these public
institutions there are also free zone, international airport, wholesale bazaar, harbor,
hospitals and university located in Antalya serving for the region.
Shares of public investment are not very high according to Turkish average in some
years for the region but important contributions are made in the region by public
supports which is crucial for the the structural and spatial transformation of the
region. Implemented investment incentives are important for the development of
regions. Share of investment incentives certificates of the region is around 7 percent
of Turkey.
Table 5 The share of Investment Incentives Certificates of Antalya City Region according to
Turkey, 2001 Prices
1995 1996 1997 1998 1999 2000 2001
REGION TOTAL 7.43 10.35 8.99 6.87 5.13 5.48 7.32
TURKEY TOTAL 100 100 100 100 100 100 100
Source: Öztürk, H.E 2008, The Role of Local and Global Networkıng For Tourısm Fırms and Clusters: The Case of Antalya, METU
Antalya has become the province that has taken the highest tourism investment in
Turkey with a 60% share between 2000 and 2005. Antalya became the primary
province in Turkey with 409 tourism investment incentive certificates and
4.785.000.000 TL investment during the period of 2000 and 2005.
4.2.1 Public Policies and New Institutional Setup to Enhance Tourism
The coastal area between the south border of Çanakkale province and Mersin
province which include Antalya is declared as a priority tourism development zone in
Tourism Master’s Plan of Turkey prepared by State Planning Organization and

57
Ministry of Tourism and Advertising in 1960s. (Öztürk, 2008)
Priority regions are transformed into Tourism Area and Tourism Centers by Tourism
Encouragement Law of The Ministry of Tourism in 1982 (Law No. 2634).
Development of tourism regions as in the case of Antalya City Region was fostered
by the allocation of public lands to tourism investments and other incentives given
for tourism.
Public investments as Antalya Yatch Marina Environment Tourism, Restoration of
Kaleiçi, 600 bed tourism complexes in Side and South Antalya Tourism Development
Project have made important contributions to the development tourism sector in the
region.
Antalya is taken as the touristic regional center and Kemer is the supporting
settlement in South Antalya Tourism Development Project covering 75 km. coastal
area between Antalya Yatch Marina and Gelidonya Foreland and also in the
boundary of Olympos-Beydagları National Park. The aim of this project was to
provide a capacity of 62.000 beds by 1995 serving mostly (80%) international
tourism, foreign market and thus obtain foreign currency which will bring positive
benefits to the balance of foreign trade of the country. (Öztürk, 2008)
GATAB, an infrastructure development association of Kemer, is established by the
government to develop infrastructure in collaboration with public and private
institutions of Kemer in the context of the project and this institutions had a crucial
role for the development of successful infrastructure projects of Kemer.
Belek and Side Tourism Development Plans have emerged in addition to the Project
of South West Antalya Tourism Development Project. Belek tourism center
constitutes of more than 40 accommodation establishment and 5 golf areas in the

58
scope of Belek Tourism Project. Existing bed capacity is 32.204. In addition to the
coastal tourism activities and natural environment, Belek Tourism center is an
organized tourism complex for conference and sport based activities.
BETUYAB has been founded as a management association in 1988 by the investor
companies of the region with the support of the Ministry of Tourism in the context of
Belek tourism Development Project. The aim of BETUYAB is solving the
infrastructure problems in Belek Tourism Center cooperation with government and
private sector. It is also a joint initiative of international institutions such as World
Bank and World Environmental Protection Association. Successful projects are
observed in Belek Tourism Center with the help of global linkages and government
support. (Öztürk, 2008)
Bed capacity of Side Tourism Development project area exceeds 50.000. Project area
covers tourism settlements of Kumköy – Bingesik – Yeni Selimiye – Antik Side –
Titreyen Göl – Kemer – Sorgun –Acısu and Manavgat. MATAB is the institution
which is mainly collaborated with the municipality when implementing and
developing infrastructure projects.
In addition to the projects stated above, settlements developed by land allocations of
government are very important for the region. Antalya is the primary province that
take the higher number of land allocations when compared with other provinces of
Turkey. Approximately, 195 tourism establishments are land allocated including
accommodation, golf, yatch and other types in Antalya by the support of the
government.
Kemer has taken 77 land allocations for tourism establishments. The second
important tourism settlement is Side and 45 tourism establishments have taken land
allocation. Belek has taken 41 land allocations. Then; 16 tourism establishments in

59
Central Antalya, 8 tourism establishments in Alanya and 6 tourism establishments in
Kale (Demre) which have taken land allocation for tourism development in Antalya.
(Öztürk, 2008)
In addition to tourism development plans and land allocations of the government,
Kaleiçi, Konyaaltı and Kundu-Kemeragzı in Central Antalya; Serik-Çolaklı, Serik-
Manavgat coastal area, Gazipasa, West Alanya, Alanya-Akdag, Alanya-Alara-
Incekum, Kas-Kalkan coastal band, Arapsuyu, Side, Perge Congress and Fair, Belek,
Ibradı Masata Yaylası, Kale (Demre), Oymapınar Culture and Tourism Conservation
Region are defined as tourism centers by the Ministry of Culture and Tourism.
To conclude while direct financial investments of public sector are not very
influential for the development, other interventions such as land development,
infrastructure provision for tourism, tourism plans and development projects have
had striking contributions for the development of tourism in the region. The
increasing number of association types, especially related with tourism, has gaining
importance by the type of activities and projects for the development of each local
area. (Öztürk, 2008)
4.3 Outcomes of the spatial dynamics
As a result of the previous analysis on Antalya Region can be divided into five sub-
regions according to the distribution of economic activity and the social structure. In
the Northern Sub-Region, main economic activities are manufacturing (especially
textile, wearing apparel and leather industries and food, beverages and tobacco
manufacturing), mining and social services (especially in Isparta and Eğirdir)
respectively. In addition, concentration of the entrepreneur and administrative
personal are high in this sub-region. In the Western Inner Sub-Region the main
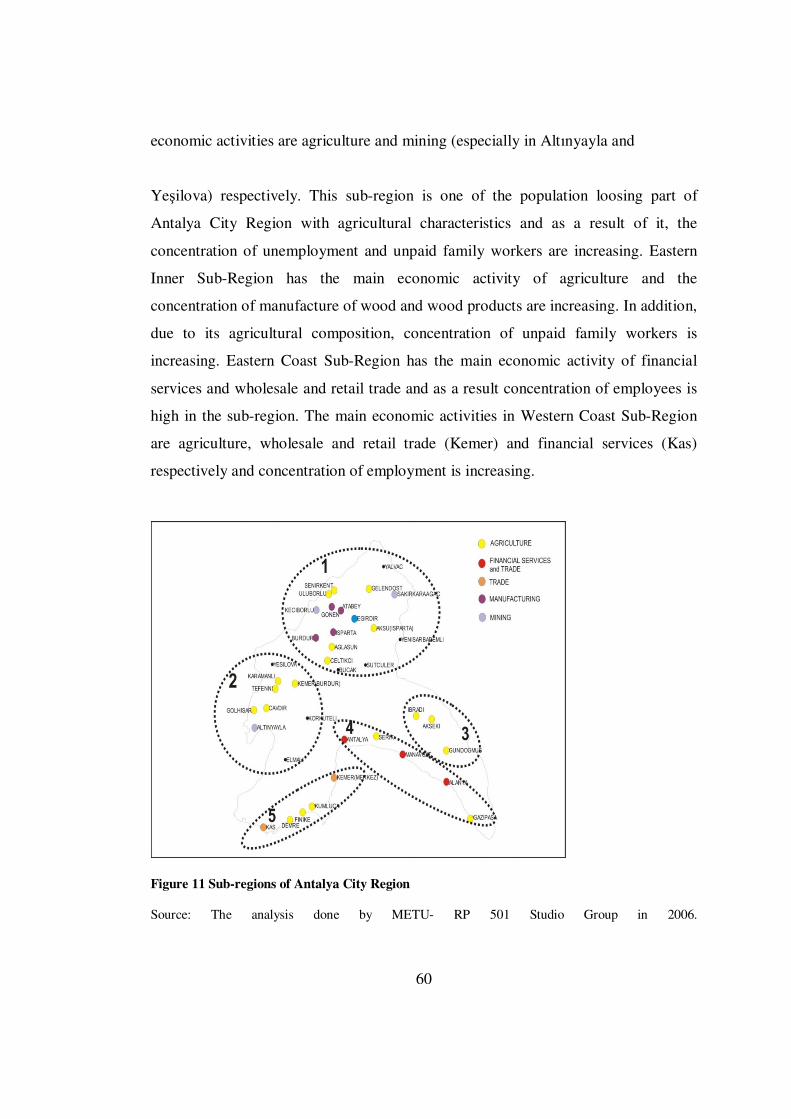
60
economic activities are agriculture and mining (especially in Altınyayla and
Yeşilova) respectively. This sub-region is one of the population loosing part of
Antalya City Region with agricultural characteristics and as a result of it, the
concentration of unemployment and unpaid family workers are increasing. Eastern
Inner Sub-Region has the main economic activity of agriculture and the
concentration of manufacture of wood and wood products are increasing. In addition,
due to its agricultural composition, concentration of unpaid family workers is
increasing. Eastern Coast Sub-Region has the main economic activity of financial
services and wholesale and retail trade and as a result concentration of employees is
high in the sub-region. The main economic activities in Western Coast Sub-Region
are agriculture, wholesale and retail trade (Kemer) and financial services (Kas)
respectively and concentration of employment is increasing.
Figure 11 Sub-regions of Antalya City Region
Source: The analysis done by METU- RP 501 Studio Group in 2006.

61
CHAPTER 5
NETWORKING AND ECONOMIC PERFORMANCE IN
ANTALYA REGION4
Aim of this chapter is to explore the determinants of economic performance and
networking patterns in the region. To achieve this aim firstly networking patterns in
the region are analyzed. Before the econometric analysis which will give
determinants stated above, relations between different variables are analyzed to
check the possible auto-correlations that may violate the econometric models.
Finally, three econometric models are employed. First model defines attractivity
factors (in actual networks), second defines centrality factors (in policy networks)
and the last model defines economic performance factors of settlements in the
network. The reason why three models are employed is because of the fact that only
economic performance of settlements is not enough and a networking mechanism is
essential for enjoying the benefits of city regions.
5.1 Data Analysis on Networking Structure of Antalya City Region
Networking patterns of Antalya Region is analyzed based on the survey results of
182 settlements of Antalya Region conducted by staff of METU, City and Regional
Planning Department in 2006. The survey includes 10 questions asked to the
4 The analysis on networking patternse are based on the studies done by METU CRP Staff and
METU- RP 501 Studio Group in 2006.

62
municipalities. Three of them are related to human flows and remaining are related to
joint activity networks with other municipalities in the region.
The surveys include two parts. In the first part is related to actual networks and
includes three categories:
• Network of human flows for work
• Network of human flows for public services
• Network of human flows for leisure, recreation or visiting
Second part of the surveys is related to joint activity networks between district
municipalities including seven categories:
• Network of partnership and cooperation
• Network of knowledge sharing and consultancy
• Network of common project
• Network of common investment
• Network of machinery and technical assistance
• Network of financial support
• Network of common cultural activity
Although the surveys are conducted to 182 settlements in the region, this study is
designed as a district level study because of lack of data in sub district level and 39
districts included in the analyses.
According to the results of this survey flows between settlements and joint activity
networks can be conceptualized with the help of social network analysis. UCInet
software is used to produce spatial maps. The analysis depends on degree centrality
measures. Degree centrality analysis shows the settlements’ degree according to their
ties to other settlements and settlements having more ties to others have bigger dots

63
than others. These settlements have a central position in the network. (Hanneman A.
R., Riddle M. ,2005).
5.1.1. Network of Human Flows
5.1.1.1 Network of Human Flows for Work
In this figure the settlements which are central in the aspect of people go for those
settlements to work can be seen. There are some major settlements which are central
in this aspect and we see a clear multi central structure comparing to other categories.
A NTA LYA BÜYÜ KŞEHĐR
KO RKUTELĐ
SERĐKM A NA V GA T
A LA NYA
GA ZĐPA ŞA
ĐBRA DI
A KSEKĐ
GÜNDO ĞMUŞ
KEMER
KUMLUC A
F ĐNĐKE
DEMRE (KA LE)
KA Ş
ELMA LI
ISPA RTA
A KSU
A TA BEYEĞĐRDĐR
GELENDOST
GÖ NENKEÇ ĐBO RLU
SENĐRKENT
SÜTÇ ÜLER
ŞA RKĐKA RA A ĞA ÇULUBORLU
YA LV A Ç
YENĐŞA RBA DEMLĐBURDUR
A ĞLA SUN
A LTIN YA YLA
BUC A K
Ç A V DIR
Ç ELTĐKÇ Đ
GÖLHĐSA R
KA RA MA NLI
KEMER
TEF ENNĐ
YEŞĐLOV A
Figure 12 Degree centrality analysis for the category of people coming to work in a coordinated
way
Source: Produced based on the data of RP 501 Studio, METU
Antalya has a huge network with the settlements surrounding it and it is the most
central settlement in the system. Then, Isparta has the second central position with a
network of surrounding settlements. Burdur, Eğirdir and Alanya forming sub-groups

64
and people go for these settlements for working. Burdur seems as a smaller center in
this analysis and it can be because of the higher centrality of Isparta which is near to
Burdur. In addition, in this analysis the administrative borders are less effective than
other categories and the duality between north and south of the region is observed in
this aspect. Finally, province centers, tourism centers, agricultural production centers
and manufacturing centers have higher centrality in this aspect.
5.1.1.2 Network of Human Flows for Public Services
In this analysis the settlements which are central for people coming for education,
health services can be seen. A dominancy of administrative borders defining the
network distribution. Antalya and Burdur have a large network with the settlements
which are in their administrative border. Isparta has its small group of settlements
and we see Alanya and Elmalı as separate identities where people want to go instead
of Antalya probably because of its location.
ANTALYA BÜYÜKŞEHĐR
KORKUTELĐ
SERĐKMANAVGAT
ALANYA
GAZĐPAŞA
ĐBRADI
AKSEKĐGÜNDOĞMUŞ
KEMER
KUMLUCA
FĐNĐKE
DEMRE (KALE)KAŞ
ELMALI
ISPARTA
AKSU
ATABEY
EĞĐRDĐR
GELENDOSTGÖNEN
KEÇĐBORLU
SENĐRKENT
SÜTÇÜLER
ŞARKĐKARAAĞAÇ
ULUBORLU
YALVAÇ
YENĐŞARBADEMLĐ
BURDUR
AĞLASUN
ALTINYAYLA
BUCAK
ÇAVDIR
ÇELTĐKÇĐ
GÖLHĐSAR
KARAMANLI KEMER
TEFENNĐ
YEŞĐLOVA
Figure 13 Degree centrality analysis for the category of people coming for public services in a
coordinated way
Source: Produced based on the data of RP 501 Studio, METU

65
5.1.1.3 Network of Human Flows for Leisure, Recreation or Visiting
In this analysis, the settlements which people go for leisure, recreational or visiting
activities are illustrated. It is possible to see a multi-central distribution which is
defined according to the locational proximities. Major centers like Antalya, Isparta,
Burdur, Yeşilova, Eğirdir, Çavdır have more ties meaning that people go there for
leisure, recreational or visiting activities.
ANTALYA BÜYÜKŞEHĐR
KORKUTELĐ
SERĐKMANAVGAT
ALANYA
GAZĐPAŞA
ĐBRADI
AKSEKĐ
GÜNDOĞMUŞ
KEMER
KUMLUCA
FĐNĐKE
DEMRE (KALE)KAŞ
ELMALI
ISPARTA
AKSU
ATABEY
EĞĐRDĐR
GELENDOST
GÖNENKEÇĐBORLU
SENĐRKENT
SÜTÇÜLER
ŞARKĐKARAAĞAÇULUBORLU
YALVAÇ
YENĐŞARBADEMLĐ
BURDUR
AĞLASUN
ALTINYAYLA
BUCAK
ÇAVDIR
ÇELTĐKÇĐ
GÖLHĐSAR
KARAMANLI
KEMER
TEFENNĐ
YEŞĐLOVA
Figure 14 Degree centrality analysis for the category of people coming for leisure, entertainment
or visiting in a coordinated way
Source: Produced based on the data of RP 501 Studio, METU
5.1.2 Joint Activity Networks in Antalya Region

66
Network analysis includes seven categories of joint activity networks between
municipalities including the level of network in the region which is crucial for city
region formation providing complementarity and cooperation.
5.1.2.1 Network of partnership and cooperation
In this category the dominancy of administrative borders are clearer. Province
centers have high centrality measures in terms of partnership and coordination issues.
This shows that partnership and cooperation type of relations are restricted by the
administrative system.
ANTALYA BÜYÜKŞEHĐRKORKUTELĐ SERĐK
MANAVGAT
ALANYA
GAZĐPAŞA
ĐBRADI
AKSEKĐ
GÜNDOĞMUŞ
KEMER
KUMLUCA
FĐNĐKE
DEMRE (KALE)KAŞ
ELMALI
ISPARTA
AKSU
ATABEY
EĞĐRDĐR
GELENDOSTGÖNENKEÇĐBORLU
SENĐRKENT
SÜTÇÜLER
ŞARKĐKARAAĞAÇULUBORLU
YALVAÇ
YENĐŞARBADEMLĐ
BURDUR
AĞLASUN
ALTINYAYLA
BUCAK
ÇAVDIR
ÇELTĐKÇĐ
GÖLHĐSAR
KARAMANLI
KEMER
TEFENNĐ
YEŞĐLOVA
Figure 15 Degree centrality analysis for the category of partnership and cooperation in a
coordinated way
Source: Produced based on the data of RP 501 Studio, METU

67
5.1.2.2 Network of knowledge sharing and consultancy
In this category there is a multi centered structure especially in the north of the
region. Again a duality in the region is obvious. There is a dense network in the north
on knowledge sharing and consultancy. Finally, dominancy of administrative borders
is less effective than other categories.
ANTALYA BÜYÜKŞEHĐR
KORKUTELĐ
SERĐK
MANAVGAT
ALANYA
GAZĐPAŞA
ĐBRADI
AKSEKĐ
GÜNDOĞMUŞ
KEMER
KUMLUCA
FĐNĐKE
DEMRE (KALE)KAŞ
ELMALI
ISPARTAAKSU
ATABEY
EĞĐRDĐR
GELENDOST
GÖNENKEÇĐBORLU
SENĐRKENT
SÜTÇÜLER
ŞARKĐKARAAĞAÇULUBORLU
YALVAÇ
YENĐŞARBADEMLĐ
BURDUR
AĞLASUN
ALTINYAYLA
BUCAK
ÇAVDIR
ÇELTĐKÇĐ
GÖLHĐSAR
KARAMANLI
KEMER
TEFENNĐ
YEŞĐLOVA
Figure 16 Degree centrality analysis for the category of knowledge sharing and consultancy in a
coordinated way
Source: Produced based on the data of RP 501 Studio, METU

68
5.1.2.3. Network of Common Project
In this category in is obvious that development of common projects is very limited in
the region. The only dominant settlement is Isparta and especially in the south of the
region there is a lack of common project culture. Most of the settlements are
excluded from this network.
ANTALYA BÜYÜKŞEHĐR
KORKUTELĐ
SERĐKMANAVGAT
ALANYA
GAZĐPAŞA
ĐBRADI
AKSEKĐ
GÜNDOĞMUŞ
KEMER
KUMLUCA
FĐNĐKE
DEMRE (KALE)
KAŞ
ELMALI
ISPARTA AKSU
ATABEY
EĞĐRDĐR
GELENDOST
GÖNENKEÇĐBORLU
SENĐRKENT
SÜTÇÜLER
ŞARKĐKARAAĞAÇULUBORLU
YALVAÇ
YENĐŞARBADEMLĐ
BURDUR
AĞLASUN
ALTINYAYLA
BUCAK
ÇAVDIR
ÇELTĐKÇĐ
GÖLHĐSAR
KARAMANLI
KEMER
TEFENNĐ
YEŞĐLOVA
Figure 17 Degree centrality analysis for the category of common projects in a coordinated way
Source: Produced based on the data of RP 501 Studio, METU
5.1.2.4 Network of Common investment
Similar to the common project category, in common investments the relations are
very limited. While most of the settlements are excluded from the network, Isparta
and Antalya are the central nodes.

69
ANTALYA BÜYÜKŞEHĐR
KORKUTELĐ
SERĐK
MANAVGAT
ALANYA
GAZĐPAŞA
ĐBRADI
AKSEKĐ
GÜNDOĞMUŞ
KEMER
KUMLUCA
FĐNĐKE
DEMRE (KALE)KAŞ
ELMALI
ISPARTA
AKSU
ATABEYEĞĐRDĐR
GELENDOSTGÖNENKEÇĐBORLU
SENĐRKENT
SÜTÇÜLER
ŞARKĐKARAAĞAÇ
ULUBORLU
YALVAÇ
YENĐŞARBADEMLĐ
BURDUR
AĞLASUN
ALTINYAYLA
BUCAK
ÇAVDIR
ÇELTĐKÇĐ
GÖLHĐSAR
KARAMANLI KEMER
TEFENNĐ
YEŞĐLOVA
Figure 18 Degree centrality analysis for the category of common investment in a coordinated
way
Source: Produced based on the data of RP 501 Studio, METU
5.1.2.5 Network of machinery and technical assistance
Comparing with other categories machinery and technical assistance network is a
dense one because of the agricultural structure of the region. This type of relations is
introduced especially between the agricultural settlements which are generally
excluded from other type of networks.

70
ANTALYA BÜYÜKŞEHĐR
KORKUTELĐ
SERĐK
MANAVGAT
ALANYA
GAZĐPAŞA
ĐBRADI
AKSEKĐ
GÜNDOĞMUŞ
KEMER
KUMLUCA
FĐNĐKE
DEMRE (KALE)
KAŞ
ELMALI
ISPARTAAKSU
ATABEY
EĞĐRDĐR
GELENDOST
GÖNENKEÇĐBORLU
SENĐRKENT
SÜTÇÜLER
ŞARKĐKARAAĞAÇULUBORLU
YALVAÇ
YENĐŞARBADEMLĐBURDUR
AĞLASUN
ALTINYAYLA
BUCAK
ÇAVDIR
ÇELTĐKÇĐ
GÖLHĐSAR
KARAMANLI
KEMERTEFENNĐ
YEŞĐLOVA
Figure 19 Degree centrality analysis for the category of machinery and technical assistance in a
coordinated way
Source: Produced based on the data of RP 501 Studio, METU
5.1.2.6 Network of Financial Support
One of the least dense networks in the region is financial support network. There is
only one dominant settlement which is Isparta. The reason of this low density is
because of the legal structure do not permit such financial support mechanisms.

71
A N TA LYA BÜYÜKŞEHĐR
KORKUTELĐ
SERĐKM A NA V GA T
A LA NYA
GA ZĐPA ŞA
ĐBRA DI
A KSEKĐ
GÜ NDOĞMUŞ
KEMER
KUM LUC A
F ĐNĐKE
DEMRE (KA LE)KA Ş
ELMA LI
ISPA RTA
A KSU
A TA BEY
EĞĐRD ĐR
GELENDOST
GÖN ENKEÇ ĐBORLU
SENĐRKENT
SÜ TÇ ÜLER
ŞA RKĐKA RA A ĞA Ç
ULUBORLU
YA LV A Ç
YENĐŞA RBA DEMLĐBURD UR
A ĞLA SUN
A LTINYA YLA
BUC A K
Ç A V DIR
Ç ELTĐKÇ Đ
G ÖLH ĐSA R
KA RA MA NLI
KEM ERTEFENNĐ
Figure 20 Degree centrality analysis for the category of financial support in a coordinated way
Source: Produced based on the data of RP 501 Studio, METU
5.1.2.7 Network of common cultural activity
In this category again the network is not a dense one. Isparta and Burdur are the
central nodes of their small network. Most of the settlements are excluded from the
network.
ANTALYA BÜYÜKŞEHĐR
KORKUTELĐ
SERĐKMANAVGAT
ALANYA
GAZĐPAŞA
ĐBRADI
AKSEKĐ
GÜNDOĞMUŞ
KEMER
KUMLUCA
FĐNĐKE
DEMRE (KALE)
KAŞ
ELMALI
ISPARTA
AKSU
ATABEY
EĞĐRDĐR
GELENDOST
GÖNENKEÇĐBORLU
SENĐRKENT
SÜTÇÜLER
ŞARKĐKARAAĞAÇULUBORLU
YALVAÇ
YENĐŞARBADEMLĐ
BURDUR
AĞLASUN
ALTINYAYLA
BUCAK
ÇAVDIR
ÇELTĐKÇĐ
GÖLHĐSAR
KARAMANLI
KEMER
TEFENNĐ
YEŞĐLOVA
Figure 21 Degree centrality analysis for the category of common cultural activity in a
coordinated way
Source: Produced based on the data of RP 501 Studio, METU
72
To conclude, networks of human flows in the region are not depended to the
administrative borders but joint activity networks as an indicator of policy networks
in the region are very depended on the administrative borders. Level of cooperation
and knowledge sharing in the region are determined by these borders. In addition
cooperation type of relations such as common projects, common investment and
financial support almost do not exist in the region. This is a crucial conclusion for
Antalya Region showing that although the region includes potentials for a successful
city region performance, it lacks the necessary networking level.
5.2 Econometric Model to Determine Factors Affecting Economic Performance
and Positions of Settlements in Antalya City Region
5.2.1 Model Description, Variables and Data
Three main models were built to test the first three hypotheses which are:
Hypothesis I: “Economic performance of a settlement depends on its endogenous
dynamics, resources and its networking patterns”.
Sub hypotheses are:
Hypothesis II: “Attractivity of a settlement depends on its position in policy
networks, its economic structure and its infrastructure.”
Hypothesis III: “Position of a settlement in policy networks depends on its economic
characteristics and its attractiveness”.

73
For the first hypothesis, central position of a settlement in the networks of human
flows is the dependent variable and as an indicator of this variable, Freeman's Degree
Centrality Measures for cities in the network of human flows is used in the model.
Centrality in total flows variable includes flow categories with purposes of work,
public services and leisure, recreation and visiting which are analyzed in detail in
Chapter 5.1.1.
In the second model the dependent variable is central position of a settlement in
policy networks and indicated by Freeman's Degree Centrality Measures
for cities in the joint activity networks. Centrality in total policy networks variable
includes network categories of partnership and cooperation, knowledge sharing and
consultancy, common project, common investment, machinery and technical
assistance, financial support and common cultural activity. The networking data is
the data source of the first and second dependent variables. The data is based on the
survey results of 182 settlements of Antalya City Region conducted by the staff of
METU, City and Regional Planning Department in 2006.
For the last hypothesis, the dependent variable used in multivariate regression is the
level of employment which is an indicator of economic performance of cities. The
data is available for year 2000 from the Study of Socio-Economic Development
Level of Districts in Turkey (2004) by State Planning Organization.
A bundle of variables are used to test these three hypotheses. It should be noted that
availability of data in district level is a main limitation for this study. The reason is
that the statistical spatial level of data storage is not even province level especially
from year 2000 and NUTS 2 regional level is the most proper level for regional
analysis. But the aim of this study necessitates local data and Study of Socio-
Economic Development Level of Districts in Turkey (2004) by State Planning
Organization is a crucial and rare resource for district level studies.

74
The possible available data give the opportunity to find independent variables which
are sectoral structure, human resources, public sector responsiveness, technical
infrastructure, quality of life, administrative status of the settlement.
Sectoral structure of settlements in an urban network is an important determinant for
economic performance and centrality ranking of individual settlements. In an
environment of competition for world market shares, inherited mix of industries and
especially specialization is an important factor for success. The workforce of
successful regions typically concentrates in high-tech and high value added sectors.
High value added sectors usually generate employment and increases productivity. In
the regression models, Krugman’s specialization index and location quotient for
high-tech industries are use to indicate sectoral structure of settlements. The data
source for these variables is State Institute of Statistics
Annual Manufacturing Statistics, 2000.
Human resource is another important factor positively affecting economic
performance and centrality ranking of individual settlements. According to Webster
and Muller (2000), the ability of an urban region to move up value chains is directly
related with its human resources. Human resource of a region is measured by
education level, skills, availability and cost of labor, availability of training facilities,
entrepreneurship, creativity and risk tolerance. In the models to indicate human
resource of settlements, the ratio of university graduates to total population is used.
In addition, as an indicator of entrepreneurship, ratio of working woman to total
employment and ratio of employees to total employment are used. The data source is
again the Study of Socio-Economic Development Level of Districts in Turkey (2004)
by State Planning Organization.

75
A responsive public sector in a settlement is another crucial factor for economic
performance and centrality ranking of settlements. It directly effects the local
business environment and willingness of mobile workers depends on this variable.
All of the social and environmental factors like the quality of the residential
accommodation, urban environment and quality of life, climate conditions, pollution
levels, public safety, health and education facilities, recreational and cultural
facilities necessitate a high public sector capacity. (Chen and Coulson, 2002). In the
regression models, public expenditure per capita for year 2000 which is taken from
the Study of Socio-Economic Development Level of Districts in Turkey (2004) by
State Planning Organization is used.
Availability of job opportunities in a settlement is the most important factor
attracting human flows. Human flows are directed from lower to higher income
areas and job opportunity variable is important indicator of high income areas. A
high unemployment rate of settlements is a negative factor setting barriers against
mobile people looking for a job. In the model to test the main hypotheses of the
thesis, two categories of employment are included. First indicator of job
opportunities is industrial employment, the data belongs to year 2000, it is
percentage of industrial employment to total employment. Second indicator is about
job opportunities in finance sector. The data is percentage of financial employment to
total employment, again for year 2000. Both variables belong to the data source of
the Study of Socio-Economic Development Level of Districts in Turkey (2004) by
State Planning Organization.
Today, availability of up-to-date transaction-facilitating infrastructure plays a crucial
role for a growth oriented economy and especially to meet the needs of local
producers. (Diamond and Spence, 1989). According to Wong, 1998,
telecommunication facilities are increasingly seen as a vital tool for business

76
administration as they can handle massive flows of information and transactions
concurrently to provide spatial integration of different sectors of economic activity.
Communications infrastructure helps to reduce the effects of geographical limitations
providing access to potential markets and suppliers. In this study as an indicator of
technical infrastructure, number of telecom subscribers per home for year 2000 is
used and the data source is again the Study of Socio-Economic Development Level
of Districts in Turkey (2004) by State Planning Organization.
One of the crucial determinants of economic performance and centrality of
settlements in an urban network is the quality of life. According to Florida (2000),
quality of life is a key component to attract talent and in doing so it positively affects
productivity, innovativeness and dynamism of local business and so the economic
performance of the region. Regarding different studies, quality of life includes low
crime, pollution and cost of living rates, racial harmony, and good health, education
and shopping facilities, low property taxes and strong state government. As
expressed above, due to the lack of appropriate data, it is possible to use only one
indicator of quality of life in the regression models although it is a very determining
factor. Infant mortality rate (per thousand) is the indicator showing the quality of life
in the regression model and the data source is the Study of Socio-Economic
Development Level of Districts in Turkey (2004) by State Planning Organization.
The last variable used in the regression analysis is a dummy variable representing
administrative status of the settlements. Being a province centre or not is expected to
be an important determinant in centrality ranking and economic performance.
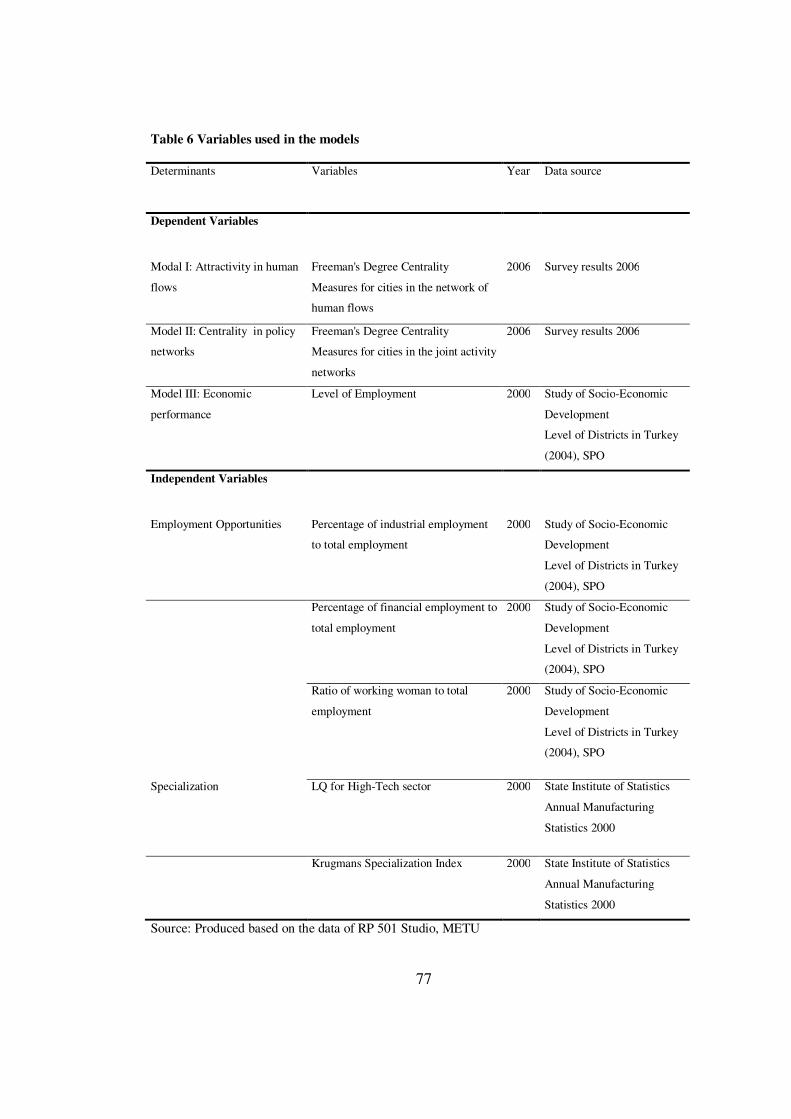
77
Table 6 Variables used in the models
Determinants Variables Year Data source
Dependent Variables
Modal I: Attractivity in human
flows
Freeman's Degree Centrality
Measures for cities in the network of
human flows
2006 Survey results 2006
Model II: Centrality in policy
networks
Freeman's Degree Centrality
Measures for cities in the joint activity
networks
2006 Survey results 2006
Model III: Economic
performance
Level of Employment 2000 Study of Socio-Economic
Development
Level of Districts in Turkey
(2004), SPO
Independent Variables
Employment Opportunities Percentage of industrial employment
to total employment
2000 Study of Socio-Economic
Development
Level of Districts in Turkey
(2004), SPO
Percentage of financial employment to
total employment
2000 Study of Socio-Economic
Development
Level of Districts in Turkey
(2004), SPO
Ratio of working woman to total
employment
2000 Study of Socio-Economic
Development
Level of Districts in Turkey
(2004), SPO
Specialization LQ for High-Tech sector 2000 State Institute of Statistics
Annual Manufacturing
Statistics 2000
Krugmans Specialization Index 2000 State Institute of Statistics
Annual Manufacturing
Statistics 2000
Source: Produced based on the data of RP 501 Studio, METU

78
Table 6 Cont’d
Source: Produced based on the data of RP 501 Studio, METU
Determinants Variables Year Data source
Human Capital Ratio of woman literacy 2000
Study of Socio-
Economic Development
Level of Districts in
Turkey (2004), SPO
Ratio of university graduates to
population 2000
Study of Socio-
Economic Development
Level of Districts in
Turkey (2004), SPO
Entrepreneurship
Ratio of entrepreneurs to total
employment 2000
Study of Socio-
Economic Development
Level of Districts in
Turkey (2004), SPO
Public sector
responsiveness Public expenditure per capita 2000
Study of Socio-
Economic Development
Level of Districts in
Turkey (2004), SPO
Technical Infrastructure
Number of telecom subscribers
per home 2000
Study of Socio-
Economic Development
Level of Districts in
Turkey (2004), SPO
Quality of life
Infant mortality rate (per
thousand) 2000
Study of Socio-
Economic Development
Level of Districts in
Turkey (2004), SPO
Administrative status of
the settlement
A dummy variable of being a
province centre or not
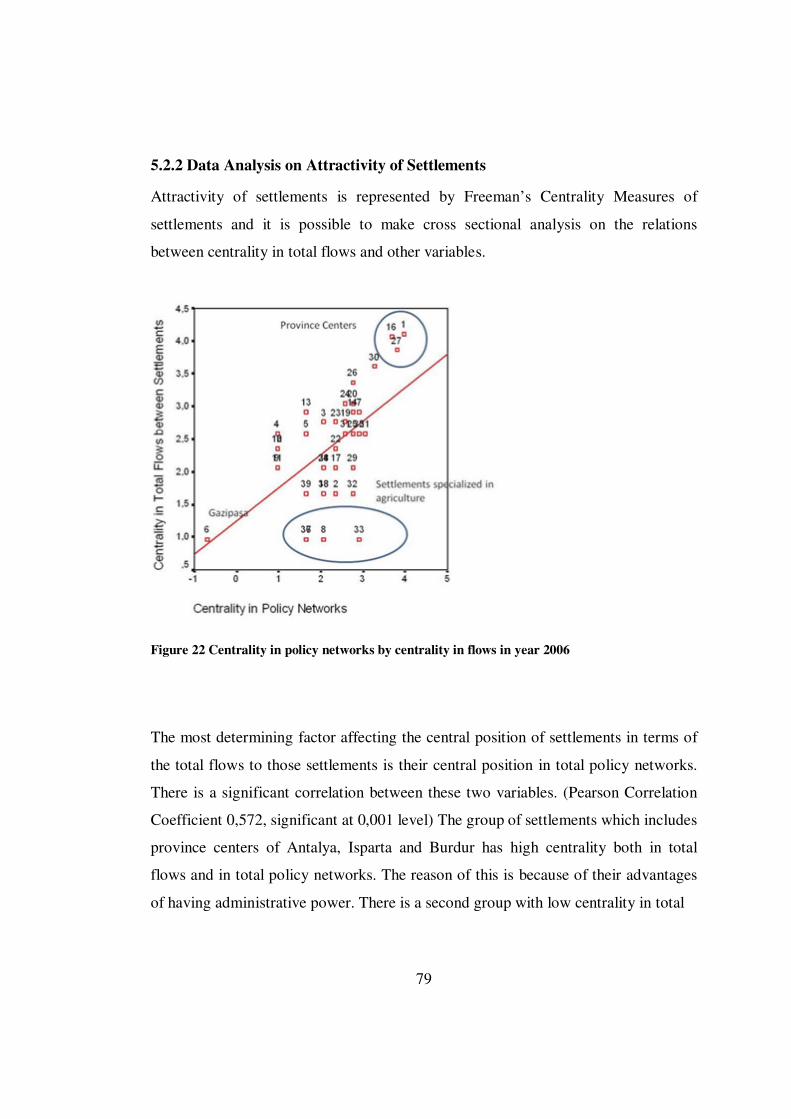
79
5.2.2 Data Analysis on Attractivity of Settlements
Attractivity of settlements is represented by Freeman’s Centrality Measures of
settlements and it is possible to make cross sectional analysis on the relations
between centrality in total flows and other variables.
Figure 22 Centrality in policy networks by centrality in flows in year 2006
The most determining factor affecting the central position of settlements in terms of
the total flows to those settlements is their central position in total policy networks.
There is a significant correlation between these two variables. (Pearson Correlation
Coefficient 0,572, significant at 0,001 level) The group of settlements which includes
province centers of Antalya, Isparta and Burdur has high centrality both in total
flows and in total policy networks. The reason of this is because of their advantages
of having administrative power. There is a second group with low centrality in total

80
flows and medium level centrality in policy networks. These settlements have
agriculture sector as their basic sector and they cannot attract flows because of their
sectoral characteristics. Finally, Gazipaşa is a settlement which has a locational
disadvantage and it is also an agricultural settlement. So proximity to main
administrative and manufacturing settlements is an important factor.
Figure 23 Number of telecom subscribers per home by centrality in flows in year 2006
Second determinant factor affecting the attractivity of settlements is the
communication infrastructure. The analysis of data shows that number of telecom
subscribers per home has the highest correlation with centrality of total flows
between settlements (Pearson Correlation Coefficient 0,654, significant at 0,001
level). Figure 2.3 indicates that again province centers have the highest values both
in centrality in total flows and in communication infrastructure. Then the second
highest values in terms of these two variables belong to production centers of

81
Tefenni and Eğirdir. The concentration of food beverages, tobacco and electricity
manufacturing increases the requirements of an advanced communication
infrastructure. It can also be observed from the figure that settlement specialized in
agriculture have the lowest values both in centrality in total flows between
settlements and in communications infrastructure.
Figure 24 Percentage of industrial employment by centrality in flows in year 2006
Third determinant of attractivity of settlements is the percentage of industrial
employment. From Figure 2.4 it is observed that again province centers have high
values in terms of both centrality in total flows and percentage of industrial
employment. Altınyayla, Atabey and Gönen are the production centers in specialized
in basic metal industries, non-metallic mineral products and mining. Because of
being specialized in these sectors these settlements have high values in industrial
employment and average values in centrality in total flows. Settlements specialized
in agriculture have low values in terms of two variables.

82
Figure 25 Public expenditure per capita by centrality in flows in year 2006
Last determinant of attractivity of settlements is the public expenditure per capita. It
shows the responsiveness of public sector and has a high correlation with centrality
in total flows. (Pearson Correlation Coefficient 0,577, significant at 0,001 level).
Again it can be observed from Figure 2.5 that province centers have high values in
terms of both variables and settlements specialized in agriculture have the lowest
values in terms of the two variables.
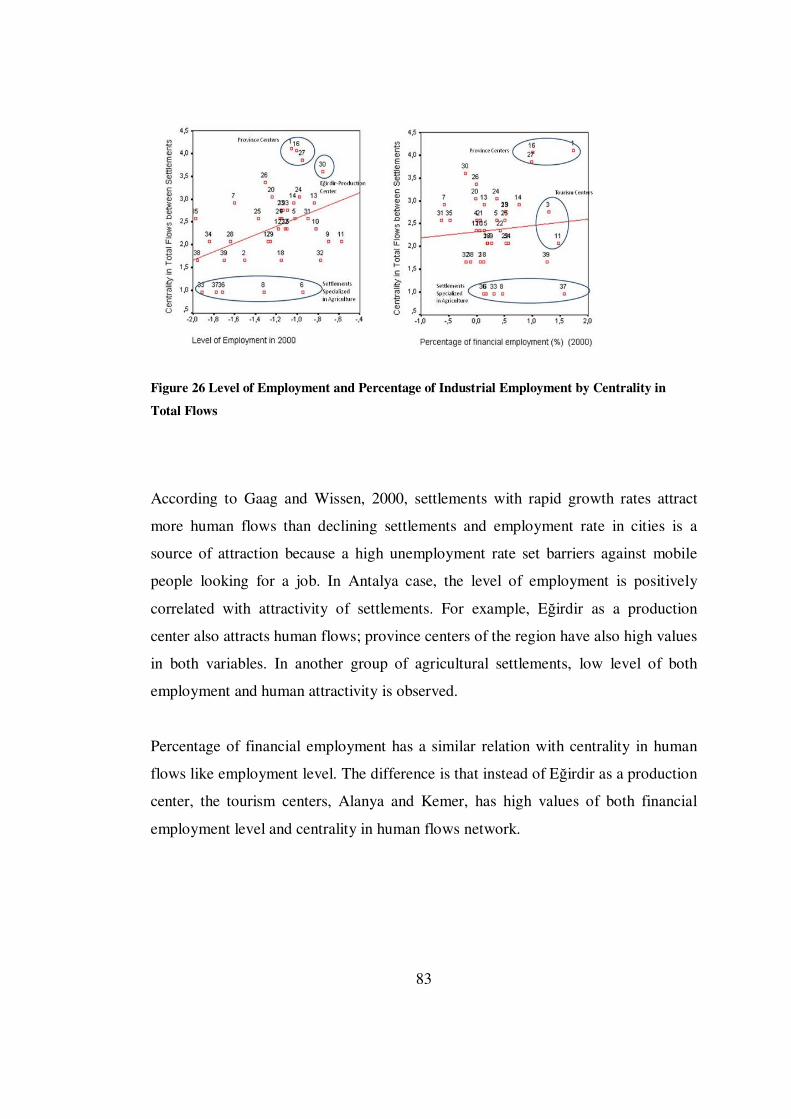
83
Figure 26 Level of Employment and Percentage of Industrial Employment by Centrality in
Total Flows
According to Gaag and Wissen, 2000, settlements with rapid growth rates attract
more human flows than declining settlements and employment rate in cities is a
source of attraction because a high unemployment rate set barriers against mobile
people looking for a job. In Antalya case, the level of employment is positively
correlated with attractivity of settlements. For example, Eğirdir as a production
center also attracts human flows; province centers of the region have also high values
in both variables. In another group of agricultural settlements, low level of both
employment and human attractivity is observed.
Percentage of financial employment has a similar relation with centrality in human
flows like employment level. The difference is that instead of Eğirdir as a production
center, the tourism centers, Alanya and Kemer, has high values of both financial
employment level and centrality in human flows network.

84
Figure 27 Krugman Specialization Index and Infant Mortality Rate by Centrality in Total Flows
Although there is no clear positive correlation between specialization and centrality
in human flows network defined in the literature, in Antalya City Region, it can be
observed that production centers with high values of specialization has at least
moderate values of centrality in human flows network.
Infant mortality rate is an important indicator of quality of life which is one of the
most determining factors of attractivity of settlements. According to Findley et al.,
1998, main characteristics of urban attractivity in terms of quality of life include low
crime, pollution and cost of living rates, racial harmony, and good health and
shopping facilities. Form this point of view, infant mortality as an indicator of good
health facilities can give insights about the life quality of a settlement. In Antalya
City Region, it is observed that settlements with agricultural characteristics have high
values in terms of infant mortality rates and these settlements have also low values in
centrality in human flows network. There is a tendency that in the settlements with
decreasing rate of infant mortality the centrality in human flows network increases. It
can be observed in Antalya City Region that life quality is a factor affecting
attractivity of settlements in terms of human flows positively.

85
Figure 28 Ratio of woman literacy and ratio of university graduates to population by centrality
in total flows
In terms of human capital that is indicated by ratio of woman literacy and ratio of
university graduates to total population there is not a powerful correlation with
centrality in total flows between settlements but again some implications can be
made from the graphs above. Especially tourism centers and province centers have
high values in terms of human capital and centrality in human flows network.
5.2.3 Data analysis on Centrality of Settlements in Policy Networks and its
determinants
Centrality in policy networks is represented by Freeman’s Centrality Measures of
settlements and it is possible to make cross sectional analysis on the relations
between centrality in policy networks and other variables.

86
Figure 29 Centrality in total flows by centrality in total policy networks
One of the most important factors of being in a central position in a policy network is
centrality in total flows. There is a significant correlation between these two
variables. (Pearson Correlation Coefficient 0,520, significant at 0,001 level).
Province centers, Antalya, Isparta and Burdur have central position both in two
networks while agricultural specialized in agriculture have medium level centrality in
total flows (because of people going for work to those settlements) and low
centrality in total policy networks.

87
Figure 30 Percentage of industrial employment by centrality in total policy networks
Second important factor affecting the centrality in total policy networks is the
percentage of industrial employment of the settlement. From data analysis it is seen
that there is a significant relation between these two variables. (Pearson Correlation
Coefficient 0,520, significant at 0,001 level) There are three important groups in the
region in this aspect. Province centers have again high values in terms of both
variables. Atabey and Gonen have manufacturing industry as their basic sector and
they form another group having high percentage of industrial employment and
moderate centrality in total policy networks. Settlements specialized in agriculture
(Korkuteli, Elmalı, Kale and Serik) have low values in terms of both variables.
Result of these analysis shows that the level of industrial employment is an important
factor on centrality in total policy networks.

88
Figure 31 Public expenditure per capita by centrality in total policy networks
Third important factor determining the centrality in total policy networks is the
responsiveness of the public sector. Analysis of data shows that there is a significant
correlation between centrality in total policy networks and public expenditure per
capita. (Pearson Correlation Coefficient 0,554, significant at 0,001 level) Again
province centers have high values in terms of both variables and settlements
specialized in agriculture (Korkuteli, Elmalı, Kale and Serik) have low values in
terms of both variables. It can be concluded from the data analysis that a responsive
public sector is one of the most important determinants of being in a central position
in total policy networks.

89
Figure 32 Level of employment and percentage of financial employment by centrality in policy
networks
Although the literature does not define factors affecting central positions of
settlements in policy networks, it is possible to observe some tendencies through
available data. There is not a significant correlation between centrality in policy
networks and employment level of settlements in Antalya City Region. Major
agricultural settlements, Kale, Elmalı, and Serik have high level of employment but
at the same time these settlements are not in a central position in policy networks of
the whole region. Percentage of financial employment is a more determining factor
compared to level of employment. In this aspect, province centers have high values
in both financial employment and centrality figures. In addition to these major
agricultural settlements have low centrality and low financial employment showing
that financial employment figures describe centrality in policy networks better than
level of employment.

90
Figure 33 Ratio of working woman to total employment and ratio of entrepreneurs to total
employment by centrality in policy networks
Entrepreneurship is a variable determining economic performance of settlements like
creativity and risk tolerance. In terms of centrality in policy networks neither the
literature nor the case study defines a direct relationship with entrepreneurship. It can
easily be observed from the figures that settlements with high values of ratio of
working woman or ratio of employees to total employment have at the same time
low values of centrality in policy networks.
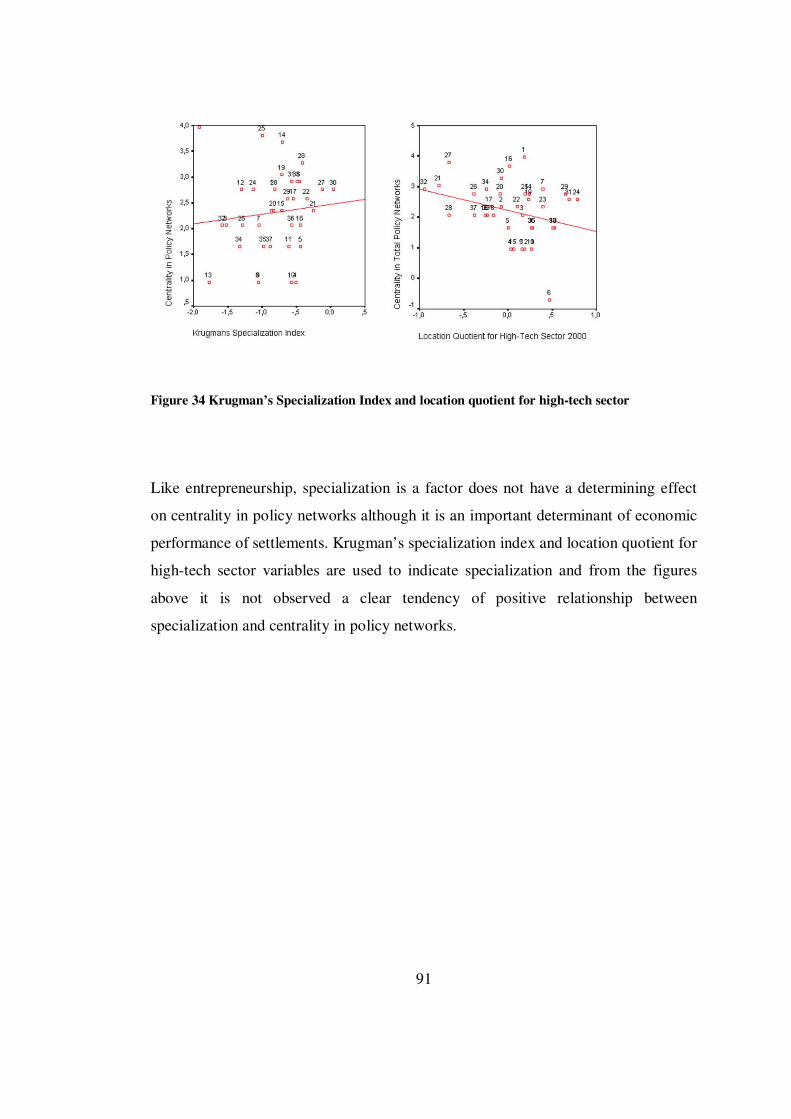
91
Figure 34 Krugman’s Specialization Index and location quotient for high-tech sector
Like entrepreneurship, specialization is a factor does not have a determining effect
on centrality in policy networks although it is an important determinant of economic
performance of settlements. Krugman’s specialization index and location quotient for
high-tech sector variables are used to indicate specialization and from the figures
above it is not observed a clear tendency of positive relationship between
specialization and centrality in policy networks.

92
Figure 35 Ratio of woman literacy and ratio of university graduates to population by centrality
in total policy networks
Human capital is a determining variable especially for economic performance of
settlements but for centrality in policy networks, neither ratio of woman literacy nor
ratio of university graduates to population has determining effect on centrality in
policy networks.

93
Figure 36 Number of telecom subscribers per home and infant mortality rate by centrality in
policy networks
Such as human capital, technical infrastructure indicated by number of telecom
subscribers per home and quality of life indicated by infant mortality rate has
determining power on centrality in policy networks.
Figure 37 Administrative Status by Centrality in Policy Networks

94
Last variable the effects of which can be examined on centrality in policy networks is
the administrative status of the settlements which is included to the model as a
dummy variable, 1 symbolizing province centers and 2 symbolizing district centers.
It can be easily seen from the figure that administrative status of settlements has a
positive effect on their centrality in policy networks.
5.2.4 Data analysis on Economic Performance of Settlements
Economic performance of settlements is represented by employment level of
settlements and it is possible to make cross sectional analysis on the relations
between economic performance and other variables.
Figure 38 Krugman’s Specialization Index by Level of Employment in 2000
Specialization is one of the important determinants of economic performance in a
world of competition. Concentration of workforce and other facilities enables firms
to increase productivity and as a result increases economic performance of

95
settlements. Krugman’s specialization index is used as an indicator of specialization
in this study. Data analysis in the region shows that manufacturing centers of Gönen
and Eğirdir have high values of specialization and economic performance. But this
trend is not true for all of the settlements in the region. There is also another
interesting group of settlements which are specialized in agriculture with high values
of specialization however they do not have high values in terms of employment
level.
Figure 39 Number of telecom subscribers per home by level of employment
Technical infrastructure is an important factor because it is vital to meet the needs of
local sectors and clusters. According to Wong, 1998, telecommunication facilities are
increasingly seen as a vital tool for business administration as they can handle
massive flows of information and transactions concurrently to provide spatial
integration of different sectors of economic activity. Technical infrastructure is also a
determining factor in Antalya City Region. Settlements specialized in tourism have

96
high values in both level of employment and number of telecom subscribers. In
contrast settlements specialized in agriculture have low level in both variables. There
is a significant correlation between competitive power and technical infrastructure
according to the results of the data analysis.
Figure 40 Percentage of financial employment by level of employment
Specialization in new and popular sectors like finance is also a source of economic
performance for settlements. Financial sector is crucial to increase start-up rates and
survival rates that are desirable characteristics for firm level success and so the
performance of settlements in an urban network. In Antalya Region, province centers
and tourism centers have high values in terms of both level of employment and
percentage of financial employment. In contrast settlements which are specialized in
agriculture have low level both variables.
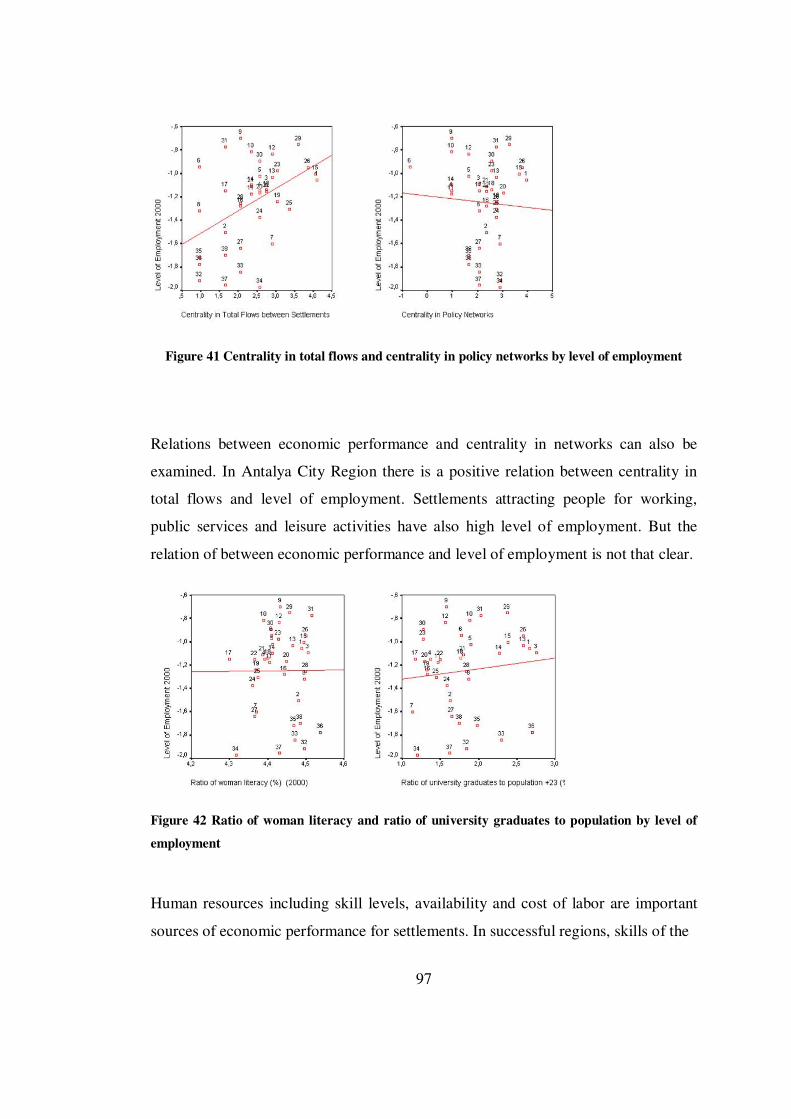
97
Figure 41 Centrality in total flows and centrality in policy networks by level of employment
Relations between economic performance and centrality in networks can also be
examined. In Antalya City Region there is a positive relation between centrality in
total flows and level of employment. Settlements attracting people for working,
public services and leisure activities have also high level of employment. But the
relation of between economic performance and level of employment is not that clear.
Figure 42 Ratio of woman literacy and ratio of university graduates to population by level of
employment
Human resources including skill levels, availability and cost of labor are important
sources of economic performance for settlements. In successful regions, skills of the

98
workforce and the share of educated and skilled labor in total population are high.
According to Webster and Muller, 2000, the ability of an urban region to move up
value chains is directly related with its human resources. Data analysis on economic
performance shows that the condition is roughly true for Antalya City Region. In the
figures above it can be seen that there is a low but positive correlation between ratio
of university graduates and level of employment. For ratio of woman literacy the
power of relationship is even lower. Province centers, Alanya, Manavgat as tourism
centers and Eğirdir as a major production center have high values in terms of human
resources and economic performance; in contrast agricultural settlements have low
values in both terms.
Figure 43 Ratio of working woman and ratio of entrepreneurs to total employment by level of
employment
Level of entrepreneurship of a settlement is a part of its human resources with
creativity and risk tolerance that has a positive effect on its economic performance.
In Antalya City Region, there is a clear tendency between entrepreneurship variables
(ratio of working woman to total employment and ratio of employees to total
employment) and the economic performance variable (level of employment). Similar
to the human capital variable entrepreneurship and economic performance values are

99
high in province centers and tourism centers and low in settlements with agricultural
characteristics.
Figure 44 Public expenditure per capita and infant mortality rate by level of employment
Another crucial factor for economic performance of settlements is a responsive
public sector because it directly effects the local business environment and
willingness of mobile workers. It also affects social and environmental factors like
the quality of the residential accommodation, urban environment and quality of life,
climate conditions, pollution levels, public safety, health and education facilities,
recreational and cultural facilities. In the data analysis for Antalya City Region, a
positive correlation is observed between public expenditure for capita and level of
employment of settlements. Public expenditure and economic performance is high in
the province centers and major production centers and low in especially the
agricultural settlements in the north of the region.
Quality of life is another source of economic performance crucial to attract mobile
workers and increase the human capital level of a settlement. But in Antalya City
Region there is not a clear relationship between quality of life (represented by infant
mortality rate) and economic performance (represented by level of employment).

100
Figure 45 Percentage of industrial employment by level of employment
Last variable is percentage of industrial employment in the region. But it is not a
determining factor because settlements with high level of industrial employment
have moderate values of economic performance.
5.2.5 Relations between different measures of attractivity, economic
performance and centrality in policy networks
The level of relations between of attractivity, economic performance and centrality in
policy networks is also important. Some of the coefficients of correlation among
these factors are significant (Table 3). However, they are not very high and so they
can be accepted as independent indicators that can be used in the econometric
analysis.

Table 7 Correlation Coefficients Between Different Variables used in the models
Source: Calculated Based on the Study of Socio-Economic Development Level of Districts in Turkey (2004), SPO
Level of
Employment
Centrality in
Total Flows
Centrality in
Policy
Networks
Percentage of
industrial
employment
Percentage of
financial
employment
Location
Quotient of High
Tech Sector
Ratio of working
woman to total
employment
Ratio of
employees to total
employment
Level of Employment 1,00 0,45 -0,06 0,12 -0,01 0,02 0,25 0,26
Centrality in Total Flows 0,45 1,00 0,57 0,09 0,12 0,14 0,12 0,24
Centrality in Policy Networks -0,06 0,57 1,00 0,41 0,16 -0,25 0,16 -0,03
Percentage of industrial employment 0,12 0,09 0,41 1,00 0,40 -0,49 0,67 0,12
Percentage of financial employment -0,01 0,12 0,16 0,40 1,00 0,18 0,72 0,41
Location Quotient of High Tech Sector 0,02 0,14 -0,25 -0,49 0,18 1,00 -0,21 0,20
Ratio of working woman to total employment 0,25 0,12 0,16 0,67 0,72 -0,21 1,00 0,53
Ratio of employees to total employment 0,26 0,24 -0,03 0,12 0,41 0,20 0,53 1,00
Ratio of woman literacy 0,01 -0,14 0,18 0,37 0,56 -0,19 0,57 0,25
Ratio of university graduates to population +23 0,12 0,14 0,15 0,36 0,70 -0,08 0,80 0,63
Public expenditure per capita 0,32 0,58 0,46 0,44 0,30 -0,06 0,32 0,10
Number of telecom subscribers per home 0,60 0,65 0,07 0,17 0,33 0,17 0,43 0,59
Infant mortality rate -0,04 -0,21 -0,10 -0,11 0,00 0,17 -0,13 -0,12
Krugmans Specialization Index 0,11 -0,06 0,10 0,23 -0,45 -0,18 -0,30 -0,45
Administrative Status -0,20 -0,58 -0,51 -0,40 -0,51 0,05 -0,48 -0,46
Centrality in Flows for Work 0,32 0,76 0,58 0,26 0,44 0,04 0,41 0,47
Centrality in Flows for Public Services 0,30 0,66 0,46 0,31 0,49 0,03 0,44 0,49
101
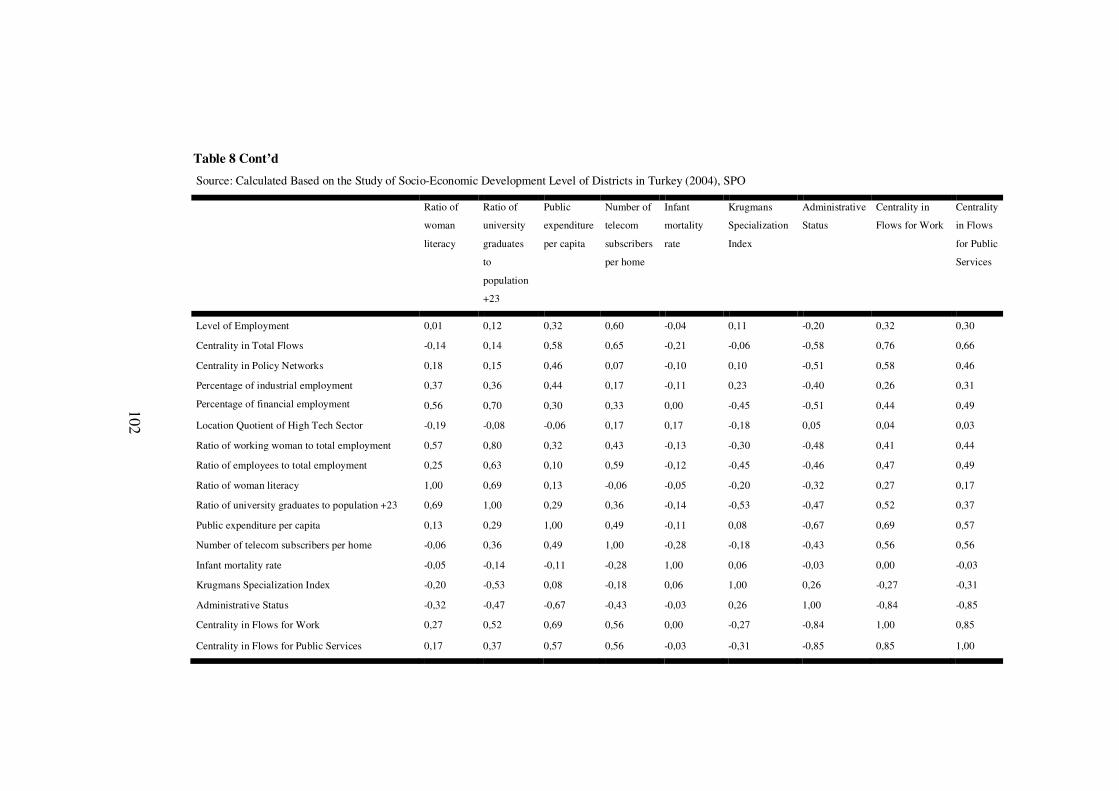
Table 8 Cont’d
Source: Calculated Based on the Study of Socio-Economic Development Level of Districts in Turkey (2004), SPO
Ratio of
woman
literacy
Ratio of
university
graduates
to
population
+23
Public
expenditure
per capita
Number of
telecom
subscribers
per home
Infant
mortality
rate
Krugmans
Specialization
Index
Administrative
Status
Centrality in
Flows for Work
Centrality
in Flows
for Public
Services
Level of Employment 0,01 0,12 0,32 0,60 -0,04 0,11 -0,20 0,32 0,30
Centrality in Total Flows -0,14 0,14 0,58 0,65 -0,21 -0,06 -0,58 0,76 0,66
Centrality in Policy Networks 0,18 0,15 0,46 0,07 -0,10 0,10 -0,51 0,58 0,46
Percentage of industrial employment 0,37 0,36 0,44 0,17 -0,11 0,23 -0,40 0,26 0,31
Percentage of financial employment 0,56 0,70 0,30 0,33 0,00 -0,45 -0,51 0,44 0,49
Location Quotient of High Tech Sector -0,19 -0,08 -0,06 0,17 0,17 -0,18 0,05 0,04 0,03
Ratio of working woman to total employment 0,57 0,80 0,32 0,43 -0,13 -0,30 -0,48 0,41 0,44
Ratio of employees to total employment 0,25 0,63 0,10 0,59 -0,12 -0,45 -0,46 0,47 0,49
Ratio of woman literacy 1,00 0,69 0,13 -0,06 -0,05 -0,20 -0,32 0,27 0,17
Ratio of university graduates to population +23 0,69 1,00 0,29 0,36 -0,14 -0,53 -0,47 0,52 0,37
Public expenditure per capita 0,13 0,29 1,00 0,49 -0,11 0,08 -0,67 0,69 0,57
Number of telecom subscribers per home -0,06 0,36 0,49 1,00 -0,28 -0,18 -0,43 0,56 0,56
Infant mortality rate -0,05 -0,14 -0,11 -0,28 1,00 0,06 -0,03 0,00 -0,03
Krugmans Specialization Index -0,20 -0,53 0,08 -0,18 0,06 1,00 0,26 -0,27 -0,31
Administrative Status -0,32 -0,47 -0,67 -0,43 -0,03 0,26 1,00 -0,84 -0,85
Centrality in Flows for Work 0,27 0,52 0,69 0,56 0,00 -0,27 -0,84 1,00 0,85
Centrality in Flows for Public Services 0,17 0,37 0,57 0,56 -0,03 -0,31 -0,85 0,85 1,00
102

103
5.3 Findings of the econometric models
5.3.1 Findings of the econometric model related to economic performances of
settlements
To identify the factors of economic performance, a regression analysis is used that
dependent variable is level of employment. In the first model, one independent
variable is employed which is the number of telecom subscribers per home (R2:
0,322, significant at 0,001). Then, second model adds percentage of financial
employment and increases the coefficient of determination. (R2: 0,429, significant at
0,001). Finally, ratio of woman literacy is the last variable determining is the last
factor determining the competitive power of settlements (R2: 0,513, significant at
0,001) in the third model.
To conclude, the variables of technical infrastructure (number of telecom subscribers
per home), development of new sectors (percentage of financial employment) and
human capital (ratio of woman literacy) are the factors which describe the economic
performance of settlements (level of employment) best.

104
Table 8 Findings of the model
Model 1 Dependent: Level of Employment Coefficients Standart Error T- ratio Significance
Constant -0,025 0,081 -0,307 0,761
Number of telecom subscribers per home 0,31 0,075 4,136 0
R2: 0,322, F: 17,10 sig at 0,001
Model 2 Dependent: Level of Employment
Constant -0,057 0,076 -0,74 0,462
Number of telecom subscribers per home 0,388 0,076 5,102 0
Percentage of financial employment 0,031 0,012 2,569 0,015
R2: 0,429
F:13,18 sig at 0,001
Model 3 Dependent: Level of Employment
Constant -0,702 0,275 -2,55 0,015
Number of telecom subscribers per home 0,443 0,075 5,928 0
Percentage of financial employment 0,052 0,014 3,652 0,001
Ratio of woman literacy 0,007 0,003 2,427 0,021
R2: 0,513 F:11,97 sig at 0,001
Durbin-Watson:1,589
All Variables Coefficients Standart Error T ratio Significance
(Constant) -1,057 0,504 -2,097 0,048
Centrality in policy networks -0,003 0,003 -1,145 0,265
Percentage of industrial employment 0,003 0,005 0,648 0,524
Percentage of financial employment 0,075 0,024 3,043 0,006
Location Quotient of High Tech Sector 0,058 0,033 1,777 0,089
Ratio of working woman to total employment 0,013 0,015 0,867 0,395
Ratio of employees to total employment -0,003 0,041 -0,086 0,933
Ratio of woman literacy 0,008 0,004 1,89 0,072
Ratio of university graduates -0,008 0,012 -0,666 0,513
Public expenditure per capita 0 0 1,44 0,164
Number of telecom subscribers per home 0,339 0,146 2,326 0,03
Infant mortality rate 0,002 0,002 1,055 0,303
Krugmans Specialization Index -0,111 0,118 -0,936 0,36
Administrative Status 0,167 0,142 1,175 0,253
Centrality in flows for work 0,001 0,005 0,229 0,821
Centrality in flows for public services 0,006 0,005 1,219 0,236
R2: 0,70
F:3,46sig at 0,004

105
5.3.2 Findings of the econometric model related to attractivity of settlements
To identify the factors determining the attractivity of settlements a regression
analysis is used. In the first model, one variable is employed which is centrality on
total policy networks (R2: 0,741, significant at 0,001). Then, second model adds
variable of communications infrastructure and increases the coefficient of
determination. (R2: 0,850, significant at 0,001). Job opportunities created in the
settlement is another determinant of attractivity of settlements and it increases R2 to
0,873. Finally, responsiveness of the public sector is the last variable determining the
attractivity of the settlements (R2: 0,890, significant at 0,001).
To conclude, the variables of centrality in policy networks, an advanced
communication infrastructure (number of telecom subscribers per home), availability
of job opportunities (percentage of industrial employment) and a responsive public
sector (public expenditure per capita) are the factors which describe the attractivity
of the settlements (centrality in total flows) best.

106
Table 9 Findings of the model
Coefficient Standart Error T ratio Significance
Model 1 Dependent: Centrality in Total Flows
Constant 1,124 1,819 0,618 0,541
Centrality in Policy Networks 1,061 0,105 10,137 0
R2: 0,741, F: 102,750 sig at 0,001
Model 2 Dependent: Centrality in Total Flows
(Constant) -26,404 5,623 -4,696 0
Centrality in Policy Networks 0,904 0,086 10,471 0
Number of telecom subscribers per home 27,896 5,518 5,056 0
R2: 0,850, F:99,20 sig at 0,001
Model 3 Dependent: Centrality in Total Flows
(Constant) -23,98 5,336 -4,494 0
Centrality in Policy Networks 0,977 0,086 11,396 0
Number of telecom subscribers per home 26,662 5,172 5,155 0
Percentage of industrial employment 0,346 0,139 2,489 0,018
R2: 0,873, F:78,02 sig at 0,001
Model 4 Dependent: Centrality in Total Flows
(Constant) -22,318 5,083 -4,391 0
Centrality in Policy Networks 0,794 0,114 6,991 0
Number of telecom subscribers per home 23,607 5,055 4,67 0
Percentage of industrial employment 0,353 0,131 2,699 0,011
Public expenditure per capita 0,004 0 2,292 0,028
R2: 0,890, F:67,14 sig at 0,001
Durbin-Watson: 2,509
All Variables Coefficient Standart Error T ratio Significance
(Constant) 72,767 33,513 2,171 0,04
Centrality in Policy Networks 0,721 0,136 5,299 0
Percentage of industrial employment 0,095 0,307 0,31 0,76
Percentage of financial employment 1,563 1,726 0,906 0,375
Location Quotient of High Tech Sector 2,739 2,173 1,26 0,22
Ratio of working woman to total employment -1,658 0,951 -1,742 0,095
Ratio of employees to total employment -3,404 2,355 -1,446 0,162
Ratio of woman literacy -0,426 0,277 -1,536 0,138
Ratio of university graduates 1,538 0,728 2,113 0,046
Public expenditure per capita 0 0 -1,052 0,304
Number of telecom subscribers per home 16,159 10,45 1,546 0,136
Infant mortality rate -0,21 0,115 -1,833 0,08
Krugmans Spec. Index 4,48 7,78 0,576 0,57
Level of Employment 26,68 13,146 2,029 0,054
Administrative Status -26,868 8,876 -3,027 0,006
R2: 0,937 F:24,6sig at 0,001 Durbin-Watson: 2,32

107
5.3.3 Findings of the econometric model related to centrality in policy networks
To identify the factors determining being in a central position in total policy
networks, a regression analysis is used that dependent variable is Freadman’s
centrality measures in total policy network. In the first model, one independent
variable is employed which is centrality in total flows (R2: 0,740, significant at
0,001). Then, second model adds variable of percentage of industrial employment
and increases the coefficient of determination. (R2: 0,796, significant at 0,001).
Finally, responsiveness of the public sector is the last variable determining the
central position in policy networks (R2: 0,820, significant at 0,001) in the third
model.
To conclude, the variables of centrality in total flows (Freadman’s centrality
measures in total flows), availability of job opportunities (percentage of industrial
employment) and a responsive public sector (public expenditure per capita) are the
factors which describe the central position in total policy networks. (Freedman’s
centrality measures in total policy networks) best.

108
Table 10 Findings of the model
Coefficients Standart Error T ratio Significance
Model 1 Dependent: Centrality in Total Policy Networks
Constant 2,651 1,417 1,871 0,069
Centrality in Total Flows 0,698 0,069 10,137 0
R2: 0,740, F: 102,749 sig at 0,001
Model 2 Dependent: Centrality in Total Policy Networks
Constant 0,502 1,45 0,346 0,731
Centrality in Total Flows 0,677 0,062 10,86 0
Percentage of industrial employment 0,412 0,133 3,094 0,004
R2: 0,796, F:68,39 sig at 0,001
Model 3 Dependent: Level of Employment
Constant 7,999 2,484 3,22 0,003
Centrality in Total Flows 0,743 0,057 12,942 0
Percentage of industrial employment 0,486 0,118 4,133 0
Public expenditure per capita 0,002 0 1,084 0,286
R2:0,820, F:64,372 sig at 0,001
Durbin-Watson: 1,86
All Variables Coefficients Standart Error T ratio Significance
(Constant) -24,746 37,485 -0,66 0,516
Level of Employment -26,345 13,616 -1,935 0,065
Centrality in Total Flows 0,763 0,144 5,299 0
Percentage of industrial employment 0,039 0,316 0,123 0,903
Percentage of financial employment -1,221 1,789 -0,683 0,502
Location Quotient of High Tech Sector -2,916 2,23 -1,308 0,204
Ratio of working woman to total employment 1,409 0,999 1,411 0,172
Ratio of employees to total employment 3,513 2,422 1,451 0,16
Ratio of woman literacy 0,28 0,294 0,955 0,35
Ratio of university graduates -1,258 0,775 -1,624 0,118
Public expenditure per capita 0 0 1,635 0,116
Number of telecom subscribers per home -15,193 10,84 -1,402 0,174
Infant mortality rate 0,14 0,123 1,143 0,265
Krugmans Specialization Index 1,272 8,056 0,158 0,876
Administrative Status 9,806 10,6 0,925 0,365
R2: 0,89 F:14,69 sig at 0,001

109
The overall findings of the three models give that in Antalya Region public sector is
still an effective actor shaping the patterns of performance. Creating employment
opportunities can also be an effective policy choice to generate new nodes in the
network.

110
CHAPTER 6
CONCLUSION
-Justification and findings
Effects of globalization changed traditional relations between settlements. With
modern information and communication technologies, old traditional relations
between capital and labor changed. Nation states lose importance and instead of
hierarchic relations, heterarchical relations gained importance. This change made
network type of spatial representations and network relations very popular themes of
regional development. Also production patterns have changed with liberalization of
financial flows and this resulted in an increase in the economic performance of
individual settlements and regions another core issue.
So in such an era where networking as a spatial representation concept and economic
performance of cities gained importance, this study aimed to explore the factors
affecting the differences of economic and centrality of settlements in an urban
network. The spatial reflections of this above stated trends can be defined as “city-
regions” which is one of the basic parts of new regionalism approach. Because of this
the case study of this thesis is designed on a “city region” which includes Antalya,
Isparta and Burdur provinces.
City region approach and network metaphor is closely related because network
emphasizes the complex and strong relationships between cities and thus the
coherence and unity of the region. Centrality of cities in an urban network can be
defined in several contexts. In this study factors affecting attractivity of settlements

111
in terms of human flows and centrality of a settlement in policy networks is
determined in Antalya City Region context.
Economic performance of cities depend mainly on sectoral trends, business
environment, innovativeness and learning, R&D facilities, human and social capital,
technical infrastructure, government structures, specialization, entrepreneurship
according to the related literature.
The related literature defines attractivity measures for cities as level of salary,
employment rate, fiscal expenditures, and quality of housing markets, metropolitan
character, regional amenities, environmental quality and quality of life.
In this study three models are employed to determine the factors affecting economic
performance, attractivity and centrality (in joint activity networks) of settlements in
Antalya Region. Available district level data to test the hypotheses consists of
dependent variables as level of employment for economic performance and central
positions of settlements in terms of human flows and joint activities. As independent
variables employment opportunities, sectoral structure, human resources, public
sector responsiveness, technical infrastructure, quality of life and administrative
status of the settlement are employed. Data analysis includes the interrelations
between these individual variables and different networks between settlements.
Network analysis showed that in some categories like human flows for working
purposes and for leisure activities, administrative borders are not determinant; the
relations are observed between settlements that belong to different provinces. In
contrast, networks of human flows for public services, network of knowledge sharing
and consultancy, network of common project and common investment depends
mainly on administrative borders. Another important result of this analysis is that
some settlements which have locational disadvantages (inner settlements located in
the rural area and some coastal settlements far from the center) are excluded from
these networks.

112
Last findings of this study are based on the three econometric models aiming to
identify the above stated (from the related literatures) factors affecting the economic
performance, attractiveness in terms of human flows and centrality in joint activity
networks of settlements in Antalya Region.
The findings on economic performance of settlements are mainly parallel to what
literature offers in this area. Technical infrastructure is one of these factors which is a
crucial element of local productive environment is one of the determinant factors in
this case study. Another similar finding to the literature is human capital as a factor
of economic performance. In Antalya City Region, ratio of woman literacy as a
proxy of human capital is found as a determinant of economic performance.
However, employment opportunities which literature defines as a factor of
attractiveness rather than economic performance is found to be one of the most
determinant factors of economic performance of settlements in the region.
Second econometric model was employed to determine the factors affecting
attractiveness of settlements in terms of human flows and the results of this part are
again mainly parallel to the related literature. The factors which are common in the
literature and in the model employed are employment opportunities available in the
region and the public sector responsiveness as factors of attractiveness. The model
also gives that (different from what literature offers) centrality in joint activity
networks and level of technical infrastructure are determinant factors of
attractiveness for human flows in Antalya City Region context.
Last model tries to define the factors affecting the centrality of settlements in policy
networks determinants of which are not defined clearly by the literature. According
to the last model, in Antalya City Region context, centrality in total human flows,
employment opportunities and public sector responsiveness are powerful
determinants of being central in policy networks.

113
Implications
Antalya City Region is studied in this thesis and it is possible to make a comparison
with the situation in the Antalya City Region and the theoretical discussions over city
regions. It can show whether this case is conditional or challenging the theory.
City region theory defines the concept as functionally interrelated geographical area
includes networks of urban centers and rural hinterland. In the case of Antalya City
Region, the network analysis shows that functional relations in the region are limited.
Administrative borders define the nature of relations. Cooperation networks,
knowledge sharing and consultancy networks have a hierarchical structure limited by
administrative borders. Common projects, common investment and financial support
tendencies are even not available.
Another important assumption is that city region should include localized networks
with global market reach. This assumption is true for the coastal area in the region
where the tourism activities are densely located.
City region theory also states that dynamism and prosperity of the city region
positively affects the semi urban and rural population. Spillover effects create a win-
win type of relations between the core and the periphery. The analysis give that while
the population increase rate in the coastal zones are high recently, the inner rural
areas are losing population. There is also a tension between the two important sectors
in the region which are agriculture and tourism.
City regions defined by the literature also include relations exceeding beyond
administrative borders. But in Antalya City Region case the administrative borders
define the nature of relations in most cases.
Specialization in different areas of the region is observed in the location quotient

114
analysis which is also crucial for developing complementary relations that create the
unity and competitive power of the region. In Antalya City Region, manufacturing,
mining, and construction sectors are specialized in the north while coastal zones are
specialized in tourism. But what is lacking is that these sectors do not form
complementary relations.
So it cannot be claimed that Antalya City Region fulfills theoretical requirements of
city regions, it lacks the unity although compared to the 1950s it gains a more
polycentric structure in terms of population distribution. Antalya City Region
includes separate specialized locations that have cooperation networks within
themselves. But it has no unity as a one city region including functional relations
between different specialized units.
However only in the coastal area of Antalya, a limited area even lower than the
province level, city region characteristics are observed based on one sector based
structure which is tourism. And this kind of a spatial organization is a new form of
city region formation.
To conclude regarding the factors that are determined in this thesis as factors of
centrality in urban networks, sub-regional policies should be generated to ensure
collaboration, interaction and participation among different part of the region. The
scale of institutionalization should be based on not the province level but city region
level and the Regional Development Agency that includes Antalya, Isparta and
Burdur is an opportunity for this. Improving better networking between settlements
specialized in different sectors which is not under the limitations of administrative
borders may help the region enjoy the benefits of city regions. Sub regional policies
can be formulated to develop networks regarding employment opportunities and
public expenditures as common determinants of centrality in Antalya City Region
networks.
115
REFERENCES
Allmendinger and Jones; 2000, Spatial dimensions and institutional uncertainties of planning and the `new regionalism; Environment and Planning C: Government and Policy Ansell, 2000, The Networked Polity: Regional Development in Western Europe, Governance: An international Journal of Policy and Administration, Vol 13, No. 3, pp 303-333 Blackwell Publishers, USA Arndt M., Gawron T. and Jahnke P, 2000 Regional Policy Through Cooperation - from urban forum to urban network- Urban Studies, Vol. 37, No. 11, 1903-1923 Begg I, Moore B. and Altuntaş Yener, Long run Trends in the competitiveness of british cities in Urban Competitiveness by Ian Begg Begg, I, 1999, Cities and Competitiveness, Urban Studies, Vol 36, No:5-6, 795-809 Besussi E. , 2006, Policy networks: conceptual developments and their European applications working papers series, paper 102 Mar 06 Bevir M. and Rhodes R. A. W. 2003, Interpreting British governance, London, Routledge Boschma, R. A. 2004, Competitiveness of Regions from an Evolutionary Perspective, Regional Studies, Vol 38.9, pp. 1001-1014 Brinton M. H. and Provan K. G. 1998, 'Measuring network structure', Public Administration,76(2), 387-407 Budd, L. and Hirmis, K. A. 2004, Conceptual Framework of Regional Competitiveness, Regional Studies, Vol 38.9, pp. 1015-1028.

116
Camagni R.P. and Salone C. , 1993, Network Urban Structures in Northern Italy: Elements for a Theoretichal Framework, Urban Studies, Vol. 30, No.6, 1053-1064 Capello R. 2000, The City Network Paradigm: Measuring Urban Network Externalities Urban Studies, Vol. 37, No. 11, 1925–1945 Chen, A, and Coulson E.N, 2002; Determinants of Urban Migration: Evidence from Chinese Cities, Urban Studies, Vol. 39, No. 12, 2189–2197 Cheshire, P. C. and Carbonado, G. 1996 “Urban Economic Growth in Europe; testing theory and policy prescriptions.” Urban Studies, Vol 33 pp: 1111-1128 Department of Trade and Industry ,1995, Competitiveness: Forging Ahead. Cmnd 2867. London: HMSO Department of Trade and Industry (2002) Regional Competitiveness Indicators, London, www.dti.gov.uk/sd/rci Doeringer, P. B., Terkla, D. G. and Topakian,G. C. 1987, Invisible Factors in Local Economic Development. New York: Oxford University Press. Eraydın, A Köroğlu B. A, Öztürk, H.E, Yaşar, S. S. 2007; Network Governance for Competitiveness: The Role of Policy Networks in the Economic Performance of Settlements in the Izmir Region Findlay, A., Morris, A. and Rogerson, R.1988, Where to live in Britain, Cities, pp. 268–276. Florida, R. 2000 Competing in the age of talent: environment, amenities, and the new economy. Pittsburgh, PA: R. K. Mellon Foundation Florida, R. 2002, The Rise of the Creative Class: And How It’s Transforming Work, Leisure, Community and Everyday Life. New York: Basic Books Gaag N. V. D and Wissen L. V; 2000, Determinants Of The Subnational Distribution Of Immigration; Netherlands Interdisciplinary Demographic Institute (NIDI)

117
Gardiner B., Martin R., Tyler P. 2004, Competitiveness, Productivity and Economic Growth across the European Regions, Regional Studies, Vol 38.9, pp. 1045-1067 Giddens, Anthony, ed. 2001 The global third way debate. Polity Press, Cambridge, UK Hay C. 2002, Political analysis, Basingstoke; New York, Palgrave Heclo H. 1978, Issue Networks and the Executive Establishment, in A. S. King, The New American political system, Washington, D.C., American Enterprise Institute of Public Policy Research Hertting N. 2004, Games 'Networkers' Play. Rationality and Frustration in Swedish Urban Renewal and Network Governance, paper presented at the ENHR Cambridge, July 2nd-6th Hm Government, 1993, Competitiveness Helping Business to Win. London: HMSO Kickert W., Klijn E. H. and Koppenjan J. 1997 Managing Complex Networks. Strategies for the Public Sector, Sage Publications. Knoke D. 1990, Political networks: the structural perspective, New York; Cambridge, Cambridge University Pres--- (1996), Comparing policy networks: labor politics in the U.S., Germany, and Japan,Cambridge [England], Cambridge University Press Knox, P. 1995, World Cities in a World System in P. Knox (Ed.) World Cities in a World System, pp:3-20, Cambridge. Kontopoulos, K. 1993; The Logics of Social Structure; New York: Cambridge University Press Kooiman J. 2000, Societal Governance: Levels, Models and Orders of Social-political Interactions, in J. Pierre, Debating Governance: Authority, Steering and Democracy, Oxford, Oxford University Press
118
Kresl P. 1995 Determinants of Urban Competition in Kresl P. and Gappert G. North American Cities and the Global Economy: Challenges and Oppurtunities. Sage London Kresl P. K. and Singh B. 1999 Competitiveness and the Urban Econnomy: Twenty-four Large US Metropolitan Areas, Urban Studies Vol. 36, Nos: 5-6, 1017-1027 Lengyel, I. 2003, The Pyramid Model: Enhancing Regional Competitiveness in Hungary, Acta Oeconomica 2004.3. pp 243-323 Lever, F.W. 1999, Competitive Cities in Europe, Urban Studies, Vol 36, nos 5-6, 1029-1044 Marcussen M. and Olsen H. P. 2005, Bridging a Structural Hole in Governance Network Analysis, published by the Centre for Democratic Network Governance, Rosklide University at http://www.demnetgov.ruc.dk Marin B. and Mayntz R. (eds.) 1991, Policy networks: empirical evidence and theoretical considerations, Frankfurt, Boulder, Campus: Westview Marsh , D. and R. A. W . Rhodes . 1992 . ‘ Policy Communities and Issue Networks. Beyond Typology’ , in D. Marsh and R. A. W . Rhodes ( eds ), Policy Networks in British Government . Oxford : The Clarendon Press , pp . 249 – 68 . Marsh, D. 1998 The development of policy network approach, in Comparing Policy Networks, in D. Marsh (Ed) Comparing Policy Networks, Open University Press: Buckingham, pp.3-20 McCann J. E, 2004, ‘Best Places’: Interurban Competition, Quality of Life and Popular Media Discourse, Urban Studies, Vol. 41, No. 10, 1909–1929, September 2004 Meijers E. (2005) Polycentric urban regions and the quest for synergy: Is a network of cities more than the sum of the parts? Urban Studies 42, pp.765-81.

119
Öztürk, H.E 2008, The Role of Local and Global Networkıng For Tourısm Fırms and Clusters: The Case of Antalya, METU Peters B. G. 1996, Managing horizontal government: the politics of coordination, Research paper no.21, published by the Canadian Centre for Management Development Pierre J. 1997, Partnerships in urban governance: European and American experiences,Basingstoke, Macmillan Polidano, C. 2000, Measuring Public Sector Capacity, World Development, 25(5): 805 Porter, M. E. 1998 The Competitive Advantage of Nations, London, MacMillan Provan, K. and H. B. Milward. 1995. A Preliminary Theory of Interorganizational Network Effectiveness: A Comprehensive Study of Four Mental Health Systems. Administrative Science Quarterly 40: 1-33 Rhodes R.A.W. 1997 Understanding Governance: Policy Networks, Governance, Reflexivity, and Accountability, Open University Press, Buckingham. Ripley R. B. and Franklin G. A. 1987, Congress, the bureaucracy and public policy, Pacific Grove, Brooks/Cole Sorensen E. and Torfing J. 2005, 'The Democratic Anchorage of Governance Networks', Scandinavian Political Studies, 28(3), 195-218 Sotarauta M. and Linnamaa R. 1998, Urban Competitiveness and Management of Urban Policy Networks: Some Reflections from Tampere and Oulu, paper presented in Conference Cities at the Millenium, 17.12 -19.12.1998 London, England Turok, I. 2004, Cities, Regions and Competitiveness, Regional Studies, Vol 38.9, pp. 1069-1083 Webster, D. and Muller L. 2000, Urban Competitiveness Assessment in Developing Country Urban Regions: The Road Forward, World Bank, Washington D.C.

120
Wong, C. 1998 Determining factors for local economic development: the perception of practitioners in the North West and Eastern regions of the UK, Regional Studies, 32, pp. 707–720