determinants of dividend policy of savings and credit co
TRANSCRIPT

DETERMINANTS OF DIVIDEND POLICY OF SAVINGS AND CREDIT CO-
OPERATIVE SOCIETIES IN KENYA
KIHORO MARY NGIMA
A RESEARCH PROJECT SUBMITTED IN PARTIAL FULFILLMENT OF THE
REQUIREMENTS FOR THE DEGREE OF MASTER OF SCIENCE IN FINANCE,
SCHOOL OF BUSINESS, UNIVERSITY OF NAIROBI
OCTOBER 2018
ii
DECLARATION
I understand, declare that this my original work and has not been presented to any institution
or university other than University of Nairobi for examination
Signed …………………… Date…………………………
MARY KIHORO
D61/77670/2015
This research project has been submitted for examination with my approval as the university
supervisor
Signed…………………… Date…………………………
PROF. J.O. ADUDA
Department of Finance and Accounting
School of Business
University of Nairobi
iii
ACKNOWLEDGEMENT
I would like to acknowledge and to express my special thanks of gratitude to my Professor J.O
Aduda who guided me and gave me this golden opportunity to do this wonderful project on the
topic Determinant of dividend policy in savings and credit cooperative societies in Kenya,
which helped me in doing a lot of research and I came to know about so many new things
which I am very thankful.
Secondly, I would like to thank my parents, my brother and friends who helped me a lot in
finalizing this project within the limited time frame.

iv
DEDICATION
I dedicate this project to my friend Emmanule Muteti who have supported me throughout.
v
ABSTRACT
Dividend policy plays a major role in the decision-making process by financial managers. The
management of a firm must decide the amount of profit to be retained in the business and then
up with the ratio for allocation of dividends to each shareholder. The decision on how much
profit should be retained and the amount paid in form of dividends is a vital element in dividend
policy. This study sought to establish the determinants of dividend policy of SACCOs in
Kenya. Specifically, the study examined the influence of financial leverage, liquidity,
profitability firm size, Working capital management and investments on dividend policy of
SACCOs in Kenya. The study adopts a causal research design. The population targeted by the
study was SACCOs in Kenya. The study used Slovin’s formula to calculate sample size 39 164
registered SACCOs in Kenya. The study collected secondary data and data was analyzed using
descriptive statistics and regression analyses. The study concluded that the determinants of
dividend policy of SACCOs in Kenya are liquidity, financial leverage, profitability, firm size,
working capital and investment. The dividend paid by SACCOs in Kenya increases with
increase in working capital, profitability and firm size. Dividend paid by SACCOs in Kenya is
adversely affected by increase in liquidity, financial leverage and investment. The study
recommends that SACCOs should mitigate distress caused by high rates of financial leverage
by signing of covenants on debts; SACCOs should not indulge in declaring exorbitant amounts
if dividends in the effort to attract more investment at the expense of liquidity position; smaller
SACCOs should come up with strategies to avoid information asymmetries which may affect
the dividend payment and; further research on the influence of government regulations and
organizational polices on dividend payment by SACCOs in Kenya.
vi
TABLE OF CONTENTS
DECLARATION ....................................................................................................................... ii
ACKNOWLEDGEMENT ....................................................................................................... iii
DEDICATION .......................................................................................................................... iv
ABSTRACT ............................................................................................................................... v
LIST OF TABLES ................................................................................................................. viii
LIST OF ABBREVIATIONS ................................................................................................... ix
CHAPTER ONE: INTRODUCTION ........................................................................................ 1
1.1 Background of the Study ................................................................................................. 1
1.1.1 Dividend Policy ........................................................................................................ 2
1.1.2 Determinants of Dividend Policy.............................................................................. 4
1.1.3 SACCOs in Kenya .................................................................................................... 5
1.2 Research Problem ............................................................................................................ 6
1.3 Research objectives .......................................................................................................... 7
1.3.1 Specific Objectives ................................................................................................... 7
1.4 Value of the Study ........................................................................................................... 7
CHAPTER TWO: LITERATURE REVIEW ............................................................................ 9
2.1 Introduction ...................................................................................................................... 9
2.2 Theoretical Review .......................................................................................................... 9
2.2.1. Dividend Relevance Theories .................................................................................. 9
2.1.1. Dividend Irrelevance Theories ............................................................................... 10
2.3 Dividend Policy ............................................................................................................. 11
2.4 Determinants of Dividend Policy................................................................................... 13
2.4.1 Financial Leverage .................................................................................................. 13
2.4.2 Liquidity .................................................................................................................. 14
2.4.3 Profitability ............................................................................................................. 14
2.4.4 Firm size.................................................................................................................. 15
2.4.5 Management of Working Capital............................................................................ 15
2.4.6 Investment ............................................................................................................... 16
2.6 Empirical Studies in Kenya ........................................................................................... 17
2.7 Research Gap ................................................................................................................. 19
2.8 Conceptual Framework .................................................................................................. 20
CHAPTER THREE: RESEARCH METHODOLOGY .......................................................... 21
3.1 Introduction .................................................................................................................... 21
3.2 Research Design............................................................................................................. 21
vii
3.3 Study Population ............................................................................................................ 22
3.4 Sampling Method ........................................................................................................... 22
3.5 Data Collection Method ................................................................................................. 23
3.6 Data Analysis ................................................................................................................. 23
3.6.1 Multiple Regression Analysis ................................................................................. 23
3.6.2 Measurement of Variables ...................................................................................... 24
3.6.3 Tests for Assumptions of Regression ..................................................................... 25
3.6.4 Test for the Significance of the Regression Coefficients ........................................ 25
CHAPTER FOUR: DATA ANALYSIS, RESULTS AND DISCUSSIONS .......................... 27
4.1 Introduction .................................................................................................................... 27
4.2 Descriptive Statistics ...................................................................................................... 27
4.3 Multicollinearity Test..................................................................................................... 28
4.4 Autocorrelation .............................................................................................................. 29
4.5 Significance of the Regression Coefficients .................................................................. 30
4.6 Discussions .................................................................................................................... 32
CHAPTER FIVE: SUMMARY, CONCLUSIONS AND RECOMMENDATIONS ............. 34
5.1 Introduction .................................................................................................................... 34
5.2 Summary ........................................................................................................................ 34
5.3 Conclusion ..................................................................................................................... 35
5.4 Recommendations .......................................................................................................... 36
5.2.1 Recommendations for Policy Development ........................................................... 36
5.2.2 Recommendations for Further Studies.................................................................... 36
REFERENCES ........................................................................................................................ 37
APPENDIX I: DATA COLLECTION SHEET ....................................................................... 42
APPENDIX II: SAMPLED SACCOs ..................................................................................... 43
APPENDIX III: LIST OF LICENSED SACCOs IN KENYA ................................................ 44
viii
LIST OF TABLES
Table 4.1: Descriptive Statistics .............................................................................................. 27
Table 4.2: Collinearity Statistics .............................................................................................. 28
Table 4.3: Collinearity Diagnostics ......................................................................................... 29
Table 4.4: Durbin-Watson Test................................................................................................ 29
Table 4.5: Model Summary ..................................................................................................... 30
Table 4.6: Analysis of Variance............................................................................................... 30
Table 4.7: Coefficients of Regression ...................................................................................... 31
ix
LIST OF ABBREVIATIONS
NPV: Net Present Value
NSE: Nairobi Securities Exchange
SACCOs: Savings and Credit Co-Operative Societies
SASRA: Sacco Societies Regulatory Authority
VIF: Variance Inflation Factor
1
CHAPTER ONE: INTRODUCTION
1.1 Background of the Study
Dividends are the part of net earnings by a company that are appropriated the shareholders
proportionate to the shares they hold in the company (Pandey, 2011). Decisions on dividend
payments are made by company directors. When a company makes a profit, they must decide
on what to do with those profits. They could continue to retain the profits within the company,
or they could pay out the profits to the owners of the firm as dividends. Once the company
decides on whether to pay dividends, they may establish a dividend structure, which may in
turn impact on investors and perceptions of the company in the financial markets which bring
impact on the firm’s value.
Dividend payout is the percentage of profits paid to shareholders in dividends. It is the ratio of
annual dividend per share to profits per share of the firm (Brockington, 1993). Profit making
organizations develop dividend policy which helps managers in the appropriation of dividends
proportionate to shares capital owned by each shareholder (Pandey, 1999). Dividend policy
regulates and guides a firm’s management when issuing dividends to shareholders. Large
firms that have steady flow of cash and few prospects for further growth have a tendency to
direct greater portion of profit earned towards payment of dividends. According to Brigham
and Ehrdardt (2011), large companies can also use profit earned to buy stocks. When a firm
has good prospects for growth and viable opportunities for investment, they tend to direct much
of the profit earned to the new growth opportunities. Such firm minimizes the amount of
dividends paid to shareholders.
Dividends can be paid in different forms including cash payments, payments in terms of stock
and payment in form of property (Kisaka, Kitur and Mbithi, 2015). Dividends paid in cash are
made by apportioning cash to the shareholders. Payments in terms of stock are made by adding
2
more shares to the shareholders in line with the shares owned by each shareholder. Payment of
dividends in form of property is actualized through physical assets such as equipment and land.
According to Banarjee (2008), property dividends can also be in form of inventories.
Perspectives on dividends differ in terms of conservatives, those in the middle and radical
groups (Anupam, 2012). Those holding conservative view of dividends attribute increase in
the firm value to the dividends paid to shareholders. The middles groups opine that firm value
does not change with payments of dividends. Contrary to conservatives, persons who hold the
radical view argue that payment of dividends lowers firm value. Payment of dividends may
differ from one country to another (Chay and Suh, 2008). The difference is orchestrated by
variations in policies and laws regulating business, difference in tax policies and the regulations
that govern policies on dividends.
1.1.1 Dividend Policy
Dividend policy plays a major role in the decision-making process by financial managers. The
management of a firm must decide the amount of profit to be retained in the business and then
up with the ratio for allocation of dividends to each shareholder. If the managers decide to
retain a greater portion of the profit, the amounts of dividends earned by shareholders reduces
(Pandey 2006). The decision on how much profit should be retained and the amount paid in
form of dividends is a vital element in dividend policy. Other considerations in the dividend
policy are budgets for administration, how stable dividends are, repurchasing of stock and the
level of liquidity in the organization (Kirungumi 2003).
According to Baker, Powell, and Veit (2002), formulation of dividend policy remains a
challenge to most financial managers and scholars despite the important role it plays in
financial management. One of the factors that render dividend policy a challenge is the
existence of diverse reasons put forward to explain what determines various policies (Desai,
3
Foley and Hines, 2001). Bebczuk, (2004) posit that agency problems emanating from conflict
between managers and shareholders is a major factor that explain differences in dividend
policies. The owners of a company consider dividends as a tool that enables them to take
charge of resources from the managers. On the contrary, managers of a company use dividends
as an indicator to the capital market signaling that the company is profitable.
The level of performance in a firm can be deduced from its dividend policy (Rigar and
Mansouri, 2003). The amounts of dividend payments made by a firm can be a pointer of
financial heath within the organization and the investment opportunities available. Most of
shareholders do not approve reduction in dividend payments with a view to use much of the
profit made in repurchasing stock. However, retention of larger portion of profit can be viewed
as an indicator of growth of a company.
Policies that guide dividend payments differ in every organization. According to Alkuwari,
(2009), each organization designs its policy on dividend payment according to the state of
business environment where it operates. Majority of organizations opt for retention of larger
portions of the profit made in a financial year in order to expand their capital base.
A critical area of dividend policy is the decision on how much of the profit should be paid as
dividends and how much should remain in the organization. The amount of profit ploughed
back into the organization forms a major source of fund for growth purposes. Nonetheless,
owners of a company advocate for payments of high rates of dividends. Hence firm's
management, in implementing its dividend decisions, should properly weigh its investment
needs against those of the shareholders. This then will enable the management to come up with
an optimal dividend policy determined solely by the profitability of investment (Kirugumi
2003).
4
Majority of organizations formulate policies on dividends which are guided by a principle that
the fall in levels of dividends shows weakness in the organization and managers should raise
the amount of dividends after ascertaining sustainability of such levels or future possibilities
for improvement (Horne 2001). Consequently, shareholders whose own consumption pattern
closely follows the dividends pattern of the firm will be attracted by the knowledge that they
are unlikely to encounter imperfect capital markets in order to make dividends or consumption
pattern adjustments.
1.1.2 Determinants of Dividend Policy
Empirical studies have established various determinants of dividend policy including financial
leverage, liquidity, profitability firm size, working capital management investments and share
price volatility. The amount of dividends reduces with increase in financial leverage and
reduction in financial leverage lead to rise in dividends (Zeng 2003; Fenn and Liang 2001).
According to James, (2009), Baker and Wurglerm (2004), Baker (2009), Okpara (2010) and
Muthusamy (2010) the amount of dividends paid reduces with increase in liquidity of a firm
and the fall in liquidity leads to rise in dividends.
Profitability is directly related to dividend payout (Lasher, 2008, Al-Kuwari 2009, Abdi 2010).
When a firm makes higher profits in a given trading period, it is expected to issue out
higher levels of dividends. Similarly, an increase in the size of a firm corresponds to an
increase in the amount of dividends paid (Deshmukh, 2005, AL- Shubiri, 2011). Firms with
adequate working capital have sound cash position and thus pay higher dividends than firms
with inadequate working capital (Ahmed & Javid, 2009, Pandey, 2010). Availability of
investments opportunities for a company is also a major factor determining dividend
payments (James, 2009).
5
Volatility in the prices of stock influences dividend payments. Higher volatility in the prices of
stocks lead to higher dividend payments and the fall in volatility of stock prices lead to increase
in dividend payments (Chijoke and Aruoriwo, 2011). On the contrary, Zuriawati, Joriah and
Abdul (2012) established that increase in volatility in the prices of shares lead to fall in dividend
payments but the influence is not significant.
1.1.3 SACCOs in Kenya
Kenya has experienced growth in savings and credit co-operatives. SACCOs have made great
contributions in socio-economic development in Kenya by improving access to fund for
business and personal (Wambua, Rotich and Anyango, 2016). The body that regulates
SACCOs is known as Sacco Societies Regulatory Authority (SASRA). SASRA authenticates
and register all SACCOs in Kenya. The legislative framework that guides operations of
Kenyan SACCOs: the Sacco Societies Act that was enacted in the year 2008. The act regulates
licensing and monitoring Kenyan SACCOs. Appendix III shows that SASRA has registered
164 SACCOs (SASRA 2017).
Kenyan SACCOs plays an important role in fulfilling financial need of people who cannot
qualify for credit facilities offered by banks (Kadagi, Ahmed and Wafula, 2015). SACCOs
accept small monthly deposits and have low rates of interest on loans. The time taken to process
loans is also short because members can act as guarantors unlike banks that require huge
collaterals. The services provided by SACCOs are close to the people because some of them
are formed at organizational levels and mainly involve people who work in the same
organization (Kadagi, Ahmed and Wafula, 2015).
According to Cheruiyot et al (2012), the major objective of Saccos in Kenya is to promote
economic interests and general welfare of members. Saccos provide members with the
avenue of borrowing to enhance production and welfare purposes this in turn reflects
6
the various loan products that Saccos have i.e. provident loans which are used to smoothen
incomes of families to which the members hail from and also loans for productive purposes
e.g. investments and educational loans and also emergency loans which members can access
in case of an emergency e.g. sickness, death and any mishap.
1.2 Research Problem
Dividend policy play major role in financial management because it influences how firms
invest their income. Dividend policies are associated with other aspects of financial
management such as management of assets and mismanagement of capital (Baker and
Weigand, 2013). Despite the importance placed on dividend policy in an organization, there is
no universally accepted guidelines on its formulation and scholars describe it as a puzzle
(Brealey and Myers 2005; Abor and Bokpin, 2010). This is an indication that more research
is needed on dividend policies across the world to provide deeper insight into best practices
that financial managers should adopt in dealing with payment of dividends.
A few empirical studies on dividends have been carried in Kenya and the main focus has been
on firms listed at Nairobi Securities Exchange (Martin 2008; Ngunjiri, 2010; Ngobe et al. 2013;
Mwihaki 2013; Elmi and Muturi 2016). The aforementioned studies have majorly examined
the association between dividends and volatility of stock prices (Exchange and Martin 2008;
Ngunjiri 2010; Ngobe et al. 2013; Mwihaki 2013). The study by Elmi and Muturi (2016)
analyzed the nexus between dividends and profitability. Kenya still lack studies on dividend
policies of firms that are not listed at NSE. Besides, studies in Kenya have not focused on other
determinants of dividend policy such as financial leverage (Zeng 2003), liquidity (Okpara
2010), profitability (Abdi 2010), firm size (AL- Shubiri, 2011), and working capital (Pandey,
2010) and investment (James, 2009).
7
Mbuki (2010) established that dividends payout ratio among Kenyan SACCOs was determined
by availability of investments opportunities and availability of cash to pay the dividend.
However, the study too did not focus on factors such as financial leverage, profitability, firm
size, and working capital management. This indicates that more research is still needed on
dividend policies of Kenyan SACCOs. Consequently, this study seeks to bridge the research
gap by examining the determinants of dividend policy of SACCOs in Kenya.
1.3 Research objectives
The general objective of this study is to establish the determinants of dividend policy of
SACCOs in Kenya.
1.3.1 Specific Objectives
Specifically, the study seeks to:
i. Evaluate the influence of financial leverage on dividend policy of SACCOs in Kenya
ii. Assess the influence of liquidity on dividend policy of SACCOs in Kenya
iii. Determine the effect of profitability on dividend policy of SACCOs in Kenya
iv. Establish the effect of firm size on dividend policy of SACCOs in Kenya
v. Establish the effect of working capital management on dividend policy of SACCOs in
Kenya
vi. Examine the effect of investment on dividend policy of SACCOs in Kenya.
1.4 Value of the Study
The information generated by study will inform shareholders about the determinants of
dividend policy in SACCOs in Kenya. Shareholders in SACCOs will use the results of this
study to make prudent decisions on their investments. Knowledge on the determinants of
8
dividend policy will minimize conflicts between shareholders and the managers therefore
mitigating agency problems that might arise over their investments.
Management of SACCOs will use the results and recommendation from this study as a source
of information for management of dividend policies in Kenya. Managers will be in a position
to formulate proper dividend policies that will benefit the shareholders’ return on
investment.
The study will enrich the current documented scholarly knowledge on dividend policies thus
aid future researchers on issues relating to dividend policy and can be used for comparison
purposes with other research conducted in relation to dividend policy in various industries.
9
CHAPTER TWO: LITERATURE REVIEW
2.1 Introduction
This chapter presents a review of theoretical literature on dividends and empirical literature
pertinent to dividend policy. The chapter commences with review of theories on dividend
followed by empirical literature on dividend policy and its determinants. The chapter also
reviews empirical studies in Kenya. The chapter concludes with a section on the research gap.
2.2 Theoretical Review
There are many theoretical approaches to dividends. One of the theoretical perspectives is that
dividends are not relevant. Another theoretical perspectives advocate for relevance of
dividends. This section presents dividend relevance theories and dividend irrelevance theories.
2.2.1. Dividend Relevance Theories
The study discusses there theories that advocate for reliance of dividends. These theories are
Bird-in-Hand theory (Gordon 1963), information signaling effect theory (Ross 1977), tax
differential theory (Litzenberger and Ramaswamy 1979) and agency theory (Ross, Westerfield
and Jordan 2011).
In the Bird-in-Hand theory Gordon (1963), posit that the value of a firm is influenced by the
firm’s policy on dividends. The owners of a company tend to avoid risky investments and opt
for investments that are certain. They have a preference for dividends which are certain as
opposed to capital gains. Capital gains are not certain because they are affected by fluctuations
demand and supply. To a shareholder dividend is a “bird in hand” due to guaranteed payments.
On the other hand, capital gains are treated as "the bush" because returns are not guaranteed
(Gordon 1963). Declaration of high rates of dividends result in higher firm values
10
The signaling effect theory argued by Ross (1977) contend that policies on dividends can used
by managers to convey essential information to a market that is not efficient. Managers are the
only ones in possession of the kind of information they intend to convey in such markets.
Management that declares high rates of dividend tend to inform market players and the owners
of the company those future levels of profits would be high enough to sustain the declared
dividends. The resultant effect would be the rise in prices of the shares in the firm and the value
of the firm. Positive information about dividends causes rise in the firm value.
Tax differential theory by Litzenberger and Ramaswamy (1979) advocates for the relevance of
dividends through an argument that dividends attract high amounts of taxes compared to tax
levied on capital gains. Consequently, firm value falls if a firm decides raise the amount of
dividend paid to shareholders. The more the dividends, the more the taxes paid and vice versa.
A firm that intends to raise its value should declare low amounts of dividend. Tax differential
theory holds the view that policies on dividend are relevant because they influence firm values.
According to agency theory (Ross, Westerfield and Jordan 2011) payment of dividends are
affected by existence of agency problems in a firm. Managers may end up paying high amounts
of dividend as a strategy to solve agency problem in a firm. The amount of profit ploughed
back into the business reduces under such circumstances. Such decision also compels
managers to look for other sources of fund to manage capital from financial institutions that
offer credit. However, the management capabilities of the managers may become questionable
due to increased quest for external funds. These events compel managers to be more transparent
with firm owners and manage the firm in a manner that improve shareholders equity.
2.1.1. Dividend Irrelevance Theories
Modigliani and Miller theory of dividend irrelevance (Modigliani and Miller 1961) opines that
firm value is not affected by payment of dividends. According to this theory, policies that
11
guide investment determine the amount profit made by a company. Firm value is dependents
on the profit earned. Consequently, the policies on investment render policies on dividend
irrelevant. Firm owners are able to determine the amount of money earned without dependence
on dividend policy.
This study also adopts the theory of Agency Cost and Free Cash Flow (Rozeff 1982) which
argue that, as means to prevent agency problems arising from payment of dividend, decision
on investment should be left to the owners of a firm. All that a company needs to do is pay the
profit due to firm owners and they can decide what to do with such profit. This kind of approach
will ensure that shareholders are in control of the firm and minimize agency problems.
Therefore, dividend policy is not needed because shareholders are in charge of investment in
the firm.
Another theory that vie dividend policy as irrelevant in firm is Tax Preference Theory
(Litzenberger and Ramaswamy 1979). The theory argues that higher tax that dividends attract
act as deterrent to payment of dividends in an effort not to lower the value of the firm. Investor
tends to choose firms that do not pay dividends and instead invest profit earned in capital gains.
Under such circumstances, dividend policy becomes irrelevant because shareholders prefer the
lowly taxed capital gains. Moreover, the value of the firm increases when no payments are
made as dividends.
2.3 Dividend Policy
Dividend policy is a strategic framework that guides the decisions pertinent to dividends in an
organization (Shisia, Sang, Sirma and Maundu, 2014). The main components of the policy are
guidelines on the allocation of profit the owners of a company and the guidelines that steer
ploughing back of profit in a firm. The owners of a firm can access data on performance
12
through policy on dividends. The following paragraphs discus various form of dividend
policies.
The first type of dividend policy is referred to as the residual payment policy. This policy state
that a firm should first deduct the profit to be ploughed back into the firm for working capital
management from the total profit earned. Payment of dividends is then equated to the amount
that remains (Shisia et al., 2014). The implication this policy is that the yearly dividends
declared varied as profits and funds invested varied. These instabilities lead to rise in cost of
capital due to skepticism by the investors. The main advantage of residual policy is that firm
value rises anytime that money earned exceed the cost of equity.
The second type of dividend policy is known as predictive dividend policy (Shisia et al., 2014).
This policy is characterized by setting the payment of dividends at particular amount. The rate
at which dividends rise should be constant. Shareholders prefer stability in policies on dividend.
A fall in firm earnings can lead to fall in dividend payments but such reductions depend on
confirmation that there will be no more falls below the low levels of firm earnings. The benefit
of predictive policy is the assurance made to stakeholders on that they always earn whenever
profits are made in the firm.
The third type of dividend policy is known as constant payout ratio (Shisia et al., 2014). The
underlying principle in this policy is that fluctuations occur in the dividends declared on each
share due to changes in profits made by a firm. This policy makes it easy for managers to come
up with periodic amounts of dividend to be declared in the firm. The main drawback in this
policy is that it causes volatility in the price of shares because investors become skeptical of
the possibilities of gaining out of their investment.
The fourth type of dividend policy is referred to as low plus extra or bonus policy (Mathur
1979). The main characteristic of this policy is the availability extra payments made in addition
13
to the dividends declared in a firm. Shareholders have assurance that they will earn dividends
at the end of each financial period. Payment of bonuses send signals that the firm is committed
to making dividend payments on a regular basis.
2.4 Determinants of Dividend Policy
This section presents a discussion of factors that influence policies on dividends. Determinants
considered include: financial leverage, liquidity, profitability firm size, Working capital
management and investments. These factors are discussed as follows:
2.4.1 Financial Leverage
Financial leverage refers to the ratio of debt to the assets of a firm (Fenn and Liang 2001).
Financial leverage is used as an indicator of the possibilities of firms encountering defaults in
the future (Zeng 2003). Payments of dividends increases with the fall in financial leverage and
the rise in financial leverage leads to fall in the rates of dividend declared in a firm. The rise in
financial leverage indicates that a firm is facing a rise in distress in financial management.
When a firm record high rates of facial leverage, payment of dividends may exacerbate the
levels of distress in such firms (Fenn and Liang 2001).
One of the solutions to mitigate distress caused by high rates of financial leverage is the signing
of covenants on debts aimed at reduction in the amounts paid as dividends to persons or entities
that own bonds (Nash et al 2003). The rise in the ratio of debt equity result in the rise of the
rates of dividend declared by a firm and the fall in debt equity result in the fall dividend
payment (Kapoor et al 2010).
14
2.4.2 Liquidity
Liquidity denotes the capability of an organization to fulfil its financial obligations anytime
such obligation needs to be paid for (Pandey 1999). When a firm issues out dividends it reduces
the amount of liquid cash that can be used to meet the demands of short time creditors and
lenders. This causes adverse effects on the ability of a firm to survive constraints in financial
positions rendering the firms insolvent. Profitability of a firm can also be affected by the
dividend decision. By issuing out dividends to the shareholders, the available cash that could
have been used for reinvestment is drawn out of the firm. Liquidity position relates to a firm’s
capability to fulfil obligation that arise in short terms. Cash is an important element in the
liquidity position of the company. Managers may be compelled not to declare dividends
when a firm lacks funds to pay for the short term obligations (James, 2009).
A rise in the levels of liquidity lead to reductions capital cost as the net present value (NPV) of
the firm increases thus lowering dividend payments (Baker and Wurgler, 2004). Therefore, the
rise in liquidity causes a fall in in the rates of dividends and a fall in the level of liquidity leads
to a rise in dividends. The amounts of dividends should rise when the liquidity of a firm is high
enough to support investments. However, this means that the firm has limited resources to
declare dividends. Larger companies are able to pay dividends compared to smaller ones
because they have bigger reserves of cash. The opportunities of growth are limited in firms that
declare dividends (Baker, 2009). Studies by John and Muthusamy (2010) and Okpara (2010)
also concluded that high levels of liquidity adversely influence the capacity of a firm to declare
dividends.
2.4.3 Profitability
The amount of profit that a firm earns influences the ability of the firm to pay dividends to the
stakeholders. It follows that if a firm makes more profit it gets in a position to award higher
15
rates of dividends (Lasher, 2008). Dividend payout ratio determines the amount of profit made
that goes into the issuance of dividends. Empirical studies have established the nexus between
firm profitability and payment of dividends (Al-Kuwari 2009 and Abdi 2010).
According to Al-Kuwari (2009), rise in profitability lead to rise in in dividends and a fall in
profitability result in low levels of dividend. However, there is an inverse association between
dividend and the level of liquidity and financial leverage. Resolution of agency conflicts is a
major driving force in the payment of dividends as managers seek to minimize problems with
the shareholders (Al-Kuwari 2009).
2.4.4 Firm size
The size of a firm is a major determinant of its ability to declare dividends and influences the
amounts paid as dividends (Deshmukh, 2005). The larger the firm, the higher its ability to pay
dividends and the higher the amounts of dividends. Small firms have limited abilities to pay
dividends because much of the profit made is directed towards growth of the firms.
Large firms incur more agency costs compared to small forms (Zeng, 2003). Consequently,
bigger firms pay more dividends in efforts to minimize agency costs. In terms of information
asymmetries, smaller firms are more exposed to information asymmetries compared to large
firms which are able to pay more dividends (Mitton, 2004). AL- Shubiri (2011) established that
the larger the size of the firm, the more the dividends paid. Conversely, the smaller the size of
the firm the lower the amount of dividend it will pay.
2.4.5 Management of Working Capital
The efficient management of working is important for any firm to make profits and maximize
the value of shareholders. When capital is efficiently management, a firm ends up with
adequate levels of cash in hand that can be used to pay for dividends (Pandey, 2010). A firm
16
should ensure that it efficiently manage cash flows in order to enhance liquidity and avail fund
for payment of dividends. Moreover, adequate cash is needed for growth of the firm and
expansion of working capital. In the event of dwindling level of firm liquidity, managers can
opt for conservative policy of dividend (Pandey, 2010).
Dividends and working capital are intertwined and any decisions on payment of dividends must
take into account the status of working capital in the firm (Ahmed and Javid, 2009). The best
practice is to allocate for capital expenditure than use the use the remaining amounts to declare
dividends. Firms with adequate working capital have sound cash position and thus pay higher
dividends than firms with inadequate working capital. Liquidity is an important consideration
for a firm making a dividend decision since most dividends are often paid in cash
(Pandey, 2010). Therefore the determination of dividend payout depends on the working
capital of a firm.
Pandey (2006) analyzed the patterns of dividends paid by Malaysian firms. The results
indicated that working capital, firm’s size and investment opportunities affect dividend
payments. This indicated that well managed companies with optimum working capital
pay higher dividends.
2.4.6 Investment
Availability of investments opportunities for a company is also a major factor
determining dividend payments (James, 2009). When a company has investment opportunities
it can fund them through retained profits or borrowed funds. Retained profits usually offer a
cheap available source of financing compared to borrowed funds. If the management makes a
decision to use the retained funds, this reduces the amount available for distribution to
shareholders hence little or no dividends for that particular period and vice versa (James, 2009).
17
The more the funds are directed towards investment, the less the funds available to pay
dividends (Deshmukh, 2005). Therefore smaller firms that are still expanding tend to direct
more funds into growth and declare low amounts of dividends. One the contrary, larger firms
that are not investing heavily on expansion have more cash to make dividend payments (Amidu
and Abort, 2006).
Investments do not always lead to low dividends as discussed in theory of signaling effect
discussed in section 2.2.1 of this study (Ross, 1977). In this perspective, manager of firms that
invest heavily in capital markets may end up declaring more dividends as a mean to inform the
market players that the firm is in a good financial position. The proponents of agency theory
(Zeng, 2003) argue that a firm may pay more dividends as way to ensure that shareholders are
in control of the firm and prevent any selfish interests of managers. The above studies have
shown that investment influence dividend polices.
2.6 Empirical Studies in Kenya
Odawo and Ntoiti (2015) analyzed factors that influence policies on dividends adopted by
banks in Kenya. The factors analyzed included financial leverage, the size of the firms, the
profitability of the firms and the level of liquidity in the financial market. Data was collected
for a five-year-period ranging from 2003 to 2013. The study concluded that payment of
dividends was inversely associated with liquidity in the financial market and directly
proportional to profitability and finance leverage. Odawo and Ntoiti (2015) recommended that
firms should strive to ensure that the above factors form part of dividend policy in Kenya’s
financial sector.
Olang and Akenga (2017) examined the influence of working capital on payment of dividends
by firms listed at NSE. Olang and Akenga (2017) targeted all the 61 firms listed at the NSE by
the year 2016 and data collected ranged from the year 2011 to 2015. The study concluded that
18
payment of dividends is positively influenced by the management of working capital. The
more efficient the working capital was managed, the higher the amounts of dividends declared
by a firm. The study revealed that cash management, inventory management and account
receivables were positively correlated to dividend policy. Olang and Akenga (2017)
recommended that firms should ensure that cash is well managed, implement policies that
ensure debtors pay on time, and inventory is well managed in order to improve payment of
dividends.
A study by Kioko (2006) focused on the nexus between profitability and dividend polices held
by Kenyan firms listed at the NSE. The study concluded that a positive association exists
between changes in dividend policies and the level of profitability of the firms at the initial
stages of changes made to dividend policies. The relationship between the two variables was
not statistically significant in the subsequent years after change in dividend policies. A similar
study exists by Kisaka, Kitur and Mbithi (2015) on the influence association between dividends
paid by commercial banks in Kenya and the profits made by the banks. Kisaka et al., (2015)
concluded that rise in the amount of profit earned led to rise in the amount of dividends paid
by the banks.
A study by Elmi and Muturi (2016) investigated the association between payment of dividends
and profitability of firms listed at the NSE. Unlike Kisaka et al., (2015) who focused on banks
at the NSE, Elmi and Muturi (2016) targeted commercial and service firm at the NSE. Elmi
and Muturi (2016) concluded that dividend payment by commercial and service firms was not
significantly influenced by their profitability. The study findings by Elmi and Muturi (2016)
differed from Kisaka et al., (2015) who concluded that rise in the amount of profit earned led
to rise in the amount of dividends paid by the banks. This mixed result on the effects of
profitability on dividend policies in Kenya indicate that more research is needed on the factors
that influence dividend payment in Kenya.
19
2.7 Research Gap
Dividends policy is still a puzzle that has not been solved by scholars in the field of corporate
financial management (Lease et al, 2000). Empirical research on dividends indicate variation
in dividend policies in respect to time (Sarig, 2004) and disparities in the the level of
development among nations (Aivazian and Booth, 2003).
Limited research has been carried out on dividend policies adopted in countries that are still
developing as compared to the countries that are already developed. The regulatory and
business conditions between developing nations and the developed ones are different (Mitton,
2004; Lin, 2002). According to Glen and Singh (2004), developing countries contend with
deeper economic constraints resulting in variation in dividend policies compared to developed
economies. Additional differences in economic environment between developed and
developing nations include access and management of information and volatility in prices
(Bekaert and Harvey, 2003). Kenya is a transitional economy and development of knowledge
on dividend policy is necessary in the development of policies that guide investments and
shareholders’ wealth maximization.
The differences on the outcome of studies on dividend policy between developing and
developed countries indicate the importance of continued research on determinant of dividend
policy. The empirical studies reviewed on dividend policy in Kenya have focused on firms
listed at Nairobi securities exchange (Odawo and Ntoiti, 2015; Kisaka, Kitur and Mbithi, 2015)
and banking industry (Olang and Akenga, 2017; Kioko 2006; Kioko 2011; Elmi and Muturi
2016). Little attention has been paid to other sectors and firms that are not listed at NSE. This
study seeks to bridge the research gap by assessing the determinants of dividend payout policy
of SACCOs in Kenya.
20
2.8 Conceptual Framework
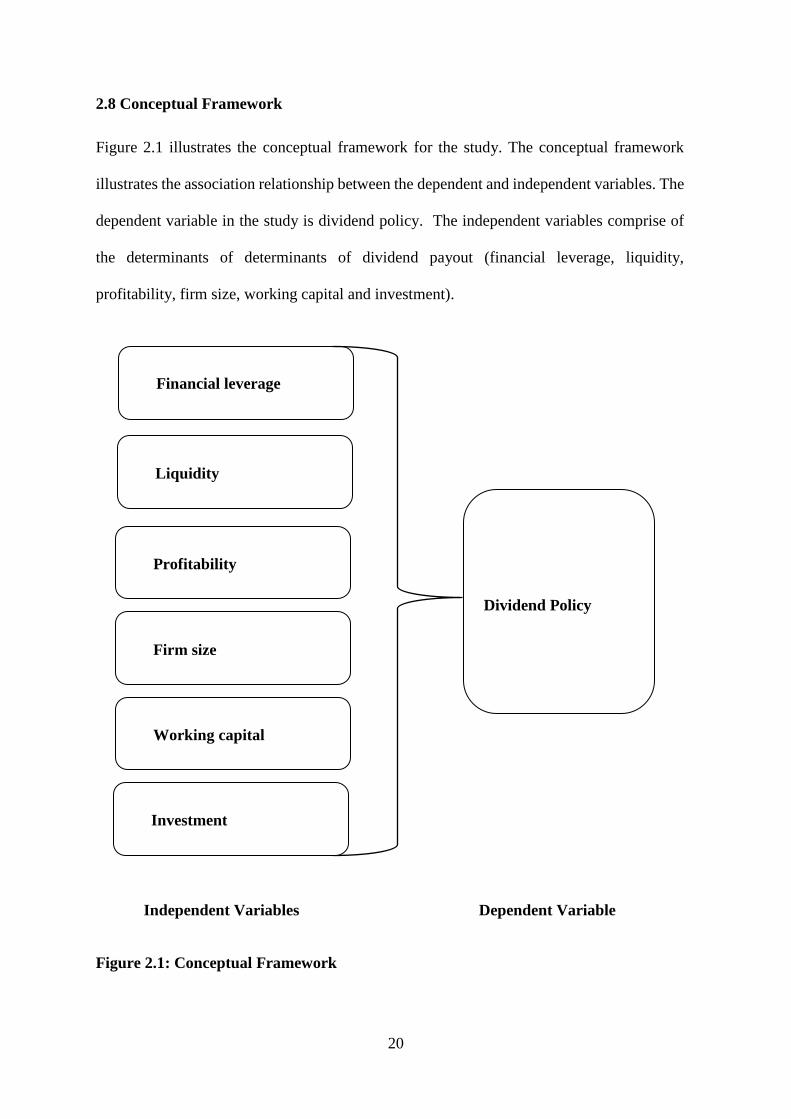
Figure 2.1 illustrates the conceptual framework for the study. The conceptual framework
illustrates the association relationship between the dependent and independent variables. The
dependent variable in the study is dividend policy. The independent variables comprise of
the determinants of determinants of dividend payout (financial leverage, liquidity,
profitability, firm size, working capital and investment).
Independent Variables Dependent Variable
Figure 2.1: Conceptual Framework
Dividend Policy
Financial leverage
Liquidity
Profitability
Firm size
Working capital
Investment
21
CHAPTER THREE: RESEARCH METHODOLOGY
3.1 Introduction
The main focus of this chapter is to discuss the methods of research that were operationalize
this study. The specific areas discussed in this chapter are the research design adopted by the
study, the population targeted and the sampling methods used to arrive at the number of
participants. The chapter also lay out the methods for data collection and how data was
analyzed.
3.2 Research Design
The study adopted a causal research design. A causal research design explains how changes
made on an independent variable cases changes on a dependent variable (Copper and Schindler
2006). The purpose for the adoption of the causal research design was to enable determination
of the causal effect of financial leverage, liquidity, profitability of Kenyan SACCOs, the size
of Kenyan SACCOs, working capital management and investment made by Kenyan SACCOs
on dividend policy of the SACCOs.
The study fulfilled conditions required for analysis of causal effects. The first requirement is
empirical association which was fulfilled by an assessment of the relationship between
dividend policy as the dependent variable and financial leverage; liquidity; profitability; firm
size; working capital and; investment as the independent variables. The second requirement
was specification appropriate time order which in this study was an 8-year-period from 2010
to 2017. The third requirement for causation was non-spuriousness which was observed by
ensuring that association between the study variables was not attributed to changes in other
variables.
22
3.3 Study Population
The population targeted by the study was SACCOs in Kenya. SASRA (2017) has a list of 164
SACCOs registered in Kenya as shown in Appendix III. All the 164 SACCOs registered in
Kenya constituted the population targeted by this study.
3.4 Sampling Method
The study used Slovin’s formula to calculate sample size from the target population of 164
registered SACCOs in Kenya. A sample of 39 registered SACCOs in Kenya was derived as
shown below.
Slovin Formula: )(1 2eN
Nn
Where: n = number of samples
N = total population
e = margin of error * desired
Applying the Slovin’s Formula we have
39
9142.38
2144.4
164
14.01641
1642
n
The study further applied purposive sampling technique to select the 39 SACCOs derived at
by the Slovin’s formula above from the target of 164 registered SACCOs in Kenya. Purposive
sampling is used in selection of respondents or participants that poses particular knowledge
that a study is looking (Tongco, 2007). Statistical methods of data analysis like logistic
regression models, frequencies, chi-square, and analysis of variance and cross tabulation
among others can be used with purposive sampling. (Neupane et al., 2002).
23
The main consideration in the criteria for selection of 39 SACCOs that participated in the study
is the length of period the SACCOs have been operational in Kenya. In this respect, the study
selected 39 SACCOs that have been operational for the longest time. This enabled collection
of time series data for last 5 years. The choice of 8 years was to enable study come up with
reliable findings because the study intends to use inferential statistics to examine time series
data. The more the number of years, the more confidence in the conclusion drawn from
inferential statistics. Appendix II shows the sampled SACCOs. Appendix ii shows the sampled
SACCOs.
3.5 Data Collection Method
The study collected secondary data on dividends policy, financial leverage, liquidity,
profitability, firm size, working capital and investment) of SACCOs in Kenya. The study
extracted secondary data from audited statements of financial position from the 39 selected
SACCOs in Kenya. The study data was quantitative in nature and was in time series covering
an 8-year-period from 2010 to 2017 (Appendix I). The long period will enable the study to
confidently determine causality between the variables.
3.6 Data Analysis
Data was analyzed using descriptive statistic including mean and standard deviations and
inferential statistics (correlation and regression analyses). Correlation and regression analyses
examined the association between dividends as the dependent variable and financial leverage,
liquidity, profitability, firm size, working capital and investment as the independent variables.
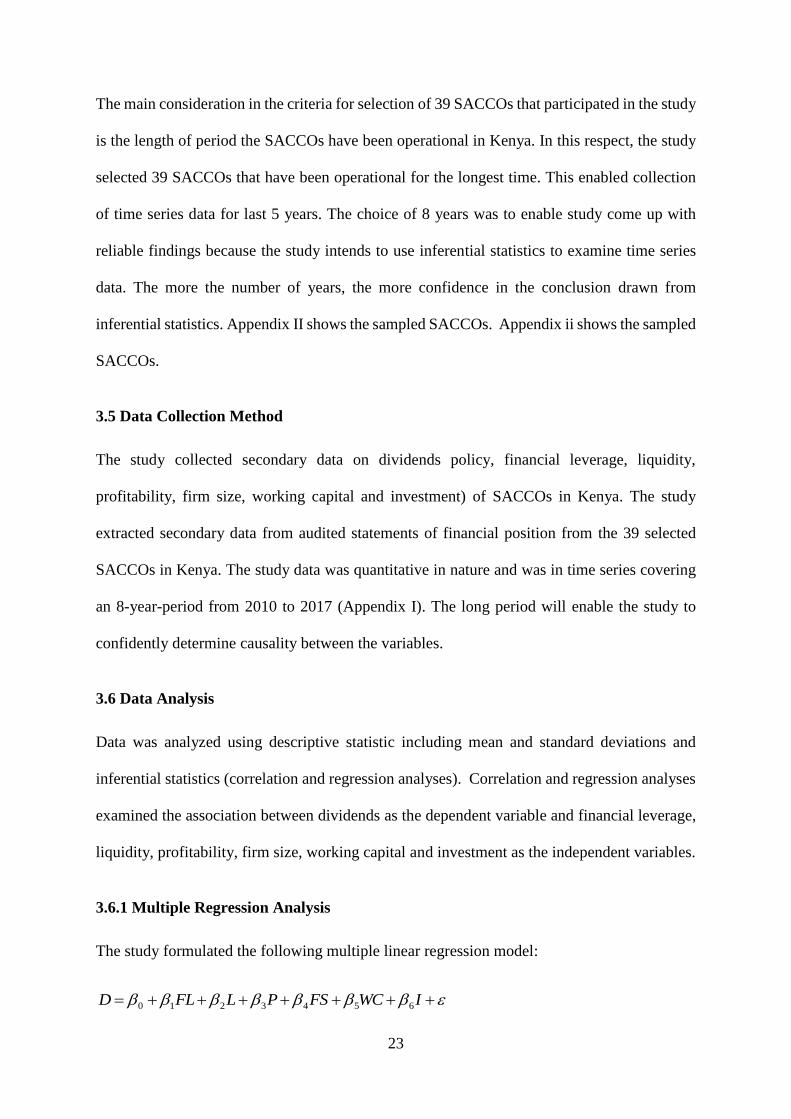
3.6.1 Multiple Regression Analysis
The study formulated the following multiple linear regression model:
IWCFSPLFLD 6543210
24
Where: D-Dividends Payout
0 -constant
1 to6 - coefficients of the regression
FL- Financial Leverage
L-Liquidity
P-profitability
FS-Firm Size
WC-Working Capital
I-Investment
-standard error
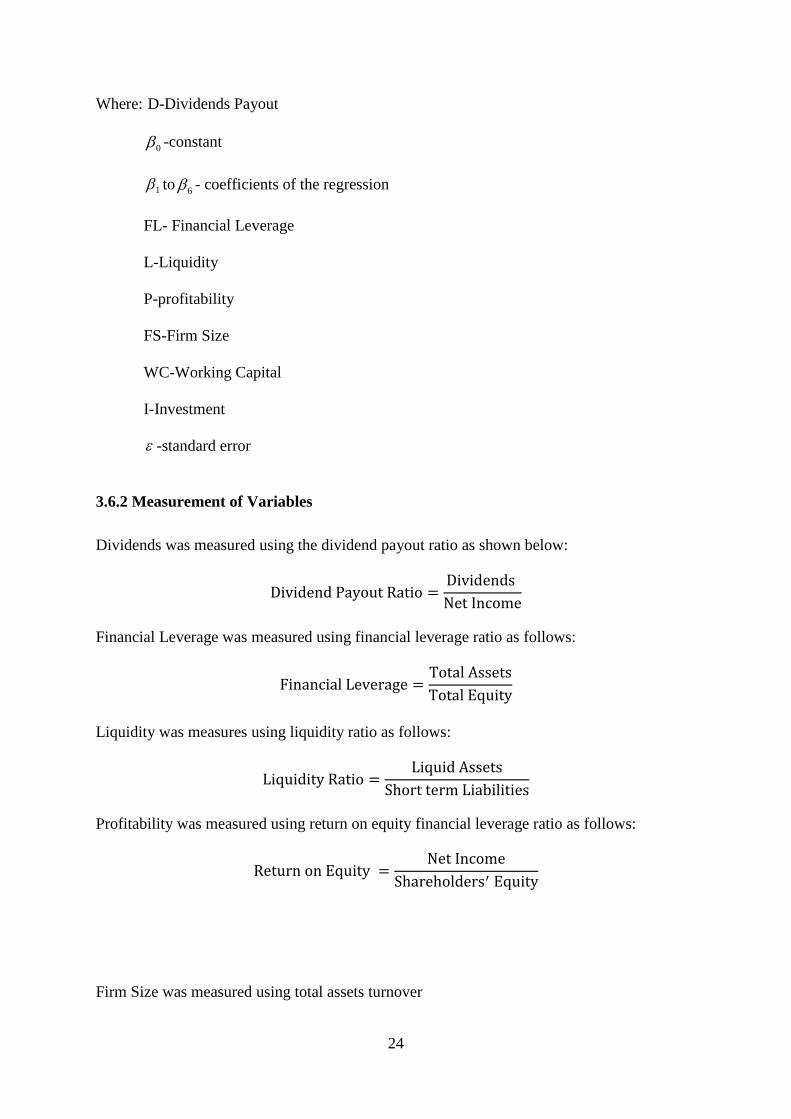
3.6.2 Measurement of Variables
Dividends was measured using the dividend payout ratio as shown below:
Dividend Payout Ratio =Dividends
Net Income
Financial Leverage was measured using financial leverage ratio as follows:
Financial Leverage =Total Assets
Total Equity
Liquidity was measures using liquidity ratio as follows:
Liquidity Ratio =Liquid Assets
Short term Liabilities
Profitability was measured using return on equity financial leverage ratio as follows:
Return on Equity =Net Income
Shareholders′ Equity
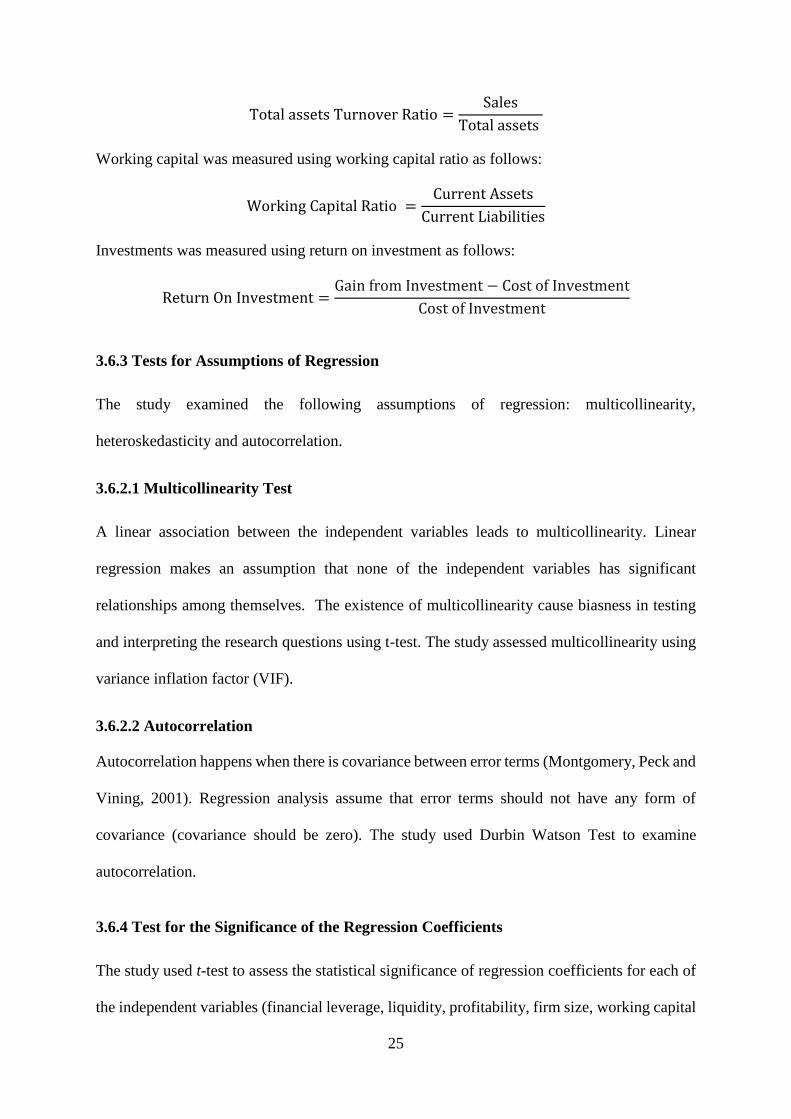
Firm Size was measured using total assets turnover
25
Total assets Turnover Ratio =Sales
Total assets
Working capital was measured using working capital ratio as follows:
Working Capital Ratio =Current Assets
Current Liabilities
Investments was measured using return on investment as follows:
Return On Investment =Gain from Investment − Cost of Investment
Cost of Investment
3.6.3 Tests for Assumptions of Regression
The study examined the following assumptions of regression: multicollinearity,
heteroskedasticity and autocorrelation.
3.6.2.1 Multicollinearity Test
A linear association between the independent variables leads to multicollinearity. Linear
regression makes an assumption that none of the independent variables has significant
relationships among themselves. The existence of multicollinearity cause biasness in testing
and interpreting the research questions using t-test. The study assessed multicollinearity using
variance inflation factor (VIF).
3.6.2.2 Autocorrelation
Autocorrelation happens when there is covariance between error terms (Montgomery, Peck and
Vining, 2001). Regression analysis assume that error terms should not have any form of
covariance (covariance should be zero). The study used Durbin Watson Test to examine
autocorrelation.
3.6.4 Test for the Significance of the Regression Coefficients
The study used t-test to assess the statistical significance of regression coefficients for each of
the independent variables (financial leverage, liquidity, profitability, firm size, working capital
26
management and investment). Significance level for regression analysis in the study will be set
at 95%. Therefore, probability (p) will be set at 0.05 (5%). Any variable with a probability (p)
value that was less than 0.05 was deemed to have significant relationship with the dependent
variable (dividend policy) while any variable with a p-value more than 0.05 was considered to
have an insignificant relationship with dividend policy. The study also estimateed the
magnitude of relationship between the variables using unstandardized coefficients.
27
CHAPTER FOUR: DATA ANALYSIS, RESULTS AND DISCUSSIONS
4.1 Introduction
This chapter present the outcome of data analysis and the interpretation of the results. The
chapters also discuss the findings of the study and relates the findings to the outcome from
similar previous studied.
4.2 Descriptive Statistics
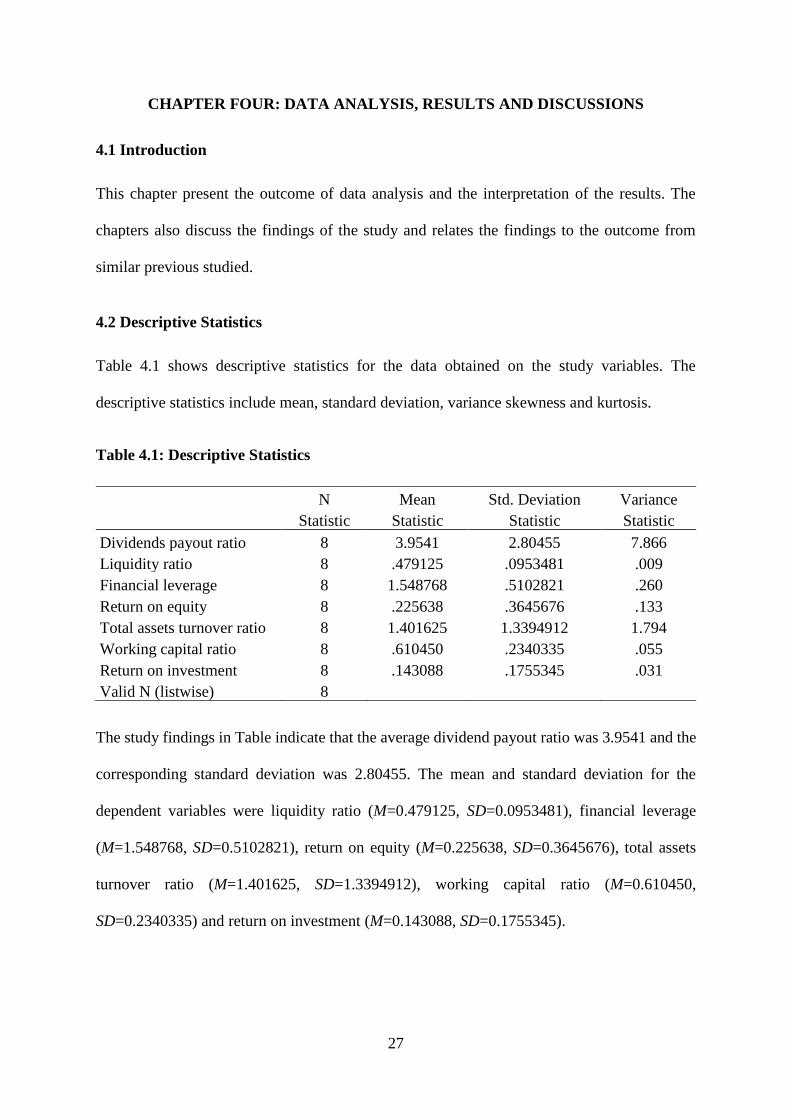
Table 4.1 shows descriptive statistics for the data obtained on the study variables. The
descriptive statistics include mean, standard deviation, variance skewness and kurtosis.
Table 4.1: Descriptive Statistics
N Mean Std. Deviation Variance
Statistic Statistic Statistic Statistic
Dividends payout ratio 8 3.9541 2.80455 7.866
Liquidity ratio 8 .479125 .0953481 .009
Financial leverage 8 1.548768 .5102821 .260
Return on equity 8 .225638 .3645676 .133
Total assets turnover ratio 8 1.401625 1.3394912 1.794
Working capital ratio 8 .610450 .2340335 .055
Return on investment 8 .143088 .1755345 .031
Valid N (listwise) 8
The study findings in Table indicate that the average dividend payout ratio was 3.9541 and the
corresponding standard deviation was 2.80455. The mean and standard deviation for the
dependent variables were liquidity ratio (M=0.479125, SD=0.0953481), financial leverage
(M=1.548768, SD=0.5102821), return on equity (M=0.225638, SD=0.3645676), total assets
turnover ratio (M=1.401625, SD=1.3394912), working capital ratio (M=0.610450,
SD=0.2340335) and return on investment (M=0.143088, SD=0.1755345).
28
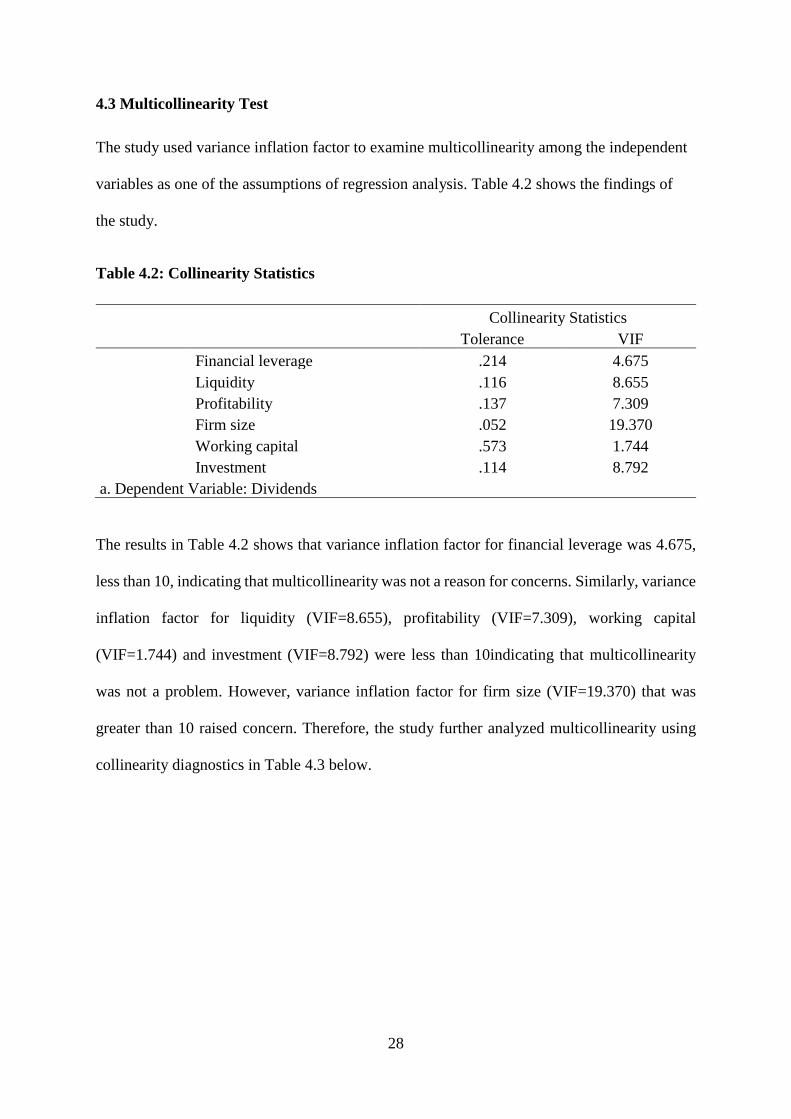
4.3 Multicollinearity Test
The study used variance inflation factor to examine multicollinearity among the independent
variables as one of the assumptions of regression analysis. Table 4.2 shows the findings of
the study.
Table 4.2: Collinearity Statistics
Collinearity Statistics
Tolerance VIF
Financial leverage .214 4.675
Liquidity .116 8.655
Profitability .137 7.309
Firm size .052 19.370
Working capital .573 1.744
Investment .114 8.792
a. Dependent Variable: Dividends
The results in Table 4.2 shows that variance inflation factor for financial leverage was 4.675,
less than 10, indicating that multicollinearity was not a reason for concerns. Similarly, variance
inflation factor for liquidity (VIF=8.655), profitability (VIF=7.309), working capital
(VIF=1.744) and investment (VIF=8.792) were less than 10indicating that multicollinearity
was not a problem. However, variance inflation factor for firm size (VIF=19.370) that was
greater than 10 raised concern. Therefore, the study further analyzed multicollinearity using
collinearity diagnostics in Table 4.3 below.
29
Table 4.3: Collinearity Diagnostics
Model Dimension Eigenvalue Condition
Index
Variance Proportions
(Constant) Financial
leverage
Liquidity Profitability Firm
size
Working
capital
Investment
1
1 5.722 1.000 .00 .00 .00 .00 .00 .00 .00
2 .615 3.049 .00 .00 .00 .11 .01 .00 .00
3 .482 3.445 .00 .00 .00 .01 .02 .00 .01
4 .120 6.908 .00 .00 .00 .01 .00 .95 .01
5 .044 11.439 .01 .02 .01 .09 .15 .00 .60
6 .013 21.069 .01 .66 .22 .57 .04 .01 .04
7 .004 40.232 .97 .31 .77 .21 .78 .04 .33
a. Dependent Variable: Dividends
Condition indices greater than 15 indicate that multicollinearity is a concern while indices
greater than 30 indicate that multicollinearity is a very serious concern. From the study findings
in Table 4.3 the conditional indices were less than 30 with exception of dimension 7 indicating
that multicollinearity was a concern but it was not of a very serious nature.
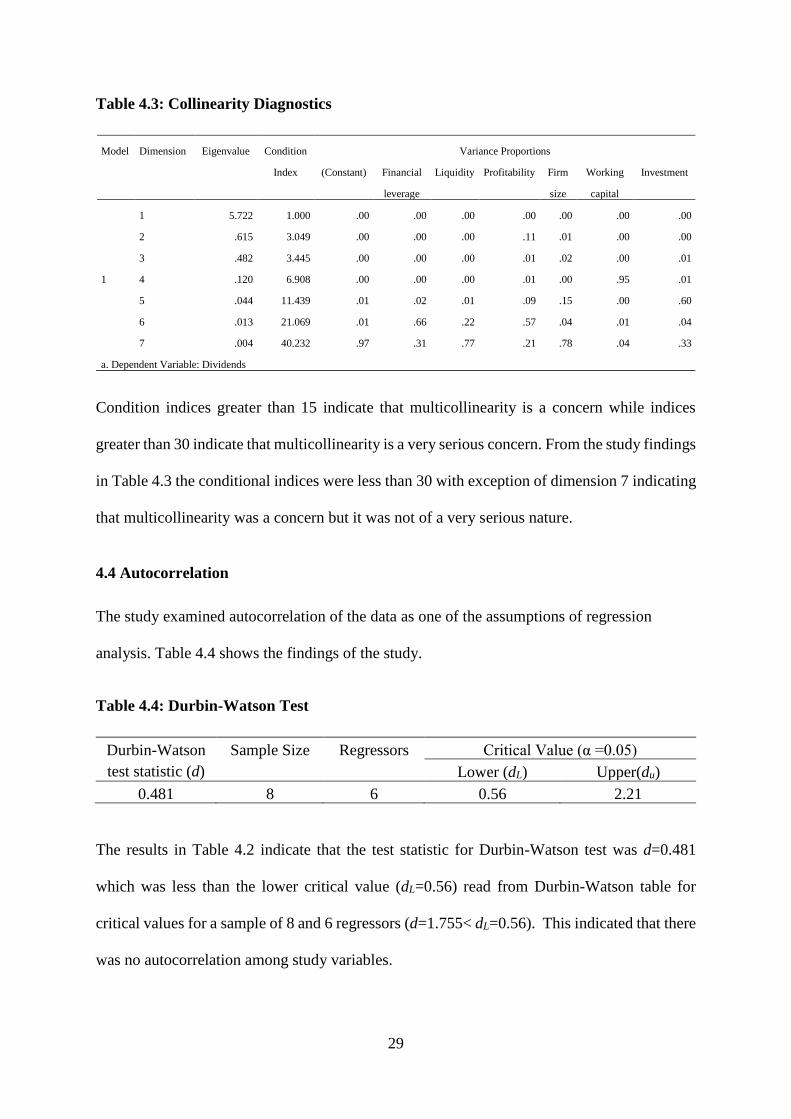
4.4 Autocorrelation
The study examined autocorrelation of the data as one of the assumptions of regression
analysis. Table 4.4 shows the findings of the study.
Table 4.4: Durbin-Watson Test
Durbin-Watson
test statistic (d)
Sample Size Regressors Critical Value (α =0.05)
Lower (dL) Upper(du)
0.481 8 6 0.56 2.21
The results in Table 4.2 indicate that the test statistic for Durbin-Watson test was d=0.481
which was less than the lower critical value (dL=0.56) read from Durbin-Watson table for
critical values for a sample of 8 and 6 regressors (d=1.755< dL=0.56). This indicated that there
was no autocorrelation among study variables.
30
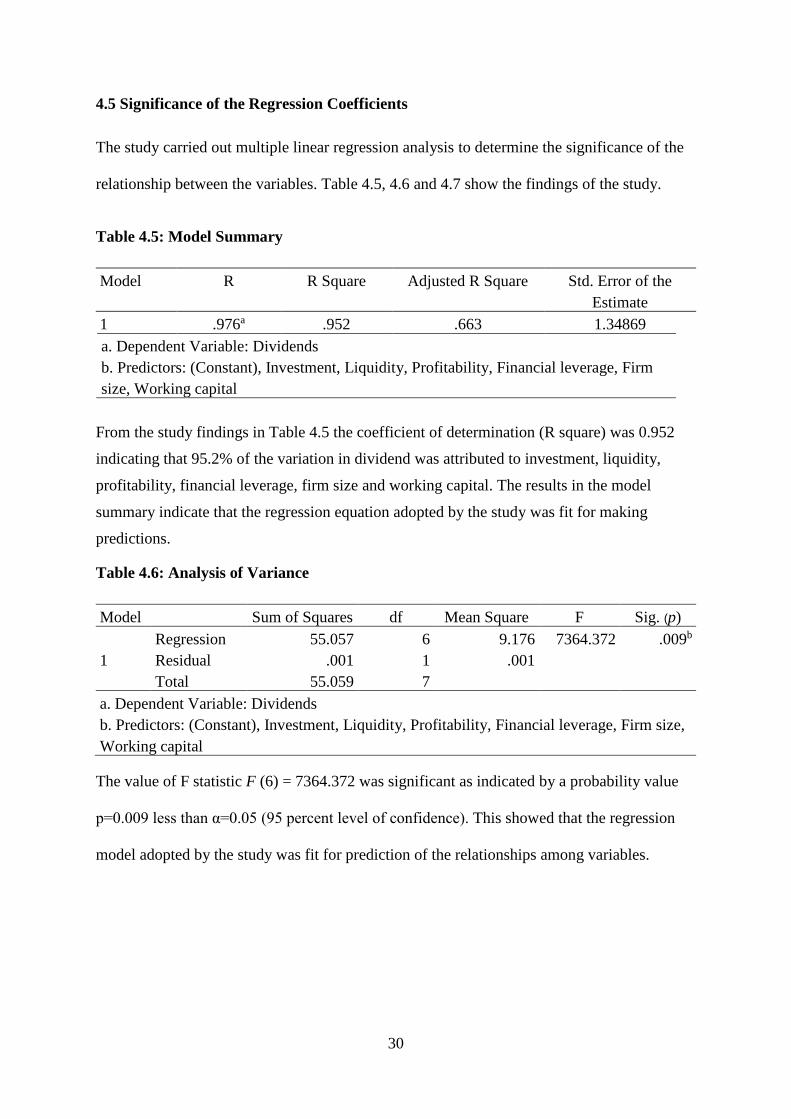
4.5 Significance of the Regression Coefficients
The study carried out multiple linear regression analysis to determine the significance of the
relationship between the variables. Table 4.5, 4.6 and 4.7 show the findings of the study.
Table 4.5: Model Summary
Model R R Square Adjusted R Square Std. Error of the
Estimate
1 .976a .952 .663 1.34869
a. Dependent Variable: Dividends
b. Predictors: (Constant), Investment, Liquidity, Profitability, Financial leverage, Firm
size, Working capital
From the study findings in Table 4.5 the coefficient of determination (R square) was 0.952
indicating that 95.2% of the variation in dividend was attributed to investment, liquidity,
profitability, financial leverage, firm size and working capital. The results in the model
summary indicate that the regression equation adopted by the study was fit for making
predictions.
Table 4.6: Analysis of Variance
Model Sum of Squares df Mean Square F Sig. (p)
1
Regression 55.057 6 9.176 7364.372 .009b
Residual .001 1 .001
Total 55.059 7
a. Dependent Variable: Dividends
b. Predictors: (Constant), Investment, Liquidity, Profitability, Financial leverage, Firm size,
Working capital
The value of F statistic F (6) = 7364.372 was significant as indicated by a probability value
p=0.009 less than α=0.05 (95 percent level of confidence). This showed that the regression
model adopted by the study was fit for prediction of the relationships among variables.
31
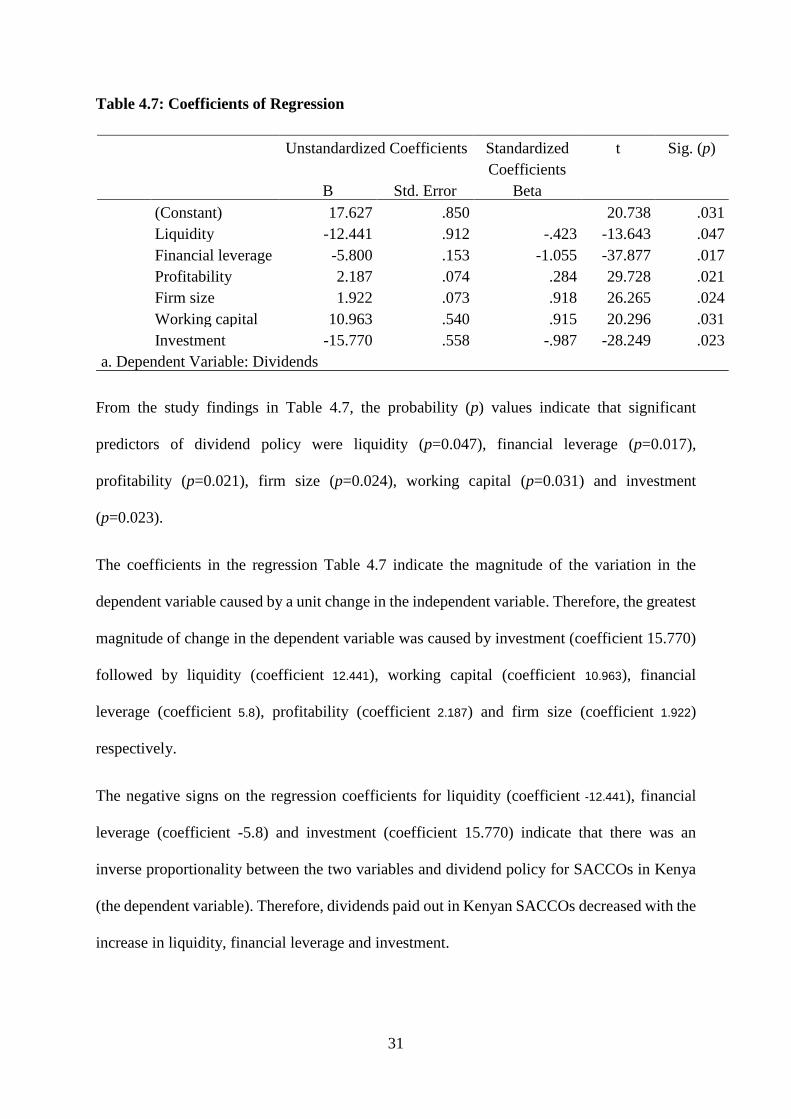
Table 4.7: Coefficients of Regression
Unstandardized Coefficients Standardized
Coefficients
t Sig. (p)
B Std. Error Beta
(Constant) 17.627 .850 20.738 .031
Liquidity -12.441 .912 -.423 -13.643 .047
Financial leverage -5.800 .153 -1.055 -37.877 .017
Profitability 2.187 .074 .284 29.728 .021
Firm size 1.922 .073 .918 26.265 .024
Working capital 10.963 .540 .915 20.296 .031
Investment -15.770 .558 -.987 -28.249 .023
a. Dependent Variable: Dividends
From the study findings in Table 4.7, the probability (p) values indicate that significant
predictors of dividend policy were liquidity (p=0.047), financial leverage (p=0.017),
profitability (p=0.021), firm size (p=0.024), working capital (p=0.031) and investment
(p=0.023).
The coefficients in the regression Table 4.7 indicate the magnitude of the variation in the
dependent variable caused by a unit change in the independent variable. Therefore, the greatest
magnitude of change in the dependent variable was caused by investment (coefficient 15.770)
followed by liquidity (coefficient 12.441), working capital (coefficient 10.963), financial
leverage (coefficient 5.8), profitability (coefficient 2.187) and firm size (coefficient 1.922)
respectively.
The negative signs on the regression coefficients for liquidity (coefficient -12.441), financial
leverage (coefficient -5.8) and investment (coefficient 15.770) indicate that there was an
inverse proportionality between the two variables and dividend policy for SACCOs in Kenya
(the dependent variable). Therefore, dividends paid out in Kenyan SACCOs decreased with the
increase in liquidity, financial leverage and investment.
32
The positive nature of regression coefficients on working capital (coefficient 10.963),
profitability (coefficient 2.187) and firm size (coefficient 1.922) indicated a direct relationship
between the variables and dividend policy for SACCOs in Kenya. Therefore, dividends paid
out to shareholders in Kenyan SACCOs increase with the increase in working capital,
profitability and firm size.
4.6 Discussions
The study established that dividend policy of SACCOs in Kenya is determined by liquidity,
financial leverage, profitability, firm size, working capital and investment. The study
established that rise in financial leverage led to reduction in dividends paid out by SACCOs in
Kenya and fall in financial leverage led to increase in dividends paid out by SACCOs in Kenya.
The increase in financial leverage indicates that SACCOs are in bad debt positions as debts to
asset ratio increases. Therefore, SACCOs with high financial leverage ratios are prone to
distress and they avoid paying out or declaring higher amounts of dividends to avoid depending
or falling into financial distress. The study findings agreed with Kapoor et al 2010 who argued
that increase in financial leverage lead to decrease in dividends.
The study established that increase in liquidity caused decrease in dividends paid out by
SACCOs in Kenya. Conversely, decrease in liquidity caused increase in dividends paid out by
Kenyan SACCOs. This can be attributed to the reduction in the amount of liquid cash when
dividends are paid to the shareholders. The study findings agreed with a similar study
conducted by Muthusamy (2010) and Okpara (2010) who reached a similar conclusion that the
rise in liquidity led to the reduction in dividends.
The study also established that dividend policy of SACCOs in Kenya depend on investments.
Investments by SACCOs mean that more revenues are ploughed back into the business as the
SACCOs expand their portfolio. Therefore, SACCOs that intend to promote growth retain
33
more profit during the period of growth and declare less dividend. However, increased
investment may reduce dividends in the short term but increase dividends in the long term as
the SACCOs make more income. The study findings agree with similar findings by Amidu and
Abort (2006) who established that smaller firms that are still expanding tend to direct more
funds into growth and declare low amounts of dividends.
The study findings revealed that profitability was positively correlated to dividend payout by
SACCOs in Kenya. The rise in the income at the SACCOs translates into higher return on
investment for shareholders as the dividends increase. The study findings are in tandem with
similar studies conducted by Al-Kuwari (2009) and Abdi (2010) who reached a conclusion that
rise in profitability lead to rise in in dividends and a fall in profitability result in low levels of
dividend.
The study findings reveled that firm size influenced dividend policy of SACCOs in Kenya. As
the size of SACCOs increase they are able to make more investments and profit. Consequently,
large SACCOs are able to pay more dividends compared to smaller SACCOs with smaller base
of assets. In another study with findings similar to this study, AL- Shubiri (2011) established
that the larger the size of the firm, the more the dividends paid.
Moreover, the study established that working capital influenced dividend policy of SACCOs
in Kenya. Prudent management of working capital in SACCOs increase their income and
profitability. Increased income enables SACCOs to declare higher amounts of dividend.
Efficient management of working capital translates to sufficient cash and optimal levels of
liquidity and better payment terms in the dividend policy. Similarly, Pandey (2010) established
that the determination of dividend payout depends on the working capital of a firm.
34
CHAPTER FIVE: SUMMARY, CONCLUSIONS AND RECOMMENDATIONS
5.1 Introduction
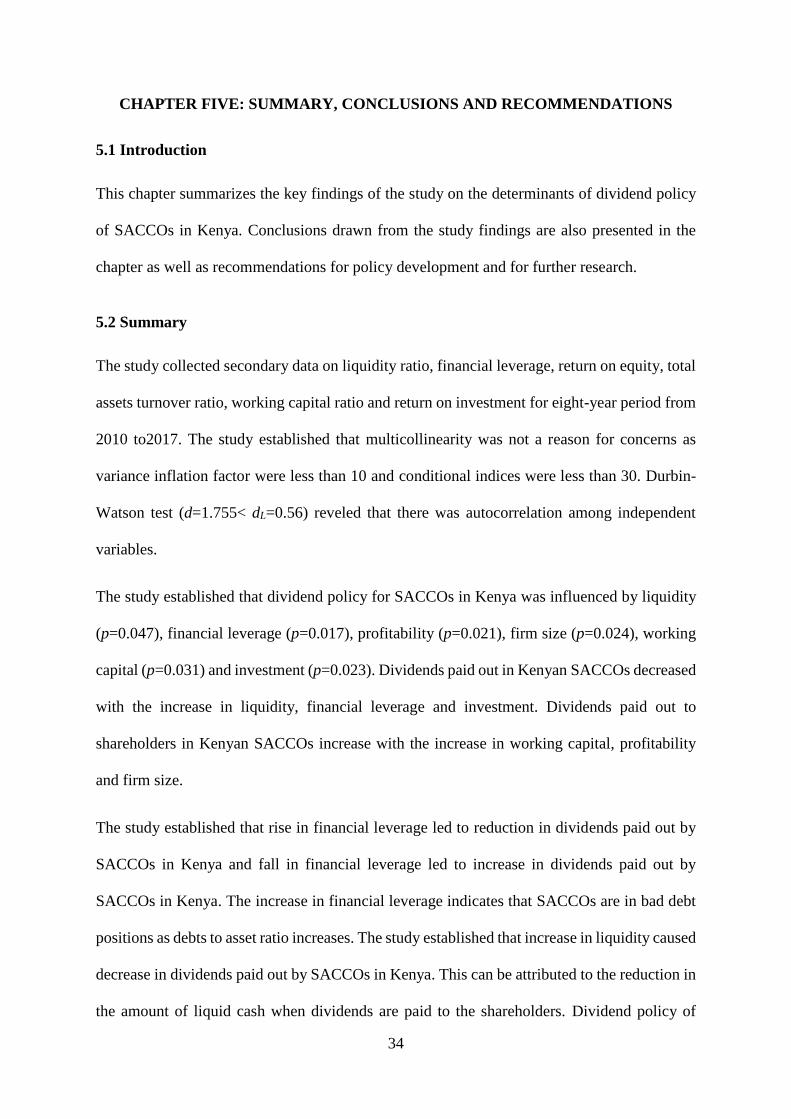
This chapter summarizes the key findings of the study on the determinants of dividend policy
of SACCOs in Kenya. Conclusions drawn from the study findings are also presented in the
chapter as well as recommendations for policy development and for further research.
5.2 Summary
The study collected secondary data on liquidity ratio, financial leverage, return on equity, total
assets turnover ratio, working capital ratio and return on investment for eight-year period from
2010 to2017. The study established that multicollinearity was not a reason for concerns as
variance inflation factor were less than 10 and conditional indices were less than 30. Durbin-
Watson test (d=1.755< dL=0.56) reveled that there was autocorrelation among independent
variables.
The study established that dividend policy for SACCOs in Kenya was influenced by liquidity
(p=0.047), financial leverage (p=0.017), profitability (p=0.021), firm size (p=0.024), working
capital (p=0.031) and investment (p=0.023). Dividends paid out in Kenyan SACCOs decreased
with the increase in liquidity, financial leverage and investment. Dividends paid out to
shareholders in Kenyan SACCOs increase with the increase in working capital, profitability
and firm size.
The study established that rise in financial leverage led to reduction in dividends paid out by
SACCOs in Kenya and fall in financial leverage led to increase in dividends paid out by
SACCOs in Kenya. The increase in financial leverage indicates that SACCOs are in bad debt
positions as debts to asset ratio increases. The study established that increase in liquidity caused
decrease in dividends paid out by SACCOs in Kenya. This can be attributed to the reduction in
the amount of liquid cash when dividends are paid to the shareholders. Dividend policy of
35
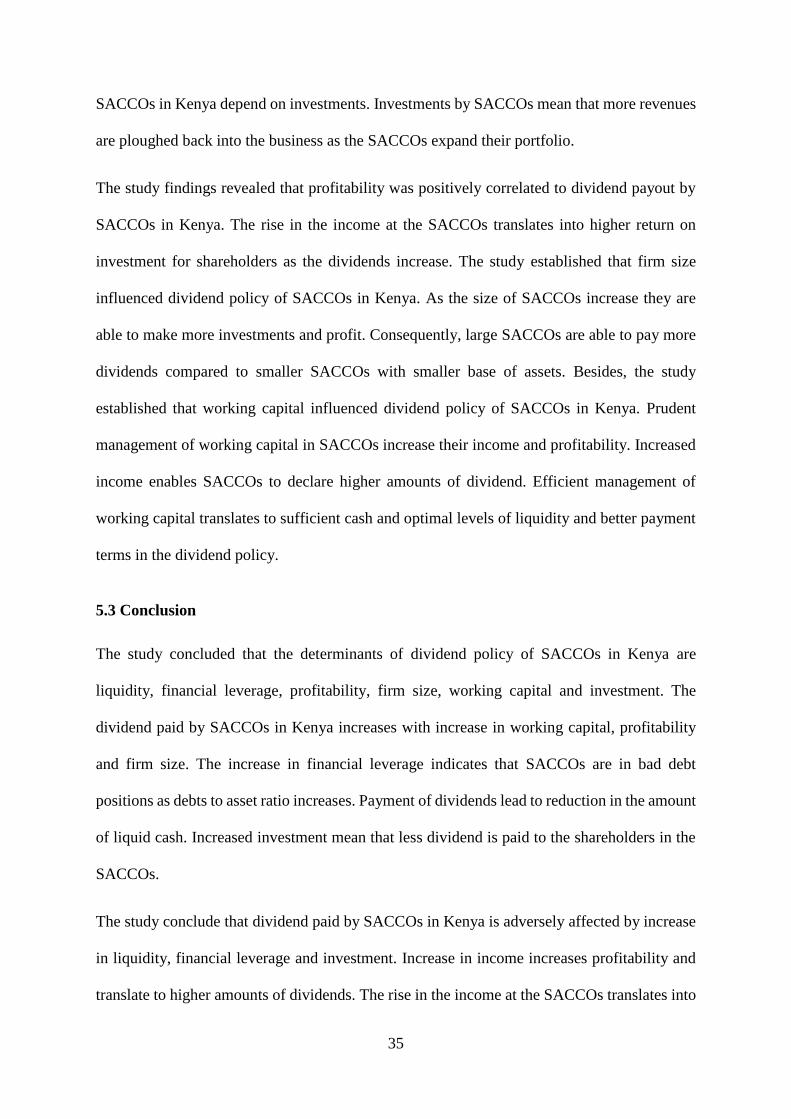
SACCOs in Kenya depend on investments. Investments by SACCOs mean that more revenues
are ploughed back into the business as the SACCOs expand their portfolio.
The study findings revealed that profitability was positively correlated to dividend payout by
SACCOs in Kenya. The rise in the income at the SACCOs translates into higher return on
investment for shareholders as the dividends increase. The study established that firm size
influenced dividend policy of SACCOs in Kenya. As the size of SACCOs increase they are
able to make more investments and profit. Consequently, large SACCOs are able to pay more
dividends compared to smaller SACCOs with smaller base of assets. Besides, the study
established that working capital influenced dividend policy of SACCOs in Kenya. Prudent
management of working capital in SACCOs increase their income and profitability. Increased
income enables SACCOs to declare higher amounts of dividend. Efficient management of
working capital translates to sufficient cash and optimal levels of liquidity and better payment
terms in the dividend policy.
5.3 Conclusion
The study concluded that the determinants of dividend policy of SACCOs in Kenya are
liquidity, financial leverage, profitability, firm size, working capital and investment. The
dividend paid by SACCOs in Kenya increases with increase in working capital, profitability
and firm size. The increase in financial leverage indicates that SACCOs are in bad debt
positions as debts to asset ratio increases. Payment of dividends lead to reduction in the amount
of liquid cash. Increased investment mean that less dividend is paid to the shareholders in the
SACCOs.
The study conclude that dividend paid by SACCOs in Kenya is adversely affected by increase
in liquidity, financial leverage and investment. Increase in income increases profitability and
translate to higher amounts of dividends. The rise in the income at the SACCOs translates into
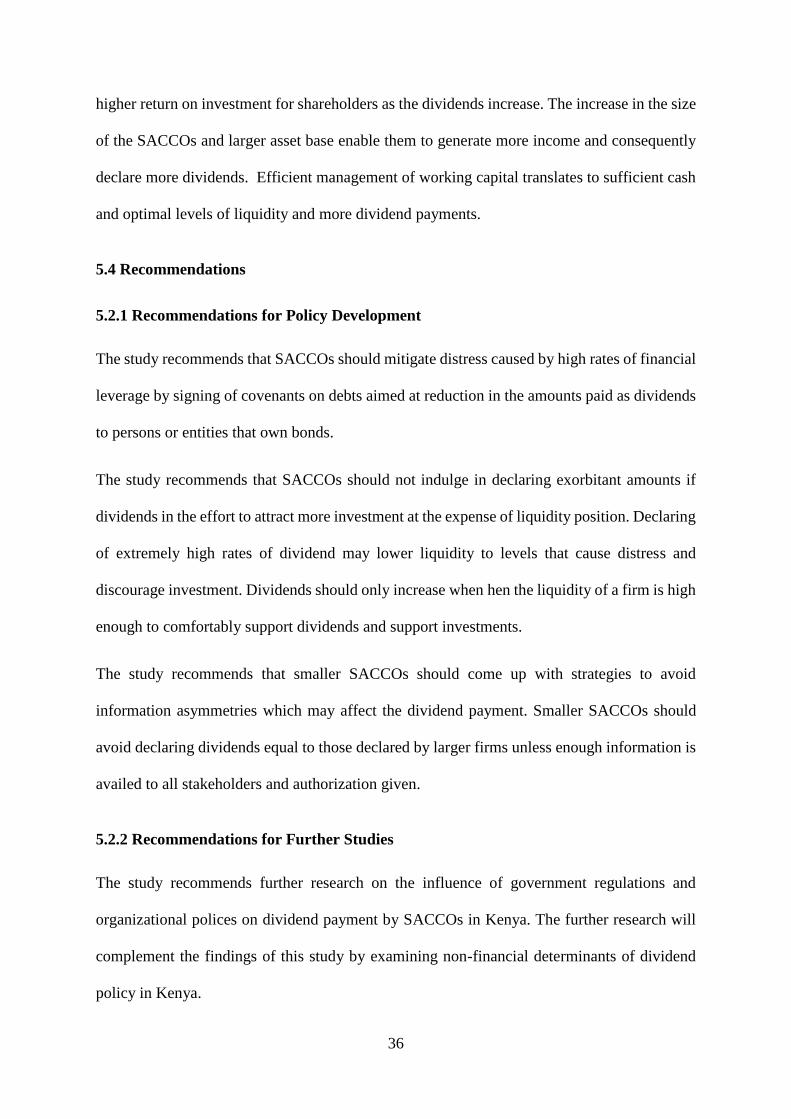
36
higher return on investment for shareholders as the dividends increase. The increase in the size
of the SACCOs and larger asset base enable them to generate more income and consequently
declare more dividends. Efficient management of working capital translates to sufficient cash
and optimal levels of liquidity and more dividend payments.
5.4 Recommendations
5.2.1 Recommendations for Policy Development
The study recommends that SACCOs should mitigate distress caused by high rates of financial
leverage by signing of covenants on debts aimed at reduction in the amounts paid as dividends
to persons or entities that own bonds.
The study recommends that SACCOs should not indulge in declaring exorbitant amounts if
dividends in the effort to attract more investment at the expense of liquidity position. Declaring
of extremely high rates of dividend may lower liquidity to levels that cause distress and
discourage investment. Dividends should only increase when hen the liquidity of a firm is high
enough to comfortably support dividends and support investments.
The study recommends that smaller SACCOs should come up with strategies to avoid
information asymmetries which may affect the dividend payment. Smaller SACCOs should
avoid declaring dividends equal to those declared by larger firms unless enough information is
availed to all stakeholders and authorization given.
5.2.2 Recommendations for Further Studies
The study recommends further research on the influence of government regulations and
organizational polices on dividend payment by SACCOs in Kenya. The further research will
complement the findings of this study by examining non-financial determinants of dividend
policy in Kenya.
37
REFERENCES
Abdi, M. A. (2010). Signaling effect of dividend payment on the profits of the Firm: evidence
from the Nairobi stock exchange. MBA Thesis, University of Nairobi.
Abor, J. & Bokpin, G. A. (2010). Investment opportunities, corporate finance, and dividend
payout policy: Evidence from emerging markets. Studies in Economics and Finance,
27 (3), 180 – 194.
Aivazian, V. and Booth, L. (2003). Do emerging market firms follow different dividend
policies from US firms? Journal of Financial Research, 26 (3), 371-87.
AL- Shubiri F. (2011). Determinants of Changes Dividend Behavior Policy: Evidence from the
Amman Stock Exchange. Amman Arab University Jordan College of Business,
Department of Finance and Banking Groppelli and Nikbakht.
Al-Kuwari, D. (2009). Determinants of the Dividend Payout Ratio of Companies Listed
on Emerging Stock Exchanges: The Case of the Gulf Cooperation Council (GCC)
Countries. Global Economy & Finance Journal Vol. 2 No. 2. Pp. 38-63.
Anupam. M. (2012). An Empirical Analysis of Determinants of Dividend Policy - Evidence
from the UAE Companies. Global Review of Accounting and Finance Vol. 3.No. 1. 18
– 31.
Baker, H. K. & Weigand, R. (2015). Corporate dividend policy revisited. Managerial Finance,
41 (2), 126 – 144.
Baker, H. (2009). Dividends and Dividend policy. Hoboken: John Wiley & Sons.
Baker, M. & Wurgler, J. (2004). A Catering Theory of Dividends. Journal of Corporate
Finance, Vol. 2. No. 2. 5-12.
Baker, M. & Wurgler, J. (2004). A Catering Theory of Dividends. Journal of Corporate Finance
Vol. 2. No. 2. 5-12.
Banerjee, B. (2008). Fundamentals of Financial Management. New Delhi: Prentice-Hall.
Bekaert G and Harvey C.R., (2003). Emerging markets finance. Journal of Empirical Finance,
10, 3-55.
Besley, S. & Brigham, E. (2008). Essentials of Managerial Finance. Manson: OH:
Thomson/South-Western.
Brealey, R., & Myers, S. (2005). Principles of Corporate Finance. London: McGraw-Hill, pp.
155–167.
Brigham, E. F., and Ehrhardt M.C. (2011). Financial Management Theory and Practice (13th
Edition) South Western Cengage Learning Graphic World, Inc.
38
Brockington, R. (1993). Financial Management (6th Edition) DP publishers.
Chay J. & Suh. J. (2008). Payout policy and cash-flow uncertainty. Journal of Financial
Economics 93:1, 88–107.
Cheruiyot, T. K., Kimeli, C. M., & Ogendo, S. M. (2012). Effect of Savings and Credit Co-
operative Societies Strategies on Member’s Savings Mobilization in Nairobi, Kenya.
International Journal of Business and Commerce, 1(11), 40-63. Retrieved October 6,
2014, from http://www.ijbcnet.com/1-11/IJBC-12-11103.pdf.
Deshmukh, S. (2005). The effect of Asymmetric Information on dividend policy. Quarterly
Journal of Business and Economics. 44 (1/2), 107-127.
Elmi, M. A. and Muturi, M. (2016). Effects of Profitability on Dividend Payout by Commercial
and Services Firms Listed In the Nairobi Securities Exchange. European Journal of
Business and Social Sciences, Vol. 5, No. 02, 160-167.
Fenn, G.W. and Liang, N. (2001). Corporate payout policy and managerial stock incentives.
Journal of Financial Economics, 60, 45-72.
Glen, J. and Singh A., (2004). Comparing capital structures and rates of return in developed
and Emerging markets. Emerging Markets Review 5, 161-192.
James (2009). Financial Management & Policy (12th Edition). Pearson Education Publishers,
p 328-331.
John, F.S., &Muthusamy, K., (2010). Leverage, Growth and Profitability as Determinants of
Dividend Payout Ratio-Evidence from Indian Paper Industry. Asian J. Business
Manage. Studies 1 (1): 26-30.
Kadagi, N. M., Ahmed, A. H., & Wafula, M. K. (2015). Role Played By Saccos in Financial
Intermediation in the Improvement of the Welfare of Members, a Case Study of
Fundilima Sacco. International Journal of Scientific and Research Publications, 5(6),
1-13.
Khaled, H., Chijoke, O. M., & Aruoriwo, M. C. (2011). Dividend policy and share price
volatility: UK evidence. Journal of risk finance, 12 (1), 57 – 68.
Kioko, M. (2006). The relationship between dividend changes and future profitability of the
companies quoted at the NSE. Unpublished MBA project. University of Nairobi.
Kioko, M. (2011). The relationship between prior dividends and financial performance of firms
listed at NSE. Unpublished MBA project. University of Nairobi.
Kirungumi, J. M. (2003). A Comparative Analysis of the Dividend Decisions of KBL and BAT
(K) ltd. Unpublished MBA Project KU.
39
Kisaka, S. E., Kitur, H. K., and Mbithi, A. (2015). The Relationship between Profits and
Dividend Payout of Commercial Banks in Kenya. Research Journal of Finance and
Accounting, Vol.6, No.10, 173-185.
Lasher, R.W. (2008). Financial Management a Practical Approach (5th Edition). Thomson
South Western Cengage Learning Graphic World, Inc.
Lease, R.C., Kose, J., Kalay, A., Loewenstein, U., Sarig, O.H., (2000). Dividend Policy: Its
Impact on Firm Value, New York: Harvard Business School Press.
Lin C.T., (2002). Dividend Policies, Legal Regimes and Institutional Structures in the Asia
Pacific Region, School of Finance and Business Economics Working Paper Series,
Working Paper 02.04
Litzenberger, R. H. & Ramaswamy K. (1979). The Effect of Personal Taxes and Dividends on
Capital Asset Prices, Journal of Financial Economics 7, 163-95.
Martin, K. (2008). The Effect of Dividend changes on share prices. The case of banks quoted
in the Nairobi Stock Exchange. MBA Thesis, University of Nairobi.
Mathur. J (1979). Introduction to Financial Management. Mc Millan Publishing Company Inc.
New York.
Mbuki, C. (2010). Factors that determine dividend payout ratio among SACCOs. Unpublished
MBA project UoN.
Mitton T., (2004). Corporate governance and dividend policy in emerging markets. Emerging
Markets Review, 5, 40-426.
Modigliani, F. & Miller, M. (1961). Dividend Policy, Growth, and the Valuation of Shares.
The Journal of Business, 34(4), 411-428.
Montgomery, D. C., Peck, E. A. and Vining, G. G. (2001). Introduction to Linear Regression
Analysis. 3rd Edition, New York, New York: John Wiley & Sons.
Mugenda, O. M. & Mugenda, A. G. (2003). Research Methods: Quantitative and Qualitative
Approaches, Acts Press, Nairobi-Kenya.
Mwihaki, L. (2013). Determinants of dividend policy: Commercial Banks listed at the Nairobi
Securities Exchange. MBA Thesis, University of Nairobi.
Nash, R., Netter, J. M., and Poulson, A. B. (2003). Determinants of Contractual Relations
between Shareholders and Bondholders: Investment Opportunities and Restrictive
Covenants. Journal of Corporate Finance, 9, 201-232.
Neupane, R. P., Shaarma, K. R., & Thapa, G. B. (2002). Adoption of agroforestry in the hills
of Nepal: A logistic regression analysis. Agricultural Systems, 72:177-196.
40
Ngobe, D. K., Simiyu, A. K., & Limo, P. K. (2013). Dividend policy and share price volatility
in Kenya. Research journal of finance and accounting, 4 (6), 115-120.
Ngunjiri, M. (2010). The relationship between Dividend payment policies and stock price
volatility for companies quoted at NSE. Unpublished MBA project, University of
Nairobi, Kenya.
Njiru, A. L. (2003). Determinants of Dividend Payment by SACCO’S in Nairobi; Unpublished
MBA Research Project. Nairobi: University of Nairobi.
Njuguna, I. M. (2006). “Determinants of Dividends Payout: The case of Listed Companies in
Kenya”. Unpublished MBA Research Project. Nairobi: University of Nairobi.
Odawo, C., and Ntoiti J. (2015). Determinants of Dividend Payout Policy in Public Ltd Banks
in Kenya: A Case Study of CFC Stanbic Bank, Strategic Journal of Business and
Change Management, Vol. 2 (54), pp 182-191.
Okpara, G. C. (2010). Diagnosis of the Determinants of Dividend Pay-Out Policy in
Nigeria: Factor of Analytical Approach. American Journal of Scientific Research
ISSN 1450-223X, Issue 8; PP 57-67.
Olang, M. A., and Akenga, M. G. (2017). Effect of Working Capital on the Dividend Pay-Out
by Firms Listed at the Nairobi Securities Exchange, Kenya. International Journal of
Finance and Banking Research, 3(2): 23-33
Pandey I.M., (2001). Corporate dividend policy and behavior: The Malaysian experience. India
Working paper no. 2001-11-01.
Pandey, I. (2010). Financial Management. New Delhi: Vikas Publishing House.
Pandey, I. M. (2011). Financial management (10th ed). New Delhi: Vikas Publishing House
Pvt Ltd.
Pandey, I.M. (1999). Financial Management. Delhi Limited India: Vikas Publishing House.
Pandy I. M. (2006). Financial Management 9th Edition, Vikas Publishing House PVT ltd New
Delphi.
Pettit, R. R. (1977). Taxes, Transactions Costs and the Clientele Effect of Dividends, Journal
of Financial Economics 5, 419-436.
Ross, R. (1977). A Critique of the Asset Price Theory’s Test: Part I: on Past and Potential
Testability of Theory, Journal of Financial Economics, 4, 129-176.
Ross, S. A., Westerfield, R. W. & Jordan, B. D. (2011). Fundamentals of Corporate Finance
(7th ed.). Irwin: Mc-Graw Hill.
Sarig, O. (2004). A Time-Series Analysis of Corporate Payout Policies. Review of Finance 9,
1-22.
41
Scott, D. L. (2003). An A to Z Guide to Investment Terms for Today's Investor. Journal of
Financial Economics, 12,230-250.
Sekaran, U. & Bougie, R. (2011). Research Methods for Business: A Skill Building Approach.
5th Edition. Aggarwal printing press, Delhi, ISBN: 978-81-265-3131-8
Shisia, A., Sang, M., Sirma, K., and Maundu, C. Z. (2014). Assessment of Dividend Policy on
Financial Performance of Telecommunication Companies Quoted at the Nairobi
Securities Exchange. International Journal of Economics, Commerce and Management,
Vol. II, Issue 10, 9-10.
Tongco, D. C. (2007). Purposive Sampling as a Tool for Informant Selection, Ethnobotany
Research & Applications 5:147-158.
Wambua, V. M., Rotich, G., and Anyango, W. (2016). Effect of Dividend Pay Out On the
Liquidity of Licensed Non- Deposit Taking SACCOs in Nairobi County. The Strategic
Journal of Business & Change Management, 3 (4), 1259-1274.
Zeng, T., (2003). What determines dividend policy? A comprehensive test. Journal of
American Academy of Business, 2 (2), 304-30.
Zuriawati, Z., Joriah, M., & Abdul, H. (2012). The impact of dividend policy on share price
volatility: Malaysian construction and material companies. Journal of economics
and management sciences, 5 (2), 01-08.
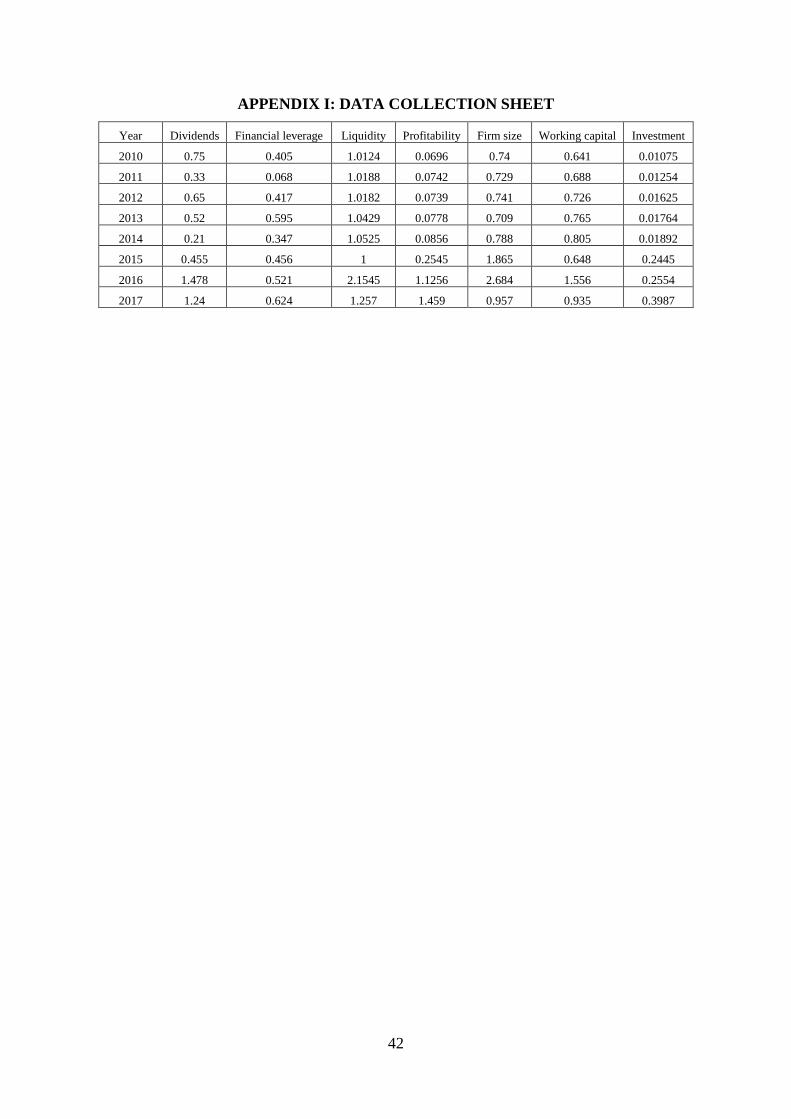
42
APPENDIX I: DATA COLLECTION SHEET
Year Dividends Financial leverage Liquidity Profitability Firm size Working capital Investment
2010 0.75 0.405 1.0124 0.0696 0.74 0.641 0.01075
2011 0.33 0.068 1.0188 0.0742 0.729 0.688 0.01254
2012 0.65 0.417 1.0182 0.0739 0.741 0.726 0.01625
2013 0.52 0.595 1.0429 0.0778 0.709 0.765 0.01764
2014 0.21 0.347 1.0525 0.0856 0.788 0.805 0.01892
2015 0.455 0.456 1 0.2545 1.865 0.648 0.2445
2016 1.478 0.521 2.1545 1.1256 2.684 1.556 0.2554
2017 1.24 0.624 1.257 1.459 0.957 0.935 0.3987
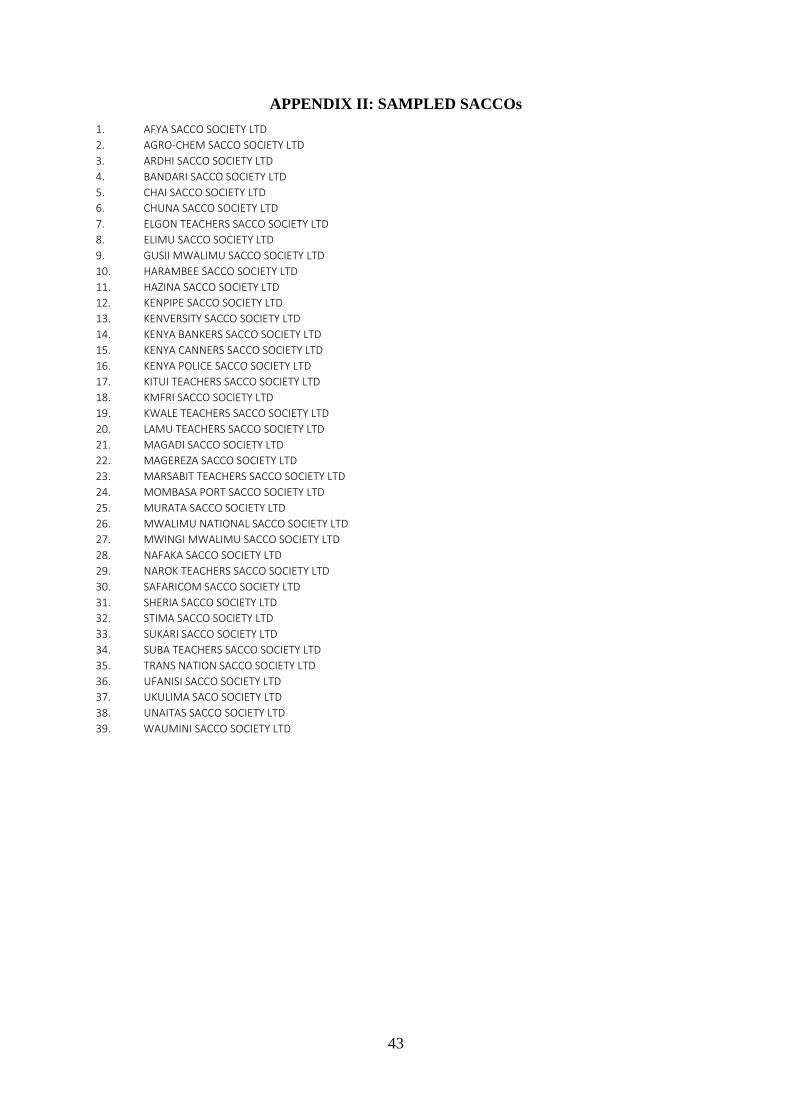
43
APPENDIX II: SAMPLED SACCOs
1. AFYA SACCO SOCIETY LTD
2. AGRO-CHEM SACCO SOCIETY LTD
3. ARDHI SACCO SOCIETY LTD
4. BANDARI SACCO SOCIETY LTD
5. CHAI SACCO SOCIETY LTD
6. CHUNA SACCO SOCIETY LTD
7. ELGON TEACHERS SACCO SOCIETY LTD
8. ELIMU SACCO SOCIETY LTD
9. GUSII MWALIMU SACCO SOCIETY LTD
10. HARAMBEE SACCO SOCIETY LTD
11. HAZINA SACCO SOCIETY LTD
12. KENPIPE SACCO SOCIETY LTD
13. KENVERSITY SACCO SOCIETY LTD
14. KENYA BANKERS SACCO SOCIETY LTD
15. KENYA CANNERS SACCO SOCIETY LTD
16. KENYA POLICE SACCO SOCIETY LTD
17. KITUI TEACHERS SACCO SOCIETY LTD
18. KMFRI SACCO SOCIETY LTD
19. KWALE TEACHERS SACCO SOCIETY LTD
20. LAMU TEACHERS SACCO SOCIETY LTD
21. MAGADI SACCO SOCIETY LTD
22. MAGEREZA SACCO SOCIETY LTD
23. MARSABIT TEACHERS SACCO SOCIETY LTD
24. MOMBASA PORT SACCO SOCIETY LTD
25. MURATA SACCO SOCIETY LTD
26. MWALIMU NATIONAL SACCO SOCIETY LTD
27. MWINGI MWALIMU SACCO SOCIETY LTD
28. NAFAKA SACCO SOCIETY LTD
29. NAROK TEACHERS SACCO SOCIETY LTD
30. SAFARICOM SACCO SOCIETY LTD
31. SHERIA SACCO SOCIETY LTD
32. STIMA SACCO SOCIETY LTD
33. SUKARI SACCO SOCIETY LTD
34. SUBA TEACHERS SACCO SOCIETY LTD
35. TRANS NATION SACCO SOCIETY LTD
36. UFANISI SACCO SOCIETY LTD
37. UKULIMA SACO SOCIETY LTD
38. UNAITAS SACCO SOCIETY LTD
39. WAUMINI SACCO SOCIETY LTD
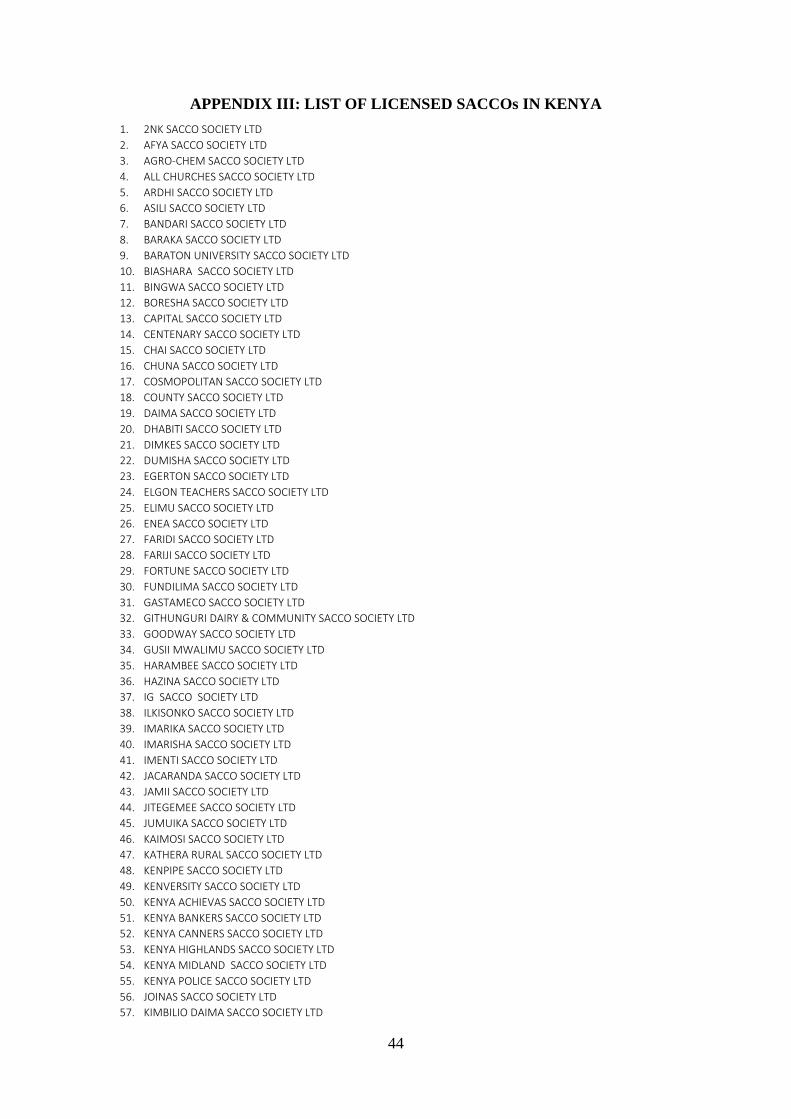
44
APPENDIX III: LIST OF LICENSED SACCOs IN KENYA
1. 2NK SACCO SOCIETY LTD
2. AFYA SACCO SOCIETY LTD
3. AGRO-CHEM SACCO SOCIETY LTD
4. ALL CHURCHES SACCO SOCIETY LTD
5. ARDHI SACCO SOCIETY LTD
6. ASILI SACCO SOCIETY LTD
7. BANDARI SACCO SOCIETY LTD
8. BARAKA SACCO SOCIETY LTD
9. BARATON UNIVERSITY SACCO SOCIETY LTD
10. BIASHARA SACCO SOCIETY LTD
11. BINGWA SACCO SOCIETY LTD
12. BORESHA SACCO SOCIETY LTD
13. CAPITAL SACCO SOCIETY LTD
14. CENTENARY SACCO SOCIETY LTD
15. CHAI SACCO SOCIETY LTD
16. CHUNA SACCO SOCIETY LTD
17. COSMOPOLITAN SACCO SOCIETY LTD
18. COUNTY SACCO SOCIETY LTD
19. DAIMA SACCO SOCIETY LTD
20. DHABITI SACCO SOCIETY LTD
21. DIMKES SACCO SOCIETY LTD
22. DUMISHA SACCO SOCIETY LTD
23. EGERTON SACCO SOCIETY LTD
24. ELGON TEACHERS SACCO SOCIETY LTD
25. ELIMU SACCO SOCIETY LTD
26. ENEA SACCO SOCIETY LTD
27. FARIDI SACCO SOCIETY LTD
28. FARIJI SACCO SOCIETY LTD
29. FORTUNE SACCO SOCIETY LTD
30. FUNDILIMA SACCO SOCIETY LTD
31. GASTAMECO SACCO SOCIETY LTD
32. GITHUNGURI DAIRY & COMMUNITY SACCO SOCIETY LTD
33. GOODWAY SACCO SOCIETY LTD
34. GUSII MWALIMU SACCO SOCIETY LTD
35. HARAMBEE SACCO SOCIETY LTD
36. HAZINA SACCO SOCIETY LTD
37. IG SACCO SOCIETY LTD
38. ILKISONKO SACCO SOCIETY LTD
39. IMARIKA SACCO SOCIETY LTD
40. IMARISHA SACCO SOCIETY LTD
41. IMENTI SACCO SOCIETY LTD
42. JACARANDA SACCO SOCIETY LTD
43. JAMII SACCO SOCIETY LTD
44. JITEGEMEE SACCO SOCIETY LTD
45. JUMUIKA SACCO SOCIETY LTD
46. KAIMOSI SACCO SOCIETY LTD
47. KATHERA RURAL SACCO SOCIETY LTD
48. KENPIPE SACCO SOCIETY LTD
49. KENVERSITY SACCO SOCIETY LTD
50. KENYA ACHIEVAS SACCO SOCIETY LTD
51. KENYA BANKERS SACCO SOCIETY LTD
52. KENYA CANNERS SACCO SOCIETY LTD
53. KENYA HIGHLANDS SACCO SOCIETY LTD
54. KENYA MIDLAND SACCO SOCIETY LTD
55. KENYA POLICE SACCO SOCIETY LTD
56. JOINAS SACCO SOCIETY LTD
57. KIMBILIO DAIMA SACCO SOCIETY LTD
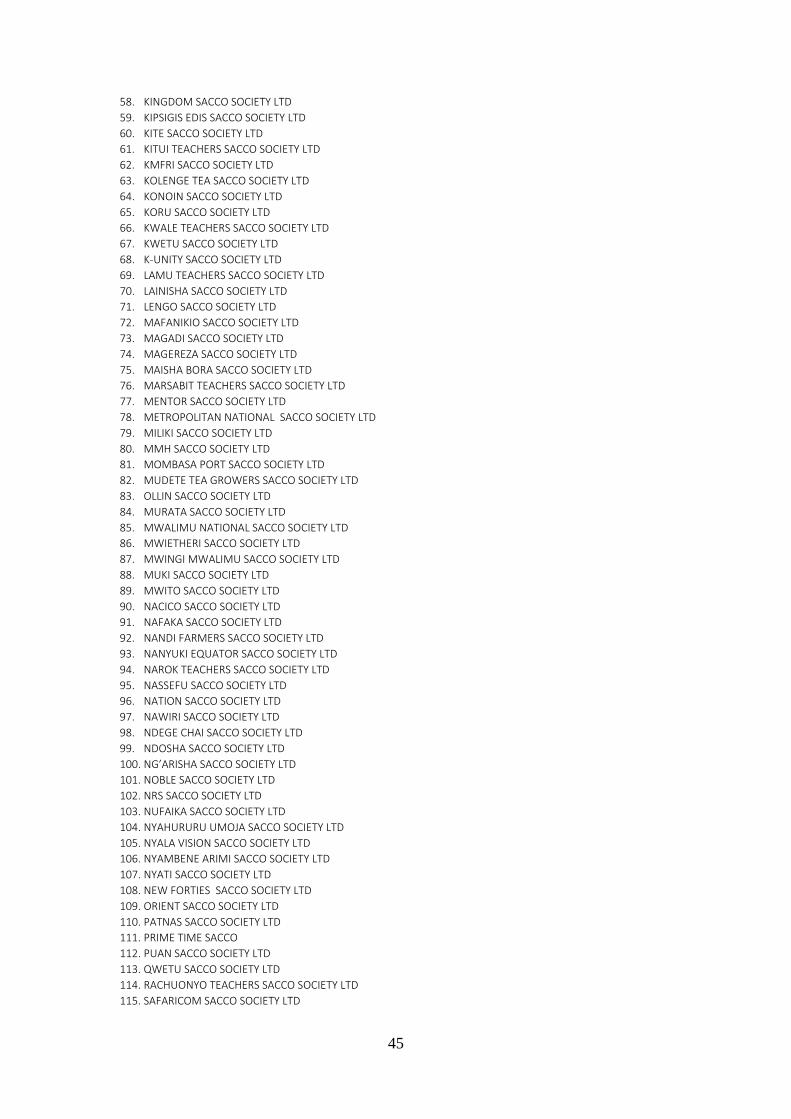
45
58. KINGDOM SACCO SOCIETY LTD
59. KIPSIGIS EDIS SACCO SOCIETY LTD
60. KITE SACCO SOCIETY LTD
61. KITUI TEACHERS SACCO SOCIETY LTD
62. KMFRI SACCO SOCIETY LTD
63. KOLENGE TEA SACCO SOCIETY LTD
64. KONOIN SACCO SOCIETY LTD
65. KORU SACCO SOCIETY LTD
66. KWALE TEACHERS SACCO SOCIETY LTD
67. KWETU SACCO SOCIETY LTD
68. K-UNITY SACCO SOCIETY LTD
69. LAMU TEACHERS SACCO SOCIETY LTD
70. LAINISHA SACCO SOCIETY LTD
71. LENGO SACCO SOCIETY LTD
72. MAFANIKIO SACCO SOCIETY LTD
73. MAGADI SACCO SOCIETY LTD
74. MAGEREZA SACCO SOCIETY LTD
75. MAISHA BORA SACCO SOCIETY LTD
76. MARSABIT TEACHERS SACCO SOCIETY LTD
77. MENTOR SACCO SOCIETY LTD
78. METROPOLITAN NATIONAL SACCO SOCIETY LTD
79. MILIKI SACCO SOCIETY LTD
80. MMH SACCO SOCIETY LTD
81. MOMBASA PORT SACCO SOCIETY LTD
82. MUDETE TEA GROWERS SACCO SOCIETY LTD
83. OLLIN SACCO SOCIETY LTD
84. MURATA SACCO SOCIETY LTD
85. MWALIMU NATIONAL SACCO SOCIETY LTD
86. MWIETHERI SACCO SOCIETY LTD
87. MWINGI MWALIMU SACCO SOCIETY LTD
88. MUKI SACCO SOCIETY LTD
89. MWITO SACCO SOCIETY LTD
90. NACICO SACCO SOCIETY LTD
91. NAFAKA SACCO SOCIETY LTD
92. NANDI FARMERS SACCO SOCIETY LTD
93. NANYUKI EQUATOR SACCO SOCIETY LTD
94. NAROK TEACHERS SACCO SOCIETY LTD
95. NASSEFU SACCO SOCIETY LTD
96. NATION SACCO SOCIETY LTD
97. NAWIRI SACCO SOCIETY LTD
98. NDEGE CHAI SACCO SOCIETY LTD
99. NDOSHA SACCO SOCIETY LTD
100. NG’ARISHA SACCO SOCIETY LTD
101. NOBLE SACCO SOCIETY LTD
102. NRS SACCO SOCIETY LTD
103. NUFAIKA SACCO SOCIETY LTD
104. NYAHURURU UMOJA SACCO SOCIETY LTD
105. NYALA VISION SACCO SOCIETY LTD
106. NYAMBENE ARIMI SACCO SOCIETY LTD
107. NYATI SACCO SOCIETY LTD
108. NEW FORTIES SACCO SOCIETY LTD
109. ORIENT SACCO SOCIETY LTD
110. PATNAS SACCO SOCIETY LTD
111. PRIME TIME SACCO
112. PUAN SACCO SOCIETY LTD
113. QWETU SACCO SOCIETY LTD
114. RACHUONYO TEACHERS SACCO SOCIETY LTD
115. SAFARICOM SACCO SOCIETY LTD
46
116. SHERIA SACCO SOCIETY LTD
117. SHIRIKA SACCO SOCIETY LTD
118. SIMBA CHAI SACCO SOCIETY LTD
119. SIRAJI SACCO SOCIETY LTD
120. SKYLINE SACCO SOCIETY LTD
121. SMART CHAMPIONS SACCO SOCIETY LTD
122. SMART LIFE SACCO SOCIETY LTD
123. SOLUTION SACCO SOCIETY LTD
124. SOTICO SACCO SOCIETY LTD
125. SOUTHERN STAR SACCO SOCIETY LTD
126. SHOPPERS SACCO SOCIETY LTD
127. STAKE KENYA SACCO SOCIETY LTD
128. STIMA SACCO SOCIETY LTD
129. SUKARI SACCO SOCIETY LTD
130. SUBA TEACHERS SACCO SOCIETY LTD
131. SUPA SACCO SOCIETY LTD
132. TAI SACCO SOCIETY LTD
133. TAIFA SACCO SOCIETY LTD
134. TARAJI SACCO SOCIETY LTD
135. TEMBO SACCO SOCIETY LTD
136. TENHOS SACCO SOCIETY LTD
137. THAMANI SACCO SOCIETY LTD
138. TRANSCOUNTIES SACCO SOCIETY LTD
139. TRANS NATION SACCO SOCIETY LTD
140. TIMES U SACCO SOCIETY LTD
141. TOWER SACCO SOCIETY LTD
142. TRANS- ELITE COUNTY SACCO SOCIETY LTD
143. UFANISI SACCO SOCIETY LTD
144. UCHONGAJI SACCO SOCIETY LTD
145. UKRISTO NA UFANISI WA ANGALICANA SACCO SOCIETY LTD
146. UKULIMA SACO SOCIETY LTD
147. UNAITAS SACCO SOCIETY LTD
148. UNI-COUNTY SACCO SOCIETY LTD
149. UNITED NATIONS SACCO SOCIETY LTD
150. UNISON SACCO SOCIETY LTD
151. UNIVERSAL TRADERS SACCO SOCIETY LTD
152. VIHIGA COUNTY FARMERS SACCO SOCIETY LTD
153. VISION POINT SACCO SOCIETY LTD
154. VISION AFRICA SACCO SOCIETY LTD
155. WAKENYA PAMOJA SACCO SOCIETY LTD
156. WAKULIMA COMMERCIAL SACCO SOCIETY LTD
157. WANAANGA SACCO SOCIETY LTD
158. WANANCHI SACCO SOCIETY LTD
159. WANANDEGE SACCO SOCIETY LTD
160. WASHA SACCO SOCIETY LTD
161. WAUMINI SACCO SOCIETY LTD
162. WEVARSITY SACCO SOCIETY LTD
163. WINAS SACCO SOCIETY LTD
164. YETU SACCO SOCIETY LTD
Source: Sacco Societies Regulatory Authority. Available at:
https://www.sasra.go.ke/index.php/news-updates/speeches/87-list-of-sacco-societies-
licensed-to-undertake-deposit-taking-sacco-business-in-kenya-for-the-financial-year-ending-
december-2016#.WbyxGvMjHcs. Retrieved on 11th September, 2017.