detection of anthropogenic dust using calipso lidar ... · atmos. chem. phys., 15, 11653–11665,...
TRANSCRIPT

Atmos. Chem. Phys., 15, 11653–11665, 2015
www.atmos-chem-phys.net/15/11653/2015/
doi:10.5194/acp-15-11653-2015
© Author(s) 2015. CC Attribution 3.0 License.
Detection of anthropogenic dust using CALIPSO lidar
measurements
J. P. Huang1, J. J. Liu1,2, B. Chen1, and S. L. Nasiri3
1Key Laboratory for Semi-Arid Climate Change of the Ministry of Education, College of Atmospheric Sciences,
Lanzhou University, Lanzhou, 730000, China2School of Mechanical and Instrument Engineering, Xi’an University of Technology, Xi’an 710048, China3Department of Atmospheric Science, Texas A&M University, College Station, Texas, USA
Correspondence to: J. P. Huang ([email protected])
Received: 5 March 2015 – Published in Atmos. Chem. Phys. Discuss.: 7 April 2015
Revised: 21 September 2015 – Accepted: 22 September 2015 – Published: 21 October 2015
Abstract. Anthropogenic dusts are those produced by hu-
man activities on disturbed soils, which are mainly cropland,
pastureland, and urbanized regions, and are a subset of the
total dust load which includes natural sources from desert
regions. Our knowledge of anthropogenic dusts is still very
limited due to a lack of data. To understand the contribution
of anthropogenic dust to the total global dust load, it is impor-
tant to identify it apart from total dust. In this study, a new
technique for distinguishing anthropogenic dust from natu-
ral dust is proposed by using Cloud-Aerosol Lidar and In-
frared Pathfinder Satellite Observation (CALIPSO) dust and
planetary boundary layer (PBL) height retrievals along with a
land use data set. Using this technique, the global distribution
of dust is analyzed and the relative contribution of anthro-
pogenic and natural dust sources to regional and global emis-
sions are estimated. Results reveal that local anthropogenic
dust aerosol due to human activity, such as agriculture, indus-
trial activity, transportation, and overgrazing, accounts for
about 25 % of the global continental dust load. Of these an-
thropogenic dust aerosols, more than 53 % come from semi-
arid and semi-wet regions. Annual mean anthropogenic dust
column burden (DCB) values range from 0.42 g m−2, with a
maximum in India, to 0.12 g m−2, with a minimum in North
America. A better understanding of anthropogenic dust emis-
sion will enable us to focus on human activities in these crit-
ical regions and with such knowledge we will be more able
to improve global dust models and to explore the effects of
anthropogenic emission on radiative forcing, climate change,
and air quality in the future.
1 Introduction
Dust accounts for some of the highest mass loadings in the
atmosphere and plays an important role in modulating ra-
diative forcing and climate via a number of complex pro-
cesses (Huang et al., 2006a, b, 2014; Su et al., 2008). Al-
though mineral dust is widely distributed and has a relatively
large optical depth, the existing atmospheric dust load can-
not be explained by natural sources alone (Tegen and Fung,
1995). The atmospheric dust load that originates from soils
disturbed by human activities such as land use practices,
which can be interpreted as “anthropogenic” dust (Tegen and
Fung, 1995), can increase dust loading, which, in turn, affects
the radiative forcing. It is critical to quantify the relative im-
portance of different dust sources and the factors that affect
dust emissions to understand the global dust cycle, including
historical and future changes in dust emissions, as noted by
Okin et al. (2011) and Bullard et al. (2011).
Anthropogenic dust primarily originates from agricultural
practices (harvesting, ploughing, and overgrazing), changes
in surface water (e.g., shrinking of the Caspian and Aral seas
and Owens Lake), and urban and industrial practices (e.g.,
construction, cement production, and transportation) (Pros-
pero et al., 2002). Over the last few decades, more frequent
warmer and drier winters and springs in semi-arid and semi-
wet regions (Huang et al., 2012), as well as changes in veg-
etated land cover due to human activities, have likely in-
creased anthropogenic dust emissions (Mahowald and Luo,
2003; Moulin and Chiapello, 2004; Tegen et al., 2004).
Mulitza et al. (2010) demonstrated that the development of
agriculture in the Sahel corresponded to a large increase in
Published by Copernicus Publications on behalf of the European Geosciences Union.

11654 J. P. Huang et al.: Detection of anthropogenic dust using CALIPSO lidar measurements
dust emission and deposition in the region. The current con-
sensus is that up to half of the modern atmospheric dust load
originates from anthropogenically disturbed soils (Tegen et
al., 2004). Sokolik and Toon (1996) revealed that the direct
solar radiative forcing from anthropogenic dust is very un-
certain; thus, forcing from anthropogenically generated dust
aerosols may be comparable to forcings from other anthro-
pogenic aerosols. Therefore, a clear understanding of anthro-
pogenic dust emissions is critical for predicting how changes
in land use (and thus changes in land use policies) will in-
fluence dust emissions, loading, and deposition in the future
(Okin et al., 2011).
However, assessments of the role of anthropogenic activ-
ity in the atmospheric dust cycle are limited by the accuracy
of the available data sets (Mahowald et al., 2002). There are
large uncertainties regarding the impact of anthropogenic ac-
tivities on dust emissions (Sokolik and Toon, 1996). Under-
standing the radiative forcing caused by dust both directly
(e.g., by disturbing soils, removing vegetation cover, or dry-
ing water bodies), and indirectly (e.g., by changing the cli-
mate or hydrological cycle) requires an improved data set.
Although there are many examples of humans altering their
environment and thereby causing an additional dust burden,
it is challenging to separately quantify the natural and an-
thropogenic components of mineral aerosols (Sagan et al.,
1979). Sokolik and Toon (1996) made the rough assumption
that the dust production rate is linearly proportional to the
dust source area and estimated the amount of anthropogenic
mineral aerosols through assessment of the land area con-
verted to desert by human activities. Tegen and Fung (1995)
estimated the anthropogenic contribution to mineral dust to
be 30 to 50 % of the total dust burden in the atmosphere by
using a three-dimensional atmospheric dust transport model.
Later, Tegen et al. (2004) provided an updated estimate by
comparing observations of visibility; they suggested that
only 5 to 7 % of mineral dust is derived from anthropogenic
sources by calibrating a dust source model with emission
indices from dust storm observations. There is limited un-
derstanding of anthropogenic dust emissions because of the
difficulty of identifying and measuring them, which derives
from strong heterogeneities in the sources (Mahowald et al.,
2002). Ginoux et al. (2012) conducted one of the first studies
that estimated anthropogenic dust emissions using observa-
tions. They estimated that 25 % of dust is anthropogenic by
using the Moderate-Resolution Imaging Spectroradiometer
(MODIS) Deep Blue satellite products in combination with
a land use fraction data set. A limitation of these products is
that they can be retrieved only over surfaces that are bright
at visible wavelengths, excluding forests and ocean surfaces.
Additionally, MODIS products do not include vertical distri-
bution information and therefore cannot readily exclude nat-
ural dust aerosols from deserts or marine sea salt aerosols
that are transported over anthropogenic sources.
The Cloud-Aerosol Lidar and Infrared Pathfinder Satel-
lite Observations (CALIPSO) satellite can actively remotely
sense cloud and aerosol vertical profiles (Winker et al., 2007;
Hu et al., 2007a, b, 2009; Chen et al., 2010). CALIPSO’s
measurement of vertical resolution and polarization ratios
can provide new insights into global anthropogenic dust
emissions. In this study, we develop a new technique for de-
tection of anthropogenic dust emissions that uses CALIPSO
lidar measurements and analyzes their global distribution.
Section 2 presents the data used in this study, and the method
for separating anthropogenic from natural dust is outlined in
Sect. 3. Section 4 discusses the calculation of the anthro-
pogenic dust column burden (DCB). Section 5 presents the
global distribution of anthropogenic dust. Finally, the con-
clusions are presented in Sect. 6.
2 Data
2.1 CALIPSO data
This study relies on the CALIPSO Cloud-Aerosol Lidar
with Orthogonal Polarization (CALIOP) for dust detection.
CALIOP acquires vertical profiles of elastic backscatter at
two wavelengths (532 and 1064 nm) and linear depolariza-
tion at 532 nm from a near-nadir viewing geometry dur-
ing both the day and the night (Winker et al., 2007; Hu
et al., 2007a, b, 2009; Chen et al., 2010). This study uses
Level 1 backscatter, depolarization ratio, and color ratio pro-
files along with the Level 2 Vertical Feature Mask (VFM)
products and 5 km Aerosol Profile Products. The depolariza-
tion ratio is a useful indicator for identifying non-spherical
particles, and it can distinguish between atmospheric dust
and spherical aerosols (Liu et al., 2004; Sun et al., 2013).
The CALIPSO algorithm classifies aerosol layers that have
volume depolarization ratio (δv) greater than 0.075 as dust
(Omar et al., 2009; Mielonen et al., 2009). Mielonen et
al. (2009) also confirmed that classification of dust is more
reliable than classification of fine aerosols because depolar-
ization ratio can be used to distinguish non-spherical aerosols
from spherical ones, while the color ratio is sensitive mainly
to particle size.
The CALIPSO Level 2 lidar VFM product (Liu et al.,
2004; Vaughan et al., 2004) provides information about cloud
and aerosol layer boundaries and positions. In CALIPSO ver-
sion 3 VFM data, the cloud aerosol discrimination (CAD)
algorithm separates clouds and aerosols based on multi-
dimensional histograms of scattering properties (e.g., in-
tensity and spectral dependence), that is, the altitude- and
latitude-dependent feature integrated color ratio, χ ′, the
layer-integrated volume depolarization ratio, δv, and the fea-
ture mean attenuated backscatter coefficient, β ′532 (Liu et al.,
2010). A parameter (CAD score) indicates the confidence at
which a feature (aerosol or cloud) can be distinguished using
the CAD algorithm. Liu et al. (2010) revealed that the feature
classification is more reasonable if a higher magnitude of the
absolute value of CAD score is used and suggested applying
Atmos. Chem. Phys., 15, 11653–11665, 2015 www.atmos-chem-phys.net/15/11653/2015/
J. P. Huang et al.: Detection of anthropogenic dust using CALIPSO lidar measurements 11655
a CAD score larger than 70. In our study, we selected a fea-
tures where the |CAD| ≥ 70 as well.
The Level 2 Aerosol Profile Product (Young and Vaughan,
2009) provides profiles of particle extinction coefficient and
backscatter and additional profile information. In addition,
the CALIPSO extinction quality control (QC) flags were also
provided. Extinction QC= 0 (the lidar ratio is unchanged
during the extinction retrieval) and QC= 1 (if the retrieval
is constrained) are chosen in this paper, which are used to
calculate optical depth by integrating extinction coefficients.
Chen et al. (2013) noted that the impact of the screening pro-
cedure in this specific case is negligible.
2.2 Land cover data
The Collection 5.1 MODIS global land cover type prod-
uct (MCD12C1) from 2011 is used in this study to pro-
vide anthropogenic dust source types. The MCD12C1 prod-
uct has 0.05◦ spatial resolution, includes 17 different sur-
face vegetation types, and was developed by the Interna-
tional Geosphere–Biosphere Programme data (IGBP) (Love-
land and Belward, 1997; Friedl et al., 2010). It provides the
dominant land cover type as well as the sub-grid frequency
distribution of land cover classes within each 0.05◦ cell. Be-
cause we are focusing on sources of anthropogenic dust in
this paper, we limit our study to three agricultural surface
types: croplands, grasslands, and cropland mosaics. Crop-
land mosaics are lands with a mosaic of croplands less than
60 % of the landscape (Friedl et al., 2002). Because urban en-
vironments can also be sources of anthropogenic dust, we get
information about the extent of urban areas from the Global
Rural–Urban Mapping Project (GRUMP) v1 (Schneider et
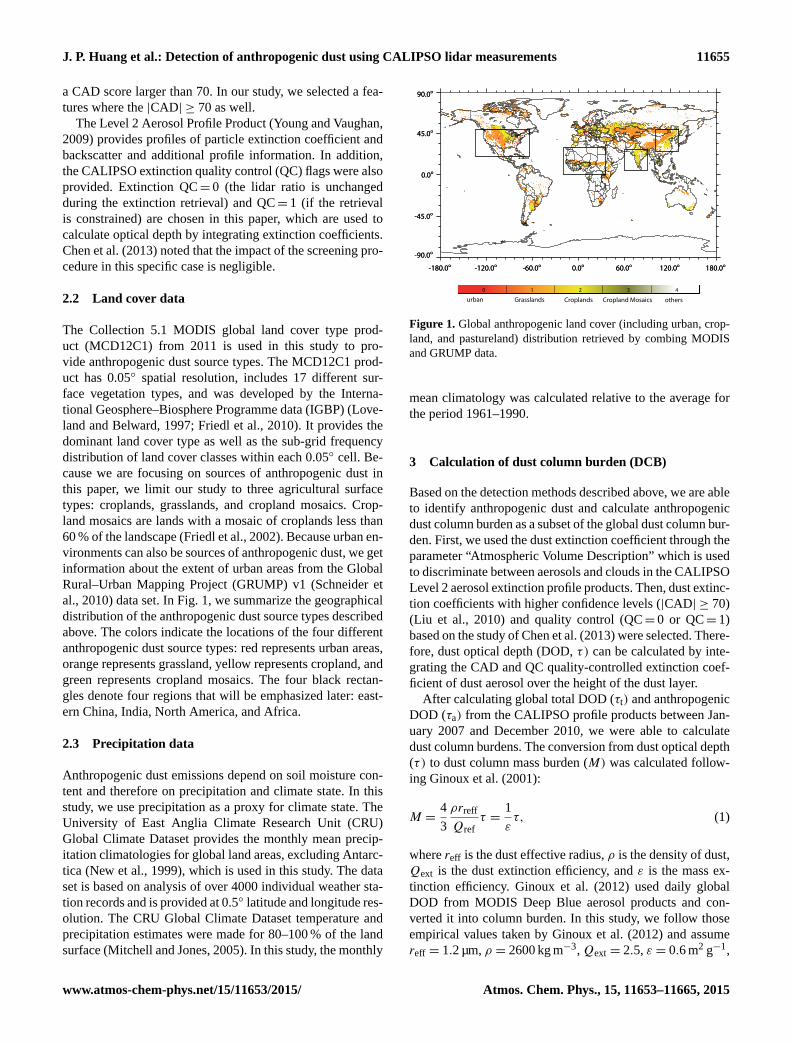
al., 2010) data set. In Fig. 1, we summarize the geographical
distribution of the anthropogenic dust source types described
above. The colors indicate the locations of the four different
anthropogenic dust source types: red represents urban areas,
orange represents grassland, yellow represents cropland, and
green represents cropland mosaics. The four black rectan-
gles denote four regions that will be emphasized later: east-
ern China, India, North America, and Africa.
2.3 Precipitation data
Anthropogenic dust emissions depend on soil moisture con-
tent and therefore on precipitation and climate state. In this
study, we use precipitation as a proxy for climate state. The
University of East Anglia Climate Research Unit (CRU)
Global Climate Dataset provides the monthly mean precip-
itation climatologies for global land areas, excluding Antarc-
tica (New et al., 1999), which is used in this study. The data
set is based on analysis of over 4000 individual weather sta-
tion records and is provided at 0.5◦ latitude and longitude res-
olution. The CRU Global Climate Dataset temperature and
precipitation estimates were made for 80–100 % of the land
surface (Mitchell and Jones, 2005). In this study, the monthly
-180.0o -120.0o -60.0o 0.0o 60.0o 120.0o 180.0o
-90.0o
-45.0o
0.0o
45.0o
90.0o
-180.0o -120.0o -60.0o 0.0o 60.0o 120.0o 180.0o
-90.0o
-45.0o
0.0o
45.0o
90.0o
0 1 2 3 4
urban Grasslands Croplands Cropland Mosaics others
Figure 1. Global anthropogenic land cover (including urban, crop-
land, and pastureland) distribution retrieved by combing MODIS
and GRUMP data.
mean climatology was calculated relative to the average for
the period 1961–1990.
3 Calculation of dust column burden (DCB)
Based on the detection methods described above, we are able
to identify anthropogenic dust and calculate anthropogenic
dust column burden as a subset of the global dust column bur-
den. First, we used the dust extinction coefficient through the
parameter “Atmospheric Volume Description” which is used
to discriminate between aerosols and clouds in the CALIPSO
Level 2 aerosol extinction profile products. Then, dust extinc-
tion coefficients with higher confidence levels (|CAD| ≥ 70)
(Liu et al., 2010) and quality control (QC= 0 or QC= 1)
based on the study of Chen et al. (2013) were selected. There-
fore, dust optical depth (DOD, τ) can be calculated by inte-
grating the CAD and QC quality-controlled extinction coef-
ficient of dust aerosol over the height of the dust layer.
After calculating global total DOD (τt) and anthropogenic
DOD (τa) from the CALIPSO profile products between Jan-
uary 2007 and December 2010, we were able to calculate
dust column burdens. The conversion from dust optical depth
(τ) to dust column mass burden (M) was calculated follow-
ing Ginoux et al. (2001):
M =4
3
ρrreff
Qref
τ =1
ετ, (1)
where reff is the dust effective radius, ρ is the density of dust,
Qext is the dust extinction efficiency, and ε is the mass ex-
tinction efficiency. Ginoux et al. (2012) used daily global
DOD from MODIS Deep Blue aerosol products and con-
verted it into column burden. In this study, we follow those
empirical values taken by Ginoux et al. (2012) and assume
reff = 1.2 µm, ρ = 2600 kg m−3,Qext = 2.5, ε = 0.6 m2 g−1,
www.atmos-chem-phys.net/15/11653/2015/ Atmos. Chem. Phys., 15, 11653–11665, 2015

11656 J. P. Huang et al.: Detection of anthropogenic dust using CALIPSO lidar measurements
and τ is the dust optical depth derived from the CALIPSO re-
trievals.
4 Dust detection and identification methods
It is a challenge to distinguish the anthropogenic dust com-
ponent from natural dust (Sagan et al., 1979; Sokolik and
Toon, 1996) due to the indirect nature of satellite-based mea-
surement data. In 2012, Ginoux et al. (2012) proposed a
method to detect anthropogenic dust by using MODIS Deep
Blue products, but MODIS, a passive instrument, has lim-
ited accuracy over relatively bright land surfaces. In order
to obtain more accurate and comprehensive results, we de-
veloped a new method to separate natural and anthropogenic
dust and assessed anthropogenic impacts on dust emissions
at the global scale by using CALIPSO measurements.
Figure 2 shows a schematic of dust sources and vertical
and horizontal transport processes underlying our approach
for separating anthropogenic dust from natural dust. The yel-
low dots represent dust aerosol in the atmosphere; the arrows
and red wavy lines indicate lifting and turbulence, respec-
tively. It illustrates that natural dust from deserts can undergo
long-range transport to other regions by lifting through the
planetary boundary layer (PBL) to the free troposphere, as
confirmed by Chen et al. (2013). Horizontal transport of nat-
ural dust aerosols occurs mainly above the PBL (Jordan et
al., 2010; Yu et al., 2012). Only a small amount of this dust
enters and remains within the PBL. However, it is this frac-
tion that may be most relevant to air quality (Yu et al., 2012).
Dusts from other land surface types and pollution sources are
predominately trapped in the PBL where industrial and com-
mercial activities, except for air travel, are conducted (Stull,
1988, 2000). We go through four steps to discriminate an-
thropogenic dust from natural dust in the CALIPSO data.
The first step is to detect the total dust load (both natural and
anthropogenic).The second step is to determine the source
region of the dust. The third step is to determine the height
of PBL, and the final step is to determine which dust is an-
thropogenic dust i.e., the subset of the total dust within PBL.
4.1 Step 1: Total dust detection
Aerosol subtypes are stored in the parameter “Feature Clas-
sification Flags” of CALIPSO VFM data. Therefore, dust
aerosols are identified by Feature Classification Flags in
this paper. We only use dust aerosol features for which
there is high confidence, i.e., absolute values of CAD score
greater than 70. Then, dust aerosol extinction coefficients
are integrated under the condition of extinctions QC= 0 and
QC= 1, which are chosen from CALIPSO’s aerosol profile
product. Next, we calculated dust aerosol optical depth as
well as dust column burden (g m−2) in Eq. (1).
Figure 2. A schematic figure for the detection process of anthro-
pogenic dust.
4.2 Step 2: Selection of source regions of anthropogenic
dust
As stated previously, anthropogenic dust mainly comes from
harvesting, ploughing, overgrazing, construction, traffic, etc.
We assume that anthropogenic dust will typically be emitted
from cropland, grasslands, and urban surfaces (referred to
as “anthropogenic surface”), will have thinner dust aerosol
layers, will be predominately trapped in PBL, and will
rarely be lifted into the free atmosphere by wind and turbu-
lence. Therefore, we restrict our source regions to the urban,
grassland, cropland, and mosaic cropland surfaces from the
MODIS and GRUMP data sets, as seen in Fig. 1.
4.3 Step 3: Determination of PBL height
In this step, we determine and use PBL height to exclude
long-distance transport of dust aerosol from dust sources
above the anthropogenic surface described above, so it is im-
portant to accurately determine PBL height to separate out
the anthropogenic dust.
We can use CALIPSO to determine PBL height because,
in general, the PBL is capped by a temperature inversion that
tends to trap moisture and aerosols. The gradient of backscat-
ter seen by lidar is almost always associated with this tem-
perature inversion and the simultaneous decrease in mois-
ture content (Palm et al., 1998; Melfi et al., 1985). Thus,
the definition of the PBL top as the location of the max-
imum aerosol scattering gradient is analogous to the more
conventional thermodynamic definition. McGrath-Spangler
and Denning (2012) revealed that the Modern-Era Retro-
spective Analysis for Research and Applications (MERRA)
PBL depths are within 25 % of the estimates derived from
the maximum standard technique (Jordan et al., 2010) by
CALIPSO, which is better than radiosonde estimates of
space/time average PBL depth (Angevine et al., 1994).
We modified the maximum standard technique developed
by Jordan et al. (2010) and derived global PBL heights
using this method, which are consistent with results of
McGrath-Spangler and Denning (2012). And, we found that
Atmos. Chem. Phys., 15, 11653–11665, 2015 www.atmos-chem-phys.net/15/11653/2015/

J. P. Huang et al.: Detection of anthropogenic dust using CALIPSO lidar measurements 11657
0.0 0.1 0.2 0.3 0.4 0.5
0.000
0.005
0.010
0.015
Laye
r int
egra
ted
atte
nuat
ed b
acks
catt
er (s
r-1)
0.0 0.1 0.2 0.3 0.4 0.5
0.000
0.005
0.010
0.015
Laye
r int
egra
ted
atte
nuat
ed b
acks
catt
er (s
r-1)
0.0 0.1 0.2 0.3 0.4 0.5
0.000
0.005
0.010
0.015
Laye
r int
egra
ted
atte
nuat
ed b
acks
catt
er (s
r-1)
0.25
North China
Taklamakan
(a) Entire pro�le
0.0 0.1 0.2 0.3 0.4 0.5
0.0 0.1 0.2 0.3 0.4 0.5
0.0 0.1 0.2 0.3 0.4 0.5
0.23
North China (Anthropogenic dust)
Taklamakan (Natural dust)
(b)PBL pro�le
0 25 50 75 100 125 150 175 200 225 250
0 25 50 75 100 125 150 175 200 225 250
Layer integrated depolarization ratio
Figure 3. The relationship between the layer-integrated depolarization ratio and the layer-integrated attenuated backscatter coefficient for
anthropogenic dust (North China) and natural dust (Taklamakan) for (a) the entire profile, and (b) the PBL profile.
this technique compared favorably to the ground-based lidar
at the Semi-Arid Climate and Environment Observatory of
Lanzhou University (SACOL) (Huang et al., 2008) with a
correlation coefficient of 0.73 (Liu et al., 2015).
4.4 Step 4: identification of anthropogenic dust within
PBL
The final step is to identify the anthropogenic dust within
the PBL. Two parameters, the layer integrated depolariza-
tion ratio δ′ and the layer integrated attenuated backscatter
coefficient γ ′, can be used to explore the difference in opti-
cal properties between natural dust and anthropogenic dust.
As an illustration of the process and resulting output of this
step, we chose two typical areas based on dust optical depth
(τ), population density, and land cover distribution, to rep-
resent sources of anthropogenic dust (North China: 35.0–
39.0◦ N, 114.0–118.0◦ E) and natural dust source (Takla-
makan: 38.0–40.0◦ N, 78.0–83.0◦ E). Because spring (March
to May) is the most active season for dust emission in the
Taklamakan region, 4 years (2007 through 2010) of spring
daytime CALIPSO measurements were used to look at the
optical properties of natural dust aerosol. Because anthro-
pogenic dust has little seasonal dependence and natural dust
is at its minimum during autumn in northern China, we
used 4 years (2007 through 2010) of autumn measurements
to look at the optical properties of anthropogenic dust. For
these two seasons, the statistical distribution of the layer-
integrated δ′ and γ ′ for both anthropogenic dust and natural
dust from the entire profile and within the PBL, respectively,
was constructed by summing occurrences within grid boxes
of 1δ′−1γ ′, measuring 0.01 by 0.001 sr−1.
In Fig. 3a, we can see that a threshold of δ′ = 0.25 can be
used to discriminate dust based on the set of entire height
profiles from the Taklamakan and North China. Figure 3b
shows that a lower threshold of δ′ = 0.23 can be used to
separate anthropogenic dust from natural dust within the
PBL. The larger threshold value for the entire profile com-
Figure 4. Flow chart of anthropogenic dust detection by combing
CALIPSO and land cover data set provided by MODIS.
pared to the PBL is mainly due to the fact that natural
dust transport above the PBL in North China leads to a
larger depolarization ratio. Furthermore, anthropogenic dust
has lower layer-integrated attenuated backscatter because an-
thropogenic dust produced by human activities is generally
mixed with other more spherical aerosol types within the
PBL, which has lower non-spherical particle. Natural dust
is more non-spherical than anthropogenic dust, so anthro-
pogenic dust has a lower layer-integrated depolarization ratio
than natural dust.
Therefore, anthropogenic dust could be accurately distin-
guished from natural dust through the above steps. Inevitably,
there are some misclassifications of anthropogenic and natu-
ral dust owing to anthropogenic dust mixed with natural dust
above and below the PBL. This problem should be kept in
mind in the following results and discussion. Quantitatively,
www.atmos-chem-phys.net/15/11653/2015/ Atmos. Chem. Phys., 15, 11653–11665, 2015

11658 J. P. Huang et al.: Detection of anthropogenic dust using CALIPSO lidar measurements
(a) Spring (MAM)
-120o -60o 0o 60o 120o
-30o
0o
30o
Latit
ude
(a) Spring (MAM)
-120o -60o 0o 60o 120o
-30o
0o
30o
Latit
ude
(b) Summer (JJA)
-120o -60o 0o 60o 120o
-30o
0o
30o
(b) Summer (JJA)
-120o -60o 0o 60o 120o
-30o
0o
30o
(c) Autumn (SON)
-120o -60o 0o 60o 120o Longitude
-30o
0o
30o
Latit
ude
(c) Autumn (SON)
-120o -60o 0o 60o 120o Longitude
-30o
0o
30o
Latit
ude
(d) Winter (DJF)
-120o -60o 0o 60o 120o Longitude
-30o
0o
30o
(d) Winter (DJF)
-120o -60o 0o 60o 120o Longitude
-30o
0o
30o
0.0 0.1 0.2 0.3 0.4 0.5 0.6
(Total DOD)
Figure 5. Global seasonal distributions of total (including polluted dust) dust optical depth derived from CALIPSO measurements (2007–
2010) for spring–winter, (a)–(d), respectively.
∼ 9.6 % of anthropogenic dust is misclassified as natural dust
and 8.7 % of natural dust is misclassified as anthropogenic
dust within the PBL mixed with the anthropogenic dust, re-
spectively.
A detailed flow chart of the anthropogenic dust detection
algorithm is shown in Fig. 4.
5 Results
The global distributions of seasonal mean and total DOD
with 1.25◦× 1.25◦ resolution derived from CALIPSO mea-
surements for 2007–2010 are presented in Fig. 5. Dust cov-
ers a larger area in the Northern Hemisphere than in the
Southern Hemisphere. The Taklamakan and Gobi deserts in
China (Qian et al., 2002; Huang et al., 2007, 2008) and the
deserts on the Indian subcontinent (Middleton, 1986) are ma-
jor dust source regions that are subordinate only to North
Africa and the Arabian Peninsula (Prospero et al., 2002;
Z. Liu et al., 2008). These major dust sources are located
in the broad “dust belt” that stretches from the western coast
of North Africa to China, covering the Sahara and Sahel re-
gions, the Arabian Peninsula, northern India, the Tarim Basin
and the Gobi Desert (Herman et al., 1997; Prospero et al.,
2002; D. Liu et al., 2008; J. Huang et al., 2014; Z. Huang
et al., 2010). The dust sources are usually associated with
topographical basins in these arid regions, on land adjacent
to high mountainous or plateau regions or in intermountain
basins, as discussed in detail by Prospero et al. (2002). The
annual rainfall in these dust source regions is generally low,
less than 200–250 mm. Significant seasonal variation in the
DOD is illustrated in panels (a) through (d) of Fig. 5. Dust
outbreaks are most active in this dust belt during the spring
and summer. In North Africa and the Arabian Peninsula,
summer is the most active season, whereas spring is the most
active season in the Indian subcontinent and the Taklamakan
region. In the Arabian Peninsula, the Indian subcontinent,
and Taklamakan, dust activities weaken rapidly in autumn,
reaching a minimum in winter. Figure 5 illustrates a major
dust transport pathway, in which the transatlantic transport
of North African dust stretches the “dust belt” towards the
North American continent. North African dust is transported
across the Atlantic throughout the year, although spring and
summer are the most active seasons and autumn is the least
active. Figure 5 also shows that the Hexi Corridor is a trans-
port pathway in East Asia, although it is clearly subordinate
to the North Atlantic pathway.
Using Eq. (1), we calculated the global annual mean total
DCB to be 79.3 Tg. The global seasonal mean values, which
are 81.5 (spring), 81.0 (summer), 73.7 (autumn), and 77.5
(winter) Tg, indicate that the dust burden in the atmosphere is
greater during the spring and summer. According to Huneeus
et al. (2011), the global annual mean dust burden values from
14 models range from 6.8 to 29.5 Tg. These values are far
less than our results, possibly because we include air masses
with both pollution aerosols and dust, thereby accounting for
episodes in which dust mixes with smoke from biomass burn-
ing, urban pollution, and sea salt aerosols (Omar et al., 2009).
In these cases the depolarization ratio is dominated by the
Atmos. Chem. Phys., 15, 11653–11665, 2015 www.atmos-chem-phys.net/15/11653/2015/

J. P. Huang et al.: Detection of anthropogenic dust using CALIPSO lidar measurements 11659
(a) Spring (MAM)
-120.0o -60.0o 0.0o 60.0o 120.0o
-30.0o
0.0o
30.0o
Latit
ude
(a) Spring (MAM)
-120.0o -60.0o 0.0o 60.0o 120.0o
-30.0o
0.0o
30.0o
Latit
ude
(b) Summer (JJA)
-120.0o -60.0o 0.0o 60.0o 120.0o
-30.0o
0.0o
30.0o
(b) Summer (JJA)
-120.0o -60.0o 0.0o 60.0o 120.0o
-30.0o
0.0o
30.0o
(c) Autumn (SON)
-120.0o -60.0o 0.0o 60.0o 120.0o Longitude
-30.0o
0.0o
30.0o
Latit
ude
(c) Autumn (SON)
-120.0o -60.0o 0.0o 60.0o 120.0o Longitude
-30.0o
0.0o
30.0o
Latit
ude
(d) Winter (DJF)
-120.0o -60.0o 0.0o 60.0o 120.0o Longitude
-30.0o
0.0o
30.0o
(d) Winter (DJF)
-120.0o -60.0o 0.0o 60.0o 120.0o Longitude
-30.0o
0.0o
30.0o
0.0 0.2 0.4 0.6 0.8 1.0 (g/m2)
Figure 6. Global seasonal distributions of mean anthropogenic dust column burden (2007–2010) for spring–winter, (a)–(d), respectively.
The gray areas represent non-anthropogenic dust source over land.
dust component, thus causing the entire mixture to be classi-
fied as dust and imparting greater values to our DCB values.
Figure 6 illustrates the global distribution of the seasonal
mean anthropogenic DCBs. The global seasonal mean an-
thropogenic DCBs are 7.0 (spring), 6.9 (summer), 6.1 (au-
tumn), and 6.0 (winter) Tg, respectively. This pattern differs
from the seasonal pattern of natural DOD (τn); the anthro-
pogenic DCB has minimal seasonal variation because an-
thropogenic dust emissions are controlled by human activ-
ities and urban pollutants. Greater DCBs occurred in east-
ern China, India, and North Africa during all seasons. These
greater DCBs are related to higher population densities in
eastern China and India and biomass burning throughout the
year in Africa when farmers prepare land for the agricul-
tural season and grazing (Justice et al., 1996). The global
annual mean anthropogenic DCB is 6.7 Tg, which accounts
for 8.4 % of the total global DCB. To avoid the impact of
dust on the ocean, we only calculated global continental dust
aerosols. We found that anthropogenic dust sources account
for 24.8 % of total continental dust sources (including pol-
luted dust). There are two reasons for the difference be-
tween our results and those of Ginoux et al. (2012): first, the
MODIS Deep Blue algorithm only retrieves the DOD over
bright surfaces (excluding forest and oceans), thus leading to
a lower dust burden. Second, MODIS data products lack ver-
tical information; therefore, they cannot extract natural dust
from deserts transported over anthropogenic source regions,
and thus they tend to yield larger results.
Figure 7 shows the global distribution of the anthro-
pogenic dust percentage of the total DCB over land. This
-180.0o -120.0o -60.0o 0.0o 60.0o 120.0o 180.0o
Longitude
-60.0o
-30.0o
0.0o
30.0o
60.0o
Latit
ude
-180.0o -120.0o -60.0o 0.0o 60.0o 120.0o 180.0o
Longitude
-60.0o
-30.0o
0.0o
30.0o
60.0o
Latit
ude
0 20 40 60 80 100 (percentage)
Figure 7. Global distributions of the percentage of anthropogenic
dust column burden account for total dust column burden.
figure illustrates the significance of human activities on dust
in many areas. Several features are evident in these maps.
Highly populated or intensively cultivated agricultural re-
gions, such as eastern North America, India, eastern China,
and Europe, all have anthropogenic dust percentages of
greater than 60 %. Lower percentages occur over places such
as western North America, particularly the Great Basin, and
North Africa, where less human activity leads to fewer an-
thropogenic dust aerosols.
Figure 8 compares the global DCB as a function of cli-
matological mean precipitation for spring, summer, autumn,
and winter. Although soil moisture is also related to the sur-
face temperature, the long-term mean precipitation is the
www.atmos-chem-phys.net/15/11653/2015/ Atmos. Chem. Phys., 15, 11653–11665, 2015

11660 J. P. Huang et al.: Detection of anthropogenic dust using CALIPSO lidar measurements
Table 1. Summary of anthropogenic dust annual mean statistics by climate region – anthropogenic dust optical depth (ADOD); total regional
area; regional anthropogenic dust column burden (DCB) (and percent contribution by region); regional dust column burden (DCB); and
percent contribution to regional DOD.
Region Mean anthropogenic DOD Area (km2) Anthropogenic DCB (Tg) DCB (Tg) Contribution to regional DOD (%)
Wet 0.12 1.77× 10⁷ 2.48 (41.2) 3.09 80.3
Semi-arid & semi-wet 0.07 2.46× 10⁷ 3.16 (52.5) 4.67 67.7
Arid 0.06 1.21× 10⁶ 0.38 (6.3) 0.56 67.9
simplest index for classifying climate regions. The mean
precipitation varies from less than 100 mm yr−1 to a max-
imum of 2000 mm yr−1 in Fig. 8, and the interval value
is 100 mm yr−1. The average anthropogenic DCB that cor-
responds to each precipitation interval is plotted. Figure 8
shows that anthropogenic dust mainly comes from semi-arid
and semi-wet regions over the entire year. Semi-arid regions
are transition zones between arid and semi-wet regions. They
are defined as areas in which the precipitation is less than the
potential evaporation, and are characterized by high tempera-
tures (30–45 ◦C) during the hottest months. The annual mean
precipitation ranges from 200 to 600 mm yr−1 in semi-arid
regions. Semi-wet regions cover considerable parts of east-
ern North America, Europe, and central China, with precip-
itation ranging from 600 to 800 mm yr−1. The total anthro-
pogenic DCB is greater in spring and summer than in autumn
and winter. This difference is most significant in arid regions.
There is almost no anthropogenic dust observed in arid re-
gions because of minimal agricultural and human activities
and urban pollution. Table 1 presents the annual mean an-
thropogenic DOD (τa), total area, total anthropogenic DCB,
and the percentage contribution to the total DCB from wet,
combined semi-arid and semi-wet, and arid regions. In wet
regions the mean DOD is 0.12, and the anthropogenic contri-
bution to the total DCB in wet regions is 80.3 %. This value is
greater than the anthropogenic contributions from combined
semi-arid and semi-wet regions, and arid regions, thus re-
vealing that anthropogenic dust plays an important role in
determining the total amount of dust because the frequency
of total natural dust events (suspended dust, blowing dust,
and dust storms) is lower in wet regions. Table 1 suggests
that anthropogenic dust aerosols from the combined semi-
arid and semi-wet regions contribute 52.5 % to the total an-
thropogenic dust aerosols over all three regions. The more
frequent occurrence of anthropogenic dust emissions over
semi-wet and semi-arid regions may be related to greater hu-
man activities and poor ecological practices in those regions.
Figure 9 shows the regional distribution of the annual
mean anthropogenic DCB derived from CALIPSO measure-
ments in four regions: eastern China, India, North America,
and North Africa. Table 2 lists their latitude and longitude
ranges, the area and percentage of each region that is con-
sidered to contribute to anthropogenic dust emissions, and
the annual mean anthropogenic DCB of the regions. In India,
0.0
0.1
0.2
0.3
0.4
0.5
0.6
0.7
0.8
Tota
l ant
hrop
ogen
ic d
ust c
olum
n bu
rden
(Tg)
0
100
200
300
400
500
600
700
800
900
1000
1100
1200
1300
1400
1500
1600
1700
1800
1900
2000
MAM
Arid Semi-arid Semi-wet Wet
Precipitation (mm/y)
0.0
0.1
0.2
0.3
0.4
0.5
0.6
0.7
0.8
Tota
l ant
hrop
ogen
ic d
ust c
olum
n bu
rden
(Tg)
0
100
200
300
400
500
600
700
800
900
1000
1100
1200
1300
1400
1500
1600
1700
1800
1900
2000
JJA
Arid Semi-arid Semi-wet Wet
Precipitation (mm/y)
0.0
0.1
0.2
0.3
0.4
0.5
0.6
0.7
0.8
Tota
l ant
hrop
ogen
ic d
ust c
olum
n bu
rden
(Tg)
0
100
200
300
400
500
600
700
800
900
1000
1100
1200
1300
1400
1500
1600
1700
1800
1900
2000
SON
Arid Semi-arid Semi-wet Wet
Precipitation (mm/y)
0.0
0.1
0.2
0.3
0.4
0.5
0.6
0.7
0.8
Tota
l ant
hrop
ogen
ic d
ust c
olum
n bu
rden
(Tg)
0
100
200
300
400
500
600
700
800
900
1000
1100
1200
1300
1400
1500
1600
1700
1800
1900
2000
DJF
Arid Semi-arid Semi-wet Wet
Precipitation (mm/y)
Figure 8. Comparisons of dust column burden as function of cli-
matological mean precipitation for different four seasons (spring,
summer, autumn, and winter) of global anthropogenic land cover.
The precipitation interval is 100 mm yr−1.
anthropogenic dust sources are distributed relatively evenly
over the region; the anthropogenic dust source area is 70.2 %
of the total area that is characterized by intense agricultural
and human activities (Prasad et al., 2007). In North Africa,
we note in Figs. 9 and 10 that the southern Sahel dust sources
are overwhelmingly anthropogenic and are associated with
aerosols from biomass burning. There is a clear separation
between natural dust sources in the Sahara and anthropogenic
dust in the southern Sahel. The area dominated by anthro-
pogenic dust sources is only 21.5 % of the total area i.e.,
most of the area is dominated by natural dust sources. Fig-
ure 9 also shows that anthropogenic dust sources in eastern
China are mostly confined to areas in northeastern China,
the North China Plain, and Inner Mongolia. The largest an-
thropogenic DCBs are located over the North China Plain.
This result is consistent with the conclusions of Wang et
al. (2006), who found that dust storm frequency does not ex-
ceed 8 days per year in northern China, even where there are
high levels of human activity. In Mongolia, there are dozens
of small anthropogenic dust sources associated with pasture-
lands or grasslands. In North America, most dust sources are
centered in two eastern areas, the Great Plains and the Upper
Mississippi Valley and also in the Great Basin to the west of
the continental divide. A major difference from the results
Atmos. Chem. Phys., 15, 11653–11665, 2015 www.atmos-chem-phys.net/15/11653/2015/

J. P. Huang et al.: Detection of anthropogenic dust using CALIPSO lidar measurements 11661
Table 2. Description of dust study areas – latitude and longitude ranges; area and percent of the region considered to contribute to anthro-
pogenic dust emissions; and annual mean anthropogenic dust column burden (ADCB) of the regions considered in this study.
Region Longitude range Latitude range Anthropogenic area km2 (%) Mean ADCB (g m−2)
Eastern China 100.0–130.0◦ E 25.0–50.0◦ N 3.71× 10⁶ (63.0) 0.17
India 60.0–90.0◦ E 5.0–27.5◦ N 1.98× 10⁶ (70.2) 0.42
North America 135.0–65.0◦W 20.0–50.0◦ N 5.56× 10⁶ (54.0) 0.09
North Africa 20.0◦W–35.0◦ E 0.0–30.0◦ N 3.40× 10⁶ (21.5) 0.26
100.0 106.0 112.0 118.0 124.0 130.0
25.0
30.0
35.0
40.0
45.0
50.0
Latit
ude
100.0 106.0 112.0 118.0 124.0 130.0
25.0
30.0
35.0
40.0
45.0
50.0
Latit
ude
(a)
(c)
(b)
(d)
60.0 66.0 72.0 78.0 84.0 90.0
5.0
9.5
14.0
18.5
23.0
27.5
60.0 66.0 72.0 78.0 84.0 90.0
5.0
9.5
14.0
18.5
23.0
27.5
(a)
(c)
(b)
(d)
-135.0 -121.0 -107.0 -93.0 -79.0 -65.0Longitude
20.0
26.0
32.0
38.0
44.0
50.0
Latit
ude
-135.0 -121.0 -107.0 -93.0 -79.0 -65.0Longitude
20.0
26.0
32.0
38.0
44.0
50.0
Latit
ude
(a)
(c)
(b)
(d)
-20.0 -9.0 2.0 13.0 24.0 35.0Longitude
0.0
6.0
12.0
18.0
24.0
30.0
-20.0 -9.0 2.0 13.0 24.0 35.0Longitude
0.0
6.0
12.0
18.0
24.0
30.0
(a)
(c)
(b)
(d)
0.0 0.1 0.2 0.3 0.5 0.7 (g/m2)
Figure 9. Regional distribution of annual mean anthropogenic dust column burden derived from CALIPSO measurements (2007 through
2010) for (a) eastern China, (b) India, (c) North America, and (d) North Africa.
of Ginoux et al. (2012) is that on the east side of the divide,
anthropogenic and natural dust sources are intertwined, and
on the west side of the divide, the sources are predominantly
natural rather than anthropogenic. The largest anthropogenic
DCBs are distributed over southeastern North America.
A histogram that illustrates the relative contribution of an-
thropogenic and natural dust sources over anthropogenic dust
source surfaces for the four study regions is shown in Fig. 10.
The annual mean anthropogenic DCB values range from a
maximum of 0.42 g m−2 in India to a minimum of 0.12 g m−2
in North America, including 0.23 g m−2 in eastern China and
0.24 g m−2 in North Africa. The anthropogenic dust contri-
butions to regional emissions from eastern China and India
are 91.8 and 76.1 %, respectively, followed by North Amer-
ica, with 73.9 %. In recent years, urbanization and human ac-
tivities have increased in eastern China; thus, its annual mean
contribution of anthropogenic dust is the largest, approxi-
mately 91.8 %. In Africa, the Sahara Desert is a rich source
of natural dust. Although the anthropogenic dust contribu-
tion is minimal, it is greater than in North America and east-
ern China. A lower amount of urban construction and human
activity in North America means that both its anthropogenic
dust content and contribution are the lowest of the four re-
gions. A possible explanation for the above phenomenon is
that eastern China and India have larger population densities
and thus more intense agricultural and human activities.
6 Discussion and conclusions
Emission of soil and mineral dust particles from the Earth’s
surface is a small-scale process that has global consequences
(Okin et al., 2011), such as cloud formation (Huang 2006b,
2010, 2014), anthropogenic carbon dioxide emission, snow
albedo changes (Huang et al., 2011), and land use changes
www.atmos-chem-phys.net/15/11653/2015/ Atmos. Chem. Phys., 15, 11653–11665, 2015

11662 J. P. Huang et al.: Detection of anthropogenic dust using CALIPSO lidar measurements
0.0
0.1
0.2
0.3
0.4
0.5
0.6
mea
n du
st c
olum
n bu
rden
(g/m
2 )
North America East China Africa India
AnthropogenicNatural
Figure 10. Anthropogenic (red) and natural (blue) mean dust col-
umn burdens and percentages in four regions (eastern China, India,
North America and Africa).
(Sokolik et al., 2011). Dust emissions are affected by climate
variability and in turn can impact climate, air quality, and hu-
man health (Ginoux et al., 2012). Global dust aerosols con-
tain not only locally emitted anthropogenic aerosols (includ-
ing agricultural dust and industrial black carbon) but also nat-
ural dust from deserts. Dust emissions from anthropogenic
activities could account for a large proportion of global dust
emissions, but quantifying anthropogenic dust emissions is
subject to large uncertainty (Sokolik and Toon, 1996). In
this paper, we have developed an algorithm to detect an-
thropogenic dust based on CALIPSO measurements and the
MODIS land cover data set. Using this algorithm, we have
determined the contribution of anthropogenic dust to the to-
tal global dust load.
We conducted a case study to test our algorithm us-
ing CALIPSO data for the Taklamakan Desert and north-
ern China, both of which are known natural and anthro-
pogenic dust source regions, respectively. We found that an-
thropogenic dust has a layer-integrated depolarization ratio
that is less than that of natural dust. This difference exists
because anthropogenic dust produced by human activities is
generally mixed with other types of aerosols within the PBL
and is thus more spherical than natural dust. However, we
note that approximately 9.6 % of anthropogenic dust is mis-
classified as natural dust and 8.7 % of natural dust is misiden-
tified as anthropogenic dust within the PBL. Another source
of uncertainty in the method comes from the uncertainty in
the PBL depth and MODIS land cover. Local anthropogenic
dust aerosols from human activities such as agriculture and
industrial endeavors contribute 25 % of the global continen-
tal dust load. Anthropogenic dust aerosols mainly come from
semi-arid and semi-wet regions, which account for more than
52 % of the total anthropogenic dust aerosols.
An analysis of sources over four different continental re-
gions revealed regional characteristics. The annual mean an-
thropogenic DCB value varies from 0.12 g m−2 in North
America to 0.42 g m−2 in India. Considering the mean DCB
in the four regions, the greatest burden of anthropogenic dust
occurs over India, and the greatest burden of natural dust oc-
curs over Africa. On a percentage basis, anthropogenic dust
is greatest over eastern China, and natural dust is greater
over Africa. Some studies have confirmed that human ac-
tivities (mainly farming, overgrazing, and water usage) are
likely responsible for the expansion of dust sources in north-
ern China and India (Xuan and Sokolik, 2002; Prasad et al.,
2007). Igarashi et al. (2011) noted that drought has been a
contributing factor. Gong et al. (2004) demonstrated that al-
though desertification has increased by only a few percent
in China, it has generated disproportionately large areas of
enhanced dust emissions. The relationship between popula-
tion density and the anthropogenic DCB from our four study
regions further supports the above results. As identified in
this paper, anthropogenic dust mainly comes from cropland,
urban areas, and pastureland. Anthropogenic dust from in-
termittent dry lake basins is not considered. A major uncer-
tainty in these results comes from the assumption of a single
value for the mass extinction efficiency in Eq. (1) that was
used in this paper; this parameter probably varies among the
different regions. To reduce this uncertainty, it will be nec-
essary to determine different mass extinction efficiencies for
natural and anthropogenic dust from different regions. We
note that the local anthropogenic dust also affects local cli-
mate, air quality, and human health. Therefore, it is necessary
to further investigate the interactions among aerosol–cloud–
precipitation processes and improve the parameterization of
local air pollution effects (Huang et al., 2006a, b, 2010, 2014;
Park et al., 2010; Li et al., 2011).
Acknowledgements. Supported by the National Basic Research
Program of China (2012CB955301), National Sciences Foundation
of China (41305026 & 41375032), and the China 111 project
(No. B 13045). CALIPSO data were obtained from the Atmo-
spheric Sciences Data Center (ASDC) at NASA Langley Research
Center. The MODIS data were obtained from the NASA Earth
Observing System Data and Information System, and the Land
Processes Distributed Active Archive Center (LP DAAC) at the
USGS Earth Resources Observation and Science (EROS) Center.
Edited by: D. Covert
References
Angevine, W. M., White, A. B., and Avery, S. K.: Boundary-
layer depth and entrainment zone characterization with a
boundary-layer profiler, Bound.-Lay. Meteorol., 68, 375–385,
doi:10.1007/BF00706797, 1994.
Bullard, J. E., Harrison, S. P., Baddock, M., Drake, N. A.,
Gill, T. E., McTainsh, G. H., and Sun, Y.: Preferential dust
sources: A geomorphological classification designed for use
in global dust-cycle models, J. Geophys. Res., 116, F04034,
doi:10.1029/2011JF002061, 2011.
Atmos. Chem. Phys., 15, 11653–11665, 2015 www.atmos-chem-phys.net/15/11653/2015/

J. P. Huang et al.: Detection of anthropogenic dust using CALIPSO lidar measurements 11663
Chen, B., Huang, J., Minnis, P., Hu, Y., Yi, Y., Liu, Z., Zhang, D.,
and Wang, X.: Detection of dust aerosol by combining CALIPSO
active lidar and passive IIR measurements, Atmos. Chem. Phys.,
10, 4241–4251, doi:10.5194/acp-10-4241-2010, 2010.
Chen, S., Huang, J., Zhao, C., Qian, Y., Leung, L. R., and Yang, B.:
Modeling the transport and radiative forcing of Taklamakan dust
over the Tibetan Plateau: A case study in the summer of 2006, J.
Geophys. Res., 118, 797–812, doi:10.1002/jgrd.50122, 2013.
Friedl, M. A., McIver, D. K., Hodges, J. C. F., Zhang, X. Y., Mu-
choney, D., Strahler, A. H., Woodcocka, C.E., Gopal, S., Schnei-
der, A., Cooper, A., Baccini, A., Gao, F., and Schaaf, C.: Global
land cover mapping from MODIS: Algorithms and early results,
Remote Sens. Environ., 83, 287–302, 2002.
Friedl, M. A., Sulla-Menashe, D., Tan, B., Schneider, A., Ra-
mankutty, N., Sibley, A., and Huang, X.: MODIS Collection
5 global land cover: Algorithm refinements and characteriza-
tion ofnew datasets, Remote Sens. Environ., 114, 168–182,
doi:10.1016/j.rse.2009.08.016, 2010.
Ginoux, P., Chin, M., Tegen, I., Prospero, J. M., Holben, B.,
Dubovik, O., and Lin, S. J.: Sources and distributions of dust
aerosols simulated with the GOCART model, J. Geophys. Res.,
106, 20255–20273, doi:10.1029/2000JD000053, 2001.
Ginoux, P., Prospero, J. M., Gill, T. E., Hsu, N. C., and
Zhao, M.: Global-scale attribution of anthropogenic and nat-
ural dust sources and their emission rates based on MODIS
Deep Blue aerosol products, Rev. Geophys., 50, RG3005,
doi:10.1029/2012RG000388, 2012.
Gong, S., Zhang, X., Zhao, T., and Barrie, L.: Sensitivity of Asian
dust storm to natural and anthropogenic factors, Geophys. Res.
Lett., 31, L07210, doi:10.1029/2004GL019502, 2004.
Herman, J., Bhartia, P., Torres, O., Hsu, C., Seftor, C., and
Celarier, E.: Global distribution of UV-absorbing aerosols from
Nimbus 7/TOMS data, J. Geophys. Res., 102, 16911–16922,
doi:10.1029/96JD03680, 1997.
Hu, Y., Vaughan M., Liu Z., Lin, B., Yang. P., Flittner, D., Hunt,
B., Kuehn, R., Huang, J., Wu, D., Rodier, S., Powell, K., Trepte,
C., and Winker, D.: The depolarization – attenuated backscatter
relation: CALIPSO lidar measurements vs. theory, Opt. Express,
15, 5327–5332, 2007a.
Hu, Y., Vaughan, M., McClain, C., Behrenfeld, M., Maring, H., An-
derson, D., Sun-Mack, S., Flittner, D., Huang, J., Wielicki, B.,
Minnis, P., Weimer, C., Trepte, C., and Kuehn, R.: Global statis-
tics of liquid water content and effective number concentration
of water clouds over ocean derived from combined CALIPSO
and MODIS measurements, Atmos. Chem. Phys., 7, 3353–3359,
doi:10.5194/acp-7-3353-2007, 2007b.
Hu, Y., Winker, D., Vaughan, M., Lin, B., Omar, A., Trepte, C., Flit-
tner, D., Yang, P., Nasiri, S. L., Baum, B., Sun, W., Liu, Z., Wang,
Z., Young, S., Stamnes, K., Huang, J., Kuehn, R., and Holz, R.:
CALIPSO/CALIOP Cloud Phase Discrimination Algorithm, J.
Atmos. Ocean. Tech., 26, 2293–2309, 2009.
Huang, J., Minnis, P., Lin, B., Wang, T., Yi, Y., Hu, Y., Sun-
Mack, S., and Ayers, K.: Possible influences of Asian dust
aerosols on cloud properties and radiative forcing observed
from MODIS and CERES, Geophys. Res. Lett., 33, L06824,
doi:10.1029/2005GL024724, 2006a.
Huang, J., Lin, B., Minnis, P., Wang, T., Wang, X., Hu, Y., Yi,
Y., and Ayers, J. R.: Satellite-based assessment of possible dust
aerosols semi-direct effect on cloud water path over East Asia,
Geophys. Res. Lett., 33, L19802, doi:10.1029/2006GL026561,
2006b.
Huang, J., Ge, J., and Weng, F.: Detection of Asia dust storms using
multisensor satellite measurements, Remote Sens. Environ., 110,
186–191, 2007.
Huang, J., Zhang, W., Zuo, J., Bi, J., Shi, J., Wang, X., Chang,
Z., Huang, Z., Yang, S., Zhang, B., Wang, G., Feng, G., Yuan,
J., Zhang, L., Zuo, H., Wang, S., Fu, C., and Chou, J.: An
overview of the semi-arid climate and environment research ob-
servatory over the Loess Plateau, Adv. Atmos. Sci., 25, 906–921,
doi:10.1007/s00376-008-0906-7, 2008.
Huang, J., Minnis, P., Yan, H., Yi, Y., Chen, B., Zhang, L., and Ay-
ers, J. K.: Dust aerosol effect on semi-arid climate over North-
west China detected from A-Train satellite measurements, At-
mos. Chem. Phys., 10, 6863–6872, doi:10.5194/acp-10-6863-
2010, 2010.
Huang, J., Fu, Q., Zhang, W., Wang, X., Zhang, R., Ye, H.,
and Warren, S. G.: Dust and black carbon in seasonal snow
across northern China, B. Am. Meteorol. Soc., 92, 175–181,
doi:10.1175/2010BAMS3064.1, 2011.
Huang, J., Guan, X., and Ji, F.: Enhanced cold-season warm-
ing in semi-arid regions, Atmos. Chem. Phys., 12, 5391–5398,
doi:10.5194/acp-12-5391-2012, 2012.
Huang, J., Wang, T., Wang, W., Li, Z., and Yan, H.: Climate effects
of dust aerosols over East Asian arid and semi-arid regions, J.
Geophys. Res., 119, 11398–11416, doi:10.1002/2014JD021796,
2014.
Huang, Z., Huang, J., Bi, J., Wang, G., Wang, W., Fu, Q., Li,
Z., Tsay, S., and Shi, J.: Dust aerosol vertical structure mea-
surements using three MPL lidars during 2008 China-U.S.
joint dust field experiment, J. Geophys. Res., 115, D00K15,
doi:10.1029/2009JD013273, 2010.
Huneeus, N., Schulz, M., Balkanski, Y., Griesfeller, J., Prospero,
J., Kinne, S., Bauer, S., Boucher, O., Chin, M., Dentener, F.,
Diehl, T., Easter, R., Fillmore, D., Ghan, S., Ginoux, P., Grini,
A., Horowitz, L., Koch, D., Krol, M. C., Landing, W., Liu, X.,
Mahowald, N., Miller, R., Morcrette, J.-J., Myhre, G., Penner,
J., Perlwitz, J., Stier, P., Takemura, T., and Zender, C. S.: Global
dust model intercomparison in AeroCom phase I, Atmos. Chem.
Phys., 11, 7781–7816, doi:10.5194/acp-11-7781-2011, 2011.
Igarashi, Y., Fujiwara, H., and Jugder, D.: Change of the Asian dust
source region deduced from the composition of anthropogenic
radionuclides in surface soil in Mongolia, Atmos. Chem. Phys.,
11, 7069–7080, doi:10.5194/acp-11-7069-2011, 2011.
Jordan, N. S., Hoff, R. M., and Bacmeister, J. T.: Validation of
Goddard Earth Observing System-version 5 MERRA planetary
boundary layer heights using CALIPSO, J. Geophys. Res., 115,
D24218, doi:10.1029/2009JD013777, 2010.
Justice, C., Kendall, J., Dowty, P., and Scholes, R.: Satellite remote
sensing of fires during the SAFARI campaign using NOAA ad-
vanced very high resolution radiometer data, J. Geophys. Res.,
101, 23851–23863, doi:10.1029/95JD00623, 1996.
Li Z., Li, C., Chen, H., Tsay, S.-C., Holben, B., Huang, J.,
Li, B., Maring, H., Qian, Y., Shi, G., Xia, X., Yin, Y.,
Zheng, Y., and Zhuang, G.: East Asian Studies of Tro-
pospheric Aerosols and their Impact on Regional Climate
(EAST-AIRC): An overview,J. Geophys. Res., 116, D00K34,
doi:10.1029/2010JD015257, 2011.
www.atmos-chem-phys.net/15/11653/2015/ Atmos. Chem. Phys., 15, 11653–11665, 2015

11664 J. P. Huang et al.: Detection of anthropogenic dust using CALIPSO lidar measurements
Liu, D., Wang, Z., Liu, Z., Winker, D., and Trepte, C.: A height
resolved global view of dust aerosols from the first year
CALIPSO lidar measurements, J. Geophys. Res., 113, D16214,
doi:10.1029/2007JD009776, 2008.
Liu, J., Huang, J., Chen, B., Zhou, T., Yan, H., Jin, H., Huang,
Z., and Zhang, B.: Comparisons of PBL heights derived from
CALIPSO and ECMWF reanalysis data over China, J. Quant.
Spectrosc. Ra., 153, 102–112, doi:10.1016/j.jqsrt.2014.10.011,
2015.
Liu, Z., Vaughan, M. A., Winker, D. M., Hostetler, C. A., Poole,
L. R., Hlavka, D., Hart, W., and McGill, M.: Use of probabil-
ity distribution functions for discriminating between cloud and
aerosol in lidar backscatter data, J. Geophys. Res., 109, D15202,
doi:10.1029/2004JD004732, 2004.
Liu, Z., Liu, D., Huang, J., Vaughan, M., Uno, I., Sugimoto, N., Kit-
taka, C., Trepte, C., Wang, Z., Hostetler, C., and Winker, D.: Air-
borne dust distributions over the Tibetan Plateau and surround-
ing areas derived from the first year of CALIPSO lidar obser-
vations, Atmos. Chem. Phys., 8, 5045–5060, doi:10.5194/acp-8-
5045-2008, 2008.
Liu, Z., Kuehn, R., Vaughan, M., Winker, D., Omar, A., Powell,
K., Trepte, C., Hu, Y., and Hostetler, C.: The CALIPSO cloud
and aerosol discrimination: Version 3 algorithm and test results,
25th International Laser Radar Conference (ILRC), St. Peters-
burg, Russia, 5–9, 2010.
Loveland, T. R. and Belward, A. S.: The IGBP-DIS global 1 km
landcover data set, DISCover: First results, Int. J. Remote Sens.,
18, 3289–3295, doi:10.1080/014311697217099, 1997.
Mahowald, N. M. and Luo, C.: A less dusty future?, Geophys. Res.
Lett., 30, 1903, doi:10.1029/2003GL017880, 2003.
Mahowald, N. M., Zender C. S., Luo, C., Savoie, D., Torres, O., and
del Corral, J.: Understanding the 30-year Barbados desert dust
record, J. Geophys. Res., 107, D21, doi:10.1029/2002JD002097,
2002.
McGrath-Spangler, E. L. and Denning, A. S.: Estimates of North
American summertime planetary boundary layer depths de-
rived from space-borne lidar, J. Geophys. Res., 117, D15101,
doi:10.1029/2012JD017615, 2012.
Melfi, S., Spinhirne, J., Chou, S., and Palm, S.: Lidar observa-
tions of vertically organized convection in the planetary bound-
ary layer over the ocean, J. Clim. Appl. Meteorol., 24, 806–821,
1985.
Middleton, N.: A geography of dust storms in South–West Asia, J.
Climate., 6, 183–196, doi:10.1002/joc.3370060207, 1986.
Mielonen, T., Arola, A., Komppula, M., Kukkonen, J., Kosk-
inen, J., de Leeuw, G., and Lehtinen, K.: Comparison of
CALIOP level 2 aerosol subtypes to aerosol types derived from
AERONET inversion data, Geophys. Res. Lett., 36, L18804,
doi:10.1029/2009GL039609, 2009.
Mitchell, T. D. and Jones, P. D.: An improved method of con-
structing a database of monthly climate observations and as-
sociated high-resolution grids, Int. J. Climatol., 25, 693–712,
doi:10.1002/joc.1181, 2005.
Moulin, C. and Chiapello, I.: Evidence of the control of summer
atmospheric transport of African dust over the Atlantic by Sahel
sources from TOMS satellites (1979–2000), Geophys. Res. Lett.,
31, L02107, doi:10.1029/2003GL018931, 2004.
Mulitza, S., Heslop, D., Pittauerova, D., Fischer, H. W., Meyer,
I., Stuut, J.-B., Zabel, M., Mollenhauer, G., Collins, J. A., and
Kuhnert, H.: Increase in African dust flux at the onset of com-
mercial agriculture in the Sahel region, Nature, 466, 226–228,
doi:10.1038/nature09213, 2010.
New, M., Hulme, M., and Jones, P.: Representing Twentieth-
Century Space-Time Climate Variability. Part I: Development of
a 1961–90 Mean Monthly Terrestrial Climatology, J. Climate,
12, 829–856, 1999.
Okin, G. S., Bullard, J. E., Reynolds, R. L., Ballantine, J. A.
C., Schepanski, K., Todd, M. C., Belnap, J., Baddock, M. C.,
Gill, T. E., and Miller, M. E.: Dust: Small-scale processes with
global consequences, Eos T. Am. Geophys. Un., 92, 241–242,
doi:10.1029/2011EO290001, 2011.
Omar, A. H., Winker, D. M., Kittaka, C., Vaughan, M. A., Liu, Z.,
Hu, Y., Trepte, C. R., Rogers, R. R., Ferrare, R. A., and Lee, K.-
P.: The CALIPSO automated aerosol classification and lidar ra-
tio selection algorithm, J. Atmos. Ocean. Tech., 26, 1994–2014,
doi:10.1175/2009JTECHA1231.1, 2009.
Palm, S. P., Hagan, D., Schwemmer, G., and Melfi, S.: Inference
of marine atmospheric boundary layer moisture and tempera-
ture structure using airborne lidar and infrared radiometer data, J.
Appl. Meteorol., 37, 308–324, doi:10.1175/1520-0450-37.3.308,
1998.
Park, S. H., Gong, S. L., Gong, W., Makar, P. A., Moran, M.
D., Zhang, J., and Stroud, C. A.: Relative impact of wind-
blown dust versus anthropogenic fugitive dust in PM2.5 on
air quality in North America, J. Geophys. Res., 115, D16210,
doi:10.1029/2009JD013144, 2010.
Prasad, A. K., Singh, S., Chauhan, S., Srivastava, M. K., Singh,
R. P., and Singh, R.: Aerosol radiative forcing over the Indo-
Gangetic plains during major dust storms, Atmos. Environ., 41,
6289–6301, doi:10.1016/j.atmosenv.2007.03.060, 2007.
Prospero, J. M., Ginoux, P., Torres, O., Nicholson, S. E., and Gill,
T. E.: Environmental characterization of global sources of at-
mospheric soil dust identified with the Nimbus 7 Total Ozone
Mapping Spectrometer (TOMS) absorbing aerosol product, Rev.
Geophys., 40, 2.1–2.31, doi:10.1029/2000RG000095, 2002.
Qian, W., Quan, L., and Shi, S.: Variations of the Dust Storm in
China and its Climatic Control, J. Climate, 15, 1216–1229, 2002.
Sagan, C., Toon, O. B., and Pollack, J. B.: Anthropogenic Albedo
Changes and the Earth’s Climate, Science, 206, 1363–1368,
1979.
Schneider, A., Friedl, M. A., and Potere, D.: Mapping global ur-
ban areas using MODIS 500-m data: New methods and datasets
based on “urban ecoregions”, Remote Sens. Environ., 114, 1733–
1746, doi:10.1016/j.rse.2010.03.003, 2010.
Sokolik, I. N. and Toon, O. B.: Direct radiative forcing by anthro-
pogenic airborne mineral aerosols, Nature, 381, 681–683, 1996.
Sokolik, I. N., Curry, J., and Radionov, V.: Interactions of Arctic
aerosols with land-cover and land-use changes in Northern Eura-
sia and their role in the Arctic climate system, in: Eurasian Arctic
Land Cover and Land Use in a Changing Climate, Springer, 237–
268, doi:10.1007/978-90-481-9118-5_10, 2011.
Stull, R. B.: An Introduction to Boundary Layer Meteorology, 666
pp., Kluwer Acad., Norwell, Mass, 1988.
Stull, R. B.: Meteorology for Scientists and Engineers,
Brooks/Cole, Pacific Grove, Calif., 2000.
Su, Jing, Huang, Jianping, Fu, Qiang, Minnis, P., Ge, Jinming, and
Bi, Jianrong: Estimation of Asian dust aerosol effect on cloud ra-
diation forcing using Fu-Liou radiative model and CERES mea-
Atmos. Chem. Phys., 15, 11653–11665, 2015 www.atmos-chem-phys.net/15/11653/2015/
J. P. Huang et al.: Detection of anthropogenic dust using CALIPSO lidar measurements 11665
surements, Atmos. Chem. Phys., 8, 2763–2771, doi:10.5194/acp-
8-2763-2008, 2008.
Sun, W., Liu, Z., Videen, G., Fu, Q., Muinonen, K., Winker, D.,
Lukashin, C., Jin, Z., Lin, B., and Huang, J.: For the depolar-
ization of linearly polarized light by smake particles, J. Quant.
Spectrosc. Ra., 122, 233–237, 2013.
Tegen, I. and Fung, I.: Contribution to the atmospheric mineral
aerosol load from land surface modification, J. Geophys. Res.,
100, 18707–18726, doi:10.1029/95JD02051, 1995.
Tegen, I., Werner, M., Harrison, S., and Kohfeld, K.: Relative im-
portance of climate and land use in determining present and fu-
ture global soil dust emission, Geophys. Res. Lett., 31, L05105,
doi:10.1029/2003GL019216, 2004.
Vaughan, M., Young, S., Winker, D., Powell, K., Omar, A., Liu, Z.,
Hu, Y., and Hostetler, C.: Fully automated analysis of spacebased
lidar data: an overview of the CALIPSO retrieval algorithms and
data products, Proc. SPIE Int. Soc. Opt. Eng., 5575, 16–30, 2004.
Wang, X., Zhou, Z., and Dong, Z.: Control of dust emissions
by geomorphic conditions, wind environments and land use
in northern China: An examination based on dust storm fre-
quency from 1960 to 2003, Geomorphology, 81, 292–308,
doi:10.1016/j.geomorph.2006.04.015, 2006.
Winker, D. M., Hunt, W. H., and McGill, M. J.: Initial perfor-
mance assessment of CALIOP, Geophys. Res. Lett., 34, L19803,
doi:10.1029/2007GL030135, 2007.
Xuan, J. and Sokolik, I. N.: Characterization of sources and emis-
sion rates of mineral dust in Northern China, Atmos. Environ.,
36, 4863–4876, doi:10.1016/S1352-2310(02)00585-X, 2002.
Young, S. A. and Vaughan, M. A.: The Retrieval of Pro-
files of Particulate Extinction from Cloud-Aerosol Lidar In-
frared Pathfinder Satellite Observations (CALIPSO) Data: Algo-
rithm Description, J. Atmos. Ocean. Technol., 26, 1105–1119,
doi:10.1175/2008JTECHA1221.1, 2009.
Yu, H., Remer, L. A., Chin, M., Bian, H., Tan, Q., Yuan,
T., and Zhang, Y.: Aerosols from overseas rival domes-
tic emissions over North America, Science, 337, 566–569,
doi:10.1126/science.1217576, 2012.
www.atmos-chem-phys.net/15/11653/2015/ Atmos. Chem. Phys., 15, 11653–11665, 2015