detecting dynamic community structure in functional brain
TRANSCRIPT

1
Detecting Dynamic Community Structure inFunctional Brain Networks Across Individuals: A
Multilayer ApproachChee-Ming Ting, S. Balqis Samdin, Meini Tang, and Hernando Ombao
Abstract—Objective: We present a unified statistical frameworkfor characterizing community structure of brain functional net-works that captures variation across individuals and evolutionover time. Existing methods for community detection focus onlyon single-subject analysis of dynamic networks; while recentextensions to multiple-subjects analysis are limited to staticnetworks. Method: To overcome these limitations, we propose amulti-subject, Markov-switching stochastic block model (MSS-SBM) to identify state-related changes in brain communityorganization over a group of individuals. We first formulatea multilayer extension of SBM to describe the time-dependent,multi-subject brain networks. We develop a novel procedure forfitting the multilayer SBM that builds on multislice modularitymaximization which can uncover a common community partitionof all layers (subjects) simultaneously. By augmenting with adynamic Markov switching process, our proposed method isable to capture a set of distinct, recurring temporal states withrespect to inter-community interactions over subjects and thechange points between them. Results: Simulation shows accuratecommunity recovery and tracking of dynamic community regimesover multilayer networks by the MSS-SBM. Application totask fMRI reveals meaningful non-assortative brain communitymotifs, e.g., core-periphery structure at the group level, that areassociated with language comprehension and motor functionssuggesting their putative role in complex information integration.Our approach detected dynamic reconfiguration of modularconnectivity elicited by varying task demands and identifiedunique profiles of intra and inter-community connectivity acrossdifferent task conditions. Conclusion: The proposed multilayernetwork representation provides a principled way of detectingsynchronous, dynamic modularity in brain networks acrosssubjects.
Index Terms—Dynamic functional connectivity, communitydetection, stochastic blockmodel, Markov-switching model, fMRI.
I. INTRODUCTION
FUNCTIONAL architecture of the brain can be charac-terized as a network of interconnected regions. Study
of brain networks has offered new insights on human be-havior and neurodegenerative diseases [1]. Early studies us-ing functional magnetic resonance imaging (fMRI) assume astatic functional connectivity (FC) pattern over time. Recent
C.-M. Ting is with the School of Information Technology, Monash Univer-sity Malaysia, 47500 Subang Jaya, Malaysia, and also the Biostatistics Group,King Abdullah University of Science and Technology, Thuwal 23955, SaudiArabia (e-mail: [email protected]).
S. B. Samdin is with the School of Electrical and Computer Engineering,Xiamen University Malaysia, 43900 Sepang, Malaysia, and also the Bio-statistics Group, King Abdullah University of Science & Technology, Thuwal23955, Saudi Arabia.
M. Tang & H. Ombao are with the Biostatistics Group, King AbdullahUniversity of Science & Technology, Thuwal 23955, Saudi Arabia.
evidence suggests temporal dynamics of FC patterns overmultiple time scales during task performance and rest [2].Dynamic FC has also been studied to examine the normal andpathological brain connectivity patterns [3]. Despite dynamicfluctuations over time, FC tends to be temporally clustered intoa finite number of putative connectivity states, i.e., distinctconnectivity patterns that transiently recur over the courseof experiment [4], [5]. Most studies of dynamic connectivitystates focused on transition between whole-brain connectivityprofiles only in terms of connectivity edges. However, switch-ing in the topological properties of brain functional networkssuch as the modular or community structure has receivedless attention. Our goal is to develop a novel approach toquantifying dynamic FC, specifically the state-driven changesin community organization of brain networks, while alsotaking into account variation across individuals.
Evidence from neuroimaging studies suggests complexcommunity structure of both structural and functional brainnetworks [6], where brain network can be decomposed intoclusters of densely inter-connected nodes (called modules orcommunities) that are relatively sparsely connected with nodesin other modules. These topological modules often correspondto groups of anatomically neighboring and/or functionally-related brain regions that are engaged in specialized informa-tion processing. Many data-driven community detection meth-ods have been applied to identify latent community structure inbrain networks. The most widely-used approach is the modu-larity maximization which partitions network’s nodes into non-overlapping communities that are more internally dense thanwould be expected by chance, by maximizing an objectivefunction of modularity [7]. There are many computationally-efficient heuristics that search for the approximate optimalmodularity [8]. Among them is the popular Louvain algorithmwhich is the fastest community detection methods in practice[9] but is only suited for analysis of single-layer networks,e.g., for individual subjects.
We consider a statistically-principled approach using thestochastic block model (SBM), a generative model for net-works with community structure [10]. The SBM partitions anetwork into ‘blocks’ or communities of nodes such that theprobability of forming a connectivity edge between a pair ofnodes depends only on which communities these nodes belong.One advantage of SBM is that it offers a richer class of com-munity structures beyond the traditional assortative communitywith internally dense and externally sparse connections (i.e.,the probability of an edge between nodes is higher within a
arX
iv:2
004.
0436
2v4
[cs
.LG
] 1
6 O
ct 2
020

2
community than between communities). These non-assortativestructures include the core-periphery, disassortative and mixedmotifs [11]. The maximizers of Newman-Girvan modularity[7] have been proven as asymptotically consistent estimatorsof block partitions under the SBM [12], and recently extendedto degree-corrected SBM [13].
Despite that community detection has become importantfor brain network analysis, there has not been much progressin (1) quantifying dynamic changes in community struc-ture over time, and (2) detecting and mapping communitiesacross subjects. Modularity in functional networks can exhibitchanges across time, e.g., over the course of task performanceand learning [14], [15]. Most studies using SBMs for brainnetworks focused mainly on the static descriptions of func-tional brain modules [11], [16]. Extensions of SBM for staticnetworks to dynamic settings have been introduced recently todetect temporal evolution of communities in social networks[17], [18]. To our knowledge, application of dynamic SBMsto time-varying brain networks is still very limited. Detectingbrain community structure across subjects was traditionallyperformed based on individual subjects or group-averagednetworks. This approach however suffers from inconsistentmapping of community labels across subjects and relies onsome ad-hoc template-matching techniques to register thesubject-specific communities to a common template [19].
A recent solution to these problems is the multilayernetwork representation via aggregating multiple instances ofa single network (layers) and then identifying communitiesacross layers by maximizing a multilayer modularity function[20]. A few studies have applied this approach to time-varyingbrain networks to track changes in community assignments ofnodes across time [14], [15], where each layer represents asnapshot of functional network at a particular time windowwith inter-layered couplings to connect nodes of networksbetween adjacent time points. It was recently modified tocharacterize modularity in brain networks across subjects[21]. By applying modularity maximization to a multilayerstack of individual subjects’ connectivity matrices, it can findcommunities in all layers (i.e. subjects) simultaneously. Oneadvantage is that it preserves community labels that are con-sistent across different subjects, thus allowing straightforwardinter-subject mapping of community assignments.
In this paper, we extend the SBM to dynamic, multi-subjectnetworks and adopt the multilayer modularity for detectingcommunities. Specifically, we develop a novel frameworkbased on multi-subject, Markov-switching SBM (MSS-SBM)to identify dynamic changes in modular organization of brainnetworks across subjects. We first formulate a multilayerSBM to characterize community structure in multi-subject,time-varying brain functional networks. We leverage on themultilayer modularity maximization to find shared communitypartition across subjects. Secondly, we aim to detect state-based changes in the network modular organization, i.e.,distinct patterns of inter-modular connectivity that repetitivelyoccur over time and across subjects, driven by some latentbrain states in response to changes in task conditions or stimuliover course of experiments. By combining the multilayer SBMand a hidden Markov model (HMM) to describe the evolution
of the underlying states, the proposed MSS-SBM is able toestimate simultaneously the change-points of time-evolvingmodularity states and the block structure in each state, i.e.,intra- and inter-modular connections. It is flexible to capturea variety of dynamics, e.g., a shift from a connectivity statewhich is highly modular to a state which is less modularand more integrated throughout the network. Moreover, ourmodel does not require for the timing of the switching betweenstates to be known a priori. In contrast to a similar setup in[22] that uses hidden-Markov SBM on the observed time-varying graphs directly, our approach has the advantage ofidentifying distinct temporal states in dynamic communitystructure based on lower-dimensional, time-evolving inter-modular connectivity matrices. Moreover, [22] only analyzedgroup-averaged dynamic functional networks and neglectedvariation across subjects. A multi-subject SBM based onmixture modeling and variational Bayesian estimation wasrecently proposed by [23], which however did not addressthe dynamic nature of the modular organization. Our earlierwork [24] proposed a Markov-switching SBM which revealedalternating modular connectivity in fMRI functional networksduring language processing, but it uses spectral clustering forcommunity detection and is limited to single-subject analysis.We apply the proposed MSS-SBM to task fMRI data in HumanConnectome Project (HCP) to study rapid switching of brainnetwork modularity evoked by repetitive tasks.
The main contributions of this work are as follows:1) We propose a novel framework based on MSS-SBM to
characterize state-based dynamic community structure ofbrain functional networks across subjects.
2) Our method combines a multi-subject, time-varying SBMwith an HMM to identify distinct repeating states inthe time-varying inter-community connectivity withouta priori knowledge about the timing of the structuralswitching between these states of network modularity.
3) To the best of our knowledge, our proposed approach isthe first that leverages on the multilayer modularity maxi-mization to detect community structure of brain networksin multiple subjects simultaneously under the proposedMSS-SBM. Given the common community partition withconsistent mapping of nodes’ community assignmentsacross subjects, it allows us to identify a set of group-level connectivity states.
II. MODELING MULTI-SUBJECT DYNAMIC COMMUNITYSTRUCTURE IN BRAIN NETWORKS
We first describe a novel multilayer SBM for modelingcommunity structure in multi-subject, time-varying brain func-tional networks. To identify state-related changes in the time-evolving community structure, we further develop a MSS-SBM that combines the multilayer SBM with an HMM todescribe the switching between distinct states of modular con-nectivity patterns over time and across subjects. The notationsof the proposed model are given in Table. I.
A. Multilayer SBM
We consider a collection of undirected graphs of multi-subject, time-varying functional brain networks G =

3
TABLE IOVERVIEW OF NOTATIONS OF THE PROPOSED MSS-SBM
Notation DescriptionT , R, N Number of time points, number of subjects, number of nodesGr,t ≡ V,Er,t Brain networks at time t for rth subjectV ≡ V1, . . . , VN, Er,t ≡ er,tij Set of nodes, set of edges between nodes in Gr,t
Wr,t = [wr,tij ] ∈ 0, 1N×N Adjacency matrix for Gr,t (wr,t
ij = 1 if node i links to node j, 0 otherwise)K Number of communities (or modules)Nk Number of nodes in kth communitygi ∈ 1, . . . ,K Community label of ith nodeφr,tij ∈ [0, 1] Probability of connections between nodes i and j at time t for rth subjectθr,tkl ∈ [0, 1] Probability of connections between nodes in communities k and lg = (g1, . . . , gN ) Community membership vectorΩ = [ωik] ∈ 0, 1N×K Community membership matrix (ωi,gi = 1 and 0 elsewhere)Φr,t = [φr,tij ] ∈ [0, 1]N×N Node-wise connection probability matrixΘr,t = [θr,tkl ] ∈ [0, 1]K×K Module-wise connection probability matrixβr,t ∈ RK2
Vectorized logit transform of Θr,t
S Number of statessr,t ∈ 1, . . . , S State indicator at time t for rth subjectπ`m ∈ [0, 1] Transition probability from state ` to state mΠ = [π`m] ∈ [0, 1]S×S Transition probability matrixµ
[m]Θ ∈ RK2
, Σ[m]Θ ∈ RK2×K2
Mean vector and covariance matrix of modular connectivity Θ for mth state
Gr,t, t = 1, . . . , T, r = 1, . . . , R that share a set of nodesV ≡ V1, . . . , VN (voxels or regions of interest (ROIs)) overT time points for a group of R subjects. We can view G asa doubly-indexed multilayer network where each (r, t)th layerGr,t ≡ V,Er,t represents a snapshot of a network observedat time step t for the rth subject, with a set of (possibly time-changing) connectivity edges between N individual nodesdenoted by Er,t ≡ er,tij , 1 ≤ i, j ≤ N. We assume thenumber of brain nodes N = |V | to be fixed over timeand subjects. We define the corresponding adjacency matrixrepresentations of the multi-subject, time-dependent networksin G by W = Wr,t, t = 1, . . . , T, r = 1, . . . , R whereWr,t = [wr,tij ] is a N × N symmetric matrix at time t forsubject r with wr,tij = 1 if there exists a connecting edgebetween the nodes i and j, er,tij ∈ Er,t and wr,tij = 0 otherwise.We assume there is no self-edge, i.e., wr,tii = 0. The time-varying adjacency matrices for each subject can be estimatedby thresholding the dynamic FC matrices (e.g., sliding-windowcorrelation matrices).
Under multilayer SBM, functional networks in G are as-sumed to be generated from a set of SBMs, where Wr,t ofindividual layers follows a regular single-layer SBM whichpartitions the N network nodes into K blocks or communities(clusters of anatomically or functionally-related brain regions).Let g = (g1, . . . , gN ) be N×1 community membership vector,where gi ∈ 1, . . . ,K indicates the community membershiplabel of node Vi and gi = k if node Vi belongs to communityk. We also denote Γk = Γk(g) = Vi : gi = k andNk = |Γk| to be the set of nodes and number of nodeswithin community k for k = 1, . . . ,K. We can rewrite ina N ×K membership matrix Ω = [ωik] such that ith row ofΩ is 1 in the gith column, ωi,gi = 1 and 0 elsewhere. Eachnode belongs only to one community (i.e., the communitiesor blocks are disjoint) such that
∑Kk=1 ωik = 1. We also
define a K × K symmetric modular connection probabilitymatrix Θr,t = [θr,tkl ], where θr,tkl ∈ [0, 1] is the probabilityof edges existing between any node in community k and anynode in community l at time t for subject r. The diagonalelements θr,tkk and the off-diagonals θr,tkl , k 6= l capture thewithin-module and between-module connectivity, respectively.Conditioned on the community assignments of nodes gi andgj , edges within and across network layers (r, t) are formedindependently following a Bernoulli distribution
wr,tij ∼ Bernoulli(φr,tij ) (1)
where φr,tij = θr,tgigj . Note that the probability of a connectionφr,tij = Pr(wr,tij = 1) between nodes i and j depends onlyon the community blocks to which they belong. Then, thenode-wise connectivity matrix is defined by Φr,t = [φr,tij ] =
ΩΘr,tΩT . Model (1) assigns a separate connection probabilityfor each subject and each time point. The set of parametersof the multilayer SBM is denoted by g,Θ with Θ =Θr,t; t = 1, . . . , T, r = 1, . . . , R. In our setting, the networkcommunity partition as represented by g is assumed to becommon to all subjects and constant over time, but the modularconnectivity matrix Θr,t is allowed to evolve across time andto vary across subjects. We consider estimation of multilayerSBM with K blocks in the a posteriori setting where both thecommunity membership labels g and the connectivity matricesΘ are both unknown and to be estimated.
B. Multi-Subject Markov-Switching SBM
In contrast to recent studies of dynamic connectivity statesin the whole-brain connectivity edges [5], [25]–[27], our goalin this paper is to identify distinct states in the time-evolvingmodular organization of networks and the temporal locationsof transitions between states. We develop a regime-switchingSBM to characterize changes the inter-community connectivitydriven by a set of recurring latent states over time and subjects.

4
In particular, let βr,t = vec(g(Θr,t)) be K2-dimensional vec-torized version of g(Θr,t) and g(Θr,t) = logit(Θr,t) whoseelements are logit of θr,tkl , logit(θr,tkl ) = log(θr,tkl )−log(1−θr,tkl ).We assume the logit transform of time-varying modular con-nection probabilities Θr,t in (1) to follow an HMM
sr,t|sr,t−1 = ` ∼Multi(π`1, . . . , π`S) (2)
βr,t|sr,t = m ∼ N(µ[m]Θ ,Σ
[m]Θ ) (3)
Wr,t|g,Θr,t ∼ Bernoulli(ΩΘr,tΩT ) (4)
where sr,t ∈ 1, . . . , S for t = 1, . . . , T is a sequence ofstate variables which vary over time for rth subject, S is thenumber of states. The variation in the modular connectivitystructure over time and subjects is determined by the latentstate indicator sr,t which follows a Markov process with S×Stransition matrix Π = [π`m]1≤`,m≤S , where π`m = Pr(sr,t =m|sr,t−1 = `) is the probability of transition from state ` attime t − 1 to state m at time t. The parameters µ
[m]Θ and
Σ[m]Θ capture respectively the mean and variations of inter-
modular connection probabilities in each state m = 1, . . . , S.In analyzing group-wise time-varying networks averaged oversubjects, [22] fitted the hidden Markov SBM directly on thehigh-dimensional N×N node-wise connectivity matrices Wt,specifying the evolution of connectivity parameters Θ[st] as apiecewise constant function of st. In contrast, the advantage ofour approach is that it utilizes the HMM for K ×K modularconnectivity matrices Θr,t, which involves a smaller numberof parameters in the state estimation and thus improvingcomputational and statistical efficiency. Moreover, it allowsclustering of the time-evolving community structure into statesthat maybe associated with different tasks and conditions overthe time course of experiment. Given the model (2)-(4), theaims are to estimate the state sequence sr,t which indicateswhich regime to be most likely active at each time point andfor each subject, and the state-specific modular connectivityparameters µ[m]
Θ ,Σ[m]Θ ,m = 1, . . . , S.
III. ESTIMATION
We develop a unified framework for efficient estimation ofthe proposed MSS-SBM to identify state-based dynamic com-munity structure in multiple subjects. A schematic overviewis shown in Fig. 1. The estimation consists of two steps:
Stage 1: Fit the multilayer SBM to the multi-subject,time-varying adjacency matrices in W. We first estimatethe common block structure g, by applying the modularitymaximization algorithm to a group-level multilayer networkobject comprising single networks of individual subjects touncover the shared nodes community memberships g overall subjects simultaneously. Given the estimated communitypartition, we then estimate by maximum likelihood (ML)method the inter-modular connection probabilities Θr,t foreach subject and each time point based on Wr,t.
Stage 2: Fit the HMM on Θr,t to identify dynamic com-munity states. This step produces estimates of change-pointsbetween states across time and subjects via the mostly likelystate sequence sr,t and the state-specific modular connectivityparameters µ[m]
Θ ,Σ[m]Θ . The proposed estimation procedure
is summarized in Algorithm 1.
Algorithm 1 Estimation Algorithm for MSS-SBM
Input: Multi-subject, time-varying and time-averaged adja-cency matrices Wr,t, t = 1, . . . , T, r = 1, . . . , R andW1
, . . . ,WR.
Parameters: Structural resolution γr = γ = 1, inter-layercoupling Cjrs = C = 1.
Step 1: Community Detection1: Find membership vector g by applying generalized Lou-
vain algorithm [28] to maximize multilayer modularity (7)
Step 2: Modular Connectivity Estimation2: Set Nk = |Vi : gi = k| for k = 1, . . . ,K
3: Set nkl = NkNl for k 6= l and nkk = Nk(Nk − 1)
4: for r = 1 : R do5: for t = 1 : T do6: Compute modular connectivity Θ
r,t= [θr,tk,l] via (9)
7: end for8: end for
Step 3: Dynamic State Identification9: Concatenate (β
1,1, . . . , β
R,T) with β
r,t= vec(g(Θ
r,t))
10: Compute state connectivity µ[m]Θ , Σ
[m]
Θ and transition
probability Π by fitting an HMM to (β1,1, . . . , β
R,T)
using the EM algorithm11: Generate state sequence s1,1, . . . , sR,T by solving (10)
using the Viterbi algorithm
Output: g, Θ, Π, µ[m]Θ , Σ
[m]
Θ and sr,t.
A. Community Detection
To detect communities in multi-subject brain functionalnetworks, we develop a method inspired by the modularitymaximization (Qmax) approach for estimating the multilayerSBM. The Qmax algorithm provides an estimate of the numberof communities K which is then used for fitting the SBM. Weuse the single-layer generalized Louvain algorithm to estimatethe community membership of nodes g at the individual sub-ject level, and develop an extension of the Qmax to multilayernetworks for group-level analysis.
1) Single-Layer Modularity Maximization: Let Wr
=[wrij ] be the adjacency matrix for subject r = 1, . . . , Rwhich is obtained by thresholding the time-averaged corre-lation matrix. For single-subject community detection, weaim to find the optimal community membership vector gr =g1r, . . . , gNr for each subject r independently. This can beaccomplished by maximizing the modularity quality function[29] of single-layer network, defined for each subject as
Q(gr) =∑
i,j
(wrij − pijr
)δ(gir, gjr) (5)
where pijr =κirκjr
2Lrdenotes the expected weight of the
edges connecting nodes i and j under the Newman-Girvannull model, κir =
∑j w
rij is the degree of node i, Lr is total
number of edges in the network of subject r, and δ(gir, gjr) =1 if nodes i and j belong to the same community, and 0

5
Fig. 1. Overview of the proposed MSS-SBM framework for detecting state-based dynamic community structure in multi-subject brain functional networks. Theapproach consists of three components: (A) Community detection via multilayer modularity maximization. (B) Estimation of time-resolved inter-communityconnectivity. (C) Identification of dynamic modular connectivity states via hidden Markov modeling.
otherwise. Then, the modularity maximization estimator of thecommunity partition is defined by gr = argmaxgr
Q(gr). Thepartition that gives the greatest value of Q is considered as agood estimate of a network’s community structure. We willdrop the subject index r for notational brevity.
To solve the single-subject or single-layer Qmax, we employthe Louvain algorithm which is simple and computationally-efficient. This community detection algorithm aims to findcommunities in a network assuming that connectivity betweennodes within communities is stronger than connectivity be-tween nodes across communities. It is a two-step iterativealgorithm. As initialization each node in the network is itsown community. In first step, each node will be assigned toa community of neighboring nodes if the resulting networkmodularity Q is maximized. The gain in modularity ∆Q bymoving a node i into community k is given by [9]
∆Q =
[Σin + κi,in
2L−(
Σtot + κi2L
)2]
−[
Σin2L−(
Σtot2L
)2
−( κi
2L
)2]
(6)
where Σin =∑ij∈Γk
wij is the number of edges withincommunity k, Σtot =
∑i∈Γk
κi is the total number of edgesincident to nodes of community k, κi is the degree of nodei and κi,in =
∑j∈Γk
wij is number of edges from node i toother nodes in the community k. The second step involvesconstructing a network with the new community structuredetected in first step. The two steps are repeated iterativelyuntil convergence of the network modularity. The algorithmmay produce different number of communities and communitypartitions gr across subjects.
2) Multilayer Modularity Maximization: We apply the mul-tilayer modularity approach [20] for community detection
in the multi-subject networks to find a group-level com-munity partition. With multilayer modularity optimization,one can study the dynamic network organization over aset of temporally-linked time-dependent networks [6], [11],[30], [31]. This method will identify the nodes communitymemberships of the functional connectivity networks for allsubjects simultaneously. The advantage of this approach is thatit can determine consistent community labels for all nodesin multi-subject networks. In contrast, conventional single-layer community detection methods such as spectral clusteringsuffer from problem of arbitrary community label switchingand hence inconsistent mapping of nodes assignments acrossdifferent subjects [18], [32], [33].
Let W = W1, . . . ,W
R be the set of R subject-specificadjacency matrices observed for a multilayer network whereeach layer represents a static functional brain network of aparticular subject. The multilayer modularity across all pairsof subjects r and s is written as
QMS =1
2µ
∑
ijrs
[(wrij−γrpijr)δ(gir, gjr)+δ(i, j)Cjrs]δ(gir, gjs)
(7)where gir is the community assignment of node i in layerr, δ(gir, gjs) = 1 indicates that community assignments girand gjs are identical, and pijr =
κirκjr
2Lris the expected
weight of edges within layer r. The total number of edgesin the adjacency tensor W is µ = 0.5
∑js(κjs + cjs)
where cjs =∑r Cjrs is the interlayer strength of node j
in layer s. This modularity optimization depends on intra-layer structural resolution γ and interlayer coupling parameterbetween layers r and s of the same nodes j, Cjrs. By addinginterlayer connections of weight C, optimization of (7) yieldscommunity labels that are preserved across subjects. We usedall-to-all interlayer coupling since the network layers acrosssubjects do not reflect specific order [20]. Larger values of

6
γ result in many small communities while large values of Cproduce communities that are common across subjects, withestimated membership vectors gr = g for all r = 1, . . . , R.
B. Estimation of Modular Connectivity Parameters
Given the estimated community partition, we can estimatethe subject-specific, time-dependent modular connectivity pa-rameters Θr,t via maximum likelihood. Under the indepen-dent formation of edges according to (1), for any arbitrarycommunity assignment g, the log-likelihood of the set of R×Tadjacency matrices W under the multilayer SBM is
f(W; Θ,g) = log
R∏
r=1
T∏
t=1
∏
i<j
(φr,tij)wr,t
ij(1− φr,tij
)1−wr,tij
=
R∑
r=1
T∑
t=1
∑
i<j
wr,tij log θr,tgi,gj
+(1− wr,tij ) log(1− θr,tgi,gj ). (8)
Given the estimated g, let Nk = |Γk(g)| = |Vi : gi = k|be the number of nodes assigned to community k. Define thenumber of possible edges between communities k and l asnkl = NkNl for k 6= l and nkk = Nk(Nk − 1) for k = l,and the number of observed edges for subject r at time tas mr,t
kl =∑i<j w
r,tij 1gi = k, gj = l, where 1· is an
indicator function. We can re-write (8) as
f(W; Θ,g) =R∑
r=1
T∑
t=1
∑
k≤l
mr,tkl log θr,tkl
+(nkl −mr,tkl ) log(1− θr,tkl )
.
Then ML estimate of connectivity parameters Θ is given by
θr,tk,l =mr,tkl
nkl, t = 1, . . . , T, r = 1, . . . , R, k, l = 1, . . . ,K.
(9)The estimated inter-block connection probabilities θr,tk,l corre-spond to the ratios of number of observed edges mr,t
kl relativeto possible edges nkl within each block, which are also calledas block densities.
C. Identification of Dynamic Community States
We fit an HMM in (2)-(3) on the estimates Θ = Θr,t; t =
1, . . . , T, r = 1, . . . , R to identify the distinct, recurringstates in the time-evolving inter-modular connectivity that arecommon across subjects. The timing of shifts between statesand the modular connectivity pattern in each state can beestimated simultaneously. Let (β
1,1, β
1,2, . . . , β
R,T) be a set
of RT concatenated vectors of the logit of estimated time-varying modular connection probabilities over all subjects.Given a set of HMM parameters λ = Π,µ
[m]Θ ,Σ
[m]Θ , the
temporal dynamics of the states over subjects sr,t can beobtained by extracting the most likely state sequence using theViterbi algorithm
s1,1, . . . , sR,T = argmaxs1,1,...,sR,T
p(s1,1, . . . , sR,T , β1,1, . . . , β
R,T |λ).
(10)
The state-specific block connectivity parameters µ[m]Θ ,Σ
[m]Θ
can be estimated via ML by using the Baum-Welch algorithm[34]. One could also fit an HMM to each subject and com-pute group-level parameters by averaging subject-specific esti-mates. Bayesian inference via the Markov chain Monte Carlosampling [35] can be used in our framework as an alternativeestimation approach for HMM, which allows incorporation ofprior information to improve parameter estimates.
IV. SIMULATIONS
In this section, we shall evaluate the performance of ourmethod on synthetic multi-subject networks.
1) Community Recovery: In this simulation, we first accessthe performance of different community detection methodsin recovering a consensus community partition that is sharedacross different subjects. We generate binary networks of Rsubjects from the multilayer SBM with balanced communitysize (with N nodes equally partitioned into K communities).The true community labels of nodes g are fixed and commonacross subjects. The modular connectivity matrix is set usingthe parameterization in [33]
Θ = αΘ0 : Θ0 = λIK + (1− λ)1K1TK , 0 < λ < 1 (11)
where IK is the K ×K identity matrix and 1K is the K × 1vector of 1’s. The quantity λ reflects the relative difference ofthe within- and between-community edge probabilities. Thenetwork sparsity is controlled by α, where Nα provides anupper bound on the average expected node degree. It is moredifficult to recover the communities when α and λ are closeto 0. We also allow inter-subject variability in the connectivitymatrix by adding some subject-specific random deviationssuch that Θr = Θ + εrIK with εr ∼ U [−0.1, 0.1].
We compare the performance of the proposed multilayermodularity maximization (Qmax) algorithm with two single-layer methods: (1) Spectral clustering which performs K-means clustering on the K leading eigenvectors of the graphLaplacian [32], and (2) Single-layer Qmax using the Louvainalgorithm (in Section III.A.(1)) as baseline. Both compet-ing methods are widely used for community recovery withpromising empirical performance, and have been shown toenjoy good statistical guarantee under the SBM [33], [36].Note that the number of communities K was assumed knownfor the spectral clustering, and estimated from the simulateddata for the Qmax methods. We measure the performance ofall methods by the adjusted Rand index (ARI) between theground-truth community labels g and their estimates g. TheARI is a measure of similarity between two partitions, takingvalues between 0 (random label assignments) and 1 (perfectrecovery of true partition).
Fig. 2 shows the performance comparison, in terms of ARIsover individual subjects, under different scenarios: increasingnumber of nodes N , number of subjects R, number of com-munities K and varying levels of network sparsity α. FromFig. 2(a), we see that the multilayer Qmax clearly outperformsthe single-layer methods, achieving perfect recovery evenwhen the number of nodes per community is very small. Thissuggests the robustness of the multilayer Qmax in small samplesettings due to the pooling of data across multiple layers to

7
20 40 60 80 100 120
Number of Nodes
-0.2
0
0.2
0.4
0.6
0.8
1
1.2
Ad
juste
d R
an
d I
nd
ex
Spectral clustering
Single-layer MM
Multilayer MM
(a)
20 40 60 80 100 120
Number of Subjects
-0.2
0
0.2
0.4
0.6
0.8
1
1.2
Ad
juste
d R
an
d I
nd
ex
Spectral clustering
Single-layer MM
Multilayer MM
(b)
2 4 6 8 10 12
Number of Communities
-0.2
0
0.2
0.4
0.6
0.8
1
1.2
Ad
juste
d R
an
d I
nd
ex
Spectral clustering
Single-layer MM
Multilayer MM
(c)
0.2 0.4 0.6 0.8 1
Network Sparsity
-0.2
0
0.2
0.4
0.6
0.8
1
1.2
Ad
juste
d R
an
d I
nd
ex
Spectral clustering
Single-layer MM
Multilayer MM
(d)
Fig. 2. Performance comparison of various methods for community detectionin multisubject networks as measured by ARI between ground-truth andestimated community labels for four simulation settings. (a) Number of nodesN increases, K = 5, R = 100, α = 0.8. (b) Number of subjects R increases,N = 120, K = 8, α = 0.8. (c) Number of communities K increases,N = 120, R = 100, α = 0.8. (d) Different levels of network sparsity α,N = 120, K = 8 and R = 100. Lines and error bars represent means andstandard deviations over subjects.
estimate the common community structure accurately. Theperformance of both single-layer methods improves steadily asN increases, with the single-layer Qmax reaching ARI of closeto 1 faster than the spectral clustering. Fig. 2(b) shows thatsmall number of layers/subjects (R = 20) is sufficient for themultilayer Qmax to yield an exact community reconstruction.The single-layer methods have slightly lower accuracy ofcommunity detection and do not show any improvement withmore layers because they carry out the community detectionin individual networks independently. Fig. 2(c) shows that themultilayer Qmax is able to consistently recover the commu-nities for large number of communities. The ARI of bothsingle-layer methods drops with increasing K, at a much fasterrate for the spectral clustering compared to the single-layerQmax. In Fig. 2(d), the single-layer methods especially thespectral clustering perform poorly when the network is sparse(low values of α). This agrees with other studies which haveshown that spectral methods tend to suffer from inconsistencyin sparse graphs [37]. As expected, the accuracy of thesemethods increases when the networks become denser as αincreases. In contrast, the multilayer Qmax remains robust evenin the sparse network case. Additional simulation shows themultilayer Qmax algorithm converges faster than single-layerQmax (See Supplementary Section 4).
2) Estimation of State-Related Changes: We further eval-uate the proposed MSS-SBM in identifying underlying tem-poral regime changes in the modular connectivity patterns.We generated time series of synthetic dynamic functionalnetworks for a cohort of R subjects, according to the time-varying, multi-subject SBM of (1). To emulate the hidden
(a) (b)
Fig. 3. Performance of MSS-SBM and K-means clustering in estimating state-based dynamic inter-modular connectivity in simulated multi-subject networksfor increased number of communities K with N = 120, T = 240 andS = 3. (a) ARI of dynamic state identification. (b) MSE for estimated time-dependent connectivity matrices. The intervals represent standard deviationsover R = 50 subjects and 100 replications of simulation for each subject.
dynamics of regime switching in the network communitystructure, the simulated sequences of T = 240 temporalgraphs Wr,t were characterized by time-evolving modularconnectivity Θ[st] driven by underlying piece-wise stationarystate time course st ∈ 1, . . . , S. Here we drop the subjectindex r in st assuming all subjects to share identical statedynamics. To imitate the typical block-design paradigm intask-based fMRI experiment, time-blocks of states (each staterepresents a task or stimulus) were interleaved and repeatedover the time course. This reproduces quasi-stable, recurringnetwork modular structure over time points. We considerS = 3 distinct states each has a unique modular connectionprobability matrix Θ[m] of the form (11) with λ = 0.9 form = 1, λ = 0.75 for m = 2 and λ = 0.6 for m = 3,which represent states of high, medium, and low within-community connectivity, respectively. We further introducetemporal variability by adding random fluctuations into thepiecewise constant trajectory Θ[st], i.e., βt = β[st] + ηt,ηt ∼ N(0, σI) where β[st] = vec(g(Θ[st])). The estimateof state sequence st is obtained via Viterbi algorithm, and thestate-specific connectivity parameters Θ
[m]= E[Θt|st = m]
from the inverse logit of the estimated means of HMMGaussian observation density g−1(µ
[m]Θ ).
To measure dynamic state estimation performance, we com-pute the ARI between the true and estimated partitions ofthe T temporal observations into states based on st. It isdefined in terms of numbers of pairs of time points that arecorrectly identified as belonging to the same or different states,where ARI = 1 indicates perfect recovery of the true statesequence. This measure also indirectly evaluates the change-point detection in the modular connectivity structure. We alsocalculate the mean squared error between the ground-truth andestimated time-evolving modular connectivity matrices overthe time course, MSE= T−1
∑Tt=1 ||Θ
[st] − Θ[st]||2F where||H||F = tr(H′H)1/2 denotes Frobenius norm of matrix H.
We access the scalability of MSS-SBM for dynamic con-nectivity estimation in the presence of large number of com-munities K. Fig. 3 plots the ARIs and MSEs over R = 50subjects as a function of increasing K with fixed N = 120.Compared to the K-means clustering approach which is widelyused in estimating dynamic brain connectivity states, the MSS-SBM performs better in both tracking of dynamic regimes and

8
connectivity estimation. This implies the advantages of usingMarkov process in the MSS-SBM to model the temporal evo-lution of the connectivity states, and the Gaussian observationdensity to account for variations within each state. Fig. 3(a)shows improved accuracy of dynamic regime identificationwith increasing K. This is because larger K may provide moreinformation about the distinct inter-community connectivitystructure that allows better discrimination between differenttemporal states. Despite improved temporal state partitioning,estimation errors of connectivity matrices increase as K in-creases (Fig. 3(b)). This is due to larger number of parametersin the state-specific connectivity matrices to be estimated,relative to fixed sample size available for each state.
V. APPLICATION TO TASK FMRIWe examined the task-based dynamic FC, a subject of
intensive recent research to understand how brain networksreconfigure dynamically to accommodate task demands [38].Most FC studies focus on resting-state fMRI which suffersdrawbacks due to its unconstrained nature, e.g., dynamic FCstates mapped during rest fail to provide a clear link to on-going cognitive states, where the identified network dynamicsmight be driven by artifactual rather than functionally-relevantsources [39]. In task settings, cognitive relevance of such FCstates can be evaluated, at least with respect to externally-imposed tasks, using the “ground-truth” defined by timing oftask performance in the experimental paradigm (e.g., to whichtask a given temporal segment belongs).
Specifically, we apply the proposed MSS-SBM approachto identify state-driven dynamic switching in inter-communityinteractions of fMRI functional networks across subjects asmodulated by distinct task performance. We assume there is acommon community partition across subjects and time, butallow the inter-modular connectivity to vary as evoked byalternating conditions over the time course of experiment. Thenumber of connectivity states corresponds to the number ofconditions, however the timing of changes in the connectivitystates between conditions is unknown a priori. Based onadjacency matrices estimated from fMRI data, we evaluatedboth the subject-specific and multi-subject community detec-tion using the single-layer and multilayer Qmax algorithm,respectively. Given the community partition, time-evolvinginter-modular connectivity matrices were estimated by MLfollowed by HMM fitting to identify the dynamic connectivitystates. We analyzed task-related fMRI data of 400 subjectsfor language tasks and 450 subjects for motor tasks fromthe Human Connectome Project. See Supplementary Section1 for details of experimental design, data acquisition andpreprocessing.
A. Network Construction
To estimate the dynamic FC, we computed Pearson’s corre-lations between the 90 ROI time series over sliding windowsof 30 time points / TRs (∼ 22 s for HCP data) with a stepsize of 1 TR. See Supplementary Section 3.2 on detailedvalidation analysis for the proposed choice of window length.For the construction of time-varying functional networks,the sliding-window correlation matrices were thresholded to
create time-varying adjacency matrices. The thresholding ofFC matrix defines the edges in the adjacency matrix andtherefore has a direct effect on the subsequent computationof graph metrics including the modularity. Here we usedthe proportional thresholding [40] by setting a fraction κ ofstrongest connections (with the highest absolute correlationvalues) of the derived FC matrix for each individual networkto 1, and other connections to zero. The application of theproportional threshold κ will result in a binary graph withconnection density of κ, defined for undirected graph as κ =2ε/N(N − 1), κ ∈ (0, 1) where ε is the number of preservededges [41]. This approach will produce a fixed density ofedges in graphs across all subjects and time windows, andthus enabling meaningful comparison of network topologybetween different groups and conditions. It has been shown togenerate more stable network metrics compared to the absolutethresholding [42]. By exploring different topological propertiesof the resulting networks over a range of connection densities,the threshold κ = 0.25 was identified as optimal indicatinga balance between network segregation and integration (SeeSupplementary Section 3.1).
B. Results for Subject-Specific Community DetectionTo detect subject-specific community structure, we first
computed subject-specific adjacency matrices for static con-nectivity by proportional thresholding the time-averaged corre-lation matrices of individual subjects. By applying the Louvainalgorithm, the detected number of communities varies acrossdifferent subjects (Supplementary Fig. 2.1). To obtain a con-sistent mapping of community partition across subjects fromsingle-subject analysis is non-trivial since each subject hasdifferent number of communities. To solve this, we computedthe community association matrices to quantify the occurrencethat pairs of nodes belong to the same community (Supplemen-tary Fig. 2.2), and aggregated them over all subjects to obtaina consensus community partition (Supplementary Fig. 2.3).
We then analyzed the regime changes in the commu-nity structure of dynamic functional networks using Markov-switching SBM (MS-SBM) as in [24] - a special case ofMSS-SBM for single-subject analysis. We fitted MS-SBMwith S = 2 and S = 6 states on the time-varying adjacencymatrices for the language and motor tasks, respectively. Herewe assume the number of dynamic community states S corre-sponds to the number of tasks in the experiments. We presenta data-driven procedure to estimate S when it is unknown apriori (e.g., for the resting-state), via clustering analysis ofΘr,t
(See Supplementary Section 3.3). Using silhouette andDavies-Bouldin cluster validity indices, the selected S on bothtask fMRI was close to the number of tasks (SupplementaryTable 3.1). Given the estimated subject-level community mem-bership of the 90 ROIs using Louvain algorithm, we computedthe subject-specific, time-varying inter-modular connectivityparameters by ML method as in (9) and then fitted an HMMfor each subject individually to detect the dynamic communityregimes. The performance of Viterbi algorithm in (10) intracking temporal regimes is compared with the K-meansclustering which is widely used in dynamic connectivity stateestimation.
9
Ground Truth
50 100 150 200 250
200
400
Story Math
K-means Estimates
50 100 150 200 250
100
200
300
400
Subje
ct
HMM Estimates
50 100 150 200 250
Time Point
100
200
300
400
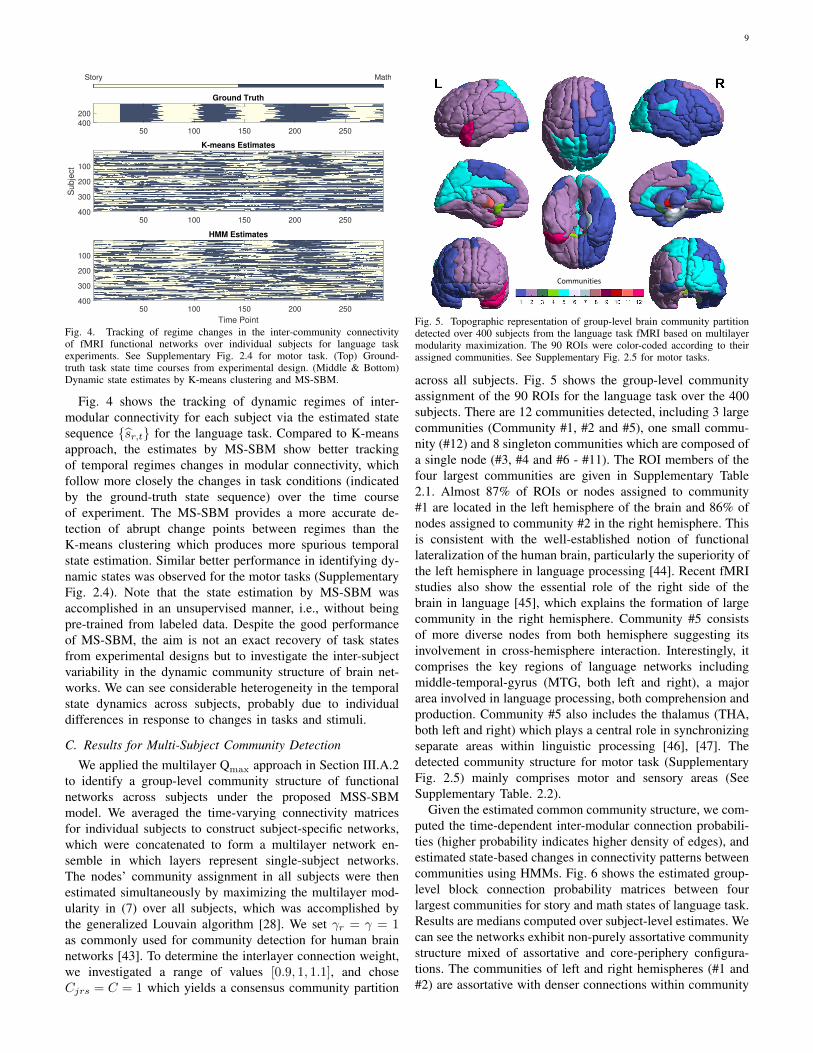
Fig. 4. Tracking of regime changes in the inter-community connectivityof fMRI functional networks over individual subjects for language taskexperiments. See Supplementary Fig. 2.4 for motor task. (Top) Ground-truth task state time courses from experimental design. (Middle & Bottom)Dynamic state estimates by K-means clustering and MS-SBM.
Fig. 4 shows the tracking of dynamic regimes of inter-modular connectivity for each subject via the estimated statesequence sr,t for the language task. Compared to K-meansapproach, the estimates by MS-SBM show better trackingof temporal regimes changes in modular connectivity, whichfollow more closely the changes in task conditions (indicatedby the ground-truth state sequence) over the time courseof experiment. The MS-SBM provides a more accurate de-tection of abrupt change points between regimes than theK-means clustering which produces more spurious temporalstate estimation. Similar better performance in identifying dy-namic states was observed for the motor tasks (SupplementaryFig. 2.4). Note that the state estimation by MS-SBM wasaccomplished in an unsupervised manner, i.e., without beingpre-trained from labeled data. Despite the good performanceof MS-SBM, the aim is not an exact recovery of task statesfrom experimental designs but to investigate the inter-subjectvariability in the dynamic community structure of brain net-works. We can see considerable heterogeneity in the temporalstate dynamics across subjects, probably due to individualdifferences in response to changes in tasks and stimuli.
C. Results for Multi-Subject Community Detection
We applied the multilayer Qmax approach in Section III.A.2to identify a group-level community structure of functionalnetworks across subjects under the proposed MSS-SBMmodel. We averaged the time-varying connectivity matricesfor individual subjects to construct subject-specific networks,which were concatenated to form a multilayer network en-semble in which layers represent single-subject networks.The nodes’ community assignment in all subjects were thenestimated simultaneously by maximizing the multilayer mod-ularity in (7) over all subjects, which was accomplished bythe generalized Louvain algorithm [28]. We set γr = γ = 1as commonly used for community detection for human brainnetworks [43]. To determine the interlayer connection weight,we investigated a range of values [0.9, 1, 1.1], and choseCjrs = C = 1 which yields a consensus community partition
Communities
Fig. 5. Topographic representation of group-level brain community partitiondetected over 400 subjects from the language task fMRI based on multilayermodularity maximization. The 90 ROIs were color-coded according to theirassigned communities. See Supplementary Fig. 2.5 for motor tasks.
across all subjects. Fig. 5 shows the group-level communityassignment of the 90 ROIs for the language task over the 400subjects. There are 12 communities detected, including 3 largecommunities (Community #1, #2 and #5), one small commu-nity (#12) and 8 singleton communities which are composed ofa single node (#3, #4 and #6 - #11). The ROI members of thefour largest communities are given in Supplementary Table2.1. Almost 87% of ROIs or nodes assigned to community#1 are located in the left hemisphere of the brain and 86% ofnodes assigned to community #2 in the right hemisphere. Thisis consistent with the well-established notion of functionallateralization of the human brain, particularly the superiority ofthe left hemisphere in language processing [44]. Recent fMRIstudies also show the essential role of the right side of thebrain in language [45], which explains the formation of largecommunity in the right hemisphere. Community #5 consistsof more diverse nodes from both hemisphere suggesting itsinvolvement in cross-hemisphere interaction. Interestingly, itcomprises the key regions of language networks includingmiddle-temporal-gyrus (MTG, both left and right), a majorarea involved in language processing, both comprehension andproduction. Community #5 also includes the thalamus (THA,both left and right) which plays a central role in synchronizingseparate areas within linguistic processing [46], [47]. Thedetected community structure for motor task (SupplementaryFig. 2.5) mainly comprises motor and sensory areas (SeeSupplementary Table. 2.2).
Given the estimated common community structure, we com-puted the time-dependent inter-modular connection probabili-ties (higher probability indicates higher density of edges), andestimated state-based changes in connectivity patterns betweencommunities using HMMs. Fig. 6 shows the estimated group-level block connection probability matrices between fourlargest communities for story and math states of language task.Results are medians computed over subject-level estimates. Wecan see the networks exhibit non-purely assortative communitystructure mixed of assortative and core-periphery configura-tions. The communities of left and right hemispheres (#1 and#2) are assortative with denser connections within community

10
5 121 2CommunitiesFig. 6. Estimated median modular connection probability matrices betweenfour largest communities for two states in the language tasks: story (left) andmath (right). The spatial distributions of the member ROIs of the communitiesare depicted in brain renders. See Supplementary Fig. 2.6 for the motor tasks.
of each hemisphere but sparser cross-hemisphere connections.These two segregated communities may engage in specializedinformation processing in language perception. Community#5 with nodes from both hemispheres is non-assortative inthe form of core-periphery motif. It acts as a core-like com-munity with strong intra-community connection density whileprojecting inter-community interactions with periphery-likecommunities (#1 and #2) with relatively sparsely connectednodes. This may suggest its role of information integrationin language processing, transiently broadcasting informationto or receive information from periphery across hemispheres.The story and math tasks elicit similar connectivity patternsbetween large communities, partly due to the overlappingsensory and cognitive effort required in both tasks such asauditory and phonetic perception, syntactic analysis, attentionand working memory. Nevertheless, slightly denser connectionwas detected between community #1 and communities #2and #5 in story task. This enhanced network integration maybe essential to facilitate more complex semantic processingwhen comprehending spoken narratives, compared to the non-semantic processes in the math task. Non-assortative com-munity motif was also found for all the six states of themotor tasks, as shown in the estimated modular connectivitymatrices (Supplementary Fig. 2.6). The temporal evolution ofthe connectivity states is captured by the estimated transitionprobability matrices in Fig. 7. The results indicate persistencein dwelling in the same states and occasional switching toother states (high self-transition and low inter-state transitionprobabilities), which is consistent with the block-design ex-perimental paradigm used in the language and motor tasks.
The difference in the inter-community connectivity patternsacross distinct states is more pronounced when including thesingleton communities. Fig. 8 show interactions between all
Language
.952
.051
.048
.949
Story
Mat
h
Story
Math
Motor
.881
.030
.026
.027
.026
.023
.024
.883
.023
.022
.029
.016
.023
.023
.884
.024
.023
.024
.025
.024
.025
.885
.025
.018
.023
.024
.024
.024
.874
.024
.024
.016
.019
.017
.023
.896
Cue
Right
-han
d
Right
-foot
Left-
hand
Left-
foot
Tongu
e
Cue
Right-hand
Right-foot
Left-hand
Left-foot
Tongue
Fig. 7. Estimated transition probability matrices between states of thelanguage and motor tasks.
communities detected for the language task for a subject. Thelinks represent the inter-block connection probabilities. Weobserved markedly distinct motifs of community interactionsbetween the two states. We see stronger between-communityconnectivity in the story state than the math state. In themotor task, we also found unique network configuration withinand between communities across the six different conditions(Supplementary Fig. 2.7).
We evaluate dynamic state estimation performance undersubject-level and group-level community partitions, detectedby the subject-specific and multi-subject Qmax algorithms, re-spectively. We also compare HMM and K-means clustering intracking dynamic connectivity states. Fig. 9 plots distributionsof RIs of the estimated state sequences over subjects relativeto changes of conditions in the experiments. The higher RIsfor both tasks confirm the results in Fig. 4 on the superiorityof MSS-SBM over the K-means clustering for detecting shiftsbetween distinct states of modular connectivity. These resultsare supported by additional performance metric based onthe F -measure (See Supplementary Section 2.4). Despite theadvantage of subject-level community detection to account forinter-subject variability with varying numbers of communitiesand community organization for individual subjects, the useof common group-level community partition produces betterresults in RIs for the dynamic state estimation. This impliesexistence of shared community structure among subjects andsynchronous brain dynamics in response to the same tasksor stimuli, which may not apply to resting-state data. Weobserve higher RIs for the motor task, reflecting the betteralignment of the estimated state sequences with the ground-truth (Supplementary Fig. 2.4) compared to the language task(Fig. 4). This is likely due to the more distinct modularconnectivity patterns across different states in the motor task(Supplementary Fig. 2.7) than the language task, which ren-ders states in the motor task easier to be differentiated overthe temporal dimension. For computational time of differentalgorithms see Supplementary Section 5.
VI. DISCUSSION
We developed a novel statistical framework based on a mul-tilayer, Markov-switching SBM for identifying state-driven dy-namic modular connectivity in multi-subject brain functionalnetworks. We first propose a multilayer SBM, a generalizationof existing dynamic SBM for single networks to an ensembleof networks, which provides a principled way of character-

11
LinksColormap
a) b)
Fig. 8. Within and between-community connectivity for each state of the language task. (a) Story. (b) Math. See Supplementary Fig. 2.7 for motor tasks.
Subject-Specific Multi-Subject
(a)
0.4
0.5
0.6
0.7
0.8
Ra
nd
In
de
x
Language fMRI
K-means
MSS-SBM
Subject-Specific Multi-Subject
(b)
0.4
0.5
0.6
0.7
0.8
Ra
nd
In
de
x
Motor fMRI
K-means
MSS-SBM
Fig. 9. Comparison of different community detection methods and temporalclustering methods for tracking modular connectivity state dynamics inlanguage and motor task fMRI, as measured by RI values of estimated statetime courses over subjects relative to the experimental ground-truth.
izing time-dependent inter-community connectivity of brainnetworks for a group of subjects. The model allows brainnodes to share common community partition over multiplenetwork layers formed by aggregating connectivity matricesof individual subjects, but the inter-community connectiondensity may vary flexibly across layers (subjects and time).By augmenting the multilayer SBM with a Markov-switchingmodel to describe the temporal dynamics, it enables us to iden-tify distinct, repeating states with respect to inter-communityconnectivity over time, without a priori assumption on thetemporal locations of the transition between states. We furtherintroduce the use of multilayer modularity maximization forestimating the latent block structure of the proposed MSS-SBM, which can uncover common community assignmentsin functional networks of many subjects simultaneously. Thisovercomes the problem of inconsistent mapping of commu-nity labels across subjects in the traditional subject-specificcommunity detection.
Simulation results show the effectiveness of the proposedmultilayer modularity maximization for recovery of commoncommunity structure in multilayer networks even when thenetwork is sparse and the number of communities to be
detected is large. When applied to two sets of HCP task-basedfMRI data, our method detected more diverse communityorganization in addition to the typical assortative structure inbrain networks, which is associated with language processingand motor functions. Even more notable is that our method wasable to identify non-assortative community motifs such as thecore-periphery structure. These types of network architectureengender more complex inter-community interactions that mayallow the network to engage in a wider functional repertoire,e.g., integration of information across different brain regionsin higher-order cognitive processes. For example, we founda bilateral core-like community in the language network thatsubserves an integrative function between periphery commu-nities in the left and the right hemisphere during languagecomprehension. The proposed MSS-SBM also captures state-related dynamic re-configuration of inter-modular interactionsin the brain networks, as modulated by the repetitive changesin task conditions over time course of experiment. It identifieda set of putative network states with distinct profiles of withinand between-community connectivity that are differential be-tween task conditions, such as left and right movements in themotor fMRI data. Our method has produced findings that couldlead to new sets of hypotheses about dynamic brain functionalnetworks particularly the state-driven reconfiguration of thebrain modular structure over time. Future work could investi-gate the behavioral relevance of the switching between statesof network modularity, e.g., switching rate as a predictive ofcognitive ability. Our current framework builds upon a basicSBM which assumes binary networks where edges carry noweights and identical degree distribution of each node. It canbe extended to incorporate enhanced variants of SBM, suchas the degree-corrected SBM [48] to allow for degree hetero-geneity within communities, and weighted SBM [49] to handleweighted connectivity networks. Another possible extension isto allow both the the connectivity parameters and communitymemberships to vary over time as in [17] to capture potentialdissolution and formation of new communities. To deal withthe arising label switching issue across different time steps[18], the proposed multilayer Qmax can be used to detect thetime-varying community partitions by varying the inter-layercoupling parameters, while preserving a consistent mappingof community labels across time.

12
REFERENCES
[1] E. Bullmore and O. Sporns, “Complex brain networks : Graph theoreti-cal analysis of structural and functional systems,” Nature Rev. Neurosci.,vol. 10, pp. 186–198, 2009.
[2] R. M. Hutchison, et al., “Dynamic functional connectivity: Promise,issues, and interpretations,” NeuroImage, vol. 80, pp. 360–378, 2013.
[3] B. Rashid, E. Damaraju, G. D. Pearlson and V. D. Calhoun, “Dynamicconnectivity states estimated from resting fMRI Identify differencesamong schizophrenia, bipolar disorder, and healthy control subjects,”Front. Hum. Neurosci., vol. 8, no. November, pp. 1–13, 2014.
[4] A. P. Baker, et al., “Fast transient networks in spontaneous human brainactivity,” eLife, vol. 2014, no. 3, pp. 1–18, 2014.
[5] E. A. Allen, E. Damaraju, S. M. Plis, E. B. Erhardt, T. Eichele and V. D.Calhoun, “Tracking whole-brain connectivity dynamics in the restingstate,” Cereb. Cortex, vol. 24, no. 3, pp. 663–676, 2012.
[6] O. Sporns and R. F. Betzel, “Modular brain networks,” Annu. Rev.Psychol., vol. 1, no. 67, pp. 613–640, 2016.
[7] M. E. J. Newman and M. Girvan, “Finding and evaluating communitystructure in networks,” Physical Rev. E, vol. 69, no. 2, pp. 026113, feb2004.
[8] A. Clauset, M. E. Newman and C. Moore, “Finding community structurein very large networks,” Physical Rev. E, vol. 70, no. 6, pp. 066111,2004.
[9] V. D. Blondel, J. L. Guillaume, R. Lambiotte and E. Lefebvre, “Fastunfolding of communities in large networks,” J. Statist. Mechanics:Theory and Experiment, vol. 2008, no. 10, 2008.
[10] K. Nowicki and T. A. B. Snijders, “Estimation and prediction forstochastic blockstructures,” J. Amer. Stat. Assoc., vol. 96, no. 455, pp.1077–1087, 2001.
[11] R. F. Betzel, J. D. Medaglia and D. S. Bassett, “Diversity of meso-scalearchitecture in human and non-human connectomes,” Nat. Commun.,vol. 9, no. 1, pp. 1–14, 2018.
[12] P. J. Bickel and A. Chen, “A nonparametric view of network models andnewman–girvan and other modularities,” Proc. Natl. Acad. Sci. U.S.A.,vol. 106, no. 50, pp. 21068–21073, 2009.
[13] Y. Chen, X. Li, J. Xu et al., “Convexified modularity maximization fordegree-corrected stochastic block models,” Ann. Statist., vol. 46, no. 4,pp. 1573–1602, 2018.
[14] D. S. Bassett, N. F. Wymbs, M. A. Porter, P. J. Mucha, J. M. Carlsonand S. T. Grafton, “Dynamic reconfiguration of human brain networksduring learning,” Proc. Natl. Acad. Sci. U.S.A., vol. 108, no. 18, pp.7641–7646, 2011.
[15] M. Pedersen, A. Zalesky, A. Omidvarnia and G. D. Jackson, “Multilayernetwork switching rate predicts brain performance,” Proc. Natl. Acad.Sci. U.S.A., vol. 115, no. 52, pp. 13376–13381, 2018.
[16] D. M. Pavlovic, P. E. Vertes, E. T. Bullmore, W. R. Schafer and T. E.Nichols, “Stochastic blockmodeling of the modules and core of theCaenorhabditis elegans connectome,” PLoS ONE, vol. 9, no. 7, 2014.
[17] K. S. Xu and A. O. Hero, “Dynamic stochastic blockmodels for time-evolving social networks,” IEEE J. Sel. Topics Signal Process., vol. 8,no. 4, pp. 552–562, 2014.
[18] C. Matias and V. Miele, “Statistical clustering of temporal networksthrough a dynamic stochastic block model,” J. Royal Stat. Society:Series B, vol. 79, no. 4, pp. 1119–1141, 2017.
[19] E. M. Gordon, T. O. Laumann, B. Adeyemo and S. E. Petersen,“Individual variability of the system-level organization of the humanbrain,” Cerebral Cortex, vol. 27, no. 1, pp. 386–399, 2017.
[20] P. J. Mucha, T. Richardson, K. Macon, M. A. Porter and J.-P. Onnela6,“Community structure in time-dependent, multiscale, and multiplexnetworks,” Science, vol. 328, no. 5980, pp. 876–878, 2010.
[21] R. F. Betzel, M. A. Bertolero, E. M. Gordon, C. Gratton, N. U.Dosenbach and D. S. Bassett, “The community structure of functionalbrain networks exhibits scale-specific patterns of inter-and intra-subjectvariability,” NeuroImage, 2019, In press.
[22] L. F. Robinson, L. Y. Atlas and T. D. Wager, “Dynamic functionalconnectivity using state-based dynamic community structure: Methodand application to opioid analgesia,” NeuroImage, vol. 108, pp. 274–291, mar 2015.
[23] D. M. Pavlovic, et al., “Multi-subject stochastic blockmodels foradaptive analysis of individual differences in human brain networkcluster structure,” bioRxiv preprint, 2019.
[24] S. B. Samdin, C.-M. Ting and H. Ombao, “Detecting state changesin community structure of functional brain networks using a markov-switching stochastic block model,” in 16th IEEE Int. Symp. Biomed.Imaging, 2019.
[25] P. A. Bandettini, et al., “Tracking ongoing cognition in individuals usingbrief, whole-brain functional connectivity patterns,” Proc. Natl. Acad.Sci. U.S.A., vol. 112, no. 28, pp. 8762–8767, 2015.
[26] S. B. Samdin, C. M. Ting, H. Ombao and S. H. Salleh, “A unifiedestimation framework for state-related changes in effective brain con-nectivity,” IEEE Trans. Biomed. Eng., vol. 64, no. 4, pp. 844–858, 2017.
[27] C. M. Ting, H. Ombao, S. B. Samdin and S. H. Salleh, “Estimatingdynamic connectivity states in fMRI using regime-switching factormodels,” IEEE Trans. Med. Imaging, vol. 37, no. 4, pp. 1011–1023,2018.
[28] L. G. S. Jeub, M. Bazzi, I. S. Jutla and P. J. Mucha, “A generalizedLouvain method for community detection implemented in MATLAB,”2017.
[29] M. E. J. Newman, “Modularity and community structure in networks,”Proc. Natl. Acad. Sci. U.S.A., vol. 103, no. 23, pp. 8577–8582, 2006.
[30] D. S. Bassett, M. A. Porter, N. F. Wymbs, S. T. Grafton, J. M. Carlsonand P. J. Mucha, “Robust detection of dynamic community structure innetworks,” Chaos, vol. 23, no. 1, 2013.
[31] A. N. Khambhati, A. E. Sizemore, R. F. Betzel and D. S. Bassett,“Modeling and interpreting mesoscale network dynamics,” NeuroImage,vol. 180, no. June 2017, pp. 337–349, 2018.
[32] K. Rohe, S. Chatterjee and B. Yu, “Spectral clustering and the high-dimensional stochastic blockmodel,” Ann. Statist., vol. 39, no. 4, pp.1878–1915, 2011.
[33] L. E. Jing and A. Rinaldo, “Consistency of spectral clustering instochastic block models,” Ann. Statist., vol. 43, no. 1, pp. 215–237,2015.
[34] L. Rabiner, “A tutorial on hidden Markov models and selectedapplications in speech recognition,” Proc. IEEE, vol. 77, no. 2, pp.257–286, 1989.
[35] S. L. Scott, “Bayesian methods for hidden markov models: Recursivecomputing in the 21st century,” J. Amer. Stat. Assoc., vol. 97, no. 457,pp. 337–351, 2002.
[36] Y. Zhao, E. Levina, J. Zhu et al., “Consistency of community detection innetworks under degree-corrected stochastic block models,” Ann. Statist.,vol. 40, no. 4, pp. 2266–2292, 2012.
[37] F. Krzakala, et al., “Spectral redemption in clustering sparse networks,”Proc. Natl. Acad. Sci. U.S.A., vol. 110, no. 52, pp. 20935–20940, 2013.
[38] J. Gonzalez-Castillo and P. A. Bandettini, “Task-based dynamic func-tional connectivity: Recent findings and open questions,” NeuroImage,vol. 180, pp. 526–533, 2018.
[39] R. D. Mill, T. Ito and M. W. Cole, “From connectome to cognition:The search for mechanism in human functional brain networks,” Neu-roImage, vol. 160, pp. 124–139, 2017.
[40] R. Schmidt, S. C. de Lange, C. Seguin, B. T. Yeo, M. P. van denHeuvel and A. Zalesky, “Proportional thresholding in resting-state fMRIfunctional connectivity networks and consequences for patient-controlconnectome studies: Issues and recommendations,” NeuroImage, vol.152, no. February, pp. 437–449, 2017.
[41] E. T. Bullmore and D. S. Bassett, “Brain graphs: Graphical models ofthe human brain connectome,” Annual Rev. Clinical Psychology, vol. 7,pp. 113–140, 2011.
[42] K. A. Garrison, D. Scheinost, E. S. Finn, X. Shen and R. T. Consta-ble, “The (in) stability of functional brain network measures acrossthresholds,” Neuroimage, vol. 118, pp. 651–661, 2015.
[43] D. S. Bassett, N. F. Wymbs, M. P. Rombach, M. A. Porter, P. J. Muchaand S. T. Grafton, “Task-based core-periphery organization of humanbrain dynamics,” PLoS Computational Biology, vol. 9, no. 9, 2013.
[44] J. A. Frost, et al., “Language processing is strongly left lateralized inboth sexes: Evidence from functional MRI,” Brain, vol. 122, no. 2, pp.199–208, 1999.
[45] A. M. Muller and M. Meyer, “Language in the brain at rest: Newinsights from resting state data and graph theoretical analysis,” Front.Hum. Neurosci., vol. 8, pp. 228, 2014.
[46] M. D. Johnson and G. A. Ojemann, “The role of the human thalamusin language and memory: Evidence from electrophysiological studies,”Brain and cognition, vol. 42, no. 2, pp. 218–230, 2000.
[47] F. Klostermann, “Functional roles of the thalamus for language capaci-ties,” Front. Syst. Neurosci., vol. 7, pp. 32, 2013.
[48] B. Karrer and M. E. Newman, “Stochastic blockmodels and communitystructure in networks,” Physical Rev. E, vol. 83, no. 1, pp. 016107,2011.
[49] C. Aicher, A. Z. Jacobs and A. Clauset, “Learning latent block structurein weighted networks,” J. Complex Networks, vol. 3, no. 2, pp. 221–248,2014.

Supplementary Material: Detecting Dynamic Community Structure in
Functional Brain Networks Across Individuals: A Multilayer Approach
Chee-Ming Ting∗, S. Balqis Samdin†, Meini Tang and Hernando Ombao‡
This appendix contains additional material to accompany our paper “Detecting Dynamic Community
Structure in Functional Brain Networks Across Individuals: A Multilayer Approach”. In Section 1, we
provide the details of the experimental design, acquisition and preprocessing of the fMRI data being used.
Section 2 presents supplementary results on subject-specific and multi-subject community detection, and
analysis of motor task fMRI data. Section 3 presents a series of validation experiments to clarify the
choice of important parameters in the estimation. Section 4 and 5 discuss the convergence behavior and
computational aspect of the proposed method.
1 Data Acquisition & Pre-processing
We applied the proposed MSS-SBM method to task-related fMRI data of 400 subjects for the language
tasks and 450 subjects for the motor tasks from the Human Connectome Project. The data were acquired
with 3T Siemens Skyra with TR = 720 ms, TE = 33.1 ms, flip angle = 52, BW =2290 Hz/Px, in-plane
FOV = 208 x 180 mm, 72 slices, 2.0 mm isotropic voxels. Refer to [1] for details of this dataset.
Language data: The experimental paradigm is block-design alternating between sentence judgments
(story) and arithmetic (math) tasks [2]. Subjects were given four sets of story-math tasks with average
duration of approximately 30s for each task. In the story task, subjects were given a short audio with
5-9 sentences followed by a question regarding topic of the story which required the subjects to choose
an answer from two given selections. In the math task, the subjects were given a few basic arithmetic
questions such as additional and subtraction and followed by answer selection for each question. Each
run has T = 316 time scans and 8 blocks. The onset of task cues can vary across different subjects.
Motor data: The task involves execution of five motor movements: left-hand, left-foot, right-hand,
right-foot and tongue movement. Each movement was repeated twice with duration of 12s with cue of 3s
prior to the executions. Each dataset has a total of T = 284 scans, 10 task blocks and 3 fixation blocks
per run. Unlike the language tasks, the onset timing of each task was identical for every subject.
Both datasets were minimally preprocessed with structural and functional HCP pre-processing pipelines
version of 3.13.2 [3]. We used the automated anatomical labeling (AAL) for parcellation of the whole
∗C-M Ting is with the School of Information Technology, Monash University Malaysia, 47500 Subang Jaya, Malaysia,
and also the Biostatistics Group, King Abdullah University of Science & Technology, Thuwal 23955, Saudi Arabia (e-mail:
[email protected]).†S. B. Samdin is with the School of Electrical and Computer Engineering, Xiamen University Malaysia, 43900 Sepang,
Malaysia, and also the Biostatistics Group, King Abdullah University of Science & Technology, Thuwal 23955, Saudi Arabia.‡M. Tang and H. Ombao are with the Biostatistics Group, King Abdullah University of Science & Technology, Thuwal
23955, Saudi Arabia.
1
arX
iv:2
004.
0436
2v4
[cs
.LG
] 1
6 O
ct 2
020
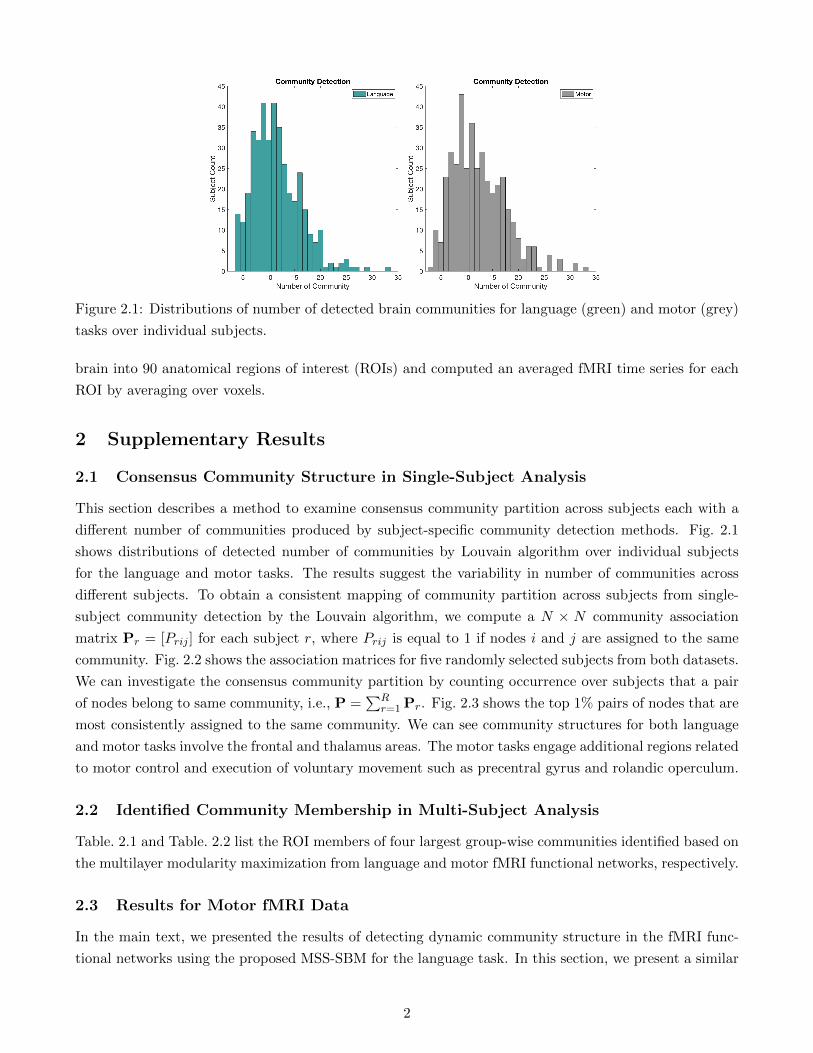
Figure 2.1: Distributions of number of detected brain communities for language (green) and motor (grey)
tasks over individual subjects.
brain into 90 anatomical regions of interest (ROIs) and computed an averaged fMRI time series for each
ROI by averaging over voxels.
2 Supplementary Results
2.1 Consensus Community Structure in Single-Subject Analysis
This section describes a method to examine consensus community partition across subjects each with a
different number of communities produced by subject-specific community detection methods. Fig. 2.1
shows distributions of detected number of communities by Louvain algorithm over individual subjects
for the language and motor tasks. The results suggest the variability in number of communities across
different subjects. To obtain a consistent mapping of community partition across subjects from single-
subject community detection by the Louvain algorithm, we compute a N × N community association
matrix Pr = [Prij ] for each subject r, where Prij is equal to 1 if nodes i and j are assigned to the same
community. Fig. 2.2 shows the association matrices for five randomly selected subjects from both datasets.
We can investigate the consensus community partition by counting occurrence over subjects that a pair
of nodes belong to same community, i.e., P =∑R
r=1 Pr. Fig. 2.3 shows the top 1% pairs of nodes that are
most consistently assigned to the same community. We can see community structures for both language
and motor tasks involve the frontal and thalamus areas. The motor tasks engage additional regions related
to motor control and execution of voluntary movement such as precentral gyrus and rolandic operculum.
2.2 Identified Community Membership in Multi-Subject Analysis
Table. 2.1 and Table. 2.2 list the ROI members of four largest group-wise communities identified based on
the multilayer modularity maximization from language and motor fMRI functional networks, respectively.
2.3 Results for Motor fMRI Data
In the main text, we presented the results of detecting dynamic community structure in the fMRI func-
tional networks using the proposed MSS-SBM for the language task. In this section, we present a similar
2

Subject 1
Left Right
Le
ftR
igh
t
La
ng
ua
ge
Ta
sk
Subject 1
Left Right
Le
ftR
igh
t
Mo
tor
Ta
sk
Subject 2
Left Right
Le
ftR
igh
t
Subject 2
Left Right
Le
ftR
igh
t
Subject 3
Left Right
Le
ftR
igh
t
Subject 3
Left Right
Le
ftR
igh
t
Subject 4
Left Right
Le
ftR
igh
t
Subject 4
Left Right
Le
ftR
igh
t
Subject 5
Left Right
Le
ftR
igh
t
Subject 5
Left Right
Le
ftR
igh
t
0
1Average
Left Right
Le
ftR
igh
t
0
0.1
0.2
0.3
0.4
0.5
0.6
0.7
0.8
0.9
1
Average
Left Right
Le
ftR
igh
t
Figure 2.2: Community association matrices for 5 subjects for language task (Top) and motor task
(Bottom). The ROI-wise entries in the matrices are arranged according to left and right brain hemisphere.
(a) Language tasks (b) Motor tasks
Figure 2.3: Top 1% pairs of connected ROIs that are most frequently assigned to the same community
over all subjects.
analysis with the motor task.
Single-Subject Analysis: For each subject, we fitted MS-SBM with S = 6 states on the dynamic
functional networks estimated from the motor task fMRI data. The community membership of nodes
were obtained by applying the Louvain algorithm on individual subject basis. Fig. 2.4 shows the superior
performance of the MS-SBM over the K-means clustering in tracking the transitions of the inter-modular
connectivity states between the six conditions in the motor task.
Multi-Subject Analysis: Similar to language task, we applied the proposed MSS-SBM with mul-
tilayer Qmax algorithm for group-level community detection on the motor task data. Fig. 2.5 shows the
detected community structure for the motor task, where 18 communities are identified. These include
4 large communities (Community #1, #2, #4 and #5, see ROI members in Table. 2.2) and 14 single-
ton communities. Community #1 consists of major motor areas including the primary motor cortex
(precentral gyrus (PreCG), both left and right) and supplementary motor areas (SMA). It also includes
regions of parietal lobe which interacts with other regions such as motor cortex by integrating visual-motor
information for movement control [4]. Community #2 mainly comprises frontal and occipital regions.
3

Table 2.1: Group-wise community membership of brain ROIs for four largest communities identified from
language task fMRI over all subjects based on multilayer modularity maximization. The ROIs were
parcellated according to Anatomical Automatic Labeling (AAL) atlas.
Membership ROI Label Membership ROI Label
Community #2 L Heschl gyrus HES.L
R Precentral gyrus PreCG.R L Superior frontal gyrus (dorsal) SFGdor.L
L Rolandic operculum ROL.L R Orbitofrontal cortex (superior) ORBsup.R
R Rolandic operculum ROL.R L Inferior frontal gyrus (opercular) IFGoperc.L
R Supplementary motor area SMA.R L Inferior frontal gyrus (triangular) IFGtriang.L
R Postcentral gyrus PoCG.R L Orbitofrontal cortex (inferior) ORBinf.L
R Superior parietal gyrus SPG.R R Insula INS.R
R Supramarginal gyrus SMG.R L Olfactory OLF.L
R Paracentral lobule PCL.R R Anterior cingulate gyrus ACG.R
R Heschl gyrus HES.R L Middle cingulate gyrus DCG.L
R Superior frontal gyrus (dorsal) SFGdor.R L Posterior cingulate gyrus PCG.L
L Orbitofrontal cortex (superior) ORBsup.L L Hippocampus HIP.L
L Orbitofrontal cortex (middle) ORBmid.L L Parahippocampal gyrus PHG.L
R Orbitofrontal cortex (middle) ORBmid.R L Precuneus PCUN.L
R Inferior frontal gyrus (opercular) IFGoperc.R L Temporal pole (middle) TPOmid.L
R Inferior frontal gyrus (triangular) IFGtriang.R R Temporal pole (middle) TPOmid.R
R Orbitofrontal cortex (inferior) ORBinf.R L Inferior temporal gyrus ITG.L
L Inferior parietal lobule IPL.L L Calcarine cortex CAL.L
R Amygdala AMYG.R L Lingual gyrus LING.L
R Caudate CAU.R L Superior Occipital gyrus SOG.L
L Superior frontal gyrus (medial) SFGmed.L L Middle occipital gyrus MOG.L
R Superior frontal gyrus (medial) SFGmed.R L Inferior occipital gyrus IOG.L
R Orbitofrontal cortex (superior-medial) ORBsupmed.R L Fusiform gyrus FFG.L
R Rectus gyrus REC.R L Superior temporal gyrus STG.L
R Middle cingulate gyrus DCG.R L Temporal pole (superior) TPOsup.L
R Posterior cingulate gyrus PCG.R Community #5
R Parahippocampal gyrus PHG.R L Insula INS.L
R Angular gyrus ANG.R R Inferior parietal lobule IPL.R
R Precuneus PCUN.R R Olfactory OLF.R
R Inferior temporal gyrus ITG.R L Pallidum PAL.L
R Calcarine cortex CAL.R R Pallidum PAL.R
R Lingual gyrus LING.R L Thalamus THA.L
R Superior occipital gyrus SOG.R R Thalamus THA.R
R Middle occipital gyrus MOG.R L Orbitofrontal cortex (superior-medial) ORBsupmed.L
R Fusiform gyrus FFG.R L Rectus gyrus REC.L
R Temporal pole (superior) TPOsup.R L Anterior cingulate gyrus ACG.L
Community #1 R Hippocampus HIP.R
L Precentral gyrus PreCG.L L Angular gyrus ANG.L
L Supplementary motor area SMA.L L Middle temporal gyrus MTG.L
L Postcentral gyrus PoCG.L R Middle temporal gyrus MTG.R
L Superior parietal gyrus SPG.L Community #12
L Supramarginal gyrus SMG.L R Inferior occipital gyrus IOG.R
L Paracentral lobule PCL.L R Superior temporal gyrus STG.R
4

Table 2.2: Group-wise community membership of brain ROIs for four largest communities identified
from motor task fMRI over all subjects based on multilayer modularity maximization. The ROIs were
parcellated according to Anatomical Automatic Labeling (AAL) atlas.
Membership ROI Label Membership ROI Label
Community #1 L Precuneus PCUN.L
L Precentral gyrus PreCG.L R Precuneus PCUN.R
R Precentral gyrus PreCG.R R Superior occipital gyrus SOG.R
L Supplementary motor area SMA.L R Middle occipital gyrus MOG.R
L Superior parietal gyrus SPG.L L Inferior occipital gyrus IOG.L
L Orbitofrontal cortex (superior) ORBsup.L R Inferior occipital gyrus IOG.R
R Orbitofrontal cortex (superior) ORBsup.R L Fusiform gyrus FFG.L
L Olfactory OLF.L R Fusiform gyrus FFG.R
R Olfactory OLF.R R Superior temporal gyrus STG.R
R Pallidum PAL.R Community #5
L Thalamus THA.L L Superior frontal gyrus (dorsal) SFGdor.L
R Thalamus THA.R R Superior frontal gyrus (dorsal) SFGdor.R
L Orbitofrontal cortex (superior-medial) ORBsupmed.L L Inferior parietal lobule IPL.L
R Orbitofrontal cortex (superior-medial) ORBsupmed.R R Inferior parietal lobule IPL.R
L Rectus gyrus REC.L L Pallidum PAL.L
L Anterior cingulate gyrus ACG.L L Superior frontal gyrus (medial) SFGmed.L
R Anterior cingulate gyrus ACG.R R Superior frontal gyrus (medial) SFGmed.R
L Middle cingulate gyrus DCG.L R Middle cingulate gyrus DCG.R
R Posterior cingulate gyrus PCG.R L Posterior cingulate gyrus PCG.L
L Hippocampus HIP.L L Inferior temporal gyrus ITG.L
R Hippocampus HIP.R R Inferior temporal gyrus ITG.R
L Middle temporal gyrus MTG.L L Calcarine cortex CAL.L
R Middle temporal gyrus MTG.R R Calcarine cortex CAL.R
L Temporal pole (middle) TPOmid.L R Lingual gyrus LING.R
R Temporal pole (middle) TPOmid.R L Superior occipital gyrus SOG.L
L Lingual gyrus LING.L L Middle occipital gyrus MOG.L
R Temporal pole (superior) TPOsup.R L Temporal pole (superior) TPOsup.L
Community #2 Community #4
L Rolandic operculum ROL.L L Postcentral gyrus PoCG.L
R Rolandic operculum ROL.R L Supramarginal gyrus SMG.L
R Postcentral gyrus PoCG.R R Supramarginal gyrus SMG.R
R Superior parietal gyrus SPG.R L Paracentral lobule PCL.L
L Heschl gyrus HES.L R Paracentral lobule PCL.R
R Heschl gyrus HES.R L Orbitofrontal cortex (inferior) ORBinf.L
L Orbitofrontal cortex (middle) ORBmid.L R Orbitofrontal cortex (inferior) ORBinf.R
R Orbitofrontal cortex (middle) ORBmid.R R Rectus gyrus REC.R
L Inferior frontal gyrus (opercular) IFGoperc.L L Parahippocampal gyrus PHG.L
R Inferior frontal gyrus (opercular) IFGoperc.R R Parahippocampal gyrus PHG.R
L Insula INS.L L Angular gyrus L ANG.L
R Insula INS.R R Angular gyrus R ANG.R
5

Ground Truth
50 100 150 200 250
200400
Cue Right-hand Right-foot Left-hand Left-foot Tongue
K-means Estimates
50 100 150 200 250
100
200
300
400
Subje
ct
HMM Estimates
50 100 150 200 250
Time Point
100
200
300
400
Figure 2.4: Tracking of regime changes in the inter-community connectivity of fMRI functional networks
over individual subjects for motor task experiments. (Top) Ground-truth task state time courses from
experimental design. (Middle & Bottom) Dynamic state estimates by K-means clustering and MS-SBM.
Fig. 2.6 shows estimated inter-modular connection probability matrices between four largest commu-
nities for the six conditions in the motor task. The non-assortative community motif is evident for all
the six states. Community #1 serves as the core interacting with periphery communities #4 and #5.
Community #4 is less assortative with low within-community connection density. The tongue movement
has its own unique connectivity pattern. Hand movements exhibit denser connections within community
#2 than foot movements. Fig. 2.7 show interactions between all communities detected for the motor
tasks for a subject with the best state alignment with experimental task sequence. We found increase in
connectivity within and between communities in the foot movements compared to the hand and tongue
movements. Moreover, the left and right movements also exhibit distinct network configurations.
2.4 Comparison of Different Methods
In the main manuscript, we compared performance of different community detection and temporal clus-
tering algorithms for estimating the modular connectivity state dynamics based on Rand indices (RIs).
To further validate the results, we consider an additional performance metric using the F -measure [5] to
compare the estimated state sequence with the ground-truth from experimental paradigm. F -measure (or
F1 score) is a type of cluster evaluation measure based on set overlaps between clusterings by counting
pairs of data points which two clusterings have in common (or number of points in the intersection of two
clusters). It takes on values in the range [0, 1] with value of 1 indicates identical clusterings. Specifically,
F -measure gives an indication of the accuracy of identified clusters with respect to a ground-truth, cal-
culated as the harmonic mean of precision (fraction of pairs correctly assigned to the same cluster with
6

Communities
Figure 2.5: Topographic representation of group-level brain community partition detected over 450 sub-
jects from the motor task fMRI based on multilayer modularity maximization. The 90 ROIs were color-
coded according to their assigned communities.
5 41 2Communities
Figure 2.6: Estimated median modular connection probability matrices between four largest communities
for six states in the motor tasks. The spatial distributions of the member ROIs of the communities are
depicted in brain renders.
7

LinksColormap
a) b) c)
d) e) f)
Figure 2.7: Within and between-community connectivity for each state of the motor tasks. (a) Rest. (b)
Right-hand. (c) Left-hand. (d) Tongue. (e) Right-foot. (f) Left-foot
Table 2.3: Comparison of average (median) Rand indices (RI) and F1 scores over subjects of different
methods for dynamic modular state identification on language and motor task fMRI.
Community State Language Motor
Detection Identification RI F1 RI F1
Subject-specificK-means 0.5158 (0.5049) 0.5023 (0.5014) 0.6796 (0.6854) 0.2340 (0.2314)
HMM 0.5203 (0.5057) 0.5364 (0.5353) 0.7105 (0.7164) 0.2512 (0.2482)
Multi-subjectK-means 0.5204 (0.5085) 0.5194 (0.5240) 0.6744 (0.6851) 0.2594 (0.2570)
HMM 0.5245 (0.5106) 0.5492 (0.5546) 0.7271 (0.7280) 0.2799 (0.2770)
ground-truth among the identified) and recall (fraction of correct pairs that were identified). Fig. 2.8
plots the F1 scores of state assignments of time points for different algorithms. In Table 2.3, we also
report the averaged RIs and F1 scores over all subjects. The results confirm the more accurate dynamic
state identification of the HMM over the K-means clustering, and multi-subject over the single-subject
community detection.
8

Subject-Specific Multi-Subject
(a)
0
0.2
0.4
0.6
0.8
1
F1 s
core
Language fMRI
K-means
MSS-SBM
Subject-Specific Multi-Subject
(b)
0
0.1
0.2
0.3
0.4
0.5
F1 s
core
Motor fMRI
K-means
MSS-SBM
Figure 2.8: Comparison of different methods for tracking modular connectivity state dynamics in language
and motor task fMRI, as measured by F1 scores of estimated state time courses relative to the experimental
ground-truth over all subjects.
3 Choice of Parameters
We present a series of additional analyses to clarify the choice of some important parameters which needs
to be pre-specified in the MSS-SBM estimation.
3.1 Edge Density in Network Construction
In the network construction, we applied the proportional thresholding which defines the threshold τκ on
the correlation matrices in terms of a fixed connection (edge) density κ (also called topological cost) of
the resulting graphs across individual and datasets. The common practice in brain connectome studies
for selecting a proper threshold is to explore network properties as a function of changing threshold or
connection density, and identify a range of values (or a single value) over which the resulting network
exhibits desirable topological characteristics [6, 7, 8]. We aim to construct networks with an optimal
balance of functional segregation and integration. To this end, we considered the well-known small-world
property which combines the presence of functionally specialized (segregated) modules with a robust
number of intermodular (integrating) links, and is found ubiquitous in brain networks [9].
The network efficiency can be used as a unified measure to define small-world networks for having
both the high global and local efficiency of parallel information transfer [10]. To investigate the effect
of connection density on network efficiency, we varied κ from 0.01 to 1 with an increment of 0.01. As
expected, the global efficiency increases with the increase of κ in the fMRI functional networks for both
tasks, as shown in Fig. 3.1(a)-(b)). This is because more edges facilitate more efficient information flows.
9

0.1 0.2 0.3 0.4 0.5 0.6 0.7 0.8 0.9 1
Edge Density
0
0.1
0.2
0.3
0.4
0.5
0.6
0.7
0.8
0.9
1
Netw
ork
Metr
ics
Language
Modularity
Efficiency
(a)
0.1 0.2 0.3 0.4 0.5 0.6 0.7 0.8 0.9 1
Edge Density
0
0.1
0.2
0.3
0.4
0.5
0.6
0.7
0.8
0.9
1
Netw
ork
Metr
ics
Motor
Modularity
Efficiency
(b)
0.1 0.2 0.3 0.4 0.5 0.6 0.7 0.8 0.9 1
Edge Density
0
0.1
0.2
0.3
Co
st-
Eff
icie
ncy
(c)
0.1 0.2 0.3 0.4 0.5 0.6 0.7 0.8 0.9 1
Edge Density
0
0.1
0.2
0.3
Cost-
Effic
iency
(d)
Figure 3.1: Effect of connection density on topological measures of fMRI functional brain networks for
language and motor tasks. (a)-(b) Global efficiency and modularity. (c)-(d) Cost-efficiency. The results
are averages over all subjects. Edge density κ = 0.25 gives the highest cost-efficiency.
However, addition of extra edges along with the increase of network cost κ, results in relatively modest
increments of network efficiency, as evident for κ > 0.5. Based on this observation, [6] proposed the so-
called cost-efficiency to quantify the economical, small-world property in brain functional networks (i.e.,
optimal in the sense of having high efficiency of information processing at low connection cost). More
precisely, the cost-efficiency is defined as the difference between global efficiency and topological cost,
which is typically positive and has a positive maximum value at a critical connection density. Using this
metric, we can find an optimal value for the threshold
κ∗ = arg maxκEglob(κ)− κ (1)
where Eglob = 1N
∑i
∑j:j 6=i (dij)
−1
N−1 is global efficiency, and dij is the shortest path length between nodes i
and j. In Fig. 3.1(c)-(d)), the plots of cost-efficiency versus κ suggest an optimal threshold according to
(1) at approximately κ∗ = 0.25 for both tasks, as indicated by the maximum value of cost-efficiency. The
proposed choice of κ = 0.25 is also within the small-word cost regime 0.15 ≤ κ ≤ 0.25 identified by [7] to
be appropriate for having fully-connected small-world brain networks, according to the classical metric
of small-worldness [11, 12]. In contrast to efficiency, the modularity index of the networks (Q ∈ [−0.5, 1]
linearly remapped to match the Eglob ∈ [0, 1]) drops with κ (Fig. 3.1(a)-(b))), indicating reduced modular
10

20 30 40 50
Window Length (TR)
0.4
0.5
0.6
0.7
Ra
nd
In
de
x
Language fMRI
(a)
20 30 40 50
Window Length (TR)
0.5
0.6
0.7
0.8
Ra
nd
In
de
x
Motor fMRI
(b)
Figure 3.2: Effect of window length on the tracking of dynamic modular connectivity states in language
and motor task fMRI data, as measured by RIs of the estimated and ground-truth state sequences over
subjects.
segregation due to denser inter-modular connections. An optimal tradeoff was identified at which Q =
Eglob, further supporting the proposed choice of κ = 0.25 in order to provide a balance between network
segregation and integration.
3.2 Effect of Window Length
Estimation of sliding-window correlations requires choosing an appropriate window length which is crucial:
Too short a window produces noisy estimates of the correlation measures when derived from fewer data
points, and introduces spurious fluctuations in the observed dynamic FC; Too long a window has low
sensitivity in detecting highly-localized genuine FC variations [13, 14]. To investigate the effect of window
length on the dynamic modular connectivity estimation, we examined time windows of 20, 30, 40 and 50
TRs (≈ 15, 22, 29 and 36 s for HCP data). Fig. 3.2 plots the Rand indices (RIs) between the estimated
and ground-truth (from experimental paradigm) state sequences as a function of window length for both
tasks. As expected, there were observable differences in the dynamic state identification performance at
different window lengths. We chose window length of 30 TRs which gives the highest RI of estimated
state dynamics, indicating optimal sensitivity and specificity in detecting dynamic modular connectivity
structure in these datasets. Nevertheless, the results suggest the estimates are fairly robust against the
choice of window size, as indicated by the relatively stable RIs over increasing window length. This
is also evident from the similar patterns of the estimated state-specific modular connection probability
matrices (based on multi-subject community detection) across different window lengths, as shown in
11

Story
20 TRs
Math
30 TRs
40 TRs
50 TRs
0
0.1
0.2
0.3
0.4
Figure 3.3: Effect of window length on the estimated state-based modular connection probability matrices
for language tasks.
Fig 3.3 (language task) and Fig 3.4 (motor task). This is probably because the inter-modular connection
probabilities are global summary measures of network connectivity (between communities) derived from
local connectivity (between nodes), which are relatively stable over time and thus less sensitive to varied
window length compared to node-wise dynamic connectivity.
3.3 Determining Number of States
Determining the number of states S is a critical problem in dynamic FC state identification. For task
fMRI as in our case, it is reasonable to assume that the number of dynamic community states corresponds
to the number of tasks in the experiments. Therefore, in the main text, we reported results by setting
S = 2 and S = 6 for the language and motor tasks, respectively. When S is unknown a priori (typically
for the resting-state data), we suggest a data-driven procedure to find S via the K-means clustering of the
time-varying modular connectivity matrices Θr,t
as an initial step. The optimal number of clusters can
be determined by cluster validity indices and serves as an estimate of S [15]. This is a common approach
to identifying unknown number of states for whole-brain dynamic FC in resting-state fMRI [16, 13]. As
in [17, 18, 19], we can also use the identified clusters to initialize the parameters of HMM states, where
12

Rest
20 TRs
Right-Hand Right-Foot Left-Hand Left-foot Tongue
30 TRs
40 TRs
50 TRs
0.2
0.25
0.3
0.35
0.4
0.45
Figure 3.4: Effect of window length on the estimated state-based modular connection probability matrices
for motor tasks.
each cluster represents a state in the Markov chain. For illustration, Table. 3.1 shows the selected S for
our task fMRI using the silhouette and Davies-Bouldin indices. The silhouette method is widely used in
dynamic FC studies, while the Davies-Bouldin index showed better performance in identifying S in both
simulation and real fMRI data among twenty four cluster indices tested recently in [15]. We evaluated
a range of candidates S ∈ 1, 2, . . . , Smax with Smax = 5 and Smax = 10 for the language and motor
tasks. Both indices yield reasonable estimates of S which are in close agreement with the number of tasks
especially for the motor task. A slightly better approximation was obtained with the subject-specific
community partition compared to the multi-subject. This was likely due to model fitting to individual
subjects which allows for varied dimensions of Θr,t
used in the clustering.
4 Convergence Analysis
We investigate the convergence behavior of the generalized Louvain algorithm for community detection in
multi-subject networks via the modularity maximization. Fig. 4.1 plots the modularity index Q computed
at each iteration of the algorithm on simulated networks. The modularity increases monotonically as
iteration increases, converging rapidly at first few iterations for both the single-layer and multilayer
community detection. Nevertheless, the algorithm for the multilayer modularity maximization shows
slightly faster convergence to a higher modularity value, due to pooling of shared information from
networks across subjects in the optimization to detect a common community structure.
13

Table 3.1: Means and standard deviations (in parenthesis) of selected number of states S in time-evolving
modular connectivity over individual subjects via cluster analysis.
Task fMRI Community PartitionCluster Validity Indices
Silhouette Davies-Bouldin
LanguageSubject-specific 3.19 (1.15) 3.23 (1.23)
Multi-subject 3.49 (1.20) 3.93 (1.20)
MotorSubject-specific 6.09 (2.90) 6.43 (3.14)
Multi-subject 6.20 (2.96) 6.66 (3.17)
1 2 3 4 5 6 7 8
Iterations
0
0.2
0.4
0.6
0.8
1
Modula
rity
Single-layer MM
Multilayer MM
Figure 4.1: Convergence behavior of generalized Louvain algorithm for single-subject and multi-subject
community detection on one realization of simulated networks with N = 120, K = 12 and R = 100. The
plot for single-subject analysis is average over R = 100 subjects.
5 Computational Time
In Table. 5.1, we compare the computational time of different algorithms in the community detection
and dynamic modular connectivity state identification for the language and motor tasks (using MATLAB
R2019a on MacBookPro laptop with 3.1 GHz Intel Core i5 CPU and 8 GB memory). The computational
time required to estimate community partition in functional networks over all subjects was substantially
lower in the group-level analysis compared to subject-specific analysis. This was probably due to the faster
convergence of the multilayer modularity maximization algorithm as shown in Fig. 4.1. As expected, the
use of HMM in identifying dynamic connectivity states was computationally more intensive than the
K-means clustering, which however gave more accurate tracking of dynamic states for both tasks (Fig. 9,
main text) and provided additional information on the temporal organization of the inferred brain states
specified by the state transition probability matrices (Fig. 7, main text). The computational cost for state
14

identification increased as the number of states and the dimension of the modular connectivity matrices
increase. Hence, the computational cost related to modeling motor tasks (with more states and a larger
number of detected communities) was substantially greater compared to that of the language tasks.
Table 5.1: Computational time (in seconds) for community detection (over all subjects) and dynamic
modular connectivity state identification (per subject) for the language and motor tasks using different
methods.
Task fMRICommunity Detection State Identification
Subject-Specific Multi-Subject K-means HMM
Language 13.06 0.22 0.0034 5.94
Motor 13.98 0.24 0.0062 45.99
References
[1] D. M. Barch, et al., “Function in the human connectome: Task-fMRI and individual differences in
behavior,” NeuroImage, vol. 80, pp. 169–189, oct 2013.
[2] J. R. Binder, et al., “Mapping anterior temporal lobe language areas with fMRI: A multicenter
normative study,” NeuroImage, vol. 54, no. 2, pp. 1465–1475, Jan 2011.
[3] M. F. Glasser, et al., “The minimal preprocessing pipelines for the human connectome project,”
NeuroImage, vol. 80, pp. 105–124, 2013.
[4] L. Fogassi and G. Luppino, “Motor functions of the parietal lobe,” Current Opinion in Neurobiology,
vol. 15, no. 6, pp. 626–631, 2005.
[5] B. Larsen and C. Aone, “Fast and effective text mining using linear-time document clustering,” in
5th ACM SIGKDD Int. Conf. Knowledge Discovery & Data Mining, 1999, pp. 16–22.
[6] S. Achard and E. Bullmore, “Efficiency and cost of economical brain functional networks,” PLoS
Comput. Biol., vol. 3, no. 2, pp. e17, 2007.
[7] D. S. Bassett, E. Bullmore, B. A. Verchinski, V. S. Mattay, D. R. Weinberger and A. Meyer-
Lindenberg, “Hierarchical organization of human cortical networks in health and schizophrenia,”
J. Neurosci., vol. 28, no. 37, pp. 9239–9248, 2008.
[8] E. T. Bullmore and D. S. Bassett, “Brain graphs: Graphical models of the human brain connectome,”
Annual Rev. Clinical Psychology, vol. 7, pp. 113–140, 2011.
[9] M. Rubinov and O. Sporns, “Complex network measures of brain connectivity: Uses and interpre-
tations,” NeuroImage, vol. 52, no. 3, pp. 1059–69, 2010.
15

[10] V. Latora and M. Marchiori, “Efficient behavior of small-world networks,” Phys. Rev. Lett., vol. 87,
no. 19, pp. 198701, 2001.
[11] M. D. Humphries, K. Gurney and T. J. Prescott, “The brainstem reticular formation is a small-world,
not scale-free, network,” Proc. Royal Soc. B: Biol. Sci., vol. 273, no. 1585, pp. 503–511, 2006.
[12] D. J. Watts and S. H. Strogatz, “Collective dynamics of small-world networks,” Nature, vol. 393,
no. 6684, pp. 440–442, 1998.
[13] S. Shakil, C.-H. Lee and S. D. Keilholz, “Evaluation of sliding window correlation performance for
characterizing dynamic functional connectivity and brain states,” NeuroImage, vol. 133, pp. 111–128,
2016.
[14] M. G. Preti, T. A. Bolton and D. Van De Ville, “The dynamic functional connectome: State-of-the-
art and perspectives,” NeuroImage, vol. 160, pp. 41–54, 2017.
[15] V. M. Vergara, M. Salman, A. Abrol, F. A. Espinoza and V. D. Calhoun, “Determining the number
of states in dynamic functional connectivity using cluster validity indexes,” J. Neurosci. Methods, p.
108651, 2020.
[16] E. A. Allen, E. Damaraju, S. M. Plis, E. B. Erhardt, T. Eichele and V. D. Calhoun, “Tracking
whole-brain connectivity dynamics in the resting state,” Cereb. Cortex, vol. 24, no. 3, pp. 663–676,
2012.
[17] S. B. Samdin, C. M. Ting, H. Ombao and S. H. Salleh, “A unified estimation framework for state-
related changes in effective brain connectivity,” IEEE Trans. Biomed. Eng., vol. 64, no. 4, pp.
844–858, 2017.
[18] C. M. Ting, H. Ombao, S. B. Samdin and S. H. Salleh, “Estimating dynamic connectivity states
in fMRI using regime-switching factor models,” IEEE Trans. Med. Imaging, vol. 37, no. 4, pp.
1011–1023, 2018.
[19] H. Ombao, C.-M. Fiecas, M.and Ting and Y. F. Low, “Statistical models for brain signals with
properties that evolve across trials,” NeuroImage, vol. 180, pp. 609–618, 2018.
16