detailed project report namkeen business under …
TRANSCRIPT
PM FME- Detailed Project Report of Namkeen Business
1
DETAILED PROJECT REPORT
NAMKEEN BUSINESS
UNDER PMFME SCHEME
National Institute of Food Technology Entrepreneurship and Management
Ministry of Food Processing Industries
Plot No.97, Sector-56, HSIIDC, Industrial Estate, Kundli, Sonipat, Haryana-131028
Website: http://www.niftem.ac.in
Email: [email protected]
Call: 0130-2281089
PM FME- Detailed Project Report of Namkeen Business
2
TABLE OF CONTENTS
S No. Topic Page Number
1. Project Summary 3
2. About the Product 4-5
3. Process Flow Chart 6-7
4. Economics of the Project 8-25
4.1. Basis & Presumptions 8
4.2. Capacity , Utilisation, Production & Output 9-10
4.3. Premises/Infrastructure 11
4.4. Machinery & Equipments 11-13
4.5. Misc. Fixed Assets 13
4.6. Total Cost of Project 14
4.7. Means of Finance 14
4.8 Term Loan 14
4.9. Term Loan repayment & interest schedule 15-18
4.10. Working Capital Calculations 18
4.11. Salaries/Wages 19
4.12. Power Requirement 19
4.13. Depreciation Calculation 20
4.14. Repairs & Maintenance 20
4.15. Projections of Profitability Analysis 21
4.16. Break Even Point Analysis 22
4.17. Projected Balance Sheet 23
4.18. Cash- Flow Statement 24
4.19. Debt-Service Coverage Ratio 25
PM FME- Detailed Project Report of Namkeen Business
3
1. PROJECT SUMMARY
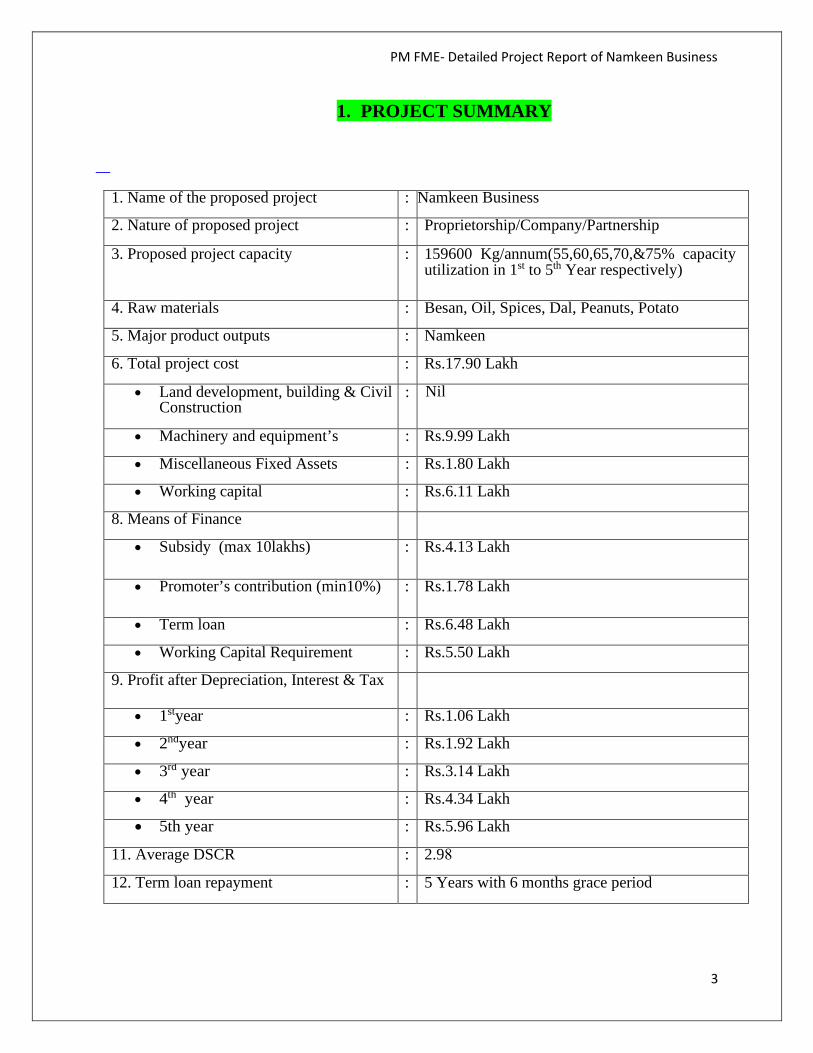
1. Name of the proposed project : Namkeen Business
2. Nature of proposed project : Proprietorship/Company/Partnership
3. Proposed project capacity : 159600 Kg/annum(55,60,65,70,&75% capacity utilization in 1st to 5th Year respectively)
4. Raw materials : Besan, Oil, Spices, Dal, Peanuts, Potato
5. Major product outputs : Namkeen
6. Total project cost : Rs.17.90 Lakh
• Land development, building & CivilConstruction
: Nil
• Machinery and equipment’s : Rs.9.99 Lakh
• Miscellaneous Fixed Assets : Rs.1.80 Lakh
• Working capital : Rs.6.11 Lakh
8. Means of Finance
• Subsidy (max 10lakhs) : Rs.4.13 Lakh
• Promoter’s contribution (min10%) : Rs.1.78 Lakh
• Term loan : Rs.6.48 Lakh
• Working Capital Requirement : Rs.5.50 Lakh
9. Profit after Depreciation, Interest & Tax
• 1styear : Rs.1.06 Lakh
• 2ndyear : Rs.1.92 Lakh
• 3rd year : Rs.3.14 Lakh
• 4th year : Rs.4.34 Lakh
• 5th year : Rs.5.96 Lakh
11. Average DSCR : 2.98
12. Term loan repayment : 5 Years with 6 months grace period
PM FME- Detailed Project Report of Namkeen Business
4
2. ABOUT THE PRODUCT
2.1. PRODUCT INTRODUCTION:
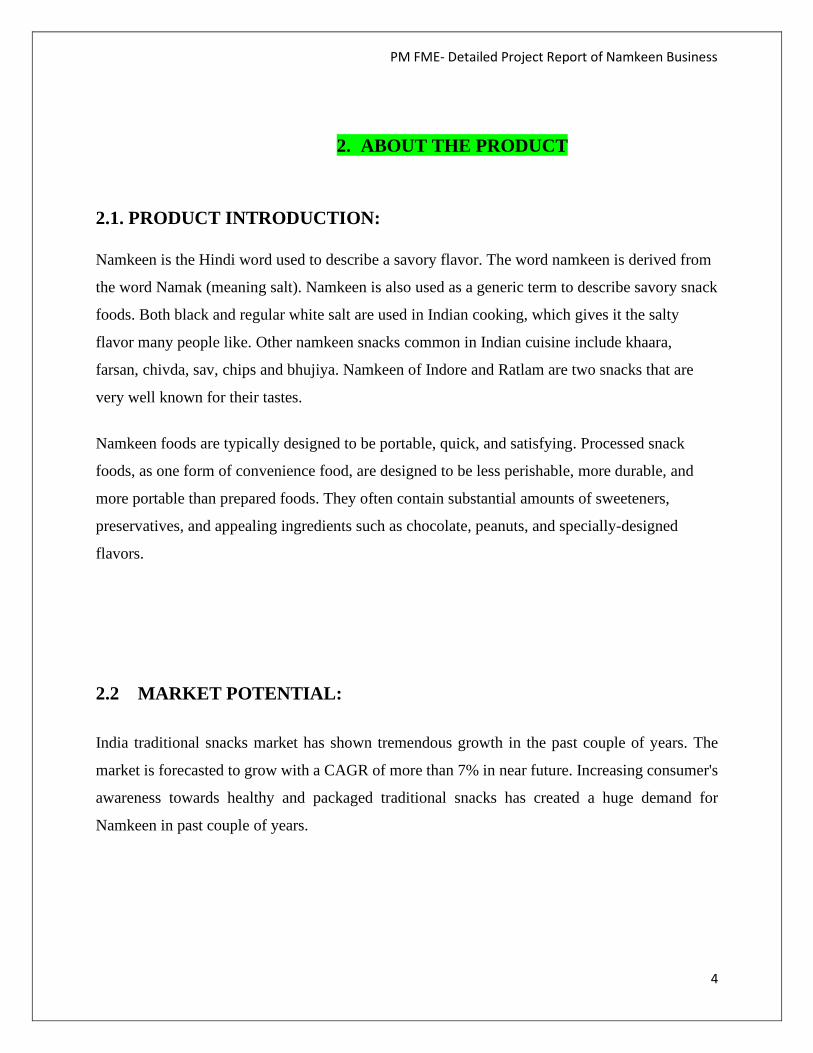
Namkeen is the Hindi word used to describe a savory flavor. The word namkeen is derived from
the word Namak (meaning salt). Namkeen is also used as a generic term to describe savory snack
foods. Both black and regular white salt are used in Indian cooking, which gives it the salty
flavor many people like. Other namkeen snacks common in Indian cuisine include khaara,
farsan, chivda, sav, chips and bhujiya. Namkeen of Indore and Ratlam are two snacks that are
very well known for their tastes.
Namkeen foods are typically designed to be portable, quick, and satisfying. Processed snack
foods, as one form of convenience food, are designed to be less perishable, more durable, and
more portable than prepared foods. They often contain substantial amounts of sweeteners,
preservatives, and appealing ingredients such as chocolate, peanuts, and specially-designed
flavors.
2.2 MARKET POTENTIAL:
India traditional snacks market has shown tremendous growth in the past couple of years. The
market is forecasted to grow with a CAGR of more than 7% in near future. Increasing consumer's
awareness towards healthy and packaged traditional snacks has created a huge demand for
Namkeen in past couple of years.
PM FME- Detailed Project Report of Namkeen Business
5
Namkeen is the dominant segment, followed by the Extruded Snacks. The market is also
segmented into organized and unorganized sector of which unorganized is the dominant market.
The India Snacks Market will be more than INR 1 Billion by the end of 2024. At present
Unorganized market is dominating the India snacks market. But this scenario is expected to change
during the forecast period of 2020-2024. India Snacks Market is growing due to following factors
Lifestyle Changes, Rising Urbanization, Growing Middle Class Population, Local Availability and
Availability of Snacks in Small Package Size, Low Price and Company’s Strategies to focus on
regional taste
2.3 RAW MATERIAL DESCRIPTION:
Key indgredients for this product are:
• Besan
• Oil
• Spices
• Dal
• Peanut
• Potato

PM FME- Detailed Project Report of Namkeen Business
6
3. PROCESS FLOW CHART
Procurement of raw material.
Preparation of dough with the help of dough mixer.
Then with the help of Bhujia machine extruder convert the dough into the shape of required
namkeen.
After that take it into the frying section.
Drying of namkeen
After frying, mix all the other ingredients like: peanut, spices etc. as per the different taste
of the namkeen.
Seasoning of namkeen with the help of seasoning machine.
Packaging of goods.
Transportation

PM FME- Detailed Project Report of Namkeen Business
7
PM FME- Detailed Project Report of Namkeen Business
8
4. ECONOMICS OF THE PROJECT
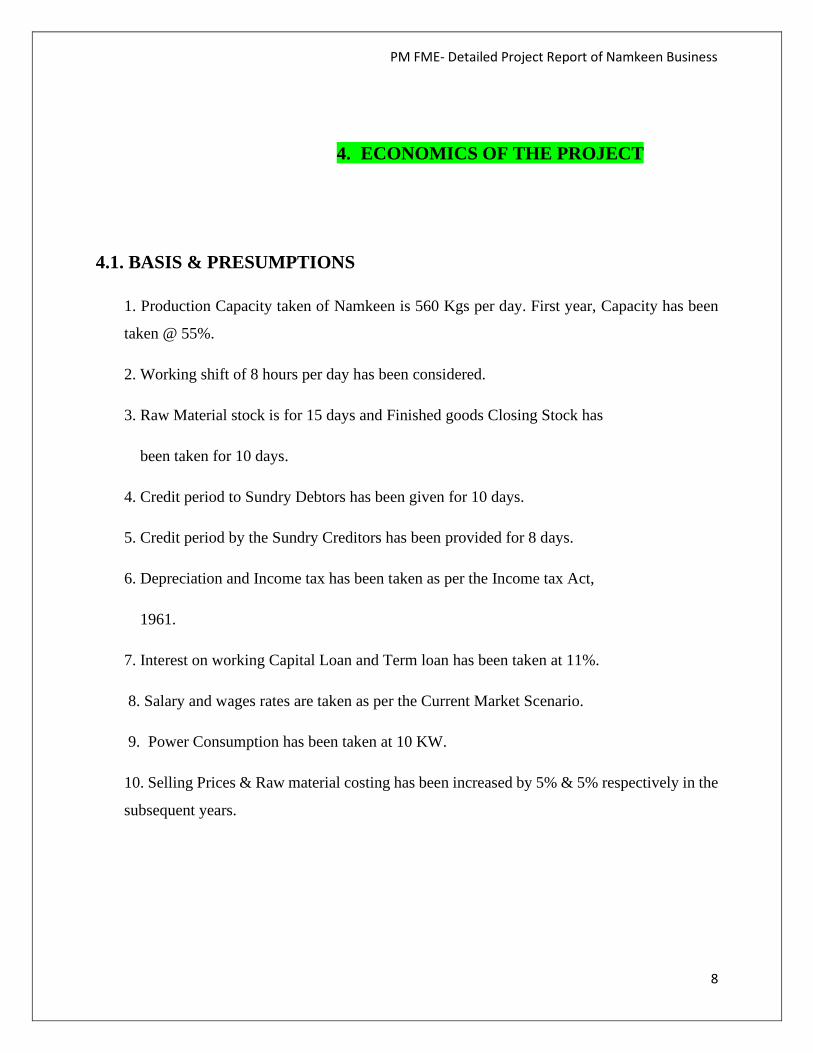
4.1. BASIS & PRESUMPTIONS
1. Production Capacity taken of Namkeen is 560 Kgs per day. First year, Capacity has been
taken @ 55%.
2. Working shift of 8 hours per day has been considered.
3. Raw Material stock is for 15 days and Finished goods Closing Stock has
been taken for 10 days.
4. Credit period to Sundry Debtors has been given for 10 days.
5. Credit period by the Sundry Creditors has been provided for 8 days.
6. Depreciation and Income tax has been taken as per the Income tax Act,
1961.
7. Interest on working Capital Loan and Term loan has been taken at 11%.
8. Salary and wages rates are taken as per the Current Market Scenario.
9. Power Consumption has been taken at 10 KW.
10. Selling Prices & Raw material costing has been increased by 5% & 5% respectively in the
subsequent years.
PM FME- Detailed Project Report of Namkeen Business
9
4.2. CAPACITY, UTILIZATION, PRODUCTION & OUTPUT
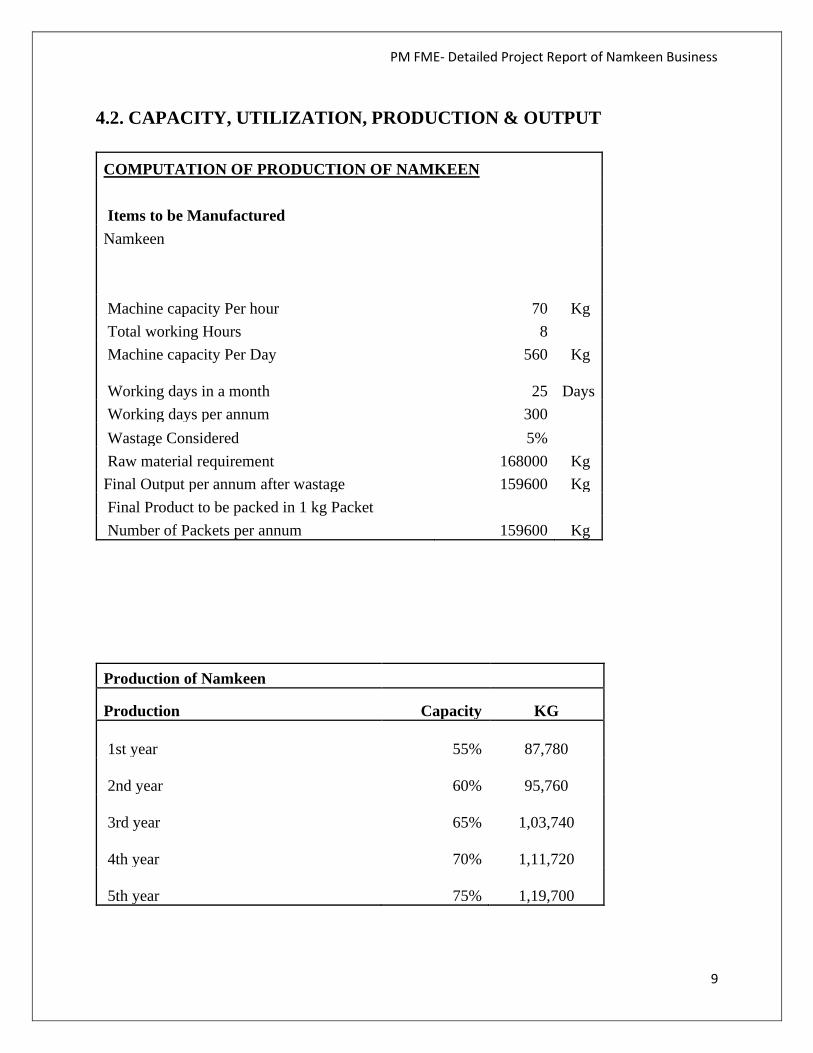
COMPUTATION OF PRODUCTION OF NAMKEEN Items to be Manufactured Namkeen
Machine capacity Per hour 70 Kg Total working Hours 8 Machine capacity Per Day 560 Kg
Working days in a month 25
Days Working days per annum 300 Wastage Considered 5% Raw material requirement 168000 Kg Final Output per annum after wastage 159600 Kg Final Product to be packed in 1 kg Packet Number of Packets per annum 159600 Kg
Production of Namkeen
Production Capacity KG
1st year 55%
87,780
2nd year 60%
95,760
3rd year 65%
1,03,740
4th year 70%
1,11,720
5th year 75%
1,19,700
PM FME- Detailed Project Report of Namkeen Business
10
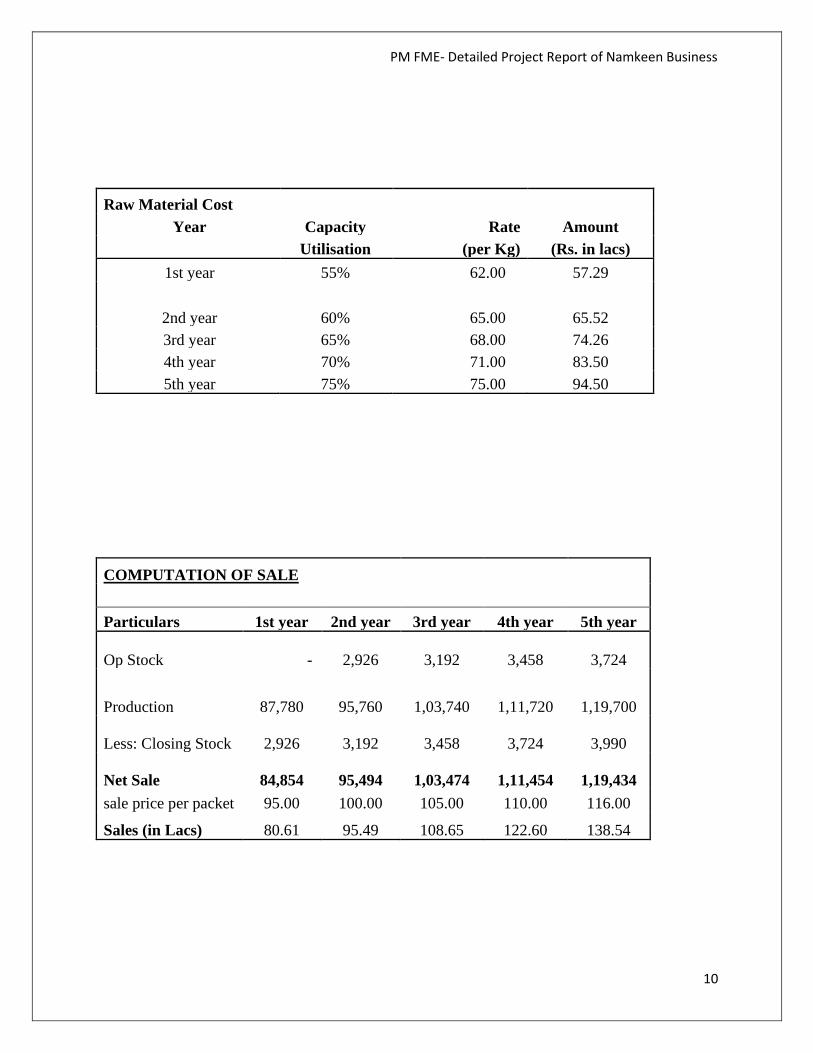
Raw Material Cost Year Capacity Rate Amount
Utilisation (per Kg) (Rs. in lacs) 1st year 55% 62.00 57.29
2nd year 60% 65.00 65.52 3rd year 65% 68.00 74.26 4th year 70% 71.00 83.50 5th year 75% 75.00 94.50
COMPUTATION OF SALE Particulars 1st year 2nd year 3rd year 4th year 5th year
Op Stock -
2,926
3,192
3,458
3,724
Production
87,780
95,760
1,03,740
1,11,720
1,19,700
Less: Closing Stock
2,926
3,192
3,458
3,724
3,990
Net Sale
84,854
95,494
1,03,474
1,11,454
1,19,434 sale price per packet 95.00 100.00 105.00 110.00 116.00
Sales (in Lacs) 80.61 95.49 108.65 122.60 138.54
PM FME- Detailed Project Report of Namkeen Business
11
4.3. PREMISES/INFRASTRUCTURE
The approximate total area required for complete factory setup is 1200-1500 Sq. ft. for smooth
production including storage area. It is expected that the premises will be on rental.
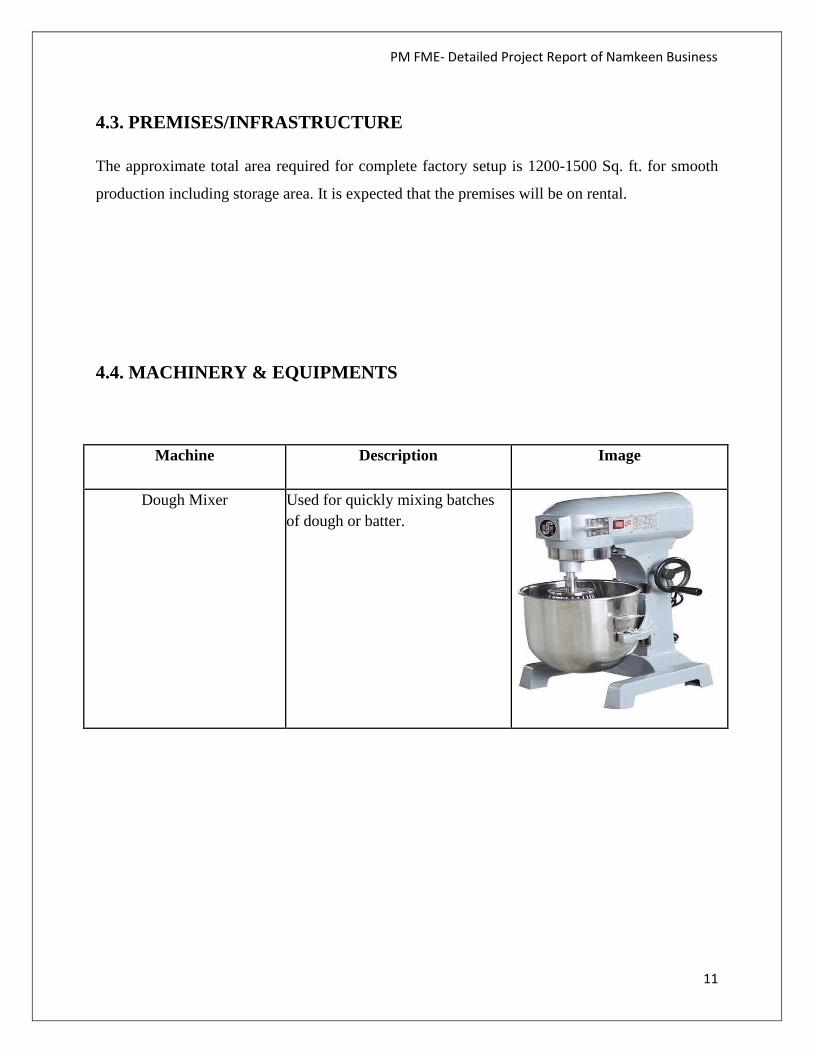
4.4. MACHINERY & EQUIPMENTS
Machine Description Image
Dough Mixer Used for quickly mixing batches of dough or batter.
PM FME- Detailed Project Report of Namkeen Business
12
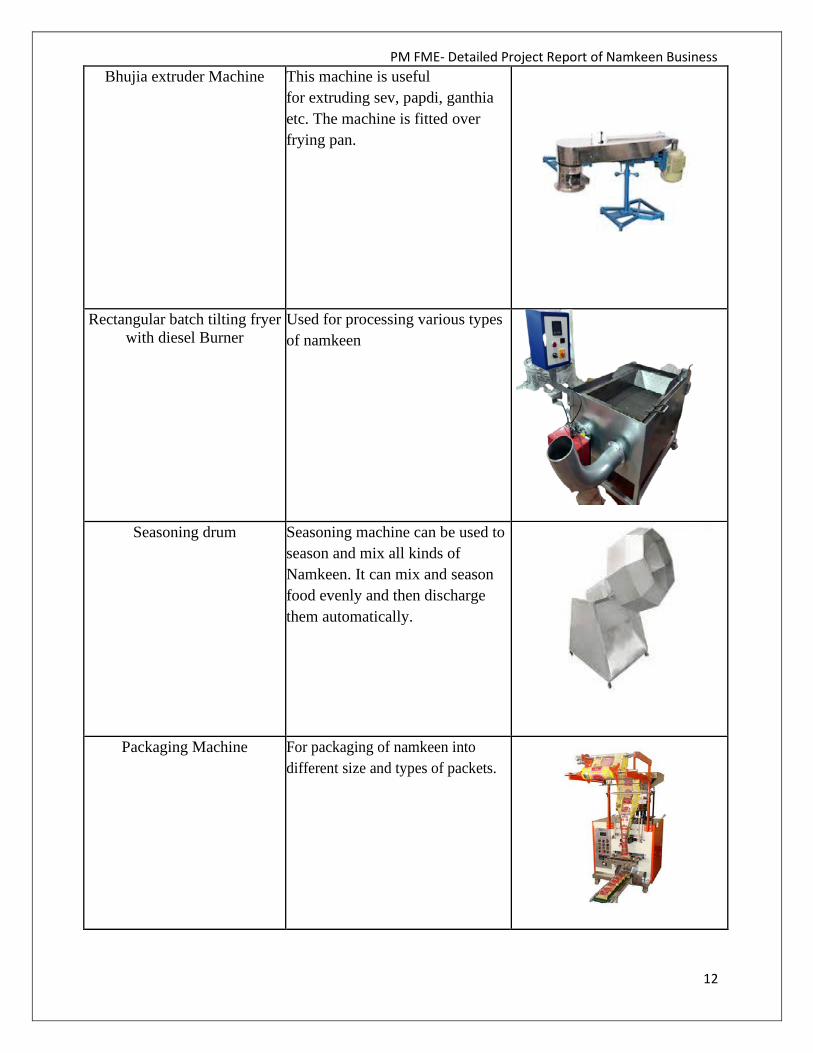
Bhujia extruder Machine This machine is useful for extruding sev, papdi, ganthia etc. The machine is fitted over frying pan.
Rectangular batch tilting fryer with diesel Burner
Used for processing various types of namkeen
Seasoning drum Seasoning machine can be used to season and mix all kinds of Namkeen. It can mix and season food evenly and then discharge them automatically.
Packaging Machine For packaging of namkeen into different size and types of packets.
PM FME- Detailed Project Report of Namkeen Business
13
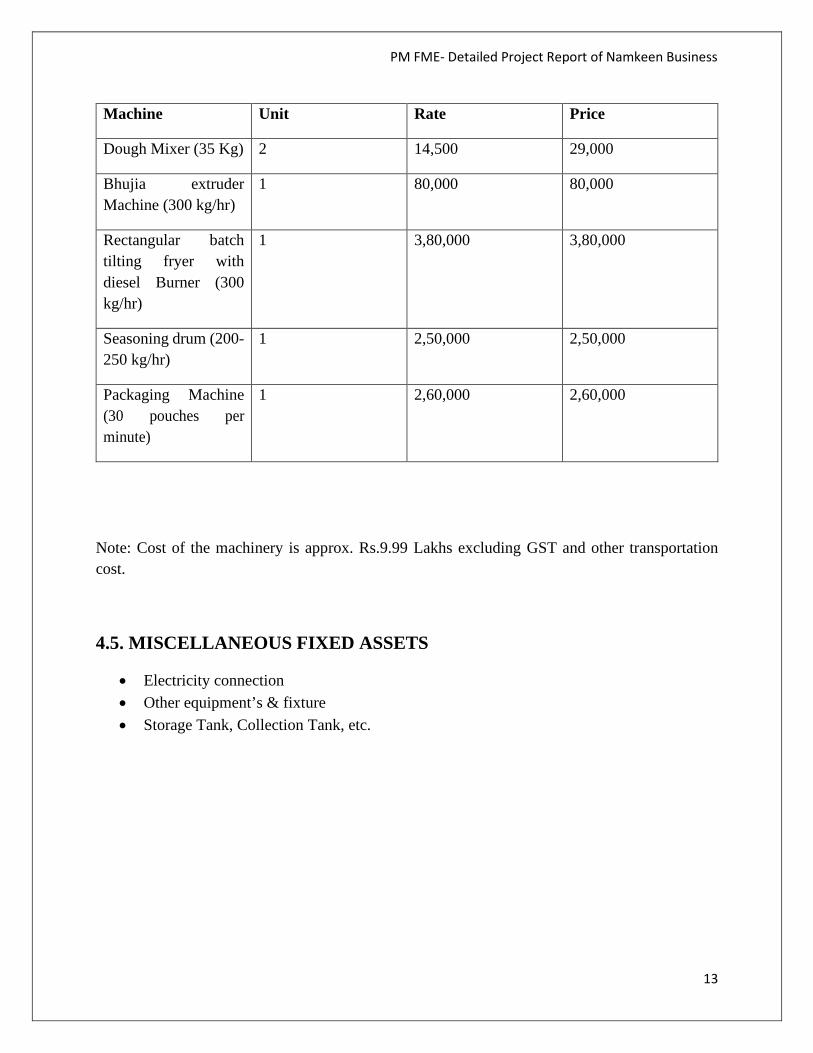
Machine Unit Rate Price
Dough Mixer (35 Kg) 2 14,500 29,000
Bhujia extruder Machine (300 kg/hr)
1 80,000 80,000
Rectangular batch tilting fryer with diesel Burner (300 kg/hr)
1 3,80,000 3,80,000
Seasoning drum (200-250 kg/hr)
1 2,50,000 2,50,000
Packaging Machine (30 pouches per minute)
1 2,60,000 2,60,000
Note: Cost of the machinery is approx. Rs.9.99 Lakhs excluding GST and other transportation cost.
4.5. MISCELLANEOUS FIXED ASSETS
• Electricity connection • Other equipment’s & fixture • Storage Tank, Collection Tank, etc.
PM FME- Detailed Project Report of Namkeen Business
14
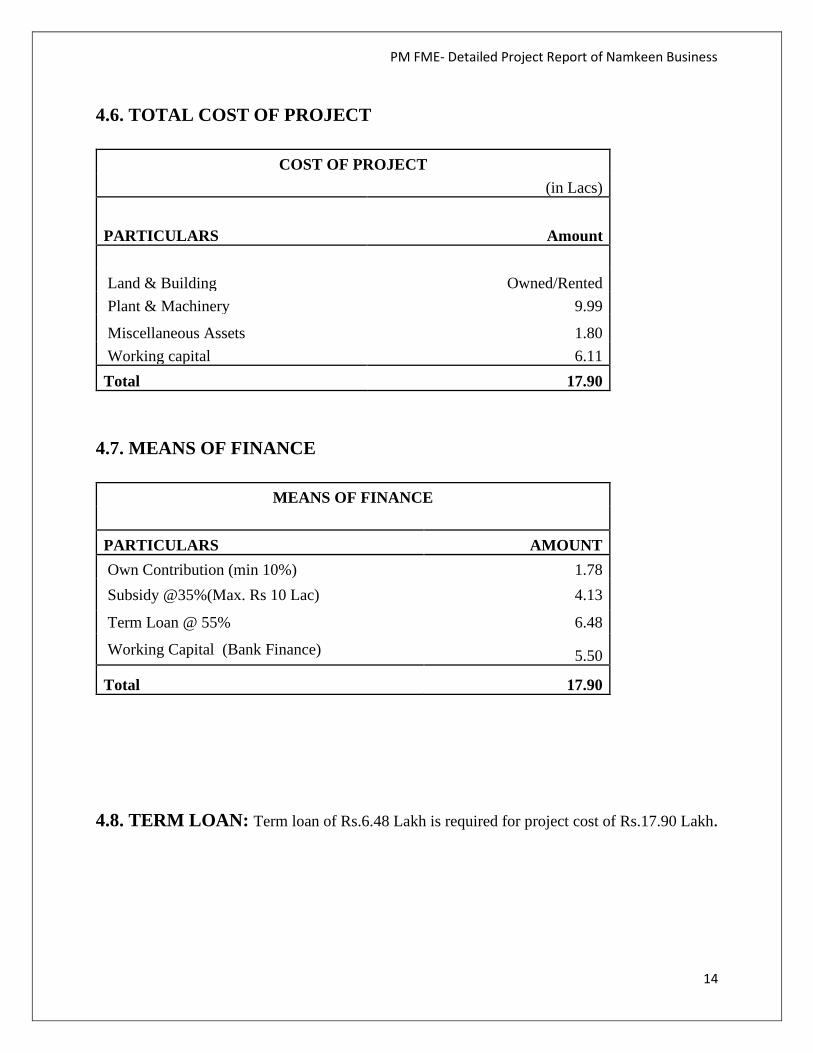
4.6. TOTAL COST OF PROJECT
COST OF PROJECT (in Lacs)
PARTICULARS Amount Land & Building Owned/Rented Plant & Machinery 9.99
Miscellaneous Assets 1.80 Working capital 6.11 Total 17.90
4.7. MEANS OF FINANCE
MEANS OF FINANCE
PARTICULARS AMOUNT Own Contribution (min 10%) 1.78 Subsidy @35%(Max. Rs 10 Lac) 4.13
Term Loan @ 55% 6.48
Working Capital (Bank Finance) 5.50
Total 17.90
4.8. TERM LOAN: Term loan of Rs.6.48 Lakh is required for project cost of Rs.17.90 Lakh.
PM FME- Detailed Project Report of Namkeen Business
15
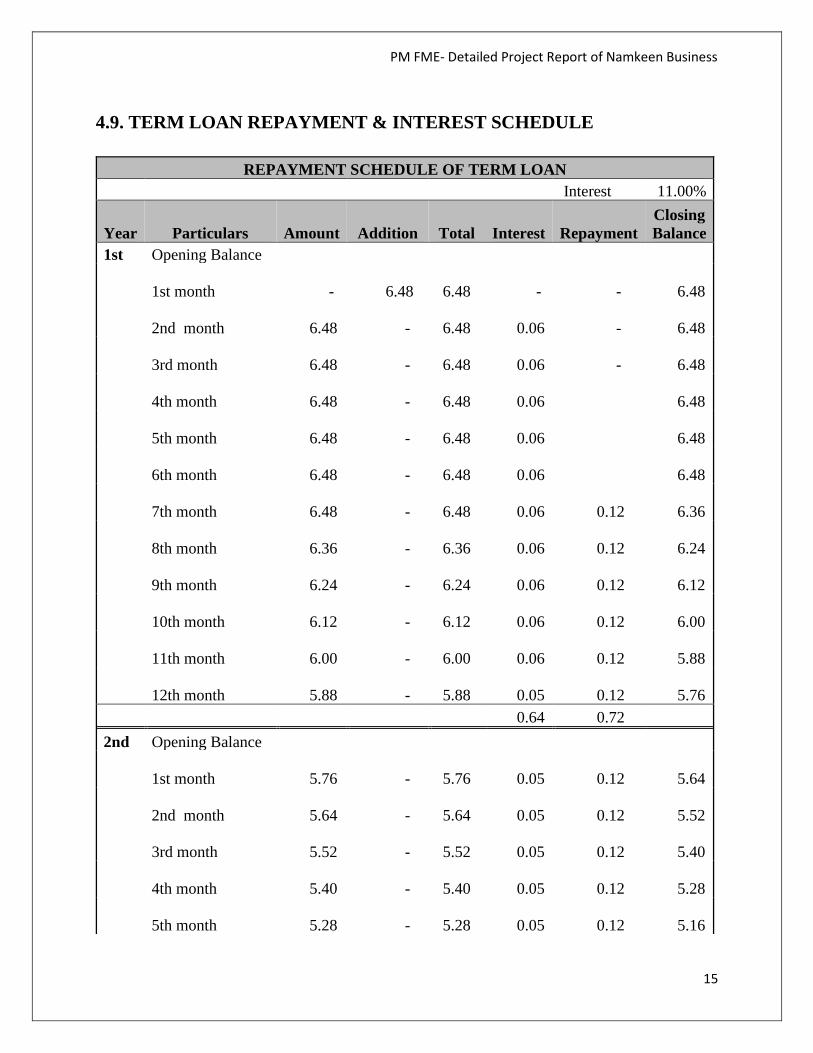
4.9. TERM LOAN REPAYMENT & INTEREST SCHEDULE
REPAYMENT SCHEDULE OF TERM LOAN Interest 11.00%
Year Particulars Amount Addition Total Interest
Repayment Closing Balance
1st Opening Balance
1st month - 6.48
6.48 - - 6.48
2nd month 6.48 -
6.48 0.06 - 6.48
3rd month 6.48 -
6.48 0.06 - 6.48
4th month 6.48 -
6.48 0.06 6.48
5th month 6.48 -
6.48 0.06 6.48
6th month 6.48 -
6.48 0.06 6.48
7th month 6.48 -
6.48 0.06 0.12 6.36
8th month 6.36 -
6.36 0.06 0.12 6.24
9th month 6.24 -
6.24 0.06 0.12 6.12
10th month 6.12 -
6.12 0.06 0.12 6.00
11th month 6.00 -
6.00 0.06 0.12 5.88
12th month 5.88 -
5.88 0.05 0.12 5.76 0.64 0.72 2nd Opening Balance
1st month 5.76 -
5.76 0.05 0.12 5.64
2nd month 5.64 -
5.64 0.05 0.12 5.52
3rd month 5.52 -
5.52 0.05 0.12 5.40
4th month 5.40 -
5.40 0.05 0.12 5.28
5th month 5.28 -
5.28 0.05 0.12 5.16
PM FME- Detailed Project Report of Namkeen Business
16
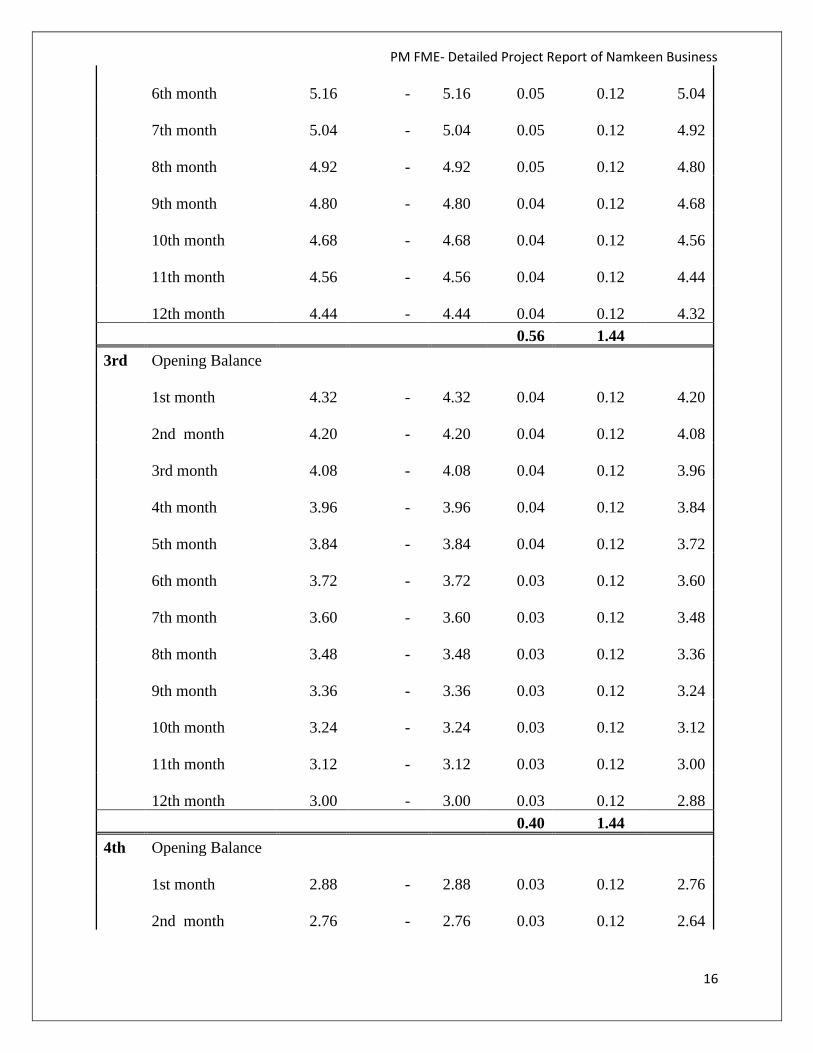
6th month 5.16 -
5.16 0.05 0.12 5.04
7th month 5.04 -
5.04 0.05 0.12 4.92
8th month 4.92 -
4.92 0.05 0.12 4.80
9th month 4.80 -
4.80 0.04 0.12 4.68
10th month 4.68 -
4.68 0.04 0.12 4.56
11th month 4.56 -
4.56 0.04 0.12 4.44
12th month 4.44 -
4.44 0.04 0.12 4.32 0.56 1.44 3rd Opening Balance
1st month 4.32 -
4.32 0.04 0.12 4.20
2nd month 4.20 -
4.20 0.04 0.12 4.08
3rd month 4.08 -
4.08 0.04 0.12 3.96
4th month 3.96 -
3.96 0.04 0.12 3.84
5th month 3.84 -
3.84 0.04 0.12 3.72
6th month 3.72 -
3.72 0.03 0.12 3.60
7th month 3.60 -
3.60 0.03 0.12 3.48
8th month 3.48 -
3.48 0.03 0.12 3.36
9th month 3.36 -
3.36 0.03 0.12 3.24
10th month 3.24 -
3.24 0.03 0.12 3.12
11th month 3.12 -
3.12 0.03 0.12 3.00
12th month 3.00 -
3.00 0.03 0.12 2.88 0.40 1.44 4th Opening Balance
1st month 2.88 -
2.88 0.03 0.12 2.76
2nd month 2.76 -
2.76 0.03 0.12 2.64

PM FME- Detailed Project Report of Namkeen Business
17
3rd month 2.64 -
2.64 0.02 0.12 2.52
4th month 2.52 -
2.52 0.02 0.12 2.40
5th month 2.40 -
2.40 0.02 0.12 2.28
6th month 2.28 -
2.28 0.02 0.12 2.16
7th month 2.16 -
2.16 0.02 0.12 2.04
8th month 2.04 -
2.04 0.02 0.12 1.92
9th month 1.92 -
1.92 0.02 0.12 1.80
10th month 1.80 -
1.80 0.02 0.12 1.68
11th month 1.68 -
1.68 0.02 0.12 1.56
12th month 1.56 -
1.56 0.01 0.12 1.44 0.24 1.44 5th Opening Balance
1st month 1.44 -
1.44 0.01 0.12 1.32
2nd month 1.32 -
1.32 0.01 0.12 1.20
3rd month 1.20 -
1.20 0.01 0.12 1.08
4th month 1.08 -
1.08 0.01 0.12 0.96
5th month 0.96 -
0.96 0.01 0.12 0.84
6th month 0.84 -
0.84 0.01 0.12 0.72
7th month 0.72 -
0.72 0.01 0.12 0.60
8th month 0.60 -
0.60 0.01 0.12 0.48
9th month 0.48 -
0.48 0.00 0.12 0.36
10th month 0.36 -
0.36 0.00 0.12 0.24
11th month 0.24 -
0.24 0.00 0.12 0.12
12th month 0.12 -
0.12 0.00 0.12 - 0.09 1.44
PM FME- Detailed Project Report of Namkeen Business
18
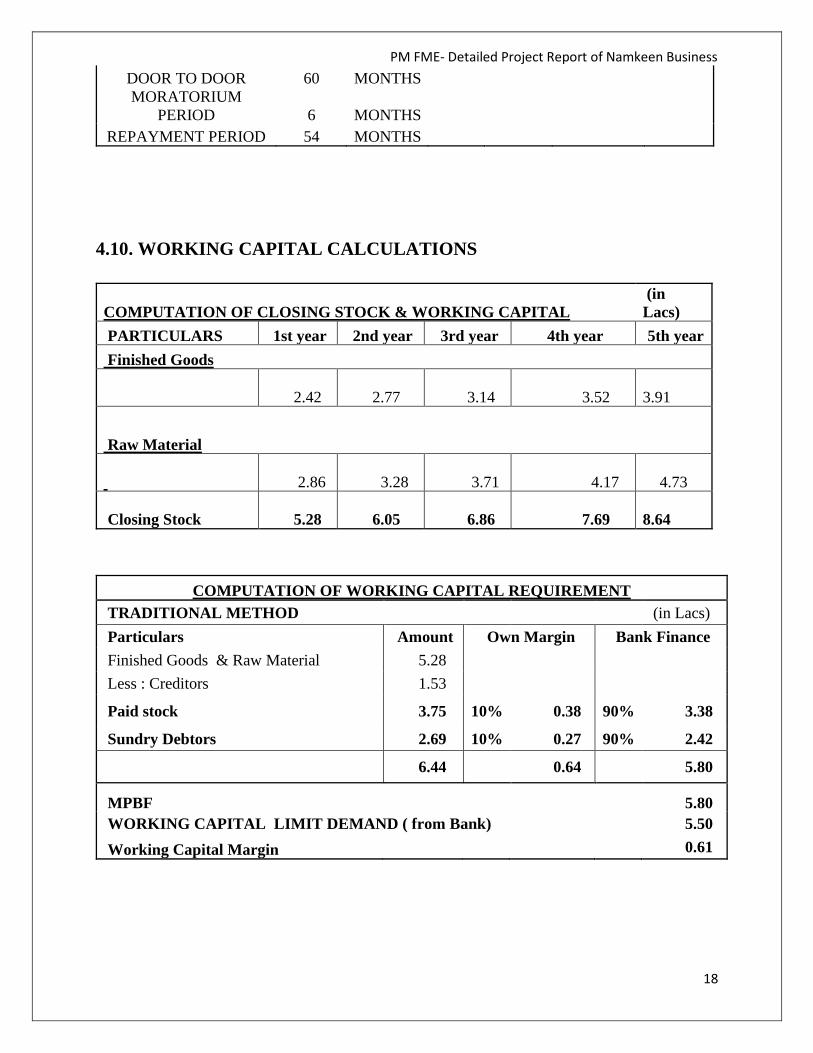
DOOR TO DOOR 60 MONTHS MORATORIUM
PERIOD 6 MONTHS REPAYMENT PERIOD 54 MONTHS
4.10. WORKING CAPITAL CALCULATIONS
COMPUTATION OF CLOSING STOCK & WORKING CAPITAL (in Lacs)
PARTICULARS 1st year 2nd year 3rd year 4th year 5th year Finished Goods
2.42 2.77 3.14 3.52 3.91
Raw Material
2.86 3.28 3.71 4.17
4.73
Closing Stock 5.28 6.05 6.86 7.69 8.64
COMPUTATION OF WORKING CAPITAL REQUIREMENT TRADITIONAL METHOD (in Lacs) Particulars Amount Own Margin Bank Finance Finished Goods & Raw Material 5.28 Less : Creditors 1.53
Paid stock 3.75 10% 0.38 90% 3.38
Sundry Debtors 2.69 10% 0.27 90% 2.42
6.44 0.64 5.80
MPBF 5.80 WORKING CAPITAL LIMIT DEMAND ( from Bank) 5.50 Working Capital Margin 0.61

PM FME- Detailed Project Report of Namkeen Business
19
4.11. SALARY & WAGES
BREAK UP OF LABOUR CHARGES Particulars Wages No of Total Rs. per Month Employees Salary
Skilled (in thousand rupees) 14,000 2 28,000 Unskilled (in thousand rupees) 8,500 1 8,500
Total salary per month 36,500 Total annual labour charges (in lacs) 4.38
BREAK UP OF STAFF SALARY CHARGES Particulars Salary No of Total Rs. per Month Employees Salary Helper 7,000 1 7,000
Accountant 18,000 1 18,000
Total salary per month 25,000
Total annual Staff charges (in lacs) 3.00
4.12 POWER REQUIREMENT
Utility Charges (per month) Particulars value Description Power connection required 10 KWH consumption per day 80 units
Consumption per month 2,000 units Rate per Unit 10 Rs. power Bill per month 20,000 Rs.
PM FME- Detailed Project Report of Namkeen Business
20
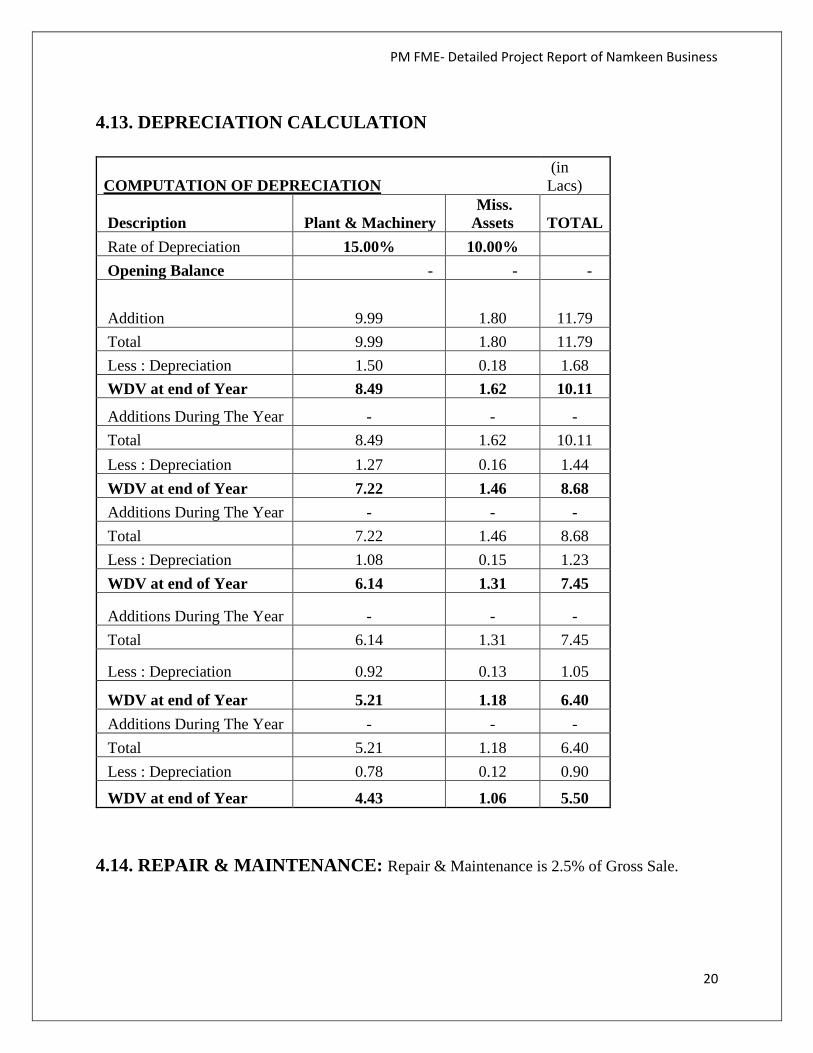
4.13. DEPRECIATION CALCULATION
COMPUTATION OF DEPRECIATION (in Lacs)
Description Plant & Machinery Miss. Assets
TOTAL
Rate of Depreciation 15.00% 10.00% Opening Balance - - -
Addition 9.99 1.80 11.79 Total 9.99 1.80 11.79 Less : Depreciation 1.50 0.18 1.68 WDV at end of Year 8.49 1.62 10.11
Additions During The Year - - - Total 8.49 1.62 10.11 Less : Depreciation 1.27 0.16 1.44 WDV at end of Year 7.22 1.46 8.68 Additions During The Year - - - Total 7.22 1.46 8.68 Less : Depreciation 1.08 0.15 1.23 WDV at end of Year 6.14 1.31 7.45
Additions During The Year - - - Total 6.14 1.31 7.45
Less : Depreciation 0.92 0.13 1.05
WDV at end of Year 5.21 1.18 6.40 Additions During The Year - - - Total 5.21 1.18 6.40 Less : Depreciation 0.78 0.12 0.90
WDV at end of Year 4.43 1.06 5.50
4.14. REPAIR & MAINTENANCE: Repair & Maintenance is 2.5% of Gross Sale.

PM FME- Detailed Project Report of Namkeen Business
21
4.15. PROJECTIONS OF PROFITABILITY ANALYSIS
PROJECTED PROFITABILITY STATEMENT (in Lacs)
PARTICULARS 1st year 2nd year
3rd year
4th year 5th year
Capacity Utilisation % 55% 60% 65% 70% 75%
SALES Gross Sale Namkeen 80.61 95.49 108.65 122.60 138.54 Total 80.61 95.49 108.65 122.60 138.54 COST OF SALES Raw Material Consumed 57.29 65.52 74.26 83.50 94.50 Electricity Expenses 2.40 2.76 3.17 3.65 4.02 Depreciation 1.68 1.44 1.23 1.05 0.90 Wages & labour 4.38 4.82 5.30 5.72 6.18 Repair & maintenance 2.02 2.39 2.72 3.06 3.46 Packaging 4.76 6.21 7.61 8.58 8.31
Cost of Production 72.52 83.13 94.28 105.57 117.37 Add: Opening Stock /WIP - 2.42 2.77 3.14 3.52
Less: Closing Stock /WIP 2.42 2.77 3.14 3.52 3.91 Cost of Sales 70.10 82.77 93.91 105.19 116.98 GROSS PROFIT 10.51 12.72 14.74 17.41 21.56 13.04% 13.32% 13.57% 14.20% 15.56% Salary to Staff 3.00 3.48 4.25 4.88 5.37 Interest on Term Loan 0.64 0.56 0.40 0.24 0.09 Interest on working Capital 0.61 0.61 0.61 0.61 0.61 Rent 3.60 3.96 4.36 4.79 5.27 selling & adm exp 1.61 2.20 1.96 2.45 3.88 TOTAL 9.45 10.80 11.57 12.98 15.21 NET PROFIT 1.06 1.92 3.17 4.43 6.35 1.31% 2.01% 2.92% 3.62% 4.58% Taxation - - 0.03 0.10 0.40 PROFIT (After Tax) 1.06 1.92 3.14 4.34 5.96

PM FME- Detailed Project Report of Namkeen Business
22
4.16. BREAK EVEN POINT ANALYSIS
BREAK EVEN POINT ANALYSIS Year I II III IV V Net Sales & Other Income 80.61 95.49 108.65 122.60 138.54 Less : Op. WIP Goods - 2.42 2.77 3.14 3.52 Add : Cl. WIP Goods 2.42 2.77 3.14 3.52 3.91 Total Sales 83.03 95.85 109.02 122.98 138.94 Variable & Semi Variable Exp. Raw Material Consumed 57.29 65.52 74.26 83.50 94.50 Electricity Exp/Coal Consumption at 85% 2.04 2.35 2.70 3.10 3.41 Wages & Salary at 60% 4.43 4.98 5.73 6.36 6.93 Selling & adminstrative Expenses 80% 1.29 1.76 1.56 1.96 3.10 Interest on working Capital 0.605 0.605 0.605 0.605 0.605 Repair & maintenance 2.02 2.39 2.72 3.06 3.46 Packaging 4.76 6.21 7.61 8.58 8.31 Total Variable & Semi Variable Exp 72.42 83.80 95.17 107.18 120.33 Contribution 10.61 12.05 13.85 15.80 18.61 Fixed & Semi Fixed Expenses Electricity Exp/Coal Consumption at 15% 0.36 0.41 0.48 0.55 0.60 Wages & Salary at 40% 2.95 3.32 3.82 4.24 4.62 Interest on Term Loan 0.64 0.56 0.40 0.24 0.09 Depreciation 1.68 1.44 1.23 1.05 0.90 Selling & adminstrative Expenses 20% 0.32 0.44 0.39 0.49 0.78 Rent 3.60 3.96 4.36 4.79 5.27 Total Fixed Expenses 9.55 10.13 10.67 11.37 12.26 Capacity Utilization 55% 60% 65% 70% 75% OPERATING PROFIT 1.06 1.92 3.17 4.43 6.35 BREAK EVEN POINT 50% 50% 50% 50% 49% BREAK EVEN SALES 74.76 80.60 84.03 88.48 91.51
PM FME- Detailed Project Report of Namkeen Business
23
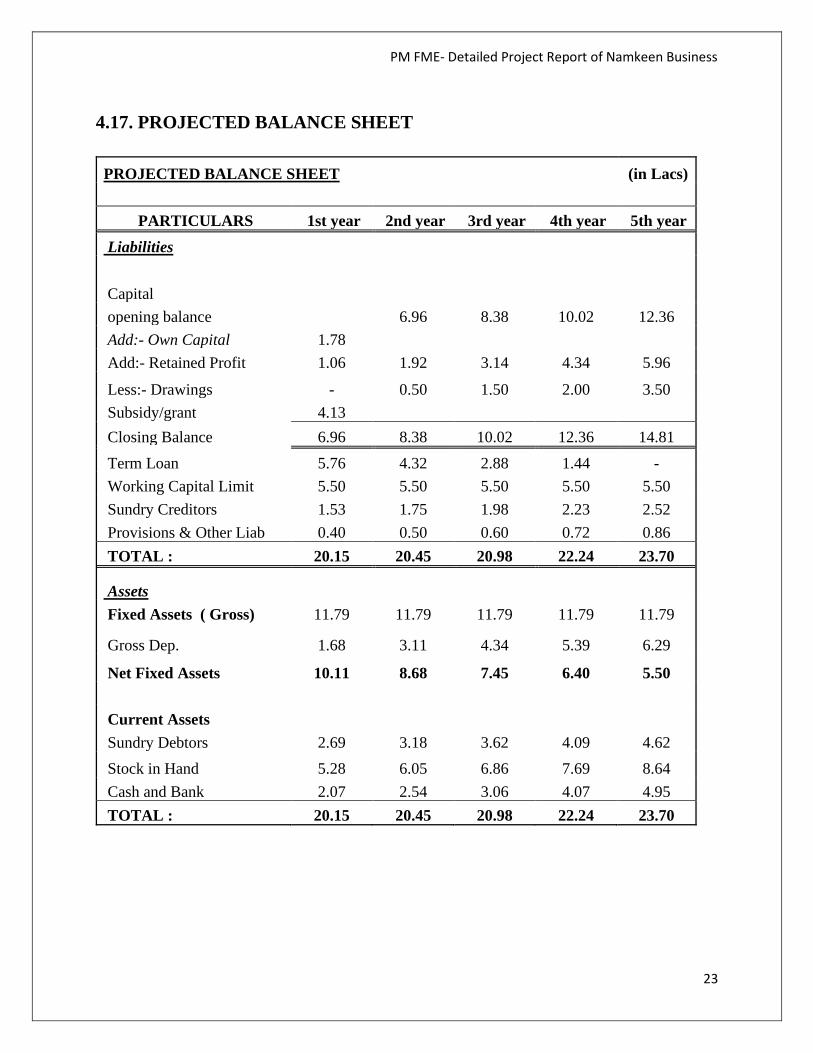
4.17. PROJECTED BALANCE SHEET
PROJECTED BALANCE SHEET (in Lacs)
PARTICULARS 1st year 2nd year 3rd year 4th year 5th year Liabilities
Capital opening balance 6.96 8.38 10.02 12.36 Add:- Own Capital 1.78 Add:- Retained Profit 1.06 1.92 3.14 4.34 5.96
Less:- Drawings - 0.50 1.50 2.00 3.50 Subsidy/grant 4.13 Closing Balance 6.96 8.38 10.02 12.36 14.81 Term Loan 5.76 4.32 2.88 1.44 - Working Capital Limit 5.50 5.50 5.50 5.50 5.50 Sundry Creditors 1.53 1.75 1.98 2.23 2.52 Provisions & Other Liab 0.40 0.50 0.60 0.72 0.86 TOTAL : 20.15 20.45 20.98 22.24 23.70
Assets Fixed Assets ( Gross) 11.79 11.79 11.79 11.79 11.79
Gross Dep. 1.68 3.11 4.34 5.39 6.29
Net Fixed Assets 10.11 8.68 7.45 6.40 5.50 Current Assets Sundry Debtors 2.69 3.18 3.62 4.09 4.62 Stock in Hand 5.28 6.05 6.86 7.69 8.64 Cash and Bank 2.07 2.54 3.06 4.07 4.95 TOTAL : 20.15 20.45 20.98 22.24 23.70

PM FME- Detailed Project Report of Namkeen Business
24
4.18. CASH FLOW STATEMENT
PROJECTED CASH FLOW STATEMENT (in Lacs)
PARTICULARS 1st year
2nd year
3rd year
4th year 5th year
SOURCES OF FUND
Own Margin 1.78 Net Profit 1.06 1.92 3.17 4.43 6.35 Depriciation & Exp. W/off 1.68 1.44 1.23 1.05 0.90 Increase in Cash Credit 5.50 - - - -
Increase In Term Loan 6.48 - - - - Increase in Creditors 1.53 0.22 0.23 0.25 0.29 Increase in Provisions & Oth lib 0.40 0.10 0.10 0.12 0.14 Sunsidy/grant 4.13 TOTAL : 22.55 3.67 4.74 5.85 7.69 APPLICATION OF FUND Increase in Fixed Assets 11.79 Increase in Stock 5.28 0.77 0.81 0.84 0.94
Increase in Debtors 2.69 0.50 0.44 0.47 0.53 Repayment of Term Loan 0.72 1.44 1.44 1.44 1.44
Drawings - 0.50 1.50 2.00 3.50 Taxation - - 0.03 0.10 0.40 TOTAL : 20.48 3.20 4.22 4.84 6.81 Opening Cash & Bank Balance - 2.07 2.54 3.06 4.07 Add : Surplus 2.07 0.47 0.51 1.01 0.88 Closing Cash & Bank Balance 2.07 2.54 3.06 4.07 4.95
PM FME- Detailed Project Report of Namkeen Business
25
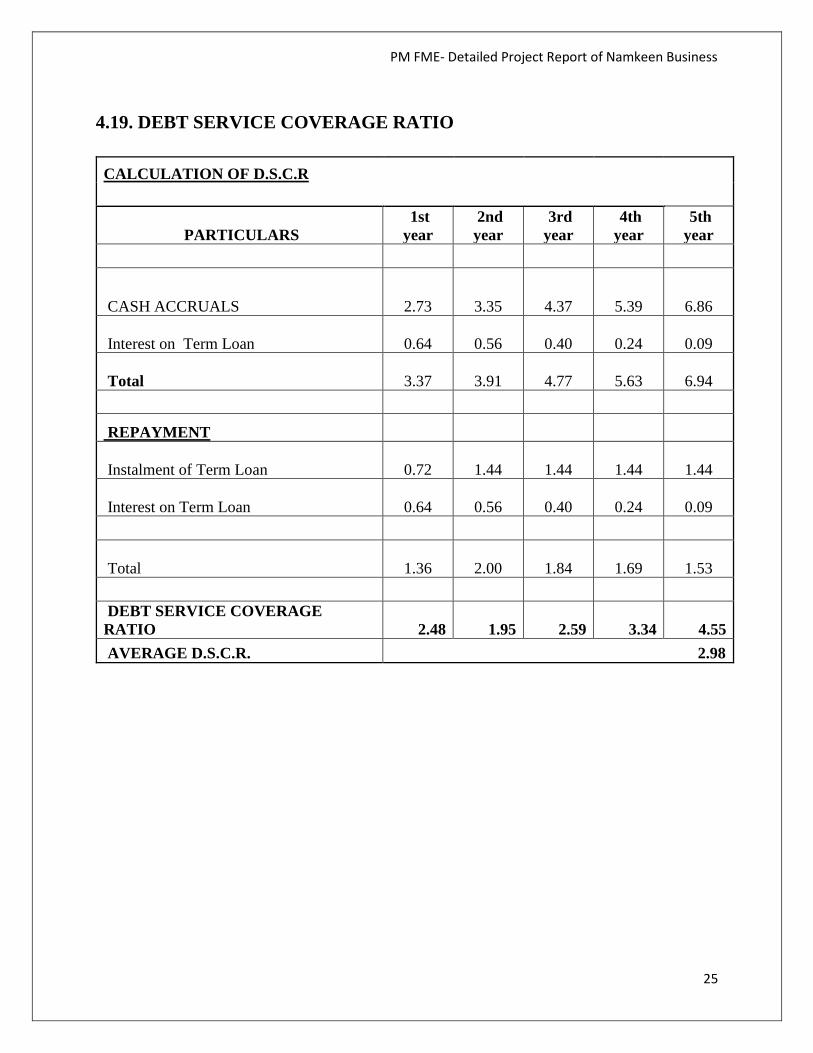
4.19. DEBT SERVICE COVERAGE RATIO
CALCULATION OF D.S.C.R
PARTICULARS 1st year
2nd year
3rd year
4th year
5th year
CASH ACCRUALS
2.73
3.35
4.37
5.39
6.86
Interest on Term Loan
0.64
0.56
0.40
0.24
0.09
Total
3.37
3.91
4.77
5.63
6.94
REPAYMENT
Instalment of Term Loan
0.72
1.44
1.44
1.44
1.44
Interest on Term Loan
0.64
0.56
0.40
0.24
0.09
Total
1.36
2.00
1.84
1.69
1.53 DEBT SERVICE COVERAGE RATIO 2.48 1.95 2.59 3.34 4.55 AVERAGE D.S.C.R. 2.98