detailed california modified greet pathway for · pdf file27.02.2009 · detailed...
TRANSCRIPT

Detailed California Modified GREET Pathway for Compressed Gaseous
Hydrogen from North American Natural Gas
Stationary Source Division
Release Date: February 27, 2009
Version 2.1

The Staff of the Air Resources Board developed this preliminary draft version as part of the Low Carbon Fuel Standard Regulatory Process
The ARB acknowledges contributions from the California Energy Commission, TIAX LLC and Life Cycle Associates LLC during the development of this document.
When reviewing this document, please submit comments directly to:
Anil Prabhu: [email protected] Chan Pham: [email protected] Alan Glabe: [email protected]
Jim Duffy: [email protected] Ben Deal: [email protected]
These comments will be compiled, reviewed, and posted to the LCFS
website in a timely manner

DRAFT
i
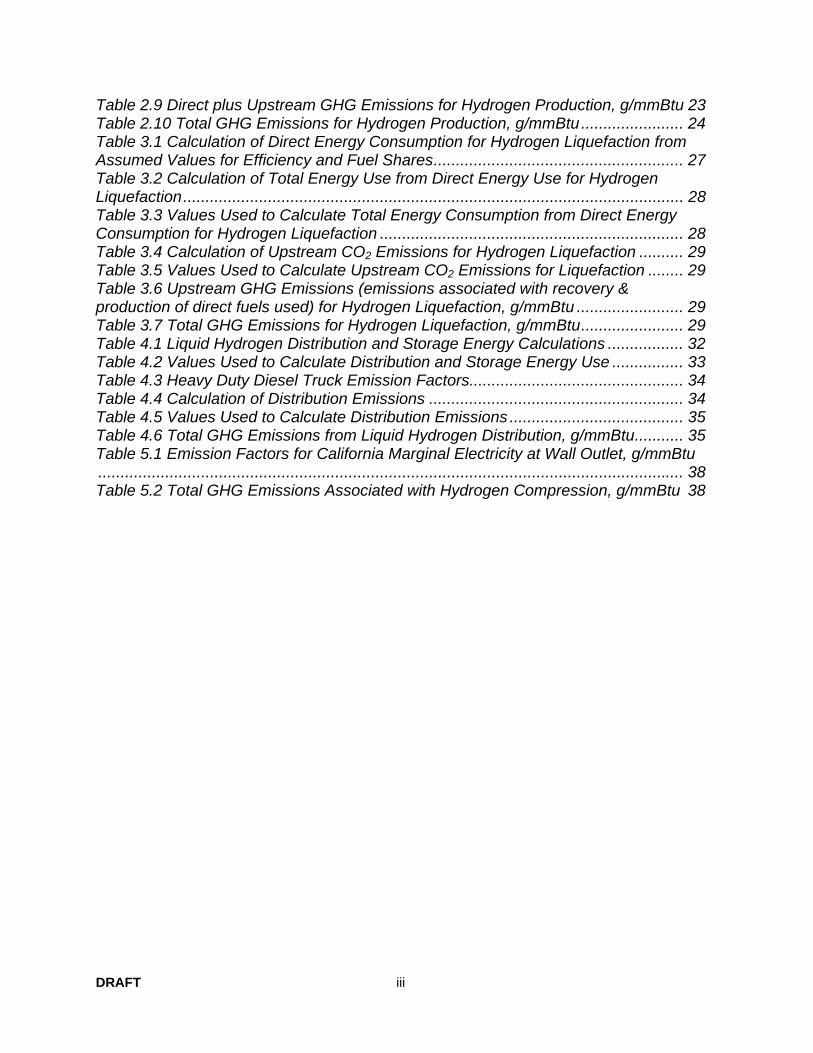
TABLE OF CONTENT Table of Content.............................................................................................................i List of Figures................................................................................................................ii List of Tables.................................................................................................................ii Summary...................................................................................................................... 1
CA-GREET Model Pathway for Compressed Gaseous Hydrogen Produced From North American Natural Gas ................................................................................. 2
APPENDIX A.............................................................................................................. 13 Section 1. Feedstock Recovery, Processing and Transport to the Hydrogen Plant 15
1.1 Energy and Emissions for Feedstock Recovery, Processing and Transport . 16 Section 2. Gaseous Hydrogen Production.............................................................. 18
2.1 Energy Use for Gaseous Hydrogen Production ............................................ 19 2.2 GHG Emissions from Gaseous Hydrogen Production................................... 21
Section 3. Hydrogen Liquefaction........................................................................... 26 3.1 Energy Use for Hydrogen Liquefaction ......................................................... 27 3.2 GHG Emissions from Hydrogen Liquefaction................................................ 29
Section 4. Hydrogen Distribution and Storage........................................................ 31 4.1 Energy Use for Liquid Hydrogen Distribution and Storage............................ 32 4.2 GHG Emissions from Hydrogen Distribution and Storage............................. 34
Section 5. Hydrogen Compression ......................................................................... 37 5.1 Hydrogen Compression Energy Use............................................................. 38 5.2 GHG Emissions from Hydrogen Compression .............................................. 38
Section 6. GHG Emissions from Vehicle ................................................................ 40 6.1 GHG Emission from a Fuel Cell Vehicle ....................................................... 41
APPENDIX B.............................................................................................................. 42 GASEUOS HYDROGEN PATHWAY INPUT VALUES........................................... 42
Scenario: Gaseuos Hydrogen from North American Natural Gas using California Electricity Marginal Mix ....................................................................................... 43

DRAFT
ii
LIST OF FIGURES Figure 1. Discrete Components of the Hydrogen Pathway........................................... 4 Figure 2. Energy and GHG Contributions of the Hydrogen Pathway ........................... 5 Figure 3. Discrete Components of the Onsite Compressed Hydrogen Pathway .......... 6 Figure 4. Discrete Components of the Onsite Compressed Hydrogen Pathway Under a Likely Scenario for SB1505 ....................................................................................... 7
LIST OF TABLES
Table A. Summary of Energy Consumption and GHG Emissions for Compressed Gaseous Hydrogen ...................................................................................................... 5 Table B. Summary of Energy Consumption and GHG Emissions for Onsite Hydrogen Production and Compression ....................................................................................... 6 Table C. Summary of Energy Consumption and GHG Emissions for Onsite 33% Renewable Hydrogen................................................................................................... 8 Table D. Total Energy Consumption for Feedstock Recovery, Processing and Transport to the Hydrogen Plant .................................................................................. 9 Table E. Total GHG Emissions from Feedstock Recovery, Processing and Transport to the Hydrogen Plant, g/mmBtu .................................................................................. 9 Table F. Total Energy Consumption by Fuel Type for Gaseous Hydrogen Production................................................................................................................................... 10 Table G. Total GHG Emissions from Gaseous Hydrogen Production, g/mmBtu........ 10 Table H. Total Energy Consumption for the Liquefaction Step................................... 10 Table I. Total GHG Emissions from the Liquefaction Step, g/mmBtu......................... 10 Table J. Energy Use for Liquid Hydrogen Distribution and Storage ........................... 11 Table K. GHG Emissions from Liquid Hydrogen Distribution, g/mmBtu ..................... 11 Table L. Energy Use for Hydrogen Compression....................................................... 11 Table M. GHG Emissions from Hydrogen Compression, g/mmBtu............................ 11 Table 1.1 Energy Consumption for Feedstock Recovery, Processing and Transport, Btu/mmBtu ................................................................................................................. 16 Table 1.2 GHG Emissions From Feedstock Recovery, Processing and Transport, g/mmBtu..................................................................................................................... 16 Table 2.1 Calculation of Direct Energy Consumption to Produce Gaseous Hydrogen19 Table 2.2 Calculation of Total Energy Consumption from Direct Energy Consumption for Hydrogen Production ............................................................................................ 20 Table 2.3 Values Used to Calculate Total Energy Use from Direct Energy Use ....... 20 Table 2.4 Natural Gas Fired Utility Boiler Emission Factors, g/mmBtu....................... 21 Table 2.5 Direct Emissions from Hydrogen Production, g/mmBtu.............................. 22 Table 2.6 Calculation of Upstream CO2 emissions from Direct CO2 Emissions for Hydrogen Production.................................................................................................. 22 Table 2.7 Values Used to Calculate Upstream CO2 Emissions for Hydrogen Production .................................................................................................................. 23 Table 2.8 Upstream GHG Emissions (emissions associated with recovery & production of direct fuels used) for Hydrogen Production, g/mmBtu .......................... 23
DRAFT
iii
Table 2.9 Direct plus Upstream GHG Emissions for Hydrogen Production, g/mmBtu 23 Table 2.10 Total GHG Emissions for Hydrogen Production, g/mmBtu....................... 24 Table 3.1 Calculation of Direct Energy Consumption for Hydrogen Liquefaction from Assumed Values for Efficiency and Fuel Shares........................................................ 27 Table 3.2 Calculation of Total Energy Use from Direct Energy Use for Hydrogen Liquefaction................................................................................................................ 28 Table 3.3 Values Used to Calculate Total Energy Consumption from Direct Energy Consumption for Hydrogen Liquefaction .................................................................... 28 Table 3.4 Calculation of Upstream CO2 Emissions for Hydrogen Liquefaction .......... 29 Table 3.5 Values Used to Calculate Upstream CO2 Emissions for Liquefaction ........ 29 Table 3.6 Upstream GHG Emissions (emissions associated with recovery & production of direct fuels used) for Hydrogen Liquefaction, g/mmBtu ........................ 29 Table 3.7 Total GHG Emissions for Hydrogen Liquefaction, g/mmBtu....................... 29 Table 4.1 Liquid Hydrogen Distribution and Storage Energy Calculations ................. 32 Table 4.2 Values Used to Calculate Distribution and Storage Energy Use ................ 33 Table 4.3 Heavy Duty Diesel Truck Emission Factors................................................ 34 Table 4.4 Calculation of Distribution Emissions ......................................................... 34 Table 4.5 Values Used to Calculate Distribution Emissions ....................................... 35 Table 4.6 Total GHG Emissions from Liquid Hydrogen Distribution, g/mmBtu........... 35 Table 5.1 Emission Factors for California Marginal Electricity at Wall Outlet, g/mmBtu................................................................................................................................... 38 Table 5.2 Total GHG Emissions Associated with Hydrogen Compression, g/mmBtu 38

DRAFT
1
SUMMARY
DRAFT
2
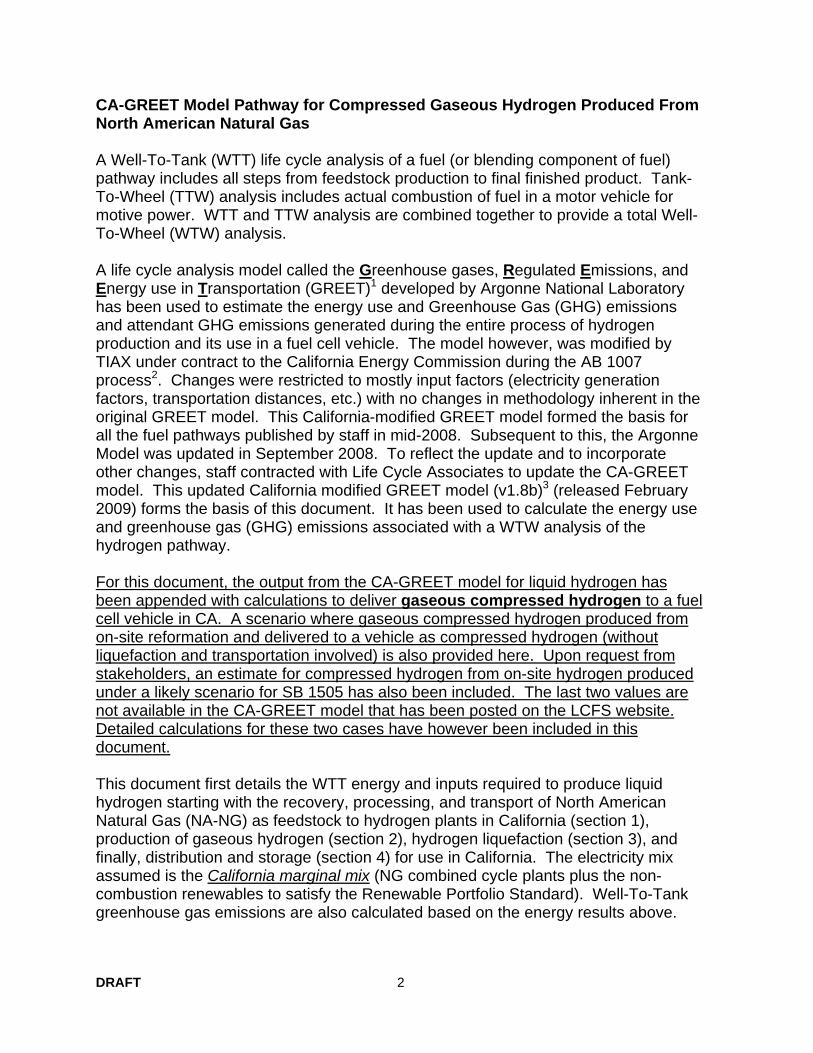
CA-GREET Model Pathway for Compressed Gaseous Hydrogen Produced From North American Natural Gas A Well-To-Tank (WTT) life cycle analysis of a fuel (or blending component of fuel) pathway includes all steps from feedstock production to final finished product. Tank-To-Wheel (TTW) analysis includes actual combustion of fuel in a motor vehicle for motive power. WTT and TTW analysis are combined together to provide a total Well-To-Wheel (WTW) analysis. A life cycle analysis model called the Greenhouse gases, Regulated Emissions, and Energy use in Transportation (GREET)1 developed by Argonne National Laboratory has been used to estimate the energy use and Greenhouse Gas (GHG) emissions and attendant GHG emissions generated during the entire process of hydrogen production and its use in a fuel cell vehicle. The model however, was modified by TIAX under contract to the California Energy Commission during the AB 1007 process2. Changes were restricted to mostly input factors (electricity generation factors, transportation distances, etc.) with no changes in methodology inherent in the original GREET model. This California-modified GREET model formed the basis for all the fuel pathways published by staff in mid-2008. Subsequent to this, the Argonne Model was updated in September 2008. To reflect the update and to incorporate other changes, staff contracted with Life Cycle Associates to update the CA-GREET model. This updated California modified GREET model (v1.8b)3 (released February 2009) forms the basis of this document. It has been used to calculate the energy use and greenhouse gas (GHG) emissions associated with a WTW analysis of the hydrogen pathway. For this document, the output from the CA-GREET model for liquid hydrogen has been appended with calculations to deliver gaseous compressed hydrogen to a fuel cell vehicle in CA. A scenario where gaseous compressed hydrogen produced from on-site reformation and delivered to a vehicle as compressed hydrogen (without liquefaction and transportation involved) is also provided here. Upon request from stakeholders, an estimate for compressed hydrogen from on-site hydrogen produced under a likely scenario for SB 1505 has also been included. The last two values are not available in the CA-GREET model that has been posted on the LCFS website. Detailed calculations for these two cases have however been included in this document. This document first details the WTT energy and inputs required to produce liquid hydrogen starting with the recovery, processing, and transport of North American Natural Gas (NA-NG) as feedstock to hydrogen plants in California (section 1), production of gaseous hydrogen (section 2), hydrogen liquefaction (section 3), and finally, distribution and storage (section 4) for use in California. The electricity mix assumed is the California marginal mix (NG combined cycle plants plus the non-combustion renewables to satisfy the Renewable Portfolio Standard). Well-To-Tank greenhouse gas emissions are also calculated based on the energy results above.

DRAFT
3
The Tank-To-Wheel part includes the use of compressed gaseous hydrogen in a fuel cell vehicle. Values and calculations have also been provided for two other scenarios:
1) delivery of compressed hydrogen from on-site reformation directly to a fuel cell vehicle
2) delivery of compressed on-site generated hydrogen under a likely scenario for SB1505
Several general descriptions and clarification of terminology used throughout this document are:
• CA-GREET employs a recursive methodology to calculate energy consumption and emissions. To calculate WTT energy and emissions, the values being calculated are often utilized in the calculation. For example, crude oil is used as a process fuel to recover crude oil. The total crude oil recovery energy consumption includes the direct crude oil consumption and the energy associated with crude recovery (which is the value being calculated).
• Btu/mmBtu is the energy input necessary in Btu to produce one million Btu of a
finished (or intermediate) product. This description is used consistently in CA-GREET for all energy calculations. There are 1,055 mmBTU per 1 MJ.
• gCO2e/MJ provides the total greenhouse gas emissions on a CO2 equivalent
basis per unit of energy (MJ) for a given fuel. Methane (CH4) and nitrous oxide (N2O) are converted to a CO2 equivalent basis using IPCC global warming potential values and included in the total.
• CA-GREET assumes that VOC and CO are converted to CO2 in the
atmosphere and includes these pollutants in the total CO2 value using ratios of their molecular weights.
• Process Efficiency for any step in CA-GREET is defined as:
Efficiency = energy output / (energy output + energy consumed)
• Note that rounding of values has not been performed in several tables in this document. This is to allow stakeholders executing runs with the CA-GREET model to compare actual output values from the CA-modified model with values in this document.
Figure 1 shows the discrete components that form the compressed gaseous hydrogen from the NA-NG pathway.

DRAFT
4
Figure 1. Discrete Components of the Hydrogen Pathway Table A provides a summary of the results for this gaseous hydrogen pathway. The WTW analysis for hydrogen results in 2,603,961 Btu of energy required to produce 1 (one) mmBtu of available fuel energy. From a GHG perspective, 142.2 g CO2e/MJ of greenhouse gas emissions are generated during the production and use of hydrogen in a fuel cell vehicle. Note that this pathway assumes North American natural gas as feedstock. Note: When using liquid H2 only, subtract compression energy of 9.2 gCO2/MJ from 142.2 gCO2/MJ shown in Table A to estimate the WTW GHG emissions for liquid H2 at 133.0 gCO2/MJ
GASEOUS HYDROGEN PRODUCTION
(NA-NG Reforming at Central Plant)
HYDROGEN DISTRIBUTION AND STORAGE + COMPRESSION
HYDROGEN LIQUEFACTION
FEEDSTOCK (NA-NG) RECOVERY
FUEL CELL VEHICLE

DRAFT
5
Table A. Summary of Energy Consumption and GHG Emissions for Compressed Gaseous Hydrogen
Energy Required
(Btu/mmBtu) % Energy
ContributionGHG
Emissions (gCO2e/MJ)
% Emissions Contribution
Well to Tank (WTT) Feedstock 72,417 2.8% 8.2 5.8% Hydrogen Production 430,522 16.5% 80.9 56.9% Hydrogen Liquefaction 830,173 31.9% 43.4 30.5% Distribution and Storage 9,176 0.4% 0.55 0.4% Compression 261,473 10.0% 9.2 6.5% Total (WTT) 1,603,961 61.6% 142.2 100% Tank to Wheel (TTW) Carbon/Energy in Fuel 1,000,000 38.4% 0 0 Vehicle CH4 and N2O 0 0 0 0 Total (TTW) 1,000,000 38.4% 0 0 Total Well to Wheel 2,603,961 100% 142.2 100%
Note: percentages may not add to 100 due to rounding Figure 2 depicts the relative contribution of each discrete component of this pathway to the total energy use and total GHG emissions. From an energy viewpoint, the hydrogen liquefaction step (31.9%) and energy in fuel (38.4%) comprise the bulk of the energy contributions to the WTW pathway. From a GHG emissions perspective, hydrogen production (56.9%) and liquefaction (30.5%) dominate the GHG contributions to this pathway.
Figure 2. Energy and GHG Contributions of the Hydrogen Pathway
WTW % Emissions Contributions
Hydrogen Production,
56.9%
Distribution and Storage, 0.4%
Compression , 6.5%
Hydrogen Liquefaction,
30.5%
Feedstock , 5.8%
WTW % Energy Contributions
Hydrogen Liquefaction,
31.9%
Distribution and Storage, 0.4%
Compression , 10.0%
Feedstock , 2.8%
Hydrogen Production,
16.5%Carbon/Energy in Fuel, 38.4%

DRAFT
6
Figure 3 shows the discrete components that form the Onsite hydrogen production and compression from NA-NG pathway.
Figure 3. Discrete Components of the Onsite Compressed Hydrogen Pathway If hydrogen is produced onsite at a refueling station, the energy and emissions will consist of feedstock, production and compression but will not contain the liquefaction and transport values of the delivered hydrogen pathway. Table B provides a summary of the results for this hydrogen pathway. The WTW analysis for hydrogen results in 1,765,318 Btu of energy required to produce 1 (one) mmBtu of available fuel energy. From a GHG perspective, 98.3 g CO2e/MJ of greenhouse gas emissions are generated during the production and use of hydrogen in a fuel cell vehicle. Note that this pathway assumes North American natural gas as feedstock. Table B. Summary of Energy Consumption and GHG Emissions for Onsite Hydrogen Production and Compression
Energy Required
(Btu/mmBtu) % Energy
Contribution GHG
Emissions (gCO2e/MJ)
% Emissions Contribution
Well to Tank (WTT) Feedstock 73,323 10% 8.2 8% Hydrogen Production 430,522 56% 80.9 82% Compression 261,473 34% 9.1 10% Total (WTT) 765,318 44% 98.3 100% Tank to Wheel (TTW) Carbon/Energy in Fuel 1,000,000 56% 0 0 Vehicle CH4 and N2O 0 0 Total (TTW) Total Well to Wheel 1,765,318 100% 98.3 100%
GASEOUS HYDROGEN PRODUCTION
(NA-NG Reforming ONSITE)
HYDROGEN COMPRESSION
FEEDSTOCK (NA-NG) RECOVERY
FUEL CELL VEHICLES

DRAFT
7
Figure 4 shows the discrete components that form the Onsite hydrogen production and compression from NA-NG and Landfill Gas pathway under the likely scenario for California Legislative Bill SB15054.
Figure 4. Discrete Components of the Onsite Compressed Hydrogen Pathway Under a Likely Scenario for SB1505
Hydrogen produced onsite at a refueling station with 2/3 of the feedstock from North American natural gas and 1/3 from landfill gas (from California) the energy and emissions will consist of feedstock, production, gas transport, gas cleanup and compression. Table C provides a summary of the results for pathway. The WTW analysis for hydrogen results in 1,455,915 Btu of energy required to produce 1 (one) mmBtu of available fuel energy. From a GHG perspective, 76.1 g CO2e/MJ of greenhouse gas emissions are generated during the production and use of hydrogen in a fuel cell vehicle. Note that this pathway assumes North American natural gas AND California Landfill Gas derived natural gas as feedstock.
GASEOUS HYDROGEN PRODUCTION (ONSITE)
FEEDSTOCK (NA-NG) RECOVERY
FUEL CELL VEHICLES
HYDROGEN COMPRESSION
LANDFILL GAS RECOVERY
LANDFILL GAS PIPELINE TRANSPORT
GAS TRANSPORT
LANDFILL GAS CLEANP AND COMPRESSION TO NG

DRAFT
8
Table C. Summary of Energy Consumption and GHG Emissions for Onsite 33% Renewable Hydrogen
Energy
Required (Btu/mmBtu)
% Energy Contribution
GHG Emissions (gCO2e/MJ)
%Emissions Contribution
Well to Tank Feedstock (NA-NG) 48,882 4% 5.4 7% Feedstock (LFG) -284,962 -21% -16.3 -20% Hydrogen Production 430,522 22% 80.9 66% Compression (1/3 RE) 261,473 20% 6.1 8% Total (WTT) 455,915 31% 76.1 100% Tank to Wheel Carbon/Energy in Fuel 1,000,000 69% 0 0 Vehicle CH4 and N2O 0 0 Total WTW 1,455,915 100% 76.1 100%
The following sections provide summaries of each of the WTW components of these pathways for only the case of gaseous compressed hydrogen gas from NA-NG )first case). Expanded details are provided in Appendix A. A table of all input values and assumptions is provided in Appendix B. For detailed calculations regarding the energy use and emissions associated with recovery, processing and transport of the feedstock used here (Natural Gas) please refer to a companion document “Detailed California-Modified GREET Pathway for Compressed Natural Gas (CNG) from North American Natural Gas”, (referred to as CNG document in sections to follow). For detailed calculations regarding electricity used here as an energy source, please refer to another companion document “Detailed California-Modified GREET Pathway for California Average Electricity” (referred to as Electricity document in sections to follow). The electricity document provides details for both average and marginal electricity. For detailed calculations regarding the energy use and emissions associated with recovery, processing and transport of Landfill Gas please refer to a companion document “Detailed California-Modified GREET Pathway for Compressed Natural Gas (CNG) from Landfill Gas”. All the companion documents listed here are available on the Low Carbon Fuel Standard website.

DRAFT
9
Feedstock Recovery, Processing and Transport Tables D and E provide a summary of the energy consumption and associated GHG emissions from recovery, processing and transport of the feedstock (North American Natural Gas) to the hydrogen plant. Calculation details are provided in Appendix A. Table D. Total Energy Consumption for Feedstock Recovery, Processing and Transport to the Hydrogen Plant
Fuel Type Btu/mmBtu
Natural Gas Recovery 31,207 Natural Gas Processing 31,862 Natural Gas T&D 9,348 Total 72,417
Table E. Total GHG Emissions from Feedstock Recovery, Processing and Transport to the Hydrogen Plant, g/mmBtu
*CO2 CH4 N2O GHG gCO2e/mmBtu
GHG gCO2e/MJ
Natural Gas Recovery 1,726 76.774 0.027 3,653 3.5
Natural Gas Processing 3,112 32.903 0.027 3,943 3.74
Natural Gas T&D 532 19.640 0.015 1,028 0.97
Total 5,370 129.32 0.07 8,624 8.2 * Includes contribution from CO and VOC
Gaseous Hydrogen Production Tables F and G provide a summary of the energy consumption and associated GHG emissions from hydrogen production. Natural gas has two applications in the hydrogen pathway. It is both a process fuel (i.e. it provides energy to the system) and a feedstock (i.e. the origin of the hydrogen). Calculation details are provided in Appendix A.

DRAFT
10
Table F. Total Energy Consumption by Fuel Type for Gaseous Hydrogen Production Fuel Type Btu/mmBtu
Natural Gas (Process Fuel) 256,210 Electricity 1,608 Natural Gas (Feedstock) 172,704 Total 430,522
Table G. Total GHG Emissions from Gaseous Hydrogen Production, g/mmBtu
*CO2 CH4 N2O GHG gCO2e/mmBtu
GHG gCO2e/MJ
Natural Gas (Process Fuel) 15,160.53 33.44 0.092 15,957.034 15.12
Electricity? 84.25 0.190 0.002 89.24 0.08 Natural Gas (Feedstock) 68,738.15 22.36 0.011 69,255.84 65.64
Total 83,982.9 56 0.1 85,302.1 80.9 * Includes contribution from CO and VOC
Hydrogen Liquefaction Tables H and I provide the energy consumption and associated GHG emissions from liquefaction of the gaseous hydrogen. Calculation details are provided in Appendix A. Table H. Total Energy Consumption for the Liquefaction Step
Fuel Type Btu/mmBtu
Electricity 827,122 Feedstock Loss 3,051 Total Energy 830,173
Table I. Total GHG Emissions from the Liquefaction Step, g/mmBtu
*CO2 CH4 N2O GHG gCO2e/mmBtu
GHG gCO2e/MJ
Electricity 43,277 96.7 1.1 45,817 43.4 * Includes contribution from CO and VOC

DRAFT
11
Liquid Hydrogen Distribution and Storage Tables J and K summarize energy consumption and GHG emissions from liquid hydrogen distribution and storage. Calculation details are provided in Appendix A. Table J. Energy Use for Liquid Hydrogen Distribution and Storage
Fuel Type Btu/mmBtu
Distribution Truck Energy 7,299 Distribution Feedstock Loss 60 Storage Feedstock Loss 1,816
Total Energy 9,176 Table K. GHG Emissions from Liquid Hydrogen Distribution, g/mmBtu
*CO2 CH4 N2O GHG gCO2e/mmBtu
GHG gCO2e/MJ
Distribution Truck 563.1 0.63 0.01 581.6 0.55
* Includes contributions from VOC and CO.
Hydrogen Compression Tables L and M summarize energy consumption and GHG emissions from hydrogen compression. Calculation details are provided in Appendix A. Table L. Energy Use for Hydrogen Compression
Fuel Type Btu/mmBtu
Direct Electricity 86,957 Total Electricity 174,516 Total Energy 261,473
Table M. GHG Emissions from Hydrogen Compression, g/mmBtu
*CO2 CH4 N2O GHG gCO2e/mmBtu
GHG gCO2e/MJ
Distribution Truck 563.1 20.64 0.23 9687.4 9.11
* Includes contributions from VOC and CO.

DRAFT
12
Vehicle N2O and CH4
Since Fuel Cell vehicles are assumed to generate no emissions, all CO2, CO, VOC, CH4 and N2O emissions are assumed to be zero.

DRAFT
13
APPENDIX A

DRAFT
14
This Page Intentionally Left Blank

DRAFT
15
SECTION 1. FEEDSTOCK RECOVERY, PROCESSING AND TRANSPORT TO THE HYDROGEN PLANT

DRAFT
16
1.1 Energy and Emissions for Feedstock Recovery, Processing and Transport This hydrogen pathway assumes that North American natural gas is used as the feedstock. For a detailed description of North American Natural gas recovery, processing and transport please refer to the CNG pathway document available on the LCFS website. The energy and emissions for natural gas recovery, processing and transport are multiplied by the hydrogen pathway loss factors (L1, L2, and L3) which are described in sections 3.1 and 4.1. These are the losses associated with boil-off of the liquid hydrogen at the central plant, during transport, and from storage tanks at the hydrogen fueling station, respectively. Table 1.1 provides the energy consumption associated with the feedstock while Table 1.2 provides the GHG emissions. Table 1.1 Energy Consumption for Feedstock Recovery, Processing and Transport, Btu/mmBtu
Process* Direct Energy Consumption
Energy Use with Loss Factors Applied
Natural Gas Recovery 28,806 31,207 Natural Gas Processing 28,807 31,862 Natural Gas Transport 8,548 9,348 Total 66,161 72,417
Note: * See CNG pathway document released January 2009 for more details. Loss Factor = L1 * L2 * L3 = 1.0005. (See sections 1.3 and 1.4) Table 1.2 GHG Emissions From Feedstock Recovery, Processing and Transport, g/mmBtu
Process CH4 N2O CO2* GHG
gCO2e/mmBtu GHG
gCO2e/MJ Natural Gas Recovery 76.8 0.027 1,726 3,653 3.5
Natural Gas Processing 32.9 0.027 3,112 3,943 3.74
Natural Gas Transport 19.64 0.015 532 1,028 0.97
Total 129.34 0.07 5,370 8,624 8.2 * Includes contributions from VOC and CO. CH4 and N2O also are converted to CO2e. Hydrogen pathway loss factors applied to all values.

DRAFT
17
This Page Intentionally Left Blank

DRAFT
18
SECTION 2. GASEOUS HYDROGEN PRODUCTION

DRAFT
19
2.1 Energy Use for Gaseous Hydrogen Production Once the natural gas is at the hydrogen plant, gaseous hydrogen is produced through steam reforming. There are three key assumptions made to calculate direct energy consumption for natural gas recovery:
• Process efficiency (71.5%, CA-GREET Default) • Fuel shares (split of total energy consumed by fuel type, CA-GREET Default) • Percent of the total natural gas that is utilized as a feedstock (83% of the
natural gas consumed becomes hydrogen; the balance is used as a process fuel.)
The assumed process efficiency of 71.5% means that 0.715 Btu of hydrogen are produced from each Btu of direct energy consumed. The efficiency assumption is coupled with an assumed split of fuels used in natural gas recovery to arrive at direct energy use by fuel to produce hydrogen. The results of this calculation are provided in Table 2.1.
Table 2.1 Calculation of Direct Energy Consumption to Produce Gaseous Hydrogen
Process Fuel Type Fuel Shares Relationship of Production
Efficiency and Fuel Shares Direct Energy Consumption,
Btu/mmBtu Natural Gas (Process + Feedstock)
99.8% (106)(1/ 71.5% – 1)(99.8%) 397,804
Electricity 0.2% (106)(1/71.5% – 1)(0.2%) 797 Total Direct Energy Consumption for Hydrogen Production 398,601
Once the total natural gas consumption is determined it must be split into two parts: process fuel and feedstock. The baseline assumption is that 83% of the natural gas goes to hydrogen (feedstock) while 17% is used as a process fuel. The amount of natural gas utilized as a process fuel is calculated as follows: Natural Gas (Process Fuel) = (106/production efficiency – electricity) * 17% = (106/0.715 – 797) * 17% = 237,627 Btu/mmBtu Natural Gas (Feedstock) = Total Natural Gas Use – Process Natural Gas = 397,804 – 237,627 = 160,178 Btu/mmBtu The values provided in Table 2.1 are direct energy consumption for the hydrogen production step. This is not the total energy required however, since CA-GREET accounts for the “upstream” energy associated with each of the fuels utilized to recover natural gas. For example, 797 Btu of electricity are required to produce each mmBtu of hydrogen. The total energy associated with the 797 Btu of electricity

DRAFT
20
includes the energy to recover the feedstocks and the losses associated with electric power plant efficiency and transmission. Table 2.2 demonstrates how the direct energy values shown in Table 2.1 are utilized to calculate total energy required to produce hydrogen. Table 2.3 provides details on the values used in Table 2.2. Table 2.2 Calculation of Total Energy Consumption from Direct Energy Consumption for Hydrogen Production
Fuel Type Formula Btu/mmBtu
Natural Gas (Process Fuel) (A + A*(B + C + D) /106) * L1 * L2 * L3 256,210
Electricity (E *(F + G)/ 106) * L1 * L2 * L3 1,608
Natural Gas (Feedstock) (H + H*(B + C + D) /106) * L1 * L2 * L3 172,704
Total energy for hydrogen production 430,522 Table 2.3 Values Used to Calculate Total Energy Use from Direct Energy Use Variable Description
A 237,627 Btu of process NG fuel used per mmBtu hydrogen produced. (see discussion below Table 2.1)
B Total energy to recover NG is 31,007 Btu/mmBtu NG. (See CNG document)
C 31,315 Btu are used to process 1 mmBtu NG. (See CNG document)
D 10,596 Btu are used to transport 1 mmBtu NG to the hydrogen plant. (See CNG document)
E 797 Btu of direct electricity used to recover 1 mmBtu NG. (see Table 2.1)
F 120,830 Btu of energy used to recover and transport sufficient feedstock to generate 1 mmBtu electricity. (See Electricity document but modified for marginal production)
G 1,884,989 Btu used to produce 1 mmBtu electricity. (See Electricity document but modified for marginal production)
H 160,178 Btu of feedstock NG used per mmBtu hydrogen produced. (See discussion below Table 2.1)
L1 1.003 loss factor for hydrogen storage at plant after liquefaction, a CA-GREET calculation. (See section 3.1)
L2 1.0001 loss factor for liquid hydrogen transport, a CA-GREET calculation. (See section 4.1)
L3 1.005 loss factor for liquid hydrogen storage, a CA-GREET calculation. (See section 4.1)

DRAFT
21
2.2 GHG Emissions from Gaseous Hydrogen Production The emission calculation methodology is analogous to the energy calculations. First the direct emissions are calculated and then the upstream emissions (due to recovery and processing of each direct fuel used) are added. To calculate the direct emissions, direct energy by fuel type (here only natural gas) is multiplied by the technology share (% fired in turbine, boiler, engine etc) and then multiplied by the appropriate emission factor. Emissions of CO2, N2O and CH4 due to combustion are quantified. In addition, emissions of VOC and CO are quantified and assumed to convert to CO2 in the atmosphere. The conversions are calculated as follows: CO (g/mmBtu) * 44 gCO2/gmole / 28 gCO/gmole * 0.43 gC/gCO VOC (g/mmBtu) * 44 gCO2/gmole / 12 gC/gmole * 0.85 gC/gVOC In this case, the only process fuel with direct emissions is natural gas and it is assumed (CA-GREET default) to be fully combusted in an industrial/utility boiler. Table 2.4 provides the emission factors utilized. Table 2.4 Natural Gas Fired Utility Boiler Emission Factors, g/mmBtu
GHG Emission Factor, g/mmBtu Notes
VOC 0 Assume offsets required (new plant) CO 8.5 BACT* (GREET value is 16.42) CH4 1.13 AP-42 (GREET value is 1.10)5 N2O 0.315 AP-42 (GREET value is 1.1) CO2 58,198 CA-GREET Default
*BACT: Best Available Control Technology The direct emissions from hydrogen production are based on the direct energy use (237,627 Btu/mmBtu – the process natural gas not the feedstock natural gas, see Section 2.1). Multiplying the direct energy by the emission factors in Table 2.4 yields the direct emissions provided in Table 2.5. Note that there are no direct emissions from direct electricity use. For the portion of the natural gas that becomes feedstock, the carbon ultimately goes to CO2 and this value is shown. The natural gas feedstock CO2 emissions are calculated by determining the CO2 potential (all carbon to CO2) due to the total natural gas input (process + feedstock) and subtracting the carbon emissions of the natural gas process share: CO2 Potential = (Process NG + Feedstock NG + 1,000,000) x NG density / NG LHV x NG Carbon content x ratio of molecular weights = 1,397,804 Btu/mmBtu x 20.4 g/scf / 930 Btu/scf x 0.724 gC/gNG x 44/12 = 81,396 g CO2/mmBtu
DRAFT
22
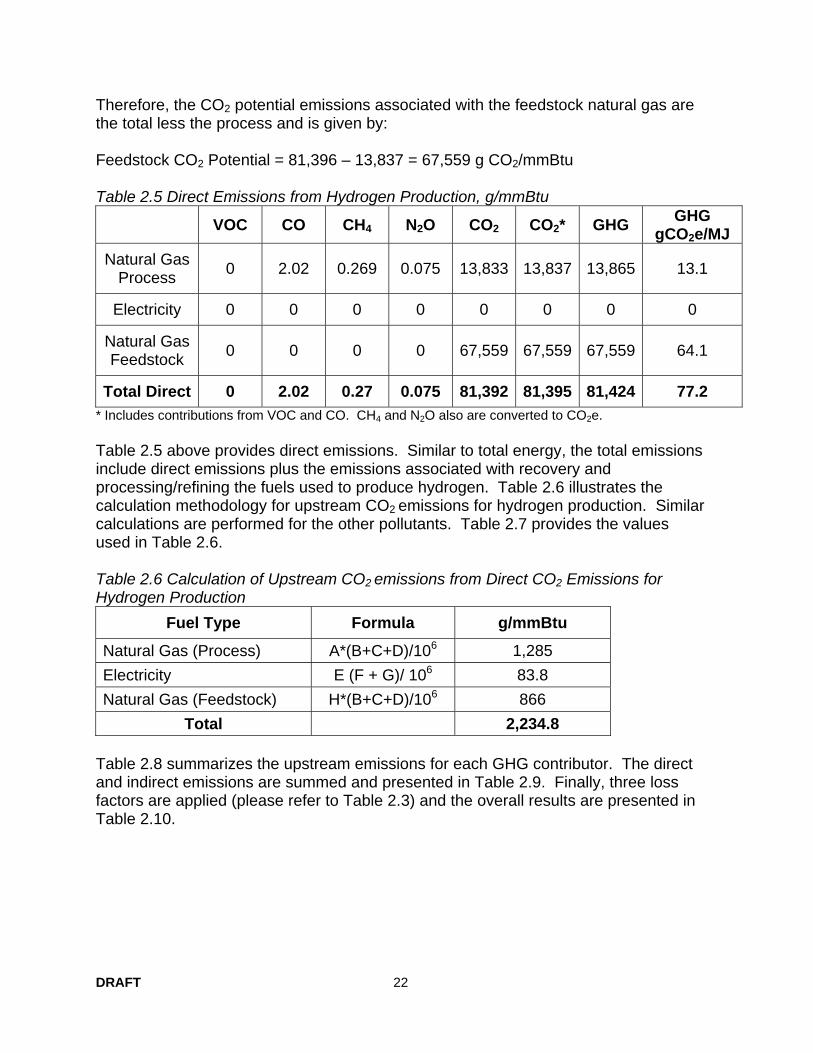
Therefore, the CO2 potential emissions associated with the feedstock natural gas are the total less the process and is given by: Feedstock CO2 Potential = 81,396 – 13,837 = 67,559 g CO2/mmBtu Table 2.5 Direct Emissions from Hydrogen Production, g/mmBtu
VOC CO CH4 N2O CO2 CO2* GHG GHG gCO2e/MJ
Natural Gas Process 0 2.02 0.269 0.075 13,833 13,837 13,865 13.1
Electricity 0 0 0 0 0 0 0 0
Natural Gas Feedstock 0 0 0 0 67,559 67,559 67,559 64.1
Total Direct 0 2.02 0.27 0.075 81,392 81,395 81,424 77.2 * Includes contributions from VOC and CO. CH4 and N2O also are converted to CO2e. Table 2.5 above provides direct emissions. Similar to total energy, the total emissions include direct emissions plus the emissions associated with recovery and processing/refining the fuels used to produce hydrogen. Table 2.6 illustrates the calculation methodology for upstream CO2 emissions for hydrogen production. Similar calculations are performed for the other pollutants. Table 2.7 provides the values used in Table 2.6. Table 2.6 Calculation of Upstream CO2 emissions from Direct CO2 Emissions for Hydrogen Production
Fuel Type Formula g/mmBtu
Natural Gas (Process) A*(B+C+D)/106 1,285 Electricity E (F + G)/ 106 83.8 Natural Gas (Feedstock) H*(B+C+D)/106 866
Total 2,234.8 Table 2.8 summarizes the upstream emissions for each GHG contributor. The direct and indirect emissions are summed and presented in Table 2.9. Finally, three loss factors are applied (please refer to Table 2.3) and the overall results are presented in Table 2.10.

DRAFT 3/2/2009
23
Table 2.7 Values Used to Calculate Upstream CO2 Emissions for Hydrogen Production Variable Description
A 237,627 Btu of direct NG fuel used per mmBtu hydrogen produced B 1,762 g CO2/mm Btu NG for NG recovery C 3,112 g CO2/mmBtu NG for NG processing (1,761 + 1,237) D 532 g CO2/mmBtu NG for NG transport to the hydrogen plant E 797 Btu of direct electricity used per mmBtu of hydrogen produced F 8,773 g/mmBtu CO2 to produce & transport feedstocks for electricity G 96,314 g CO2 to produce 1 mmBtu electricity H 160,178 Btu of NG use as feedstock per mmBtu hydrogen produced
Table 2.8 Upstream GHG Emissions (emissions associated with recovery & production of direct fuels used) for Hydrogen Production, g/mmBtu
VOC CO CH4 N2O CO2 Natural Gas (Process) 1.66 2.13 33 0.017 1,285 Electricity 0.009 0.02 0.2 0.002 83.8 Natural Gas (Feedstock) 1.12 1.44 22.25 0.011 866 Total Indirect 2.8 3.6 55.4 0.03 2,234.8
Note: See table 2.6 for detail calculations Table 2.9 Direct plus Upstream GHG Emissions for Hydrogen Production, g/mmBtu
VOC CO CH4 N2O CO2 Natural Gas (Process) 1.66 4.15 33.28 0.092 15,118 Electricity 0.009 0.023 0.2 0.002 84 Natural Gas (Feedstock) 1.12 1.435 22.25 0.011 68,425
Total 2.8 5.6 55.7 0.1 83,627 Note: Table 2.5 results plus Table 2.8 results

DRAFT
24
Table 2.10 Total GHG Emissions for Hydrogen Production, g/mmBtu
CO2* CH4 N2O GHG gCO2e/mmBtu
GHG gCO2e/
MJ Natural Gas (Process) 15,160 33.4 0.1 15,957 15.1 Electricity 84 0.2 0.002 89 0.1 Natural Gas (Feedstock) 68,738 22.4 0.01 69,255 65.6
Total 83,983 56 0.1 85,302 80.9 * Includes contributions from VOC and CO. CH4 and N2O also are converted to CO2e.

DRAFT
25
This Page Intentionally Left Blank

DRAFT
26
SECTION 3. HYDROGEN LIQUEFACTION

DRAFT
27
3.1 Energy Use for Hydrogen Liquefaction The next step in the hydrogen pathway is liquefaction. The methodology to calculate direct and total energy for liquefaction is the same as that to calculate direct and total energy for hydrogen production. The key assumptions are:
• Process efficiency (71.0%, CA-GREET Default) • Fuel shares (100% electricity, CA-GREET Default) • Hydrogen boil off (utilized to calculate liquefaction loss factor)
The electricity mix assumed is the California marginal mix (NG combined cycle plants plus the non-combustion renewables to satisfy the Renewable Portfolio Standard6). The electricity document provides complete details on the marginal electricity mix. Table 3.1 illustrates how direct energy consumption is calculated based on process efficiency and fuel shares. Table 3.1 Calculation of Direct Energy Consumption for Hydrogen Liquefaction from Assumed Values for Efficiency and Fuel Shares
Process Fuel Type
Fuel Shares Calculations
Direct Energy Consumption,
Btu/mmBtu Electricity 100% (106)(1/0.71 – 1)(1) 408,450 Feedstock Loss n/a See discussion below 3,046 Direct Energy Consumption for Hydrogen Liquefaction 411,497
The feedstock loss is the energy associated with “boil off” losses of stored liquid hydrogen at the production plant. The quantity of hydrogen loss is calculated as follows: H2 loss (g/mmBtu) = (0.3%/day x 5 days / 30,500 Btu/gal x 268 g/gal x 106) x (1-80%) (1 – 0.3%/day x 5 days) = 26.762 g/mmBtu As can be seen, an 80% boil-off recovery is assumed. The energy associated with this loss is calculated as follows: Feedstock Loss (Btu/mmBtu) = 26.762 g/mmBtu / 268 g/gal x 30,500 Btu/gal = 3,046 Btu/mmBtu

DRAFT
28
Note: An error has been found in the loss factor calculations in CA-GREET version developed as part of the AB 1007 analysis. The error overestimates the loss factors due to boil-off of liquid hydrogen because it does not include the boil-off recovery rates (80% assumed here). The AB1007 values for this pathway are therefore overestimated. This error has been corrected in GREET1.8b and has been corrected here. The loss factor associated with storage of liquid hydrogen at the plant (L1 in Table 2. 3) is based on this boil-off value. The loss factor is calculated as follows: Loss Factor L1 = 1 + 26.762 g/mmBtu / 268 g/gal * 30,500 Btu/gal / 106 Btu/mmBtu = 1.003 The values provided in Table 3. 1 are direct energy consumption per Btu for the hydrogen liquefaction step. This is not the total energy required however, since CA-GREET accounts for the “upstream” energy associated with each of the fuels utilized to recover natural gas. Table 3.2 demonstrates how the direct energy consumption values shown in Table 3.1 and values in Table 3.3 are utilized to calculate total energy required to liquefy hydrogen. Table 3.2 Calculation of Total Energy Use from Direct Energy Use for Hydrogen Liquefaction
Fuel Type Formula Btu/mmBtu
Electricity A*(B + C)/ 106 * L2 * L3 827,122
Feedstock Loss D * L2 * L3 3,051
Total Energy Consumption for Hydrogen Liquefaction 830,173 Table 3.3 Values Used to Calculate Total Energy Consumption from Direct Energy Consumption for Hydrogen Liquefaction
Variable Description
A 411,497 Btu of direct electricity used to liquefy 1 mmBtu hydrogen.
B 120,830 Btu of energy used to recover and transport sufficient feedstock to generate 1 mmBtu electricity.
C 1,884,989 Btu used to produce 1 mmBtu electricity. D 3,046 Btu hydrogen loss per mmBtu hydrogen produced
L2 1.0001 loss factor for liquid hydrogen transport, a CA-GREET calculation. (See section 4.1)
L3 1.002 loss factor for liquid hydrogen storage, a CA-GREET calculation (See section 4.1)

DRAFT
29
3.2 GHG Emissions from Hydrogen Liquefaction Because the only process fuel utilized in hydrogen liquefaction is electricity, there are no direct emissions for this step. Table 3.4 provides the upstream CO2 emission calculations and Table 3.5 provides the values used in the terms of Table 3.4. Table 3.6 provides the upstream emissions for each GHG contributor. Table 3.7 combines the upstream and direct GHG emissions, converts VOC and CH4 to CO2, and applies loss factors L2 and L3 (see Table 3.3). Table 3.4 Calculation of Upstream CO2 Emissions for Hydrogen Liquefaction
Fuel Type Formula g/mmBtu
Electricity A*(B + C)/ 106 43,243
Table 3.5 Values Used to Calculate Upstream CO2 Emissions for Liquefaction
Variable Description
A 411,497 Btu of direct electricity used to liquefy 1 mmBtu hydrogen.
B 8,773 g/mmBtu CO2 to produce & transport feedstock for electricity production
C 96,314 g CO2 to produce 1 mmBtu electricity. Table 3.6 Upstream GHG Emissions (emissions associated with recovery & production of direct fuels used) for Hydrogen Liquefaction, g/mmBtu
VOC CO CH4 N2O CO2 Electricity 4.76 11.9 97.68 1.07 43,243
Note: See example calculation of CO2 in Table 3.4 Table 3.7 Total GHG Emissions for Hydrogen Liquefaction, g/mmBtu
CH4 N2O CO2* GHG g
CO2e/mmBtu GHG
gCO2e/MJ
Electricity 96.68 1.07 43,277 45,817 43.4 * Includes contributions from VOC and CO. CH4 and N2O also are converted to CO2e.

DRAFT
30
This Page Intentionally Left Blank

DRAFT
31
SECTION 4. HYDROGEN DISTRIBUTION AND STORAGE

DRAFT
32
4.1 Energy Use for Liquid Hydrogen Distribution and Storage The final step in this hydrogen pathway is delivery by truck and storage at the fueling station. For the delivery component, it is assumed that liquid hydrogen is delivered by heavy duty diesel trucks over a distance of 50 miles directly to retail stations (no intermediate stops at fuel terminals). In addition to truck fuel consumption, there are energy losses associated with hydrogen boil off from the truck. At the retail station, there are no emissions, but there is an energy loss associated with boil-off from storage tanks. Table 4.1 illustrates the energy consumption calculations while Table 4.2 provides the values utilized in the formulas. Table 4.1 Liquid Hydrogen Distribution and Storage Energy Calculations Parameter Units Formula Value Truck Energy Intensity
Btu/ton-mile (Diesel LHV, Btu/gal) / (truck fuel economy, mi/gal) / (payload, tons) 6,423
Truck Energy Use Btu/mmBtu
(Liquid H2 density, g/gal) / (Liquid H2 LHV, Btu/gal) * (106 Btu/mmBtu) / (454 g/lb) / (2000 lb/ton) * (roundtrip miles) * (energy intensity) * (1+WTT diesel energy)
7,299
Truck Feedstock Loss
Btu/mmBtu ((Transit time, days) * (Boil-off rate, %/day)) / (1 – (transit time) * (Boil-off rate)) * 106 Btu/mmBtu * (1 – recovery rate)
60
Storage Loss Btu/mmBtu
((Storage time, days) * (Boil-off rate, %/day)) / (1 – (storage time) * (Boil-off rate)) * 106 Btu/mmBtu * (1 – recovery rate)
1,816
Total Distribution and Storage Energy
Btu/mmBtu Truck Energy + Distribution Loss + Storage Loss 9,176

DRAFT
33
Table 4.2 Values Used to Calculate Distribution and Storage Energy Use Units Value Comments Diesel LHV Btu/gal 128,450 CA-GREET Default Truck Fuel Economy Mi/gal 5 CA-GREET Default Truck Liquid H2 Payload Tons 4 CA-GREET Default Liquid H2 Density g/gal 268 CA-GREET Default Liquid H2 LHV Btu/gal 30,500 CA-GREET Default Distance (roundtrip) Miles 100 CA-GREET Default
WTT diesel energy Btu/Btu 0.174 CA-GREET Calculation
Truck Transit Time Days 0.1 CA-GREET Default Truck Boil-off rate %/day 0.3% CA-GREET Default Truck Boil-off Recovery % 80% CA-GREET Default Storage Time Days 3 CA-GREET Default Storage Boil-off rate %/day 0.3% CA-GREET Default Storage Boil-off recovery % 80% CA-GREET Default
Two of the loss factors utilized throughout the pathway are quantified at this step: the distribution loss factor L2 and the storage loss factor L3. Similar to the calculation of L1 described in Section 3, L2 and L3 are based on the evaporative hydrogen losses (boil-off). The loss factor is calculated as follows: Loss factor = 1 + (storage days * loss rate, %/day) /( 1 – days * loss rate, %/day) * (1 – recovery rate). L2 = 1 + (0.1 * 0.3%) / (1 – 0.1 * 0.3%) * (1 – 80%) = 1.0001 L3 = 1 + (3 * 0.3%) / (1 – 3 * 0.3%) * (1 – 80%) = 1.002

DRAFT
34
4.2 GHG Emissions from Hydrogen Distribution and Storage The GHG emissions from the distribution and storage consist entirely of emissions from the diesel truck over the 100 mile roundtrip distance. Table 4.3 provides the heavy duty truck emission factors utilized. These VOC and CO emission factors are based on EMFAC20077. The CH4 and N2O values are from the Climate Action Registry Reporting Protocol, and the CO2 value is calculated from fuel composition subtracting out the VOC, CO and methane carbon. Table 4.3 Heavy Duty Diesel Truck Emission Factors
Pollutant g/mi g/mmBtu diesel VOC 1.2 45.7 CO 4.2 162.1 CH4 0.03 1.29 N2O 0.05 2 CO2 1,998.6 77,798
Note: The g/mi values are converted to a g/mmBtu diesel basis by multiplying by miles/gal, dividing by diesel LHV in Btu/gal and multiplying by one million. e.g.: for VOC (1.2 g/mi) x (5 miles/gal) / (128,450 Btu/gal) * 106 = 45.7 g/mmBtu Table 4.4 illustrates the equations utilized to calculate distribution emissions and Table 4.5 provides the values used in the equations. Total GHG emissions are provided in Table 4.6 (VOC and CO are converted to CO2 and a composite CO2 equivalent value is provided). Table 4.4 Calculation of Distribution Emissions
Parameter Formula Value Transport Energy Btu diesel/Btu Liquid H2
(Liquid H2 Density, g/gal) / Liquid H2 LHV, Btu/gal) / 454 g/lb / 2000 lb/ton * (Energy Intensity, Btu/ton-mile) * (Roundtrip miles)
0.00622
VOC, g/mmBtu Transport Energy * (Direct Emission factor + WTT Diesel Emission) of VOC 0.33
CO, g/mmBtu Transport Energy * (Direct Emission factor + WTT Diesel Emission) of CO 1.09
CH4, g/mmBtu Transport Energy * (Direct Emission factor + WTT Diesel Emission) of CH4
0.6
N2O, g/mmBtu Transport Energy * (Direct Emission factor + WTT Diesel Emission) of N2O 0.013
CO2, g/mmBtu Transport Energy * (Direct Emission factor + WTT Diesel Emission) of CO2
560

DRAFT
35
Table 4.5 Values Used to Calculate Distribution Emissions Parameter Units Value Comments
Liquid H2 Density g/gal 268 Assumed Value Liquid H2 LHV Btu/gal 30,500 Assumed Value Energy Intensity Btu/ton-mile 6,423 See Table 4.1 Roundtrip miles Miles 100 Assumed Value WTT Diesel VOC g/mmBtu 7.62 Calculated Value WTT Diesel CO g/mmBtu 12.89 Calculated Value WTT Diesel CH4 g/mmBtu 100.42 Calculated Value WTT Diesel N2O g/mmBtu 0.27 Calculated Value WTT Diesel CO2 g/mmBtu 12,357 Calculated Value
Example calculation for CO2 emission: 0.00622 Btu diesel/ Btu Liquid H2* (77,798 g/mmBtu + 12,357 g/mmBtu) = 560 g/mmBtu (as shown in Table 4.4) Table 4.6 Total GHG Emissions from Liquid Hydrogen Distribution, g/mmBtu
CH4 N2O CO2* GHG g
CO2e/mmBtu GHG g
CO2e/MJ Truck Emissions 0.6 0.013 563.1 581.6 0.55
Note: Includes contributions from VOC and CO. CH4 and N2O also are converted to CO2e.

DRAFT
36
This Page Intentionally Left Blank

DRAFT
37
SECTION 5. HYDROGEN COMPRESSION
DRAFT
38
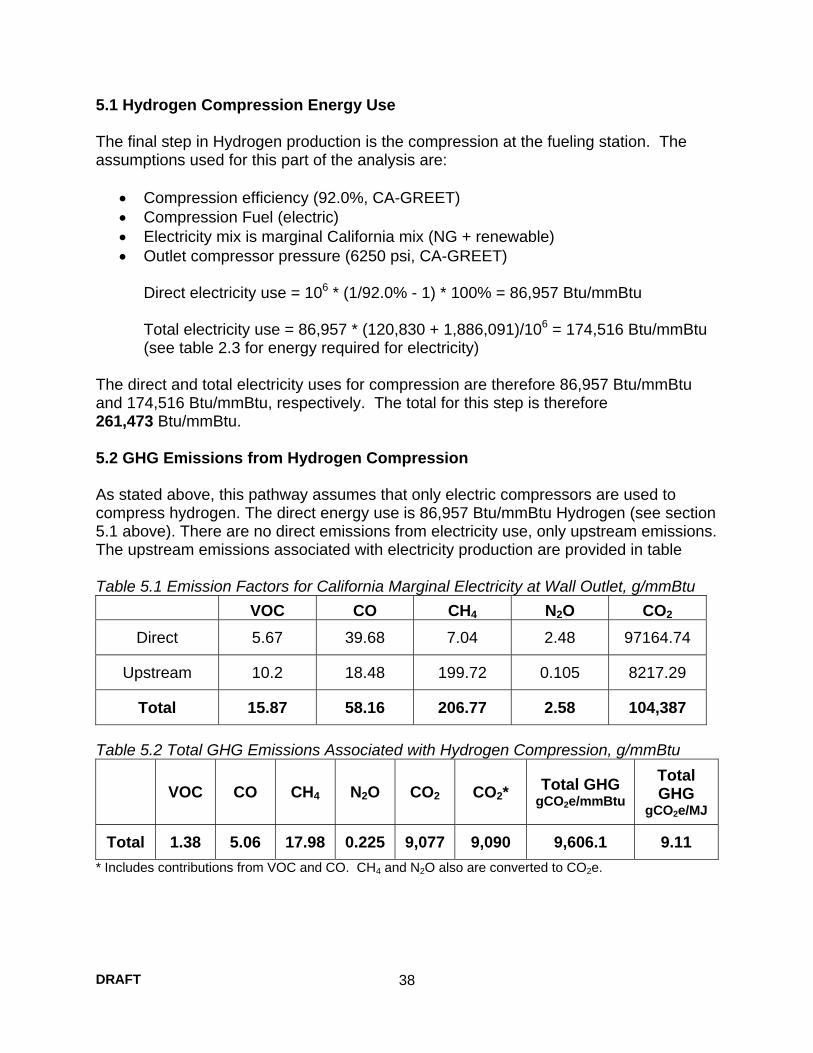
5.1 Hydrogen Compression Energy Use The final step in Hydrogen production is the compression at the fueling station. The assumptions used for this part of the analysis are:
• Compression efficiency (92.0%, CA-GREET) • Compression Fuel (electric) • Electricity mix is marginal California mix (NG + renewable) • Outlet compressor pressure (6250 psi, CA-GREET)
Direct electricity use = 106 * (1/92.0% - 1) * 100% = 86,957 Btu/mmBtu Total electricity use = 86,957 * (120,830 + 1,886,091)/106 = 174,516 Btu/mmBtu (see table 2.3 for energy required for electricity)
The direct and total electricity uses for compression are therefore 86,957 Btu/mmBtu and 174,516 Btu/mmBtu, respectively. The total for this step is therefore 261,473 Btu/mmBtu. 5.2 GHG Emissions from Hydrogen Compression As stated above, this pathway assumes that only electric compressors are used to compress hydrogen. The direct energy use is 86,957 Btu/mmBtu Hydrogen (see section 5.1 above). There are no direct emissions from electricity use, only upstream emissions. The upstream emissions associated with electricity production are provided in table Table 5.1 Emission Factors for California Marginal Electricity at Wall Outlet, g/mmBtu
VOC CO CH4 N2O CO2 Direct 5.67 39.68 7.04 2.48 97164.74
Upstream 10.2 18.48 199.72 0.105 8217.29
Total 15.87 58.16 206.77 2.58 104,387 Table 5.2 Total GHG Emissions Associated with Hydrogen Compression, g/mmBtu
VOC CO CH4 N2O CO2 CO2* Total GHG
gCO2e/mmBtu Total GHG
gCO2e/MJ
Total 1.38 5.06 17.98 0.225 9,077 9,090 9,606.1 9.11 * Includes contributions from VOC and CO. CH4 and N2O also are converted to CO2e.

DRAFT
39
This Page Intentionally Left Blank

DRAFT
40
SECTION 6. GHG EMISSIONS FROM VEHICLE

DRAFT
41
6.1 GHG Emission from a Fuel Cell Vehicle If hydrogen is utilized in a fuel cell vehicle, it is assumed that there are no vehicle CO2, CO, VOC, CH4 and N2O emissions. Hence for this pathway, there are no GHG emissions from the TTW portion of the analysis. All emissions are from the WTT part of the analysis.

DRAFT
42
APPENDIX B
GASEUOS HYDROGEN PATHWAY INPUT VALUES

DRAFT
43
Scenario: Gaseuos Hydrogen from North American Natural Gas using California Electricity Marginal Mix
Parameters Units Values Note
GHG Equivalent CO2 1 CA-GREET Default CH4 23 CA-GREET Default N2O 296 CA-GREET Default
VOC 3.1 CA-GREET Default CO 1.6 CA-GREET Default
Gaseous Hydrogen Production Process Efficiency 71.5% CA-GREET Default
Percent of Natural gas as feedstock (Balance used as process fuel) 83% CA-GREET Default
Process Fuel Shares Residual Oil 0% CA-GREET Default
Conventional Diesel 0% CA-GREET Default Conventional Gasoline 0% CA-GREET Default
Natural Gas 99.8% CA-GREET Default Electricity 0.2% CA-GREET Default
Natural Gas Equipment Shares Industrial Boiler 100% CA-GREET Default
CO2 Emission Factor gCO2/mmBtu 58,215 CA-GREET Default Liquefaction
Process Efficiency 71.0% CA-GREET Default Fuel Shares
Conventional Diesel 0% CA-GREET Default Natural Gas 0% CA-GREET Default
Electricity 100% CA-GREET Default Boil Off Losses
Loss Rate %/day 0.3% CA-GREET Default Number of Days Stored Days 5 CA-GREET Default
Recovery Rate 80% CA-GREET Default Liquid Hydrogen Transport
Heavy Duty Truck 100% CA-GREET Default Miles 50 CA-GREET Default
Boil Off Losses Loss Rate %/day 0.3% CA-GREET Default
Number of Days Stored Days 0.1 CA-GREET Default Recovery Rate 80% CA-GREET Default
Liquid Hydrogen Storage at Refueling Station
Boil Off Losses Loss Rate %/day 0.3% CA-GREET Default
Number of Days Stored Days 3 CA-GREET Default Recovery Rate 80% CA-GREET Default
Hydrogen Compression at Refueling Station Compression Efficiency 92.0% CA-GREET Default

DRAFT
44
1 GREET Model: Argonne National Laboratory: http://www.transportation.anl.gov/modeling_simulation/GREET/index.html 2 California Assembly Bill AB 1007 Study: http://www.energy.ca.gov/ab1007 3 CA_GREET Model (modified by Lifecycle Associates ) released February 2009 (http://www.arb.ca.gov/fuels/lcfs/lcfs.htm) 4 In 2006, the California legislature passed Senate Bill 1505 (SB 1505 - Lowenthal) calling for the Air Resources Board to adopt regulations regarding environmental standards for hydrogen production. The standards are to ensure that when the California Hydrogen Highway Blueprint Plan is implemented it is done in an environmentally responsible manner. SB 1505 includes emission reduction standards as well as a renewable energy requirement. http://www.arb.ca.gov/msprog/hydprod/1505concepts.pdf 5 AP 42 Compilation of Air Pollutant Emission Factors from U.S. EPA: www.epa.gov/otaq/ap42.htm 6 A Renewable Portfolio Standard (RPS) is a regulatory policy that requires the increased production of renewable energy sources such as wind, solar, biomass, and geothermal energies 7 The EMission FACtors (EMFAC) model is used to calculate emission rates from all motor vehicles, such as passenger cars to heavy-duty trucks, operating on highways, freeways and local roads in California