detachment of agglutinin-bonded red blood cells. ii. mechanical energies to separate large contact...
TRANSCRIPT

Detachment of agglutinin-bonded red blood cells11. Mechanical energies to separate large contact areas
E. Evans,*' D. Berk,* A. Leung,* and N. Mohandas§*Departments of Pathology and 'Physics, University of British Columbia, Vancouver, British Columbia V6T 1W5, Canada; andsDivision of Cell and Molecular Biology, Lawrence Berkeley Laboratory, University of California, Berkeley, California 94720 USA
ABSTRACT As detailed in a companion paper (Berk, D., and E. Evans. 1991. Biophys. J. 59:861-872), a method was developed toquantitate the strength of adhesion between agglutinin-bonded membranes without ambiguity due to mechanical compliance ofthe cell body. The experimental method and analysis were formulated around controlled assembly and detachment of a pair ofmacroscopically smooth red blood cell surfaces. The approach provides precise measurement of the membrane tension appliedat the perimeter of an adhesive contact and the contact angle O between membrane surfaces which defines the mechanicalleverage factor (1 - cos Oj) important in the definition of the work to separate a unit area of contact. Here, the method was appliedto adhesion and detachment of red cells bound together by different monoclonal antibodies to red cell membrane glycophorin andthe snail-helix pomatia-lectin. For these tests, one of the two red cells was chemically prefixed in the form of a smooth sphere thenequilibrated with the agglutinin before the adhesion-detachment procedure. The other cell was not exposed to the agglutinin until itwas forced into contact with the rigid cell surface by mechanical impingement. Large regions of agglutinin bonding were producedby impingement but no spontaneous spreading was observed beyond the forced contact. Measurements of suction force todetach the deformable cell yielded consistent behavior for all of the agglutinins: i.e., the strength of adhesion increasedprogressively with reduction in contact diameter throughout detachment. This tension-contact diameter behavior was not alteredover a ten-fold range of separation rates. In special cases, contacts separated smoothly after critical tensions were reached; thesewere the highest values attained for tension. Based on measurements reported in another paper (Evans et al. 1991. Biophys. J.59:838-848) of the forces required to rupture molecular-point attachments, the density of cross-bridges was estimated with theassumption that the tension was proportional to the discrete rupture force x the number of attachments per unit length. Theseestimates showed that only a small fraction of agglutinin formed cross-bridges at initial assembly and increased progressively withseparation. When critical tension levels were reached, it appeared that nearly all local agglutinin was involved as cross-bridges.Because one cell surface was chemically fixed, receptor accumulation was unlikely; thus, microscopic "roughness" and stericrepulsion probably modulated formation of cross-bridges on initial contact. To counter the steric repulsion, adhesive contacts wereexposed to solutions of a high molecular weight polymer to draw the surfaces together by osmotic dehydration of the adhesiongap. These stresses exceeded initial mechanical assembly stresses by up to three orders of magnitude. As expected, the strengthof adhesion was greatly enhanced by the added impingement stress.
INTRODUCTION
Recognition and adhesion between cell surfaces areimportant aspects of biological function. In general,these processes are controlled by specialized macromol-ecules to produce adhesion between cell surfaces andsubstrates. Conceptually, molecules are thought to formphysical "cross-bridges" between the two cell surfaces.Such molecules can be native membrane-associatedproteins that bind directly to the other surface (1) ormultivalent proteins in solution that bind to sites on bothsurfaces (2). Although there is considerable interest inidentification and characterization of cell adhesion mol-ecules, most investigations of cell adhesion have beenmore descriptive than quantitative. Microscopic physicalproperties of cell-cell adhesion remain to be determinedmainly because experimental techniques have not been
Address correspondence and reprint requests to Dr. Evans.
adequately designed to directly measure these proper-ties. Adhesion strength is usually evaluated on a relativescale, based on the degree of cell aggregation or on thelevel of force required to disaggregate a multicellularassembly (3). Such measurements are only qualitativebecause aggregation and disaggregation, although drivenby adhesion, involve other factors, e.g., cell deformabil-ity, surface topography, the conditions of cell assembly,and separation.
Presumably, adhesion strength can be related toproperties of discrete cross-bridges. A number of theo-retical models have represented cross-bridges as elastic"springs" with a characteristic energy, force, or displace-ment at which failure occurs (4-6). In other treatments(7-10), cross-bridge formation and breakage were treatedas chemical-thermodynamic reactions that depended ondisplacement through a postulated potential of mean
Biophys. J. Biophysical SocietyVolume 59 April 1991 849-860
00639/10/891 200006-3495/91/04/849/12 $2.00 849

force. A more phenomenological approach has been tointroduce a "fracture energy density" to describe celladhesion (11), a concept developed in the study offracture of materials (12). Fracture energy density is thework (mechanical energy) per unit area required toseparate surfaces. From this observable quantity, thefracture energy per cross-bridge can be estimated if thesurface density of cross-bridges (molecules per area) canbe determined. Precise measurement of the mechanicalwork required to separate adhesive contacts yields an
unequivocal physical property; however, distribution ofthe work as a true energy per cross-bridge involves an
implicit assumption that the cross-bridges are suffi-ciently dense to be treated as a continuum (5). In thelimit of sparse-point attachments between surfaces, thefracture energy approaches the force required to rup-ture a single cross-bridge x the number of attachmentsper unit length along the contact perimeter (6). Identifi-cation of the microscopic determinants of cross-bridgestrength as energy- or force-based also depends onkinetic features of bond formation/release and surfacemobility as well as surface density. Thus, in some cases,"fracture energy" is related to the energies required todissociate cross-bridges whereas, in others, it dependson forces to rupture molecular attachments. In all cases,separation of contacts may or may not involve the bondbetween receptor and agglutinin molecule. The separa-tion may cause other structural failures such as extrac-tion of receptors from the membrane (evidence clearlysupports this type of failure in our cellular detachmentstudies; 13).
In the idealized-classical view, fracture energy densityWf is treated as a reversible-thermodynamic quantitywhich is assumed equal to the "chemical affinity" Wa
between surfaces. The affinity induces stresses in cells asa contact spreads; these stresses can often be deter-mined from the shapes of cell aggregates (11, 14-16). Onthe other hand, measurement of Wf requires the applica-tion of a membrane "peeling" force to reduce thecontact area. In studies of controlled adhesion/separa-tion of artificial lipid-bilayer vesicles, it was demon-strated that adhesion is mechanically reversible (Wa = Wf)in concentrated solutions of large polymers and simpleelectrolyte buffers (17-19); but the vesicle-vesicle adhe-sion did not involve molecular attachments (18-19). Intests of adhesion which involved specific agglutinins, ithas not been possible to characterize contact formationand separation with a single surface energy density. Forexample, in red blood cell aggregation produced by thelectin wheat germ agglutinin (20), adhesion was stronglyirreversible (Wf >> Wa). Similar observations (9) weremade in studies of adhesion between cytotoxic T-lympho-cytes and target cells. However, these experiments (and
others) could not be accurately analyzed to obtainprecise measurements of the membrane tension andcontact angle at the contact perimeter which are neededto define wa and Wf. Also, it appeared that cell surfacereceptor cross-bridges were "dragged" along the surfaceto accumulate at the contact perimeter. In experimentswith more complicated types of cells like white bloodcells (9, 21), analysis becomes even more difficult be-cause the membrane surface is extremely irregular withfolds, projections, and wrinkles which lead to tremen-dous redundancy of membrane between molecular at-tachment sites.To quantitate the strength of membrane adhesion
produced by agglutinins and other adhesion molecules,we have recently designed an experiment based onrigorous analysis that yields the mechanical propertiesintrinsic to formation and separation of large contactareas (22). Here, we have used this approach to studythe mechanics of red cell contact formation and separa-tion mediated by specific agglutinins. The results pro-vide the first unambiguous measurements of "fractureenergy density" for separation of agglutinin-bondedmembranes. We compare a multivalent lectin (HPAfrom the snail helix pomatia) with two bivalent mono-clonal antibodies (MAb) to glycophorin A, the majorsialoglycoprotein of the red blood cell. We also exam-ined the role of nonspecific repulsion between mem-brane surfaces in two ways: (a) MAb's were chosen withbinding sites at two different locations on the samesurface receptor. (b) We examined the ability of impinge-ment stress to overcome nonspecific repulsion with theuse of an "osmotic press" technique where a dehydra-tion stress was applied to the membranes in the contactzone by exclusion of large polymers from the gap.
MICROMECHANICAL TEST PROCEDUREAND METHOD OF ANALYSIS
The following is an outline of the procedure used forassembly of two membrane capsules to form largeadhesive contacts and for subsequent detachment bycontrolled force. In the test procedure, one set of redcells was chemically fixed in the form of smooth spheresto establish rigid surface matrices of receptors (seepaper I for details of preparation, reference 13). Onlycells from this set were bound with agglutinin before theadhesion-detachment tests. (Note: based on microfluo-rometric assay with labeled agglutinins, no appreciablereduction in bound agglutinin was detectable on timescales required for the adhesion experiments.) Assemblyand detachment of a normal (deformable) cell to/from arigid spherical cell was performed with a dual micropi-
850 Biophysical Journal Volume 59 April 1991850 Biophysical Journal Volume 59 April 1991

Evans et al. Detachment of Agglutinin-Bonded Red Blood Cells II 851
400
300$
F(10 dyn)
0 0
200
00
0 2
Dc
(I 0-4 cm)
3 4
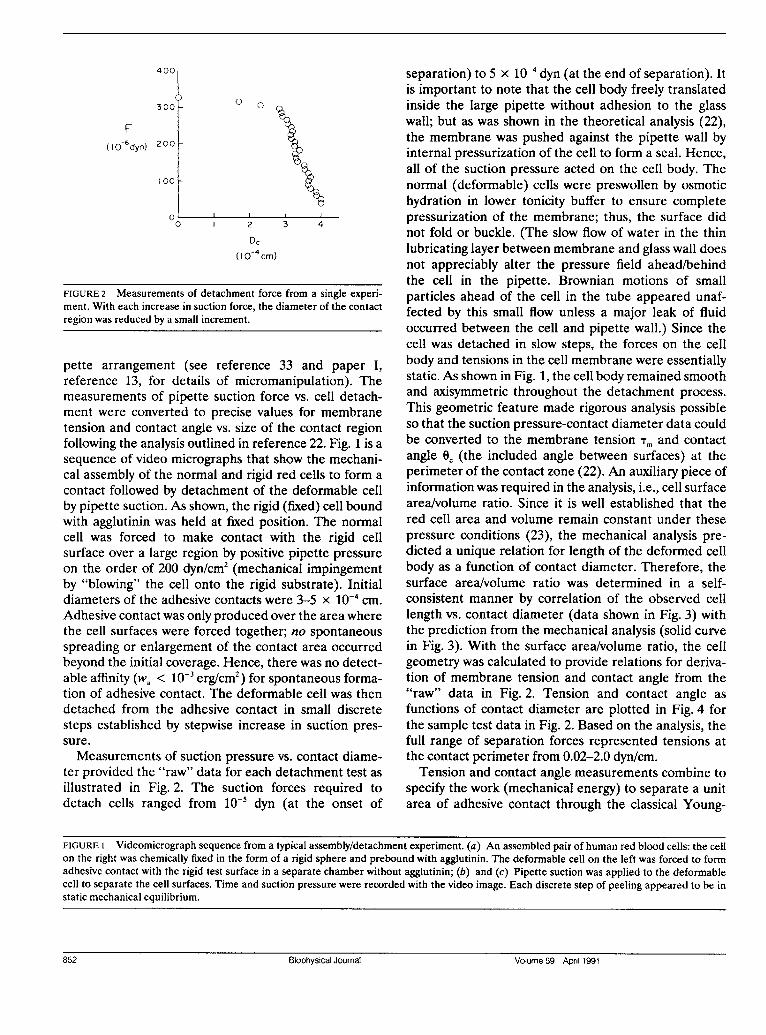
FIGURE 2 Measurements of detachment force from a single experi-ment. With each increase in suction force, the diameter of the contactregion was reduced by a small increment.
pette arrangement (see reference 33 and paper I,
reference 13, for details of micromanipulation). Themeasurements of pipette suction force vs. cell detach-ment were converted to precise values for membranetension and contact angle vs. size of the contact regionfollowing the analysis outlined in reference 22. Fig. 1 is asequence of video micrographs that show the mechani-cal assembly of the normal and rigid red cells to form a
contact followed by detachment of the deformable cellby pipette suction. As shown, the rigid (fixed) cell boundwith agglutinin was held at fixed position. The normalcell was forced to make contact with the rigid cellsurface over a large region by positive pipette pressureon the order of 200 dyn/cm2 (mechanical impingementby "blowing" the cell onto the rigid substrate). Initialdiameters of the adhesive contacts were 3-5 x 10' cm.
Adhesive contact was only produced over the area wherethe cell surfaces were forced together; no spontaneousspreading or enlargement of the contact area occurredbeyond the initial coverage. Hence, there was no detect-able affinity (Wa < 10' erg/cm2) for spontaneous forma-tion of adhesive contact. The deformable cell was thendetached from the adhesive contact in small discretesteps established by stepwise increase in suction pres-sure.
Measurements of suction pressure vs. contact diame-ter provided the "raw" data for each detachment test as
illustrated in Fig. 2. The suction forces required todetach cells ranged from 10- dyn (at the onset of
separation) to 5 x 10' dyn (at the end of separation). Itis important to note that the cell body freely translatedinside the large pipette without adhesion to the glasswall; but as was shown in the theoretical analysis (22),the membrane was pushed against the pipette wall byinternal pressurization of the cell to form a seal. Hence,all of the suction pressure acted on the cell body. Thenormal (deformable) cells were preswollen by osmotichydration in lower tonicity buffer to ensure completepressurization of the membrane; thus, the surface didnot fold or buckle. (The slow flow of water in the thinlubricating layer between membrane and glass wall doesnot appreciably alter the pressure field ahead/behindthe cell in the pipette. Brownian motions of smallparticles ahead of the cell in the tube appeared unaf-fected by this small flow unless a major leak of fluidoccurred between the cell and pipette wall.) Since thecell was detached in slow steps, the forces on the cellbody and tensions in the cell membrane were essentiallystatic. As shown in Fig. 1, the cell body remained smoothand axisymmetric throughout the detachment process.This geometric feature made rigorous analysis possibleso that the suction pressure-contact diameter data couldbe converted to the membrane tension Tm and contactangle Oc (the included angle between surfaces) at theperimeter of the contact zone (22). An auxiliary piece ofinformation was required in the analysis, i.e., cell surfacearea/volume ratio. Since it is well established that thered cell area and volume remain constant under thesepressure conditions (23), the mechanical analysis pre-
dicted a unique relation for length of the deformed cellbody as a function of contact diameter. Therefore, thesurface area/volume ratio was determined in a self-consistent manner by correlation of the observed celllength vs. contact diameter (data shown in Fig. 3) withthe prediction from the mechanical analysis (solid curve
in Fig. 3). With the surface area/volume ratio, the cellgeometry was calculated to provide relations for deriva-tion of membrane tension and contact angle from the"raw" data in Fig. 2. Tension and contact angle as
functions of contact diameter are plotted in Fig. 4 forthe sample test data in Fig. 2. Based on the analysis, thefull range of separation forces represented tensions atthe contact perimeter from 0.02-2.0 dyn/cm.Tension and contact angle measurements combine to
specify the work (mechanical energy) to separate a unitarea of adhesive contact through the classical Young-
Biophysical Journal Volume 59 April 1991
FIGURE 1 Videomicrograph sequence from a typical assembly/detachment experiment. (a) An assembled pair of human red blood cells: the cellon the right was chemically fixed in the form of a rigid sphere and prebound with agglutinin. The deformable cell on the left was forced to formadhesive contact with the rigid test surface in a separate chamber without agglutinin; (b) and (c) Pipette suction was applied to the deformablecell to separate the cell surfaces. Time and suction pressure were recorded with the video image. Each discrete step of peeling appeared to be instatic mechanical equilibrium.
0D 1lX
852 Biophysical Journal Volume59 April 1991

1.0
0.8 F
Tm(dyn/cm)
2 3 4 5
Dc( (0-4CM)
00.6H
0.4
0
0.2
0 2
Do - Dc
(I 0-4 cm)
FIGURE 3 The end-to-end extension of the red cell was measured asfunction of contact diameter. The points are data from the experimentshown in Fig. 2. Mechanical analysis predicts a unique relation thatdepends on cell surface area, volume, and pipette diameter. Theprediction for Rp = 2.3 ,um,A = 135 p.m2, and V = 115 pum3 is the solidcurve.
2.01
1.8
- cos ec 1.6
1.4
Dupre equation,
Wf = Tm (1 Cos Oc)
when higher order terms due to changes in membranebending energy at the contact perimeter are negligible.As indicated by the sharp membrane bend at theperimeter of the contact, bending effects contribute< 1% to the mechanical energies measured here (15, 24).In the experimental tests, "fracture energies" were
directly equal to the mechanical energies for cell separa-tion because dissipation in the cell body and surround-ing fluids was negligible. Because of the geometricproportions and method of detachment, the mechanicalleverage factor (1 - cos Oj) only varied over the range1.2-1.6 in these tests as seen in Fig. 4. Thus, themembrane tension applied at the perimeter of a contactwas a close measure of the "fracture energy density"throughout at each detachment step.
MATERIALS AND OTHER METHODS
Rigid red cell substratesRigid spherical test surfaces were created by chemical fixation ofswollen red blood cells with use of an established procedure (25)described in paper 1 (13).
AgglutininsFor adhesion molecules, we chose two monoclonal antibodies (MAb)that bind to the major sialoglycoprotein of the red blood cellmembrane, glycophorin A, and the lectin (HPA) from edible snail-helix pomatia (obtained from Sigma Chemical Co.) which agglutinatestype A red cells. B14 MAb (full name NBTS/BRIC 14; reference 26) isthought to bind near the hydrophobic bilayer-spanning portion of
0
1.2 F
1.010 2
D. - Dc(10-4 cm)
FIGURE 4 (a) Peeling tension at the perimeter of the contact vs.reduction in the contact diameter calculated from the data in Figs. 2and 3 by mechanical analysis of the cell deformation. (b) Mechanicalleverage factor (1 - cos Oj) calculated with values of contact angle O0at each step of separation (derived from the data in Figs. 2 and 3 bymechanical analysis of cell deformation).
glycophorin (between residues 55 and 70; reference 26). R10 MAb(full name LICR LON R10; reference 27) binds to a more superficialregion of the molecule between residues 25 and 40 (28, 29). HPAlectin has six binding sites for D-GalNAc sugar residues (30). Adhesivesurfaces were prepared by incubation of the fixed red cell spheres in a
buffered solution that contained the antibody or lectin. The surfacedensity of bound agglutinin was estimated by a microfluorometrictechnique described previously (20) or from published data. In themicrofluorometric technique, test surfaces were incubated in antibodyor lectin conjugated with fluorescein isothiocyanate (FITC). Anindividual sphere was transferred to a fluorescence-free chamberunder a fluorescence microscope, and the surface fluorescence wasquantitated by analysis of the video image intensity profile of thefluorescent boundary. A binding curve and Scatchard plot were
constructed from the data for many spheres incubated at differentconcentrations of antibody/lectin. For the antibody, saturation was
taken as the surface density of glycophorin A (0.5-1.0 x 10' per cell or3-7 x 10¹¹/cm2; references 31 and 31a). For HPA, saturation has beenreported to be 2.8 x 10"1/cm2 (3.8 x 10' per cell; reference 32); but ourmicrofluorometric tests yielded order of magnitude higher values2-3 x 10⁶ per cell. To calculate molar concentrations, molecularweights were taken as 150,000 daltons for the MAb's and 79,000daltons for the lectin.
Evans et al. Detachment of Agglutinin-Bonded Red Blood Cells II 853
12
10L
(I 04CM)
(0) lbo(110% QOD
Evans et al. Detachment of Agglutinin-Bonded Red Blood Cells 11 853

Rigid-spherical test surfaces were selected from a chamber thatcontained buffer solution with antibody or lectin and transferred to anadjacent chamber that contained normal red blood cells in buffer butno agglutinin molecules. Thus, assembly of normal cells with the testsurfaces was expected to provide the maximum cross-bridge formationand strength of adhesion. If both surfaces had been coated withadhesive molecules, agglutination would have been reduced becausefewer sites would have been available for cross-bridge formation. Thebuffer solution contained human serum albumin (1 g/100 ml) toprevent adhesion of the normal cell membrane to the glass micropi-pette.
Osmotic dehydration of adhesivecontactsDextran (Pharmacia, Sweden) with a weight-averaged molecularweight of 147,000 was added to the phosphate-buffered saline toobtain concentrations in a range from 0.5 to 10.0 g/100 ml. Thissolution was injected into a third chamber on the microscope stage. Inone set of tests, a rigid spherical cell was first transferred to theantibody/lectin-free chamber and an adhesive contact was made with a
normal erythrocyte. Next, the adherent pair was transferred to thechamber that contained dextran solution, held for 1 min, and thentransferred back to the saline chamber for the separation test. In othertests, normal cells were assembled with rigid spherical cells directly indextran solution then separated. No difference in results was observedbetween these two sets of tests; thus, it was concluded that dextran wasexcluded from the gap between surfaces and hence acted to dehydratethe gap. As such, the surfaces were forced together with a normal forceequal to the difference between osmotic pressures in the gap and thebulk solution (19). Based on the first and second virial coefficientsdetermined for dextran by osmometry (19), the osmotic stress was
calculated from the following equation:
Posm = (2.58 x 10⁵)c + (3.63 x 10⁷)c2 dyn/cm2,
where c is the dextran concentration in grams per cubic centimeter.
RESULTS
Strengthening of adhesion byseparationIn nearly 100 separation tests with the three agglutinins,the same type of relation was observed between tensionand reduction in contact diameter: i.e., the tensionrequired to separate a contact began at low valuesbetween 10-2-10` dyn/cm, increased linearly with reduc-tion in contact diameter (over most of the change incontact area), and reached ultimate values at least anorder of magnitude higher (-1 dyn/cm or more). Theseobservations were in marked contrast to the behaviorpredicted for separation of an "ideal" adhesive contact:i.e., the tension required to separate a contact shouldremain constant throughout detachment provided thecontact angle is fixed. As noted in the previous section,variation of contact angle in these experiments contrib-uted only a maximum of 30% change to the mechanical
leverage factor and thus were not sufficient to accountfor the tension increase with separation. Because theinitial linear increase in tension was common to all tests,it was apparent that strength of adhesion could bequantitated by a phenomenological "adhesion energygradient" Kf defined by the increase in tension divided bydecrease in contact diameter (or perimeter length ifnormalized by ir). In exceptional situations, the contactseparated in nearly ideal fashion when high levels oftension were reached (i.e., at this "critical" tension, thecontact separated smoothly without further increase intension). Thus, the critical tension was also an importantcharacteristic of the strength of adhesion. However, thislevel of tension was achieved in only a few special cases(to be described).
Effect of rate of detachmentThe unexpected necessity to increase the "peeling"tension suggested that microscopic dissipation and ki-netic effects may have been important factors. However,no obvious motion ("creep") of the membrane was
observed after each incremental reduction of contactsize in respone to increase in suction force. Because ofthis quasi-static behavior, large-scale time-dependentprocesses were not significant. To examine possiblemicroscopic effects, the rate of separation was changedby increase or decrease in the ramp rate of application ofthe suction force. For this purpose, the pipette suctionwas increased at fixed rates in the range from 1 to 20dyn/cm2/s (force rates 0.2-4.0 x 10' dyn/s). For this
range of rates of force application, complete separationoccurred in time intervals from as short as 2 min up to aslong as 30 min. The effects of separation rate werestudied for adhesive contacts produced only by the lectin(HPA) because separation of adhesive contacts bondedby the other agglutinins exhibited the same mechanicalbehavior (as will be shown). In Fig. 5, data are plottedfrom individual tests with three force application ratesthat cover the full range. As shown, the tension vs.reduction in contact diameter did not depend on rate ofseparation. Table 1 presents the cumulated values of"adhesion energy gradients" Kf measured in all of thetests; again, there is no apparent dependence on rate ofseparation. When the separation rate was very large,greater variations in the gradient were observed. If theseparation was very slow (over 20 min), other practicalproblems were encountered, e.g., evaporation of waterfrom the microscope chamber caused shrinkage of theadherent cell. Consequently, the decision was to in-crease pressure at a rate of 8 dyn/cm2/s (forcerate 1.4 x 10⁶ dyn/s) in all subsequent experiments.For this rate, detachment times varied from 30 s for
854 Biophysical Journal Volume 59 April 1991854 Biophysical Journal Volume 59 April 1991

2.0
Tm
(dyn/cm)
(HPA. 1.3 x 10⁻⁷ M)
0 D.= 4.7 rate=0.2 (xIO6dyn/sec)A 3.6 1.6* 4.6 3.3
1.5 F
1.0 _
0.5 F
* *2* i
* 0
A*0
A*0A *Q
A *0A °
0*
0 2 3
Do - Dc
(10-4 cm)
FIGURE 5 Peeling tension vs. reduction in contact diameter for threeadherent cell pairs agglutinated with HPA. Rigid test cell surfaceswere incubated in 1.3 x 10⁻⁷ M HPA. For detachment, separationforce was applied at average rates of 0.2 x 10⁻⁶ dyn/s, 1.6 x 10⁻⁶ dyn/s,and 3.3 x 10⁻⁶ dyn/s. Initial diameters D. (micrometer) of the contactsare listed in the figure.
weakly adherent cells to over 6 min for strongly adherentcells.
Effects of agglutininAs noted, the stiffening response to detachment of redcells from large contact areas was the same for cellsbonded with all of the agglutinins. However, importantdifferences were observed in the magnitudes of theadhesion energy gradient Kf in each case. Thus, theresults are examined in the context of the agglutininproperties: i.e., B14 MAb binds deep in the surfaceglycocalyx close to the lipid bilayer; R10 MAb binds tothe same receptor but more superficially ( - 30 peptidesor 45 A further out); and HPA lectin binds to sugarspresumably on other membrane receptors but at un-known depths. In the first set of tests, adhesive contactswere initiated simply by mechanical impingement. Withinthe contact region, mechanical impingement impartedcompressive stresses (through an initial positive pipette
TABLE 1 Efect of separation rate on the strengthening ofadhesion for hpa agglutinated cells
KfRate of force Adhesion energyapplication gradient ± S.D. n
10-6 dynis dyn/cm/104 cm dyn/cm/104 cm0.33 0.44 0.07 71.6 0.40 0.09 63.3 0.43 0.15 9
pressure) which were only on the order of 102 dyn/cm2. Itwas not surprising, therefore, that adhesive contactsbetween normal cells and test surfaces bound with B14MAb were very weak. Indeed, it was not possible to formlarge contact areas and total detachment of adherentcells occurred at suction forces < 20 x 10' dyn. The testsurfaces were incubated in 7 x 10' M and 3 x 10-' Msolutions of the B14 MAb. Based on an estimatedassociation constant of 3 x 10⁵M-l, between 20-50%
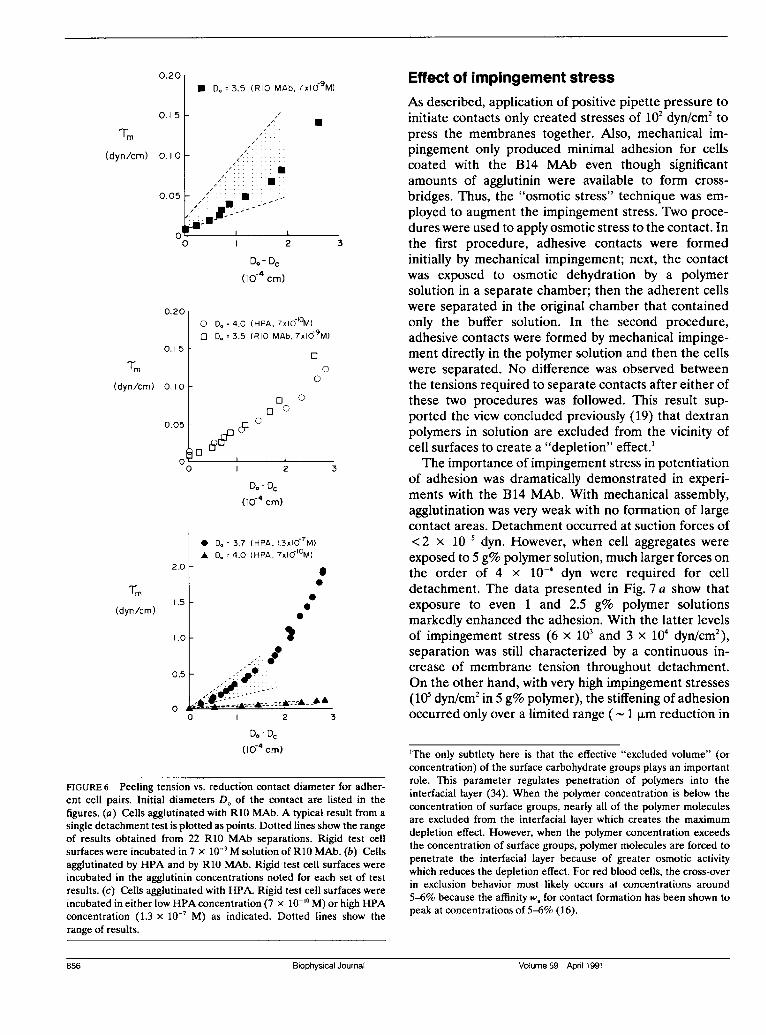
of the glycophorin A molecules were likely bound withantibody, yet the level of adhesion was insignificant.(Note: insufficient amounts of B14 MAb were availablefor labeling and use in microfluorometric assay ofbinding.) On the other hand, for cells exposed to R10MAb at similar solution concentrations, significant lev-els of adhesion and large contact areas were producedby mechanical impingement. Fig. 6 a shows measure-ments from a typical separation experiment plus thetotal range of results obtained with rigid cells incubatedat low R10 MAb concentration (7 x 10- M). As shown,separation commenced when tensions of approximately10-2 dyn/cm were applied at the perimeter of adhesivecontacts. Each reduction in contact diameter requiredan increase in tension until the cell was detached fromthe rigid test cell. At cell detachment, the tension levelreached 0.15-0.2 dyn/cm, an order of magnitude greaterthan the initial tension. Over the first few micronreduction in contact diameter (which began in the range
of 3-5 x 10' cm), the dependence of tension on contactdiameter was always approximately linear.As shown in Fig. 5, cells agglutinated with the lectin
HPA exhibited the same detachment behavior as theR10 MAb-agglutinated cells. For comparison, results fordetachment of a cell from a test surface bound with lowlevels of HPA are plotted in Fig. 6 b along with resultsfrom a detachment test for R10-MAb. These dataappear virtually identical. However, when test surfaceswere incubated in higher concentrations of HPA, muchlarger tensions were needed to achieve comparableseparations. Fig. 6 c shows the range of results forseparation of cells bound at low HPA (7 x 10`l° M) andhigh HPA (1.3 x 10⁻⁷ M) concentrations. For high HPAconcentrations, tensions were as large as 4 dyn/cm! Atlow HPA surface binding, the increase of tension overthe first 2 ,um reduction in contact diameter (- 75% of
the contact area) was characterized by a gradient Kf of2 x 10-2 dyn/cm/p,m (s.d. 5 x 10' dyn/cm/,Lm for five
tests). At high HPA surface binding, the gradient Kfparameter was a factor of 20 larger, 0.4 dyn/cml,m, overthe initial stage of separation (s.d. 9 x 10⁻² dyn/cm/l,mfor 22 tests). Based on an association constant of 107M-1, the surface density at the higher concentration wasestimated to be almost 100 times that at the lowerconcentration.
Evneta. Deahmn ofAgg.utinin-B.nded Red Blood Cells..85
us
Evans et al. Detachment of Agglutinin-Bonded Red Blood Cells 11 855
0.201* D, = 3.5 (RIO MAb, 7xlO9M)
0.1 5
Tm
(dyn/cm)
.
o. o
0.05
UmI,
,............. 0....... ..... .._...
,/ .. ......_..
Il
2 3
Do( Dc(I10-4 cm)
0.20,
0.1 5 F
Tm
(dyn/cm) 0.1 0
O Do = 4.0 (HPA, 7x10'M)0 D.= 3.5 (RIO MAb, 7xIO9M)
0
0
0
5 C0
0
0 2 3
Do - Dc(10-4 cm)
2.0
Tm
(dyn/cm)1.5
* Do= 3.7 (HPA, 1.3x10¹⁷M)v Do = 4.0 (HPA, 7xl I'OM)
0
0
0
0
I.0 F
0.5
0
0
04
5 ," <
I. ......
2w_: 3A,. n.--s- ---A- ;-
.0 2 3
Do(- DC(I10-i4 cm)
FIGURE 6 Peeling tension vs. reduction contact diameter for adher-ent cell pairs. Initial diameters Do of the contact are listed in thefigures. (a) Cells agglutinated with R10 MAb. A typical result from asingle detachment test is plotted as points. Dotted lines show the rangeof results obtained from 22 R10 MAb separations. Rigid test cellsurfaces were incubated in 7 x 10- M solution of R10 MAb. (b) Cellsagglutinated by HPA and by R10 MAb. Rigid test cell surfaces wereincubated in the agglutinin concentrations noted for each set of testresults. (c) Cells agglutinated with HPA. Rigid test cell surfaces wereincubated in either low HPA concentration (7 x 10`' M) or high HPAconcentration (1.3 x 10' M) as indicated. Dotted lines show therange of results.
Effect of impingement stressAs described, application of positive pipette pressure toinitiate contacts only created stresses of 102 dyn/cm2 topress the membranes together. Also, mechanical im-pingement only produced minimal adhesion for cellscoated with the B14 MAb even though significantamounts of agglutinin were available to form cross-bridges. Thus, the "osmotic stress" technique was em-ployed to augment the impingement stress. Two proce-dures were used to apply osmotic stress to the contact. Inthe first procedure, adhesive contacts were formedinitially by mechanical impingement; next, the contactwas exposed to osmotic dehydration by a polymersolution in a separate chamber; then the adherent cellswere separated in the original chamber that containedonly the buffer solution. In the second procedure,adhesive contacts were formed by mechanical impinge-ment directly in the polymer solution and then the cellswere separated. No difference was observed betweenthe tensions required to separate contacts after either ofthese two procedures was followed. This result sup-ported the view concluded previously (19) that dextranpolymers in solution are excluded from the vicinity ofcell surfaces to create a "depletion" effect.1The importance of impingement stress in potentiation
of adhesion was dramatically demonstrated in experi-ments with the B14 MAb. With mechanical assembly,agglutination was very weak with no formation of largecontact areas. Detachment occurred at suction forces of<2 x 10⁻⁵ dyn. However, when cell aggregates wereexposed to 5 g% polymer solution, much larger forces onthe order of 4 x 10⁻⁴ dyn were required for celldetachment. The data presented in Fig. 7 a show thatexposure to even 1 and 2.5 g% polymer solutionsmarkedly enhanced the adhesion. With the latter levelsof impingement stress (6 x 10³ and 3 x 10⁴ dyn/cm2),separation was still characterized by a continuous in-crease of membrane tension throughout detachment.On the other hand, with very high impingement stresses(105 dyn/cm2 in 5 g% polymer), the stiffening of adhesionoccurred only over a limited range ( - 1 p,m reduction in
'The only subtlety here is that the effective "excluded volume" (orconcentration) of the surface carbohydrate groups plays an importantrole. This parameter regulates penetration of polymers into theinterfacial layer (34). When the polymer concentration is below theconcentration of surface groups, nearly all of the polymer moleculesare excluded from the interfacial layer which creates the maximumdepletion effect. However, when the polymer concentration exceedsthe concentration of surface groups, polymer molecules are forced topenetrate the interfacial layer because of greater osmotic activitywhich reduces the depletion effect. For red blood cells, the cross-overin exclusion behavior most likely occurs at concentrations around5-6% because the affinity w, for contact formation has been shown topeak at concentrations of 5-6% (16).
856 Biophysical Journal Volume 59 April 1991
O.C
856 Biophysical Journal Volume 59 April 1991

0.8 F0A0
(B14 MAb. 7xlOC9M)
5.0 9% D. = 4.72.5g% 4.41.0g% 4.1
§ critical tension
0.6 F(O
0.4 AA
AA0.2 8 A
00
0 ~~2 3
D.i- Dc
(10-4 cm)
0.61
0.4
0.2
0
0A0
(RIO MAb. 7x 10 M)
5g% D. = 4.21g% 4.3
Og% 3.5
criticaltension
0
O A
O A0
0A
3
Do( DC(I10-4 cm)
FIGURE 7 Peeling tension vs. reduction in contact diameter for threeadherent cell pairs. After assembly, each adherent contact wasexposed to osmotic dehydration in a dextran polymer solution (concen-tration listed above) then separated. Initial diameters D. of contactsare given for each test. (a) Cells agglutinated with B14 MAb. Rigidtest cell surfaces were incubated in 7 x 10- M solution of B14 MAb.(b) Cells agglutinated with R10 MAb. Rigid test cell surfaces wereincubated in 7 x 10- M solution of RIO MAb.
served in separation of cells assembled by mechanicalimpingement alone.The same dramatic augmentation in strength of adhe-
sion was observed for R10 MAb-agglutinated cells thathad been stressed by the polymer solutions as shown inFig. 7 b. For cells assembled only by mechanical impinge-ment, the tension increased up to a maximum value of0.2 dyn/cm or less. By comparison, adherent cells ex-posed to 1 g% polymer required a much larger increasein tension for separation; at detachment, the maximumtension reached 0.6 dyn/cm in these tests. Adherent cellsstressed by 5 g% polymer required even greater in-creases in tension for comparable separations, but themaximum tension remained at 0.6 dyn/cm. As in the B14MAb studies, rapid detachment followed when thetension reached 0.6 dyn/cm (after 1-2 ,m reduction incontact diameter). This critical tension was found inseparation tests with R10 MAb agglutinated cells ex-posed to 1, 2.5, and 10 g% polymer solutions. Thecritical tensions appeared to be almost identical for cellsagglutinated by either MAb to red cell glycophorin.Another common feature was that exposure to even lowpolymer concentrations (0.5 g% - 2 x 10³ dyn/cm2 stress)augmented adhesion. However, the stiffening of adhe-sive contacts after exposure to the polymer solutions wasnoticeably different for each MAb as shown in Fig. 7.
Exposure to polymer stress produced little effect onadhesion strength for lectin HPA-agglutinated cells.This result was very surprising since measurements withtest surfaces incubated in either 7 x 10- M R10 MAb or7 x 10-10 M HPA led to similar strengths of adhesion(Fig. 6 b); and exposure of the R10 MAb-agglutinatedcells to polymer stress strengthened adhesion by asmuch as 600%. However, for HPA-agglutinated cells,stiffening of adhesion with separation was only 50%greater on the average for adherent cells exposed topolymer solutions than for cells assembled only bymechanical impingement. Another significant differencefrom the antibody tests was that a critical tension wasnever observed with HPA-agglutinated cells.
contact diameter). Then, the tension reached a criticallevel ( - 0.7 dyn/cm) where a large reduction in contact
diameter suddenly occurred and the cell detached. Thisbehavior suggested that, after a small separation, theperimeter of the adhesive contact became saturated withcross-bridges to reach the ultimate adhesive strength.Apparently, direct application of the osmotic impinge-ment stress was not sufficient to cause complete forma-tion of cross-bridges. Although separation was initiatedat low tensions, the gradient Kf of the adhesive contactwas greatly increased by added impingement stress andled to the apparently "ideal" separation behavior at thecritical tension. This type of behavior was never ob-
CONCLUSIONS AND DISCUSSION
These results clearly show that detachment of antibodyand lectin-agglutinated red cells does not obey the ideal"fracture energy" law where surfaces separate continu-ously at a constant mechanical energy per unit area. Inall separations of agglutinin-bonded red blood cells, acommon amplification of adhesion was observed wherethe tension increased progressively with reduction incontact diameter (perimeter) usually over 75-80% ofthe contact area. The adhesion energy gradient de-pended strongly on the amount of agglutinin bound to
Evans et al. Detachment of Agglutinin-Bonded Red BlOOd Cells II 857
Tm
(dyn/cm)
Tm
(dyn/cm)
Evans et al. Detachment of Agglutinin-Bonded Red Blood Cells 11 857

the test cell surface and the level of impingement stressapplied to the initial contact. However, for fixed condi-tions (impingement stress and amount of agglutininbound to the test surface), the tension measurementsdid not depend on initial size of the contact or the rate ofseparation. Thus, we conclude that time-dependentprocesses at the microscopic level were not affected bythe rate of separation. (Based on the rates of "peeling"[ 4 x 10-24 x 10-3 pm/s], single molecular cross-
bridges were stressed for periods of 1-10 s beforerupture.) In special cases, cells separated smoothly at a
critical tension without further increase in detachmentforce. The critical tension was reached only in tests ofcells agglutinated with the monoclonal antibodies toglycophorin and where cell contacts had been subjectedto compression by osmotic dehydration in polymersolutions. In tests with the HPA lectin, no criticaltension was observed even though much higher levels oftension were required to separate contacts in somecases.
In previous studies (9, 20), it appeared that thestrengthening of adhesion was due to accumulation ofcross-bridges at the perimeter of the contact. Consistentwith this concept, micromechanical analysis (6) hasshown that cross-bridges at the perimeter of the contactare subject to a small force parallel to the surface as wellas the dominant rupture force normal to the surface.Thus, if membrane receptors are mobile, cross-bridgescould be dragged inward to produce accumulation andaugmentation of the adhesive strength. Also, if receptor-agglutinin bonds are chemically labile, the lateral forcecould produce an energy gradient sufficient to driveagglutinin into the contact zone. Even though theseeffects may lead to cross-bridge accumulation in manycases, this mechanism did not seem likely in the antibodyagglutination experiments reported here. The proteinsin one of the adherent cell surfaces were rigidly cross-linked and showed no evidence of mobility. However, itwas possible that HPA receptors remained mobilebecause it is known that HPA binds to glycolipids in thecell surface. Also, when large regions of adhesive con-tact were agglutinated by fluorescently labeled MAbmolecules then separated, no bright ring was observed atthe perimeter of the contact region. Further, othercircumstantial evidence indicated that accumulation wasnot the major source for strengthening of the adhesivecontact. For instance, no time-dependent changes wereobserved in contact formation (i.e., contacts did notspread) and the "fracture energies" did not depend onrate of separation; this implied that cross-bridges were
locally restrictediand sparsely distributed. As an alterna-tive to cross-bridge accumulation, we propose thatseparation progressively increased the fraction of sur-face area in intimate contact and thereby induced
additional agglutinin to form molecular attachments.The reasoning is as follows:Although red cell surfaces appear smooth in the light
microscope, they are actually rough and irregular on themesoscopic scale below optical resolution. For example,scanning electron micrographs of the rigid test cellsurfaces have revealed small asperities. Also, freeze-fracture micrographs of flexible red cell surfaces exhibittopological variations with amplitudes of a few hundredAngstroms over distances of 103 A (E. Sackmann,personal communication). Even when surfaces arepressed together with a large impingement stress, molec-ular attachments probably lock in much of this rough-ness to frustrate continuous contact between surfaces.In fact, when cell suspensions are aggregated by un-controlled agglutination, regions of intimate contact areinterrupted in the adhesion zone by large intervals ofwide gaps between the surfaces (35). Hence, initialformation of contact probably produces only a fewmolecular attachments even though many more ag-glutinin sites are present. Given this topographical"roughness," mechanical actions local to the contactperimeter may be important in increasing the fraction ofsmooth surface contact. The mechanism is predictedfrom analysis of separation of a flexible membrane thatis bonded at discrete points to a substrate (6). Whentension is applied to the membrane, bending stresses atthe perimeter of the contact assert disjoining forces onlocal molecular cross-bridges which lead to rupture andseparation. But as the membrane pulls-up on cross-bridges, the membrane region interior to an attachmentsite experiences a large compressive stress that pushesthe surfaces together. Conceptually, the membrane actsas a lever: i.e., the tension-force is applied about afulcrum (the perimeter cross-bridges) and pushes themembrane against the substrate interior to the attach-ment site. Both the magnitude of the compressive stressand the size of the membrane region affected by compres-sion increase with the level of tension applied to themembrane which leads to the proportional increase thelocal density of molecular attachments as tension in-creases. In addition to pressing surfaces toward oneanother, the mechanical action of "peeling" also trans-lates the membrane laterally to smooth out irregulari-ties. Hence, the progressive increase in adhesion strengthcould represent proportional recruitment ofbound agglu-tinin as cross-bridges. As such, values measured forcritical tensions should correspond to complete partici-pation of local agglutinin molecules as cross-bridges.To examine the assumptions and predictions of this
mechanism for amplification of the "fracture" strength,we have estimated the "apparent" surface densities ofcross-bridges over the course of cell detachment. The"apparent" surface density can be deduced from the
85 ipyiclJunl oue5 Arl19858 Biophysical Journal Volume 59 April 1991

force per unit perimeter length (tension required toseparate the contact) divided by the force required torupture a single molecular cross-bridge (this ratio issquared to obtain an estimate of surface density). In thefirst paper (13), values of the force to rupture singlemolecular attachments were obtained for the sameantibodies and lectins. Surprisingly, the detachmentforce was found to be between 1-2 x 10⁻⁶ dyn for all ofthe agglutinin types (13). Thus, for low tensions requiredto commence separation (10-2 dyn/cm), attachmentdensities would be on the order of 108/cm2, i.e., therewould only be 10-15 attachment sites along the initialperimeter of the contact. By comparison, critical ten-sions for separation of the MAb agglutinated cells were0.6-0.7 dyn/cm; the values imply a maximum surfacedensity of 4-5 x 10ll/cm2 for these antibodies (whichare comparable to the values published for surfacedensity of glycophorin A in red blood cell membranes,reference 31). On the other hand for the HPA lectin,critical tensions were never observed even though ten-sions were as large as 4 dyn/cm. Tensions of thismagnitude indicate that the surface density of attach-ments would be very large on the order of 10l3/cm2. Thus,there would only be 30 A between sites along thecontact perimeter which seems surprising unless lectin-receptor complexes were accumulated at the edge of thecontact. Also, because of the high surface density ofattachments, a significant number of cross-bridges inte-rior to the contact perimeter were stressed and contrib-uted to the strength of adhesion. Thus, the assumptionthat only attachments along the perimeter supported themembrane stress would no longer be valid.
This work was supported by the U.S. National Institutes of Healththrough grants HLA5099 and HL31579.
REFERENCES
1. Sell, S. 1987. Immunology, Immunopathology, and Immunity.Elsevier, New York. 852 pp.
2. Edelman, G. M. 1983. Cell adhesion molecules. Science (Wash.DC.). 219:450-457.
3. Greig, R., and D. E. Brooks. 1979. Shear induced concanavalin Aagglutination of human erythrocytes. Nature (Lond.). 282:738-739.
4. Bell, G. I. 1978. Models for the specific adhesion of cells to cells.Science (Wash. DC.). 200:618-627.
5. Evans, E. A. 1985. Detailed mechanics of membrane-membraneadhesion and separation. I. Continuum of molecular cross-bridges. Biophys. J. 48:175-183.
6. Evans, E. A. 1985. Detailed mechanics of membrane-membraneadhesion and separation. II. Discrete kinetically-trapped molec-ular cross-bridges. Biophys. J. 48:185-192.
7. Bell, G. I., M. Dembo, and P. Bongrand. 1984. Cell adhesion:
competition between nonspecific repulsion and specific bonding.Biophys. J. 45:1051-1064.
8. Dembo, M., D. C. Torney, K. Saxman, and D. Hammer. 1988. Thereaction-limited kinetics of membrane-to-surface adhesion anddetachment. Proc. R Soc. Lond. B 234:55-83.
9. Tozeren, A., K.-LP. Sung, and S. Chien. 1989. Theoretical andexperimental studies on cross-bridge migration during celldisaggregation. Biophys. J. 55:479-487.
10. Hammer, D. A., and D. A. Lauffenburger. 1987. A dynamicalmodel for receptor-mediated adhesion to surfaces. Biophys. J.52:475-487.
11. Skalak, R., P. R. Zarda, K.-M. Jan, and S. Chien. 1981. Mechanicsof rouleau formation. Biophys. J. 35:771-781.
12. Griffith, A. A. 1921. The phenomena of rupture and flow in solids.Phil. Trans. Roy. Soc. Lond. A. 221:163-198.
13. Evans, E., A. Leung, and D. Berk. 1990. Detachment of agglutinin-bonded red blood cells. I. Forces to rupture molecular-pointattachments. Biophys. J. 59:838-848.
14. Evans, E. A. 1980. Minimum energy analysis of membranedeformation applied to pipette aspiration and surface adhesionof red blood cells. Biophys. J. 30:265-284.
15. Evans, E. A., and K. Buxbaum. 1981. Affinity of red blood cellmembrane for particle surfaces measured by the extent ofparticle encapsulation. Biophys. J. 34:1-12.
16. Buxbaum, K., E. Evans, and D. E. Brooks. 1982. Quantitation ofsurface affinities of red blood cells in dextran solutions andplasma. Biochemistry. 21:3235-3239.
17. Evans, E. A., and M. Metcalfe. 1984. Free energy potential foraggregation of mixed PC:PS lipid vesicles in glucose polymer(dextran) solutions. Biophys. J. 457:715-720.
18. Evans, E., and D. Needham. 1987. Physical properties of surfac-tant bilayer membranes: thermal transitions, elasticity, rigidity,cohesion and colloidal interactions. J. Phys. Chem. 91:4219-4228.
19. Evans, E., and D. Needham. 1988. Interactions between lipidbilayer membranes in concentrated aqueous solutions of non-adsorbing polymers: comparison of mean-field theory with directmeasurement of adhesion energy. Macromol. 21:1822-1831.
20. Evans, E., and A. Leung. 1984. Adhesivity and rigidity of erythro-cyte membrane in relation to wheat germ agglutinin binding. J.Cell Biol. 98:1201-1208.
21. Sung, K.-LP., L. A. Sung, M. Crimmins, S. J. Burakoff, and S.Chien. 1986. Determination ofjunction avidity of cytolytic T celland target cell. Science (Wash. DC.). 234:1405-1408.
22. Berk, D., and E. Evans. 1990. Detachment of agglutinin bondedred blood cells. III. Mechanical analysis for large contact areas.Biophys. J. 59:861-872.
23. Evans, E. A., and R. Skalak. 1980. Mechanics and Thermodynam-ics of Biomembranes. CRC Press, Inc., Boca Raton, FL. 254 pp.
24. Evans, E. 1990. Adhesion of surfactant-membrane covered drop-lets: special features and curvature elasticity effects. ColloidsSurfaces. 43:327-347.
25. Tha, S. P., J. Shuster, and H. L. Goldsmith. 1986. Interactionforces between red cells agglutinated by antibody. II. Measure-ment of hydrodynamic force of breakup. Biophys. J. 50:1117-1126.
26. Ridgwell, K., M. J. A. Tanner, and D. J. Anstee. 1983. The Wrbantigen, a receptor for plasmodium falciparum malaria, islocated on a helical region of the major membrane sialoglycopro-tein of human red blood cells. Biochem. J. 209:273-276.
27. Edwards, P. A. W. 1980. Monoclonal antibodies that bind to the
Evans et al. Detachment of Agglutinin-Bonded Red Blood Cells 11 859

human erythrocyte-membrane glycoproteins glycophorin A andband 3. Biochem. Soc. Trans. 8:334.
28. Anstee, D. J., and P. A. W. Edwards. 1982. Monoclonal antibodiesto human erythrocytes. Eur. J. Immunol. 12:228-232.
29. Bigbee, W. L., M. Vanderlaan, S. S. N. Fong, and R. H. Jensen.1983. Monoclonal antibodies specific for the M- and N-forms ofhuman glycophorin A. Molec. Immunol. 20:1353-1362.
30. Hammarstrom, S., and E. A. Kabat. 1971. Studies on specificityand binding properties of the blood group A reactive hemagglu-tinin from Helix pomatia. Biochemistry. 10:1684-1692.
31. Steck, T. L. 1974. The organization of proteins in the human redblood cell membrane: a review. J. Cell Biol. 62:1-19.
31a. Gahmberg, C. G., M. Jokinen, and L. C. Andersson. 1979. J. Biol.Chem. 254:7442-7448.
32. Sung, L. A., E. A. Kabat, and S. Chien. 1985. Interaction of lectinswith membrane receptors on erythrocyte surfaces. J. Cell Biol.101:646-651.
33. Evans, E. 1988. Micromethods for measurement of deformabilityand adhesivity properties of blood cells and synthetic membranevesicles. In Physical Basis of Cell-Cell Adhesion. P. Bongrand,editor. CRC Press, Boca Raton, FL. 173-189.
34. Gast, A. P., and L. Leibler. 1986. Interactions of stericallystabilized particles suspended in a polymer solution. Macromol.19:686-691.
35. Coakley, W. T., L. A. Hewison, and D. Tilley. 1985. Interfacialinstability and the agglutination of erythrocytes by polylysine.Eur. Biophys. J. 13:123-130.
860 Biophysical Journal Volume 59 April 1991