dessertation
TRANSCRIPT

Qwertyuiopasdfghjklzxcvbnmqw
ertyuiopasdfghjklzxcvbnmqwert
yuiopasdfghjklzxcvbnmqwertyui
opasdfghjklzxcvbnmqwertyuiopa
sdfghjklzxcvbnmqwertyuiopasdf
ghjklzxcvbnmqwertyuiopasdfghj
klzxcvbnmqwertyuiopasdfghjklz
xcvbnmqwertyuiopasdfghjklzxcv
bnmqwertyuiopasdfghjklzxcvbn
mqwertyuiopasdfghjklzxcvbnmq
wertyuiopasdfghjklzxcvbnmq A THESIS SUBMITTED AS A PARTIAL FULFILMENT OF
THE REQUIREMENTS FOR THE DEGREE OF
MASTER OF SCIENCE
IN
ENVIRONMENTAL SYSTEM MANAGEMENT
PRESIDENCY COLLEGE, KOLKATA
(AUTONOMOUS)
UNDER THE UNIVERSITY OF CALCUTTA
2011
hjklzxcvbnmqwertyuiopasdfghjk
lzxcvbnmqwertyuiopasdfghjklzx
STUDY OF THE STATE OF THE
ENVIRONMENT IN & AROUND SURVEY PARK,
SANTOSH PUR, KOLKATA BY
MOUMITA ROY
Roll No. Pc/ ESM/ 1006
Registration No. 110965 of 2006-2007

1 | P a g e
GOVERNMENT OF WEST BENGAL
This is to certify that Ms. MOUMITA ROY has carried out her dissertation work
on
“STUDY OF THE STATE OF THEENVIRONMENT IN & AROUND SURVEY PARK, SANTOSH PUR, KOLKATA”
under my guidance in partial fulfilment of the requirements of her M. Sc.
Examination, 2011 in Environmental System Management of Presidency College,
Kolkata (Autonomous) under the University of Calcutta.
Countersigned :
…..…………………. ………………………………………...
(DR. RABINDRA K. ROY)
Guest Professor
Department of Applied Geology
&
Environmental System Management,
Presidency College, Kolkata.
PRESIDENCY COLLEGE, KOLKATA
86/1, COLLEGE STREET, KOLKATA. INDIA 700073.
Tel: **91-33-22192636, **91-33-22411960 (Extn. 207)
DEPARTMENT OF APPLIED GEOLOGY &
ENVIRONMENTAL SYSTEM MANAGEMENT
2 | P a g e
“STUDY OF THE STATE OF THE ENVIRONMENT IN & AROUND
SURVEY PARK, SANTOSH PUR, KOLKATA”
A THESIS SUBMITTED AS A PARTIAL FULFILMENT OF
THE REQUIREMENTS FOR THE DEGREE OF
MASTER OF SCIENCE
IN
ENVIRONMENTAL SYSTEM MANAGEMENT
PRESIDENCY COLLEGE, KOLKATA
(AUTONOMOUS)
UNDER THE UNIVERSITY OF CALCUTTA
2011
MOUMITA ROY
Roll No. Pc/ ESM/ 1006
Registration No. 110965 of 2006-2007
DEPARTMENT OF APPLIED GEOLOGY
&
ENVIRONMENTAL SYSTEM MANAGEMENT
PRESIDENCY COLLEGE, KOLKATA

3 | P a g e
PREFACE
Studies pertaining to environment have become an essential
components in any residential area of Kolkata like any kind
Metropolitan area. The concept of “study of environmental status of a residential place” entirely depends on evaluation
different environmental parameters. As a result,
understanding those environmental perspectives & issues is
the essential need of the residents of that area. This
dissertation is aimed to initiate an awareness on the
environmental statu of the areas. With this backdrop this
dissertation is designed to bring out the holistic components
of Environmental condition. Thu,s the approach in this
project is to synthesize the different facets of environment
& to highlight its perspectives & issues which form the
basic components in the environmental curriculum of a place
of our ecosystem. The inter/multi disciplinary nature of
environment has been given sharper focus for understanding
the impact of the study on the society of the area.

4 | P a g e
CONTENT
Title Preface
Abstract
Introduction
Objective
Literature Review
Location Selection Of Study Area
selection Of 3 Ponds to Measure
considerable Parameters
Uses of Ponds
Valuation of Water bodies
Valuation of Ponds Of Survey Park
Role Of Ponds Comparison Between Wetlands & urban Ponds in Kolkata History Of Study Area
Present Status Of Study Area
Methodology
Field Survey
Sampling
Laboratory Method
Determination Of Environmental Quality
Rainfall & climate

5 | P a g e
The climatic Transformation of the
study area
Geomorphology & Soil Types
General geology of the area
Ground Water Resources
Ground Water Quality
Ground Water related Issues &
Problems
Drainage System In The Study Area
Biodiversity Of Study Area
Botanical diversity of The Study Area
The Botanical Transformation Of The
Study Area
Zoological Diversity Of The Study Area
The Zoological transformation Of The
Study Area
Measurement Or Sampling Undertaken & Monitoring Results
sampling Of Pond Water
Physical parameters
Analysis of Pond Water
Remark & Discussion
Sampling Of sewage Water
Analysis Of Sewage water
Discussion
Sampling of Drinking water
Analysis Of drinking water
6 | P a g e
Water quality Criteria
Desirable & permissible limit Of Water
Temperature & rainfall measurement
climatic Analysis During December
Ambient Air Quality
Discussion
Noise Level Measurement
Discussion
Estimation Of Benefits Environmental Impact Upon Health Conclusion Suggestion Limitation
Scope Of Further Study
Questionnaire
References
Acknowledgement

7 | P a g e
List of Tables
Title
Phytoplankton diversity in waterbody
names of common flora
Zoo planktonic diversity in waterbody
Names of common fishes
Checklist of Amphibian Fauna
Checklist of Reptilian Fauna
checklist Of Birds
Checklist of Mammalian Fauna
Analysis of Pond water
Analysis of sewage water
Analysis of drinking water
water quality Criteria
Desirable & permissible limit of water
Temperature & rainfall measurement
Climatic analysis
Ambient Air quality at 4 monitoring stations during June, 2010
Average air quality data of district Kolkata during December, 2010
Average air quality data of district 24 Pargana (S ) during December, 2010
Comparison on air quality data between district Kolkata & 24 Pargana ( S )
Ambient air quality at Kasba Station during 2006
Noise monitoring at the periphery of work places.
Sample 1

8 | P a g e
sample 2
sample 3
List Of Figures
Location ( Map - representation )
Residential area of Survey park
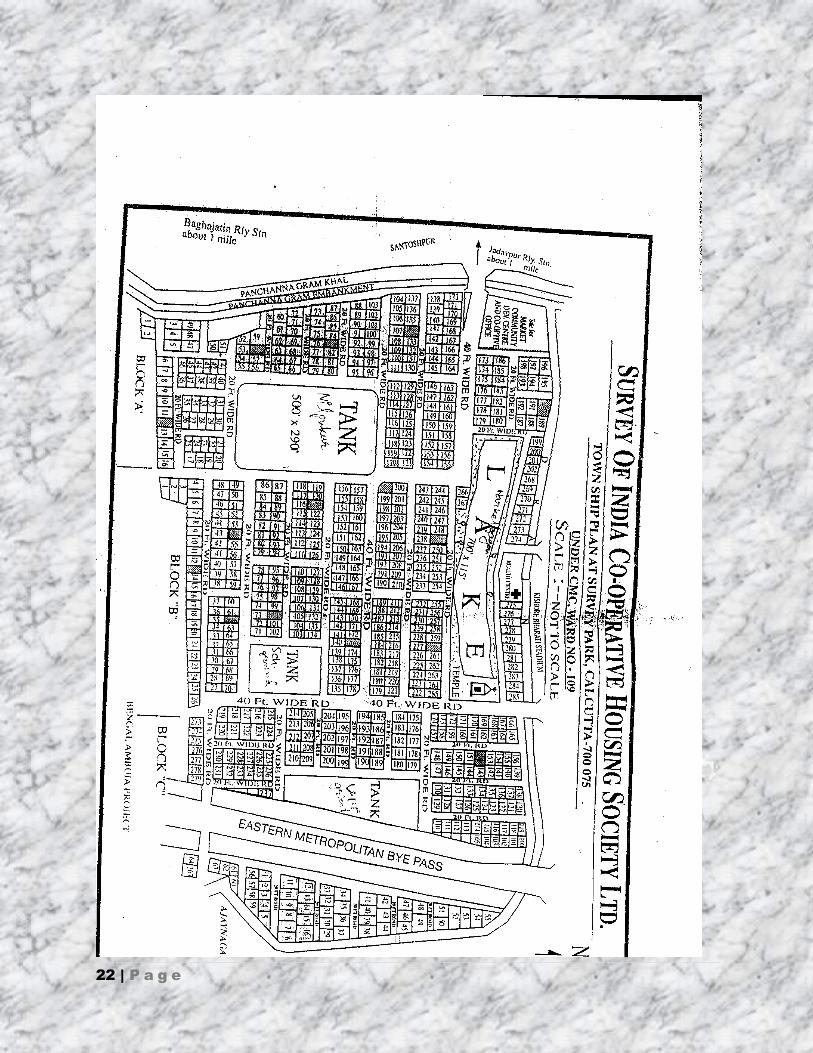
survey Of India co-operative housing society LTD ( Map )
Methodology
Used equipments & instruments.
Normal rainfall ( mm ) in KMC area
Geomorphological map of CMC area.
Subsurface disposition of aquifers in Kolkata municipal corporation area.
Botanical diversity of the study area.
Sampling of pond water.
Graphical representation of analysis of pond water.
Sampling of sewage water
Graphical representation of analysis of sewage water.
Sampling of Drinking water.
Graphical Representation of temperature & rainfall measurement.
graphical representation of Climate
graphical representation of comparison on air quality data between 2 districts during December, 2010

9 | P a g e
ABSTRACT
The significance of urban and semi-urban waterbodies (ponds) as water
resources is being appreciated now as never before. Increasing population in
urban and semi-urban centres has put more stress on water management of
city administrations. This has necessitated proper management of the ponds
economically for better water quality. Kolkata, the second largest metropolis
in the country, has about 3000 ponds of different sizes spread within its
municipal corporation boundary. These ponds are used as multiple resources
– about a million people use it for bathing, washing, pisciculture, performing
religious rites and also use its adjoining areas as city parks. The ponds also
have a great ecological importance in urban environment – from
microclimate control to biodiversity. The present paper firstly aims at valuing
the contribution made by urban and semi-urban ponds to support and improve
the quality of life of the people residing in adjoining areas (or using it).
Secondly, it attempts to deal with the issue of sustainable management of
such ponds both at theoretical and at the practical level. The study is based
on the impacts on a residencial area of kolkata (actually the study on ponds
& its role ), to find its prime uses and users. For tractability, the present
study considers only use-values, such as bathing, washing, immersion of
idols, recreational uses along with fish cultivation. The main observations of
the study are ------
a) Even without considering existence value, option value etc., the value
contributed by a pond .
b) Sustainability from the viewpoint of human use and sustainability from
the viewpoint of pisciculture may have some mutual incompatibility
and therefore requires an integrated approach. And
c) Proper community management can attain sustainability without
compromising on quality of life.
10 | P a g e
INTRODUCTION
The urban areas of the country are facing problems of deterioration of
environmental and socio-economic conditions. The major concerns are
unplanned and haphazard development, poor sanitary and living conditions,
urbanization and associated problems including slums, poor/inadequate
infrastructure and pollution problems. While there are several causes for
urban degradation such as population migration, environmental
considerations not adequately being incorporated into plans , uncoordinated
and haphazard development, weak implementation of plans and laws, one of
the major concerns is resource crunch.
Environmental degradation associated with development and population
growth is visible all over the world. India is not an exception, where daily
survival is put at stake when environment degrades. Environmental
degradation occurs only when we forget about the price of environmental
amenities such as Ponds, lakes, rivers, mangroves, national parks, coral
reefs, wetlands and so on may be a difficult proposition but needs to be
addressed.
Economic valuation of environmental resources (and consequently their
impact assessment) can make decisions on resource utilization and
allocation more meaningful. These need to be undertaken when markets fail
to generate the true price of the resource in question.
Environmental resources like water body, soil, forest are well known & well
documented. There are three types of resources in building the base of what
is popularly known as conservation economics. These are stock resources
(non-renewable), flow resources (renewable) and critical zone resources. A
critical zone resource can be replenished until threshold of irreversible
depletion has been reached. Beyond that level it may be lost forever. The
water bodies like ponds & lakes of Calcutta & its surrounding areas are
11 | P a g e
considered as critical zone resources. The total area of the water body had
been reduced by two thirds during last forty years and still under threat now.
Over the last few years, there has been increasing global concern over the
public health impacts attributed to environmental pollution, in particular, the
global burden of diseases. To emphasize the link between environmental
pollution & public health in an urban setting it is important to know what is
fresh water & how is it related to environment.
The quality of fresh water is an important factor in determining human
welfare. It has been noted that polluted fresh water is the cause for water
borne diseases which wiped out the entire population of cities. The major
sources of water pollution are domestic waste from urban & rural areas, &
industrial wastes which are discharged into natural water bodies. The river &
lakes near urban centers emit disgusting odors & fish are being killed in
millions along the sea coasts. The origin of these problems must be
attributed origin of these problems must be attributed to many sources &
types of pollutants.
In the present study, this complex ecosystem has been examined both
economically and ecologically in the context of sustainable existence of the
great metropolis. And also we have to be Considered the severely lacking or
inadequate infrastructure facilities, deteriorating environmental quality and
living conditions on one hand and the lack of awareness, there is a need for
looking into custom made non-conventional solutions for application.
OBJECTIVE
The overall objective of the project is to improve environment and bringing
visible results through this projects in the selected area of Santoshpur. The
specific objectives are to:
1. Identify the environmental problems/hotspots in the studied area and
gives priority in environmental improvement of the selected area namely
as SURVEY OF INDIA CO OPERATIVE SOCIETY of Santoshpur. Designing &

12 | P a g e
detailing of this projects shows the effect of ponds in a particular living
place & with the habitant of that place. And also we tried to find out the
difference between the pond as water body & the wetland that located in
near the Santoshpur, in Kolkata.
2. A detailed survey was carried out to collect relevant information to
analyze the present use of water bodies for economic purposes and
consequent damage in terms of area loss, water quality and loss in
biodiversity. The study also covers the aspect and value of the benefit
derived from water bodies.
LITERATURE REVIEW
Mohit Kumar Ray1 , Siddhartha Majumdar in their project the studied
about EVALUATING ECONOMIC SUSTAINABILITY OF URBAN AND PERI-
URBAN WATERBODIES which was published in Biodiversity and Quality of
Life- p135-146 – Ed Nirmal Sengupta and Jayanta Badyopadhyay –
Macmillan, New Delhi, 2005. In their project they found that how is Water
going to become the most important natural resource in the 21st
century. For
some countries it may become the most critical issue influencing political
and social events in the immediate future. Though India enjoys a relatively
moderate average-rainfall, water has still become a critical issue. Sharing of
water resources has already caused friction between states, culminating in
violent riots. Most city authorities cannot provide the required minimum
water supply to its citizens. Even in areas with high rainfall, water scarcity
has become a problem during non-rainy months.
They were distinguished between and define various types of urban
waterbodies like wetlands, lakes and ponds that are commonly observed in
an urban area. They discussed the significance of urban waterbodies. They
also attempt to estimate the value of the flow of utility generated by a few
representative ponds in their survey. Also they discussed about the issue of
environmental management and economic sustainability of urban
waterbodies with special reference to two ponds selected from their survey.
They considered Water as the source from where life began. Waterbodies of
every form – oceans, seas, rivers, marshes or ponds –have been the niche for
thousands of species of flora and fauna. Most of the living beings require
water in some form for their survival. Human civilizations have also grown

13 | P a g e
depending on the water resources, as a result of which they have mostly
developed near the river valleys. So water bodies have served both the cause
of the conservation of nature as well as of human development. This paper
was focussing on a specific aspect of water resources – economic
sustainability of urban and peri-urban waterbodies with special reference to
the ponds of Kolkata.
LOCATION
Name: Survey Of India Cooperative Society
City: Santoshpur
Status: Place
Region: Bengal
Country: India
Continent: Asia
Population: 7,635
Latitude/Breadth: 22°31'48"N
Longitude/Length: 88°16'12"E
Distance as the crow flies between Santoshpur and India's capital
New Delhi is approximately 1,298.9km.
Survey Park is a wellknown livingplace.

14 | P a g e
SELECTION OF STUDY AREA
I select Survey Of India Cooperative Society as study area
as it is surrounded by 4 large well known pond namely as Narkelbagan Pond,
Nil pond & VIP pond . Else one is not sanctioned by government. But the
basic reason to choose the survey park is to determine the significance of
urban & peri urban (ponds) water bodies as water resources. Because the
ponds or water bodies as water resources is being appreciated now as never
before. Increasing population in urban & semi-urban centers has put more
stress on water management of the city administrations. This has
necessitated proper management of the pons economically for better water
quality. Also these ponds play an important role on environment of a living
place & control the different parameters of a particular environment. And
this is the environment where a large no of people spends their 10-12 hours
daily to set their minds to work in work place properly.
SELETION OF 3 PONDS TO MEASURE DIFFERENT
PARAMETERS
Before going into discussion of selection of 3 ponds to measuer those
parameters, we have to know_____________
What is waterbody?
What is pond?
How is it releted to a particular environment?
Waterbody is a commonly used term, which may describe any place
holding water. Seas, rivers, lakes, wetlands and ponds, all are water
bodies though their distinctive uniqueness as a specific form of water
body is not always evident to all and sundry. A definition of water body
is therefore required to be useful for a specific study. The water
bodies can be classified in many ways by their sizes, locations, water

15 | P a g e
quality, aquatic ecology and others. It may be artificial or natural;
static or flowing, sweet or brackish, deep or shallow, permanent or
temporary. Though the Terms Rivers and seas do not need much
clarification, the terms lakes, wetlands, water bodies, tanks or ponds
are quite commonly used interchangeably.
A Pond is generally described as a water body of a smaller size, man-
made or developing it from its natural origin. In the present study the
term pond has been used as smaller water body in the urban and peri-
urban area. The term water body has often been used for ponds also.
Ponds are mostly of totally different nature. These are of
comparatively smaller sizes varying from 0.03 ha to few hectares.
Thus ponds can be considered as the smallest unit of water bodies for
this discussion. Pond excavation was once a part of social and
religious customs. Ponds are distinctly separate from lakes and
wetlands as they are nearly all located within residential areas and
are meant for local uses.
USES OF PONDS The pond-use pattern shows that all (100%) the ponds are used for
bathing. 62% of the ponds are used for washing purposes. One of the
important aspects of this finding is that the pond water is a major
source for bathing water for urban poor. Bathing is considered a
primary healthcare activity and thus the question of water quality
gains more importance.
After bathing, the next major activity in the ponds is pisiciculture. 92%
of the surveyed ponds are used for it. As pisciculture is related with
local employment generation, this aspect, too, should be studied
carefully.
As discussed before, the pond surroundings also make significant
contribution to the social, cultural and ecological environment of the
urban scenario. The survey found that all the ponds have some trees
around them. Nearly half (44%) of the Narkelbagan pond have adjacent
Kali temples.

16 | P a g e
VALUATION OF WATERBODIES Unfortunately the value of services rendered by such water bodies
often gets unnoticed. As mentioned before, a pond, like many
environmental assets, can be used for consumption purposes as well
as an input for some productive activities. This is a typical problem
faced by public goods (which environmental assets generally are).
Though the ponds are not a public good in a strict sense, however,
non-excludability from and partial non-rivalry of consumption make the
typical Kolkata pond vulnerable to the same kind of over-exploitation
and subsequent degradation problems as are typical of common
property resources. Therefore it is necessary to form an estimate of
the economic value of a pond. A brief sketch of such a valuation
procedure is presented here (see Johansson, 1987). We also attempt
to make a rough estimate of the economic value of a few
representative ponds with the data generated from this survey.
The economic value of environmental goods like a pond has a
composite nature. We initially classify it into two categories -1) use
value and 2) non -use value. Use values are defined as those benefits
that are derived from the actual use of environment. Moreover,
economists have also introduced the concept of option value, which is
the additional value placed on a natural resource by those who want
to have the possibility of using the goods and services in future. This
is known as Option–value (Munasinghe, 1993). Non-use values are also
called existence values. The argument is that people care about
environmental resources not only because they confer some benefits
upon human beings, but also because they wish to maintain or improve
environmental assets out of sympathy for animal and nature or just
from a moral conviction. There is thus an intrinsic value in these
things (animals/nature etc.), which go beyond our own self-interest
(Pearce and Turner, 1990).
VALUATION OF PONDS OF SURVEY PARK
There are different methods for evaluating environmental resources.
Market price valuation is carried out based on market price data.
17 | P a g e
Indirect Valuation approach considers services or benefits obtained
from natural resources that are not marketed but a reasonable
assessment is done about their value by an indirect approach (Hanley
et al, 1997). There are different methods for doing so like Travel Cost
method, Hedonic Pricing method and Substitute Goods approach.
(Hanley et al, 1997). Contingent Valuation Method involves direct
questioning of the consumers to determine their willingness to pay for
enjoying the facilities rather than go without them. For the present study only use values have been considered for our
empirical exercise. Fish cultivation, use of water by people for
bathing, washing, immersion of idols, recreation uses etc., are
therefore seen as the principal uses of these ponds.
Annual value of fish produced in each pond is available from the
Annual Accounts of the pond committees. Annual value is defined as
the amount obtained from fish sale or angling charges less the direct
costs like cost of fish feed, fish spawns, netting etc.
Human uses include bathing, cleaning and washing. Most of the people
using the pond do not have proper water supply at home.
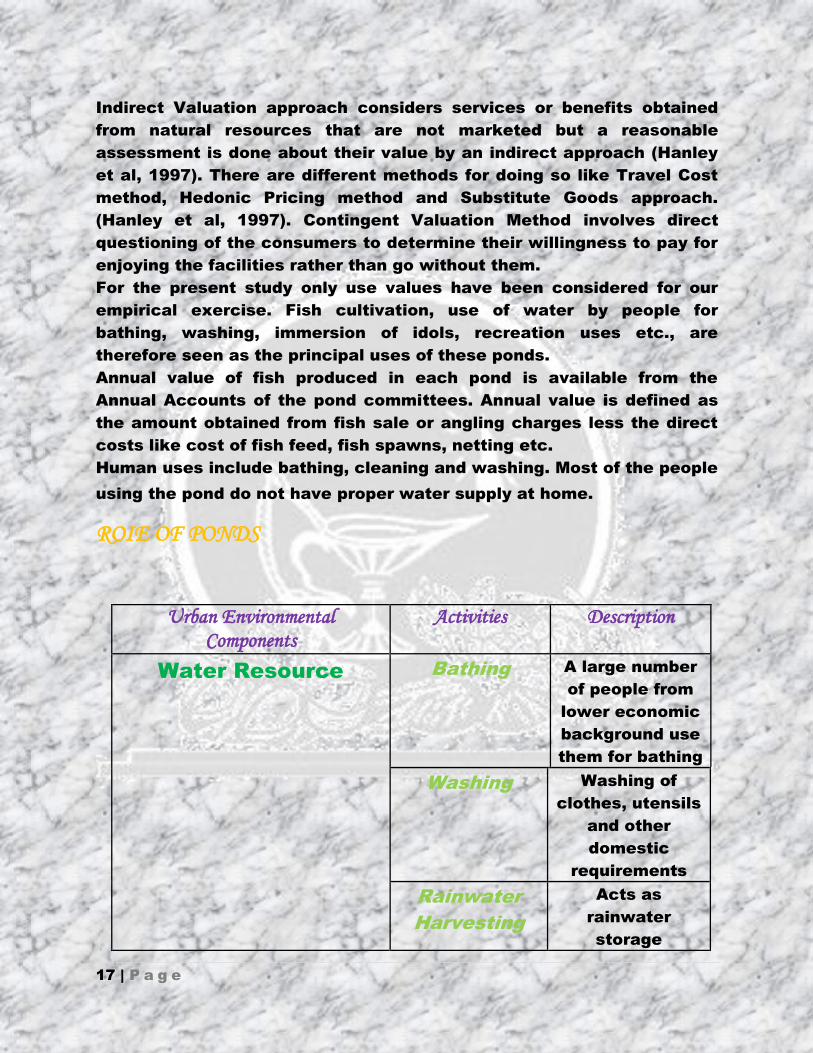
ROIE OF PONDS
Urban Environmental Components
Activities Description
Water Resource Bathing A large number
of people from
lower economic
background use
them for bathing
Washing Washing of
clothes, utensils
and other
domestic
requirements
Rainwater
Harvesting
Acts as
rainwater
storage
18 | P a g e
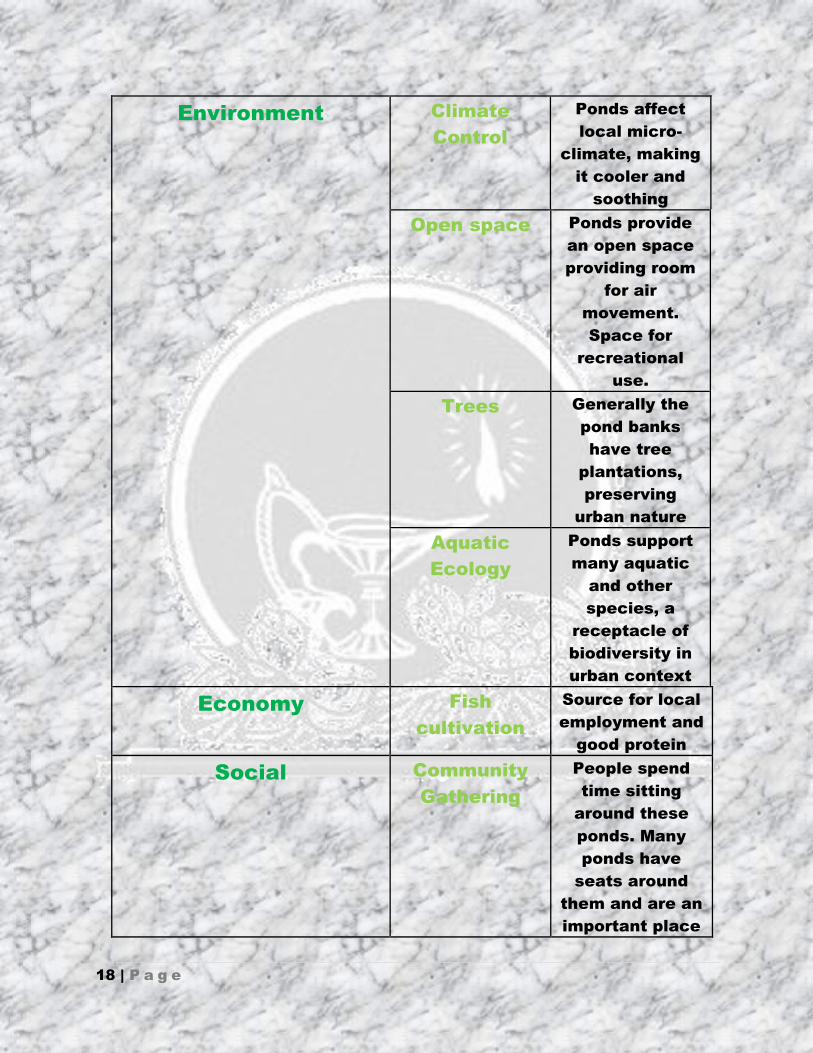
Environment Climate
Control
Ponds affect
local micro-
climate, making
it cooler and
soothing
Open space Ponds provide
an open space
providing room
for air
movement.
Space for
recreational
use.
Trees Generally the
pond banks
have tree
plantations,
preserving
urban nature
Aquatic
Ecology
Ponds support
many aquatic
and other
species, a
receptacle of
biodiversity in
urban context
Economy Fish
cultivation
Source for local
employment and
good protein
Social Community
Gathering
People spend
time sitting
around these
ponds. Many
ponds have
seats around
them and are an
important place

19 | P a g e
for local
community
gathering.
Clubs Because of
open space,
there often
exist many
clubs by the
pond side.
These clubs
also manage
the ponds.
Culture Temples Many ponds
have temples by
their sides.
Temple
authorities also
mange some
ponds.
Safety Fire
Extinguishing
In congested
urban areas,
ponds are very
useful as a
source of water
supply for
extinguishing
fire.
COMPARISON BETWEEN WETLANDS AND PONDS IN
KOLKATA
Functions Wetland Urban Pond Location At the margin of human
habitation
Inside Human
habitation
Users A specific group of people
like fishermen
Different groups of
Common people
Size Covers a wide area Small but many in
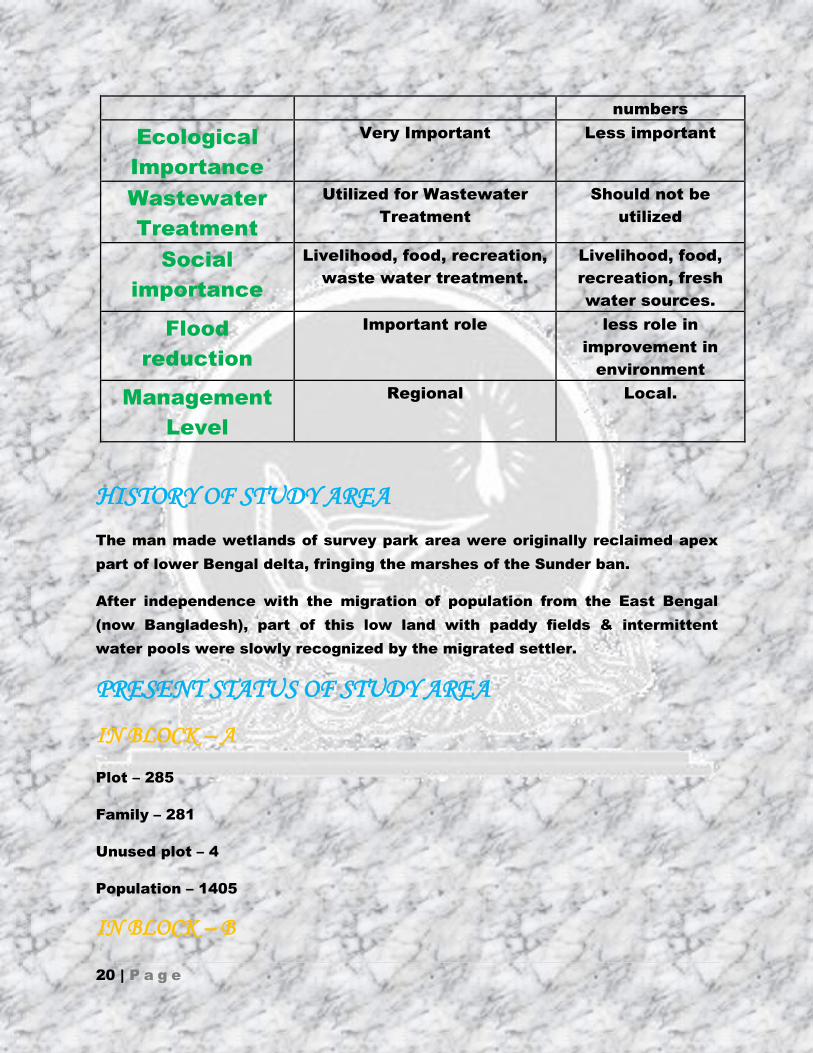
20 | P a g e
numbers
Ecological
Importance
Very Important Less important
Wastewater
Treatment
Utilized for Wastewater
Treatment
Should not be
utilized
Social
importance
Livelihood, food, recreation,
waste water treatment.
Livelihood, food,
recreation, fresh
water sources.
Flood
reduction
Important role less role in
improvement in
environment
Management
Level
Regional Local.
HISTORY OF STUDY AREA
The man made wetlands of survey park area were originally reclaimed apex
part of lower Bengal delta, fringing the marshes of the Sunder ban.
After independence with the migration of population from the East Bengal
(now Bangladesh), part of this low land with paddy fields & intermittent
water pools were slowly recognized by the migrated settler.
PRESENT STATUS OF STUDY AREA
IN BLOCK – A
Plot – 285
Family – 281
Unused plot – 4
Population – 1405
IN BLOCK – B

21 | P a g e
Plot – 265
Family – 256
Unused plot – 9
Population – 1280
IN BLOCK – C
Plot – 279
Family – 278
Unused plot – 1
Population – 1390
All values are approximately taken depending on residential reports of that
area. This is reported that there is 10 % increase in population in every year.
OWNERSHIP & MANAGEMENT OF STUDY AREA
The surveyed ponds are owned by Co operative Society of Survey of
India. The management of the ponds are carried out by different
groups. A number of government owned ponds are looked after by the
Pond Committees. Private ponds are mostly looked after by the people
who take them on lease for fishing. Some local clubs and religious
institutions also manage some ponds. It has been seen that the ponds
managed by the Pond Committees are relatively better. Private ponds
are looked after the least, as these are mostly owned on lease (for
fishing).
22 | P a g e

23 | P a g e
RESIDENTIAL AREA OF SURVEY PARK
CLUB HOUSE HOUSE
HOUSE HOUSE
CLUB HOUSE MATRI MANDI

24 | P a g e
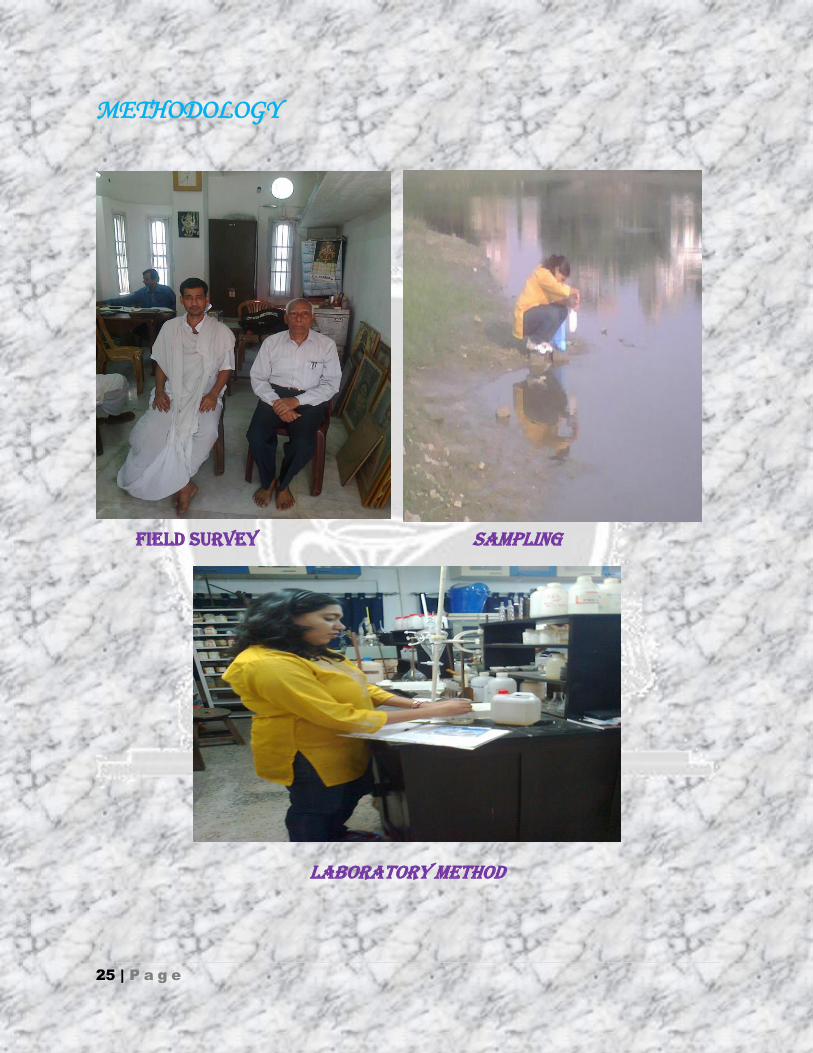
METHODOLOGY
The first step was designed to select the water bodies to be studied. Survey
map data were used for final selection of the study area.
FIELD SURVEY
To understand the current situation of the Water bodies and the benefits
derived by the surrounding households, a field survey was conducted based
on the information acquired during the pilot survey. For this purpose most of
the households who live around those ponds under survey were selected
randomly to mimic the population characteristics. This survey includes the
households’ responses to any change in their present environment, i.e., their
attitude for the presence of those ponds. In order to record their responses a
structured questionnaire was used. Households were selected among those
who derive direct benefit from those ponds and from those who do not. Care
was taken in selecting the samples to include all segments of the population
as far as possible including people with different occupation, caste,
education level etc. Household-level information was collected through
personal interviews using pre set-up questionnaires covering different
aspects of the study objective.
SAMPLING
For testing of water quality, I collected water sample for different test such
as pH, Turbidity, Conductivity, DCo2, DO, BOD, COD, Hardness, Calcium,
Magnesium, Alkalinity, Fluoride, Chloride, Sulphate, Phosphate, Nitrate, Iron,
Arsenic & Oil & grease from each of the sources according to college rules.
DCo2 , DO, pH, Temperature were measured on the spot with Thermometer,
pH strip, & necessary chemicals under the guidance of prof. Rabindra k. Roy,
Guest Professor of Presidency college, Kolkata. Other tests were done in
laboratory under the guidance of Dr. Swapan Saha, Professor of Presidency
college. Regular temperature was measured in different area with the help of
local residents to measure the impact of waterbodies on regular temperature
controlling. Other data were collected from different sources like Alipur
Weather Casting Office, Central Pollution Control Board; KMDA Office etc. in
consultation with other guide prof R. K. Roy.
25 | P a g e
METHODOLOGY
FIELD SURVEY SAMPLING
LABORATORY METHOD

26 | P a g e
LABORATORY METHOD
BOD, COD, Hardness, Calcium, Magnesium, Alkalinity, Fluoride, Chloride,
Sulphate, Phosphate, Nitrate, Iron, Arsenic & Oil & grease were measured in
College Laboratory under the guidance of Dr. Swapan Saha, Dr. Gargi
Majumder Professor of Presidency College by using Necessary chemicals &
instruments. For each test we follow the principal of AFFA.
Used Equipments and instruments
1. Laboratory Instruments in the Chemical Laboratory
Microprocessor based Visible Single beam Spectrophotometer Aqua
mate
Atomic Absorption Spectrophotometer
Turbidity Meter
Microprocessor based digital pH Meter
Microprocessor based digital Conductivity/Total Dissolved
Solid/Salinity Meter
Microprocessor based electronic digital balance
Double Distilled Water Apparatus
Hot Air Oven
Laboratory Hot Plate
Water Distillation Apparatus
Flame Photometer
BOD incubator
Membrane filter
2. Laboratory Instruments in the Bacteriological Laboratory
Bacteriological Incubator
Autoclave
Laminar Flow Bench

27 | P a g e
USED EQUIPMENTS AND INSTRUMENTS
WEATHER MEASURING THERMOMETRE SPECTROPHOTOMETRE
WATER TEMPERATURE MEASURING
THERMOMETRE DIGITAL BALANCE
28 | P a g e
DETERMINATION OF ENVIRONMENTAL QUALITY
There are many environmental parameters like air, water, noise etc. which
play a vital role to control the nature of a living place from where a large no.
of people , i.e, habitants of that place takes their relaxations & spends 10-12
hours daily at their home in the vicinity of the waterbodies of my study area,
to set their mind to give a better performance in work place as office, school,
colleges etc. But if there is any pond which must be play a crucial role to
control or to change those parameter in compare to a place where no water
body. So we measure those parameters from the 3 ponds or from the
neighboring areas around the 3 ponds. The presence of waterbodies also
provides a placid asthetic iew & mental Security about availability of water
for the event of any emergency likr eailure of water supply of fire hazards.
RAINFALL & CLIMATE
The normal annual rainfall is 1647mm. Monthwise normal rainfall (mm).
Kolkata experiences the following four distinct climatological features eg. i)
Mild Winter, ii) Brief Spring, iii) Summer with occasional Norwesters and iv)
Prolong Monsoon. The mean temp in winter is 22.50
C, which goes down to a
minimum of 100
C in the months of December-January. The mean temp in
summer is 29.250
C and goes up to a maximum of 400
C in the month of April.
The climate during monsoon months is warm and humid.
THE CLIMETIC TRANSFORMATION OF THE STUDY AREA AFTER CYCLONE
In the part of our country, The most important climatic induced natural
hazards are flood, water logging & Cyclone. As per recorded history, there
were big cyclone in early October ( 5th ), 1864 & next one is in 2009. In 1864
cyclone relative loss of property & life was more than 2009 cyclone. The
important of cyclone is strongest in the Sager Island, Sandeshkhali,
Frazorganj & adjoining parts in the southern half of lower Bengal Delta
covering the populated parts around the core area of Sunder ban reserve
forest. The damage is much less in the area & in around Kolkata. Because
the technological advanced warning system & communication become
progressively relevant as a result loss of life in 2009 Cyclone ( known as
AILA ) was much less than in earlier occasions. Our study area being a part

29 | P a g e
of the Kolkata Metropolitan with very high ground water level with brick &
concrete buildings & trees around the ponds & roads were less affected.
Only some road tress &temporary structures at the roof top & some bill
boards were affected. Temporary water logging & spill over from some
ponds without any regulatory outlet were noticed in the area.
GEOMORPHOLOGY & SOIL TYPES
Study area forms a part of the lower deltaic plains of the Ganga- Bhagirathi
river system. It is a typical deltaic flat land with surface elevation ranging
between 3.5 to 6m above mean seal level. Several low lying depressions in
the form of marshes, shallow lakes or jills occur within the city and most of
these represent river scars of the post river channels of Bhagirathi. The
master slope of the land is towards south. Younger levee, deltaic plain,
interdistributory marsh, paleo channels and younger levee adjacent to river
Hugli and older levee on both sides of the old Adi Ganga are the important
geomorphological units present in the area.The area is covered with
younger alluvial soil mainly of silty & clayey loams.

30 | P a g e

31 | P a g e
GENERAL GEOLOGY OF AREA The area is underlain by 762m thick unconsolidated alluvium, which overlies
a huge pile of unconsolidated to semi-consolidated sediments deposited on
the basement. The structure and lithology of the sediments indicates number
of pulses of sedimentation, marine transgression and regression and tectonic
uplift from Cretaceous to Pleistocene times. The study of the lithological logs
of borehole data indicates that the upper 300m of sediments are of
Quaternary age but the exact boundary between the Quaternary and Tertiary
sediments could not be established due paucity of data. The Quaternary
alluvium comprising several cycles of sand, silt and clay and shows facies
variation in both vertical as well as in horizontal sections. The panel diagram
prepared on the basis of the lithological logs of the tube wells indicates that
there are two regionally extensive clay beds throughout KMC area within the
depth of 400 mbgl. The depth of occurrence of the basal clay bed varies from
place to place but in general it occurs from 300 to 450m bgl and the depth
gradually decreases southward. The top clay bed of 10 to more than 60m
thick occurs above the entire alluvium sequence from the ground surface in
KMC area. The thickness of this clay bed varies from place to place. Both top
and bottom clays are dark grey in colour, sticky, plastic and often found to
contain strings of silt and fine sand. The upper clay bed often contains peaty
matter within the depth of 10m bgl indicating earlier land subsidence in
recent past. Sands of various grades with occasional gravel occur between
these two clay beds form the main aquifer system in KMC area. Presence of
several clay layers and lenses at various depths at different places divides
the above mentioned sand zones into several layers.
Thin lenses of very fine grained sand and silt in the silt clay layer also occur
above the top clay layer at some places around Ballyganj, Tollyganj, Tijola,
Dhakuria, Kasba, Santoshpur, Garia, Behala, Barish and Thakurpur in the
marshy/swampy lands. The thickness of these sand and silt layers varies
from place to place. In the levee deposits along the bank of river Hugli lenses
of sand of fine to coarse grained are also present above the top clay bed at
some places. The thickness of this sand bed also varies from place to place.

32 | P a g e

33 | P a g e
GROUND WATER RESOURCES
Due to semi confined to confined nature of aquifers estimation of ground
water resource by water table fluctuation method could not be done.
Depending upon the available data a total quantum of 204 million litres per
day of ground water is entering into the central depressed zone. Ground
water in the localized water table aquifers in Ballyganj, Tollyganj, Tiljola,
Dhakuria, Kasba, Santoshpur, Garia, Behala, Barish and Thakurpur area and
in the levee deposits along the bank of Hugli river has got limited yield
prospects but estimation of ground water resources is not possible due to
paucity of data as the aerial extension of the aquifer can not be determined
due to cover by urban agglomeration.
GROUND WATER QUALITY A typical hydrochemical situation exists in KMC area. Ground water in KMC
area may be classified under two principal types viz. a) Bicarbonate type
and b) Chloride type. The anionic types may further be subdivided into two
types on the basis of predominance of cation concentration. These are i)
Calcium- Magnesium bicarbonate, ii) Sodium bicarbonate and iii) Calcium-
Magnesium chloride and iv) Sodium chloride. Ground water in the area west
of a line connecting BBD Bag, Park Street and Jadavpur is of Bicarbonate
type whereas in the area east of this line ground water is of Chloride type.
GROUNDWATER RELATED ISSUES AND PROBLEMS
Ground water in KMC area may be classified under two principal types viz.
Bicarbonate type and Chloride type. Ground water in the area west of a line
connecting BBD Bag, Park Street and Jadavpur is of Bicarbonate type
whereas in the area east of this line ground water is of Chloride type.
Ground water in the entire western and south-central part of the city, south
of Taltala- Kasba-Santoshpur tract in the NNW-SSE direction is of Ca-Mg-
HCO3
type. Concentration of chloride is low. Ground water in the entire
northern and eastern part of the city, north of Taltala- Kasba-Santoshpur
tract in the NNW-SSE direction is of Ca-Mg-Cl type. Concentration of
chloride is high (280-620 mg/lt) having more than 1000 mg/lt TDS.
Ground water tapped by open wells in Ballyganj, Tollyganj, Tijola, Dhakuria,
Kasba, Santoshpur, Garia, Behala, Barish and Thakurpur area in the marshy/

34 | P a g e
swampy lands is hydraulically connected to the surface water bodies like
ponds, unlined drains etc is biogenecally polluted.
DRAINAGE SYSTEM IN THE STUDY AREA
The study area fall in the drainage basin/domain of Bidyadhari river. It is a
tidal channel originally from Sunderban. There from it flows north east part
Harua & the bends Westwards & is joined by another tidal channel known as
Nona Khal. From this point, Bidyadhari flows south west ward to the junction
of beliaghata Canal & Tolly’s Nulla. The beliaghata Canal was a man made Canal at least in part, dug by the East India Company To protect their
establishment at Calcutta, now Kolkata from the attack of the native
Margate & Sirajdulla. The Tolly’s Nulla was a reclaimed old distributary channel of the river Hooghly & is known as AdiGanga. The Bidyadhari
Channel also serves as the main outfall channel for the storm water &
sewage of the city through Beliaghata Canal & Tolly’s Nulla network with
smaller tributary canals & natural drainage course. The problem of
acceleration of silting up of these drainage channels was considered due to
works ( like embankments ) is connectors with local fisheries, accumulation
silt from storm water drainages & also due to tidal impact. Moreover,
reclamation of salt water lakes for cultivation has restricted are bankflow of
tidal channels into the adjoining reclaimed land. As a result the silt brought
from island & by tidal water gets settled in the channel. Thus the Bidyadhari
drainage progressively becoming less effective has a natural drainage course
of water & storm water from Kolkata.
BIODIVERSITY OF STUDY AREA
The surveyed area supports the survival of a large number of fish, snakes,
frogs and a wide variety of other aquatic animals. These areas also provide
habitats of a large number of birds including migratory ones. Particularly in
winter season these migratory birds gather in a large numbers in the
surveyed areas. Flora diversity is also large in the surveyed areas. As flora,
faunas and birds are highly interdependent for their feeding, breeding and
growth, loss of any aquatic plant or aquatic animal disturbs the food chain

35 | P a g e
for whole kingdom of plant and animal. The population of aquatic animals
and birds are dwindling very rapidly in recent year due to increase in
anthropogenic activities like fish catch, jute retting, and irrigation and fodder
collection. The surrounding population of the surveyed areas believes that
both varieties and number of non-commercial aquatic animals have been
reduced heavily as compared to 15 years back because of excessive and
inappropriate application of pesticides in upland areas and net fishing. The
environment and biodiversity are also disturbed by the interaction of the
pollutants in and around the water bodies, for example noise from road &
vehicles is an important factor for decrease in the birds’ population in and around the water bodies.
BOTANICAL DIVERSITY OF THE STUDY AREA
The study area was essentially low lying paddy field area interspersed with
home stead plots & water pools of various dimension. These areas afforded
the foothold of numerous marsh species like Sphenodea, Hydrolea, Ammonia,
Enhydra, Wedelia, Sesbonia etc. The ponds & ditches harbour many submerged
& floating water plants like Utricularia, Pistia, Hydrilla, Lagarosiphus,
Ceratophyllum, Ohelia & valliseneria etc.
The natural vegetation along the side of the canals transporting waste &
rain water discharges from Bhaajatri railway station. Dowmstream towards
Haltu Kalikapur & separating Santoshpur proper from Survey park, included
village Shorubberies of semispontaneous species like Odina, Zigphus, Acacia,
Glycosmis, Trema often interspersed with chumps of planted Bamboos, grooves
of Areca, Coconut, Maringa, Mangifera etc.
Wayrides & waste dump areas other than those spoiled by heaps of non
biodegradable materials are filled with grasses & weeds. A very large
proportion of plant species seen in these areas have been inadverstantly
introduced by local settles. These includes some European & African species
like Senebrera pinnatifida & Xanthium spesidsum.
Since the partition of Bengal in 1947 & also huge migration of Hindu
population of East Pakistan ( now Bangladesh from 1971) all these areas
have harboursed many refugees who started changing the landcover &

36 | P a g e
landuse by clearing shrubberies, depending waterpools, raising paddy field
ground levels by filling up them with earth from the pools. The rice fields
were, thus, converted to semiurban settlement by replacing marsh species
with ‘ kuchu Garden ᾽ & land trees dominated by coconut, Areca nuts, Mango,
Banana etc. wood species were few the Bamboo grasses continued to
survive for sometime. Initially, these settlements were the semiurban type
where the use of bamboo & earth in making the dewellings has been
predominant. During this period, the survey park areas continued to have
lesser population pressure & there botanical character changed rather
Viveknagar Bank colony to the west & north west of Survey park.
DIFFERENT MACROPHYTES IN WATERBODY
Hydrilla, Wolffia, Chara, Azolla, Lemna, Pistia, Salvinia, Spirodella, Typha,
Utricularia.
PHYTOPLANKTONIC DIVERSITY IN WATERBODY
These are all general phytoplanktonic species of general frash waterbody like ponds,
lakes, rivers.
FAMILY PHYTOPLANKTON
Myxophyceae Anabaena sp.
Agmenellum sp.
Microcytis sp.
Spirulina sp.
Oscillatoria sp.
Schillatoria sp.
Schizothrix sp.
Closteropsis sp.
Glotrichia sp.

37 | P a g e
Chlorophyceae Closterium sp.
Tetrahedron sp.
Cosmarium sp.
Euglena sp.
Chlorella sp.
Planktospherica sp.
Bacillariophyceae Navicula sp.
Nitzschia sp.
Fragillaria sp.
Diatoma sp.
Synedra sp.
Cocconeis sp.
NAMES OF COMMON FLORA
COMMON NAME SCIENTIFIC NAME
Ground Nut Arachis hypogaea
Coconut Cocos nucifera
Castor Ricinus communis
Mango Mangifera indica
Banana Musa paradisiaca
Papaw Carica papaya
Sugarcane Saccharum officinarum

38 | P a g e
Rauwolfia Rauwolfia serpentine
Deodar Cedrus deodara
Jarul Lagerstroemia sp.
Cotton Gossypium sp.
Jute Corchorus sp.
Goldmohur Delonix regia
Jaba Hibiscus sp.
Rose Rosa sp.
Pear pyrus sp.
THE BOTANICAL TRANSFORMATION OF THE STUDY AREA
The botanical transformation of the study area continued with the pace of
urbanization & population growth. By 1985, the Survey park area was
developed into a new urban residential area with metalled rodes & lanes,
bricks & concrete houses & progressively reduced open areas. The marshy
plant species got restricted to the waste water canal & three big
waterbodies. Homestead trees planted in the 1950 & in the 1960 continued
to survive in a scattered way making rooms for new construction.
There has been another phase of botanical transformation stating fron 1995
onwards when Earkrn bypass road become optimal when the space of
urbanization led to the transformation of individual single or 2 storied
dewelling units with backyards & from open space harboring, flowering, &
fruit carring plants & trees, to building complexes with flats. This change
over become rapid after 2002 & there by bringing in another change in the
botanical region of the area from land plants in the house holds to plot &
park culture. However, a mix of natural vegetation & plantation like Coconut,
Areca, Banana etc. are seen around the temple tank & on the canal side to
the south of ῾Jorabagan᾿ ( a landmark of Santoshpur ).

39 | P a g e
BOTANICAL DIVERSITY OF THE STUDY AREA
PHYTOPLANKTONIC DIVERSITY
IN WATERBODY COMMON FLORA
COMMON FLORA PHYTOPLANKTONIC DIVERSITY
IN WATERBODY

40 | P a g e
COMMON FLORA COMMON FLORA NEAR SEWAGE CANAL

41 | P a g e
ZOOLOGICAL DIVERSITY OF THE STUDY AREA
In the Survey park area which had undergone transformation in the land use
& land cover in stages since 1947. The faunal population has also undergone
changes due to changes in Ecology. The changes are largely due to death. In
these areas prior to 1947 there were Fishing Cat, Civic Cat, Mongoose,
Monkey, Jackals, Fox, Reptiles of various description, Rodents.
With Various stages of Urbanization resulted in dwendling of the population
of large vertebrates & much of Reptiles population & Averians. At present
only household Dogs , Cats Rodents, Common Reptiles, rarely jackels & birds
are seen in the area.
In the present day environment, which is less densely urbanized, the
waterbodies host small vertebrates like Rodents, Jackel & common
Serpents. In these bodies some migratory Ducks & other common Birds
Hawks, Golden oridles, Sandpipers,Pelicans, Owls, Doves, Crows, Sparrows,
Jays etc. The bird population is thinner in this waterbodies.
Since the studied water bodies in Survey park area are being utilized for
pisiculture. Almost all the local varieties of fresh water fish are grown in
these water bodies.
FISHING BENEFIT
Fishing benefit is derived from all the surveyed ponds. The value of average
annual fish production of different variety per pond has been collected which
has been estimated by approximately based on the data collected from
fisherman. In some ponds this value is directly obtained from fisherman’s co-
operative society.
DIFFERENT BENTHOS IN WATERBODY
Fishes, Insect larvae, Beetles, Mites, Molluscs, Crustaceans etc.

42 | P a g e
ZOOPLANKTONIC DIVERSITY IN WATERBODY
FAMILY SPECIES
Copepods Cyclops
Diaptomus
Nauplius larva
Cladocerans Daphnia
Moina
Rotifers Brachionus
Keratella
Asplanchna
Ostracods Cypris
NAMES OF COMMON FISHES
Sl No Common Name Scientific name
1 Lata Channa punctatus
2 Sole Channa striatus
3 Rohu Labeo rohita
4 Katla Catla catla
5 Mrigel Cirrihinus mrigala
6 Silver Crap Hypophthaimichthys
7 Common Crap Molitrix
8 Tilapia Cyprinuscaripo
9 Lalantica Tilapia mysambica
10 Magur Oreochromis nilotica
11 Koi Clarias batrachus
Anabas tudineus
43 | P a g e
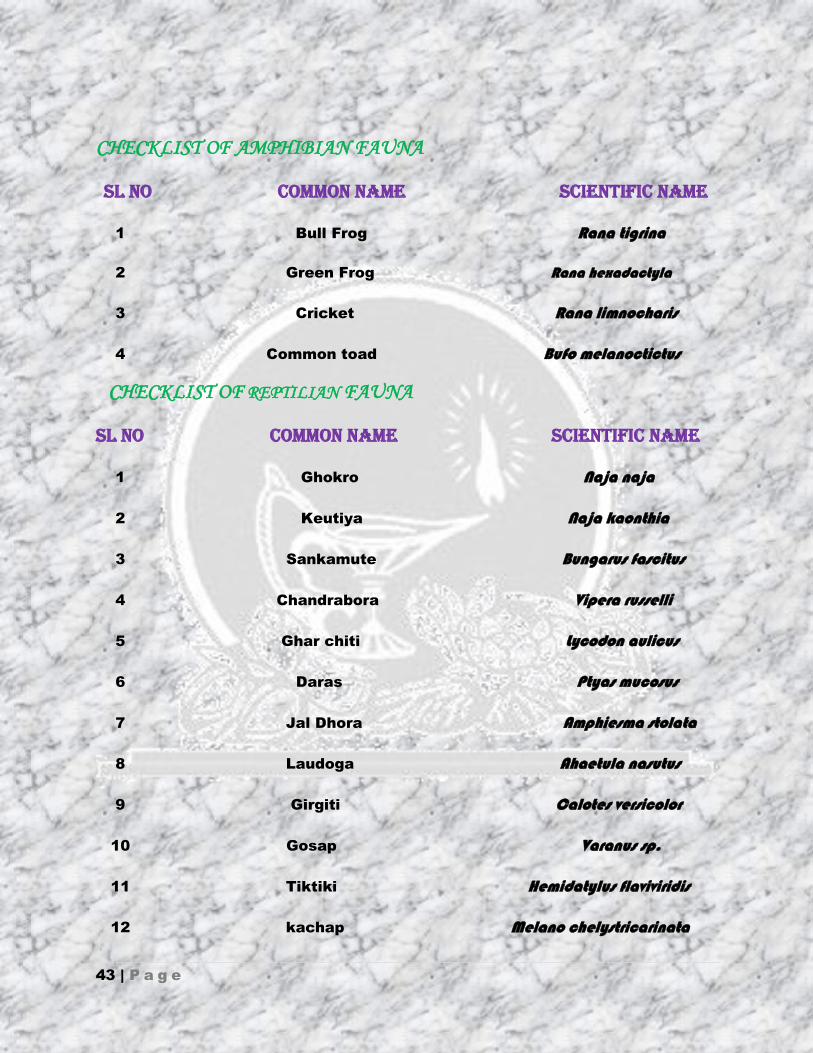
CHECKLIST OF AMPHIBIAN FAUNA
Sl No Common Name Scientific name
1 Bull Frog Rana tigrina
2 Green Frog Rana hexadactyla
3 Cricket Rana limnocharis
4 Common toad Bufo melanoctictus
CHECKLIST OF REPTILIAN FAUNA
Sl No Common Name Scientific name
1 Ghokro Naja naja
2 Keutiya Naja kaonthia
3 Sankamute Bungarus fascitus
4 Chandrabora Vipera russelli
5 Ghar chiti Lycodon aulicus
6 Daras Ptyas mucosus
7 Jal Dhora Amphiesma stolata
8 Laudoga Ahaetula nasutus
9 Girgiti Calotes versicolor
10 Gosap Varanus sp.
11 Tiktiki Hemidatylus flaviviridis
12 kachap Melano chelystricarinata

44 | P a g e
CHECKLIST OF BIRDS
Sl No Common Name Scientific name
1 Pelicans Pelecanus sp.
2 Ducks Anas sp.
3 Swans Cygnus sp.
4 Eagle Aquila sp.
5 Vulture Naphra sp.
6 Pigeon Columba sp.
7 Dove Streptapelia sp.
8 Cuckoo Cuculus sp.
9 Parrot Psittacula sp.
10 Kingeisher Alcedo sp
11 Woodpecker Picus sp.
12 Crow Corvus sp.
13 House sparrow Passer sp.
CHECKLIST OF MAMMALIAN FAUNA
Sl No Common Name Scientific name
1 Beji Herpestes auropunctuatus
2 Neul Herpestes edwardsii
3 Bhodar Lutrogale perspicillata

45 | P a g e
4 Chamchika Pipistrellus coromandra
5 Kathbiral Fuambulus pennatii
6 Metho Indur Mus booduga
7 Dhera Indur Bandicota bengalensis
8 Indur Bandicota indica
9 Nangti Indur Mus platythrix
10 Chuchu Sucks murinus
11 Marsh Moongoose Herpestes paltustris
12 Jackals, Dogs Canis sp.
13 Fox Vulpes sp.
THE ZOOLOGICAL TRANSFORMATION OF THE STUDY AREA
With future advancement of urbanization only Jackel, domesticated animals,
housepets, common street Dogs, occasional Monkeys, Fishing cats
(occasional), Rodents ( large & small) & a reduced population of reptiles
comprised the faunal population.
46 | P a g e
MEASUREMENT OR SAMPLING UNDERTAKEN AND
MONITORING RESULTS
SAMPLING OF POND WATER
Sampling of pond water from 3 different locations during December, 2010.
The results of pond water analysis are given.
Sample 1
Sample 1 was collected from--------------
NAME: Narkel bagan pond
LOCATION: Middle of north side of Survey Park
NATURE: Natural pond
DIMENSION: Length: 700ft.
Wide: 115 ft.
Depth: 9 ft.
PRESENT STATUS: It is Surrounded by Coconut Tree & Matri Mandir in one
side & in another side a swimming ghat is located. At present no waste
water is drained in this pond. Most of the fauna was extinct due to
civilization & for using of manure for pisiculture purpose.
HISTORY: Surrounding area of Narkelbagan pond was reported tobe a natural
raised land. After that this area was occupied for urbanization from 1968
approximately. Initially waste water from settlement used to drain in this
pond.
USES: Mainly used for pisiculture. ( name of the fishes are listed below).
One ghat is totally used by Mandir commity for puja purposes.
Another ghat is used for swimming purposes.

47 | P a g e
Sample 2
Sample 2 was collected from--------------
NAME: Nil pukur pond
LOCATION: West side of Survey Park
NATURE: Man made pond
DIMENSION: Length: 500 ft.
Wide: 290 ft.
Depth: 20 ft.
PRESENT STATUS: It is Surrounded by houses of Block A & Block B. At
present no waste water is drained in this pond. Most of the fauna was extinct
due to civilization & for using of manure for pisiculture purpose. The pond
was cleaned for fishing purposes on regular interval. This pond was
occationally overflow in pre moonson period. There is a 20 ft. road in north &
south of the pond & a 30 ft. road on eastern side.
HISTORY: Surrounding area of Nil pukur pond was reported to be a natural
raised land. After that this area was occupied for urbanization from 1968
approximately. Initially waste water from settlement used to drain in this
pond.
USES: Mainly used for pisiculture. ( name of the fishes are listed below).
Mostly used by the resident for their daily work & domestic purposes
like Bathing, Washing etc.
Also is used for swimming purposes.

48 | P a g e
Sample 3
Sample 3 was collected from--------------
NAME: VIP pond
LOCATION: East side of Survey Park
NATURE: Man made pond
DIMENSION: Length: 500 ft.
Wide: 280 ft.
Depth: 20 ft.
PRESENT STATUS: It is Surrounded by houses of Block C & Eastern
Metropolitan Bypass on eastern side of pond. At present no waste water is
drained in this pond. Most of the fauna was extinct due to civilization & for
using of manure for pisiculture purpose. The pond was cleaned for fishing
purposes on regular interval. This pond was occationally overflow in pre
moonson period. There is a 20 ft. road in north & south of the pond & a 40 ft.
road on western side.
HISTORY: Surrounding area of VIP pukur pond was reported to be a natural
raised land.It was builded during formation of Metropolitan Bypass. After that
this area was occupied for urbanization from 1968 approximately. Initially
waste water from settlement used to drain in this pond.
USES: Mainly used for pisiculture. ( name of the fishes are listed below).
Mostly used by the resident for their daily work & domestic purposes
like Bathing, Washing etc.
Also is used for swimming purposes.

49 | P a g e
SAMPLING OF POND WATER
Sample 1 Narkel bagan pond Sample 2 Nil pukur pond
Sample 3 VIP pond

50 | P a g e
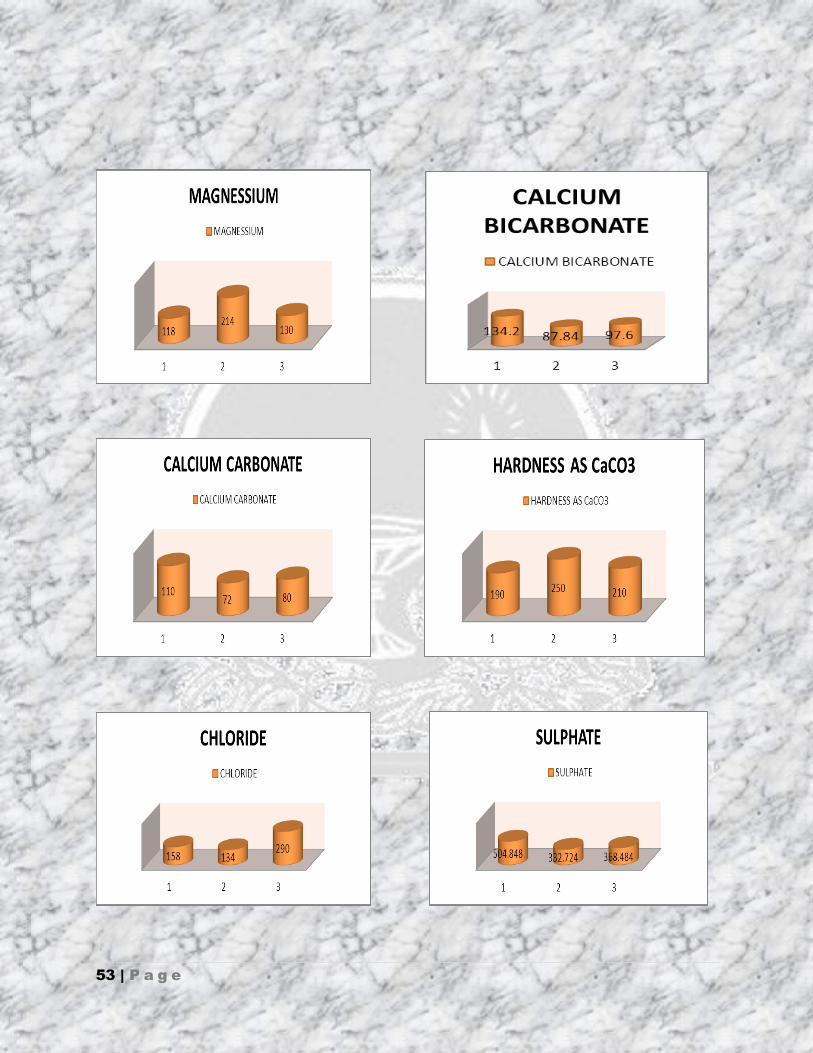
ANALYSIS OF POND WATER
Analysis of pond water from 3 different locations during december,
2010. The results of pond water analysis are given. Faecal Bacteria
are presents in all water samples.
parameters NIL PUKUR POND
NARKEL BAGAN POND VIP LAKE POND
TEMPERATURE 26.5° C 25° C 25° C
Ph 8 7.5 8
TURBIDITY( ntu) 1.2 1.8 1.8
TOTAL DISSOLVESOLIDS 632 mg/lit 776 mg/lit 1088 mg/lit
CONDUCTIVITY 790 970 1360
FREE DCO2 16.72 mg/lit 10.04 mg/lit 14.2 mg/lit
DO AT 26°C TEMP 3 mg/lit 4.4 mg/lit 4.6 mg/lit
BOD 3 DAYSAT 27°C TEMP 280 mg/lit 460 mg/lit 560 mg/lit
CALCIUM 36 mg/lit 72 mg/lit 80 mg/lit
MAGNESSIUM 214 mg/lit 118 mg/lit 130 mg/lit
CALCIUM CARBONATE 72 mg/lit 110 mg/lit 80 mg/lit

51 | P a g e
CALCIUM BICARBONATE 87.84 mg/lit 134.2 mg/lit 97.6 mg/lit
HARDNESS AS CaCO3 250 mg/lit 190 mg/lit 210 mg/lit
CHLORIDE 134 mg/lit 158 mg/lit 290 mg/lit
IRON 2.96 mg/lit 1.97 mg/lit 2.85 mg/lit
SULPHATE 332.724 mg/lit 504.848 mg/lit
368.484
mg/lit
PHOSPHATE 1.39 mg/lit 1.424 mg/lit 3.14 mg/lit
NITRATE 1.002 mg/lit 0.894 mg/lit 2.319 mg/lit
OIL & GREASE 0.34 mg/lit 0.45 mg/lit 0.64 mg/lit

52 | P a g e
53 | P a g e

54 | P a g e
REMARK
The chemical & biological processes that occur in water are strongly
influenced by the physical condition of the body of water. Water’s unique temperature-density relationship results in the formation of distinct layer
within non flowing bodies of water such as stagnant water in a deep pond.
During summer, the surface layer (epilimnion) of deep ponds is heated by
solar radiation. It floats owing to its lower density upon the bottom layer
( hypolimnion). This phenomenon is called the Thermal Stratification. When a
significant temperature difference exists b/w the 2 layers , they donot mix ,
but behave independently & have very different chemical & biological
properties. The shear plane or layer b/w epilimnion & hypolimnion is called

55 | P a g e
Thermocline. The epilimnion which is exposed to light may have a heavy
growth of algae. Because the epilimnion is exposed to atmosphere &
contains to heavy growth of algae photosynthetic activity in this layer is
high. Hence this layer contains higher levels of DO & it contains
predominantly oxidized species. On the other hand in hypolimnion, the
consumption of O2 by biodegradable organic matter may cause the water to
become anaerobic. As a result, Chemical species in a relatively reduced form
tend to predominate in the hypolimnion.
DISSCASSION
BOD of all samples were done after 1% dilution.
COD of all samples were done after 5% dilution.
BDL----- Below Detection Level.
In all water sample faecal bacteria present so there is chance of
Spread of water born disease.
Render water unsafe for uses like aquatic sports, drinking & bathing.
Suspended solids & sludge discharge into water body causes reduction in
self purification capacity of streams.
All testing methods was done according to APHA, 20th Edision.
TDS of tubewell water is high.
Iron is high in all water sample.

56 | P a g e
SAMPLING OF SEWAGE WATER
Sampling of sewage canals down stream & up stream from 2 different
locations during December, 2010. The results of sewage silt analysis are
given.
Sample 1
Sample 1 was collected from waste water discharge channel near from
concreate bridge across the Rajapur canal at a point of 20 mt. downstream
of waste water discharge outfall from the Hyland park complex. At this point
T.B. hospital’s canal from south east of rajapur canal which drain
considerable area starting from patuli downstream upto kasba.
Generally here, the dumping of solid waste plastic & biodegradable &
nonbiodegradable wastes are occurred.
Sample 2
Sample 2 was collected from Rajapur – Dhapa waste water channel to be
upstream of waste water discharge from Calcutta green & Ambuja housing
Complex away 100 mt. Here I was able to find Sajna, Banana & many other
natural vegetation which proved that natural plantation are predominated
over manmade plantation.
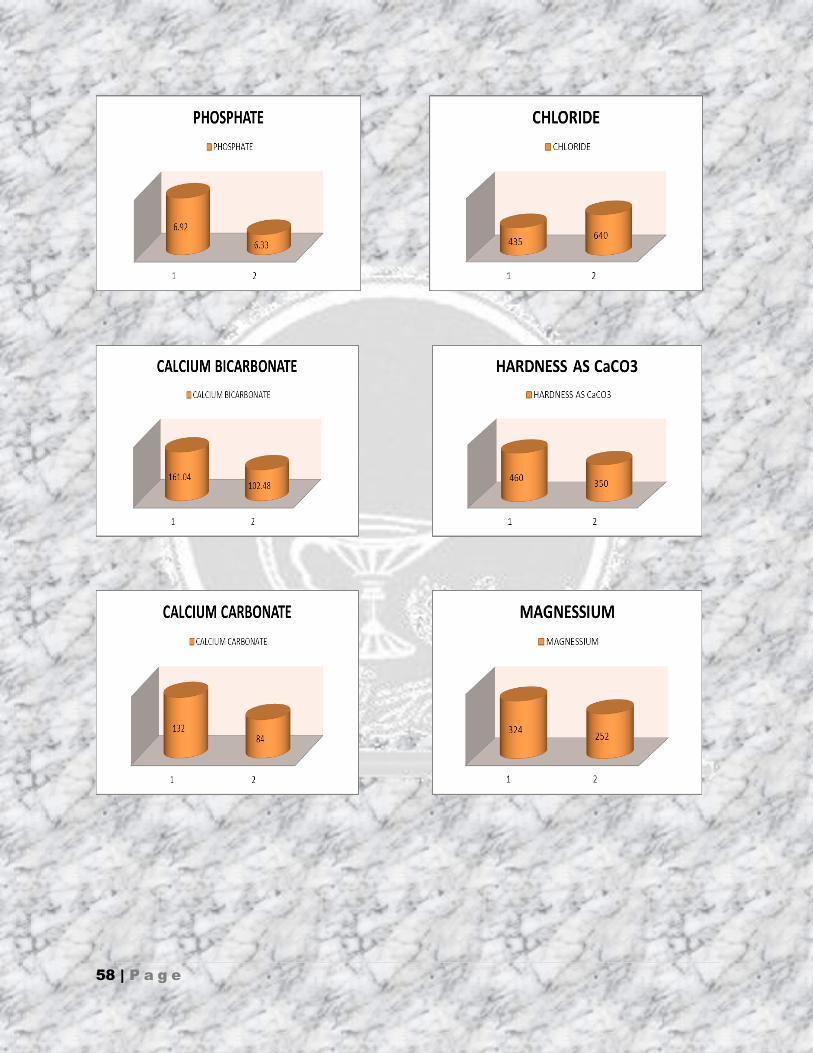
ANALYSIS OF SEWAGE CANALS
Analysis of sewage canals down stream & up stream from 2 different
locations during december, 2010. The results of sewage silt analysis are
given. . Faecal Bacteria are presents in all water samples. Sampling and
analysis of Tube well from 1 locations during december, 2010.
PARAMETERS
Sewage canal
downstream Sewage canal upstream
TEMPERATURE °C 28° C 26° C

57 | P a g e
Ph 7.5 7.5
DO AT 26°C TEMP nil. nil
BOD 3 DAYSAT 27°C
TEMP 320 mg/lit 380 mg/lit
CALCIUM 136 mg/lit 98 mg/lit
MAGNESSIUM 324 mg/lit 252 mg/lit
HARDNESS AS CaCO3 460 mg/lit 350 mg/lit
CALCIUM CARBONATE 132 mg/lit 84 mg/lit
CALCIUM
BICARBONATE 161.04 mg/lit 102.48 mg/lit
CHLORIDE 435 mg/lit 640 mg/lit
NITRATE 9.31 mg/lit 6.092 mg/lit
PHOSPHATE 6.92 mg/lit 6.33 mg/lit
SULPHATE 833.332 mg/lit 473.936 mg/lit
58 | P a g e

59 | P a g e
REMARK
Flow Chart of the Public Health Effects brought about by Environmental Pollution emanating from Waste Dumping SANTOSHPUR SEWAGE CANAL • Industrial Waste e.g., falloff or unused chemicals and raw materials,
expired products and substandard goods from industry.
•Agricultural Waste e.g., pesticides (herbicides and fungicides,manuers,fertilisers) from catchment area.
• Hospital Waste e.g., packaging materials and containers, used syringes and sharps, biological waste and pharmaceuticals from several hospital nursing
homes of the area.
↓
↓
↓

60 | P a g e
↓
ENVIRONMENTAL POLLUTANTS FROM THE ABOVE UNTREATED WASTE
WATER
• Heavy Metals e.g., lead, mercury, cadmium, arsenic, chromium, zinc, nickel
and copper.
• Persistent Organic Pollutants e.g., aldrin, dieldrin, dichlorodiphenyl-trichloroethane (DDT), endrin, heptachlor, toxaphene, chlordane,
hexachlorobenzene, mirex (organochlorines, organophosphates, carbamates)
and polychlorinated biphenyls (PCBs).
↓
↓
↓
↓
ROUTES OF EXPOSURE TO THE LIFE FORMS
These toxicants can be found in air, water and soil and could find their way
into the human body & other biota through:
• Inhalation – movement of air from the external environment through the
airways during breathing.
61 | P a g e
• Ingestion – the consumption of a substance by an organism either man or
animals.
• Absorption – the movement and uptake of substances into cells or across
tissues such as skin by way of diffusion or osmosis.
↓
↓
↓
↓
I PUBLIC HEALTH EFFECTS
• Skin Disorders – Fungal infection, allergic dermatitis, pruritis and skin
cancer
• Respiratory Abnormalities – bacterial upper respiratory tract infections
(pharyngitis, laryngitis and rhinitis), chronic bronchitis and asthma.
• Abdominal and Intestinal Problems – bacterial enteritis, helminthiasis,
amoebiasis, liver cancer, kidney and renal failure.
• Dental Disorders – dental carries and dental pain.
62 | P a g e
• Ear Infections – otitis media and bacterial infections.
• Skeletal Muscular Systems – back pain.
•Central Nervous System – impairment of neurological development,
peripheral nerve damage and headaches.
• Eye Infections – allergic conjunctivitis, bacterial eye infections.
• Blood Disorders – Iron deficiency anaemia.
•Others – malaria, chicken pox, septic wounds and congenital abnormalities,
cardiovascular diseases and lung cancer.
SAMPLING OF DRINKING WATER
Quality of ground water of existing tube wells located was determined.
Although the water is not polluted in respect of coliform contamination and
elevated levels of heavy metals, concentrations of dissolved solids, total
hardness, chloride and Fe are high when compared with drinking water
standard.
Sampling and analysis of Tube well from 1 locations during December, 2010.
The results of drinking water analysis are given.

63 | P a g e
LOCATION
Tubewell water from the Survey Park Matri Mandir has been situated in the
default location of the tubewell is as below------------
SURVEY PARK MATRI MANDIR,
SURVEY OF INDIA CO-OPERATIVE HOUSING SOCIETY LTD,
SURVEY PARK,
SANTOSH PUR,
KOLKATA – 700075.
PHYSICAL CHARACTERS
COLOUR — reddish.
ODOUR — smell of iron.
TURBID — turbid.
TASTE — not well.

64 | P a g e
CHEMICAL CHARACTERS
parameters
Tube well
TEMPERATURE 26.5° C
Ph 7.7
TURBIDITY 57.2 NTU
TOTAL DISSOLVESOLIDS 2480 mg/lit
CONDUCTIVITY 3100
FREE DCO2 22 mg/lit
Arsenic Below detection level
CALCIUM 52 mg/lit
MAGNESSIUM 118 mg/lit
CALCIUM CARBONATE 90 mg/lit
CALCIUM BICARBONATE 109.80 mg/lit
HARDNESS AS CaCO3 170 mg/lit
CHLORIDe
fluoride 840 mg/lit
Below detection level
IRON 7.97 mg/lit
SULPHATE 201.212 mg/lit
PHOSPHATE Below detection level
NITRATE 0.0 mg/lit
OIL & GREASE Not examined
Sampling and analysis of Tube well from 1 locations during december, 2010.

65 | P a g e
REMARK
WATER QUALITY CRITERIA
Designated-Best-Use
Class
of
water
Criteria
Drinking Water Source
without conventional
treatment but after
disinfection
A Total Coliforms Organism
MPN/100ml shall be 50 or less .
pH between 6.5 and 8.5 .
Dissolved Oxygen 6mg/l or more.
Biochemical Oxygen Demand 5
days 20°C 2mg/l or less .
Outdoor bathing
(Organised)
B Total Coliforms Organism
MPN/100ml shall be 500 or less.
pH between 6.5 and 8.5 .
Dissolved Oxygen 5mg/l or more.
Biochemical Oxygen Demand 5
days 20°C 3mg/l or less .
Drinking water source
after conventional
treatment and
disinfection
C Total Coliforms Organism
MPN/100ml shall be 5000 or less.
pH between 6 to 9.
Dissolved Oxygen 4mg/l or more.
Biochemical Oxygen Demand 5
days 20°C 3mg/l or less.

66 | P a g e
Propagation of Wild
life and Fisheries
D pH between 6.5 to 8.5.
D Dissolved Oxygen 4mg/l or more.
Free Ammonia (as N) 1.2 mg/l or
less .
Irrigation,
Industrial Cooling,
Controlled Waste
disposal
E
pH betwwn 6.0 to 8.5.
Electrical Conductivity at 25°C
micro mhos/cm Max.2250.
Sodium absorption Ratio Max. 26.
Boron Max. 2mg/l
Below-E Not Meeting A, B, C, D & E Criteria
67 | P a g e
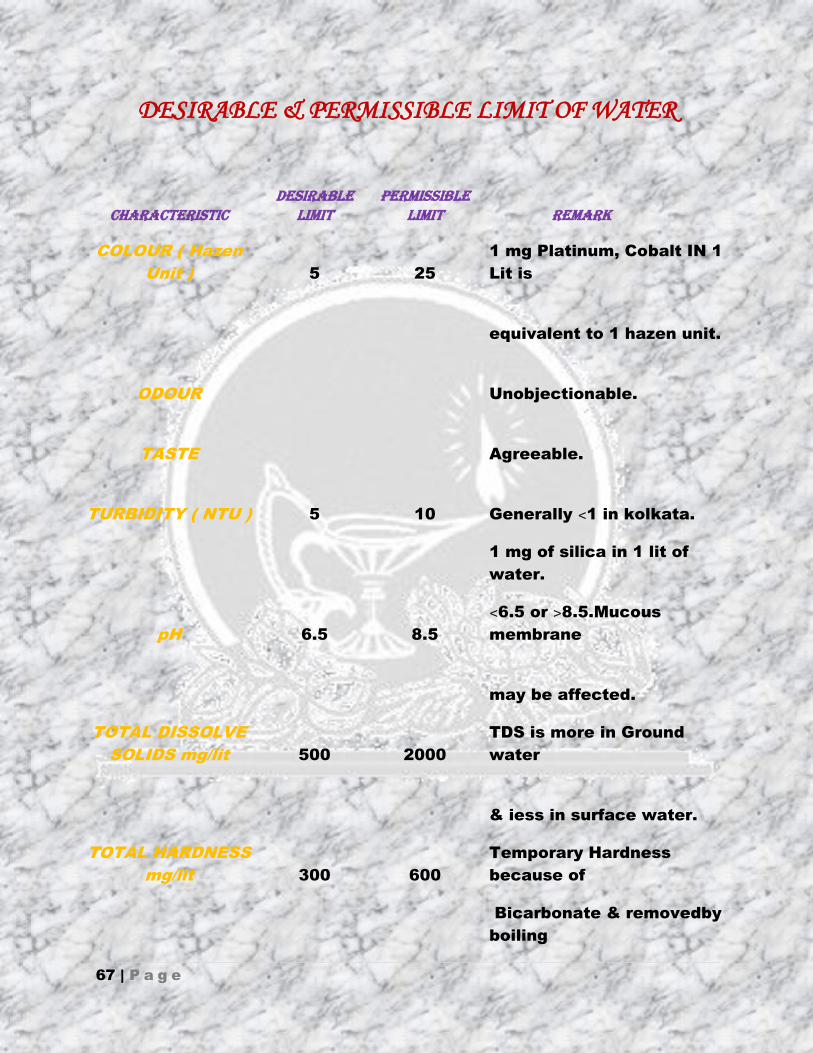
DESIRABLE & PERMISSIBLE LIMIT OF WATER
CHARACTERISTIC DESIRABLE
LIMIT PERMISSIBLE
LIMIT REMARK
COLOUR ( Hazen
Unit ) 5 25
1 mg Platinum, Cobalt IN 1
Lit is
equivalent to 1 hazen unit.
ODOUR Unobjectionable.
TASTE Agreeable.
TURBIDITY ( NTU ) 5 10 Generally 1 in kolkata.
1 mg of silica in 1 lit of
water.
pH 6.5 8.5
6.5 or 8.5.Mucous
membrane
may be affected.
TOTAL DISSOLVE
SOLIDS mg/lit 500 2000
TDS is more in Ground
water
& iess in surface water.
TOTAL HARDNESS
mg/lit 300 600
Temporary Hardness
because of
Bicarbonate & removedby
boiling

68 | P a g e
while permanent is
because of non Carbonate.
IRON mg/lit 0.3 1
FLUORIDE mg/lit 1 1.5
Fluoride less in surface
water.
CALCIUM mg/lit 75 200
Adverse effect on domestic
uses.
SULPHATE mg/lit 200 400
Magnesium & sodium of
this compound
causes Gastro Intestinal
Irritation.
NITRATE mg/lit 45 45
Blue Baby diseases may be
take place.
ARSENIC mg/lit 0.01 0.05
Arsenocosis may be take
place.
ALKALINITY mg/lit 200 400

69 | P a g e
TEMPERATURE & RAINFALL MEASURE MENT
Station code:
A1 = Nearer area of Narkel bagan pond ( in Matri mandir),
A2 = Nearer area of nil pukur pond( C 225, Survey Park ),
A3 = nearer area of VIP pukur Pond ( A 119, Survey Park ).
LOCATION DATE TIME IN
DAYTIME
MINIMUM
TEMP IN °C MAXIMUM TEMP IN
°C
A1 7/12/2010 9:45 AM 13.1 26.9
8/12/2010 9:45 AM 22.3 31
9/12/2010 9:45 AM 26.5 38.2
10/12/2010 9:45 AM 13.2 26.9
11/12/2010 9:45 AM 12.4 25.9
12/12/2010 9:45 AM 12.1 25.6
13/12/2010 9:45 AM 12.4 25.8
14/12/2010 9:45 AM 11.7 24

70 | P a g e
LOCATION DATE
TIME IN
DAYTIME
MINIMUM
TEMP IN °C
MAXIMUM
TEMP IN °C
A2 22/12/10 8:10 AM 11.7 23
23/12/2010 8:00 AM 11.4 22.6
24/12/2010 8:10 AM 11.2 22.3
25/12/2010 8:20 AM 11 21.9
26/12/2010 8:00 AM 10.5 21.6
27/12/2010 8:10 AM 10.5 21.5
28/12/2010 8:05 AM 10.5 21.6
29/12/2010 7:50 AM 10 21
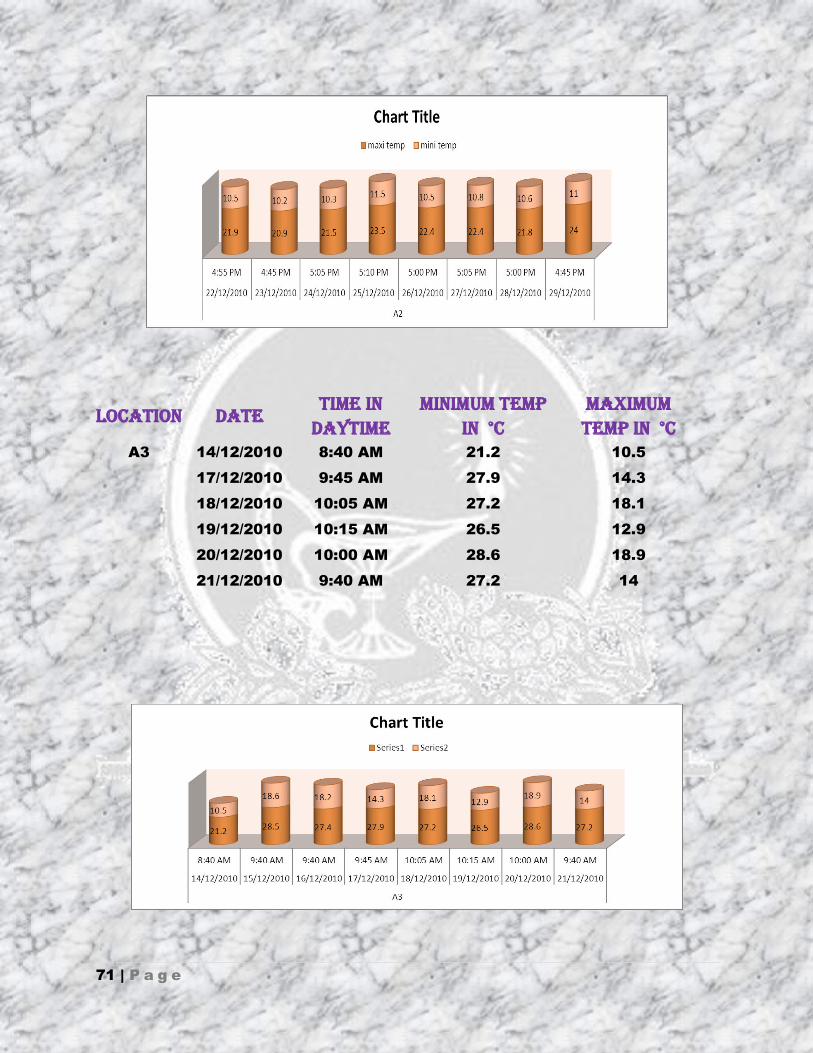
LOCATION DATE
TIME IN
NIGHTTIME
MAXIMUM
TEMP IN °C
MINIMUM
TEMP IN °C A2 22/12/2010 4:55 PM 21.9 10.5
23/12/2010 4:45 PM 20.9 10.2
24/12/2010 5:05 PM 21.5 10.3
25/12/2010 5:10 PM 23.5 11.5
26/12/2010 5:00 PM 22.4 10.5
27/12/2010 5:05 PM 22.4 10.8
28/12/2010 5:00 PM 21.8 10.6
29/12/2010 4:45 PM 24 11
71 | P a g e
LOCATION DATE TIME IN
DAYTIME
MINIMUM TEMP
IN °C
MAXIMUM
TEMP IN °C A3 14/12/2010 8:40 AM 21.2 10.5
17/12/2010 9:45 AM 27.9 14.3
18/12/2010 10:05 AM 27.2 18.1
19/12/2010 10:15 AM 26.5 12.9
20/12/2010 10:00 AM 28.6 18.9
21/12/2010 9:40 AM 27.2 14

72 | P a g e
LOCATION DATE
TIME IN
NIGHTTIME
MAXIMUM TEMP
IN °C
MINIMUM TEMP
IN °C A3 14/12/2010 8:45 PM 20.9 10.2
15/12/2010 9:00 PM 20.6 10
16/12/2010 8:50 PM 20.3 10
17/12/2010 8:45 PM 20.9 10.2
18/12/2010 8:50 PM 20 9.9
19/12/2010 8:45 PM 19 9.8
20/12/2010 8:40 PM 19 9.8
21/12/2010 8:30 PM 21.2 10.5

73 | P a g e
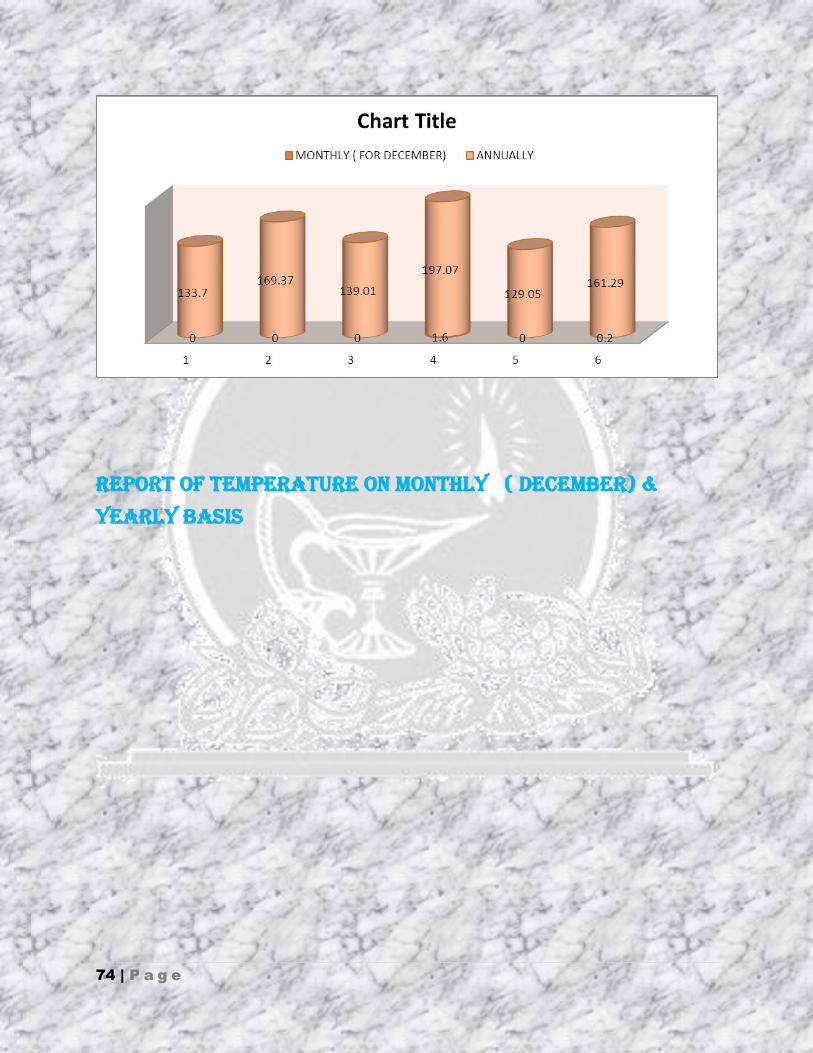
REPORT OF RAINFALL ON MONTHLY ( DECEMBER) & YEARLY
BASIS
YEAR MONTHLY ( FOR DECEMBER) ANNUALLY 1945 0 133.7
1970 0 169.37
1980 0 139.01
1990 1.6 197.07
2000 0 129.05
2005 0.2 161.29
74 | P a g e
REPORT OF TEMPERATURE ON MONTHLY ( DECEMBER) &
YEARLY BASIS

75 | P a g e
YEAR MONTHLY ( FOR DECEMBER) ANNUALLY
MAXIMUM IN °C MINIMUM IN °C MAXIMUM IN °C MINIMUM IN °C
1945 25.8 12.8 31.4 21.6
1970 26.7 12.7 31.6 22.2
1980 27.7 14.9 32 22.5
1990 27.3 15 31.1 22.4
2000 27.2 14.8 31.4 22.8
2005 27 15.2 31.7 22.9

76 | P a g e
AMBIENT AIR QUALITY Ambient air quality in respect of concentrations of RPM, SPM, SO2, NOx, CO
and Pb was monitored at Central Pollution Control Board in Kasba stations
during 2010 . RPM and SPM concentrations are relatively high exceeding the
limits of prescribed annual average concentrations. This is possibly related
to long distance transport of the pollutants from Kolkata metropolitan area.
Concentrations of SO2 and NOx, CO and Pb are within the prescribed limits.
Ambient air quality at 4 monitoring stations during June, 2010
Station code: A1 = Near main gate fishery feed MMC Export Ltd,
Khasmahal, Kolkata 700 105, A2 = Bamanghata K.G,School, Hadia, 24
Parganas (S).
Station Date RPM SPM SO2 NOx CO Pb Rainfall
code (mm)
10.06.10 to 132.59 250.00 7.66 32.52 <125 <0.002 11.06.10 112.46 205.33 6.51 30.03 <125 <0.002 15.3
138.00 267.98 6.90 26.42 <125 <0.002
A1 14.06.10 to 120.18 335.92 6.90 30.03 <125 <0.002
15.06.10 136.28 316.49 7.28 28.45 <125 <0.002 0
116.49 163.72 6.51 28.68 <125 <0.002
25.06.10 to 123.59 235.17 6.90 30.03 <125 <0.002 26.06.10 110.88 193.50 6.13 26.42 <125 <0.002 0
118.50 228.11 6.51 28.45 <125 <0.002

77 | P a g e
138.59 287.61 6.13. 35.00 <125 <0.002
10.06.10 to 123.04 140.85 5.75 32.52 <125 <0.002 0.80
11.06.10 112.36 200.14 5.75 30.03 <125 <0.002
A2
124.31 253.99 6.13 33.42 <125 <0.002
14.06.10 to 132.47 234.55 6.51 31.61 <125 <0.002 0.0
15.06.10 110.76 194.62 5.36 29.58 <125 <0.002
132.43 248.73 6.13 33.42 <125 <0.002
26.06.10 to 116.30 236.59 5.75 30.03 <125 <0.002 0
27.06.10 110.33 186.23 5.36 28.45 <125 <0.002
Shift: 1 from 1000 to 1800 hours, 2 = 1800 to 0200 hours and 3 = 0200 to
1000 hours
All values are in microgram per cubic meter of air
Average Air Quality DATA Of District: Kolkata For Date Between
01/12/2010 And 31/12/2010
All data & results are collected from Central Pollution Control Board
Date Parameters
NO2(µg/m³) PM10 (µg/m³) SO2(µg/m³)
01/12/2010 73.75 119.00 11.25
02/12/2010 75.00 166.50 11.00
03/12/2010 77.75 129.50 9.25
04/12/2010 73.50 154.25 10.25
05/12/2010 64.75 171.00 10.00
06/12/2010 87.00 106.00 10.25
07/12/2010 79.00 117.25 10.00
08/12/2010 62.80 89.60 8.60
09/12/2010 64.50 59.75 10.75
10/12/2010 68.80 80.40 8.00
78 | P a g e
11/12/2010 69.00 122.00 10.33
12/12/2010 56.75 141.75 8.50
13/12/2010 71.80 144.80 9.40
14/12/2010 74.75 189.25 10.50
15/12/2010 76.40 205.00 10.20
16/12/2010 83.67 167.67 12.67
17/12/2010 77.00 171.50 10.25
18/12/2010 74.43 187.00 9.71
19/12/2010 66.25 158.00 10.25
20/12/2010 85.00 181.60 11.80
21/12/2010 91.33 202.33 12.33
22/12/2010 102.00 234.40 10.00
23/12/2010 82.33 267.67 10.67
24/12/2010 92.22 203.11 10.44
25/12/2010 83.50 180.25 8.75
26/12/2010 66.67 175.33 9.00
27/12/2010 108.90 287.86 9.60
28/12/2010 93.25 233.00 9.75
29/12/2010 106.60 242.29 10.60
30/12/2010 97.50 244.50 8.75
31/12/2010 96.50 309.25 8.75
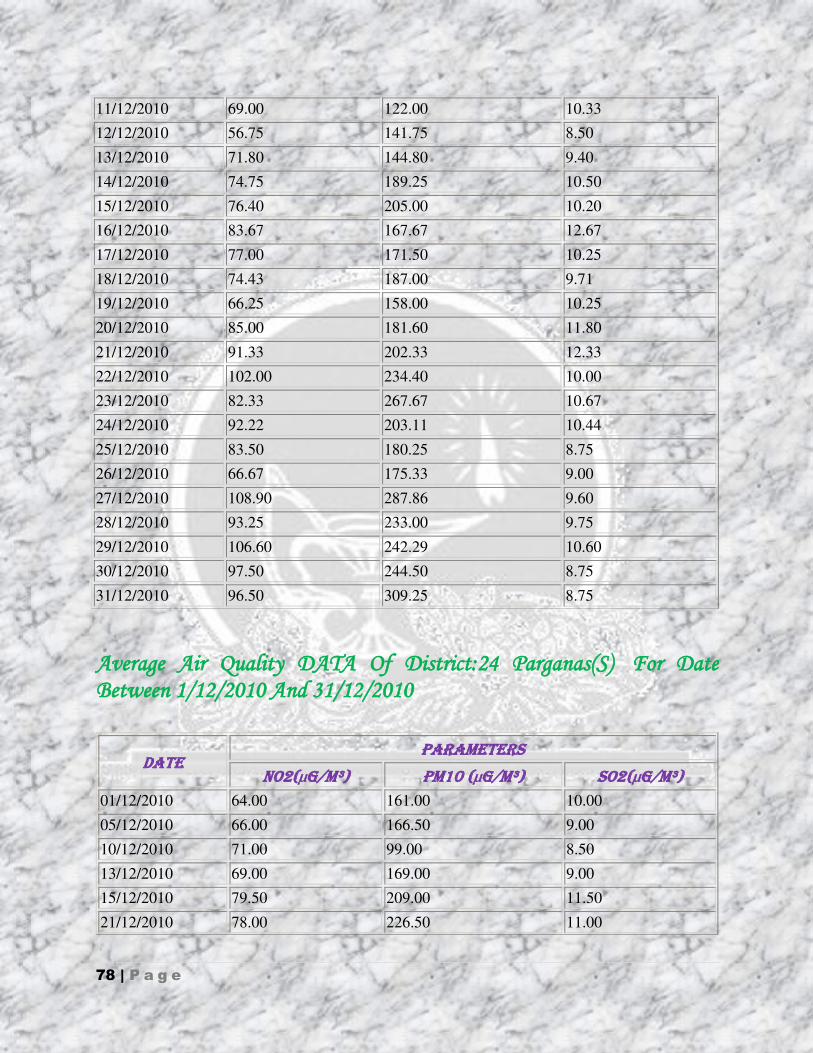
Average Air Quality DATA Of District:24 Parganas(S) For Date Between 1/12/2010 And 31/12/2010
Date Parameters
NO2(µg/m³) PM10 (µg/m³) SO2(µg/m³)
01/12/2010 64.00 161.00 10.00
05/12/2010 66.00 166.50 9.00
10/12/2010 71.00 99.00 8.50
13/12/2010 69.00 169.00 9.00
15/12/2010 79.50 209.00 11.50
21/12/2010 78.00 226.50 11.00

79 | P a g e
COMPARISION OF AIR QUALITY DATA BETWEEN
DISTRICT KOLKATA & SOUTH 24 PARGANA DURING
DECEMBER , 2010.
25/12/2010 72.00 179.00 8.00
27/12/2010 83.50 245.50 9.00
30/12/2010 84.00 276.00 7.50
PARAMETERS
AREA NO2 ( μG/M3 ) PM 10 ( μG/M3 ) SO2 ( μG/M3 )
KOLKATA 80.08 175.54 10.05
SOUTH 24
PARGANA 74.05 192.38 9.27
80 | P a g e
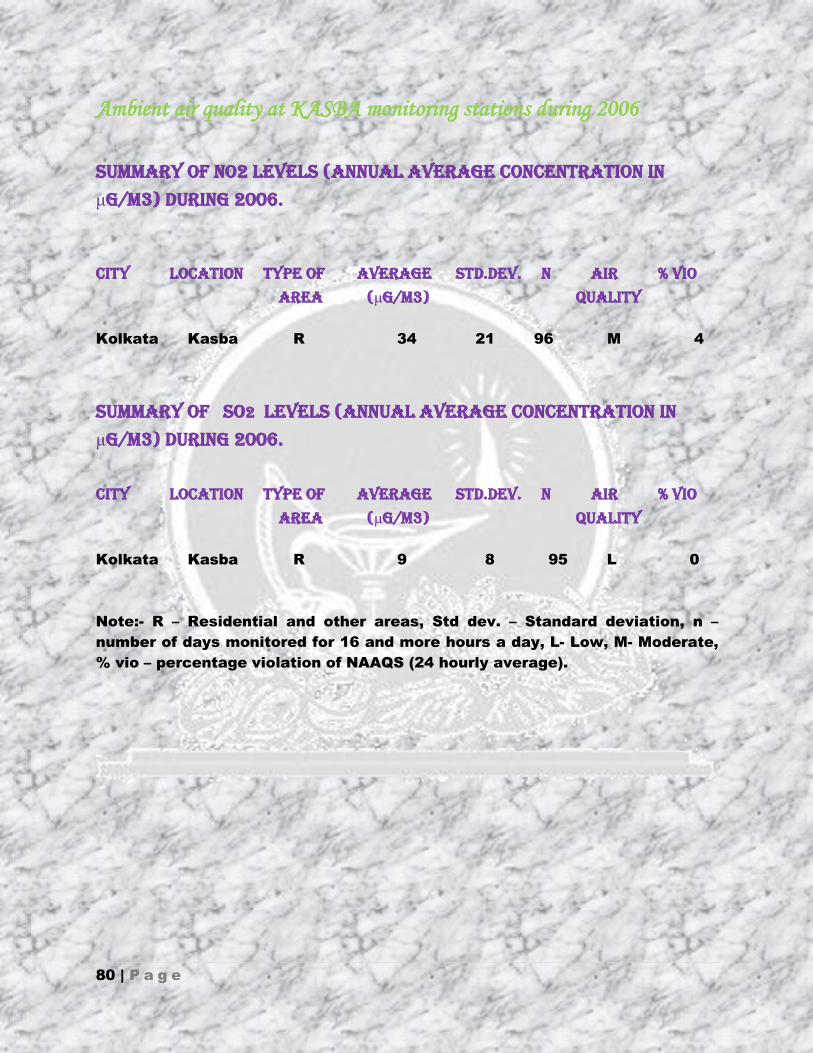
Ambient air quality at KASBA monitoring stations during 2006
Summary of NO2 levels (Annual Average Concentration in
μg/m3) during 2006.
CITY LOCATION Type of Average Std.Dev. n Air % vio
Area (μg/m3) Quality
Kolkata Kasba R 34 21 96 M 4
Summary of SO2 levels (Annual Average Concentration in
μg/m3) during 2006.
CITY LOCATION Type of Average Std.Dev. n Air % vio
Area (μg/m3) Quality
Kolkata Kasba R 9 8 95 L 0
Note:- R – Residential and other areas, Std dev. – Standard deviation, n –
number of days monitored for 16 and more hours a day, L- Low, M- Moderate,
% vio – percentage violation of NAAQS (24 hourly average).

81 | P a g e
REMARK SOME COMMON AIR POLLUTANTS< THEIR SOURCES & EFFECTS
POLLUTANTS
MAJOR
SOURCES
EFFECTS
ANIMALS PLANTS MATERIALS
CARBON
MONOXIDE
(CO)
Gasoline,
motor
exhaust,
burning of
coal.
reduced
oxygen
carrying
capacity of
blood,
reducing
mental
attentiveness,
physical
exertion,
cardiovascular
disease.
leaf
curling,
aging &
reduction
in leaf size.
none
NITROGEN
OXIDES
( NOX)
motor
vehicle
exhaust ,
power
generation
( burning
of coal )
Interferes
with
respiratory
functions
producing
chronic
diseases.
Defoliation,
marginal &
tip burning,
irregular
black
spots.
Accelerated
deterioration
of dyes &
paints.
SULPHUR
OXIDES
( SOX )
power
generation,
industrial
processes
irritation to
eyes &
respiratory
aliments.
interveinal
chlorosis
affects
stomatal
pores,
stomatal
frequency
&
chloroplast
strutures.
corrosion of
iron metals,
accelerated
deterioration
of building
stone,
cotton,
paper,
leather other
finishes.

82 | P a g e
SUSPENDED
PARTICULATE
MATTES
(SPM)
power
generation,
industrial
processes,
soil
erosion.
interferes with
respiratory
functions,
contributing
to lung
cancer, eye
irritation.
clogs
stomata,
prevents
gas &
vapour
exchange.
spoiling of
fabrics &
buildings,
corrosion of
metals when
combines
with so2
CHLORINE
bleaching
of cotton &
flour &
other
chemical
processes.
attacks entire
respiratory
tract &
mucous
membrane of
eyes, causes
pulmonary
edema
ARSENIC
metals or
acids
containing
arsenic
soldering
breaks down
rbc in blood,
damages
kidney,
causes
jaundice.

83 | P a g e
NOISE LEVEL MEASUREMENT Ambient noise levels in study area were measured. The noise levels although
exceeding the norm for residential area exceed only by a few decibals they
are acceptable taking in to consideration that average noise level in Kolkata
is relatively high.
Date of 12.4.2010
Monitoring
Location Santoshpur pumping station
Mean noise level in dB(A) 54.9
Site activity Vehicles were plying
NOISE MONITORING AT THE PERIPHERY OF WORK PLACES Noise levels in dBA have been compared with the periphery of several work
sites & ambient noise level. The results of the measurements are tabulated .
SAMPLING 1
Location: Near Santoshpur Railway Station
Borough: Maheshtala Municipality
Ward: 121
Package: SDA
Noise level when activity was going on
Activity at site Mixture Machine was running
Date 17.03.10

84 | P a g e
Min dB (A) 72.3
Max dB (A) 81.9
Leq dB(A) 77.81
Mean dB(A) 76.93
Ambient Noise level at periphery of the worksite Ambient
Date 17.03.10
Min dB (A) 64.5
Max dB (A) 70.5
Leq dB(A) 68.06
Mean dB(A) 67.64
Ambient Remarks Light vehicles plying
Noise levels in dBA have been compared with the periphery of several work
sites & ambient noise level. The results of the measurements are tabulated .
SAMPLING 2
Location: Near Jora Bridge
Borough: XII
Ward: 104
Package: SDC
Noise level when activity was going on

85 | P a g e
Date 18.03.10
Min dB (A) 69.1
Max dB (A) 80.4
Leq dB(A) 77.24
Mean dB(A) 76.13
Activity at site 3 H.P. Pump wasrunning
Ambient Noise level at periphery of the worksite
Date 18.03.10
Min dB (A) 57.9
Max dB (A) 68.5
Leq dB(A) 64.35
Mean dB(A) 63.05
Ambient Remarks Light vehicles plying
Noise levels in dBA have been comparedwhen work was going on & not
going. The results of the measurements are tabulated .
SAMPLING 3
Location: Near Jora Bridge
Borough: XII
Ward: 104
Package: SDC
Work was going on
Date 09. 06.10
Min dB (A) 72.9

86 | P a g e
Max dB (A) 82.9
Leq dB(A) 79.50
Mean dB(A) 78.64
Activity at site Mixture Machine was running.
Work was not going on
Date 09.06.10
Min dB (A) 60.6
Max dB (A) 68.8
Leq dB(A) 65.64
Mean dB(A) 64.94
Ambient Remarks Near Canal area

87 | P a g e
REMARK
IMPACT ON HUMAN HEALTH
NOISE LEVEL
( dB)
DAMAGE
80-95 Annoyance of varying degree.
100 Prolonged exposure cause Permanent damage to
hearing.
110 Stimulation of reception in skin.
120 Threshold of pain.
130-135 Nausea, Vomiting, Dizziness, Interference with
touch.
140 Pain in ear, prolonged exposure causes insanity.
150 Burning sensation in skin, significant change in
pulse rate.
180 Rupture of eardrum.
194 Lung damage.
IMPACT ON WILD LIFE
Effect of noise pollution on migratory birds is exemplified by the decline in
number of migratory birds to habitats which have become noisy.
IMPACT ON NONLIVING THINGS
High intensity noise result in breaking of window pane, loosening of wall
plaster, cracks on walls & other effects.

88 | P a g e
ESTIMATION OF BENEFITS Water bodies play an important role in the history of human civilization.
Water being the main source of life, all great civilizations grew up along
riverbanks like Indus, Ganges, Nile, Euphrates and Tigris. Affinity of human
towards ponds is ancient too as their presence in the close vicinity had been
playing a significant role in commanding the distribution of human
settlements. ponds in close proximity had been providing the surrounding
population with all their basic necessities of life be it as a source of drinking
or irrigation water or fertile soil for harvesting or supplying materials for
building homesteads etc. Since the dawn of civilization the interlinkage
between this natural environment and economy is all embracing. Despite
their functions as regulators of water regimes and habitats of distinctive
ecosystems ponds have significant commercial and economic importance
too. The surveyed ponds are used as storage of water, which made either
from runoff or from drenched water of nearby rivers. This water is used
initially for irrigation in periods of water scarcity. A number of commercially
valuable flora and fauna are also grown in these ponds by the neighbouring
community, among which fish is the most important one. The huge economic
benefits obtained from net fishing have tended these ponds to be converted
to aquaculture ponds.
ENVIRONMENTAL IMPACT UPON HEALTH
We humans have captured the environment to make our lives beautiful
but through our activities and materialistic pursuits, we have made
environment the biggest enemy of our health. We have ourself created an
environment which has given us all leisures of life but on the other hand we
have dug the walls of unhealthy livings also in it. In 1997, Department of
Health Canada passed a report which stated:
“The built environment is part of the overall ecosystem of our
earth. It encompasses all of the buildings, spaces, and products that
are created, or at least significantly modified, by people. It includes
our homes, schools and workplaces, parks, business areas and roads.
It extends overhead in the form of electric transmission lines,

89 | P a g e
underground in the form of waste disposal sites and subway trains and
across the country in the form of highways.” (Hancock, 2000)
In the contemporary society of today, built environment is the most
crucial aspect of our lives. All over the world, more than 85 per cent of
people are living in urban dewllings. These urban settlements are creating an
adverse impact on the natural environment. They are using maximum amount
of the world’s resources and in return are producing maximum waste from them. Even leRiche and Milner (1971) explained in “Epidemiology as
Medical Ecology,” “One of the most striking changes in the ecology of
man has been the growth of cities.” (Hancock, 2000) The WHO Expert Committee on Environmental Health in Urban Development (WHO, 1991)
pointed that:
“In some respects, urbanization can itself be considered to be a
key variable in the health equation: when the pollution produced by a
densely packed population outstrips the natural absorptive capacity of
the city's ecosystem, adverse health effects can be increased where
controls are lacking or unreliable.” (Hancock, 2000)
Urban civilization cannot be termed as a natural ecosystem as it is
completely built by humans encompassing almost whole globe in its vicinity
and destroying the very concept of being “Natural”. It is a complex human ecosystem which constitutes both physical environment created by humans
and the social, economic, cultural and political environments in which the
humans survive. In Survey Park like area, human beings spend around 70
percent of their time inside the four confines of their doors, another 5 per
cent in their cars and remaining 25 per cent outside like school or colleges
or in offices or other service centers. And outside too, they are spending
maximum time in the vicinity of the built urban environment.
It is a general trend of humans to consider the poor diet or just lack of
exercise as an excuse for their bad health but they hardly consider the ill
effect of the built environment with the housing characteristics, patterns in
land use, transportation etc. It is evidently proved without doubt that when
these different modes of our living standards are not created keeping the

90 | P a g e
ecological balance into consideration, the ecosystem collapses (Jackson &
Kochtitzky, Online Edition) which deteriorates our health causing stress,
chronic diseases etc. The haphazard urban development leads to the climate
and atmospheric changes, pollution and ecotoxicity, resource depletion and
reduced habitat and bio- diversity. (Hancock and Davies, 1997)
The subject that encompasses the link between these human
endeavors and the public health is known as human ecology. This human
ecology can provide integrative, holistic and radical perspective on health
issues. (Hancock, 2000) Catalano in 1979 propounded that there is an utmost
need that the health issues must take into consideration economic and
social processes which shapes community, so as to prevent any spread of
diseases. (Hancock, 2000) The metapopulation theory gives an enduring
account of urban ecosystems and the human aspect of the study of the urban
systems can be done by the “human ecosystem model,” which deals with the social components like waterbodies of an area which are the part of the
human system and its connections to ecology. (Niemela, 1999) The Mandala
of Health is a model, which establishes the relationship between the natural
sciences and the social sciences and gives suggestion at every level of
human activity corresponding to its environment. (Hancock & Perkins, 1985)
Overall we can say that the health of the human beings is dependent
on the health of the natural ecosystems and the planet. Therefore it is
utmost necessary to keep the urban ecosystems healthy keeping in mind
both its physical and social dimensions such as health of the population with
regard to the mental well being, the social well being of the urban community
with regard to their social and cultural aspects, the quality of different
components that make the built environment, the quality of the environment
in the vicinity of the urban sphere like clean air, clean water, soil, prevention
of noise pollution and the urban ecosystem on the overall ecosystem of
planet.
Indicators of Population Health at the Community Level formulated a
model known as the Healthy Community model. (Hancock, 2000) This model
reflects on the environmental, social, economic, cultural and political factors
that lead to the health of urban populations. There are three main parts,
which make up the healthy community model. These are community,
91 | P a g e
environment and economy, which in turn possess three qualities like
livability, viability and sustainability. These qualities are related to our living
styles and we humans have to make the best use of the available resources
to maintain these qualities for our healthy lives. For e.g. Unhealthy water
causes digestive problems because it causes water pollution. This healthy
community model provides answer to the best way possible to control water
pollution. The theories and models show how we can maintain and improve
human and ecosystem health, which will require changes in the way the
urban settlements are planned, designed and worked upon. Canadian Public
Health Association Taskforce on Human and Ecosystem Health in 1992 said
in a report:
“Human development and the achievement of human potential
requires a form of economic activity that is environmentally and
socially sustainable in this and future generations.” (Hancock, 2000)
We cannot change the urban settlements but we can sort out ways by
which we can reduce the pollution, and make our environment the most
beautiful and healthy place to live in.

92 | P a g e
CONCLUSION It may be concluded from the above analysis that:
i) Urban and peri-urban ponds are the main sources of water for a large
number of people. For Kolkata, the figure is likely to be at least a million. In
my study area the figure would reach upto 4 thousands.
ii) Most of the users come from the poorer section of the society.
iii) The value generated by the ponds is quite significant, even though
option-value, existence-value etc. have not been critically considered.
iv) Since providing water to its citizens is a basic duty of the State, the
Municipal authorities/Government maintenance & keep of fresh water
bodies would be the basic responsibility of the municipal. In my study area ,
thereis enough scope of conservation & upgradation of the ponds to meet
all type of contingencies where fresh water is the basic need.
v) Sustainability from the viewpoint of human use and that from the
viewpoint of pisciculture may have some mutual incompatibility and
therefore requires an integrated approach.
vi) Periphery ponds should be conserved without reducing the size. They
should be cleaned regularly & to be maintained because they are lungs of the
area which protects the inhabitants from no of urban hazards like dust, noise
& halps in reducing the ambient temperature. Assist in maintaining the
moisture containing during hot summer.
vii) They could be the source of fresh water in the absence of fire hydrants.
They could be the source of fire hazard mitigation in dencely populated area.
93 | P a g e
Viii ) Beside this the ponds are also the source of livilyhood for the remnant
member of fishermen community that wants inhabited the area.
iX) Since there are no road side plantation in Santosh Pur & Survey Park
highway. So there is no well length barrier against dust & noise pollution.
Hence development & maintenance of greeneries around those ponds are
considerably necessary for environmental management of those areas.
xi) Simmilarly plantation along the bank of waste water canal & its
maintenance & also is considered to be very important for environmental
protection & aesthetic of those areas.
xii) There is a necessity of awareness the residents of the dwelling units
around the ponds to avoid accumulation of garbage in & around the pond.
Xiii) Unless the garbage are not removed from the ponds they will causes
bacterial or may be water pollution which will degrade the pond & its natural
environment.
The author appreciate the role of Survey Park Co-Operative society which
were aware to the issues & made a programme of environmement
awareness. The slogan should be
“COME FORWARD TO PLANT SUITABLE TREES IN THE BUILDING COMPOUND & PARTICULARLY IN STRESS
FACING ROADS INSTEAD OF BUILDING UP TO PROTECT
YOUR FUTURE GENERATION. "

94 | P a g e
SUGESSION
It is my important duties to sketch strategies to mend, the loop holes
accured from the studies on the findings of the present study from the
following strategies have been made to cope with the problems.
Tubewell water must be filtered before drinking.
Any pond water should not be used in drinking purpose.
As I am not able to done air & noise sampling, So I couldn’t comment on this purpose.
In consequences, I may hope, the problem will be wither away.
LIMITATION
The study is based on the only 1 tubewell testing whereas tubewell
water is an important source of drinking water in that area.
There is no air sampling or noise monitoring occured in that particular
area. For all those data of air & noise monitoring have been collected
from Central Pollution Control Board. Where as the data were collected
for whole Kolkata or Santoshpur. So unable to reach any conclusion in
this purpose.
Due to short time span, it has not been possible to complete the work
satisfactory.
SCOPE OF FURTHERB STUDY
Keeping in view some of the limitation of the study being outlines
above I may suggest some of the lines of approach though which future
research can be carried for more comprehensive & elaborate study on
these purpose.

95 | P a g e
Questionnaire Survey on Residential area Department of Environmental System Management PRESIDENCY UNIVERSITY Calcutta – 700 073
1. Place :
1.1. State :
1.2. District :
1.3. Block :
1.4. Police Station :
2. Household profile :
2.1. Name of the head of the household :
2.2. Father’s/ husband’s name of the head of the household : 2.3. Caste :
2.4. Annual household income from all sources :
2.5. Do you have any earning ( direct or indirect ) from neighbouring
Waterbodies? Yes/ No
2.5.1. If yes,
*How do you account ?
*What is the approximate annual value ?
2.6. Details of each member of the household :
2.7. Educational qualification
Illiterate :
Literate :
Below class x :
Madhyamik :
Higher Secondary :
Graduate :
Post graduate :
3. Land holding and land use pattern :
4. Details of benefits derived from the waterbodies:
Part B
5. What are the plants found in the waterbodies? Give local name and
quantity.
5.1. Do you observe any increasing or decreasing trend of plants ? Yes/ No
Specify.

96 | P a g e
5.2. Which birds are observed in the waterbodies?
5.3. Name the species of aquatic animals (fish, snake, toad etc.) found in this
waterbodies.
5.4. Are they naturally growing or cultivated ? Yes/ No.
5.5. Do you observe any increasing or decreasing trend of aquatic animals or
birds ?
If so, what is the reason for this variation ?
6. State the aesthetic and cultural values associated with this waterbodies.
7. Is there any change of area of waterbodies?
8. How many families are associated with this waterbodies?
9. Are you satisfied with the present state of the waterbodies? Yes/ No.
10. If ‘no’ what are the alternatives and what benefits do you expect?
11. If you are against conversion, how much are you willing to pay for
preservation of the waterbodies?
12. Aquatic Plants (Give local name and yes/no).
13. Aquatic animals (Give local name and yes/no) .
14. Aquatic animals (Give local name and yes/no).
15. Birds (Give local name and yes/no).
Part C
16. Present area of the waterbodies.
17. Loss in area compared to 15 years back and present use of that
converted waterbodies.
18. Name of the villages surrounding the waterbodies.
19. How many families directly or indirectly derive benefit from this
waterbodies?

97 | P a g e
20. Identify development programmes in and around the waterbodies.
21. Quantify and value the above mentioned benefits per year.
22. Water spread and commanding area for irrigation purposes.

98 | P a g e
REFERENCES Biswas, K. (1972): Flora of the Salt Lake, Journal De. Sci. University of
Calcutta.
Biswas S (1999): Ecology of Macrozoobenthic Community in a Sewage Fed
Wetland in East Calcutta, An unpublished Ph D dissertation. Chakravarty, S.
(1998): East Calcutta Wetlands - Its Significance, Presentation, Protection
and Development, Meenbarta.
CMDA 1976): Area Development Strategy for Salt Lake Township. Directorate
of
Planning, CMDA, Calcutta.
CMDA (1996): Environmental Improvement for Calcutta - A Sustaining
Calcutta Present Status Report of the Urban People's Environment.
Ghosh, A.K. (1990): Biological Resources of Wetlands of East Calcutta, Indian
Journal, Landscape and Ecological Studies, 13: 10-23.
Ghosh, Ashish (1997): Management of East Calcutta Wetlands and Canal
System, Dept. of Environment, Govt. of West Bengal assisted by the UK
Overseas Devt. Administration.
IWMED, (1997): A Study on the Status of the Sewage of Calcutta as Carrier of
Pollutants, Nutrients and Sediments
Chattopadhyay, Kunal and Krishna Mazumdar (2002) “Economics of Environmental Degradation – East Kolkata Wetlands”, in Kunal Chattopadhyay and Krishna Mazumdar (eds), Kolkata-- the City of Wetlands,
Dept. of Fisheries, Government of West Bengal. Pp 174
Cowardin, L.M., V. Carter, F.C Golet and E.T.LaRoe (1979), Classification of
Wetlands and Deepwater Habitats of the United States, U.S. Fish & Wildlife
Service Publication, - quoted in Wetlands by W.J.Mitsch and J.G.Gosselink,
Van Nostrand Reinhold Company, New York, 1986
Hanley, N., J.Shogren and B.White (1997), Environmental Economics,
Macmillan India Ltd., New Delhi.

99 | P a g e
Hindustan Times, 29 July 2003.
Johansson, P.O. (1987) The Economic Theory and Measurement of
Environmental Benefits, Cambridge University Press, Cambridge.
Mukherjee, Madhumita & D.K Maity, (2002) East Kolkata Wetland – Policy
Option for Sustainable Development, in Kunal Chattopadhyay and Krishna
Mazumdar (eds), Kolkata-- the City of Wetlands, Dept. of Fisheries,
Government of West Bengal, pp 2.
Published in Biodiversity and Quality of Life- p135-146 – Ed Nirmal Sengupta
and Jayanta Badyopadhyay – Macmillan, New Delhi, 2005. Presented at 8th
Biennial Scientific Conference - International Society for Ecological
Economics, Montreal, July 2004, 15
Munasinghe, M. (1993) “Environmental Economics and Sustainable
Development’ World Bank Environment Paper Number 3, World Bank,
Washington, D.C
Pearce, D.W., and R.K. Turner (1990) Economics of Natural Resources and
Environment, Harvester Wheatsheaf, New York.
EVALUATING ECONOMIC SUSTAINABILITY OF URBAN AND PERI-URBAN
WATERBODIES ---A CASE STUDY FROM KOLKATA PONDS by Mohit Kumar
Ray & Siddhartha Majumdar
Global Biodiversity assessment (1995), Ed. by V.H. Heywood, UNEP.
Global Biodiversity (1992), compiled by World Conservation Monitoring
Centre, Ed.,Brian Groombridge
Biodiversity Assessment, A Guide to Good Pratice (1995), Ed., Jermy, Long,
Sands, Stork,Winser, Department of the Environment, HMSO, London.
Nick Hanley, Jason F. Shogren and Benwhite (1997), Environmental
Economics in Theory and Practiice, Macmillan.
Wetlands and waterbirds of West Bengal (1998), Nature Environment and
Wild life society.

100 | P a g e
Kundu, N.C. (1991): Urban Development and Public Policy: A Study of East
Calcutta, Doctoral Thesis, Department of Political Science, University of
Calcutta & Westman R E (1985) Ecology, Impact Assessment and
Environment Planning, Wiley, Chicchester, U.K. Mukherjee, Madhumita
(1996): Pisciculture and Environment.
Nath, K.J. (1986): Solid Waste Management and Sanitation in Calcutta:
Challenge of The Tercentenary. In Calcutta's Urban Future, 295-301, Govt. of
West Bengal.
Panayotou T (1990): The Economics of Environmental Degradation:
Problems, Causes and Responses. Development Discussion Paper335.
Harvard Institute for International development, Cambridge, 133
Pearce, D.D. Witington and S. Georgion (1994): Economic Values and the
Environment in the Developing World, A Report to the UNEP, Nairobi.
Roy Chowdhury, D. K. (1984): Birds in and Around the Calcutta Metropolitan
Area. Naturalist Vol. I, Prakriti Samsad, Calcutta.
Sewell, R.B.S. (1934): A Study of the Fauna of Salt Lakes, Calcutta,
IndianMus. 36, 45-122.
Turner R K et al. (2000): Ecological Economic Analysis of Wetlands:
Scientific Integration for management and Policy, Ecological Economics.
Wetlands and Biodiversity EERC Working Paper Series: WB-2, Environmental
Conservation and Valuation of East Calcutta Wetlands – Kunal
Chattopadhyay Indian Statistical Institute, Kolkata.
Barrow C. J. (1999), Environmental Management – Principles and Practice,
Routledge.

101 | P a g e
ACKNOWLEDGEMENT
I gratefully & sincerely acknowledged the continuous guidance
& support o Prof. ( Dr. ) Harendra Nath Bhattacharya, Head of
the department, Prof. ( Dr. ) Saradendu Chakraborty , Course co
coordinator of Environmental System Management department,
Presidency College. Without their support it would not been
possible for me to complete the task.
I am extremely grateful to Prof. Rabindra K. Roy, Guest faculty
& guide of the project, for his continuous guidance & support in
all stage of the project.
Special gratitude is due to Dr. Swapan Saha & Dr. Gargi
Mazumdar for their guidance & support during the analytical
work
My sincerethanks & deep sense of appreciation are due to Sri
Sachindra Nath Das, Secretary of The Survey Of India Co-
Operative Society who has extended support for data collection.
I also extend ny sincere thanks to Central Pollution Control
Board, Alipur Weather Casting Office & KMC- Office for their
encouraging support in course of my data collection work.

102 | P a g e