designing web map popups - story mapsstorymaps.esri.com/downloads/designingwebmappopups.pdfdesigning...
TRANSCRIPT
Designing Web Map Pop-ups Page 1
Designing Web Map Pop-ups
Introduction
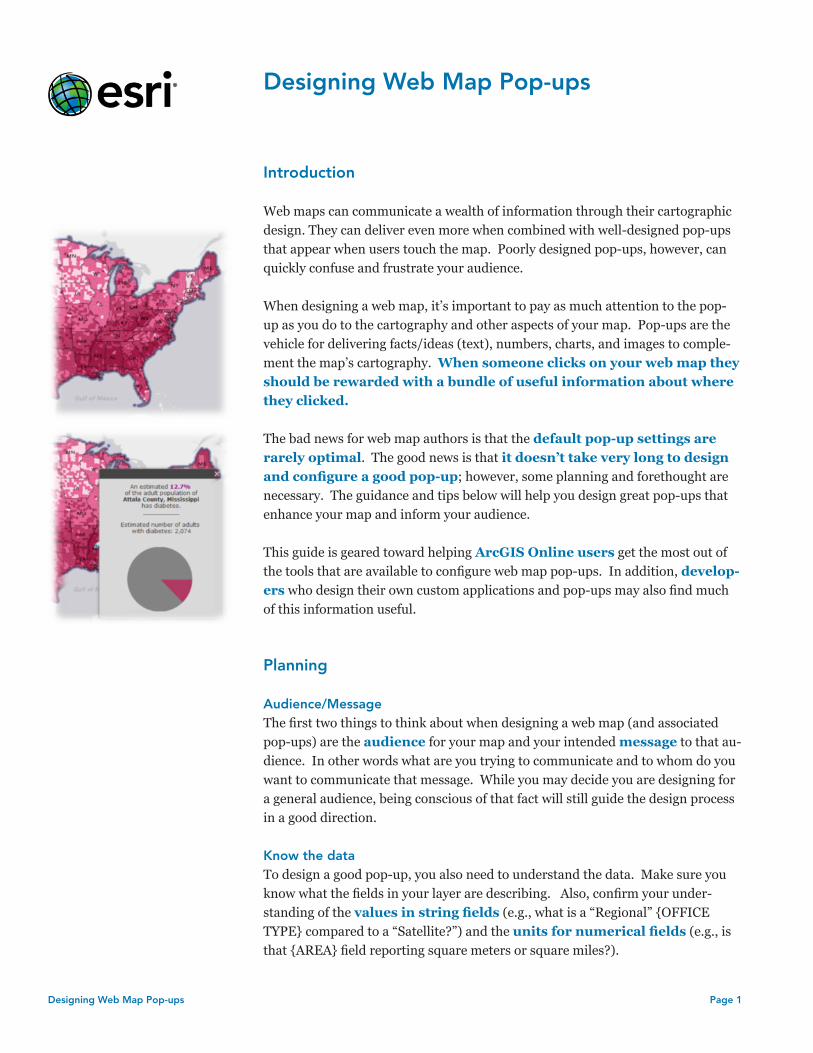
Web maps can communicate a wealth of information through their cartographic design. They can deliver even more when combined with well-designed pop-ups that appear when users touch the map. Poorly designed pop-ups, however, can quickly confuse and frustrate your audience.
When designing a web map, it’s important to pay as much attention to the pop-up as you do to the cartography and other aspects of your map. Pop-ups are the vehicle for delivering facts/ideas (text), numbers, charts, and images to comple-ment the map’s cartography. When someone clicks on your web map they should be rewarded with a bundle of useful information about where they clicked.
The bad news for web map authors is that the default pop-up settings are rarely optimal. The good news is that it doesn’t take very long to design and configure a good pop-up; however, some planning and forethought are necessary. The guidance and tips below will help you design great pop-ups that enhance your map and inform your audience.
This guide is geared toward helping ArcGIS Online users get the most out of the tools that are available to configure web map pop-ups. In addition, develop-ers who design their own custom applications and pop-ups may also find much of this information useful.
Planning
Audience/MessageThe first two things to think about when designing a web map (and associated pop-ups) are the audience for your map and your intended message to that au-dience. In other words what are you trying to communicate and to whom do you want to communicate that message. While you may decide you are designing for a general audience, being conscious of that fact will still guide the design process in a good direction.
Know the dataTo design a good pop-up, you also need to understand the data. Make sure you know what the fields in your layer are describing. Also, confirm your under-standing of the values in string fields (e.g., what is a “Regional” {OFFICE TYPE} compared to a “Satellite?”) and the units for numerical fields (e.g., is that {AREA} field reporting square meters or square miles?).

Designing Web Map Pop-ups Page 2
Design
What to IncludeWhen designing a pop-up first determine the most important piece of informa-tion for the audience to see when they click on the map. It might be a number, a name or address, a project description, or a list of items. Whatever it is, put that information at the top of the pop-up and make it obvious so that the audience’s attention is directed to it.
Also think about context. What is going to let the audience know if the place they clicked on is typical, above average, or below average? Information often needs a benchmark for comparison like a national/state average, the previous years’ results, or acceptable/normal values. For example, $5M in funding may not mean much unless you also report this represents a 100% increase from last year’s budget of $2.5M and that the national average is $2M. Consider including a ranking, percentile, or relationship to some other yardstick or baseline. When making these choices consider and respect your perception of the audience’s understanding of the issue.
Determine if any numeric information is best displayed as raw values or as a chart and if you have any images or hyperlinks to other sources on the web that can enhance your pop-up. There are tips for designing these aspects of your pop-up later in this guide.
What not to IncludeThinking about what should not be in your web map is just as important. Gener-ally, it is not advisable to include ID numbers or codes (e.g., FIDs, GlobalIDs, FIPS codes, etc.) in your pop-up – these numbers typically don’t have any mean-ing to an end user and clutter the limited space in a pop-up window.
There is rarely a good reason to include latitude and longitude (or X and Y) fields. You have already mapped the location, so the coordinate values are not needed and, like ID codes, don’t mean anything to most people.
Also, eliminate duplicate or redundant information from pop-ups. Good pop-ups are compact and simple, so repeating information in such a small space is not advisable. For example, omit from the body of your pop-up any field(s) already used in the title, and don’t show fields that report the same information such as {STATE_NAME} and {STATE_ABBREVIATION}.
Never include raw field names in a pop-up. Configure aliases to make field names readable. This includes correcting {field_names_with_underscores}, {FIELD NAMES IN ALL CAPS}, and {FieldNamesWithNoSpaces}, as well as replacing abbreviations (e.g., change “POP2010” to “2010 Population”) and using consistent capitalization. Field naming conventions for databases and spread-
POSITION IMPORTANT INFO AT TOP
INCLUDE CONTEXT
RAW VALUES OR CHART?
ELIMINATE DUPLICATE INFO

Designing Web Map Pop-ups Page 3
sheets do serve a purpose but are confusing to web map audiences. As the map author, you translate the raw view of data from the GIS world into an information product anyone can understand. Try to use as few words as possible to deliver a concise explanation of each field’s contents. Well-designed map services often al-ready have nice field aliases, which can be a tremendous help toward understand-ing the data; however, the aliases might be too wordy or not exactly right for your purposes. Do not be afraid to modify aliases for a better fit with your map.
For most audiences, use jargon and acronyms sparingly and provide clear explanations if they are used. Use plain language as much as possible. Of course, if your audience is a specific technical community or set of subject matter experts, then the opposite may apply.
Finally, do not feel the need to include every field available in the pop-up. Determine what information is required to inform your audience and support your message and leave out the rest.
See more examples in the sidebar and at the end of this document to see what works well and what mistakes to avoid.
Types of popup displayThere are three pop-up display options. Below are descriptions of the options and some advice on how to choose which is right for your map.
1. A List of Field Attributes is simply a table of attribute names and their corre-sponding values. This option is not the default because it’s the best or most infor-mative to your audience; it’s the default because it is the easiest for an automated system to generate without requiring any decisions to be made by the map author (you). This type is recommended only when your audience is geospatial profes-sionals who are comfortable with this type of display. However, for most people this is not the best format from which to digest information.
2. A Description from One Field is appropriate if there is a single field that pro-vides all the explanation needed for your pop-up. An example of this is a map of projects where you have a {PROJECT DESCRIPTION} field.
3. The Custom Attribute Display is recommended in most cases. It takes just a little extra time to configure and transforms your map into a true online informa-tion product rather than having the feel of a desktop GIS map. This is critical to ensure your map is useful for the intended audience. The remainder of this docu-ment provides guidance on designing Custom Attribute Display pop-ups.
Designing Custom Attribute Display Pop-Ups
There are many ways to design custom pop-ups, and your choices depend heav-ily on the type of information that is present in the layer to which the pop-up
USE GOOD FIELD NAME ALIASES
DON’T INCLUDE LAT/LONG FIELDS
1. LIST OF FIELD ATTRIBUTES
2. DESCRIPTION FROM ONE FIELD
3. CUSTOM ATTRIBUTE DISPLAY

Designing Web Map Pop-ups Page 4
belongs. Below are some tips that you can use in particular situations.
Text formatting: Using bold, italics, underlining, color, and ALL CAPS (and combinations like BOLD COLORED CAPS) are good tools to help guide the eyes and attention of your audience as they view your pop-up. Bullets and numbered lists are also useful for organizing information. Some pieces of information will usually be more important than others, so use formatting to make that hierarchy clear to the viewer. With many tools at your disposal, also be mindful not to overuse text formatting.
Numeric formatting: Format numerical fields with the proper usage of decimal places and 1,000s separators. If your field contains items that should be counted in whole numbers (actual population, traffic counts, crimes, etc.) set it to display “0 decimal places.” Fields that contain a year should not use the 1,000s separator (2012 – not 2,012). For currency val-ues include a dollar sign in front of the field in your custom pop-up, turn on the 1,000s separator, and show an appropriate number of decimal places (usually 0, but possibly 2).
Addresses: A common type of information to have is street addresses, or a city and state. Labeling these pieces of information is unnecessary as people will recognize they represent a location, especially if you use familiar address formatting. If you have just a city and state, put them next to each other separated by a comma and a space (e.g., “{CITY}, {STATE}”). If you want to show a full street address, format it like you usually see an address on a website or envelope; “{STREET}” on one line, then “{CITY}, {STATE} {ZIP}” on the next line.
Use fields within sentences: A good tactic in situations where you have in-formation that needs a bit of explanation is to embed fields from your layer within a sentence. For the airfare example to the left, the pop-up could dryly list the rank, percent change, and average airfare, or it could provide this same information in a few simple sentences your audience can comfort-ably read through. Be sure to include proper punctuation, spaces before and after field codes, and other characters as needed (e.g., dollar signs, per-cent signs, ampersands, etc.) when constructing your sentences. Use bold text to bring attention to the fields.
Limit use of field labels: Information is often self-describing and doesn’t need a label. People will intuitively understand that “Corporate Head-quarters” is the {OFFICE TYPE}; it doesn’t need to explicitly be labeled. Remember, fields have labels because they are coming from a database or spreadsheet where columns need names. Thinking about a pop-up as an ex-pression of information about a particular location on the map, rather than a query on a database, will help your design.
Hyperlinks: When you include web links in your pop-up, be sure not to just paste in the full URL. It’s more compact and clear to format existing text in
DON’T LABEL OBVIOUS INFORMATIONUSE FAMILIAR FORMATTING FOR ADDRESSES
EXPLAIN BY EMBEDDING FIELDS WITHIN SENTENCES

Designing Web Map Pop-ups Page 5
your pop-up as a hyperlink.Avoid:1. Data Source: National Park Service, http://www.data.gov/geodata/g894952/2. This map uses the World Topographic Map, which can be found here: http://www.arcgis.com/home/item.html?id=d5e02a0c1f2b4ec39982 3fdd3c2fdeBetter:1. Data obtained from the National Park Service.2. This map uses the World Topographic Map.
Pop-Up Media
Charts and images can be used to elevate pop-ups beyond simple text and num-bers. The tips below will help you pick the right type of chart for your informa-tion and help your images look their best.
ChartsCharts are a powerful way to represent numeric data in pop-ups.
Chart Type: Use the right type of chart for your data. There is a lot of infor-mation on the web to help you select the right type of chart, but here are a few tips:
Use column/bar charts for comparing a similar measurement across two or more categories (e.g., population counts for age groups, budgets for various agencies).Use line charts for time series data to show trends. An exception here is that bar/column charts can work for two or three fields of time series data (such as when comparing previous- and current-year budgets or populations).Pie charts are best if you have two or three fields that together add up to 100% of something (e.g., spending on transportation projects and all
other spending). Too many slices (more than five or so) or slices that are too small (<5% or so) are reasons to avoid pie charts.
Captions: Be sure to include good captions on your charts. Often this is a good place to display the units of measure and/or normalization basis for your numerical data or instructions to the viewer (e.g., that they can mouse over the chart for more information). Remember to avoid redundant information between the title, caption, field aliases, etc.
ImagesAnother way to enhance your pop-ups is to use images. Images stored on a web server (i.e., addressable by a URL) can be referenced in a pop-up.
Same or different?: You can display the same photo in all pop-ups in a layer or have a different image for each pop-up. To display different images

Designing Web Map Popups Page 6
for each location you will need a field with the URLs to each photo in a field in your layer. Common images to include are photos of the pop-up subject (building, project site, person, etc.) or an organizational logo.
Speed and size: To help the images draw faster and fill the entire space allotted, create thumbnails (200 pixels x 150 pixels) of your full-resolution images. (See this blog post for details.) Use the URL for the full-resolution photo as the optional link. Viewers can then click the thumbnail and be taken to the high-res version. The instructions to “Click to view larger photo” can be displayed in the image title or caption.
Captions: Use captions to briefly describe and/or credit photos when ap-propriate.
Power User TipsIf you want to get fancy, check out some of the power user tips below:
Using HTML and JavaScript in fields: If a field in your data source con-tains HTML and/or JavaScript, the pop-up will display the correct web con-tent described by your markup/script. You can use this trick to do things like format text that cannot be formatted using the current pop-up configu-ration options (e.g., in the Title field), add images to the Title or Body of your pop-up, or other fun things like display live traffic camera feeds. Just include the HTML/JavaScript in a field of your data source then add that field to your pop-up in the appropriate place. The example snippets below show what you’d need to put in a field to: 1) make a pop-up title appear in italics, and 2) embed a traffic camera feed that refreshes every 2 seconds (see the live traffic camera web map example).
1. <i> My pop-up text in italics</i>2. <img src=”http://cmhimg01.dot.state.oh.us/images/CMH/CMH064.jpg” height=200 width=200 id=”reloader” onload=”setTimeout(‘document.getElementById(\’reloader\’).src=\’http://cmhimg01.dot.state.oh.us/images/CMH/CMH064.jpg?\’+new Date().getMilliseconds()’, 2000)” />
Inconsistent/missing information: A common problem with fields that have inconsistent or missing information for some locations is that custom pop-ups look broken when those pieces of information are missing. Here are a few methods for dealing with this:
If the type of information available varies in a consistent way (i.e., all features in a feature type have the same information), consider splitting your data into different layers based on the differences. That way a dif-ferent pop-up configuration can be authored for each situation.Text that you might normally link together with a comma and space (e.g., {CITY}, {STATE}) can be placed on different lines of a custom attribute display to avoid looking broken when one is missing. If one of the fields is empty, it will be less noticeable. If the second field is always the missing one (e.g., the state in the above example), then you can put

Designing Web Map Pop-ups Page 7
them on the same line but leave out the comma and, again, the missing information will be less noticeable.If you have a different hyperlink for each feature that you want to include in your pop-up, but you still want to use a custom attribute display, consider embedding a generic image that then becomes the hyperlink (i.e., a logo for an organization or program).
Conclusion
Web maps enable anyone to create compelling maps and represent a new pub-lishing paradigm for geospatial professionals. Working in this new environment is not the same as producing a printed wall map – although many of the same map design principles are at work, they often must be applied in different ways to achieve good results. The main concept to keep in mind is to “remember your au-dience” and to think about your web map from their point of view. When design-ing your web map, ask yourself questions like: What message do I want people to take away from my map? Will my audience understand this abbreviation? Is any of this information extraneous? What needs more explanation? Can I use a chart to better represent my data? The answers to these questions will help you design a better map and better pop-ups. For more information about designing web maps, refer to the ArcGIS Online blog and in particular the posts that pertain to pop-ups.
Examples
Below are some examples of good pop-up design:

Page 8Designing Web Map Pop-ups
7/10/12