designing a re insurance program
TRANSCRIPT
8/2/2019 Designing a Re Insurance Program
http://slidepdf.com/reader/full/designing-a-re-insurance-program 1/30
Use of a DFA Model to EvaluateReinsurance Programs
Case Study
Presented by:Robert F. Conger, FCASTillinghast – Towers Perrin
1999 CAS Seminar on Financial Risk ManagementApril 12-13, 1999Denver, Colorado

8/2/2019 Designing a Re Insurance Program
http://slidepdf.com/reader/full/designing-a-re-insurance-program 2/30
2
Discussion Outline
The Challenge: How Much Reinsurance to Buy, and What Mix?
Conceptual Framework
Methodological Approach
Case Study: XYZ Insurance
Key Issues

8/2/2019 Designing a Re Insurance Program
http://slidepdf.com/reader/full/designing-a-re-insurance-program 3/30
The Challenge: How Much Reinsurance to Buy,and What Mix?
8/2/2019 Designing a Re Insurance Program
http://slidepdf.com/reader/full/designing-a-re-insurance-program 4/30
4
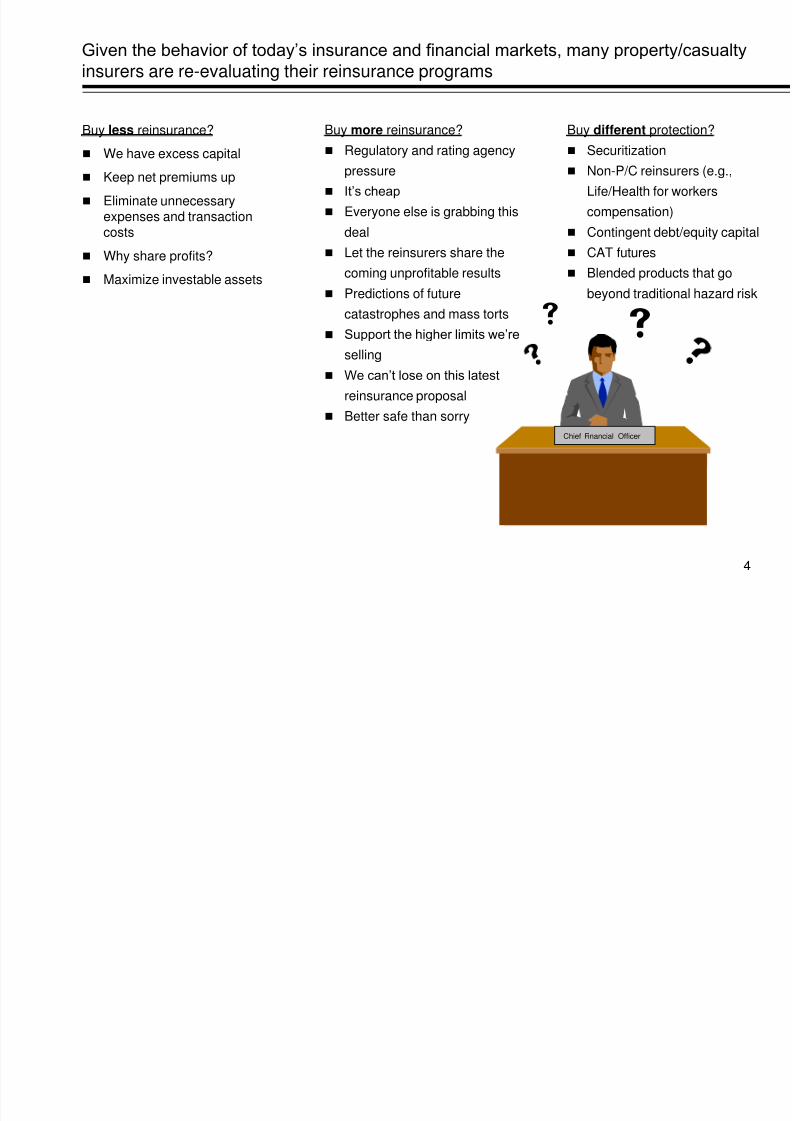
Given the behavior of today’s insurance and financial markets, many property/casualty
insurers are re-evaluating their reinsurance programs
Buy less reinsurance?
We have excess capital
Keep net premiums up
Eliminate unnecessaryexpenses and transactioncosts
Why share profits?
Maximize investable assets
Buy more reinsurance?
Regulatory and rating agency
pressure
It’s cheap
Everyone else is grabbing this
deal
Let the reinsurers share the
coming unprofitable results Predictions of future
catastrophes and mass torts
Support the higher limits we’re
selling
We can’t lose on this latest
reinsurance proposal
Better safe than sorry
Buy different protection?
Securitization
Non-P/C reinsurers (e.g.,
Life/Health for workers
compensation)
Contingent debt/equity capital
CAT futures
Blended products that gobeyond traditional hazard risk
Chief Financial Officer
8/2/2019 Designing a Re Insurance Program
http://slidepdf.com/reader/full/designing-a-re-insurance-program 5/30
5
The design of a reinsurance program involves complex issues, and is material to mostinsurers’ bottom lines
Despite favorable market conditions, reinsurance is still a significant cost item for
many insurers
Reinsurance decisions are becoming more challenging
Benefits have always been difficult to evaluate in relation to costs
How does reduction in underwriting volatility affect capital and returnrequirements?
Decisions are often made at the program level, but need to be placed in overallenterprise context
Need to avoid inefficient reinsurance activity
Proliferation of reinsurance products expands alternatives to consider
Alternatives to reinsurance products are becoming available, but add further tocomplexity of analysis
Securitization of risk Contingent debt/equity capital
Reinsurance price volatility creates short-term tactical opportunities that can bemore effectively played against a long-term strategy baseline

8/2/2019 Designing a Re Insurance Program
http://slidepdf.com/reader/full/designing-a-re-insurance-program 6/30
6
Case Study: Reinsurance Strategy for XYZ Insurance
Large multi-line company, organized into business units
Reinsurance purchasing occurs at corporate and business unit level
Corporate buys major treaties covering enterprise
Business units buy additional coverage to protect their results
Study focuses on three questions:
Which elements of the reinsurance program add value over the long term?
Which elements are good tactical buys today, due to market conditions?
How can the program be restructured to create more value?

8/2/2019 Designing a Re Insurance Program
http://slidepdf.com/reader/full/designing-a-re-insurance-program 7/30
Conceptual Framework
8/2/2019 Designing a Re Insurance Program
http://slidepdf.com/reader/full/designing-a-re-insurance-program 8/30
8
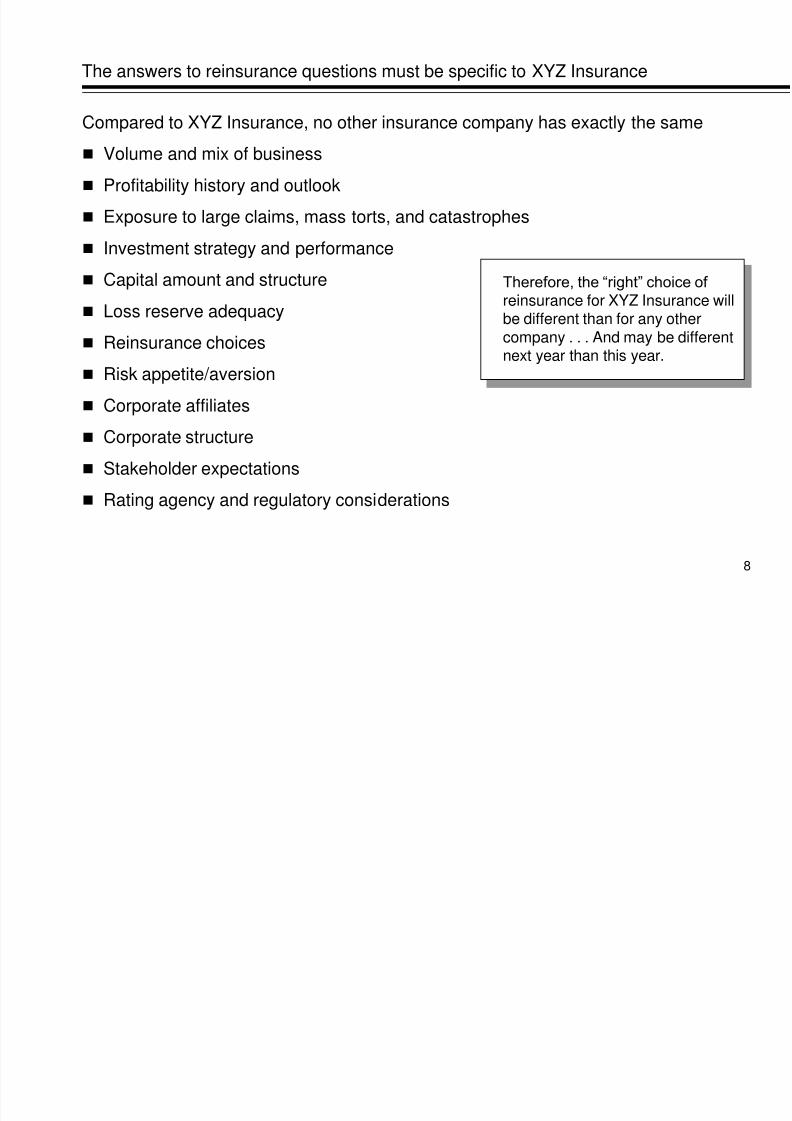
The answers to reinsurance questions must be specific to XYZ Insurance
Compared to XYZ Insurance, no other insurance company has exactly the same
Volume and mix of business
Profitability history and outlook
Exposure to large claims, mass torts, and catastrophes
Investment strategy and performance
Capital amount and structure
Loss reserve adequacy
Reinsurance choices
Risk appetite/aversion
Corporate affiliates
Corporate structure
Stakeholder expectations
Rating agency and regulatory considerations
Therefore, the “right” choice of reinsurance for XYZ Insurance willbe different than for any othercompany . . . And may be differentnext year than this year.
8/2/2019 Designing a Re Insurance Program
http://slidepdf.com/reader/full/designing-a-re-insurance-program 9/30
9
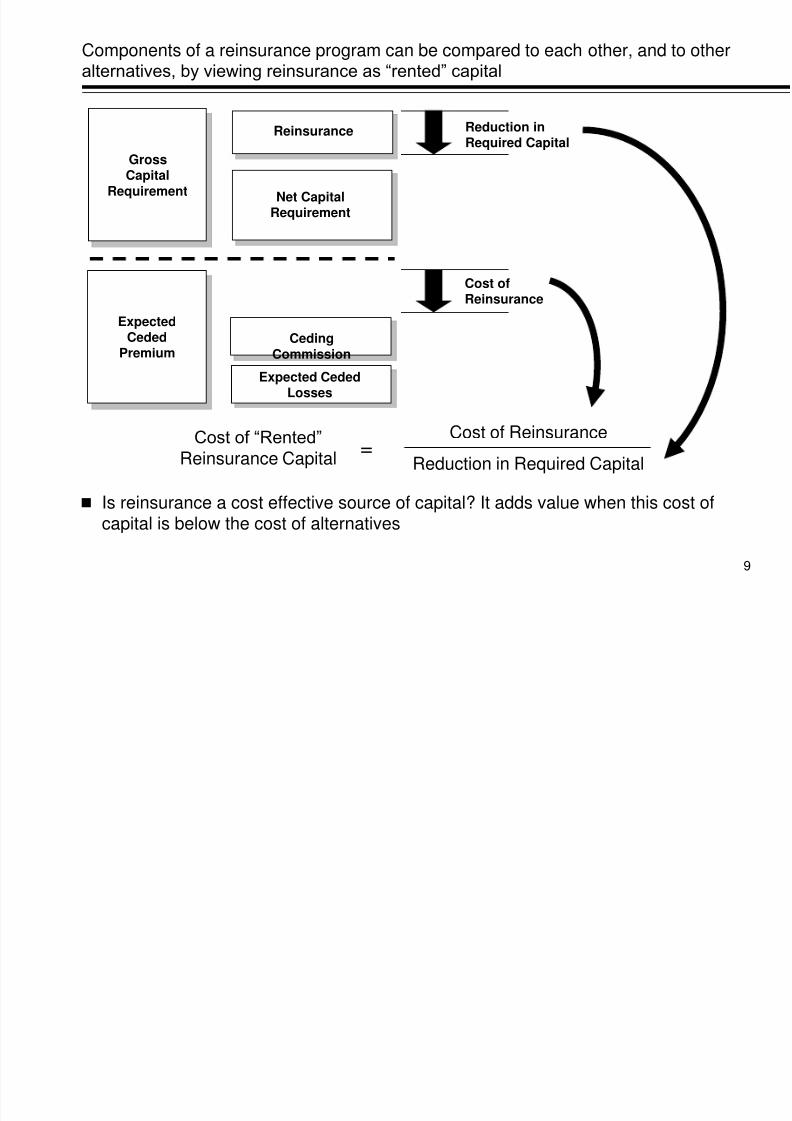
Components of a reinsurance program can be compared to each other, and to otheralternatives, by viewing reinsurance as “rented” capital
Is reinsurance a cost effective source of capital? It adds value when this cost ofcapital is below the cost of alternatives
GrossCapital
Requirement
Cost of “Rented”
Reinsurance Capital=
Cost of Reinsurance
Reduction in Required Capital
Reinsurance
Net CapitalRequirement
Reduction in
Required Capital
ExpectedCeded
PremiumCeding
Commission
Expected CededLosses
Cost ofReinsurance
8/2/2019 Designing a Re Insurance Program
http://slidepdf.com/reader/full/designing-a-re-insurance-program 10/30
10
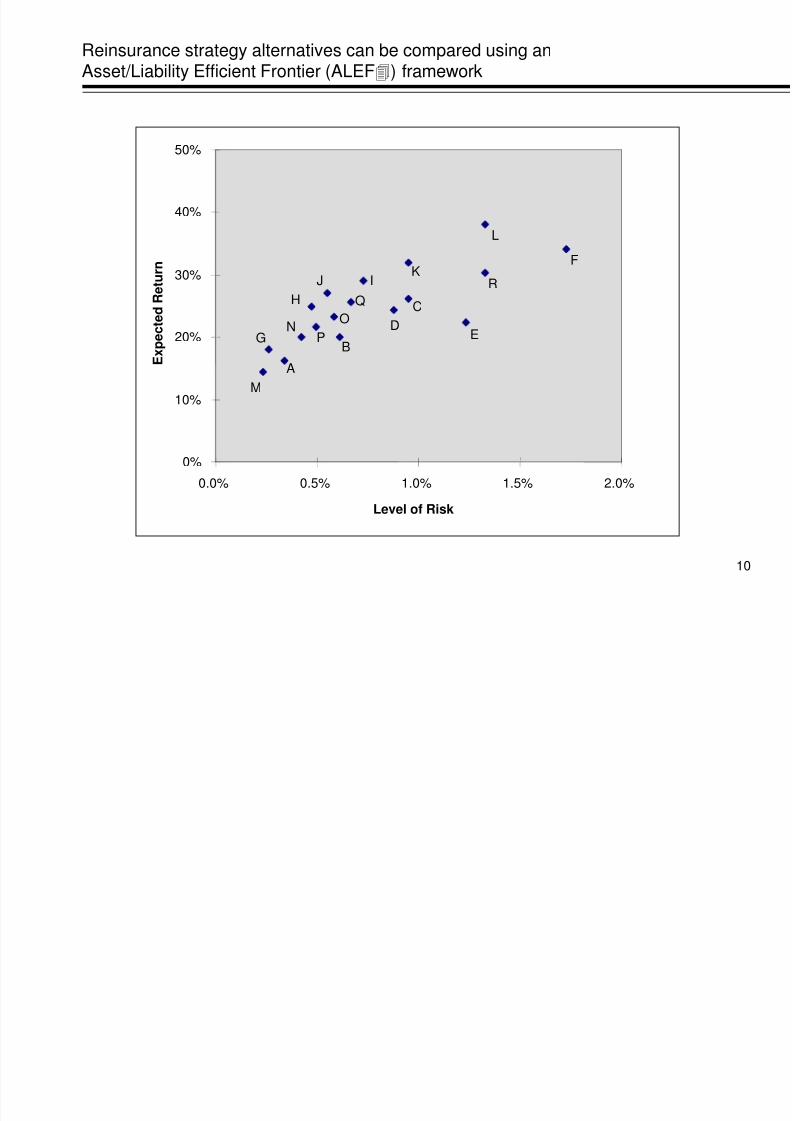
Reinsurance strategy alternatives can be compared using anAsset/Liability Efficient Frontier (ALEF) framework
0%
10%
20%
30%
40%
50%
0.0% 0.5% 1.0% 1.5% 2.0%
Level of Risk
E x p e c t e d
R e t u
r n
M
N
A
G
H
J
O
B
Q
I
D
C
K
E
L
F
R
P
8/2/2019 Designing a Re Insurance Program
http://slidepdf.com/reader/full/designing-a-re-insurance-program 11/30
11
Either conceptual framework begs several questions
How to quantify an insurer’s projected financial results and the potential for
variability in these future results?
Gross of reinsurance
Net of reinsurance(for each alternative reinsurance program)
How to measure the Cost of a Reinsurance program and its effect on an insurer’s
Expected Returns?
How to translate “the potential for variability” in future results into a usable and
meaningful measure of Risk?
What is an insurer’s Required Capital?
With no reinsurance
With current reinsurance
With alternative reinsurance portfolios

8/2/2019 Designing a Re Insurance Program
http://slidepdf.com/reader/full/designing-a-re-insurance-program 12/30
Methodological Approach
8/2/2019 Designing a Re Insurance Program
http://slidepdf.com/reader/full/designing-a-re-insurance-program 13/30
13
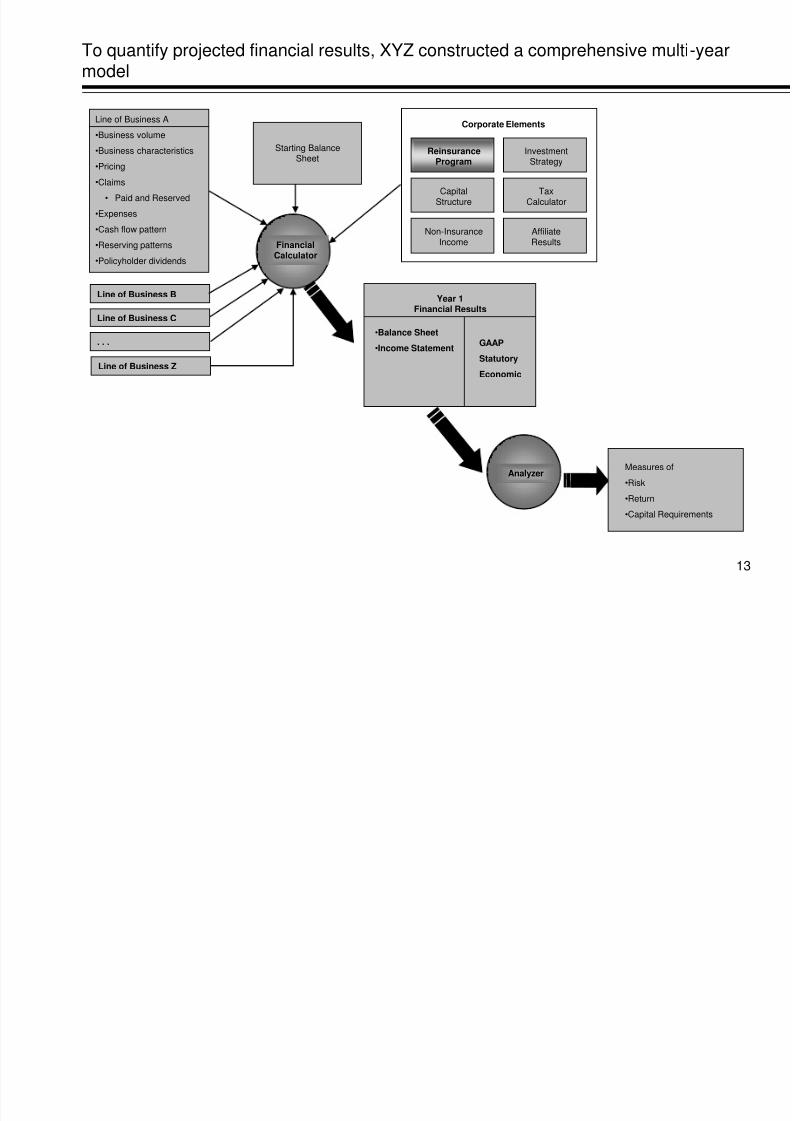
To quantify projected financial results, XYZ constructed a comprehensive multi-yearmodel
Line of Business A
•Business volume•Business characteristics
•Pricing
•Claims
• Paid and Reserved
•Expenses
•Cash flow pattern
•Reserving patterns
•Policyholder dividends
Line of Business B
Line of Business C
. . .
Line of Business Z
Starting BalanceSheet
FinancialCalculator
•Balance Sheet
•Income StatementGAAP
Statutory
Economic
Year 1Financial Results
Measures of
•Risk
•Return
•Capital Requirements
Analyzer
ReinsuranceProgram
InvestmentStrategy
CapitalStructure
TaxCalculator
Non-InsuranceIncome
AffiliateResults
Corporate Elements
8/2/2019 Designing a Re Insurance Program
http://slidepdf.com/reader/full/designing-a-re-insurance-program 14/30
14
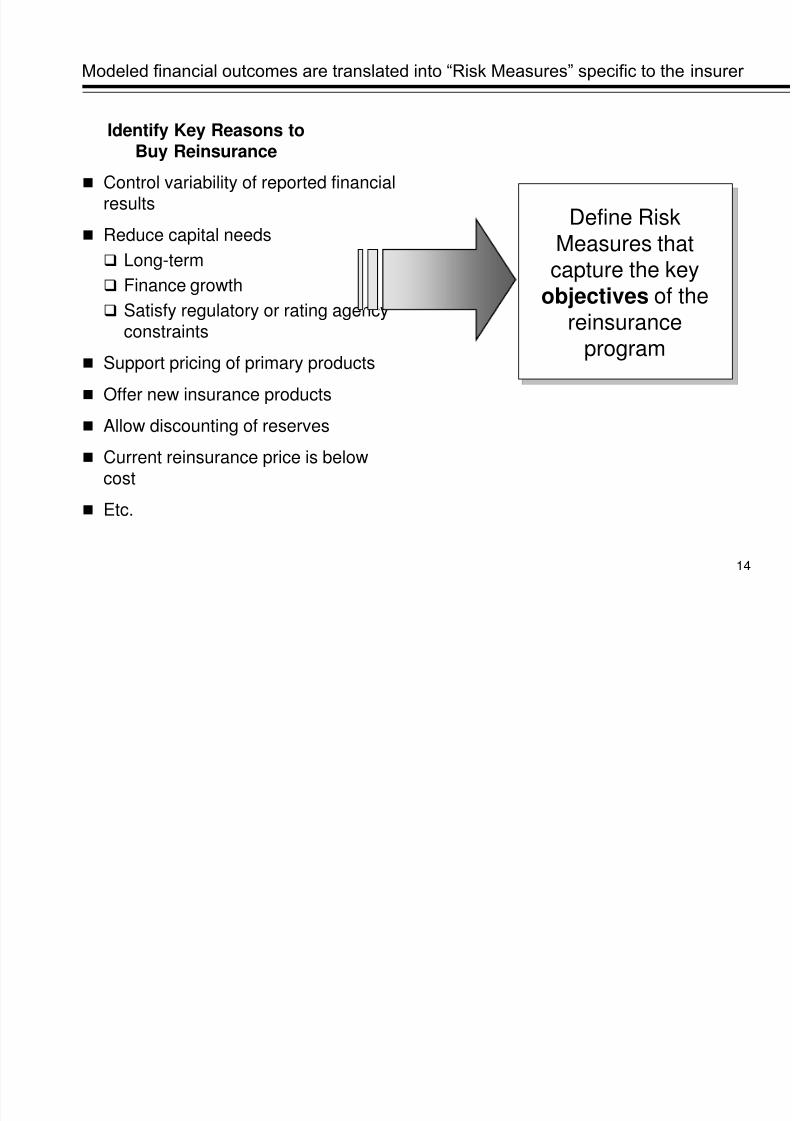
Modeled financial outcomes are translated into “Risk Measures” specific to the insurer
Control variability of reported financialresults
Reduce capital needs
Long-term
Finance growth
Satisfy regulatory or rating agencyconstraints
Support pricing of primary products
Offer new insurance products
Allow discounting of reserves
Current reinsurance price is belowcost
Etc.
Identify Key Reasons toBuy Reinsurance
Define RiskMeasures that
capture the keyobjectives of thereinsurance
program
8/2/2019 Designing a Re Insurance Program
http://slidepdf.com/reader/full/designing-a-re-insurance-program 15/30
15
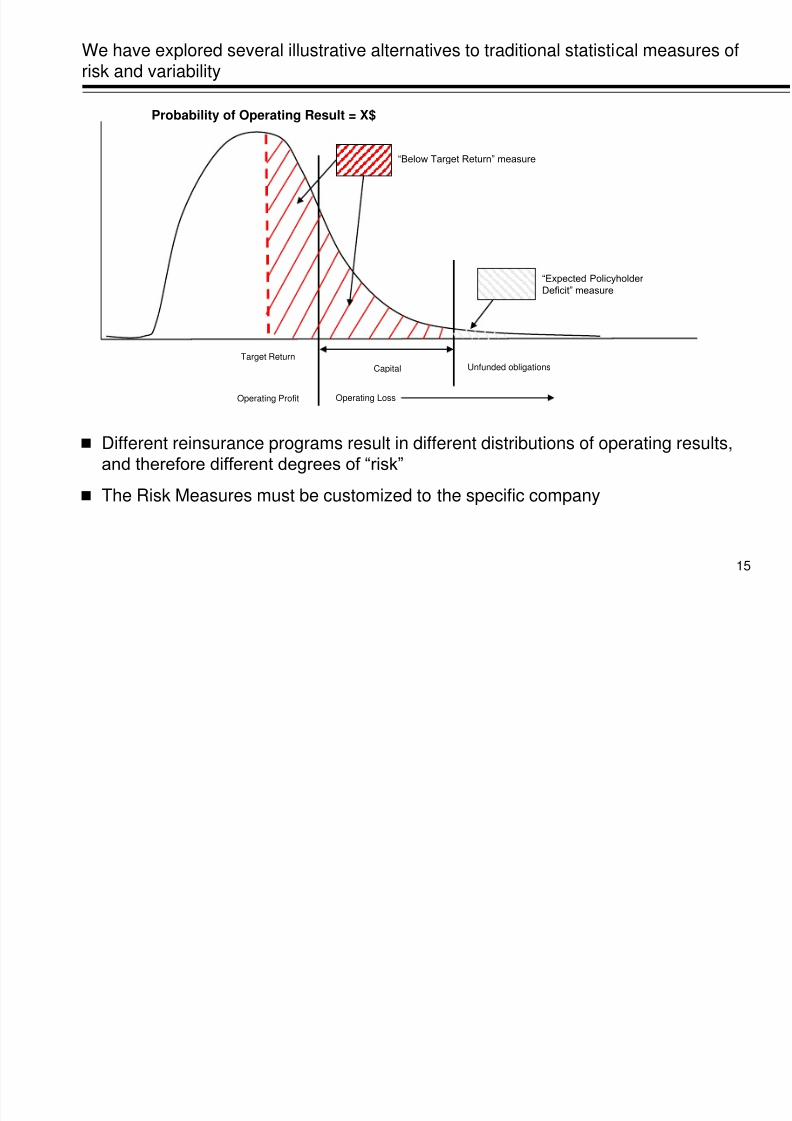
We have explored several illustrative alternatives to traditional statistical measures ofrisk and variability
Different reinsurance programs result in different distributions of operating results,and therefore different degrees of “risk”
The Risk Measures must be customized to the specific company
Target Return
Capital
Operating Profit Operating Loss
Unfunded obligations
“Below Target Return” measure
“Expected Policyholder Deficit” measure
Probability of Operating Result = X$

8/2/2019 Designing a Re Insurance Program
http://slidepdf.com/reader/full/designing-a-re-insurance-program 16/30
16
The advantage of Below Target Risk over standard deviation can be illustrated byan example
These two return probability
distributions have the sameexpected return of 13%, and thesame standard deviation
Using a target return of 3%(roughly equivalent to a zeroreal return), the top distributionhas a BTR of 17.6%; the bottom
distribution has a BTR of 27.7%
The top return distribution ispreferable: more upside andless downside
13%
P r o b a b i l i t y
Rate of Return
P
r a b a b i l i t y
8/2/2019 Designing a Re Insurance Program
http://slidepdf.com/reader/full/designing-a-re-insurance-program 17/30
17
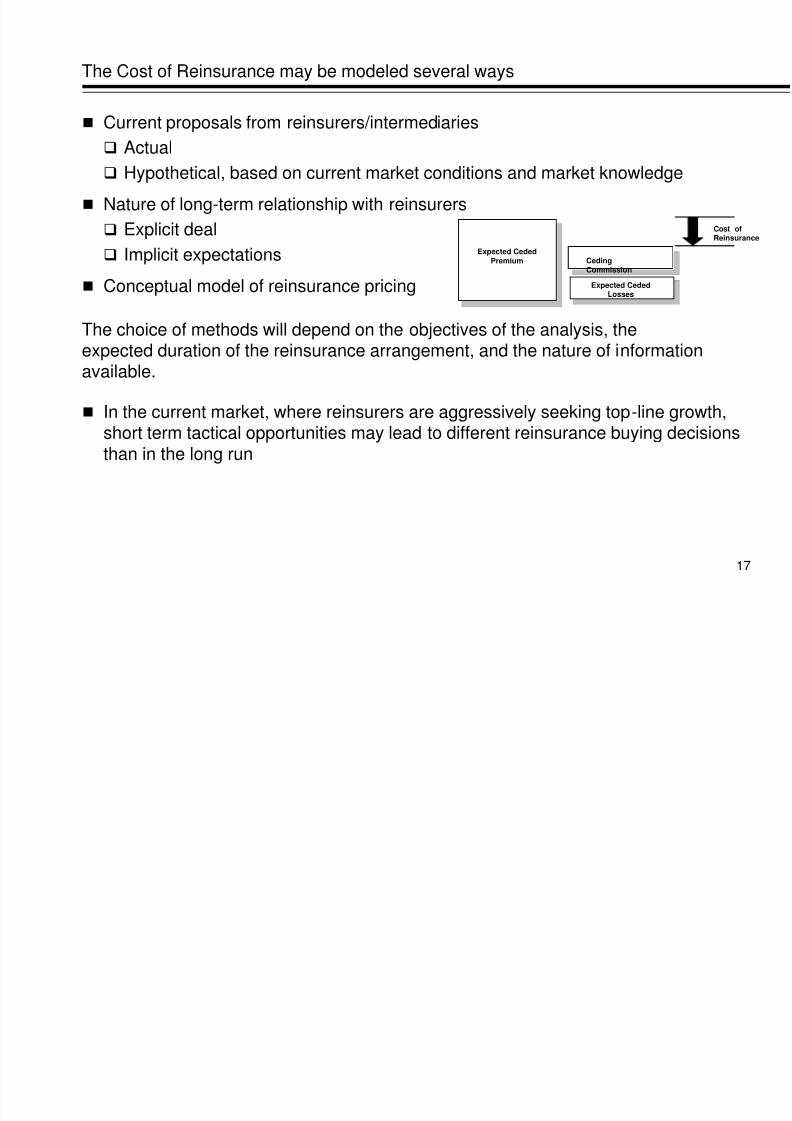
The Cost of Reinsurance may be modeled several ways
Current proposals from reinsurers/intermediaries
Actual
Hypothetical, based on current market conditions and market knowledge
Nature of long-term relationship with reinsurers
Explicit deal
Implicit expectations
Conceptual model of reinsurance pricing
In the current market, where reinsurers are aggressively seeking top-line growth,short term tactical opportunities may lead to different reinsurance buying decisionsthan in the long run
The choice of methods will depend on the objectives of the analysis, theexpected duration of the reinsurance arrangement, and the nature of informationavailable.
Ceding CommissionExpected Ceded
Premium
Expected CededLosses
Cost ofReinsurance
CedingCommission
8/2/2019 Designing a Re Insurance Program
http://slidepdf.com/reader/full/designing-a-re-insurance-program 18/30
18
The definition of “Required Capital” likewise will vary depending on company
perspective
Illustrative definitions of required capital with current reinsurance program
Current capital
Estimated capital at threshold of specified A.M. Best rating
Multiple of RBC
Capital that keeps Expected Policyholder Deficit < x%
With alternative reinsurance programs, we can
Model the different amount of Required Capital that would produce the samelevel of risk, or
Determine the change in level of risk, given the same amount of capital
8/2/2019 Designing a Re Insurance Program
http://slidepdf.com/reader/full/designing-a-re-insurance-program 19/30
19
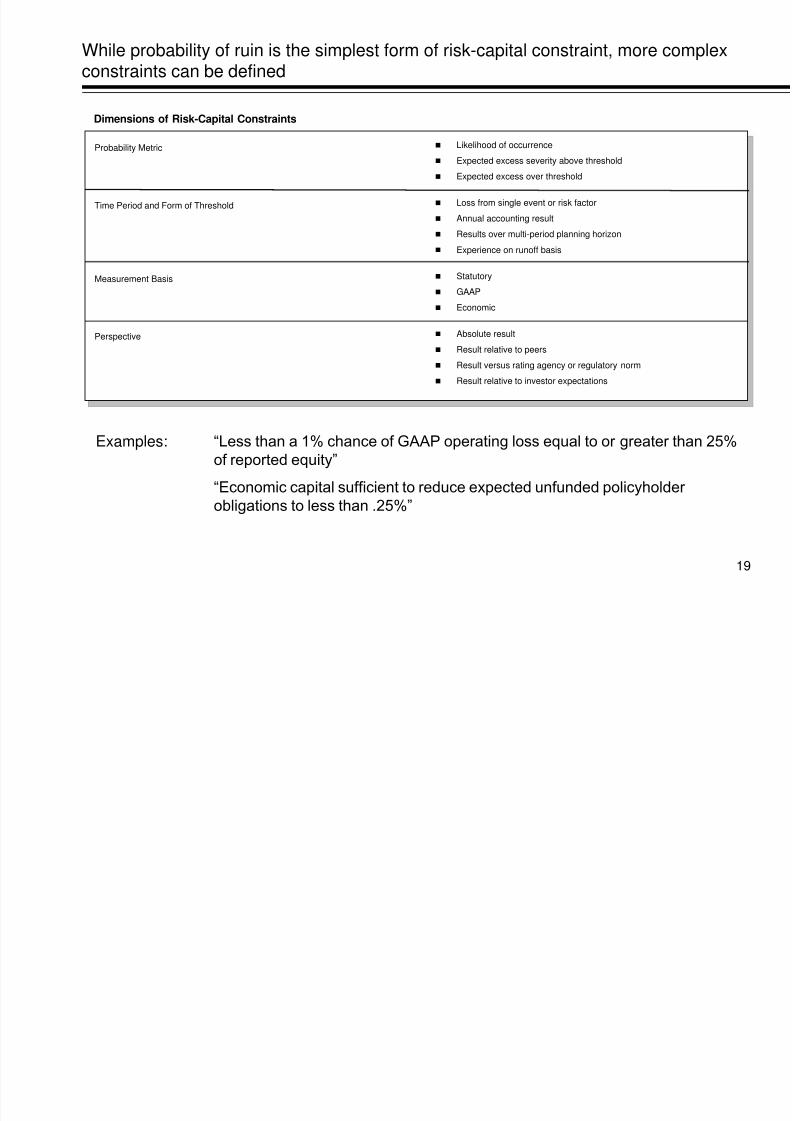
While probability of ruin is the simplest form of risk-capital constraint, more complexconstraints can be defined
Probability Metric
Time Period and Form of Threshold
Measurement Basis
Perspective
Likelihood of occurrence
Expected excess severity above threshold
Expected excess over threshold
Loss from single event or risk factor
Annual accounting result
Results over multi-period planning horizon
Experience on runoff basis
Statutory GAAP
Economic
Absolute result
Result relative to peers
Result versus rating agency or regulatory norm
Result relative to investor expectations
Dimensions of Risk-Capital Constraints
Examples: “Less than a 1% chance of GAAP operating loss equal to or greater than 25%
of reported equity”
“Economic capital sufficient to reduce expected unfunded policyholder
obligations to less than .25%”
8/2/2019 Designing a Re Insurance Program
http://slidepdf.com/reader/full/designing-a-re-insurance-program 20/30
Case Study: XYZ Insurance

8/2/2019 Designing a Re Insurance Program
http://slidepdf.com/reader/full/designing-a-re-insurance-program 21/30
21
As a first step, XYZ identified the highest cost components of the reinsurance program
Top 15 Programs by Normative Net Annual Cost
0 2 4 6 8 10 12 14 16
Casualty Clash
Special Property QS
Prof Liab XS
Aviation XS
Marine XS
Casualty High XS
Surety QS
Std Property Risk XS
Umbrella QS
Property High Cat
Work Comp Working XS
E&O Program XS
Special Property Fac
Property First Cat
Casualty Working XS
Millions $
8/2/2019 Designing a Re Insurance Program
http://slidepdf.com/reader/full/designing-a-re-insurance-program 22/30
22
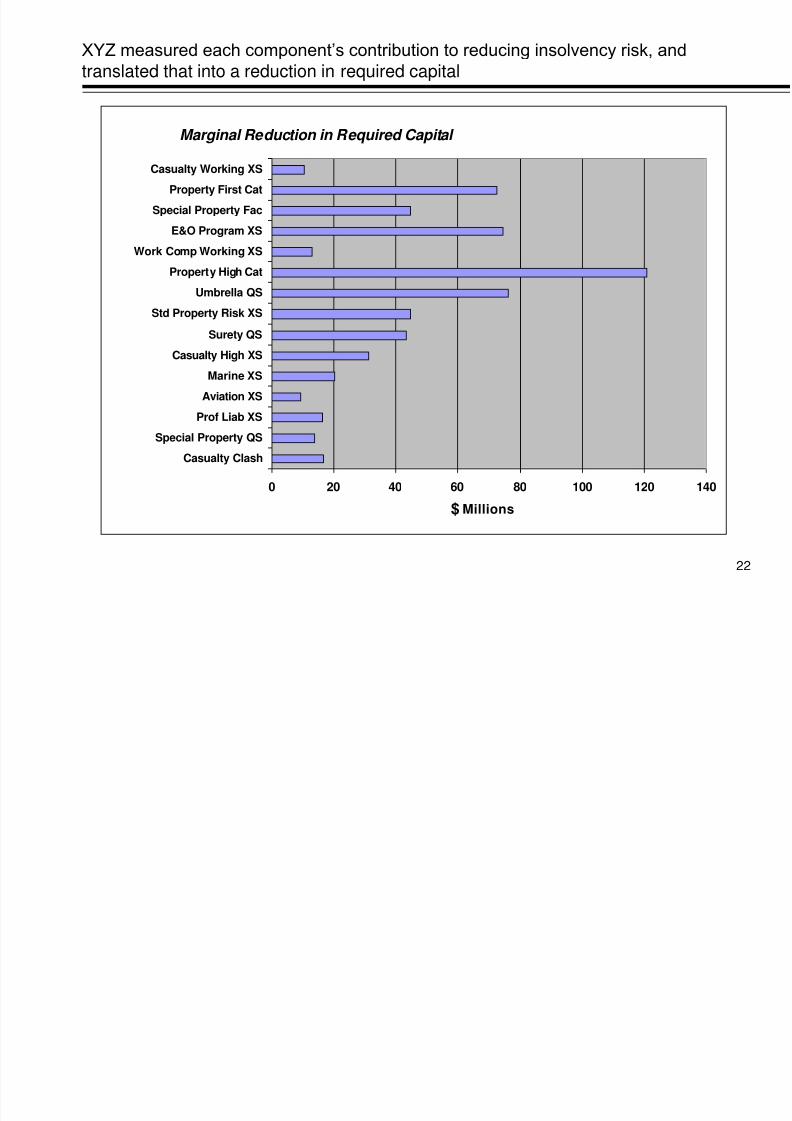
XYZ measured each component’s contribution to reducing insolvency risk, and
translated that into a reduction in required capital
Marginal Reduction in Required Capital
0 20 40 60 80 100 120 140
Casualty Clash
Special Property QS
Prof Liab XS
Aviation XS
Marine XS
Casualty High XS
Surety QS
Std Property Risk XS
Umbrella QS
Property High Cat
Work Comp Working XS
E&O Program XS
Special Property Fac
Property First Cat
Casualty Working XS
Millions$
8/2/2019 Designing a Re Insurance Program
http://slidepdf.com/reader/full/designing-a-re-insurance-program 23/30
23
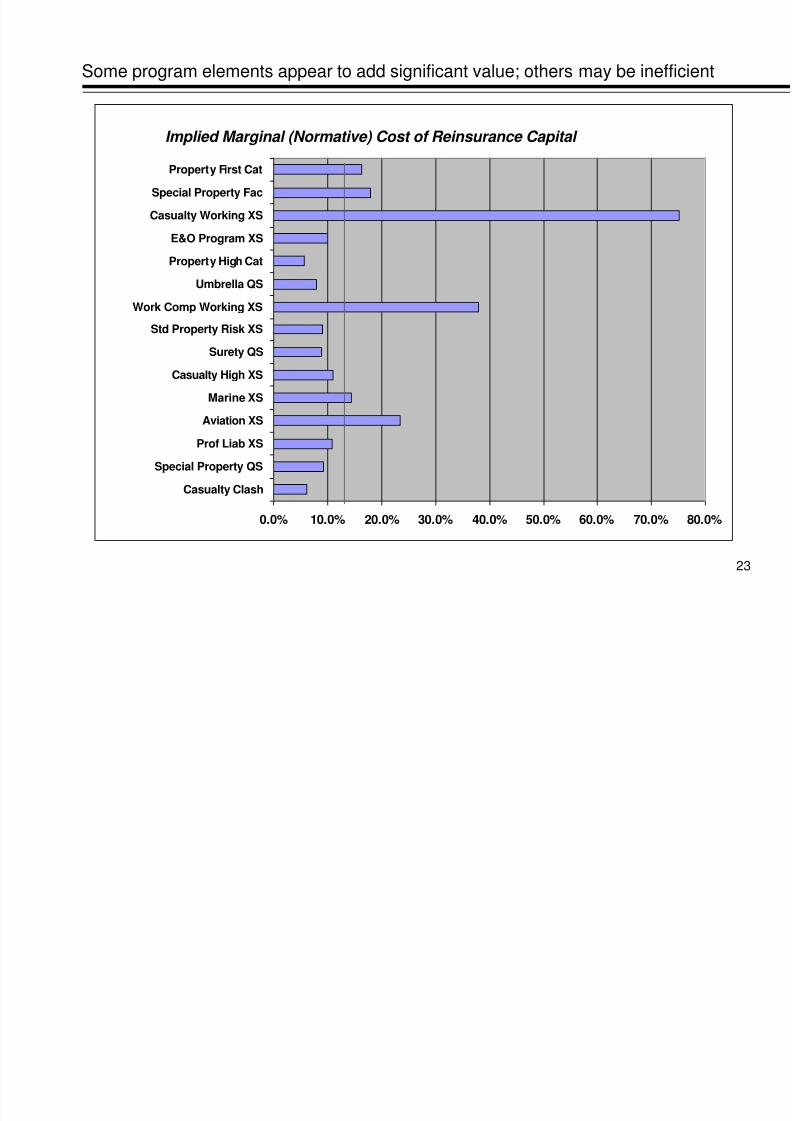
Some program elements appear to add significant value; others may be inefficient
Implied Marginal (Normative) Cost of Reinsurance Capital
0.0% 10.0% 20.0% 30.0% 40.0% 50.0% 60.0% 70.0% 80.0%
Casualty Clash
Special Property QS
Prof Liab XS
Aviation XS
Marine XS
Casualty High XS
Surety QS
Std Property Risk XS
Work Comp Working XS
Umbrella QS
Property High Cat
E&O Program XS
Casualty Working XS
Special Property Fac
Property First Cat
8/2/2019 Designing a Re Insurance Program
http://slidepdf.com/reader/full/designing-a-re-insurance-program 24/30
24
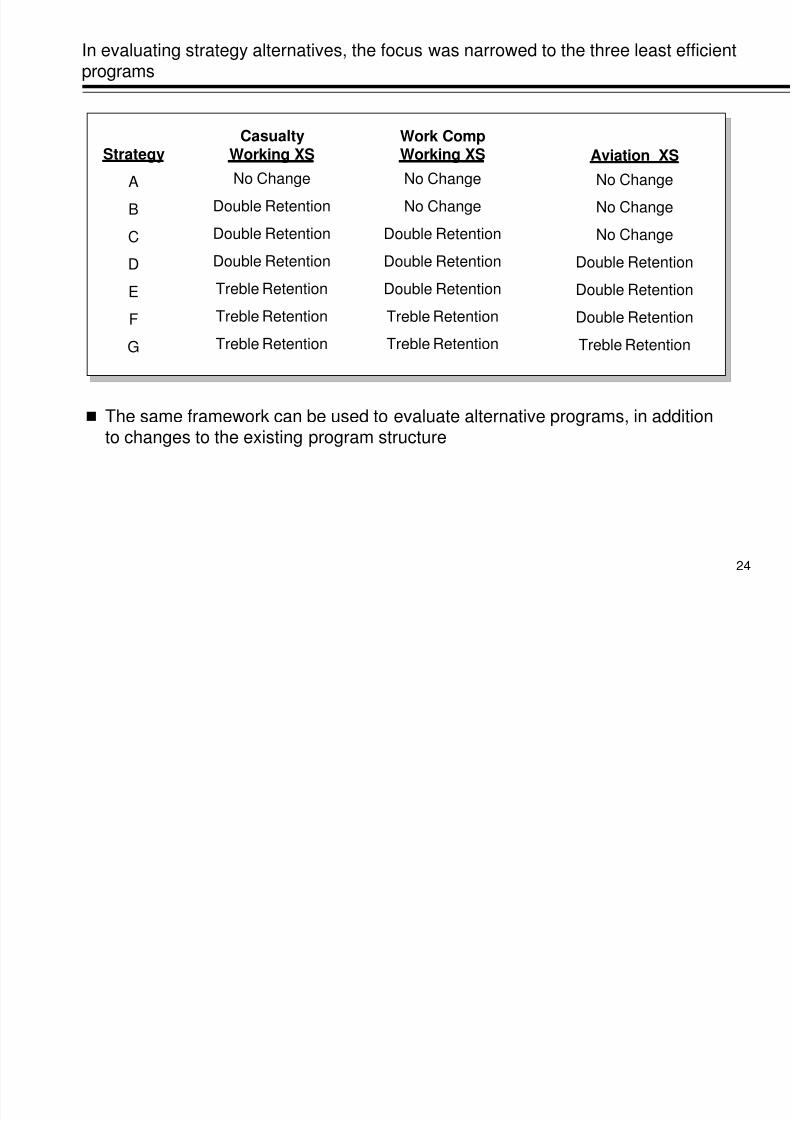
In evaluating strategy alternatives, the focus was narrowed to the three least efficientprograms
Strategy
A
B
C
D
E
F
G
CasualtyWorking XS
No Change
Double Retention
Double Retention
Double Retention
Treble Retention
Treble Retention
Treble Retention
Work CompWorking XS
No Change
No Change
Double Retention
Double Retention
Double Retention
Treble Retention
Treble Retention
Aviation XS
No Change
No Change
No Change
Double Retention
Double Retention
Double Retention
Treble Retention
The same framework can be used to evaluate alternative programs, in additionto changes to the existing program structure

8/2/2019 Designing a Re Insurance Program
http://slidepdf.com/reader/full/designing-a-re-insurance-program 25/30
25
Each strategy was evaluated in terms of its impact on risk and return
10%
11%
12%
0.9% 1.0% 1.1%
Below Target Risk
E x p e c t e d
R e t u r n
A
B
D
C
E F G

8/2/2019 Designing a Re Insurance Program
http://slidepdf.com/reader/full/designing-a-re-insurance-program 26/30
Key Issues
8/2/2019 Designing a Re Insurance Program
http://slidepdf.com/reader/full/designing-a-re-insurance-program 27/30
27
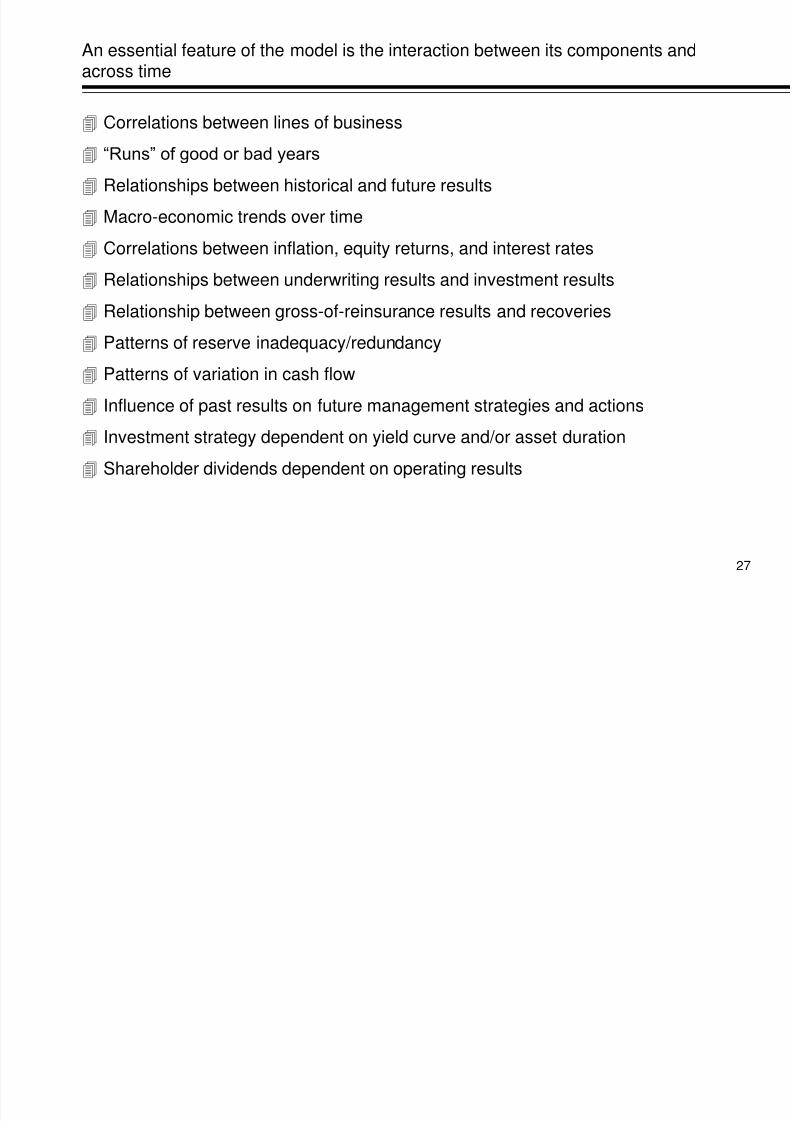
An essential feature of the model is the interaction between its components andacross time
Correlations between lines of business
“Runs” of good or bad years
Relationships between historical and future results
Macro-economic trends over time
Correlations between inflation, equity returns, and interest rates
Relationships between underwriting results and investment results
Relationship between gross-of-reinsurance results and recoveries
Patterns of reserve inadequacy/redundancy
Patterns of variation in cash flow
Influence of past results on future management strategies and actions
Investment strategy dependent on yield curve and/or asset duration
Shareholder dividends dependent on operating results
8/2/2019 Designing a Re Insurance Program
http://slidepdf.com/reader/full/designing-a-re-insurance-program 28/30
28
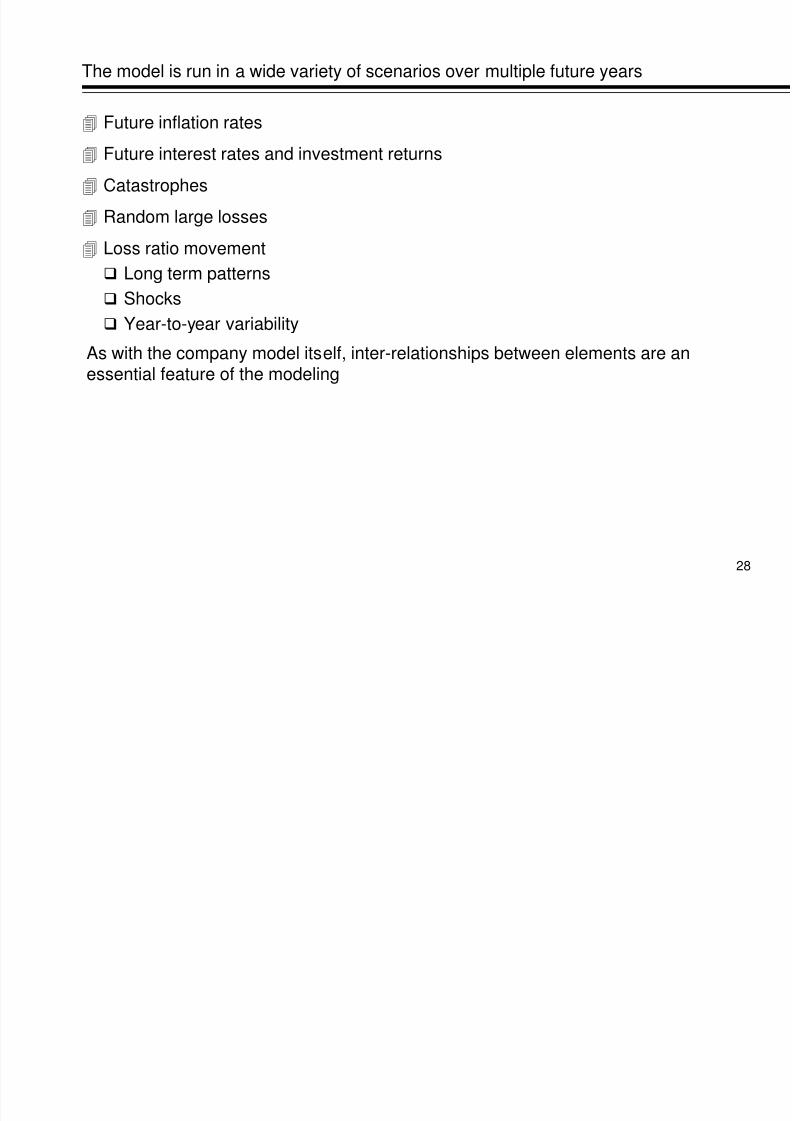
The model is run in a wide variety of scenarios over multiple future years
Future inflation rates
Future interest rates and investment returns
Catastrophes
Random large losses
Loss ratio movement
Long term patterns Shocks
Year-to-year variability
As with the company model itself, inter-relationships between elements are anessential feature of the modeling
8/2/2019 Designing a Re Insurance Program
http://slidepdf.com/reader/full/designing-a-re-insurance-program 29/30
29
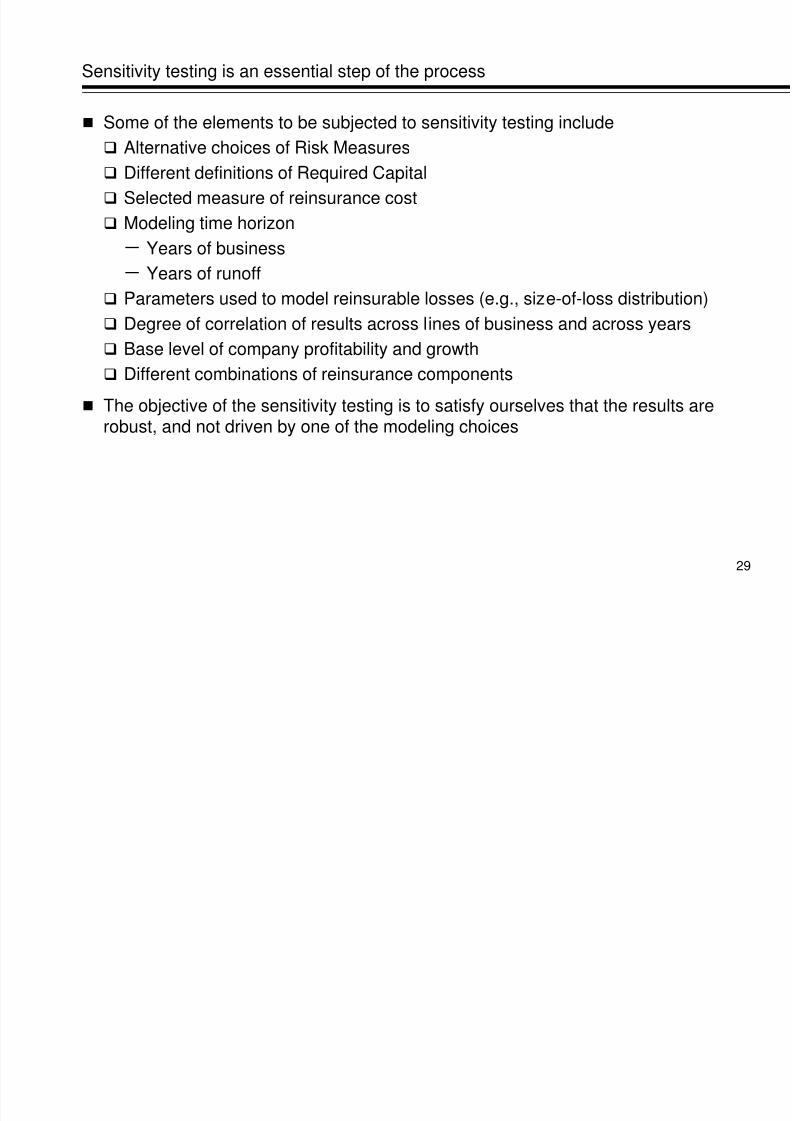
Sensitivity testing is an essential step of the process
Some of the elements to be subjected to sensitivity testing include
Alternative choices of Risk Measures
Different definitions of Required Capital
Selected measure of reinsurance cost
Modeling time horizon
Years of business
Years of runoff Parameters used to model reinsurable losses (e.g., size-of-loss distribution)
Degree of correlation of results across lines of business and across years
Base level of company profitability and growth
Different combinations of reinsurance components
The objective of the sensitivity testing is to satisfy ourselves that the results arerobust, and not driven by one of the modeling choices
8/2/2019 Designing a Re Insurance Program
http://slidepdf.com/reader/full/designing-a-re-insurance-program 30/30
30
Of course, modeling does not replace management judgment
Modeling results will depend on key management perspectives, such as the choice
of Risk Measure
The final trade-off between risk and return is a matter of preference
But this modeling approach provides strong support to allow making the keydecisions in a well-informed manner.