designing a processor from the ground up to allow voltage
TRANSCRIPT

Designing a Processor From the Ground Up toAllow Voltage/Reliability Tradeoffs
Andrew B. Kahng†+, Seokhyeong Kang†, Rakesh Kumar‡, John Sartori‡
+CSE and†ECE Departments ‡Coordinated Science LaboratoryUniversity of California, San Diego University of Illinois, Urbana-Champaign
La Jolla, CA 92093-0404 Urbana, IL 61801
Abstract—Current processor designs have a critical operatingpoint that sets a hard limit on voltage scaling. Any scalingbeyond the critical voltage results in exceeding the maximumallowable error rate, i.e., there are more timing errors thancan be effectively and gainfully detected or corrected by anerror-tolerance mechanism. This limits the effectiveness of voltagescaling as a knob for reliability/power tradeoffs.
In this paper, we present power-aware slack redistribution, anovel design-level approach to allow voltage/reliability tradeoffsin processors. Techniques based on power-aware slack redistribu-tion reapportion timing slack of the frequently-occurring, near-critical timing paths of a processor in a power- and area-efficientmanner, such that we increase the range of voltages over whichthe incidence of operational (timing) errors is acceptable. Thisresults in soft architectures- designs that fail gracefully, allowingus to perform reliability/power tradeoffs by reducing voltage upto the point that produces maximum allowable errors for ourapplication. The goal of our optimization is to minimize thevoltage at which a soft architecture encounters the maximumallowable error rate, thus maximizing the range over whichvoltage scaling is possible and minimizing power consumptionfor a given error rate. Our experiments demonstrate 23% powersavings over the baseline design at an error rate of 1%. Observedpower reductions are 29%, 29%, 19%, and 20% for error ratesof 2%, 4%, 8%, and 16% respectively. Benefits are higher inthe face of error recovery using Razor. Area overhead of ourtechniques is up to 2.7%.
I. I NTRODUCTION
Traditionally, processors have been designed to alwaysoperate correctly, even when subjected to a worst-case com-bination of non-idealities. Conservative guardbands (in termsof voltage margins, for example) are incorporated into designconstraints to ensure correct behavior in all possible scenarios.However, designing for a conservative operating point incursconsiderable overhead, in terms of power and performance [5].Overheads are worse for technologies with increased varia-tions [26].
Several better-than-worst-case (BTWC) designapproaches [1] have been recently proposed that allowtradeoffs between reliability and power/performance. Suchapproaches provide power/performance benefits by targetingaverage-case conditions, while an error detection/correctionmechanism deals with errors in the worst-case. Razor [5],for example, is a well-known circuit-level technique to detectand correct timing errors due to frequency, temperature,and voltage variations. Razor detects timing violations bysupplementing critical flip-flops withshadow latches. Ashadow latch strobes the output of a logic stage at a fixed
delay after the main flip-flop; if a timing violation occurs, themain flip-flop and shadow latch will have different values,signaling the need for correction. Correction involves recoveryusing the correct value(s) stored in the shadow latch(es).Similarly, system-level techniques such as Algorithmic NoiseTolerance [12] have proved effective in overcoming timingerrors in specific domains. Such techniques allow timingerrors due to frequency/voltage overscaling to propagateto the system or the application. The applications havealgorithmic and/or cognitive noise tolerance and, therefore,perform application-level error correction. Application- orsystem-level error detection and correction is also assumedfor recently proposed probabilistic SOCs [3] and stochasticprocessor architectures [33], [34] which are also classes ofBTWC designs.
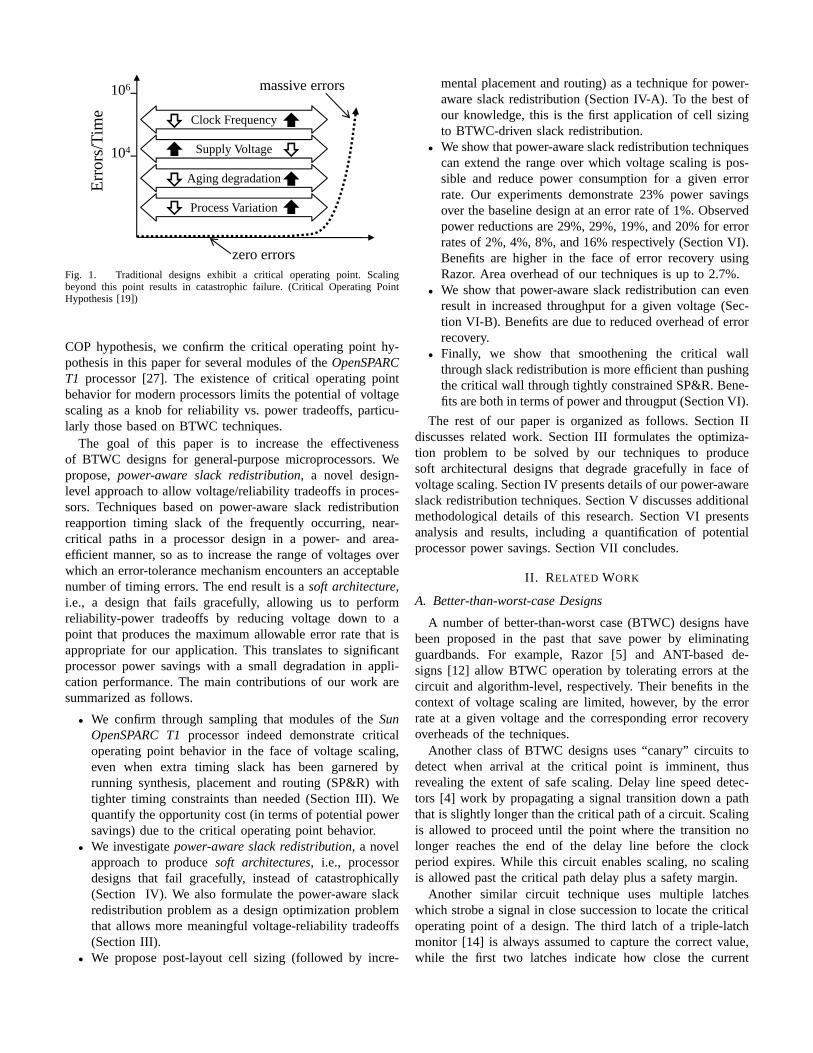
The effectiveness of BTWC techniques is limited, however,for high performance general-purpose microprocessors. Thisis because current general-purpose processor designs appearto have acritical operating point(see Figure 1) that sets ahard limit on voltage scaling [19]. The Critical Operating Point(COP) hypothesis [19], in the context of voltage scaling, statesthe following about large CMOS circuits (e.g., general-purposemicroprocessors):
There exists a critical operating voltageVc for a fixedambient temperatureT, such that
• Any voltage belowVc causesmassiveerrors• Any voltage aboveVc causesno voltage-induced
timing errors• In practice, Vc is not a single point, but is
confined to an extremely narrow range for agiven ambient temperature,Tc
The hypothesis is based on the fact that a large number oftiming paths in modern CMOS circuits are almost as longas the critical path. (In chip implementation, this is calledthe “wall of (critical) slack” in signoff timing reports.) Thisimplies that timing errors, when they occur, are massive.The Critical Operating Point (COP) hypothesis suggests thatany scaling beyond the critical voltage (voltage overscaling)will result in exceeding the maximum allowable error rate,rendering an error-tolerance mechanism ineffective. In otherwords, overscaling will lead to more timing errors than canbe corrected by the error-tolerance mechanism.
While the experiments in [19] provided the basis for the
106Ti
me
massive errors
Clock Frequency
104
Erro
rs/T Supply Voltage
Aging degradation
Process Variation
zero errorsFig. 1. Traditional designs exhibit a critical operating point. Scalingbeyond this point results in catastrophic failure. (Critical Operating PointHypothesis [19])
COP hypothesis, we confirm the critical operating point hy-pothesis in this paper for several modules of theOpenSPARCT1 processor [27]. The existence of critical operating pointbehavior for modern processors limits the potential of voltagescaling as a knob for reliability vs. power tradeoffs, particu-larly those based on BTWC techniques.
The goal of this paper is to increase the effectivenessof BTWC designs for general-purpose microprocessors. Wepropose,power-aware slack redistribution, a novel design-level approach to allow voltage/reliability tradeoffs in proces-sors. Techniques based on power-aware slack redistributionreapportion timing slack of the frequently occurring, near-critical paths in a processor design in a power- and area-efficient manner, so as to increase the range of voltages overwhich an error-tolerance mechanism encounters an acceptablenumber of timing errors. The end result is asoft architecture,i.e., a design that fails gracefully, allowing us to performreliability-power tradeoffs by reducing voltage down to apoint that produces the maximum allowable error rate that isappropriate for our application. This translates to significantprocessor power savings with a small degradation in appli-cation performance. The main contributions of our work aresummarized as follows.
• We confirm through sampling that modules of theSunOpenSPARC T1processor indeed demonstrate criticaloperating point behavior in the face of voltage scaling,even when extra timing slack has been garnered byrunning synthesis, placement and routing (SP&R) withtighter timing constraints than needed (Section III). Wequantify the opportunity cost (in terms of potential powersavings) due to the critical operating point behavior.
• We investigatepower-aware slack redistribution, a novelapproach to producesoft architectures, i.e., processordesigns that fail gracefully, instead of catastrophically(Section IV). We also formulate the power-aware slackredistribution problem as a design optimization problemthat allows more meaningful voltage-reliability tradeoffs(Section III).
• We propose post-layout cell sizing (followed by incre-
mental placement and routing) as a technique for power-aware slack redistribution (Section IV-A). To the best ofour knowledge, this is the first application of cell sizingto BTWC-driven slack redistribution.
• We show that power-aware slack redistribution techniquescan extend the range over which voltage scaling is pos-sible and reduce power consumption for a given errorrate. Our experiments demonstrate 23% power savingsover the baseline design at an error rate of 1%. Observedpower reductions are 29%, 29%, 19%, and 20% for errorrates of 2%, 4%, 8%, and 16% respectively (Section VI).Benefits are higher in the face of error recovery usingRazor. Area overhead of our techniques is up to 2.7%.
• We show that power-aware slack redistribution can evenresult in increased throughput for a given voltage (Sec-tion VI-B). Benefits are due to reduced overhead of errorrecovery.
• Finally, we show that smoothening the critical wallthrough slack redistribution is more efficient than pushingthe critical wall through tightly constrained SP&R. Bene-fits are both in terms of power and througput (Section VI).
The rest of our paper is organized as follows. Section IIdiscusses related work. Section III formulates the optimiza-tion problem to be solved by our techniques to producesoft architectural designs that degrade gracefully in face ofvoltage scaling. Section IV presents details of our power-awareslack redistribution techniques. Section V discusses additionalmethodological details of this research. Section VI presentsanalysis and results, including a quantification of potentialprocessor power savings. Section VII concludes.
II. RELATED WORK
A. Better-than-worst-case Designs
A number of better-than-worst case (BTWC) designs havebeen proposed in the past that save power by eliminatingguardbands. For example, Razor [5] and ANT-based de-signs [12] allow BTWC operation by tolerating errors at thecircuit and algorithm-level, respectively. Their benefits in thecontext of voltage scaling are limited, however, by the errorrate at a given voltage and the corresponding error recoveryoverheads of the techniques.
Another class of BTWC designs uses “canary” circuits todetect when arrival at the critical point is imminent, thusrevealing the extent of safe scaling. Delay line speed detec-tors [4] work by propagating a signal transition down a paththat is slightly longer than the critical path of a circuit. Scalingis allowed to proceed until the point where the transition nolonger reaches the end of the delay line before the clockperiod expires. While this circuit enables scaling, no scalingis allowed past the critical path delay plus a safety margin.
Another similar circuit technique uses multiple latcheswhich strobe a signal in close succession to locate the criticaloperating point of a design. The third latch of a triple-latchmonitor [14] is always assumed to capture the correct value,while the first two latches indicate how close the current
operating point is to the critical point. Again, the effectivenessof the technique in the context of general-purpose processordesigns will be limited by the critical operating point behaviorof the processor.
B. Design-level Optimizations for Timing Speculation
Design-level optimizations have recently been proposed [7]to improve throughput of timing speculation architectures. Theidea is to identify and optimize the most frequently-exerciseddynamic paths in a design at the expense of the majorityof the static paths, which are allowed to suffer infrequenttiming errors. EVAL [18] is a technique that trades error ratefor processor frequency by shifting, tilting, or reshaping thepath delay distributions of the various functional units. As anapplication of EVAL, the BlueShift technique [7] identifiestiming paths that are most-often violated and optimizes themusing on-demand selective biasing and path constraint tuning.On-demand selective biasing (OSB) involves adding slack tothe most frequently violated paths by forward body biasingsome of their gates. Path constraint tuning (PCT) involvesadding slack to paths by applying strong timing constraintson them.
There are four major differences between our work andthe BlueShift work. First, the optimization problem beingsolved is different. The goal of the BlueShift work is tomaximize the frequency for a given error rate, while the goalof this work is to minimize voltage for a given error rate.Second, our sensitivity functions are different. While BlueShiftoptimizations are agnostic of voltage-dependence of delayfor various timing paths, our work involves optimizing paths/ cells according to different functions, including switchingactivity, amount of negative slack, and response of path delayto voltage scaling. As the results in Section VI show, usingthe BlueShift sensitivity functions to minimize power maynot be very effective. Third, our optimization techniques aredifferent. While BlueShift uses OSB and PCT, we use cellsizing. Section VI compares the PCT method against ourtechnique (cell sizing) and shows the limited effectiveness ofPCT for power optimizations.
Fourth and finally, there is a significant difference betweenthe optimization flow of our approach and the BlueShiftapproach. BlueShift uses repetitive gate level simulations toget path profiles after making iterative improvements. Thismay be impractical with large, modern SOC designs, as thenumber of post-sizing, layout, extraction simulation steps isoften limited by runtime constraints. In contrast, our approachneeds only one simulation of the gate-level netlist to obtainswitching information for use in optimization. Moreover, thissimulation does not need delay information (SDF). This ex-pedites runtime.
C. Cell Sizing
In our work, we use post-layout cell resizing (or cellswapping) as a technique for redistributing timing slack ina design to create a gradual slack distribution. Previous workshave typically proposed cell sizing or swapping as a technique
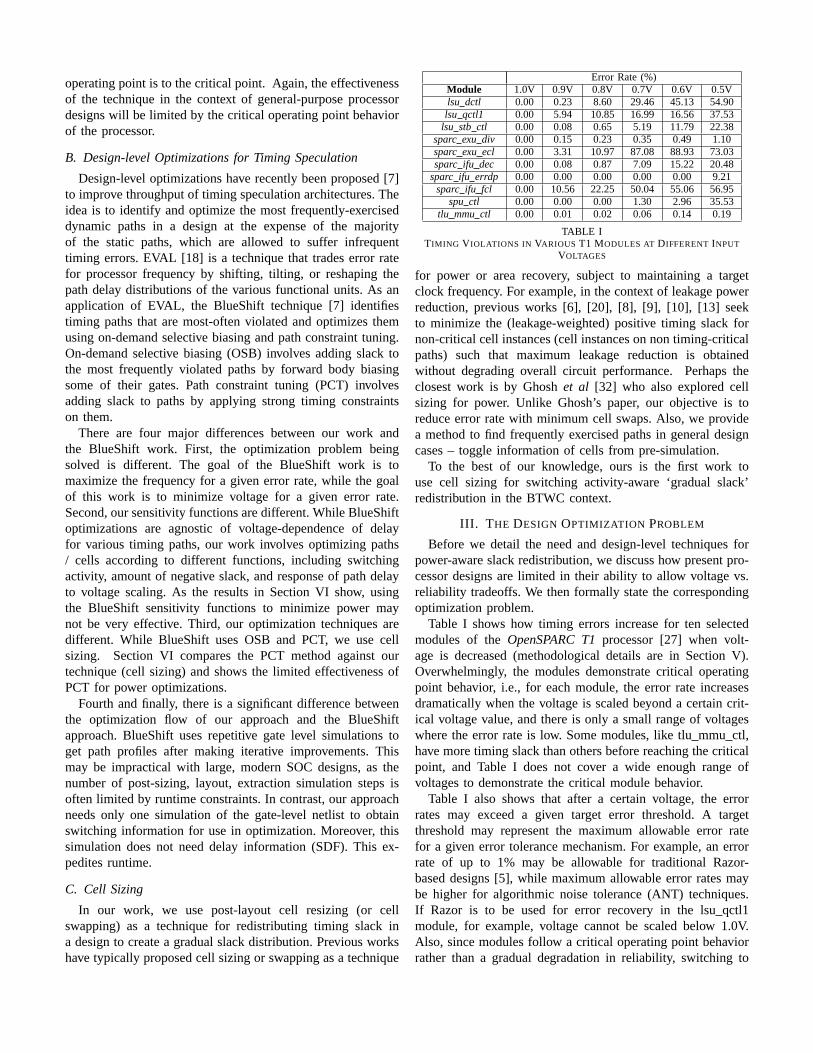
Error Rate (%)Module 1.0V 0.9V 0.8V 0.7V 0.6V 0.5Vlsu dctl 0.00 0.23 8.60 29.46 45.13 54.90lsu qctl1 0.00 5.94 10.85 16.99 16.56 37.53
lsu stb ctl 0.00 0.08 0.65 5.19 11.79 22.38sparc exu div 0.00 0.15 0.23 0.35 0.49 1.10sparc exu ecl 0.00 3.31 10.97 87.08 88.93 73.03sparc ifu dec 0.00 0.08 0.87 7.09 15.22 20.48
sparc ifu errdp 0.00 0.00 0.00 0.00 0.00 9.21sparc ifu fcl 0.00 10.56 22.25 50.04 55.06 56.95
spu ctl 0.00 0.00 0.00 1.30 2.96 35.53tlu mmu ctl 0.00 0.01 0.02 0.06 0.14 0.19
TABLE ITIMING V IOLATIONS IN VARIOUS T1 MODULES AT DIFFERENT INPUT
VOLTAGES
for power or area recovery, subject to maintaining a targetclock frequency. For example, in the context of leakage powerreduction, previous works [6], [20], [8], [9], [10], [13] seekto minimize the (leakage-weighted) positive timing slack fornon-critical cell instances (cell instances on non timing-criticalpaths) such that maximum leakage reduction is obtainedwithout degrading overall circuit performance. Perhaps theclosest work is by Ghoshet al [32] who also explored cellsizing for power. Unlike Ghosh’s paper, our objective is toreduce error rate with minimum cell swaps. Also, we providea method to find frequently exercised paths in general designcases – toggle information of cells from pre-simulation.
To the best of our knowledge, ours is the first work touse cell sizing for switching activity-aware ‘gradual slack’redistribution in the BTWC context.
III. T HE DESIGN OPTIMIZATION PROBLEM
Before we detail the need and design-level techniques forpower-aware slack redistribution, we discuss how present pro-cessor designs are limited in their ability to allow voltage vs.reliability tradeoffs. We then formally state the correspondingoptimization problem.
Table I shows how timing errors increase for ten selectedmodules of theOpenSPARC T1processor [27] when volt-age is decreased (methodological details are in Section V).Overwhelmingly, the modules demonstrate critical operatingpoint behavior, i.e., for each module, the error rate increasesdramatically when the voltage is scaled beyond a certain crit-ical voltage value, and there is only a small range of voltageswhere the error rate is low. Some modules, like tlummu ctl,have more timing slack than others before reaching the criticalpoint, and Table I does not cover a wide enough range ofvoltages to demonstrate the critical module behavior.
Table I also shows that after a certain voltage, the errorrates may exceed a given target error threshold. A targetthreshold may represent the maximum allowable error ratefor a given error tolerance mechanism. For example, an errorrate of up to 1% may be allowable for traditional Razor-based designs [5], while maximum allowable error rates maybe higher for algorithmic noise tolerance (ANT) techniques.If Razor is to be used for error recovery in the lsuqctl1module, for example, voltage cannot be scaled below 1.0V.Also, since modules follow a critical operating point behaviorrather than a gradual degradation in reliability, switching to
an error recovery technique that can tolerate 2% errors is notpossible for lsuqctl1. This effect is even more pronounced formodules like sparcifu fcl, where the increase in error rate iseven more drastic.
The goal of our design optimization, therefore, is to si-multaneously minimize the voltages at which each givenmaximum allowable error rate is observed, thus maximizingthe range over which voltage scaling is possible. Formally, theoptimization problem can be stated as follows.
Given: a set of error ratese1,e2, · · · ,en (ei < ei+1,1 < i < n).
Find: Minimize Vi,k, whereVi,k is the voltage at which theerror rate is no more thanei for designk.
Subject to: (1) For all i andk, Vi,k ≥V(i+1),k; (2) ∃ K, s.t., forall i andk, Vi,K ≤Vi,k whereK is the optimized design.
The above formulation results in designs that allow volt-age/reliability tradeoffs up to a point where the error rate isen. DesignK is the optimal design.
Note that the above optimization can be performed in twodifferent ways: (1) reduce the voltage value at which a moduleexhibits critical operating point behavior, or (2) optimize themodule to eliminate the critical operating point behavior (i.e.,there is now a gradual degradation in module reliability).In this paper, we focus on the latter, for the following tworeasons. First, a soft architecture with a gradual degradationin reliability with voltage scaling would allow us to performreliability/power tradeoffs by reducing voltage down to a pointthat produces maximum allowable errors for a given errortolerance mechanism, i.e., maximum number of timing errorsthan can be effectively and gainfully corrected by a givenerror-tolerance mechanism. This will allow us to maximize thepower savings for a given error tolerance mechanism. Second,a soft architecture allows one to use a different error toler-ance mechanism at different voltages, allowing deeper voltagescaling, since an appropriate mechanism can be selected basedon observed error rate. Figure 2 demonstrates the goal of theoptimization problem.
Timing slack0
Zero slack after voltage scaling
0
‘wall’ of slack ‘gradual slope’slack
Num
ber
of p
aths
Fig. 2. The goal of the gradual slack optimization is to transform aslack distribution with critical wall behavior into one with a gradual failurecharacteristic.
We propose to solve this optimization problem based onpower-aware slack redistribution, which is discussed in detailin the next section.
0200400600800
100012001400
-0.0
5
-0.0
3
-0.0
1
0.01
0.03
0.05
0.07
0.09
0.11
0.13
0.15
0.17
0.19
Num
ber
of p
aths
slack value(ns)
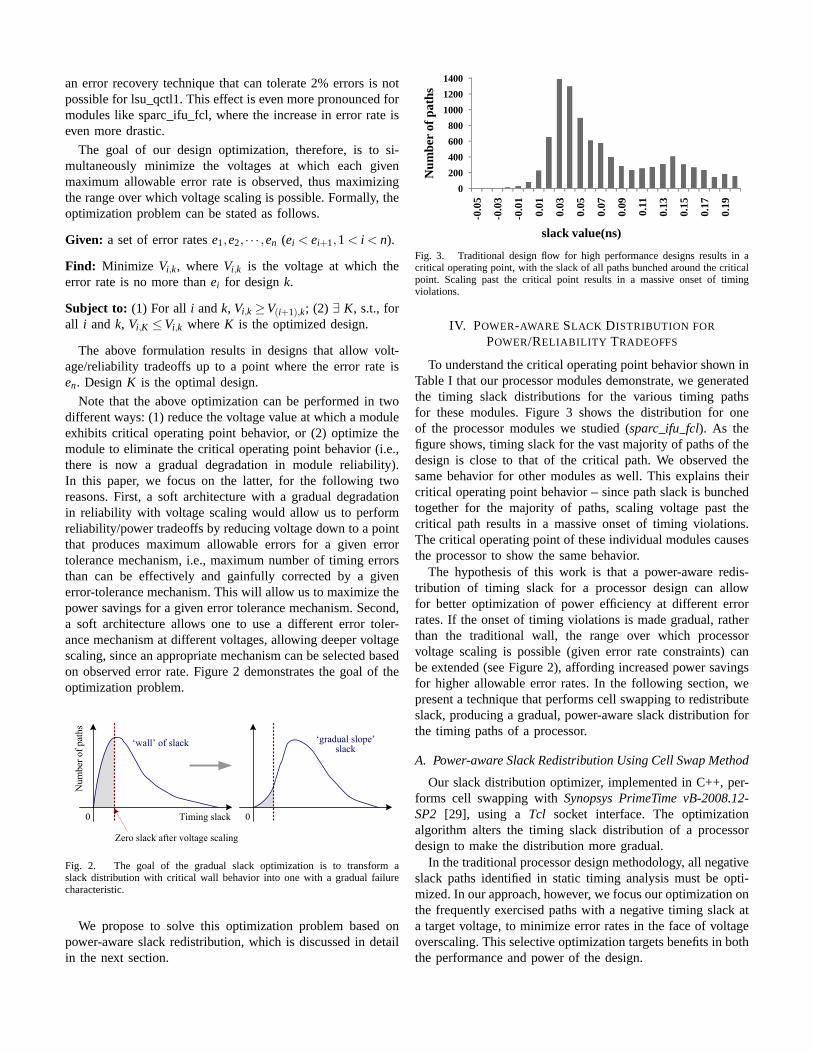
Fig. 3. Traditional design flow for high performance designs results in acritical operating point, with the slack of all paths bunched around the criticalpoint. Scaling past the critical point results in a massive onset of timingviolations.
IV. POWER-AWARE SLACK DISTRIBUTION FOR
POWER/RELIABILITY TRADEOFFS
To understand the critical operating point behavior shown inTable I that our processor modules demonstrate, we generatedthe timing slack distributions for the various timing pathsfor these modules. Figure 3 shows the distribution for oneof the processor modules we studied (sparc ifu fcl). As thefigure shows, timing slack for the vast majority of paths of thedesign is close to that of the critical path. We observed thesame behavior for other modules as well. This explains theircritical operating point behavior – since path slack is bunchedtogether for the majority of paths, scaling voltage past thecritical path results in a massive onset of timing violations.The critical operating point of these individual modules causesthe processor to show the same behavior.
The hypothesis of this work is that a power-aware redis-tribution of timing slack for a processor design can allowfor better optimization of power efficiency at different errorrates. If the onset of timing violations is made gradual, ratherthan the traditional wall, the range over which processorvoltage scaling is possible (given error rate constraints) canbe extended (see Figure 2), affording increased power savingsfor higher allowable error rates. In the following section, wepresent a technique that performs cell swapping to redistributeslack, producing a gradual, power-aware slack distribution forthe timing paths of a processor.
A. Power-aware Slack Redistribution Using Cell Swap Method
Our slack distribution optimizer, implemented in C++, per-forms cell swapping withSynopsys PrimeTime vB-2008.12-SP2 [29], using a Tcl socket interface. The optimizationalgorithm alters the timing slack distribution of a processordesign to make the distribution more gradual.
In the traditional processor design methodology, all negativeslack paths identified in static timing analysis must be opti-mized. In our approach, however, we focus our optimization onthe frequently exercised paths with a negative timing slack ata target voltage, to minimize error rates in the face of voltageoverscaling. This selective optimization targets benefits in boththe performance and power of the design.
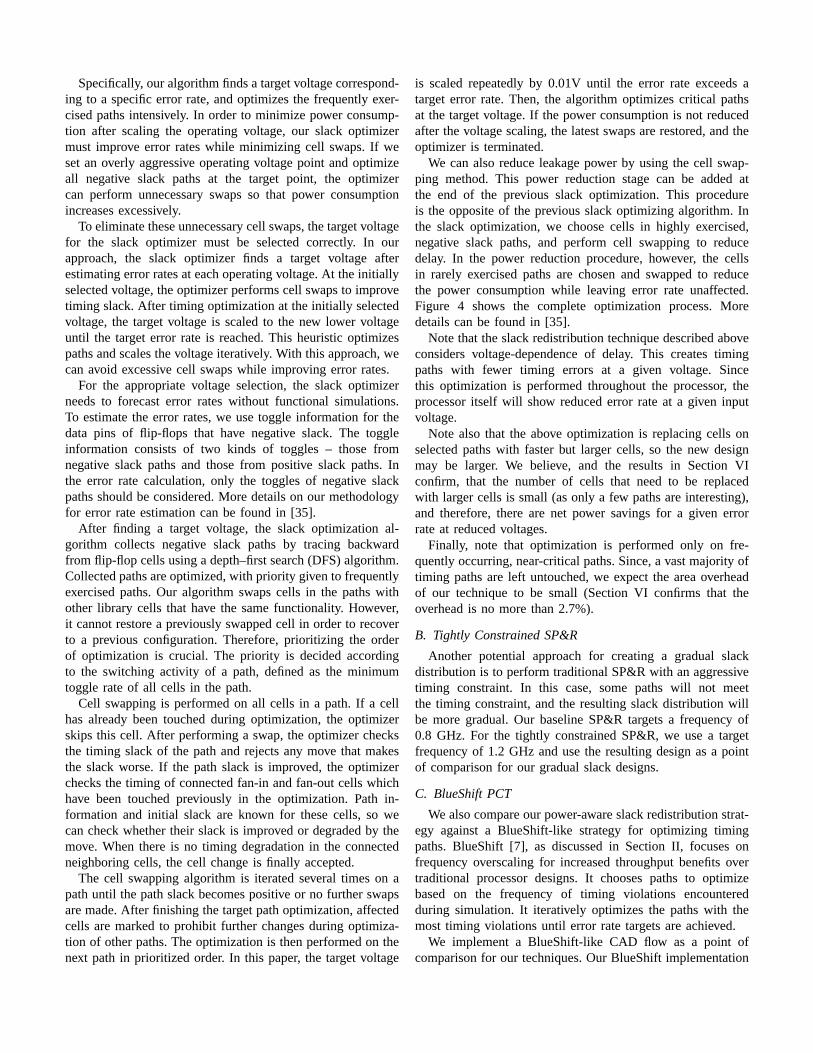
Specifically, our algorithm finds a target voltage correspond-ing to a specific error rate, and optimizes the frequently exer-cised paths intensively. In order to minimize power consump-tion after scaling the operating voltage, our slack optimizermust improve error rates while minimizing cell swaps. If weset an overly aggressive operating voltage point and optimizeall negative slack paths at the target point, the optimizercan perform unnecessary swaps so that power consumptionincreases excessively.
To eliminate these unnecessary cell swaps, the target voltagefor the slack optimizer must be selected correctly. In ourapproach, the slack optimizer finds a target voltage afterestimating error rates at each operating voltage. At the initiallyselected voltage, the optimizer performs cell swaps to improvetiming slack. After timing optimization at the initially selectedvoltage, the target voltage is scaled to the new lower voltageuntil the target error rate is reached. This heuristic optimizespaths and scales the voltage iteratively. With this approach, wecan avoid excessive cell swaps while improving error rates.
For the appropriate voltage selection, the slack optimizerneeds to forecast error rates without functional simulations.To estimate the error rates, we use toggle information for thedata pins of flip-flops that have negative slack. The toggleinformation consists of two kinds of toggles – those fromnegative slack paths and those from positive slack paths. Inthe error rate calculation, only the toggles of negative slackpaths should be considered. More details on our methodologyfor error rate estimation can be found in [35].
After finding a target voltage, the slack optimization al-gorithm collects negative slack paths by tracing backwardfrom flip-flop cells using a depth–first search (DFS) algorithm.Collected paths are optimized, with priority given to frequentlyexercised paths. Our algorithm swaps cells in the paths withother library cells that have the same functionality. However,it cannot restore a previously swapped cell in order to recoverto a previous configuration. Therefore, prioritizing the orderof optimization is crucial. The priority is decided accordingto the switching activity of a path, defined as the minimumtoggle rate of all cells in the path.
Cell swapping is performed on all cells in a path. If a cellhas already been touched during optimization, the optimizerskips this cell. After performing a swap, the optimizer checksthe timing slack of the path and rejects any move that makesthe slack worse. If the path slack is improved, the optimizerchecks the timing of connected fan-in and fan-out cells whichhave been touched previously in the optimization. Path in-formation and initial slack are known for these cells, so wecan check whether their slack is improved or degraded by themove. When there is no timing degradation in the connectedneighboring cells, the cell change is finally accepted.
The cell swapping algorithm is iterated several times on apath until the path slack becomes positive or no further swapsare made. After finishing the target path optimization, affectedcells are marked to prohibit further changes during optimiza-tion of other paths. The optimization is then performed on thenext path in prioritized order. In this paper, the target voltage
is scaled repeatedly by 0.01V until the error rate exceeds atarget error rate. Then, the algorithm optimizes critical pathsat the target voltage. If the power consumption is not reducedafter the voltage scaling, the latest swaps are restored, and theoptimizer is terminated.
We can also reduce leakage power by using the cell swap-ping method. This power reduction stage can be added atthe end of the previous slack optimization. This procedureis the opposite of the previous slack optimizing algorithm. Inthe slack optimization, we choose cells in highly exercised,negative slack paths, and perform cell swapping to reducedelay. In the power reduction procedure, however, the cellsin rarely exercised paths are chosen and swapped to reducethe power consumption while leaving error rate unaffected.Figure 4 shows the complete optimization process. Moredetails can be found in [35].
Note that the slack redistribution technique described aboveconsiders voltage-dependence of delay. This creates timingpaths with fewer timing errors at a given voltage. Sincethis optimization is performed throughout the processor, theprocessor itself will show reduced error rate at a given inputvoltage.
Note also that the above optimization is replacing cells onselected paths with faster but larger cells, so the new designmay be larger. We believe, and the results in Section VIconfirm, that the number of cells that need to be replacedwith larger cells is small (as only a few paths are interesting),and therefore, there are net power savings for a given errorrate at reduced voltages.
Finally, note that optimization is performed only on fre-quently occurring, near-critical paths. Since, a vast majority oftiming paths are left untouched, we expect the area overheadof our technique to be small (Section VI confirms that theoverhead is no more than 2.7%).
B. Tightly Constrained SP&R
Another potential approach for creating a gradual slackdistribution is to perform traditional SP&R with an aggressivetiming constraint. In this case, some paths will not meetthe timing constraint, and the resulting slack distribution willbe more gradual. Our baseline SP&R targets a frequency of0.8 GHz. For the tightly constrained SP&R, we use a targetfrequency of 1.2 GHz and use the resulting design as a pointof comparison for our gradual slack designs.
C. BlueShift PCT
We also compare our power-aware slack redistribution strat-egy against a BlueShift-like strategy for optimizing timingpaths. BlueShift [7], as discussed in Section II, focuses onfrequency overscaling for increased throughput benefits overtraditional processor designs. It chooses paths to optimizebased on the frequency of timing violations encounteredduring simulation. It iteratively optimizes the paths with themost timing violations until error rate targets are achieved.
We implement a BlueShift-like CAD flow as a point ofcomparison for our techniques. Our BlueShift implementation
Estimate Error Rate at Target
Voltage
Optimize Negative Slack Paths at Target
Voltage by Resizing Cells
Error Rate>Target Rate
YESUndo
OptimizationPower >
Current PowerYES
NO
Place and Route
Choose New (Lower) Target
Voltage
NO
Error Rate>Target Rate
NO YES
Reduce Power by Resizing Non-critical
Cells (optional)
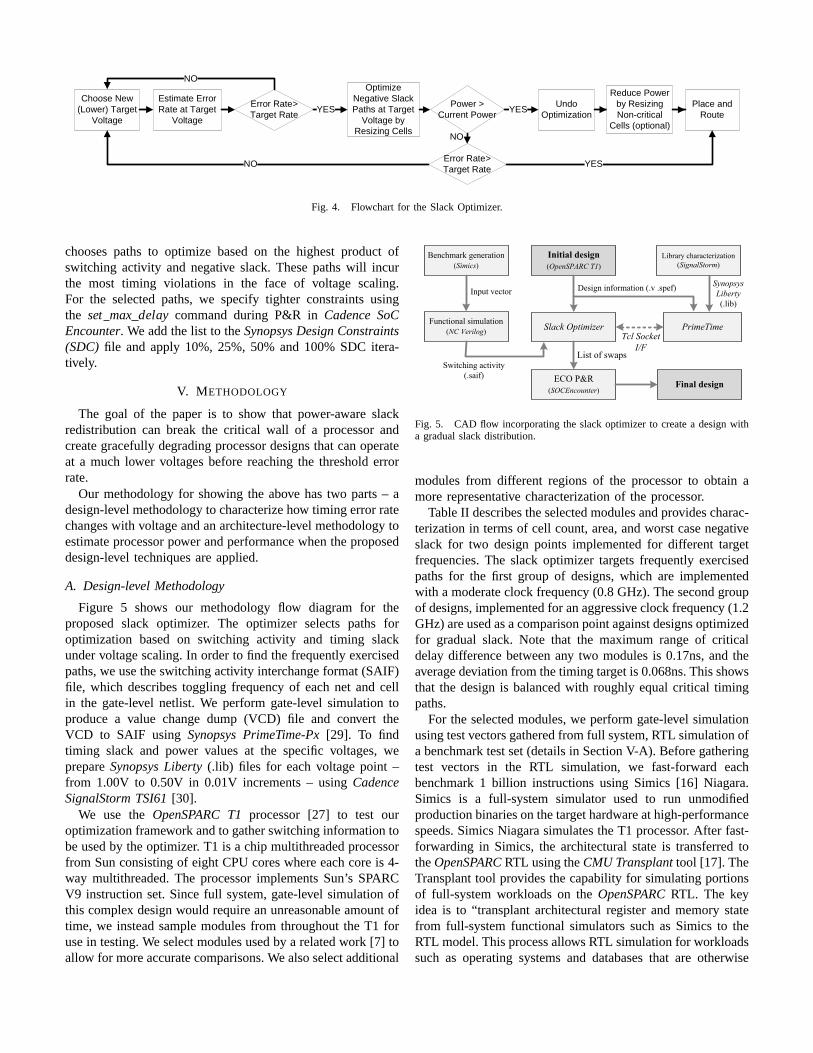
Fig. 4. Flowchart for the Slack Optimizer.
chooses paths to optimize based on the highest product ofswitching activity and negative slack. These paths will incurthe most timing violations in the face of voltage scaling.For the selected paths, we specify tighter constraints usingthe set max delay command during P&R inCadence SoCEncounter. We add the list to theSynopsys Design Constraints(SDC) file and apply 10%, 25%, 50% and 100% SDC itera-tively.
V. M ETHODOLOGY
The goal of the paper is to show that power-aware slackredistribution can break the critical wall of a processor andcreate gracefully degrading processor designs that can operateat a much lower voltages before reaching the threshold errorrate.
Our methodology for showing the above has two parts – adesign-level methodology to characterize how timing error ratechanges with voltage and an architecture-level methodology toestimate processor power and performance when the proposeddesign-level techniques are applied.
A. Design-level Methodology
Figure 5 shows our methodology flow diagram for theproposed slack optimizer. The optimizer selects paths foroptimization based on switching activity and timing slackunder voltage scaling. In order to find the frequently exercisedpaths, we use the switching activity interchange format (SAIF)file, which describes toggling frequency of each net and cellin the gate-level netlist. We perform gate-level simulation toproduce a value change dump (VCD) file and convert theVCD to SAIF using Synopsys PrimeTime-Px[29]. To findtiming slack and power values at the specific voltages, weprepareSynopsys Liberty(.lib) files for each voltage point –from 1.00V to 0.50V in 0.01V increments – usingCadenceSignalStorm TSI61[30].
We use theOpenSPARC T1processor [27] to test ouroptimization framework and to gather switching information tobe used by the optimizer. T1 is a chip multithreaded processorfrom Sun consisting of eight CPU cores where each core is 4-way multithreaded. The processor implements Sun’s SPARCV9 instruction set. Since full system, gate-level simulation ofthis complex design would require an unreasonable amount oftime, we instead sample modules from throughout the T1 foruse in testing. We select modules used by a related work [7] toallow for more accurate comparisons. We also select additional
Tcl Socket I/F
List of swaps
Initial designGate-level simulation
Design information(.v .spef)
Switching activity(.saif)
PrimeTime Slack Optimizer
ECO P&R(SOCEncounter)
Final design
Synopsys Liberty(.lib)
Initial design(OpenSPARC T1)
PrimeTime
Library Charic.(SignalStorm)
SynopsysLiberty(.lib)
Design information(.v .spef)
PowerOptimizer
Tcl Socket I/F
Library characterization(SignalStorm)
Functional simulation(NC Verilog)
Benchmark generation(Simics)
Input vector
Simulation dump (.vcd)
ECO P&R(SOCEncounter)
Final design
List of swaps
Initial design(OpenSPARC T1)
PrimeTime
Design information (.v .spef)
Slack OptimizerTcl Socket
I/F
Library characterization(SignalStorm)
Functional simulation(NC Verilog)
Benchmark generation(Simics)
Input vector
Switching activity (.saif) ECO P&R
(SOCEncounter)Final design
List of swaps
SynopsysLiberty(.lib)
Fig. 5. CAD flow incorporating the slack optimizer to create a design witha gradual slack distribution.
modules from different regions of the processor to obtain amore representative characterization of the processor.
Table II describes the selected modules and provides charac-terization in terms of cell count, area, and worst case negativeslack for two design points implemented for different targetfrequencies. The slack optimizer targets frequently exercisedpaths for the first group of designs, which are implementedwith a moderate clock frequency (0.8 GHz). The second groupof designs, implemented for an aggressive clock frequency (1.2GHz) are used as a comparison point against designs optimizedfor gradual slack. Note that the maximum range of criticaldelay difference between any two modules is 0.17ns, and theaverage deviation from the timing target is 0.068ns. This showsthat the design is balanced with roughly equal critical timingpaths.
For the selected modules, we perform gate-level simulationusing test vectors gathered from full system, RTL simulation ofa benchmark test set (details in Section V-A). Before gatheringtest vectors in the RTL simulation, we fast-forward eachbenchmark 1 billion instructions using Simics [16] Niagara.Simics is a full-system simulator used to run unmodifiedproduction binaries on the target hardware at high-performancespeeds. Simics Niagara simulates the T1 processor. After fast-forwarding in Simics, the architectural state is transferred totheOpenSPARCRTL using theCMU Transplanttool [17]. TheTransplant tool provides the capability for simulating portionsof full-system workloads on theOpenSPARCRTL. The keyidea is to “transplant architectural register and memory statefrom full-system functional simulators such as Simics to theRTL model. This process allows RTL simulation for workloadssuch as operating systems and databases that are otherwise
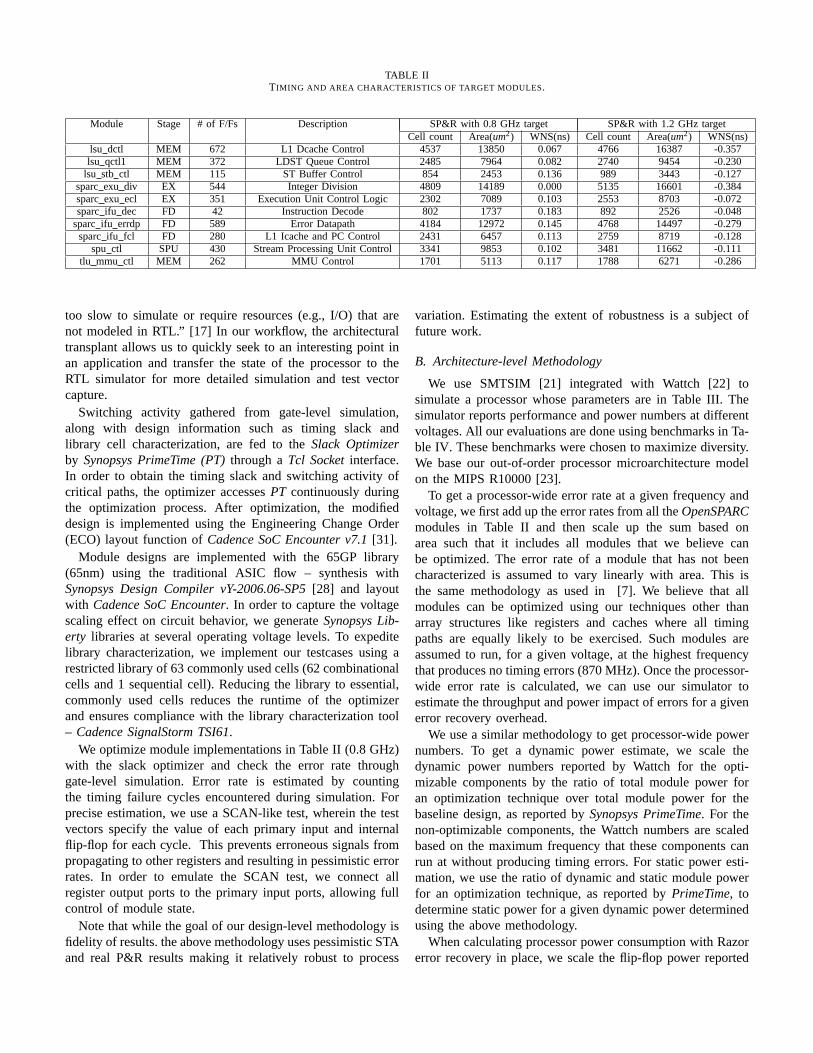
TABLE IITIMING AND AREA CHARACTERISTICS OF TARGET MODULES.
Module Stage # of F/Fs Description SP&R with 0.8 GHz target SP&R with 1.2 GHz targetCell count Area(um2) WNS(ns) Cell count Area(um2) WNS(ns)
lsu dctl MEM 672 L1 Dcache Control 4537 13850 0.067 4766 16387 -0.357lsu qctl1 MEM 372 LDST Queue Control 2485 7964 0.082 2740 9454 -0.230
lsu stb ctl MEM 115 ST Buffer Control 854 2453 0.136 989 3443 -0.127sparc exu div EX 544 Integer Division 4809 14189 0.000 5135 16601 -0.384sparc exu ecl EX 351 Execution Unit Control Logic 2302 7089 0.103 2553 8703 -0.072sparc ifu dec FD 42 Instruction Decode 802 1737 0.183 892 2526 -0.048
sparc ifu errdp FD 589 Error Datapath 4184 12972 0.145 4768 14497 -0.279sparc ifu fcl FD 280 L1 Icache and PC Control 2431 6457 0.113 2759 8719 -0.128
spu ctl SPU 430 Stream Processing Unit Control 3341 9853 0.102 3481 11662 -0.111tlu mmu ctl MEM 262 MMU Control 1701 5113 0.117 1788 6271 -0.286
too slow to simulate or require resources (e.g., I/O) that arenot modeled in RTL.” [17] In our workflow, the architecturaltransplant allows us to quickly seek to an interesting point inan application and transfer the state of the processor to theRTL simulator for more detailed simulation and test vectorcapture.
Switching activity gathered from gate-level simulation,along with design information such as timing slack andlibrary cell characterization, are fed to theSlack Optimizerby Synopsys PrimeTime (PT)through aTcl Socketinterface.In order to obtain the timing slack and switching activity ofcritical paths, the optimizer accessesPT continuously duringthe optimization process. After optimization, the modifieddesign is implemented using the Engineering Change Order(ECO) layout function ofCadence SoC Encounter v7.1[31].
Module designs are implemented with the 65GP library(65nm) using the traditional ASIC flow – synthesis withSynopsys Design Compiler vY-2006.06-SP5[28] and layoutwith Cadence SoC Encounter. In order to capture the voltagescaling effect on circuit behavior, we generateSynopsys Lib-erty libraries at several operating voltage levels. To expeditelibrary characterization, we implement our testcases using arestricted library of 63 commonly used cells (62 combinationalcells and 1 sequential cell). Reducing the library to essential,commonly used cells reduces the runtime of the optimizerand ensures compliance with the library characterization tool– Cadence SignalStorm TSI61.
We optimize module implementations in Table II (0.8 GHz)with the slack optimizer and check the error rate throughgate-level simulation. Error rate is estimated by countingthe timing failure cycles encountered during simulation. Forprecise estimation, we use a SCAN-like test, wherein the testvectors specify the value of each primary input and internalflip-flop for each cycle. This prevents erroneous signals frompropagating to other registers and resulting in pessimistic errorrates. In order to emulate the SCAN test, we connect allregister output ports to the primary input ports, allowing fullcontrol of module state.
Note that while the goal of our design-level methodology isfidelity of results. the above methodology uses pessimistic STAand real P&R results making it relatively robust to process
variation. Estimating the extent of robustness is a subject offuture work.
B. Architecture-level Methodology
We use SMTSIM [21] integrated with Wattch [22] tosimulate a processor whose parameters are in Table III. Thesimulator reports performance and power numbers at differentvoltages. All our evaluations are done using benchmarks in Ta-ble IV. These benchmarks were chosen to maximize diversity.We base our out-of-order processor microarchitecture modelon the MIPS R10000 [23].
To get a processor-wide error rate at a given frequency andvoltage, we first add up the error rates from all theOpenSPARCmodules in Table II and then scale up the sum based onarea such that it includes all modules that we believe canbe optimized. The error rate of a module that has not beencharacterized is assumed to vary linearly with area. This isthe same methodology as used in [7]. We believe that allmodules can be optimized using our techniques other thanarray structures like registers and caches where all timingpaths are equally likely to be exercised. Such modules areassumed to run, for a given voltage, at the highest frequencythat produces no timing errors (870 MHz). Once the processor-wide error rate is calculated, we can use our simulator toestimate the throughput and power impact of errors for a givenerror recovery overhead.
We use a similar methodology to get processor-wide powernumbers. To get a dynamic power estimate, we scale thedynamic power numbers reported by Wattch for the opti-mizable components by the ratio of total module power foran optimization technique over total module power for thebaseline design, as reported bySynopsys PrimeTime. For thenon-optimizable components, the Wattch numbers are scaledbased on the maximum frequency that these components canrun at without producing timing errors. For static power esti-mation, we use the ratio of dynamic and static module powerfor an optimization technique, as reported byPrimeTime, todetermine static power for a given dynamic power determinedusing the above methodology.
When calculating processor power consumption with Razorerror recovery in place, we scale the flip-flop power reported
by PrimeTimeto account for the increased power consumptionof Razor flip-flops. Razor flip-flops consume higher powerduring normal operation and also introduce a power overheadwhen recovering from an error. We use the processor error rate,as formulated above, in conjunction with the rates of powerconsumption during normal operation and error recovery [5]to calculate the power overhead of Razor and determine totalprocessor power consumption.
All our application simulations are done for 1 billion cyclesafter fast-forwarding to a Simpoint [24].
Property Value
L1 Icache 16KB, 4-way, 1 cycL1 Dcache 16KB, 4-way, 1 cycL2 2MB, 8 way, 8 cycExecution 2-way OORegFile 72 (int), 72 (FP)Branch Predictor gshare (8K entries)Memory Access 315 cyc
TABLE IIIPROCESSOR SPECIFICATIONS.
VI. A NALYSIS AND RESULTS
In this section, we present the results of our study, demon-strating that power-aware slack redistribution can extend therange of allowable voltage scaling, resulting in significantpower benefits for a given error rate. We first demonstrate thebenefits for individual processor modules. Then, we demon-strate processor-wide benefits and characterize the effect ofpower-aware slack redistribution on performance.
A. Voltage/Reliability Tradeoffs for Processor Modules
In these experiments, we use 10 submodules of theOpenSPARC T1processor [27] to test our optimization frame-work. We estimate error rates through gate-level simulationswith different voltage libraries. Power consumption is alsocalculated for each operating voltage. We run experimentsfor four implementation cases at an operating frequency of0.87GHz. This is the highest frequency at which no moduleproduces timing errors.
1) Traditional P&R with a loose clock frequency target(0.8GHz)
2) Traditional P&R with a tight clock frequency target(1.2GHz)
3) BlueShift PCT[7]4) Slack optimizer
Our slack optimizer includes the power reduction post-processing stage.
Figure 6 compares the power consumptions of the vari-ous design techniques at several target error rates (0.25%,0.5%, 1%, 2%, 4%, 8% and 16%). Different error recoverymechanisms have different overheads of recovery. Thus, eachmechanism can gainfully tolerate a different level of errors.One of the benefits of gradual slack designs is that theyminimize the incidence of maximum acceptable error rates
over a range of voltages, allowing for tradeoffs betweenpower and error rate based on what is acceptable for a givenapplication and recovery technique.
Although one proposed benefit of slack redistribution ispower efficiency, path slack optimization can also incur costsin terms of power, due to cell resizing. We observed an averagearea overhead of 20.3% for tightly constrained P&R, 6.5% forBlueShift, and 2.7% for the slack optimizer (the power reduc-tion process changes cells with smaller one, but there is no areareduction since we used ECO P&R to conserve the timing).Techniques like tightly constrained P&R and BlueShift do notconsider the power implications of their optimizations and inmany cases the power overhead of optimization outweighs thepower benefit of voltage scaling, as evidenced in Figure 6.Power-aware slack redistribution, on the other hand, does wellto reduce power consumption at the target error rates for thediverse set of processor modules, in spite of the slight areaoverhead (2.7%). In fact, only 5% cells were swapped, onaverage.
B. Processor-wide Voltage/Reliability Tradeoffs
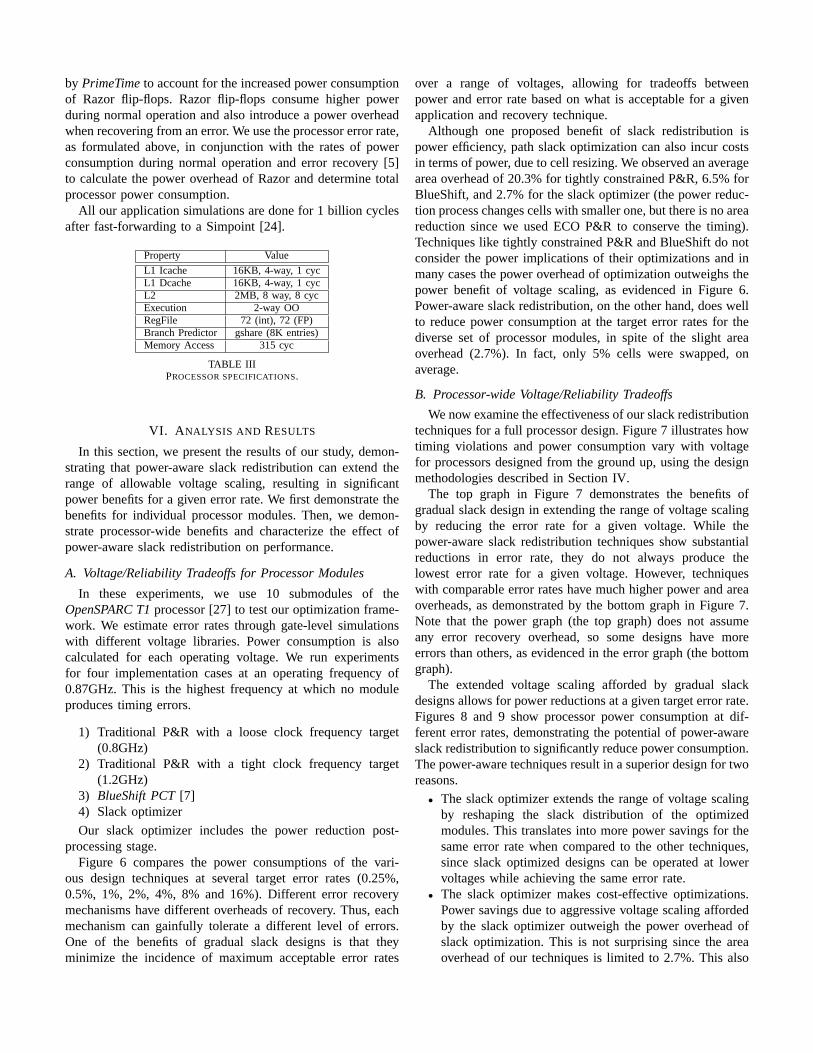
We now examine the effectiveness of our slack redistributiontechniques for a full processor design. Figure 7 illustrates howtiming violations and power consumption vary with voltagefor processors designed from the ground up, using the designmethodologies described in Section IV.
The top graph in Figure 7 demonstrates the benefits ofgradual slack design in extending the range of voltage scalingby reducing the error rate for a given voltage. While thepower-aware slack redistribution techniques show substantialreductions in error rate, they do not always produce thelowest error rate for a given voltage. However, techniqueswith comparable error rates have much higher power and areaoverheads, as demonstrated by the bottom graph in Figure 7.Note that the power graph (the top graph) does not assumeany error recovery overhead, so some designs have moreerrors than others, as evidenced in the error graph (the bottomgraph).
The extended voltage scaling afforded by gradual slackdesigns allows for power reductions at a given target error rate.Figures 8 and 9 show processor power consumption at dif-ferent error rates, demonstrating the potential of power-awareslack redistribution to significantly reduce power consumption.The power-aware techniques result in a superior design for tworeasons.
• The slack optimizer extends the range of voltage scalingby reshaping the slack distribution of the optimizedmodules. This translates into more power savings for thesame error rate when compared to the other techniques,since slack optimized designs can be operated at lowervoltages while achieving the same error rate.
• The slack optimizer makes cost-effective optimizations.Power savings due to aggressive voltage scaling affordedby the slack optimizer outweigh the power overhead ofslack optimization. This is not surprising since the areaoverhead of our techniques is limited to 2.7%. This also

Benchmark Description Benchmark Descriptionammp Computational Chemistry mcf Combinatorial Optimizationapplu Parabolic / Elliptic Partial Differential Equations mgrid Multi-grid Solver: 3D Potential Field
art Image Recognition / Neural Networks parser Word Processingbzip2 Compression swim Shallow Water Modelingcrafty Game Playing: Chess twolf Place and Route Simulatoreon Computer Visualization vortex-2 Object-oriented Database
equake Seismic Wave Propagation Simulation vpr FPGA Circuit Placement and Routingwupwise Physics/ Quantum Chromodynamics
TABLE IVBENCHMARKS.
2.00E-04
2.50E-04
3.00E-04
3.50E-04
0.25% 0.50% 1% 2% 4% 8% 16%
Power(W)
Error Rate (%)
lsu_dctl
0.8 GHz
1.2 GHz
BlueShift
Slack Optimizer
1.20E-04
1.60E-04
2.00E-04
2.40E-04
0.25% 0.50% 1% 2% 4% 8% 16%
Power(W)
Error Rate (%)
lsu_qctl1
0.8 GHz
1.2 GHz
BlueShift
Slack Optimizer
2.00E-05
3.00E-05
4.00E-05
5.00E-05
6.00E-05
0.25% 0.50% 1% 2% 4% 8% 16%
Power(W)
Error Rate (%)
lsu_stb_ctl
0.8 GHz
1.2 GHz
BlueShift
Slack Optimizer
1.50E-04
2.00E-04
2.50E-04
3.00E-04
Power(W) sparc_exu_div
0.8 GHz
1.2 GHz
BlueShift
Slack Optimizer
1.50E-05
2.00E-05
2.50E-05
3.00E-05
3.50E-05
0.25% 0.50% 1% 2% 4% 8% 16%
Power(W)
Error Rate (%)
sparc_ifu_dec
0.8 GHz
1.2 GHz
BlueShift
Slack Optimizer
1.00E-04
1.10E-04
1.20E-04
0.25% 0.50% 1% 2% 4% 8% 16%
Power(W)
Error Rate (%)
sparc_ifu_errdp
0.8 GHz
1.2 GHz
BlueShift
Slack Optimizer
1.00E-04
1.50E-04
2.00E-04
2.50E-04
0.25% 0.50% 1% 2% 4% 8% 16%
Power(W)
Error Rate (%)
sparc_ifu_fcl
0.8 GHz
1.2 GHz
BlueShift
Slack Optimizer
1.00E-04
1.40E-04
1.80E-04
Power(W) spu_ctl
0.8 GHz
1.2 GHz
BlueShift
Slack Optimizer
2.00E-04
2.50E-04
3.00E-04
3.50E-04
0.25% 0.50% 1% 2% 4% 8% 16%
Power(W)
Error Rate (%)
lsu_dctl
0.8 GHz
1.2 GHz
BlueShift
Slack Optimizer
1.20E-04
1.60E-04
2.00E-04
2.40E-04
0.25% 0.50% 1% 2% 4% 8% 16%
Power(W)
Error Rate (%)
lsu_qctl1
0.8 GHz
1.2 GHz
BlueShift
Slack Optimizer
2.00E-05
3.00E-05
4.00E-05
5.00E-05
6.00E-05
0.25% 0.50% 1% 2% 4% 8% 16%
Power(W)
Error Rate (%)
lsu_stb_ctl
0.8 GHz
1.2 GHz
BlueShift
Slack Optimizer
1.00E-04
1.50E-04
2.00E-04
2.50E-04
3.00E-04
0.25% 0.50% 1% 2% 4% 8% 16%
Power(W)
Error Rate (%)
sparc_exu_div
0.8 GHz
1.2 GHz
BlueShift
Slack Optimizer
1.00E-04
1.50E-04
2.00E-04
2.50E-04
3.00E-04
0.25% 0.50% 1% 2% 4% 8% 16%
Power(W)
Error Rate (%)
sparc_exu_ecl
0.8 GHz
1.2 GHz
BlueShift
Slack Optimizer
1.50E-05
2.00E-05
2.50E-05
3.00E-05
3.50E-05
0.25% 0.50% 1% 2% 4% 8% 16%
Power(W)
Error Rate (%)
sparc_ifu_dec
0.8 GHz
1.2 GHz
BlueShift
Slack Optimizer
1.00E-04
1.10E-04
1.20E-04
0.25% 0.50% 1% 2% 4% 8% 16%
Power(W)
Error Rate (%)
sparc_ifu_errdp
0.8 GHz
1.2 GHz
BlueShift
Slack Optimizer
1.00E-04
1.50E-04
2.00E-04
2.50E-04
0.25% 0.50% 1% 2% 4% 8% 16%
Power(W)
Error Rate (%)
sparc_ifu_fcl
0.8 GHz
1.2 GHz
BlueShift
Slack Optimizer
6.00E-05
1.00E-04
1.40E-04
1.80E-04
0.25% 0.50% 1% 2% 4% 8% 16%
Power(W)
Error Rate (%)
spu_ctl
0.8 GHz
1.2 GHz
BlueShift
Slack Optimizer
4.50E-05
4.70E-05
4.90E-05
5.10E-05
0.25% 0.50% 1% 2% 4% 8% 16%
Power(W)
Error Rate (%)
tlu_mmu_ctl
0.8 GHz
1.2 GHz
BlueShift
Slack Optimizer
2.00E-04
2.50E-04
3.00E-04
3.50E-04
0.25% 0.50% 1% 2% 4% 8% 16%
Power(W)
Error Rate (%)
lsu_dctl
0.8 GHz
1.2 GHz
BlueShift
Slack Optimizer
1.20E-04
1.60E-04
2.00E-04
2.40E-04
0.25% 0.50% 1% 2% 4% 8% 16%
Power(W)
Error Rate (%)
lsu_qctl1
0.8 GHz
1.2 GHz
BlueShift
Slack Optimizer
2.00E-05
3.00E-05
4.00E-05
5.00E-05
6.00E-05
0.25% 0.50% 1% 2% 4% 8% 16%
Power(W)
Error Rate (%)
lsu_stb_ctl
0.8 GHz
1.2 GHz
BlueShift
Slack Optimizer
1.50E-04
2.00E-04
2.50E-04
3.00E-04
Power(W) sparc_exu_div
0.8 GHz
1.2 GHz
BlueShift
Slack Optimizer
1.50E-05
2.00E-05
2.50E-05
3.00E-05
3.50E-05
0.25% 0.50% 1% 2% 4% 8% 16%
Power(W)
Error Rate (%)
sparc_ifu_dec
0.8 GHz
1.2 GHz
BlueShift
Slack Optimizer
1.00E-04
1.10E-04
1.20E-04
0.25% 0.50% 1% 2% 4% 8% 16%
Power(W)
Error Rate (%)
sparc_ifu_errdp
0.8 GHz
1.2 GHz
BlueShift
Slack Optimizer
1.00E-04
1.50E-04
2.00E-04
2.50E-04
0.25% 0.50% 1% 2% 4% 8% 16%
Power(W)
Error Rate (%)
sparc_ifu_fcl
0.8 GHz
1.2 GHz
BlueShift
Slack Optimizer
1.00E-04
1.40E-04
1.80E-04
Power(W) spu_ctl
0.8 GHz
1.2 GHz
BlueShift
Slack Optimizer
2.00E-04
2.50E-04
3.00E-04
3.50E-04
0.25% 0.50% 1% 2% 4% 8% 16%
Power(W)
Error Rate (%)
lsu_dctl
0.8 GHz
1.2 GHz
BlueShift
Slack Optimizer
1.20E-04
1.60E-04
2.00E-04
2.40E-04
0.25% 0.50% 1% 2% 4% 8% 16%
Power(W)
Error Rate (%)
lsu_qctl1
0.8 GHz
1.2 GHz
BlueShift
Slack Optimizer
2.00E-05
3.00E-05
4.00E-05
5.00E-05
6.00E-05
0.25% 0.50% 1% 2% 4% 8% 16%
Power(W)
Error Rate (%)
lsu_stb_ctl
0.8 GHz
1.2 GHz
BlueShift
Slack Optimizer
1.00E-04
1.50E-04
2.00E-04
2.50E-04
3.00E-04
0.25% 0.50% 1% 2% 4% 8% 16%
Power(W)
Error Rate (%)
sparc_exu_div
0.8 GHz
1.2 GHz
BlueShift
Slack Optimizer
1.00E-04
1.50E-04
2.00E-04
2.50E-04
3.00E-04
0.25% 0.50% 1% 2% 4% 8% 16%
Power(W)
Error Rate (%)
sparc_exu_ecl
0.8 GHz
1.2 GHz
BlueShift
Slack Optimizer
1.50E-05
2.00E-05
2.50E-05
3.00E-05
3.50E-05
0.25% 0.50% 1% 2% 4% 8% 16%
Power(W)
Error Rate (%)
sparc_ifu_dec
0.8 GHz
1.2 GHz
BlueShift
Slack Optimizer
1.00E-04
1.10E-04
1.20E-04
0.25% 0.50% 1% 2% 4% 8% 16%
Power(W)
Error Rate (%)
sparc_ifu_errdp
0.8 GHz
1.2 GHz
BlueShift
Slack Optimizer
1.00E-04
1.50E-04
2.00E-04
2.50E-04
0.25% 0.50% 1% 2% 4% 8% 16%
Power(W)
Error Rate (%)
sparc_ifu_fcl
0.8 GHz
1.2 GHz
BlueShift
Slack Optimizer
6.00E-05
1.00E-04
1.40E-04
1.80E-04
0.25% 0.50% 1% 2% 4% 8% 16%
Power(W)
Error Rate (%)
spu_ctl
0.8 GHz
1.2 GHz
BlueShift
Slack Optimizer
4.50E-05
4.70E-05
4.90E-05
5.10E-05
0.25% 0.50% 1% 2% 4% 8% 16%
Power(W)
Error Rate (%)
tlu_mmu_ctl
0.8 GHz
1.2 GHz
BlueShift
Slack Optimizer
Fig. 6. Power consumption of each design technique at various target error rates (operating frequency is 0.87 GHz).
explains why some techniques that achieve lower errorrates than the power-aware slack optimizer for somevoltages still consume more power for a given error rate.
Note that the benefits are smaller relative to BlueShift fora small number of very low non-zero error rates, due to theaggressiveness of the BlueShift technique. However, power-aware slack optimization creates a gradual slack distribution,whereas BlueShift optimizes target paths heavily at the ex-pense of other timing paths in the design. After 0.9V, the errorrate of the BlueShift design shoots up, while the error rate ofthe slack optimized design continues to increase gradually,causing the two curves to diverge on the power vs. error rateplane
While the power graph in Figure 7 shows the effect of
voltage scaling on processor power consumption as well asthe relative ordering of techniques in terms of their poweroverhead, it does not assume any error recovery overhead.Figure 10 shows how processor power consumption varieswith voltage scaling when Razor is used to detect and correcterrors. This graph incorporates power overheads due to the in-creased power consumption of Razor flip-flops during normaloperation and the power overhead of recovery incurred whenRazor detects and corrects an error.
Figure 10 demonstrates that power-aware slack redistribu-tion achieves the lowest power of any technique and extendsthe range over which voltage scaling and Razor correctionare feasible. Note that in the baseline design (P&R with afrequency target of 0.8GHz), minimum power with Razor
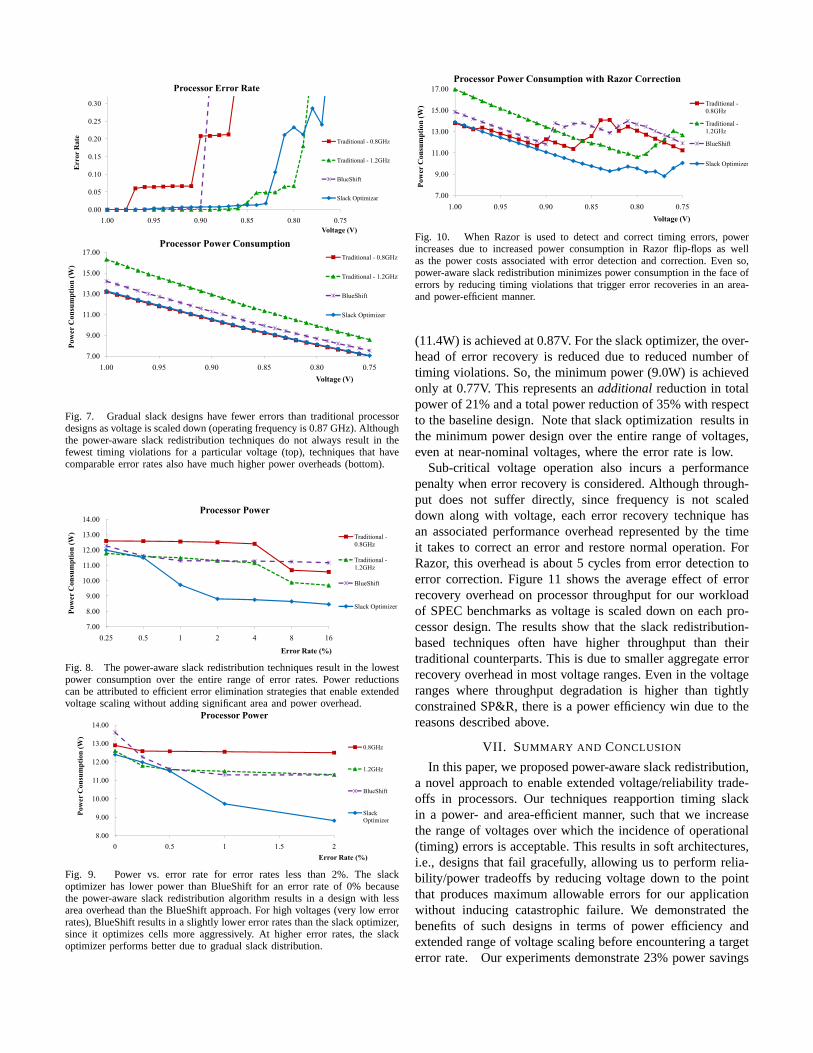
0.00
0.05
0.10
0.15
0.20
0.25
0.30
Err
or R
ate
Processor Error Rate
Traditional - 0.8GHz
Traditional - 1.2GHz
BlueShift
Slack Optimizar
0.00
0.05
0.10
0.15
0.20
0.25
0.30
0.750.800.850.900.951.00
Err
or R
ate
Voltage (V)
Processor Error Rate
Traditional - 0.8GHz
Traditional - 1.2GHz
BlueShift
Slack Optimizar
7.00
9.00
11.00
13.00
15.00
17.00
0.750.800.850.900.951.00
Processor Power ConsumptionTraditional - 0.8GHz
Traditional - 1.2GHz
BlueShift
Slack Optimizer
Pow
er C
onsu
mpt
ion
(W)
7.00
9.00
11.00
13.00
15.00
17.00
0.750.800.850.900.951.00Voltage (V)
Processor Power ConsumptionTraditional - 0.8GHz
Traditional - 1.2GHz
BlueShift
Slack Optimizer
Pow
er C
onsu
mpt
ion
(W)
Fig. 7. Gradual slack designs have fewer errors than traditional processordesigns as voltage is scaled down (operating frequency is 0.87 GHz). Althoughthe power-aware slack redistribution techniques do not always result in thefewest timing violations for a particular voltage (top), techniques that havecomparable error rates also have much higher power overheads (bottom).
7.00
8.00
9.00
10.00
11.00
12.00
13.00
14.00
0.25 0.5 1 2 4 8 16
Processor Power
Traditional -0.8GHz
Traditional -1.2GHz
BlueShift
Slack Optimizer
Pow
er C
onsu
mpt
ion
(W)
7.00
8.00
9.00
10.00
11.00
12.00
13.00
14.00
0.25 0.5 1 2 4 8 16
Error Rate (%)
Processor Power
Traditional -0.8GHz
Traditional -1.2GHz
BlueShift
Slack Optimizer
Pow
er C
onsu
mpt
ion
(W)
Fig. 8. The power-aware slack redistribution techniques result in the lowestpower consumption over the entire range of error rates. Power reductionscan be attributed to efficient error elimination strategies that enable extendedvoltage scaling without adding significant area and power overhead.
8.00
9.00
10.00
11.00
12.00
13.00
14.00Processor Power
0.8GHz
1.2GHz
BlueShift
Slack Optimizer
Pow
er C
onsu
mpt
ion
(W)
8.00
9.00
10.00
11.00
12.00
13.00
14.00
0 0.5 1 1.5 2Error Rate (%)
Processor Power
0.8GHz
1.2GHz
BlueShift
Slack Optimizer
Pow
er C
onsu
mpt
ion
(W)
Fig. 9. Power vs. error rate for error rates less than 2%. The slackoptimizer has lower power than BlueShift for an error rate of 0% becausethe power-aware slack redistribution algorithm results in a design with lessarea overhead than the BlueShift approach. For high voltages (very low errorrates), BlueShift results in a slightly lower error rates than the slack optimizer,since it optimizes cells more aggressively. At higher error rates, the slackoptimizer performs better due to gradual slack distribution.
g ( )
7.00
9.00
11.00
13.00
15.00
17.00Processor Power Consumption with Razor Correction
Traditional -0.8GHz
Traditional -1.2GHz
BlueShift
Slack Optimizer
Pow
er C
onsu
mpt
ion
(W)
g ( )
7.00
9.00
11.00
13.00
15.00
17.00
0.750.800.850.900.951.00Voltage (V)
Processor Power Consumption with Razor Correction
Traditional -0.8GHz
Traditional -1.2GHz
BlueShift
Slack Optimizer
Pow
er C
onsu
mpt
ion
(W)
Fig. 10. When Razor is used to detect and correct timing errors, powerincreases due to increased power consumption in Razor flip-flops as wellas the power costs associated with error detection and correction. Even so,power-aware slack redistribution minimizes power consumption in the face oferrors by reducing timing violations that trigger error recoveries in an area-and power-efficient manner.
(11.4W) is achieved at 0.87V. For the slack optimizer, the over-head of error recovery is reduced due to reduced number oftiming violations. So, the minimum power (9.0W) is achievedonly at 0.77V. This represents anadditional reduction in totalpower of 21% and a total power reduction of 35% with respectto the baseline design. Note that slack optimization results inthe minimum power design over the entire range of voltages,even at near-nominal voltages, where the error rate is low.
Sub-critical voltage operation also incurs a performancepenalty when error recovery is considered. Although through-put does not suffer directly, since frequency is not scaleddown along with voltage, each error recovery technique hasan associated performance overhead represented by the timeit takes to correct an error and restore normal operation. ForRazor, this overhead is about 5 cycles from error detection toerror correction. Figure 11 shows the average effect of errorrecovery overhead on processor throughput for our workloadof SPEC benchmarks as voltage is scaled down on each pro-cessor design. The results show that the slack redistribution-based techniques often have higher throughput than theirtraditional counterparts. This is due to smaller aggregate errorrecovery overhead in most voltage ranges. Even in the voltageranges where throughput degradation is higher than tightlyconstrained SP&R, there is a power efficiency win due to thereasons described above.
VII. SUMMARY AND CONCLUSION
In this paper, we proposed power-aware slack redistribution,a novel approach to enable extended voltage/reliability trade-offs in processors. Our techniques reapportion timing slackin a power- and area-efficient manner, such that we increasethe range of voltages over which the incidence of operational(timing) errors is acceptable. This results in soft architectures,i.e., designs that fail gracefully, allowing us to perform relia-bility/power tradeoffs by reducing voltage down to the pointthat produces maximum allowable errors for our applicationwithout inducing catastrophic failure. We demonstrated thebenefits of such designs in terms of power efficiency andextended range of voltage scaling before encountering a targeterror rate. Our experiments demonstrate 23% power savings
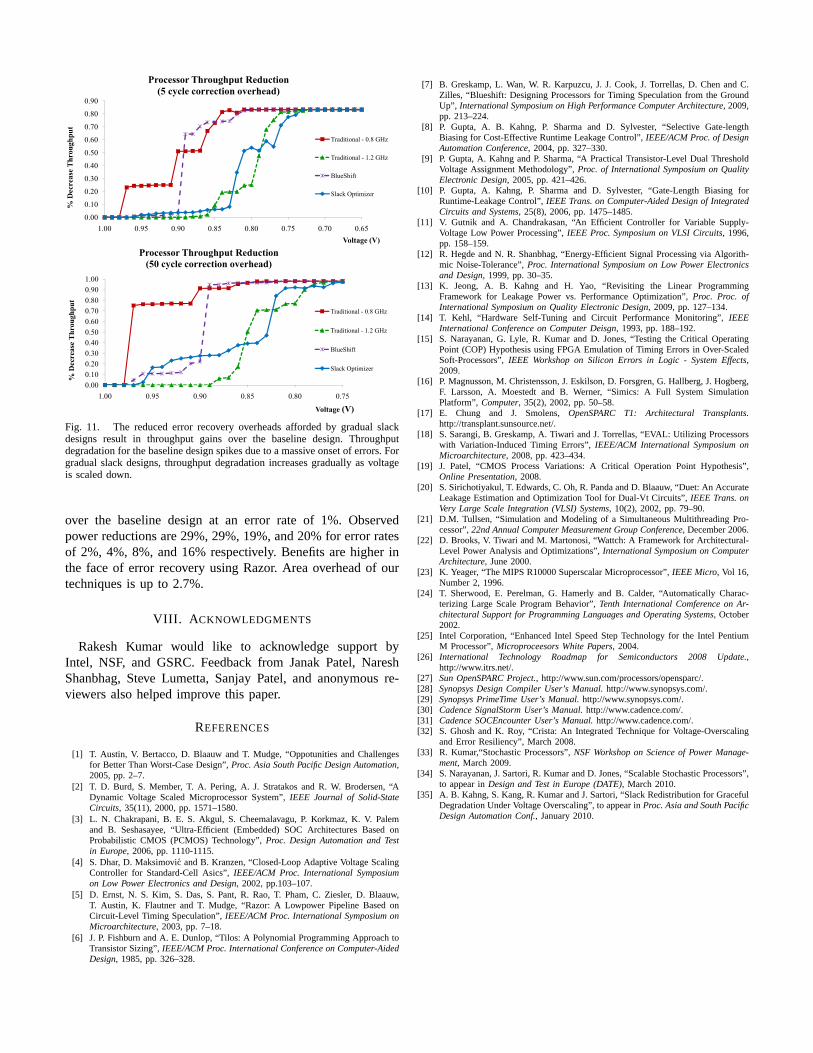
0.10
0.20
0.30
0.40
0.50
0.60
0.70
0.80
0.90
Processor Throughput Reduction (5 cycle correction overhead)
Traditional - 0.8 GHz
Traditional - 1.2 GHz
BlueShift
Slack Optimizer
% D
ecre
ase
Thr
ough
put
0.00
0.10
0.20
0.30
0.40
0.50
0.60
0.70
0.80
0.90
0.650.700.750.800.850.900.951.00Voltage (V)
Processor Throughput Reduction (5 cycle correction overhead)
Traditional - 0.8 GHz
Traditional - 1.2 GHz
BlueShift
Slack Optimizer
% D
ecre
ase
Thr
ough
put
0 000.100.200.300.400.500.600.700.800.901.00
Processor Throughput Reduction (50 cycle correction overhead)
Traditional - 0.8 GHz
Traditional - 1.2 GHz
BlueShift
Slack Optimizer
% D
ecre
ase
Thr
ough
put
0.000.100.200.300.400.500.600.700.800.901.00
0.750.800.850.900.951.00
Voltage (V)
Processor Throughput Reduction (50 cycle correction overhead)
Traditional - 0.8 GHz
Traditional - 1.2 GHz
BlueShift
Slack Optimizer
% D
ecre
ase
Thr
ough
put
Fig. 11. The reduced error recovery overheads afforded by gradual slackdesigns result in throughput gains over the baseline design. Throughputdegradation for the baseline design spikes due to a massive onset of errors. Forgradual slack designs, throughput degradation increases gradually as voltageis scaled down.
over the baseline design at an error rate of 1%. Observedpower reductions are 29%, 29%, 19%, and 20% for error ratesof 2%, 4%, 8%, and 16% respectively. Benefits are higher inthe face of error recovery using Razor. Area overhead of ourtechniques is up to 2.7%.
VIII. A CKNOWLEDGMENTS
Rakesh Kumar would like to acknowledge support byIntel, NSF, and GSRC. Feedback from Janak Patel, NareshShanbhag, Steve Lumetta, Sanjay Patel, and anonymous re-viewers also helped improve this paper.
REFERENCES
[1] T. Austin, V. Bertacco, D. Blaauw and T. Mudge, “Oppotunities and Challengesfor Better Than Worst-Case Design”,Proc. Asia South Pacific Design Automation,2005, pp. 2–7.
[2] T. D. Burd, S. Member, T. A. Pering, A. J. Stratakos and R. W. Brodersen, “ADynamic Voltage Scaled Microprocessor System”,IEEE Journal of Solid-StateCircuits, 35(11), 2000, pp. 1571–1580.
[3] L. N. Chakrapani, B. E. S. Akgul, S. Cheemalavagu, P. Korkmaz, K. V. Palemand B. Seshasayee, “Ultra-Efficient (Embedded) SOC Architectures Based onProbabilistic CMOS (PCMOS) Technology”,Proc. Design Automation and Testin Europe, 2006, pp. 1110-1115.
[4] S. Dhar, D. Maksimovic and B. Kranzen, “Closed-Loop Adaptive Voltage ScalingController for Standard-Cell Asics”,IEEE/ACM Proc. International Symposiumon Low Power Electronics and Design, 2002, pp.103–107.
[5] D. Ernst, N. S. Kim, S. Das, S. Pant, R. Rao, T. Pham, C. Ziesler, D. Blaauw,T. Austin, K. Flautner and T. Mudge, “Razor: A Lowpower Pipeline Based onCircuit-Level Timing Speculation”,IEEE/ACM Proc. International Symposium onMicroarchitecture, 2003, pp. 7–18.
[6] J. P. Fishburn and A. E. Dunlop, “Tilos: A Polynomial Programming Approach toTransistor Sizing”,IEEE/ACM Proc. International Conference on Computer-AidedDesign, 1985, pp. 326–328.
[7] B. Greskamp, L. Wan, W. R. Karpuzcu, J. J. Cook, J. Torrellas, D. Chen and C.Zilles, “Blueshift: Designing Processors for Timing Speculation from the GroundUp”, International Symposium on High Performance Computer Architecture, 2009,pp. 213–224.
[8] P. Gupta, A. B. Kahng, P. Sharma and D. Sylvester, “Selective Gate-lengthBiasing for Cost-Effective Runtime Leakage Control”,IEEE/ACM Proc. of DesignAutomation Conference, 2004, pp. 327–330.
[9] P. Gupta, A. Kahng and P. Sharma, “A Practical Transistor-Level Dual ThresholdVoltage Assignment Methodology”,Proc. of International Symposium on QualityElectronic Design, 2005, pp. 421–426.
[10] P. Gupta, A. Kahng, P. Sharma and D. Sylvester, “Gate-Length Biasing forRuntime-Leakage Control”,IEEE Trans. on Computer-Aided Design of IntegratedCircuits and Systems, 25(8), 2006, pp. 1475–1485.
[11] V. Gutnik and A. Chandrakasan, “An Efficient Controller for Variable Supply-Voltage Low Power Processing”,IEEE Proc. Symposium on VLSI Circuits, 1996,pp. 158–159.
[12] R. Hegde and N. R. Shanbhag, “Energy-Efficient Signal Processing via Algorith-mic Noise-Tolerance”,Proc. International Symposium on Low Power Electronicsand Design, 1999, pp. 30–35.
[13] K. Jeong, A. B. Kahng and H. Yao, “Revisiting the Linear ProgrammingFramework for Leakage Power vs. Performance Optimization”,Proc. Proc. ofInternational Symposium on Quality Electronic Design, 2009, pp. 127–134.
[14] T. Kehl, “Hardware Self-Tuning and Circuit Performance Monitoring”,IEEEInternational Conference on Computer Deisgn, 1993, pp. 188–192.
[15] S. Narayanan, G. Lyle, R. Kumar and D. Jones, “Testing the Critical OperatingPoint (COP) Hypothesis using FPGA Emulation of Timing Errors in Over-ScaledSoft-Processors”,IEEE Workshop on Silicon Errors in Logic - System Effects,2009.
[16] P. Magnusson, M. Christensson, J. Eskilson, D. Forsgren, G. Hallberg, J. Hogberg,F. Larsson, A. Moestedt and B. Werner, “Simics: A Full System SimulationPlatform”, Computer, 35(2), 2002, pp. 50–58.
[17] E. Chung and J. Smolens,OpenSPARC T1: Architectural Transplants.http://transplant.sunsource.net/.
[18] S. Sarangi, B. Greskamp, A. Tiwari and J. Torrellas, “EVAL: Utilizing Processorswith Variation-Induced Timing Errors”,IEEE/ACM International Symposium onMicroarchitecture, 2008, pp. 423–434.
[19] J. Patel, “CMOS Process Variations: A Critical Operation Point Hypothesis”,Online Presentation, 2008.
[20] S. Sirichotiyakul, T. Edwards, C. Oh, R. Panda and D. Blaauw, “Duet: An AccurateLeakage Estimation and Optimization Tool for Dual-Vt Circuits”,IEEE Trans. onVery Large Scale Integration (VLSI) Systems, 10(2), 2002, pp. 79–90.
[21] D.M. Tullsen, “Simulation and Modeling of a Simultaneous Multithreading Pro-cessor”,22nd Annual Computer Measurement Group Conference, December 2006.
[22] D. Brooks, V. Tiwari and M. Martonosi, “Wattch: A Framework for Architectural-Level Power Analysis and Optimizations”,International Symposium on ComputerArchitecture, June 2000.
[23] K. Yeager, “The MIPS R10000 Superscalar Microprocessor”,IEEE Micro, Vol 16,Number 2, 1996.
[24] T. Sherwood, E. Perelman, G. Hamerly and B. Calder, “Automatically Charac-terizing Large Scale Program Behavior”,Tenth International Comference on Ar-chitectural Support for Programming Languages and Operating Systems, October2002.
[25] Intel Corporation, “Enhanced Intel Speed Step Technology for the Intel PentiumM Processor”,Microproceesors White Papers, 2004.
[26] International Technology Roadmap for Semiconductors 2008 Update.,http://www.itrs.net/.
[27] Sun OpenSPARC Project., http://www.sun.com/processors/opensparc/.[28] Synopsys Design Compiler User’s Manual.http://www.synopsys.com/.[29] Synopsys PrimeTime User’s Manual.http://www.synopsys.com/.[30] Cadence SignalStorm User’s Manual.http://www.cadence.com/.[31] Cadence SOCEncounter User’s Manual.http://www.cadence.com/.[32] S. Ghosh and K. Roy, “Crista: An Integrated Technique for Voltage-Overscaling
and Error Resiliency”, March 2008.[33] R. Kumar,“Stochastic Processors”,NSF Workshop on Science of Power Manage-
ment, March 2009.[34] S. Narayanan, J. Sartori, R. Kumar and D. Jones, “Scalable Stochastic Processors”,
to appear inDesign and Test in Europe (DATE), March 2010.[35] A. B. Kahng, S. Kang, R. Kumar and J. Sartori, “Slack Redistribution for Graceful
Degradation Under Voltage Overscaling”, to appear inProc. Asia and South PacificDesign Automation Conf., January 2010.