designing a benchmark for many-core architectures1 introduction 1.1motivation...
TRANSCRIPT
Institut fürTechnische Informatik undKommunikationsnetze
Semester Thesisat the Department of Information Technology
and Electrical Engineering
Designing a benchmark for many-corearchitectures
AS 2012
Pierre Ferry
Advisors: Devendra RaiLars Schor
Professor: Prof. Dr. Lothar Thiele
Zurich10th February 2013
Abstract
Recent progress in computing capabilities is no more driven by the increaseof processor frequency, but rather by an increase in the number of cores. Inthis context, it is necessary to distribute tasks on a given multi/many- coresystem in a way that the combined computing power of the entire systemcan be most efficiently harvested.
Benchmarks are an efficient tool to clearly understand the computing andcommunication capabilities offered by the multi/many core system. Once aclear understanding of various available resources has been developed, it ispossible to develop algorithms that will map given tasks to the multi/many-core system such that various metrics such as latencies are minimized. Thisthesis proposes a comparative study of existing parallel applications andadapts one of them, a deduplication algorithm, for a many-core architectureusing the Distributed Application Layer (DAL) framework. The benchmarkswere evaluated on a PC as well as the Intel SCC cluster, and detailed resultsare presented in this thesis.
— II —

Acknowledgements
I would like to express my sincere gratitude to Prof. Dr. Lothar Thielefor granting me the opportunity to write this semester thesis in his researchgroup.I would also like to thank my advisors Devendra Rai and Lars Schor for theirsupport and availability throughout this thesis.
— III —

Contents
1 Introduction 21.1 Motivation . . . . . . . . . . . . . . . . . . . . . . . . . . . . . 21.2 Contributions . . . . . . . . . . . . . . . . . . . . . . . . . . . 31.3 Outline . . . . . . . . . . . . . . . . . . . . . . . . . . . . . . 4
2 The KPN and DAL 52.1 The Kahn Process Network, KPN . . . . . . . . . . . . . . . . 52.2 The Distributed Application Layer, DAL . . . . . . . . . . . . 6
3 Benchmark Development 83.1 Finding the benchmark . . . . . . . . . . . . . . . . . . . . . . 83.2 The Deduplication application . . . . . . . . . . . . . . . . . . 11
4 Benchmark 154.1 Measurement libraries . . . . . . . . . . . . . . . . . . . . . . 15
4.1.1 Performance Measurement on a PC-Cluster . . . . . . 154.1.2 Performance Measurement on the Intel SCC . . . . . . 17
4.2 Benchmark Results . . . . . . . . . . . . . . . . . . . . . . . . 194.2.1 PC Cluster . . . . . . . . . . . . . . . . . . . . . . . . 194.2.2 Intel SCC . . . . . . . . . . . . . . . . . . . . . . . . . 23
5 Conclusion and Outlook 275.1 Conclusion . . . . . . . . . . . . . . . . . . . . . . . . . . . . . 275.2 Outlook . . . . . . . . . . . . . . . . . . . . . . . . . . . . . . 27
A Acronyms 29
B Presentation Slides 30
— IV —
List of Figures
3.1 Dedup, Process network of the deduplication application. . . 12
4.1 Communication output of each process as a function of theinput file size. . . . . . . . . . . . . . . . . . . . . . . . . . . . 20
4.2 Number of hardware cycles spent in computation for each pro-cess as a function of the input file size. . . . . . . . . . . . . . 21
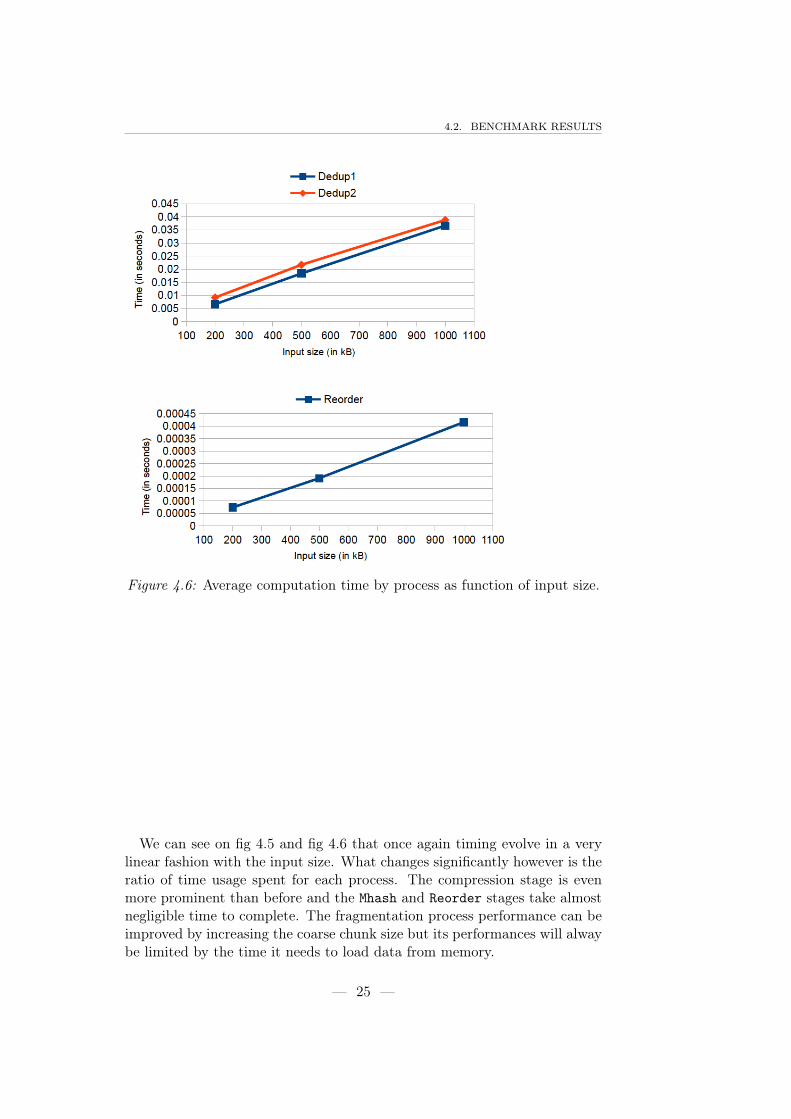
4.3 Average spent hardware cycles per byte. . . . . . . . . . . . . 224.4 SCC Layout. . . . . . . . . . . . . . . . . . . . . . . . . . . . 234.5 Average computation time by process as function of input size. 244.6 Average computation time by process as function of input size. 254.7 Average computation time for compression with duplicated
input. . . . . . . . . . . . . . . . . . . . . . . . . . . . . . . . 26
— 1 —
1Introduction
1.1 Motivation
The goal of this project was to design and to implement a benchmark formany-core architectures. Developing a benchmark for a many-core systemis much more complex than developing a corresponding benchmark for asingle-core architecture. Usually, for a single core system one can have arather accurate idea of a processor’s overall performance with its memoryand computational performance. Performance depends on a great variety ofparameters such as clock frequency, instruction set, cache size. Once theseparameters are known, it is rather easy to assert how well this processor willperform a specific task.
However, a many core system is usually more complex than a single-coresystem. A multi/many core system may have complex cache and memoryhierarchy. First of all, the core hierarchy may not be homogeneous, with onlysome cores sharing a given cache, while others may map to entirely differentmemory regions. It is also possible that a given multi/many-core system mayhave cores of different types: for instance, some cores may be x86-based cores,while others may be graphics processors. Such heterogeneous cores, togetherwith complex memory hierarchies may generate very diverse memory accesspatterns that makes it difficult to evaluate the memory performance. A givenapplication may therefore perform differently depending on how it is mappedonto the architecture. In view of such challenges, it becomes clear that
— 2 —
1.2. CONTRIBUTIONS
mapping a significantly large application onto a multi/many-core system is acomplex problem. Common approaches used to solve such mapping problemsrely on design-space exploration (DSE), wherein abstract properties (such asmaximum computing power of a core, available bandwidth to its neighbours)of the given system are used to construct a suitable model of the givensystem. Suitable algorithms are developed, which use such abstract models inorder to arrive at an optimal solution to, for instance, map various processesin the application such as the communication latencies between processesare minimized. The more cores are available and the more complex theapplication is , the more difficult it is to evaluate the performance of anapplication on a predefined architecture.A benchmark gives a reliable way to compare different architectures andapplication mappings.
1.2 Contributions
In this thesis, a set of existing parallel benchmarks was studied to find anapplication fitted for a high performance system benchmark. These bench-marks were compared regarding a few parameters:
• Parallelizability
• Possibility to scale computation and communication load to matchmore or less performant systems
• Complexity
• Realistic as a nowadays task for high performance systems
After a careful examination two benchmark applications were developed:
• Secure Hash Algorithm (SHA) signature application : relatively simpleapplication that computes secure signature of files. It is used to au-thenticate file transfers for instance.
• Deduplication application: detects and removes redundancy in a fileand compresses it. This application will be the one described in thisreport as it is the one of significant importance.
Instrumentation to measure the performance of the system was integratedto the application. The resulting benchmark was run on a PC cluster andported on an Intel Single-chip Cloud Computer (SCC) (see 4.2.2).
— 3 —
CHAPTER 1. INTRODUCTION
1.3 Outline
In the first chapter, a computation model, Kahn process networks, ispresented as well as the Distributed Application Layer.In the second chapter, the steps leading to the benchmark development aredescribed. First a comparative study of existing parallel benchmarks is sum-marized. Then the Deduplication application principle is described as wellas its implementation.The third chapter presents the solution used to measure the performance ofthe application as well as the results of the benchmark on a PC cluster andon an Intel SCC chipThe last chapter stands as a conclusion and an Outlook to this thesis.
— 4 —
2The KPN and DAL
2.1 The Kahn Process Network, KPN
A Kahn Process Network (KPN) is a model of computation that was pro-posed in 1974 by Gilles Kahn (see [1]) . In this model, a KPN is an orientedgraph where nodes are sequential processes and edges are communicationchannels (unbounded First In First Out buffers). Processes can either writeor read from these channels. They must also have the following properties:
• Writing to a channel is non-blocking : every write is successful and theprocess does not stop.
• Reading from a channel is blocking : the process stalls until data isavailable in the channel.
• Monotonicity: with a prefix of any input sequence, the process pro-duces a prefix of the corresponding output sequence.
These properties, alongside with the structure of the network guarantee thedeterminism of the application. The monotonicity also allows processes torun asynchronously or in any given order since a process does not need tohave access to its full input sequence to produce the beginning of the outputsequence.It is important to note that processes can not test the state of the channels(the availability of data) because it would make the execution of the processtiming dependent.
— 5 —
CHAPTER 2. THE KPN AND DAL
In the case of our application, the restriction on the read primitive wasremoved in order to ensure the maximum usage of resources (minimum pos-sible process stalling). Thus, non-blocking read have been allowed. Thischange removes the guarantee of determinacy of the process network. How-ever, in the particular case of our application, the behavior of the applicationremains correct even without this restriction (see 3.1).
2.2 The Distributed Application Layer, DAL
The Distributed Application Layer (DAL) is a framework developed by theComputer Engineering and Networks Laboratory (TIK) at ETH. It allows tomap KPN-like process networks (see 2.1) dynamically onto many-tile plat-forms. Thus, mapping can be changed at execution time in order to adaptto the current application scenario.
The DAL framework makes it possible to use the same application ondifferent multiprocessor architectures because the application is designedwithout any knowledge of the architecture on which it will be executed.The application mapping is described separately from the application itself.
In this framework, an application is designed as a network of processes.Every process has the same three methods: init, fire and finish. The initmethod is executed by every process at the start of the application. Thisprocedure may be used, for example, to initialize a data-structure needed forthe application.
The fire method is called repeatedly, until the application stops executing.It is the fire method which executes the functionality of each process. Thus,all necessary computations and communications are carried out within thefire method itself.
The last one, finish, is called when the application stops, and may be used toperform necessary housekeeping activities, such as freeing malloc’dmemory,write results to a filesystem, or to collect relevant performance statistics ofthe process.
It is possible for a process to have access to persistent memory, in orderto share certain variables, or to retain the results of computation betweensuccessive fire cycles. Such persistence of information is made possible bythe use of so-called Local_State of the process.
— 6 —

2.2. THE DISTRIBUTED APPLICATION LAYER, DAL
The DAL Framework is composed of two layers: A bare-bones framework,which creates a master process and a set of slave processes. The masterprocesses dispatches instructions to the required slave process, such as:
1. Load a certain functionality for execution.
2. Create a FIFO of a given size, and attach it to either the input or anoutput port of a process.
3. Instantiate an inter-processor communication module, and attach it toa given FIFO.
4. Start, Stop, Pause or Resume the execution of a given process.
In order to keep the memory footprint of the framework as low as possible,the functionality to be loaded by a slave process is compiled a so-called sharedlibrary, or process-independent code (PIC). At run-time, a slave may receivean instruction to load the functionality associated with Reorder process ofthe Deduplication application. The slave simply looks up a library consistingof a collection of shared-objects, and loads a suitable object. In what follows,the functionality will be simply referred to as a process, not to be confusedwith the master or the slave processes. Wherever necessary, the distinctionwill be made clear with the context.
All slave processes continuously listen for instructions from the master pro-cess. A process network description file, written in XML, is created by thedesigner of the application which describes how various processes in the ap-plication are connected, alongwith the necessary size of associated FIFOsfor communication. Thus, the master process derives necessary applicationsetup instructions from this process network description file.
Upon reception of these instructions, the slave processes establish the cor-responding channels and load the process specified by the master process.
When the process network has been established, the master will start ex-ecution of the application, by sending the appropriate instruction(s) to eachof the slave processes. Subsequently, the processes of the application runasynchronously to each other. The communication layer is established usingthe Message Passing Interface (MPI) [2]. Since message passing interface isthe most commonly used communication solution used in high-performancecomputing applications, versions of it have been optimized for use on variousmulti/many- core systems. Such commonality of communication interfacesallows the application to be portable across several multiprocessor architec-tures.
This allows us to develop our application as a KPN-like process network andrun it on both on a PC cluster and an Intel SCC.
— 7 —

3Benchmark Development
3.1 Finding the benchmark
An ideal benchmark for our purpose must be based on a realistic applic-ation, and must offer computational and communication loads which arecommonly expected of high-performance applications today. Another inter-esting characteristic that we look for in a benchmark is that it should showa deterministic relationship between the size of its input, to communica-tion and computational work done by it. Ideally, we look for a polynomialrelationship between the input size and output loads (communication, com-putation).
A benchmark possessing these characteristics can be tuned to test a rangeof multiprocessing systems (mobile platforms, Intel SCC, or the supercom-puting cluster). For instance, each core in the Intel SCC chip is a relativelysimple P54C core, running at 800MHz, with 16K of instruction and datacache, and therefore, the computing capabilities offered by each core of theSCC are significantly different from those offered by a core in modern clustersystems, which may be running latest Intel/AMD cores, clocked at 3GHz orhigher.
The first step was therefore to find an application that could make asuitable benchmark for this thesis. An important point is that, in the DALframework, processes do not share any memory and so the target applicationmust be parallelizable with explicit communication between processes. There
— 8 —
3.1. FINDING THE BENCHMARK
are a lot of existing benchmarks for parallel computing but most of themrely on shared memory (i.e., thread level parallelization). Aside from beingsuitable for a distributed architecture, the benchmark indeed needs to bereasonably complex in order to be able to exploit a many core system butalso to be feasible in the amount of time available for this thesis.
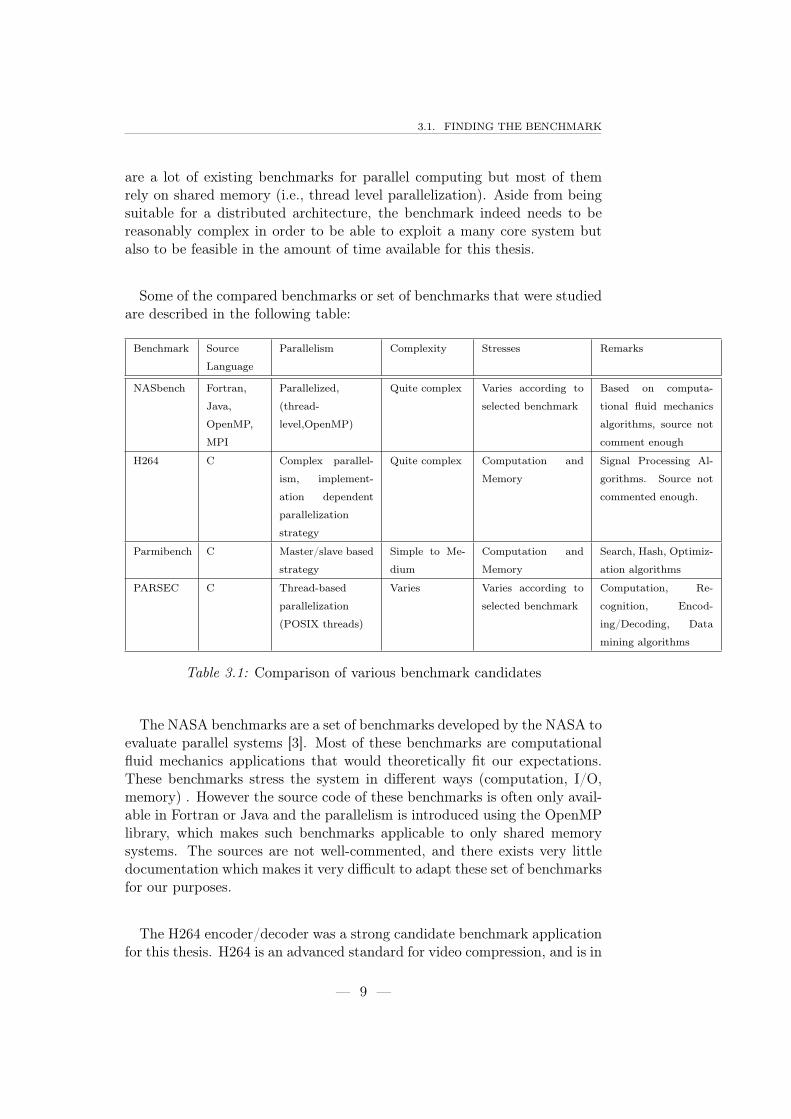
Some of the compared benchmarks or set of benchmarks that were studiedare described in the following table:
Benchmark Source
Language
Parallelism Complexity Stresses Remarks
NASbench Fortran,
Java,
OpenMP,
MPI
Parallelized,
(thread-
level,OpenMP)
Quite complex Varies according to
selected benchmark
Based on computa-
tional fluid mechanics
algorithms, source not
comment enough
H264 C Complex parallel-
ism, implement-
ation dependent
parallelization
strategy
Quite complex Computation and
Memory
Signal Processing Al-
gorithms. Source not
commented enough.
Parmibench C Master/slave based
strategy
Simple to Me-
dium
Computation and
Memory
Search, Hash, Optimiz-
ation algorithms
PARSEC C Thread-based
parallelization
(POSIX threads)
Varies Varies according to
selected benchmark
Computation, Re-
cognition, Encod-
ing/Decoding, Data
mining algorithms
Table 3.1: Comparison of various benchmark candidates
The NASA benchmarks are a set of benchmarks developed by the NASA toevaluate parallel systems [3]. Most of these benchmarks are computationalfluid mechanics applications that would theoretically fit our expectations.These benchmarks stress the system in different ways (computation, I/O,memory) . However the source code of these benchmarks is often only avail-able in Fortran or Java and the parallelism is introduced using the OpenMPlibrary, which makes such benchmarks applicable to only shared memorysystems. The sources are not well-commented, and there exists very littledocumentation which makes it very difficult to adapt these set of benchmarksfor our purposes.
The H264 encoder/decoder was a strong candidate benchmark applicationfor this thesis. H264 is an advanced standard for video compression, and is in
— 9 —
CHAPTER 3. BENCHMARK DEVELOPMENT
wide use today, see [4]. For example, this standard is used to compress videosfor the blue-ray disc format. Real-world applications, and non-trivial compu-tational requirements make the H264 an interesting benchmark. Further, adistributed implementation allows evaluating video compression speeds andrelated metrics on a variety of multicore and unicore platforms.
However a few problems make it difficult to use this benchmark for thecurrent thesis. First, the method to parallelize the application is not entirelyclear, many different approaches exist [5][6][7]. Parallelism can be introducedat different levels of the computation. Frame processing or macro-blockprocessing are two steps that can be parallelized (but not both at the sametime). Each choice having its benefits and drawbacks. These techniquesare also not indefinitely scalable, the number of worker being limited bythe complex dependency between the encoding of different frames/blocks.Moreover both the encoder and the decoder are very complex and adaptingone of them in the course of the thesis was not really feasible.
Parmibench is a set of parallel benchmarks developed by [8] . Most of thesebenchmarks are in fact quite simple algorithms which are commonly used.The code source is fully available. However the parallelization technique usedis not very interesting for our benchmarks: it is mainly done by a masterprocess that segments data and distributes it to workers that are all alike.
PARSEC [9] is the last set of benchmarks that will be described here. Itwas developed at Princeton University’s Computer Science Department. Theentire source code of all benchmarks in the suite is available. The benchmarksproposed in this suite are of very varying complexity. The simplest onecomputes the price of financial options according to the Blackscholes formula[10], and is commonly used in financial applications. This application isinteresting because the speed of computations can have a major impact onthe financial markets. However the blackscholes algorithm is too simple to beused as a benchmark. Another interesting benchmark in the PARSEC suiteis called Ferret and is used to find images based on content similarity. Ferrethas applications in comparing, for instance, a database of fingerprints to asample, or image-search (such as Google’s image-search) where the searchengine tries to find images similar to the one specified as an input. Ferretis reasonably complex, and could be very well adapted to our framework.However it needs to be interfaced with a specific database that would bedifficult to integrate in our application and would hurt its portability.
The benchmark that was finally chosen for this thesis is part of PARSEC.It is a deduplication algorithm. This program processes a stream of data andtries to detect redundancy in the data stream. If any redundancy is detected,
— 10 —
3.2. THE DEDUPLICATION APPLICATION
deduplication attempts to remove it, without loosing any information, andthen attempts to compress this data. Thus, deduplication is useful for usein data centers, allowing storage space to be freed by avoiding to storage ofredundant information [11].This application is very interesting because it can be easily split into differentsteps, and can be also very easily parallelized. It can also be used on workingset of arbitrary size so that it is possible to scale the input to match the kindof system that has to be benchmarked.
3.2 The Deduplication application
The Deduplication application is used to remove redundancy in an inputstream. The application fragments input data and recognizes identical seg-ments in it. Non duplicated parts are compressed into the output whereassimple references are written for the duplicated parts.
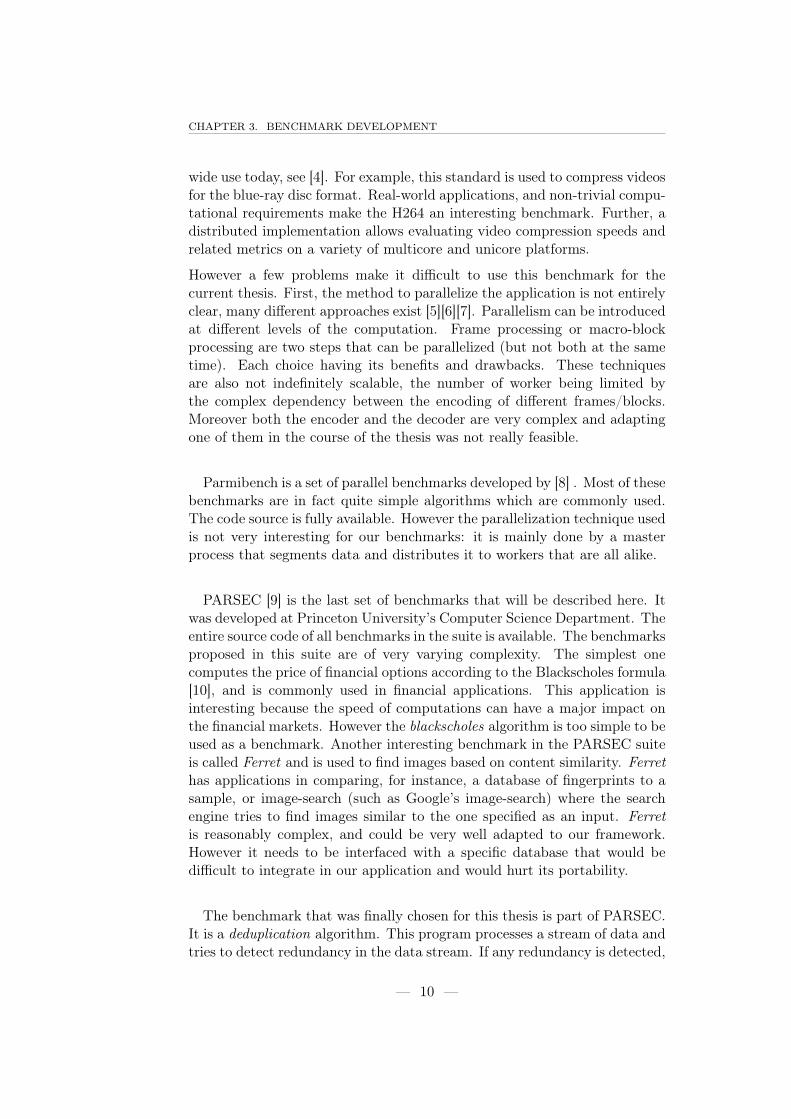
The application consists of six different processes. Fig 3.1 shows the net-work for a two pipelines architecture. The data is split by the application inchunks. Processes then only communicate these chunks that are processedstep by step as they go through the application.
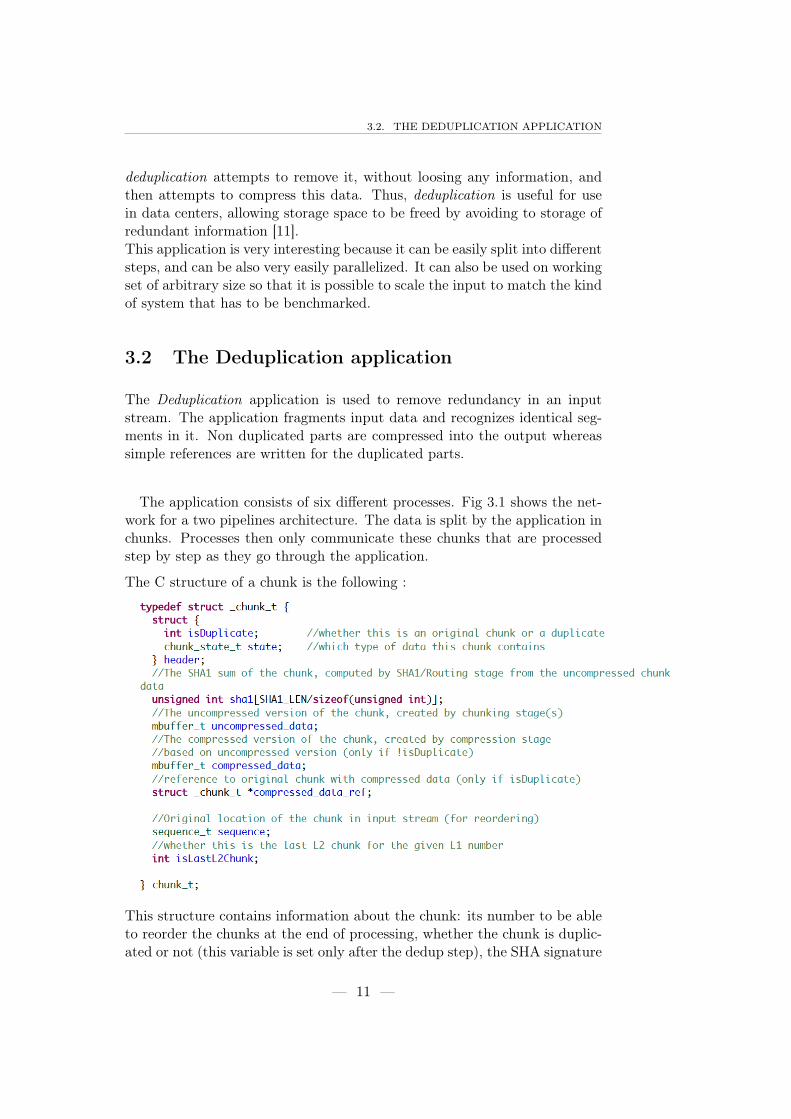
The C structure of a chunk is the following :
This structure contains information about the chunk: its number to be ableto reorder the chunks at the end of processing, whether the chunk is duplic-ated or not (this variable is set only after the dedup step), the SHA signature
— 11 —

CHAPTER 3. BENCHMARK DEVELOPMENT
of the chunk and the pointer to the data of the chunk. These chunks aresent through three separate channels: one that sends the chunk meta data,e.g the previous structure, the second one sends the size of the data and thelast one sends the actual data. It is necessary to use a separate channel tocommunicate the size of the data since the MPI receiver needs to know howmany bytes it has to read.
1
2
3
4
5
6
1
2
3
4
5
6
1
2
3
8 7
4
5
6
1
2
3
4
5
6
1
2
3
4
5
6
Fragment
Fragment_refine
1
2
3
4
5
6
Fragment_refine
Dedup
1
2
3
8 7
4
5
6
Dedup
Compress
1
2
3
4
5
6
Compress
Reorder_W
12
34
MHash
100001
102323
Tag
Channel ID
Chunk data
Data size
Chunk metadata
100102
100203
100304
100405
100506
1
2 3 5
6
987
4
200304
200405
200506
700304
700405
700506
300304
300405
300506
300607
800304
800405
800506
800607400104
400002
400304
400405
400506
900304
900405
900506
Rankx
Figure 3.1: Dedup, Process network of the deduplication application.
The first two processes are Fragment and Fragment_refine. The role ofthese processes is to :
• Read data
• Split it in chunks
• Annotate them to keep track of their order
To split data, these processes try to find specific breakpoints using rabinfingerprints [12].
— 12 —
3.2. THE DEDUPLICATION APPLICATION
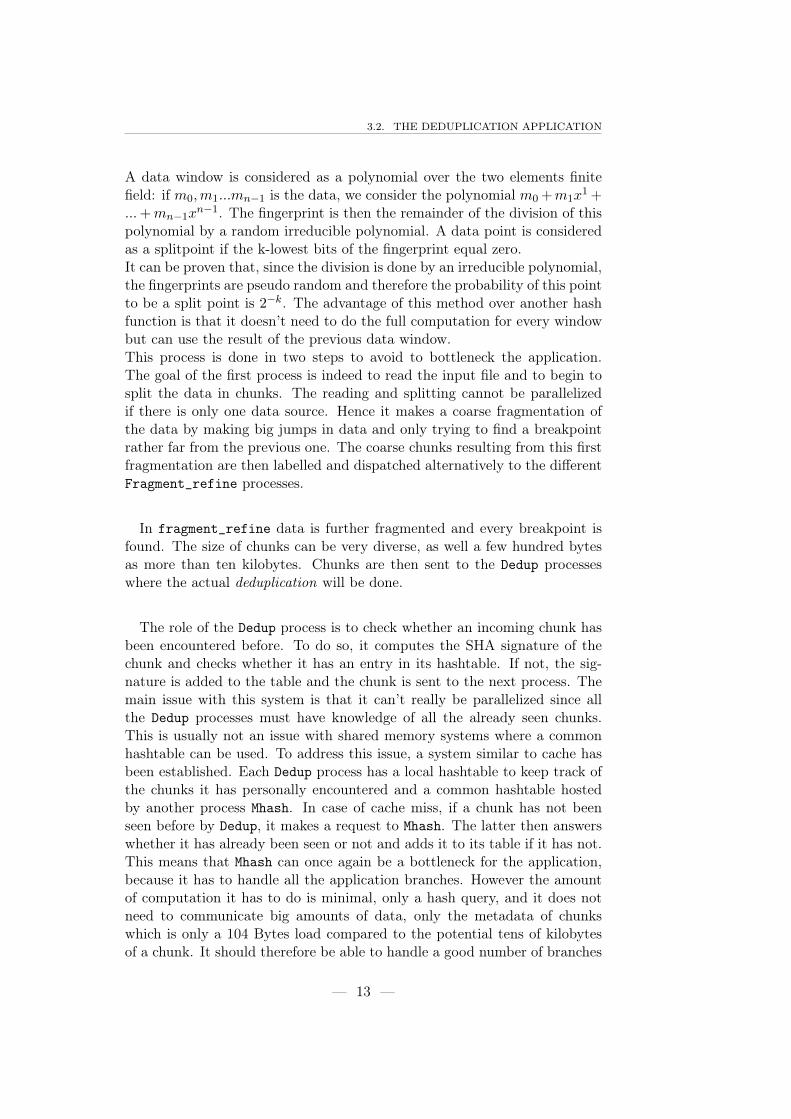
A data window is considered as a polynomial over the two elements finitefield: if m0,m1...mn−1 is the data, we consider the polynomial m0+m1x
1+...+mn−1x
n−1. The fingerprint is then the remainder of the division of thispolynomial by a random irreducible polynomial. A data point is consideredas a splitpoint if the k-lowest bits of the fingerprint equal zero.It can be proven that, since the division is done by an irreducible polynomial,the fingerprints are pseudo random and therefore the probability of this pointto be a split point is 2−k. The advantage of this method over another hashfunction is that it doesn’t need to do the full computation for every windowbut can use the result of the previous data window.This process is done in two steps to avoid to bottleneck the application.The goal of the first process is indeed to read the input file and to begin tosplit the data in chunks. The reading and splitting cannot be parallelizedif there is only one data source. Hence it makes a coarse fragmentation ofthe data by making big jumps in data and only trying to find a breakpointrather far from the previous one. The coarse chunks resulting from this firstfragmentation are then labelled and dispatched alternatively to the differentFragment_refine processes.
In fragment_refine data is further fragmented and every breakpoint isfound. The size of chunks can be very diverse, as well a few hundred bytesas more than ten kilobytes. Chunks are then sent to the Dedup processeswhere the actual deduplication will be done.
The role of the Dedup process is to check whether an incoming chunk hasbeen encountered before. To do so, it computes the SHA signature of thechunk and checks whether it has an entry in its hashtable. If not, the sig-nature is added to the table and the chunk is sent to the next process. Themain issue with this system is that it can’t really be parallelized since allthe Dedup processes must have knowledge of all the already seen chunks.This is usually not an issue with shared memory systems where a commonhashtable can be used. To address this issue, a system similar to cache hasbeen established. Each Dedup process has a local hashtable to keep track ofthe chunks it has personally encountered and a common hashtable hostedby another process Mhash. In case of cache miss, if a chunk has not beenseen before by Dedup, it makes a request to Mhash. The latter then answerswhether it has already been seen or not and adds it to its table if it has not.This means that Mhash can once again be a bottleneck for the application,because it has to handle all the application branches. However the amountof computation it has to do is minimal, only a hash query, and it does notneed to communicate big amounts of data, only the metadata of chunkswhich is only a 104 Bytes load compared to the potential tens of kilobytesof a chunk. It should therefore be able to handle a good number of branches
— 13 —
CHAPTER 3. BENCHMARK DEVELOPMENT
before actually slowing down the application.The metadata of the chunk is annotated depending on whether it is a du-plicate or not. The chunk can then be sent to the next process, Compress.
The role of compress is simply to compress the incoming chunk in order tospare a maximum of space. The compression method that was chosen hereis a simple zip compression. A chunk is however compressed only if it is nota duplicate. The compressed (or not compressed if not necessary) data isthen sent to the last process, Reorder_W.
The last process reorders the chunks that do not necessarily come in orderbecause of the different branches of the application. When a chunk is read bythe process, the process checks whether it is the next to be written dependingon what is its sequence and what was the previous chunk written. If it isnot the next chunk, it is put in a search tree. If it is the next chunk, it iswritten in the output file and the process checks if the next one is also inthe search tree. Once all the chunks available are written, the process triesto read a new chunk again.This process writes the compressed data in the output file if the chunk is notduplicated and only writes its SHA signature if the chunk is duplicated.
It can be noted that with this architecture it is possible to obtain inthe output file a SHA signature before the original has been written. Twoidentical chunks can indeed be processed out of order and in that case the lastwill be treated as an original whereas the first will be considered a duplicate.For the first one only a signature will be written and the next occurrencewill be compressed. This possibility is not incorrect but must be taken intoaccount by the corresponding decoder.
A few key parameters are of note for the configuration of the application:
• MAXBUF : size of input buffer loaded at a time by Fragment. Thisvariable is defined in dedupdef.h.
• ANCHOR_JUMP : minimum size of the coarse chunk defined by Fragment.This variable is defined in dedupdef.h
• rabinmask : defines the value that the lower bits of the rabin finger-prints have to take to define a breakpoint. This variable is defined inrabin.h
— 14 —
4Benchmark
4.1 Measurement libraries
Once a benchmark is adopted for use in the DAL framework, the essentialstep of introducing appropriate instrumentation in order to extract variousperformance parameters must be completed. The instrumentation must becarefully done in order to collect accurate information about various met-rics of interest (computation times, communication size) as each processexecutes.
The instrumentation step was carried out both in the PC-cluster environ-ment, as well as on the Intel SCC. Such an arrangement allows us to cross-compare the results from both environments, and derive conclusions aboutcapabilities of both setups.
4.1.1 Performance Measurement on a PC-Cluster
Timing
For the case of a PC-cluster, Performance API, (PAPI) library ([13]) wasused. This library utilizes hardware-counters in the processor to keep anaccurate track of a range of events as well as time. PAPI’s application pro-gramming interface allows a user to select the events of interest. Once a se-lection of interesting events to monitor has been made, the library providesfunctions to access values recorded in hardware counters (such as number
— 15 —
CHAPTER 4. BENCHMARK
of L1 cache misses, between two known points in the software code). Thecounters used for the PC-cluster were the following:
• TotalCycles : Number of machine cycles elapsed between two pointsof the process.
• Instructions completed : Number of instruction completed by the pro-cess.
• Hardware Interrupts : Number of times the process has been interrup-ted by the Operating System (OS).
• L1 Data Cache Misses : Number of cache misses of the first level cache.
• Real Time : Time elapsed between two points of the process.
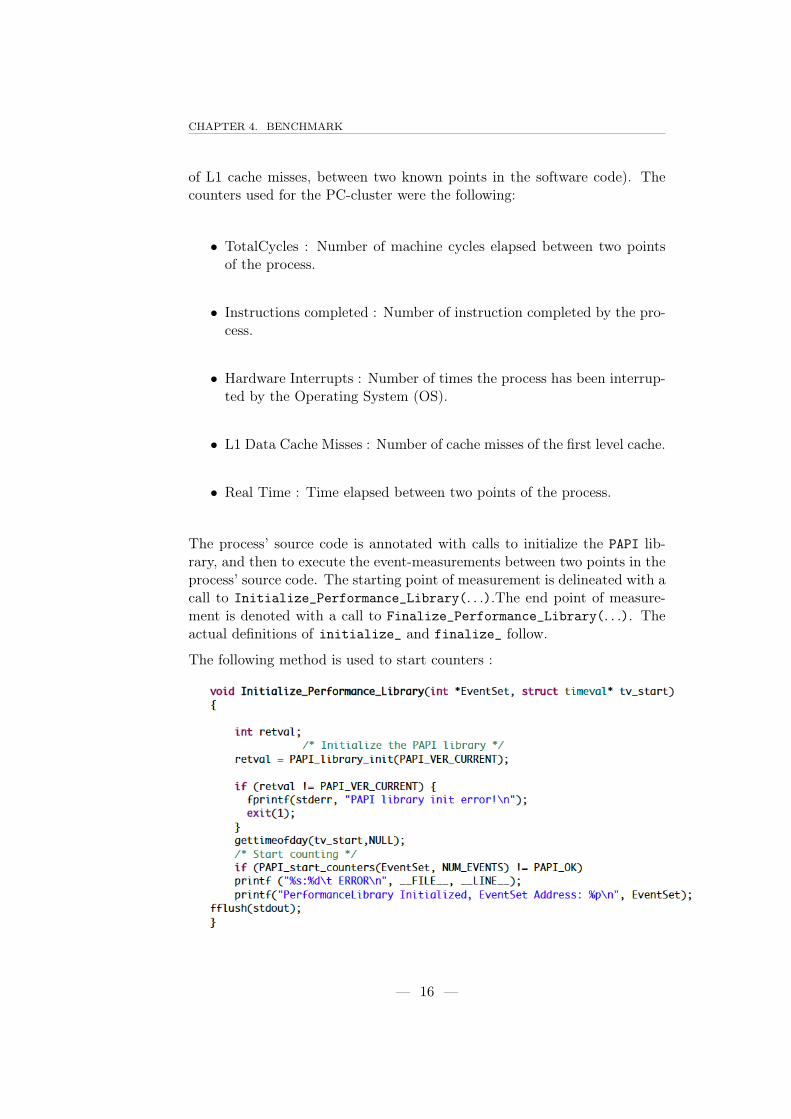
The process’ source code is annotated with calls to initialize the PAPI lib-rary, and then to execute the event-measurements between two points in theprocess’ source code. The starting point of measurement is delineated with acall to Initialize_Performance_Library(. . .).The end point of measure-ment is denoted with a call to Finalize_Performance_Library(. . .). Theactual definitions of initialize_ and finalize_ follow.
The following method is used to start counters :
— 16 —
4.1. MEASUREMENT LIBRARIES
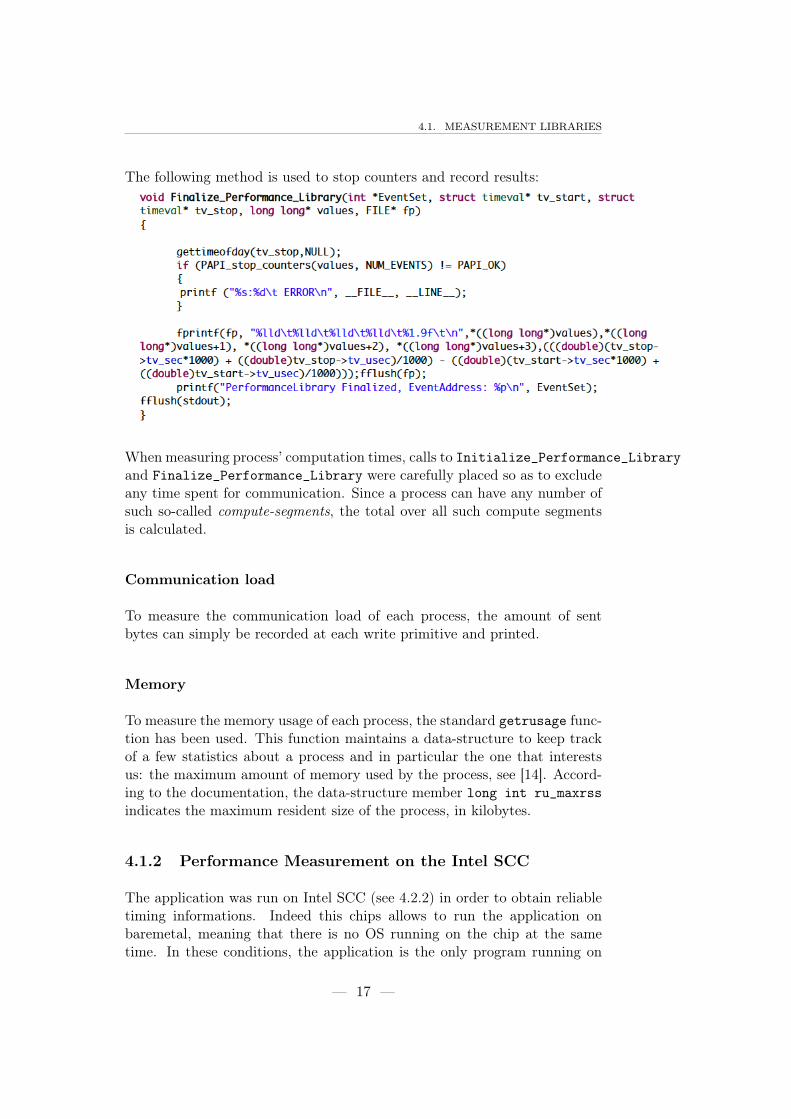
The following method is used to stop counters and record results:
When measuring process’ computation times, calls to Initialize_Performance_Libraryand Finalize_Performance_Library were carefully placed so as to excludeany time spent for communication. Since a process can have any number ofsuch so-called compute-segments, the total over all such compute segmentsis calculated.
Communication load
To measure the communication load of each process, the amount of sentbytes can simply be recorded at each write primitive and printed.
Memory
To measure the memory usage of each process, the standard getrusage func-tion has been used. This function maintains a data-structure to keep trackof a few statistics about a process and in particular the one that interestsus: the maximum amount of memory used by the process, see [14]. Accord-ing to the documentation, the data-structure member long int ru_maxrssindicates the maximum resident size of the process, in kilobytes.
4.1.2 Performance Measurement on the Intel SCC
The application was run on Intel SCC (see 4.2.2) in order to obtain reliabletiming informations. Indeed this chips allows to run the application onbaremetal, meaning that there is no OS running on the chip at the sametime. In these conditions, the application is the only program running on
— 17 —

CHAPTER 4. BENCHMARK
the chip. There are no interferences with other programs that could causeinterruptions. There is also no other application using the cache memorythat could modify the behavior of the application. Processes also run onseparate tiles on the chip (see 4.2.2), so that we can be assured that thereare no cache interference between different processes of the application (Iftwo processes run on the same tile, they both use some common cache).Simple recordings of the clock cycles of the chip give precise and reliabletiming information about the execution of the application.
— 18 —

4.2. BENCHMARK RESULTS
4.2 Benchmark Results
4.2.1 PC Cluster
The first set of numbers that have been measured have been on a PCcluster. It is not possible to get reliable timing on a PC cluster. First thecommunication is quite slow compared to communication between processorson a single chip. Also these PC are running many different threads at thesame time and so depending on how busy the PC is during execution, thebenchmark might give different results. But other metrics are still valid.Therefore only communication load, memory usage and number of hardwarecycles spent by the process have been measured.
Communication load as well as machine cycles should evolve in a ratherlinear fashion as functions of the input file size. Experiments have beenconducted with different input file size up to 1MB. Bigger input files are ofcourse possible. However the speed of the PC cluster communications wassuch that a 10 MB input would take a long time to complete.
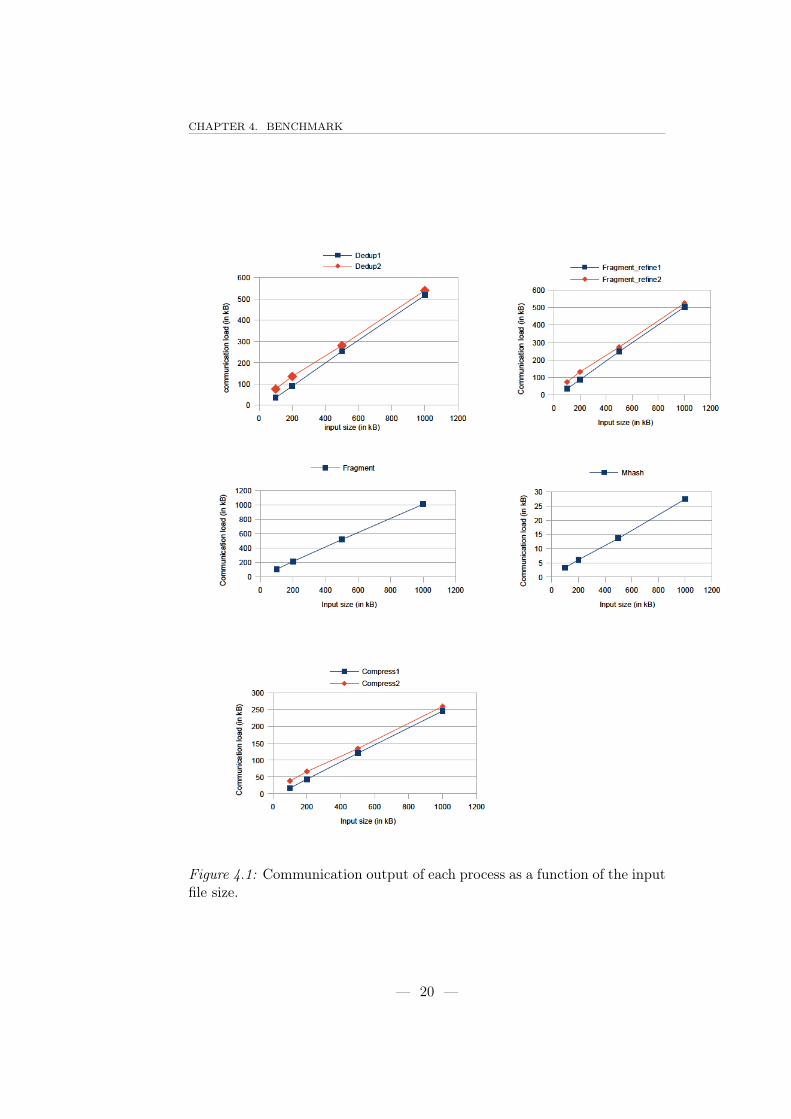
One can observe in fig 4.1 that the amount of data communicated byevery process evolves linearly with the input file size. This is what onewould expect since every process has to go through data in a linear fashionand that the number of chunks is linear with the size of the input file. It isalso possible to see that the amount of communication is much lower for theMhash process simply because it only forwards the chunks meta data that isabout a hundred bytes big.
The difference between two similar process (for instance between Dedup1and Dedup2) is due to the granularity of the load repartition. As explainedbefore, the first process makes big chunks (that can be as big as our architec-ture allows it) and distributes it to the second layer of processes. The defaultsettings of the original benchmark was of 2MB. For the purpose of this study,it was greatly reduced (to about 30 kB) to be able to distribute data acrossboth the application branches. It still gives significative difference betweenthe branch that was served first and the other one (it can also be an almostzero difference if they have been served the same number of times).
— 19 —
CHAPTER 4. BENCHMARK
Figure 4.1: Communication output of each process as a function of the inputfile size.
— 20 —
4.2. BENCHMARK RESULTS
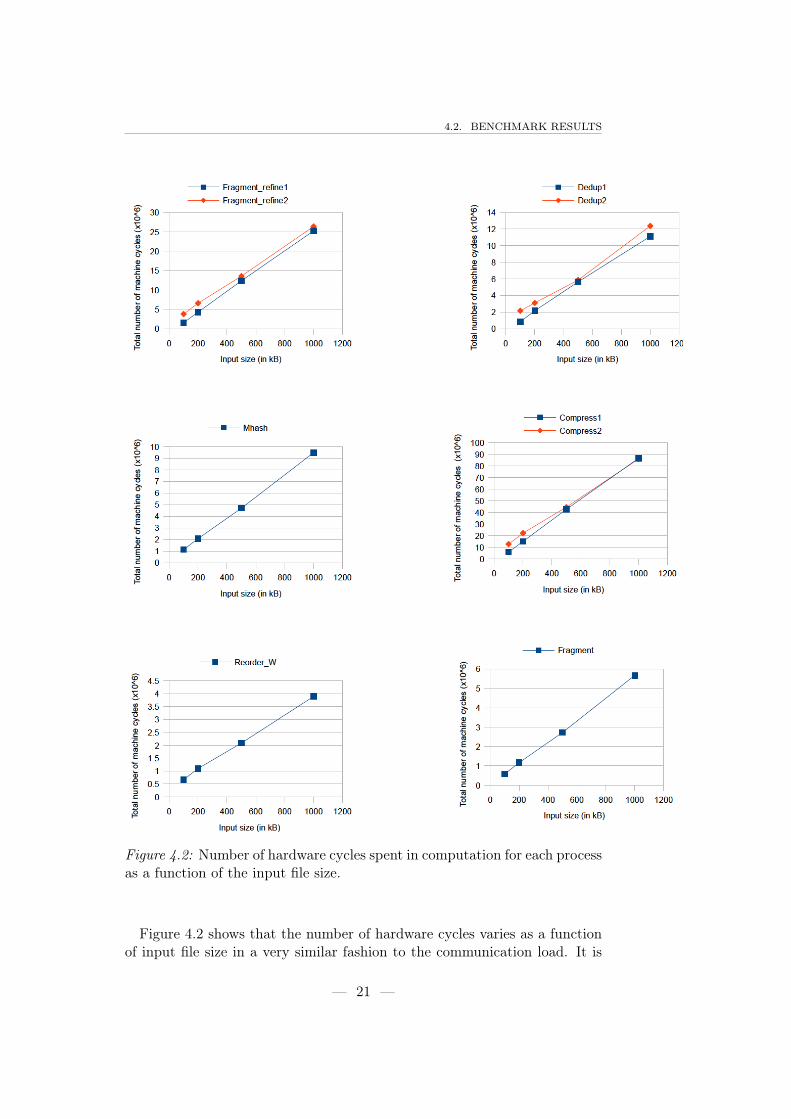
Figure 4.2: Number of hardware cycles spent in computation for each processas a function of the input file size.
Figure 4.2 shows that the number of hardware cycles varies as a functionof input file size in a very similar fashion to the communication load. It is
— 21 —

CHAPTER 4. BENCHMARK
relatively natural because the amount of cycle spent by chunk is constant inaverage. These measurements are based on single runs.
Figure 4.3: Average spent hardware cycles per byte.
Figure 4.3 shows the number of cycles the application needs in average tocompute one byte of data. This graph shows that the compression stage isby far the one that takes the most computation. Then comes in second thefine fragmentation. Third is the deduplication (because of the SHA signaturecalculation). Last are the non-parallelized processes. These confirms thatfurther parallelization should be possible. It is also possible to further reducethe computation time per byte for Fragment by making bigger chunks at thefirst stage. There are also solutions to parallelize Mhash if it becomes reallynecessary.
— 22 —
4.2. BENCHMARK RESULTS
4.2.2 Intel SCC
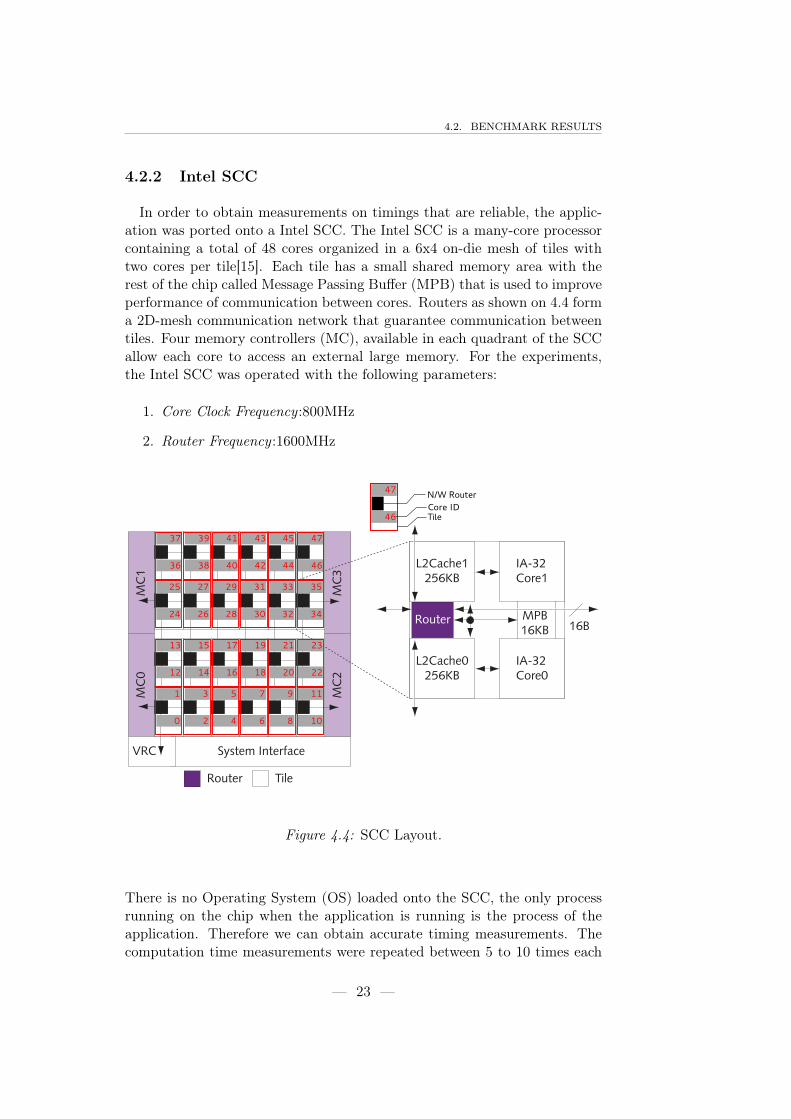
In order to obtain measurements on timings that are reliable, the applic-ation was ported onto a Intel SCC. The Intel SCC is a many-core processorcontaining a total of 48 cores organized in a 6x4 on-die mesh of tiles withtwo cores per tile[15]. Each tile has a small shared memory area with therest of the chip called Message Passing Buffer (MPB) that is used to improveperformance of communication between cores. Routers as shown on 4.4 forma 2D-mesh communication network that guarantee communication betweentiles. Four memory controllers (MC), available in each quadrant of the SCCallow each core to access an external large memory. For the experiments,the Intel SCC was operated with the following parameters:
1. Core Clock Frequency :800MHz
2. Router Frequency :1600MHz
0
1
2
3
4
5
6
7
8
9
10
11
12
13
14
15
16
17
18
19
20
21
22
23
24
25
26
27
28
29
30
31
32
33
34
35
36
37
38
39
40
41
42
43
44
45
46
47
46
47
46
47
46
47
TileCore IDN/W Router
Figure 4.4: SCC Layout.
There is no Operating System (OS) loaded onto the SCC, the only processrunning on the chip when the application is running is the process of theapplication. Therefore we can obtain accurate timing measurements. Thecomputation time measurements were repeated between 5 to 10 times each
— 23 —
CHAPTER 4. BENCHMARK
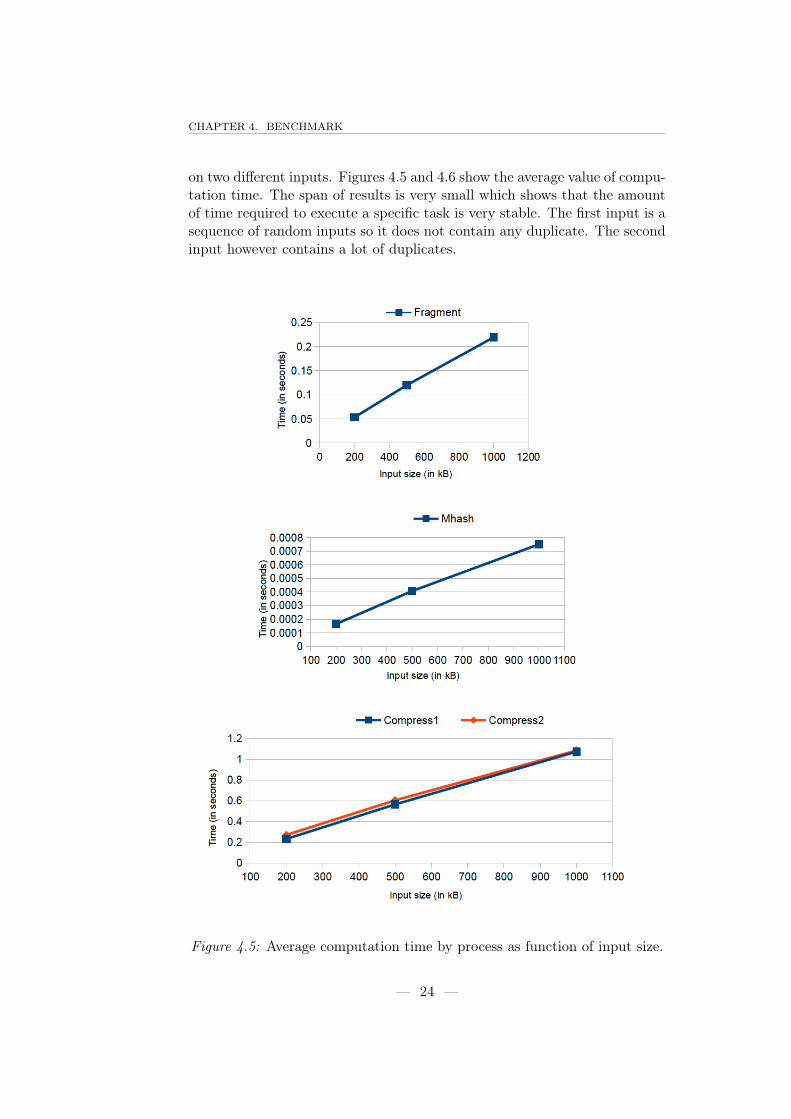
on two different inputs. Figures 4.5 and 4.6 show the average value of compu-tation time. The span of results is very small which shows that the amountof time required to execute a specific task is very stable. The first input is asequence of random inputs so it does not contain any duplicate. The secondinput however contains a lot of duplicates.
Figure 4.5: Average computation time by process as function of input size.
— 24 —
4.2. BENCHMARK RESULTS
Figure 4.6: Average computation time by process as function of input size.
We can see on fig 4.5 and fig 4.6 that once again timing evolve in a verylinear fashion with the input size. What changes significantly however is theratio of time usage spent for each process. The compression stage is evenmore prominent than before and the Mhash and Reorder stages take almostnegligible time to complete. The fragmentation process performance can beimproved by increasing the coarse chunk size but its performances will alwaybe limited by the time it needs to load data from memory.
— 25 —

CHAPTER 4. BENCHMARK
Figure 4.7: Average computation time for compression with duplicated in-put.
When using a duplicated input, the results are very similar to those of therandom input. The only process that behaves differently is the compressionprocess as shown in fig 4.7. Computation time does not increase linearly.Its increase depends on the amount of new data that is discovered since forduplicated data the compression stage is skipped. It can also decrease forone branch depending on what branch of the application discovers the datafirst.
— 26 —
5Conclusion and Outlook
5.1 Conclusion
This semester thesis proposed a comparative study of existing parallelbenchmarks, the development of a deduplication application for many-corearchitectures in the context of the DOL framework as well as the result of afew benchmarking runs of the application on a PC cluster and an Intel SCC.
This study has shown that the deduplication application is a viable choicefor benchmarking a many-core architecture because it can be strongly par-allelized in a non homogenous fashion (6 different types of process) and cansupport very big input load. The benchmarking runs are also a proof thatthis application can be used to benchmark very diverse architectures, froma PC cluster to a Single-chip Cloud Computer.
5.2 Outlook
There are several possibilities to improve and extend the current imple-mentation. First of all the question of the scalability of the application to avery big number of cores (more than 20-30) still needs to be fully addressed.A few improvement could be added to ensure the possibility to work withmore processes. If the Mhash process were to saturate, it could be split in afew other Mhash that would process chunks depending on a few bits of theirSHA signature. The Reorder and Fragment to saturate, the size of coarse
— 27 —

CHAPTER 5. CONCLUSION AND OUTLOOK
chunks could be increased. It would also be possible to process separateinput files at the same time using the same core application and Reorderthem separately.
Moreover other metrics could be monitored by the application and a com-parative study of its performance depending on mapping onto the Intel SCCwould provide additional insight on the subject.
— 28 —
AList of Acronyms
API Application Programming InterfaceDOL Distributed Operation LayerFIFO First-In First-OutIntel SCC Intel Single-chip Cloud ComputerI/O Input/OutputKPN Kahn Process NetworkMPB Message Passsing BufferMPI Message Passing InterfaceNASA National Aeronautics and Space AdministrationOS Operating SystemPAPI Performance Application Programming InterfacePC Personal ComputerSHA Secure Hash AlgorithmXML Extensible Markup Language
— 29 —

BPresentation Slides
— 30 —

IntroductionBenchmark
Benchmark results
Designing Benchmarksfor High Performance Systems
Pierre Ferry
Advisors: Devendra Rai, Lars Schor
Computer Engineering Group TECProf. L.Thiele
Semester Thesis
February 6th, 2013
1 / 33
IntroductionBenchmark
Benchmark results
Problem descriptionContribution
Introduction
1 IntroductionProblem descriptionContribution
2 Benchmark
3 Benchmark results
2 / 33
IntroductionBenchmark
Benchmark results
Problem descriptionContribution
Problem description
How to compare the performance of multi/many core systems ?
Very different architectures
Many performance parameters exist
3 / 33
IntroductionBenchmark
Benchmark results
Problem descriptionContribution
Contribution
Comparative study of existing parallel benchmarks suited forhigh performance processing
Splitting of each application into multiple tasks
Porting to Distributed Application Layer (DAL)
For SCC: Baremetal Specific Design of Communication Layer
Benchmarks on PC cluster and Intel SCC
4 / 33
IntroductionBenchmark
Benchmark results
Benchmark selectionSHA applicationDeduplication applicationPerformance measurements
Benchmark
1 Introduction
2 BenchmarkBenchmark selectionSHA applicationDeduplication applicationPerformance measurements
3 Benchmark results
5 / 33
IntroductionBenchmark
Benchmark results
Benchmark selectionSHA applicationDeduplication applicationPerformance measurements
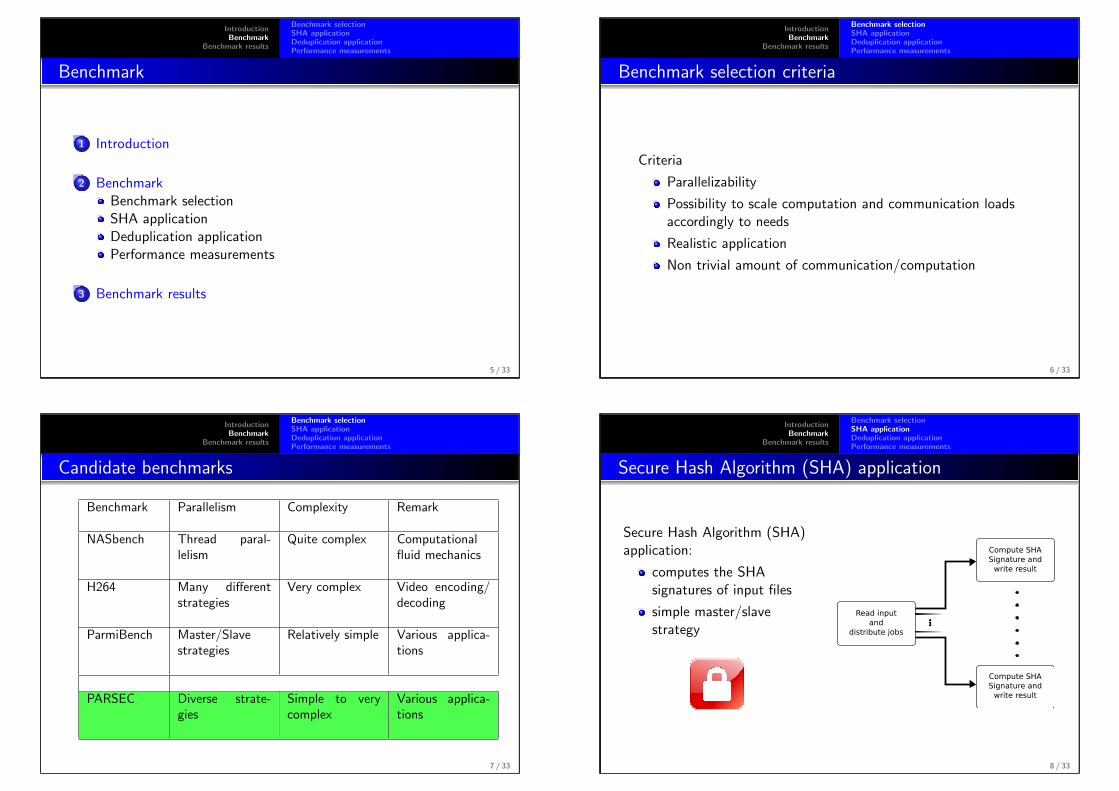
Benchmark selection criteria
Criteria
Parallelizability
Possibility to scale computation and communication loadsaccordingly to needs
Realistic application
Non trivial amount of communication/computation
6 / 33
IntroductionBenchmark
Benchmark results
Benchmark selectionSHA applicationDeduplication applicationPerformance measurements
Candidate benchmarks
Benchmark Parallelism Complexity Remark
NASbench Thread paral-lelism
Quite complex Computationalfluid mechanics
H264 Many differentstrategies
Very complex Video encoding/decoding
ParmiBench Master/Slavestrategies
Relatively simple Various applica-tions
PARSEC Diverse strate-gies
Simple to verycomplex
Various applica-tions
7 / 33
IntroductionBenchmark
Benchmark results
Benchmark selectionSHA applicationDeduplication applicationPerformance measurements
Secure Hash Algorithm (SHA) application
Secure Hash Algorithm (SHA)application:
computes the SHAsignatures of input files
simple master/slavestrategy
Read input
and
distribute jobs
Compute SHA
Signature and
write result
Compute SHA
Signature and
write result
8 / 33
IntroductionBenchmark
Benchmark results
Benchmark selectionSHA applicationDeduplication applicationPerformance measurements
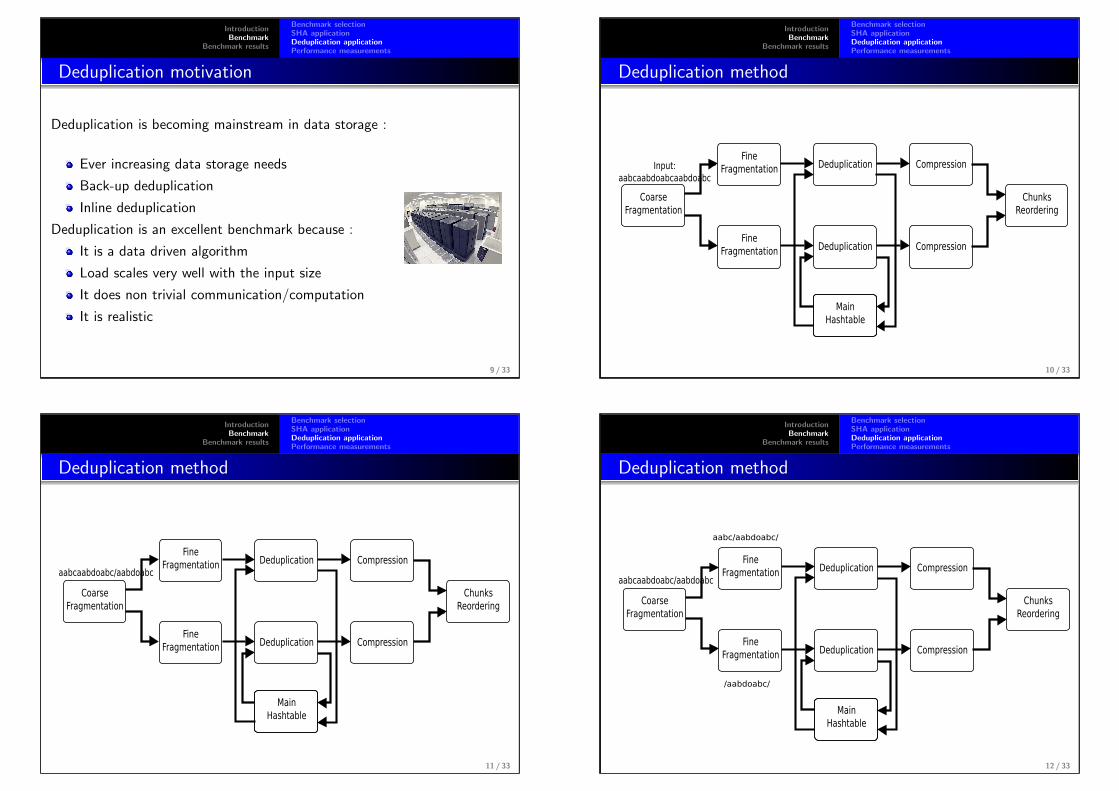
Deduplication motivation
Deduplication is becoming mainstream in data storage :
Ever increasing data storage needs
Back-up deduplication
Inline deduplication
Deduplication is an excellent benchmark because :
It is a data driven algorithm
Load scales very well with the input size
It does non trivial communication/computation
It is realistic
9 / 33
IntroductionBenchmark
Benchmark results
Benchmark selectionSHA applicationDeduplication applicationPerformance measurements
Deduplication method
Coarse
Fragmentation
Fine
Fragmentation
Fine
Fragmentation Deduplication
Deduplication Compression
Compression
Chunks
Reordering
Main
Hashtable
Input:
aabcaabdoabcaabdoabc
10 / 33
IntroductionBenchmark
Benchmark results
Benchmark selectionSHA applicationDeduplication applicationPerformance measurements
Deduplication method
Coarse
Fragmentation
Fine
Fragmentation
Fine
Fragmentation Deduplication
Deduplication Compression
Compression
Chunks
Reordering
Main
Hashtable
aabcaabdoabc/aabdoabc
11 / 33
IntroductionBenchmark
Benchmark results
Benchmark selectionSHA applicationDeduplication applicationPerformance measurements
Deduplication method
Coarse
Fragmentation
Fine
Fragmentation
Fine
Fragmentation Deduplication
Deduplication Compression
Compression
Chunks
Reordering
Main
Hashtable
aabcaabdoabc/aabdoabc
aabc/aabdoabc/
/aabdoabc/
12 / 33

IntroductionBenchmark
Benchmark results
Benchmark selectionSHA applicationDeduplication applicationPerformance measurements
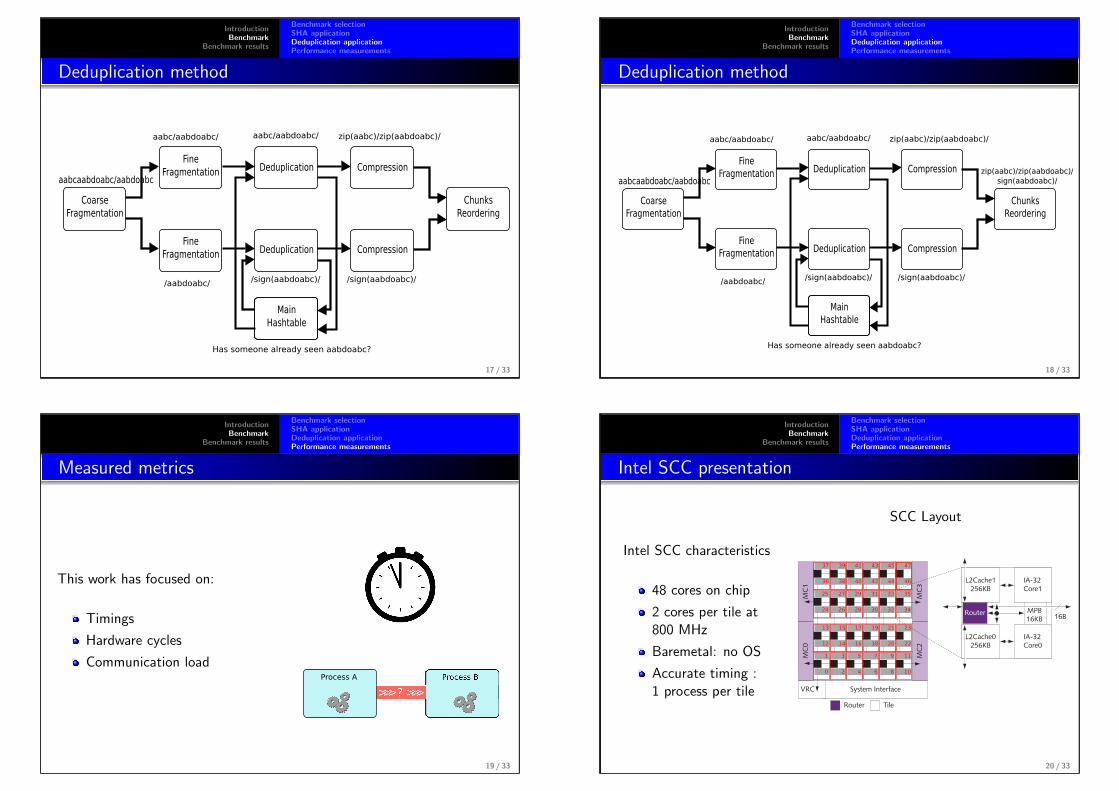
Deduplication method
Coarse
Fragmentation
Fine
Fragmentation
Fine
Fragmentation Deduplication
Deduplication Compression
Compression
Chunks
Reordering
Main
Hashtable
aabcaabdoabc/aabdoabc
aabc/aabdoabc/ aabc/aabdoabc/
/aabdoabc/
Has someone already seen aabdoabc?
13 / 33
IntroductionBenchmark
Benchmark results
Benchmark selectionSHA applicationDeduplication applicationPerformance measurements
Deduplication method
Chunk i Chunk i+1 Chunk i+2 Chunk i+3 Chunk i+4 Chunk i+5
SHA1(i) SHA1(i+1) SHA1(i+2) SHA1(i+3) SHA1(i+4) SHA1(i+5)
=Matching Signature duplicated chunks
14 / 33
IntroductionBenchmark
Benchmark results
Benchmark selectionSHA applicationDeduplication applicationPerformance measurements
Deduplication method
Coarse
Fragmentation
Fine
Fragmentation
Fine
Fragmentation Deduplication
Deduplication Compression
Compression
Chunks
Reordering
Main
Hashtable
aabcaabdoabc/aabdoabc
aabc/aabdoabc/ aabc/aabdoabc/
/aabdoabc/
Has someone already seen aabdoabc?
zip(aabc)/zip(aabdoabc)/
15 / 33
IntroductionBenchmark
Benchmark results
Benchmark selectionSHA applicationDeduplication applicationPerformance measurements
Deduplication method
Coarse
Fragmentation
Fine
Fragmentation
Fine
Fragmentation Deduplication
Deduplication Compression
Compression
Chunks
Reordering
Main
Hashtable
aabcaabdoabc/aabdoabc
aabc/aabdoabc/ aabc/aabdoabc/
/aabdoabc//sign(aabdoabc)/
Has someone already seen aabdoabc?
zip(aabc)/zip(aabdoabc)/
16 / 33
IntroductionBenchmark
Benchmark results
Benchmark selectionSHA applicationDeduplication applicationPerformance measurements
Deduplication method
Coarse
Fragmentation
Fine
Fragmentation
Fine
Fragmentation Deduplication
Deduplication Compression
Compression
Chunks
Reordering
Main
Hashtable
aabcaabdoabc/aabdoabc
aabc/aabdoabc/ aabc/aabdoabc/
/aabdoabc//sign(aabdoabc)/
Has someone already seen aabdoabc?
zip(aabc)/zip(aabdoabc)/
/sign(aabdoabc)/
17 / 33
IntroductionBenchmark
Benchmark results
Benchmark selectionSHA applicationDeduplication applicationPerformance measurements
Deduplication method
Coarse
Fragmentation
Fine
Fragmentation
Fine
Fragmentation Deduplication
Deduplication Compression
Compression
Chunks
Reordering
Main
Hashtable
aabcaabdoabc/aabdoabc
aabc/aabdoabc/ aabc/aabdoabc/
/aabdoabc//sign(aabdoabc)/
Has someone already seen aabdoabc?
zip(aabc)/zip(aabdoabc)/
/sign(aabdoabc)/
zip(aabc)/zip(aabdoabc)/
sign(aabdoabc)/
18 / 33
IntroductionBenchmark
Benchmark results
Benchmark selectionSHA applicationDeduplication applicationPerformance measurements
Measured metrics
This work has focused on:
Timings
Hardware cycles
Communication loadProcess A
19 / 33
IntroductionBenchmark
Benchmark results
Benchmark selectionSHA applicationDeduplication applicationPerformance measurements
Intel SCC presentation
Intel SCC characteristics
48 cores on chip
2 cores per tile at800 MHz
Baremetal: no OS
Accurate timing :1 process per tile
SCC Layout
0
1
2
3
4
5
6
7
8
9
10
11
12
13
14
15
16
17
18
19
20
21
22
23
24
25
26
27
28
29
30
31
32
33
34
35
36
37
38
39
40
41
42
43
44
45
46
47
46
47
20 / 33
IntroductionBenchmark
Benchmark results
Benchmark selectionSHA applicationDeduplication applicationPerformance measurements
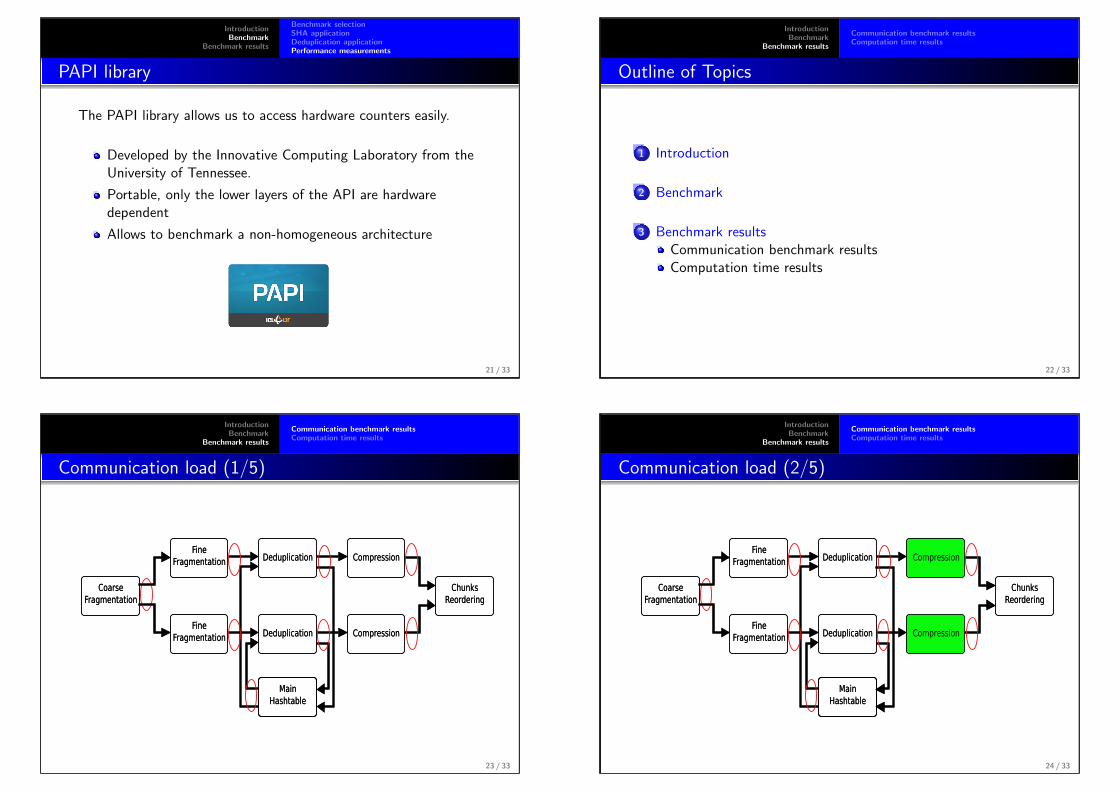
PAPI library
The PAPI library allows us to access hardware counters easily.
Developed by the Innovative Computing Laboratory from theUniversity of Tennessee.
Portable, only the lower layers of the API are hardwaredependent
Allows to benchmark a non-homogeneous architecture
21 / 33
IntroductionBenchmark
Benchmark results
Communication benchmark resultsComputation time results
Outline of Topics
1 Introduction
2 Benchmark
3 Benchmark resultsCommunication benchmark resultsComputation time results
22 / 33
IntroductionBenchmark
Benchmark results
Communication benchmark resultsComputation time results
Communication load (1/5)
Coarse
Fragmentation
Fine
Fragmentation
Fine
Fragmentation Deduplication
Deduplication Compression
Compression
Chunks
Reordering
Main
Hashtable
Coarse
Fragmentation
Fine
Fragmentation
Fine
Fragmentation Deduplication
Deduplication Compression
Compression
Chunks
Reordering
Main
Hashtable
23 / 33
IntroductionBenchmark
Benchmark results
Communication benchmark resultsComputation time results
Communication load (2/5)
Coarse
Fragmentation
Fine
Fragmentation
Fine
Fragmentation Deduplication
Deduplication Compression
Compression
Chunks
Reordering
Main
Hashtable
Coarse
Fragmentation
Fine
Fragmentation
Fine
Fragmentation Deduplication
Deduplication Compression
Compression
Chunks
Reordering
Main
Hashtable
24 / 33
IntroductionBenchmark
Benchmark results
Communication benchmark resultsComputation time results
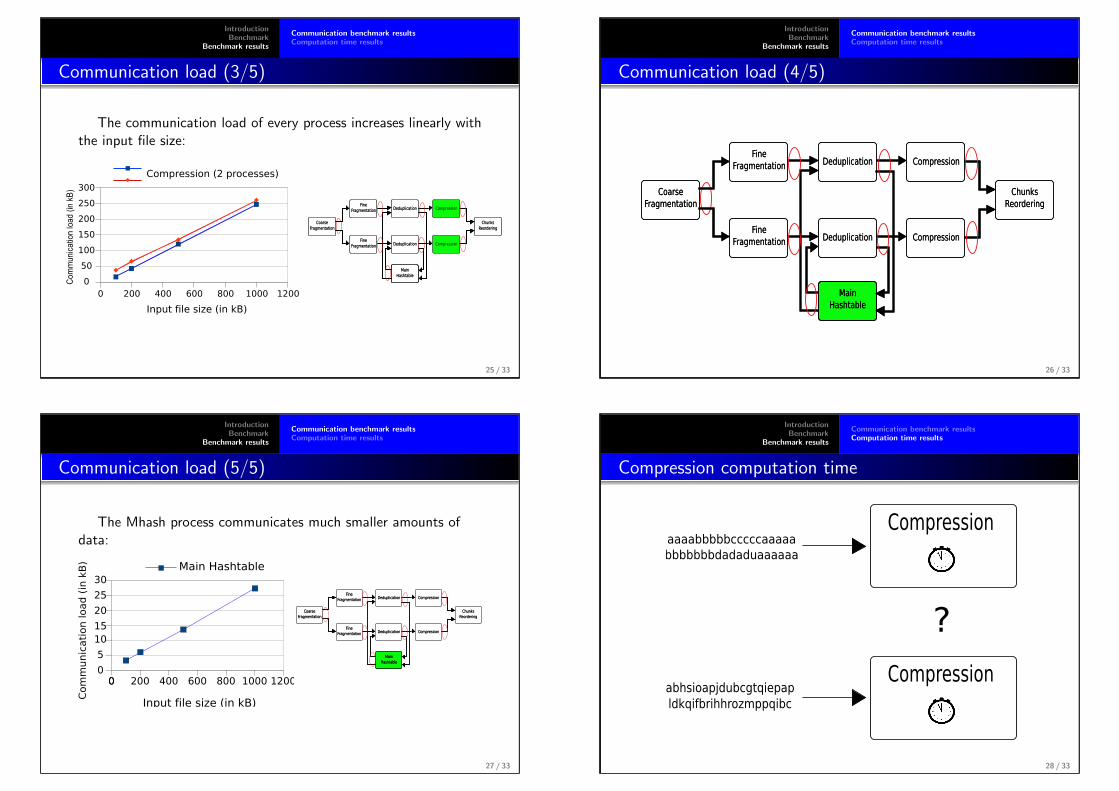
Communication load (3/5)
The communication load of every process increases linearly withthe input file size:
Communicationload(inkB)
00
Compression (2 processes)
0 200 400 600 800 1000 1200
300
250
200
150
100
50
0
Input file size (in kB)
Coarse
Fragmentation
Fine
Fragmentation
Fine
Fragmentation Deduplication
Deduplication Compression
Compression
Chunks
Reordering
Main
Hashtable
Coarse
Fragmentation
Fine
Fragmentation
Fine
Fragmentation Deduplication
Deduplication Compression
Compression
Chunks
Reordering
Main
Hashtable
25 / 33
IntroductionBenchmark
Benchmark results
Communication benchmark resultsComputation time results
Communication load (4/5)
Coarse
Fragmentation
Fine
Fragmentation
Fine
Fragmentation Deduplication
Deduplication Compression
Compression
Chunks
Reordering
Main
Hashtable
Coarse
Fragmentation
Fine
Fragmentation
Fine
Fragmentation Deduplication
Deduplication Compression
Compression
Chunks
Reordering
Main
Hashtable
26 / 33
IntroductionBenchmark
Benchmark results
Communication benchmark resultsComputation time results
Communication load (5/5)
The Mhash process communicates much smaller amounts ofdata:
Main Hashtable
Input file size (in kB)
0 200 400 600 800 1000 120000
5
10
15
20
25
30
Communicationload(inkB)
27 / 33
IntroductionBenchmark
Benchmark results
Communication benchmark resultsComputation time results
Compression computation time
Compression
Compression
aaaabbbbbcccccaaaaa
bbbbbbbdadaduaaaaaa
abhsioapjdubcgtqiepap
ldkqifbrihhrozmppqibc
?
28 / 33
IntroductionBenchmark
Benchmark results
Communication benchmark resultsComputation time results
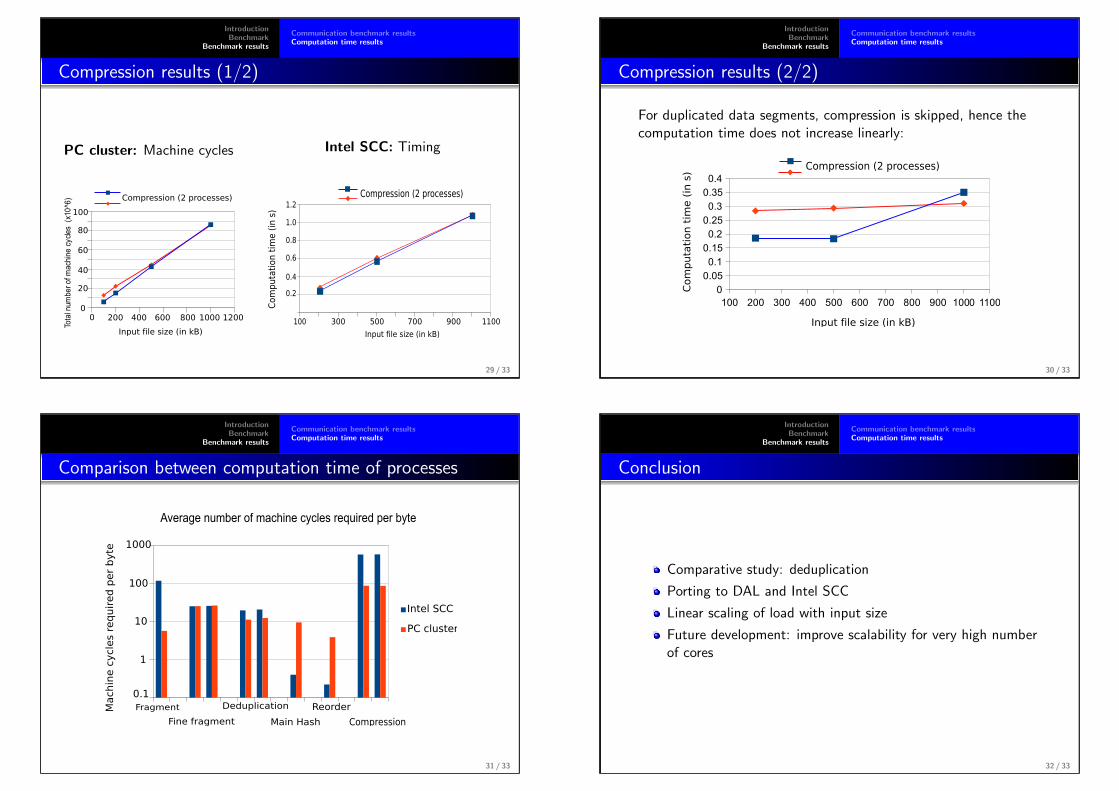
Compression results (1/2)
PC cluster: Machine cycles
Totalnumberofmachinecycles(x10^6)
0
200 400 600 800 1000 120000
20
40
60
80
100
Compression (2 processes)
Input file size (in kB)
Intel SCC: Timing
0
0
100 500 700 900 1100300
Compression (2 processes)
Input file size (in kB)
0.2
0.4
0.6
0.8
1.0
1.2
Com
puta
tion t
ime (
in s
)
29 / 33
IntroductionBenchmark
Benchmark results
Communication benchmark resultsComputation time results
Compression results (2/2)
For duplicated data segments, compression is skipped, hence thecomputation time does not increase linearly:
100 200 300 400 500 600 700 800 900 1000 1100
0
0.05
0.1
0.15
0.2
0.25
0.3
0.35
0.4
Compression (2 processes)
Input file size (in kB)
Com
puta
tion t
ime (
in s
)
30 / 33
IntroductionBenchmark
Benchmark results
Communication benchmark resultsComputation time results
Comparison between computation time of processes
Average number of machine cycles required per byte
Compression
ReorderDeduplication
Fine fragment
Fragment
0.1
1
10
100
1000
Machin
e c
ycle
s r
equir
ed p
er
byte
Intel SCC
PC cluster
Main Hash
31 / 33
IntroductionBenchmark
Benchmark results
Communication benchmark resultsComputation time results
Conclusion
Comparative study: deduplication
Porting to DAL and Intel SCC
Linear scaling of load with input size
Future development: improve scalability for very high numberof cores
32 / 33
IntroductionBenchmark
Benchmark results
Communication benchmark resultsComputation time results
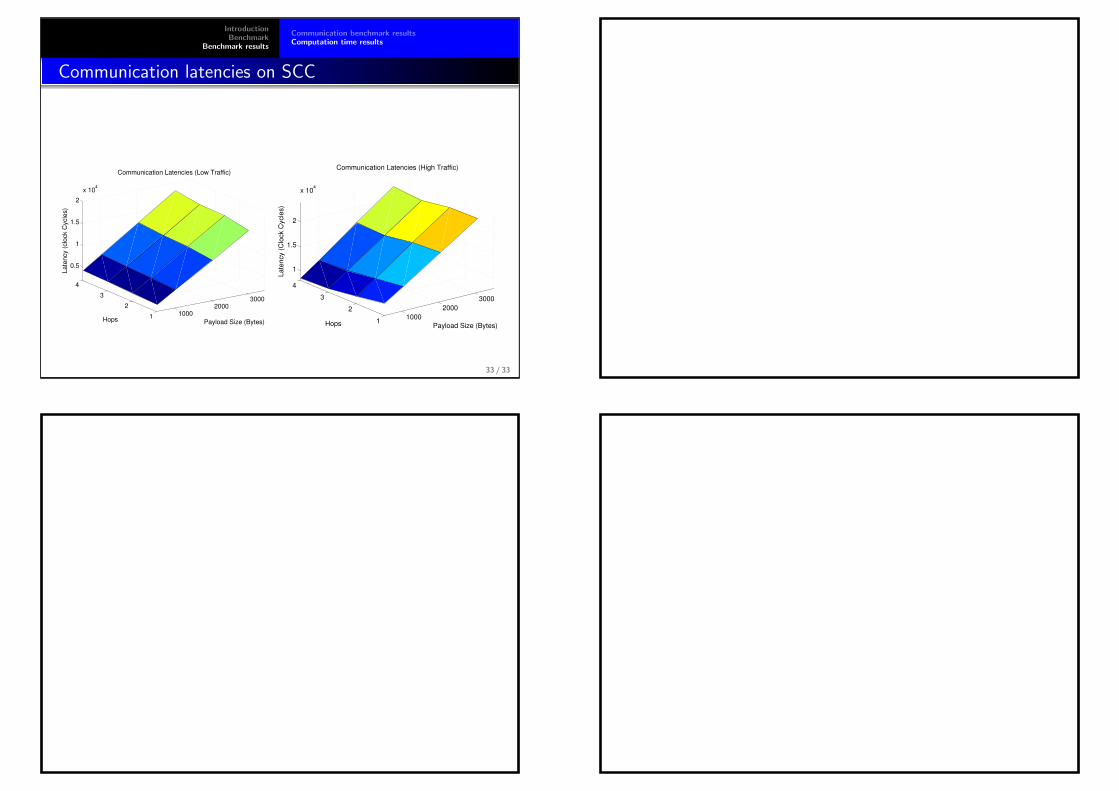
Communication latencies on SCC
10002000
3000
1
2
3
4
0.5
1
1.5
2
x 104
Payload Size (Bytes)
Communication Latencies (Low Traffic)
Hops
Late
ncy (
clo
ck C
ycle
s)
1000
2000
3000
1
2
3
4
1
1.5
2
x 104
Payload Size (Bytes)
Communication Latencies (High Traffic)
Hops
Late
ncy (
Clo
ck C
ycle
s)
33 / 33

APPENDIX B. PRESENTATION SLIDES
— 40 —
Bibliography
[1] G. Kahn, “The semantics of a simple language for parallelprogramming,” 1974.
[2] E. L. W. Gropp and A. Skjellum,Using MPI: Portable Parallel Programming with the Message Passing Interface,1999.
[3] D. Bailey, E. Barszcz, J. Barton, D. Browning, R. Carter, L. Dagum,R. Fatoohi, P. Frederickson, T. Lasinski, R. Schreiber et al., “The nasparallel benchmarks summary and preliminary results,” inSupercomputing, 1991. Supercomputing’91. Proceedings of the 1991ACM/IEEE Conference on. IEEE, 1991, pp. 158–165.
[4] “Information technology – Coding of audio-visual objects – Part 10:Advanced Video Coding,” 2012.
[5] A. Rodriguez, A. Gonzalez, and M. Malumbres, “Hierarchicalparallelization of an h. 264/avc video encoder,” in Parallel Computingin Electrical Engineering, 2006. PAR ELEC 2006. InternationalSymposium on. IEEE, 2006, pp. 363–368.
[6] J. Chong, N. Satish, B. Catanzaro, K. Ravindran, and K. Keutzer,“Efficient parallelization of h. 264 decoding with macro block levelscheduling,” in Multimedia and Expo, 2007 IEEE InternationalConference on. IEEE, 2007, pp. 1874–1877.
[7] A. Azevedo, C. Meenderinck, B. Juurlink, A. Terechko,J. Hoogerbrugge, M. Alvarez, and A. Ramirez, “Parallel h. 264decoding on an embedded multicore processor,” High PerformanceEmbedded Architectures and Compilers, pp. 404–418, 2009.
[8] S. Iqbal, Y. Liang, and H. Grahn, “Parmibench-an open-sourcebenchmark for embedded multiprocessor systems,” ComputerArchitecture Letters, vol. 9, no. 2, pp. 45–48, 2010.
[9] C. Bienia, S. Kumar, J. Singh, and K. Li, “The parsec benchmarksuite: Characterization and architectural implications,” in Proceedings
— 41 —

BIBLIOGRAPHY
of the 17th international conference on Parallel architectures andcompilation techniques. ACM, 2008, pp. 72–81.
[10] F. Black and M. Scholes, “The pricing of options and corporateliabilities,” The journal of political economy, pp. 637–654, 1973.
[11] B. Zhu, K. Li, and H. Patterson, “Avoiding the disk bottleneck in thedata domain deduplication file system,” in Proceedings of the 6thUSENIX Conference on File and Storage Technologies, vol. 18, 2008.
[12] M. O. Rabin, Fingerprinting by Random Polynomials. Center forResearch in Computing Technology, Harvard University, 1981.
[13] M. S. Mucci P. and S. N., “Performance Tuning Using HardwareCounter Data,” 2001.
[14] GNU, “Ressource Usage,” http://www.gnu.org/software/libc/manual/html_node/Resource-Usage.html, [Online].
[15] T. Mattson, M. Riepen, T. Lehnig, P. Brett, W. Haas, P. Kennedy,J. Howard, S. Vangal, N. Borkar, G. Ruhl et al., “The 48-core sccprocessor: the programmer’s view,” in Proceedings of the 2010ACM/IEEE International Conference for High PerformanceComputing, Networking, Storage and Analysis. IEEE ComputerSociety, 2010, pp. 1–11.
— 42 —