design of single assembly line for the delayed differentiation of product variants
TRANSCRIPT

Design of single assembly line for the delayeddifferentiation of product variants
Tarek AlGeddawy • Hoda ElMaraghy
Published online: 18 January 2011
� Springer Science+Business Media, LLC 2011
Abstract Delayed Product Differentiation (DPD) can reduce the manufacturing
complexities arising due to the proliferation of products variety. A new optimization
model constructs the optimum layout of delayed differentiation assembly lines for a
mix of products to be manufactured by the same system and optimizes the position
of the differentiation points. This model employs a classification tool (Cladistics)
used in biological analysis and modifies it for use in planning DPD assembly lines
configurations in order to incorporate the assembly precedence constraints, required
production rates of different product variants and existing production capacity of
work stations. The optimum layout configuration ensures that the quantities required
of different products are produced on the same line; while achieving balance,
minimizing duplication of stations and maximizing the overall system utilization.
The developed model has been applied to a group of automobile engine accessories
normally assembled on different lines. The use of Cladistics to analyze product
variants that are candidates for delayed assembly is an original approach for
designing the assembly line layout and identifying the best differentiation points. It
also helps rationalize the design of product variants and their features to further
delay their assembly differentiation and achieve economy of scale without affecting
their functionality.
Keywords Assembly � Product variants � Delayed differentiation � Cladistics
T. AlGeddawy (&) � H. ElMaraghy
Intelligent Manufacturing Systems Centre, University of Windsor, Windsor, ON, Canada
e-mail: [email protected]
H. ElMaraghy
e-mail: [email protected]
123
Flex Serv Manuf J (2010) 22:163–182
DOI 10.1007/s10696-011-9074-7

1 Introduction
Automotive manufacturers as well as many other industries are under pressure to
offer a range of product variants to satisfy customers’ demands, while maintaining
attractive prices and responsive delivery times to remain competitive. Therefore,
managing the augmented product varieties is becoming a major concern in
manufacturing in general and in the automotive industry in particular. Fujimoto
et al. (2003) discussed many sources of product and process varieties in automotive
industry;
• Different basic functions within the same family of products (example:
crossover car models might offer different wheel drives to select from such as
4WD for sport utility or FWD for family ride).
• Adaptation of the same function to different requirements (example: car engines
with the same output might vary in dimensions and layout based on the car
model).
• Offering optional functions (examples of options include: power/manual
windows, sun-roof, passenger side air bags, fog lights…etc.)
• Non-functional requirements (examples include: manufacturing processes
variation may arise due to the introduction of a new technology like replacing
control knobs with touch buttons or navigation screens; which are all executing
the same functions).
In general; offering a wide range of product variants can lead to a considerable
expansion in the number of sub-assemblies and amounts of raw materials that must
be kept in stock to satisfy the full range of possible variations in product
configurations (Bragg 2004). In addition, customer service cost increases when
many product variations exist. For example, managers attempt to stock as much as
possible of the finished products under the pressure of maintaining good customer
service quality, while eventually those stocks might become obsolete in a relatively
short time due to rapid technology changes (Lee and Billington 1994). Increasing
the product variety means increasing manufacturing complexity, which eventually
leads to higher managerial burdens in order to handle all the previously discussed
symptoms of increasing products varieties, and associated escalating administrative
cost.
These negative effects of products variety proliferation motivated the adoption of
postponement strategy, which exploits the commonality between produced items
and designs the production and distribution processes to delay the point of products
differentiation. Delaying product differentiation can increase flexibility, reduce
uncertainties and decrease the cost of complexity (Shao and Ji 2008).
This paper specifically targets Form Postponement in assembly lines, which
requires deferring product differentiation activities as much as possible along
production stages by delaying the insertion of specialized components or performing
variant-specific processes. These specialization and customization production stages
are called points of products differentiation. Consequently, these deferred activities
lead to a Delayed Product Differentiation (DPD) production system (Garg and Tang
1997). Form postponement has been reported in many industries such as: (1) batch
164 T. AlGeddawy, H. ElMaraghy
123

process industries of a product form variation i.e. converting hot aluminum to
different sections bars and food industry (Caux et al. 2006); (2) in the low variety—
high volume batch production of specialized high voltage cables; (3) the high
variety—low volume production of electric motors in a process cells layout, and (4)
the high variety—high volume manual assembly of keypads for automated telling
machines (Harrison and Skipworth 2008); assembly of computers and their storage
devices and subassemblies (Swaminathan and Tayur 1999); and in automotive
manufacturing facilities by introducing points of differentiation after body shop and
paint shop to allow sequencing to reduce production disturbances (Fournier and
Agard 2007).
The main enabler of products form postponement is ‘Modularity’, which is a
relative property that depends on the degree of similarity between the physical and
functional product design and architecture and the extent of decoupling between
components (Ulrich and Tung 1991). Many approaches are used to further facilitate
form postponement by capitalizing on the concept of modularity. Standardization of
components is a product redesign strategy that encourages utilizing common
components and interchangeable sub-assemblies (part commonality) or common
processes in order to reduce the manufacturing system complexity. Modular designis also a product re-design strategy which decomposes the whole product into
independent modules that can be easily assembled together. This approach was
considered the main enabler for applying DPD assembly strategy. Process re-
construction, as the name suggests, is a process re-design strategy that refers to re-
sequencing the steps used in making a product, in order to perform the common
process steps shared by multiple products before the product specific process steps
(Lee and Billington 1994; Lee and Tang 1997).
2 Assembly line design
The design of assembly line entails several tasks; including but not limited to;
assembly Line composition into stations associated with the assembly of different
variants features; arranging the stations into a layout according to precedence
requirements and modeling, analysis and optimization to balance out processing
times in different sections and optimize performance measures such as utilization
and stations duplication, and finally, selection of specific workstations, material
handling and transfer systems (De Lit et al. 2003; Rekiek and Delchambre 2006).
2.1 Assembly line balancing
The assembly line balancing mainly involves searching for the optimum assignment
of tasks (nodes), precedence relations (arrows) and task durations (assigned to each
node) in a pre-set assembly graph, to achieve a pre-defined single or multi-objective
goal. These objectives vary from a single objective of minimizing the number of
stations for a given cycle time, or minimizing the cycle time for a given number of
stations in a serial line; to optimizing line efficiency and imbalance simultaneously
in a non-serial line (Rekiek and Delchambre 2006). Boysen et al. (2007) referred to
Design of single assembly line 165
123

two types of problems: (1) the simple assembly line balancing problem (SALP)
where assigning tasks to stations in a serial line is performed; and (2) the general
assembly line balancing problem (GALP) where more practical aspects are
considered such as assembly layouts other than serial lines (e.g. U-shape), non-
deterministic process times, varying production demands and the effect of using a
number of parallel stations in single assembly stages on their workload distribution.
They also pointed out the existence of a wide gap between research and practical
applications in the field of GALP, where the real layouts found in industry could not
be considered, were not solved satisfactorily or the results were not applicable due
to the used simplifying assumptions.
For assembly line balancing where product variety exists involves a deeper
elaboration of an initial rough assembly line layout to achieve a desired cycle time.
Two approaches were suggested: (1) a multi-model assembly line where different
product models are considerably distinctive, therefore production is executed in
batches of each product model, and (2) a mixed-model assembly line where the
product model variants are significantly similar that they can be assembled
simultaneously on the same line (Boysen et al. 2007). The latter is usually a simple
serial line called ‘paced’ assembly line where the proportion of each variant in the
total assembly plan is known (Rekiek et al. 2000). A serial line might also possess
several parallel identical stations in a single assembly stage to satisfy a desired cycle
time. It is indicated that for such arrangement; the workload differences increase
drastically among those identical stations when product variety increases in a mixed
products assembly line in addition to the stock allocation problem. Consequently,
continuous production rescheduling and process re-sequencing are needed (Boysen
et al. 2007), besides the need for an optimized assembly stations layout to eliminate
non-value added process elements such as walking and waiting (Klampfl et al.
2005). The serial line can be bent in a U-shaped line for more homogenous
workloads of assembly stations, however, balancing these workloads requires
production scheduling integration with tasks assignment to stations (Miltenburg
2002). The U-shaped line was the main focus of the GALP in past research (Boysen
et al. 2007). Few researchers focused on balancing more complex shapes such as
asymmetric lines (Ko and Jack Hu 2008) and cellular layouts (Lee and Johnson
1991), however the lack of integration of the layout design with line balancing still
exists.
The model proposed in this paper presents an integrated assembly line design
approach where layout design, assembly sequencing, task assignment and stations
location decisions are combined in the optimization process for a mixed-model
product assembly that has a more complex system layout than a serial or a U-shaped
line.
2.2 Delayed product differentiation
When the postponement strategy is applied to assembly processes; it defers the final
configuration of products, thus it is considered a form postponement. In a mixed-
product assembly; the points of products differentiation represent specialization
stages in the assembly system where each product starts to develop its own unique
166 T. AlGeddawy, H. ElMaraghy
123

identity, thus, becoming differentiated from other end product designs in the
family. The determination of these points has traditionally been associated with
some strategic factors such as capital investment and inventory costs as well as
work in process level (WIP). The determination of these points is considered a
pre-requisite for all of the subsequent assembly line design tasks. Garg and Tang
(1997) modeled a three stage assembly system with two points of differentiation
as a distribution system under both centralized and decentralized control policies.
A decision is made to choose either early family postponement (delaying the first
differentiation point) or late product postponement (delaying the second differ-
entiation point) based on demand variability, lead time correlation and inventory
savings.
Some mathematical models are found in the literature for determining the optimum
positions of points of product differentiation in an assembly line. Hsu and Wang
(2004) presented a dynamic programming model to locate such points. The model
decides at every design stage, based on lead-time, capital investment, processing, and
inventory holding costs, whether to continue with the common part assemblies or to
introduce a specific differentiating component. Another dynamic programming model
was presented by Chen et al. (2006) to determine the product differentiation points.
The model is similar to Hsu and Wang’s model, as it works only for a family of
products with the same production processes type and precedence constraints. In
addition to the cost of investment, processing, and inventory holding, other cost
components were taken into consideration, such as transportation cost. Fournier and
Agard (2007) introduced a practical automotive paced serial production line with two
points of differentiation, where buffers of WIP are installed so that units in those
buffers can be reordered before the next step, which improved the earliness and the
lateness of the entire production system.
Swaminathan and Tayur (1998) introduced a different model which starts from a
number of products having common components, and proposes the best semi-
finished products configurations (vanilla boxes), and provides the right amount and
mix of these vanilla boxes inventory level to minimize the total stock-out and
holding cost. These vanilla boxes are equivalent to the work-in-process at each
differentiation point, and their number is decided by the user. In their later model
(Swaminathan and Lee 2003) the assembly sequence problem was taken into
consideration. The applied precedence constraints were component-based, i.e. they
show the relationship between each pair of used components but they do not follow
the precedence constraints for each end product, consequently the precedence
constraints were greatly relaxed, and while the final results included feasible
assembly sequences, no physical assembly line layout was synthesized. In addition,
the number of vanilla boxes (points of differentiation) is still pre-set, and was
limited to two in their examples.
Two main shortcomings are observed in the previous models:
1. There is no mention of the physical assembly or production system layout in
most cases, but a serial line type that produces end products and keeps WIP at
each differentiation point is assumed.
2. Assembly line balancing was mostly neglected.
Design of single assembly line 167
123

The first short coming was addressed by the proposed model of AlGeddawy and
ElMaraghy (2009), which presented a design process for assembly lines that delays
products differentiation considering only precedence constraints and producing the
best layout accordingly. However, that model did not consider line balancing and its
effect on the optimal line layout. This paper proposes a model that addresses line
balancing and integrates it with the layout optimization process where the main goal
is adopting DPD strategy to postpone the differentiation of products configuration
and assembly stages as much as possible while maintaining a common assembly
line configuration and processes as long as possible. This strategy reduces the risks
associated with increasing products varieties, by exploiting the commonalities
among their variants in components and processes while complying with the
assembly precedence constraints of each product. In addition; the required
production rates of the different products and the production capacities of the
different assembly stations are also taken into consideration since it is believed it
does not only affect the balancing of the assembly line but also its layout and the
locations of products differentiation points. The case study of the car engine
accessories is a good example of a product family the members of which share
functional similarities and common assembly processes that are currently produced
on separate assembly lines, which increases the number of redundant processes and
reduces the overall utilization and efficiency of production. The proposed model
applies form postponement to this car engine accessories assembly by establishing
an optimum assembly line layout that delays product differentiation and minimizing
processes redundancy.
3 Modeling the layout of a balanced delayed differentiation assembly line
The proposed model is divided into two steps; layout construction and layout
evaluation. First; a layout that represents one of the possible delayed differentiation
assembly lines is constructed; showing the locations of the differentiation points.
Second; the commonality analysis and precedence constraints are applied followed
by assembly line balancing. The main objective of the model is to design an
assembly line that satisfies the production requirements of the given product
variants and delays their differentiation while using the minimum number of
assembly stations as described in the next sections.
3.1 Commonality cladistics analysis
In this part of the model; studied products common features are recognized and
products are classified graphically using a novel method utilizing the comparative
data analysis in biological science known as ‘Cladistics’. This classification method
was originally introduced and developed by Hennig (1966, republished in 1999) to
generate cladograms, which are tree-like structures representing evolution course
hypotheses. In manufacturing; Cladistics was used for the first time (ElMaraghy
et al. 2008) to analyze products commonality. A case study of automotive engine
blocks was analyzed, to identify their design evolution trend and obtain more
168 T. AlGeddawy, H. ElMaraghy
123

informative products groupings than what would be possible using the traditional
product families. These cladograms were also found to represent the candidate
assembly line layouts in the proposed model, since cladogram trees combine the
studied entities based on their common characters under unified branches in those
trees. It was established that the schematic layout of an assembly system that delays
production differentiation resembles the appearance of the cladogram tree. Such
layout would also maximize the postponement of the production of different product
features as much as possible in the layout branches, while producing the common
features along the previous unified branches. The process of constructing the
product variants cladogram begins with choosing end-taxa—which are the product
variants to be assembled, placed at the end of cladogram terminals such as taxa A,
B, C, D and E shown in Fig. 1, then determining the characters that provide
relationships evidence (1–6 in Fig. 1). The different assembly processes of the
studied products will be the characters in the case of assembly line design. Next, all
inherited character states in each taxon are identified. A character state could be
‘primitive’, where that character does not exist or has a low profile (0), or could be
in a ‘derived’ state; representing the existence of the character, or has a more
developed profile (1). The objective of the construction process is to generate the
most parsimonous (minimum length) cladograms. A cladogram length is the number
of the characters that appear on the cladogram graph. The cladogram shown in
Fig. 1 has a total length of 10 steps, while there are only six characters because
some characters are repeated, which represents cladistic conflicts that increase its
length. The objective of the optimization process is to minimize those conflicts so
that the number of characters is kept to a minimum. This is consistent with the
objective of minimizing the total number of assembly stations in the layout so that
the maximum number of common assembly processes/stations can be unified in
joint assembly stages.
Fig. 1 Constructing a cladogram in a parsimony analysis
Design of single assembly line 169
123

3.2 Precedence constraints
The precedence assembly constraints for each product variant are individually
represented by a precedence graph for each. A combined precedence graph is the
main way to represent precedence constraints for the whole product variants/family,
which is then converted into a relationships precedence matrix (Ko and Jack Hu
2008). This step entails grouping common tasks (Boysen et al. 2009); which is an
extra calculation burden. This is, however, avoided in the model proposed in this
paper. Individual precedence graphs are converted into a precedence matrix by
assigning a value of ‘1’ to direct or later succession; else a value ‘0’ is assigned
where no relationship exists. Figure 2 shows the effect of incorporating precedence
constraints on the cladogram construction process. If there is no precedence
constraint; a character (2), which represents an assembly step, can be combined into
one process if it exists in two or more products (e.g. A and B in Fig. 2a). This has
the effect of minimizing the number of duplicate assembly stations in the assembly
system. However, if a precedence constraint exists between character (2) and
another one (1) it prevents their integration; then process combination is not
possible and the corresponding products will require their own separate assembly
processes for such features/characters as shown in Fig. 2b.
3.3 Production requirements
In this section; production rate, R, refers to the system objective to produce a
required number of product units per unit time. Production capacity, Q, is the
system-specific property representing the maximum number of product units that
can be produced per unit time. The objective is to achieve the targeted production
rates of each product variants when balancing the assembly system. Those rates
present the demand constraint that should be achieved by each assembly station.
It is assumed that a number of parallel stations may be installed at an assembly
station as needed to fulfill the required production rate at this particular stage
(Fig. 3). This assumption ensures that the production requirements are satisfied at
each stage regardless of the system layout, which is globally optimized by the
model. The number of parallel stations for a given process is N C R/Q, and the total
production capacity of this stage = N 9 Q. Where N is the ceiling integer (R/Q),
Fig. 2 Applying precedenceconstraints to a cladogram.Products A and B undergoprocess 2. a Processes 1 and 2are independent. b Process 1precedes process 2
170 T. AlGeddawy, H. ElMaraghy
123

R ¼P8i Ri is the total number of products per unit time required at that stage and Q
is the production capacity (products/unit time) of a single work station.
3.4 System utilization
It can be proven that the utilization of a manufacturing system having a delayed
differentiation layout is always the same or better than that of other types of layouts.
System utilization is simply the used portion of the total system production capacity.
For simplicity and illustration; a two products case is shown in Fig. 4. Product A
and B have required production rates RA and RB, respectively. Only one assembly
operation is required for both products A and B production, which is performed
using a processing station of capacity Q. Only two types of layouts can be used for
this simple case: (a) two separate lines layout (case -a), and (b) an integrated
delayed differentiated line (case -b). For case (a); the required production rates of
each product are fulfilled separately. This implies that a number of processing
stations (NA and NB) of total production capacity—equal to or exceeds the
individual product requirement (RA and RB)—must be used in each line. For case
(b); the number of stations is determined to fulfill the aggregated production
requirements of both products. The system utilization for both cases can then be
calculated using Eqs. 1 and 2.
Ua ¼ ðRA þ RBÞ=½Q� ðNA þ NBÞ� ð1ÞUb ¼ ðRA þ RBÞ=ðQ� NÞ ð2Þ
The number of stations in case (a) imposes the upper limit of needed stations, while
the number of stations in case (b) is always the lower limit; since:
*N ¼ ceiling integer ðRA þ RB=QÞ ð3Þ)NA þ NB ¼ ceiling integer ðRA=QÞ þ ceiling integer ðRB=QÞ ð4Þ
Fig. 3 Fulfilling productionrequirements at each assemblystage
Design of single assembly line 171
123

*Ceiling integer ððRA þ RBÞ=QÞ�Ceiling integer ðRA=QÞþ Ceiling integer ðRB=QÞ ð5Þ
)N�NA þ NB ð6ÞThe utilization of case (b) line is always better than case (a) as long as
N \ NA ? NB. The comparison between case (a) and case (b) utilization in
different cases is shown by Eqs. 7–9
For N\NA þ NB and N ¼ ðRA þ RBÞ=Q! Ub ¼ 100% ð7ÞFor N\NA þ NB and N [ ðRA þ RBÞ=Q! Ub [ Ua ð8Þ
For N ¼ NA þ NB ! Ub ¼ Ua ð9Þ
The previous equations indicate that a delayed differentiation layout would always
be preferred over other layout types not only for minimizing the number of the used
stations but also for maximizing the system utilization. The previous conclusion
entails that an optimum balanced delayed differentiation layout would always yield
the maximum system utilization. The overall utilization of a manufacturing system
can be calculated using Eq. 10.
U ¼X
8ijRij=
X
8ilQil ð10Þ
where: Rij is the required production rate of product (j) at location (i). And Qil is the
production capacity of station (l) at location (i).System utilization is also inversely proportional to idle time. Better system
utilization means more use of available production resources and less idle time in
the system.
3.5 Balanced layout optimization algorithms
The proposed model constructs and evaluates the layout using two algorithms that
are executed iteratively. The evaluation algorithm analyzes the layout topology
(T) generated by the construction algorithm, given a specific group of product
variants expected at the end points of the assembly line (terminals of the
corresponding cladogram).
Fig. 4 Effect of layout on line balancing. a Separate lines. b Grouped stations in delayed productsdifferentiation
172 T. AlGeddawy, H. ElMaraghy
123

3.5.1 Layout construction
The layout construction algorithm involves the application of the physical graph
constraints on a chosen topology. These constraints connect the graph nodes to
establish the tree structure of the delayed differentiation layout, by imposing the
necessary graph arcs (minimum number of arcs at the upper nodes and increasing
number of arcs at lower nodes). The tree construction part of the algorithm ensures
that all tree terminal nodes are eventually connected to the upper-most node. If a
node (i,j) on the graph is connected by an arc to one of its consecutive lower nodes;
then Xij = 1 else Xij = 0. Some arcs might be redundant which distorts the tree
shape by producing arc loops; hence, they are removed by the connectedness
redundancy removal part of the algorithm. The layout generation algorithm is
shown in Fig. 5.
3.5.2 Layout evaluation
The layout evaluation algorithm shown in Fig. 6 is responsible for distributing
assembly processes over the generated layout and calculating the production
capacities needed to fulfill the production requirements and balance the assembly
line. Steps 1–6 are for data setup and initialization. Step 7 combines common
features in pair-wise products unless this violates a precedence constraint, which is
checked in step 8. Step 8 also balances the assembly line by calculating the
minimum number of parallel identical stations required to perform a process at a
certain stage. Step 13 evaluates the current assembly line, while step 14 stores the
best obtained results.
Finding the most parsimonious cladogram is NP hard combinatorial problem
(Kitching et al. 1998) and consequently the problem of identify the best evaluated
layout. Therefore the choice of the optimization search techniques depends on the
problem size where: (1) Exhaustive search is used for small size problems of 10
variants or less, (2) Random destinations—where a random portion of the solution
space is selected for evaluation—is suitable for problems with 11–20 variants, and
(3) Genetic Algorithm is recommended for large size problems of more than 20
product variants. The presented case study (size of five variants) was solved using
Fig. 5 Algorithm for generating feasible assembly line layout topologies
Design of single assembly line 173
123

exhaustive search within the solution space; consequently the provided solution is
an exact optimum since it was the best found one compared to all other feasible
solutions. The other two techniques use meta-heuristics that are known to find near
optimal solutions.
4 The case study
There are many examples of mixed-products manufacturing in the automotive
industry. A limited number of automotive engine family variants may serve a
handful of automobile models; however the engines accessories vary widely
according to the specific car models. The utilization of a serpentine flat belt that
connects many components of the engine is becoming the common practice since
the 70’s (Cassidy et al. 1979). Several factors led to such variety; engine torque
load, required damping and bearing characteristics among other factors (for more
details on these factors refer to Ulsoy et al. 1985). These accessories are usually a
pair of idler and belt-tensioner in each engine (Fig. 7). The common practice in
Fig. 6 The evaluation and optimization algorithm of assembly line layout
174 T. AlGeddawy, H. ElMaraghy
123

industry is to assemble these accessories using separate manual, automatic or hybrid
assembly lines depending on features and production volume. The assembly of these
accessories consists of a range of insertion, fastening, aligning and press fitting
processes. In some cases, where accurate alignment is required, a fine surface
machining is used.
A set of five different engine accessories are studied (Fig. 8). These are normally
produced using different assembly lines, and they will be considered for production
by a single system utilizing the concept of delayed differentiation. SAT01, ABT03
and NAT04 are three belt-tensioners with damping mechanisms; while EXI02 and
SAI04 are two idlers without such damping. These products have some common
components and assembly processes that can be explored for possible unification.
Table 1 shows the processes needed to assemble each product. A ‘1’ value means
the process is needed for that specific product; while a ‘0’ value indicates that it is
not required and may be a candidate for amalgamation.
A pulley assembly (1) is placed in the pallet then a bushing (2), which exits in
some variants, is inserted in the pulley. The pulley assembly is held together by
driving a bolt (3.1) or pressing a pivot (3.2). Different engine belt-tensioners may
have U (4.1) or N-shaped (4.2) arms—the latter needs to be inverted upside down
for further operations. The damper (6) is placed inside the arm housing and secured
by pressing and twisting the cup and spring assembly (6) into the arm housing. If the
product is self-aligning; an insert (7.1) is placed on top of the damper before the cup
and spring are assembled. For products requiring accurate alignment (7.2); a CNC
machine is used to make a final precision surface machining of the arm housing
where it gets assembled to the engine. The required production rates for each
product and the production capacity of the assembly stations used for each process
are given in Table 2. The precedence constraints of these assembly processes are
represented by a group of precedence graphs as shown in Fig. 9. These constraints
are converted to a precedence matrix (Table 3) representing the pair wise
relationships between the different assembly processes. A ‘1’ value indicates the
existence of a precedence relationship; while a ‘0’ value means its absence.
Fig. 7 The locations of engine accessories in a car engine
Design of single assembly line 175
123

Same production rate for each task is assumed regardless of the product variant
since a common assembly process that is shared by many variants is by definition
not product variant-specific. At stations where differentiated product variants
assembly takes place, the process time may be different except for duplicate
identical stations that are sometimes set up in different sections to achieve the
Fig. 8 The group of studied engine accessories
Table 1 The assembly processes of the studied products
Place
pulley
Insert
bushing
Fastening Arm positioning Twist cup
assembly
Insert
damper
Align
Bolt Pivot U N Self Fixed
1 2 3.1 3.2 4.1 4.2 5 6 7.1 7.2
EXI02 1 1 0 1 0 0 0 0 0 0
SAI04 1 0 0 1 1 0 0 0 1 0
SAT01 1 0 1 0 0 1 1 1 1 0
ABT03 1 0 1 0 1 0 1 1 0 1
NAT04 1 0 0 1 1 0 1 1 0 1
Table 2 Required production rates and stations production capacities
Product EXI02 SAI04 SAT01 ABT03 NAT04
Required rate (unit/min) 1.1 0.8 1.1 1.1 1.2
Assembly station 1 2 3.1 3.2 4.1 4.2 5 6 7.1 7.2
Capacity Q (unit/min) 2.1 1.9 1.2 1.2 1.6 2.1 2.7 1.5 1.5 1.4
176 T. AlGeddawy, H. ElMaraghy
123

delayed differentiation. Given the similarity that often exits between product
variants, the similarity of processing times for similar assembly processes is thought
to be a reasonable approximation for the purpose of synthesizing the assembly line
DPD layout. Besides; station duplication is to be minimized through the objective
function of the proposed optimization algorithm.
5 Results
5.1 The assembly line layout
For a set of five end product variants; there exist seven different Cladistic topologies
and 5! = 120 end products-to-terminals combinations. The complete solution space
contains 7 9 120 = 840 possible cladograms, which is feasible to search exhaus-
tively given its small size. The optimum cladogram was found to have a length of 22
steps land two differentiation points after station ‘1’ (3 parallel stations)—where
pulleys are assembled—and station ‘4.1’ (2 parallel stations)—where the U-shaped
arms are positioned in the assembly. The optimum cladogram is shown in Fig. 10a.
This graph can be readily converted to a schematic assembly line layout (Fig. 10b)
Fig. 9 The precedence graphsof the automobile engine belt-tensioners
Table 3 The precedence matrix of the automobile engine belt-tensioners
Predecessor
process
Successor process
1 2 3.1 3.2 4.1 4.2 5 6 7.1 7.2
1 0 1 1 1 0 0 1 1 1 1
2 0 0 0 1 0 0 0 0 0 0
3.1 0 0 0 0 0 0 1 1 1 1
3.2 0 0 0 0 0 0 0 0 0 1
4.1 1 0 1 1 0 0 1 1 1 1
4.2 1 0 1 0 0 0 1 1 1 0
5 0 0 0 0 0 0 0 0 0 1
6 0 0 0 0 0 0 1 0 0 1
7.1 0 0 0 1 0 0 1 0 0 0
7.2 0 0 0 0 0 0 0 0 0 0
Design of single assembly line 177
123

by deleting the arcs that do not possess characters, and rejoining their end nodes.
This schematic layout is then converted to the physical assembly line layout shown
in Fig. 11.
Fig. 10 The optimum assembly line schematic. a Cladistic representation. b Schematic representation
Fig. 11 The optimum and balanced delayed differentiation layout of the five auto-engine accessoriesassembly system
178 T. AlGeddawy, H. ElMaraghy
123
5.2 Sensitivity analysis
5.2.1 Infinite capacity assembly stations
Infinite capacities of assembly stations are assumed in order to test the dependency
of the optimum layout on the extent of commonality and precedence constraints
among product variants. This assumption relaxes the assembly line balancing
problem, since each station would be capable of satisfying any required production
rate of any given product. This assumption is equivalent to setting every station
capacity Qi to a large value, where:
Qi�X
8jRj; 8i ¼ 1. . .N; 8j ¼ 1. . .n ð11Þ
N: number of processing stations, n: number of products.
In this case; Qi C (1.1 ? 0.8 ? 1.1 ? 1.1 ? 1.2) = 5.3 unit/min. The resulting
unbalanced optimum layout—which does not consider production rate—is found to
be the same as the obtained balanced optimum layout. This result indicates that the
precedence constraints in this case study are highly restrictive. In general it can be
concluded that only smaller number of certain types of layout and stations
arrangement would be feasible, regardless of the required production rate, due to the
limitations imposed by the precedence constraints.
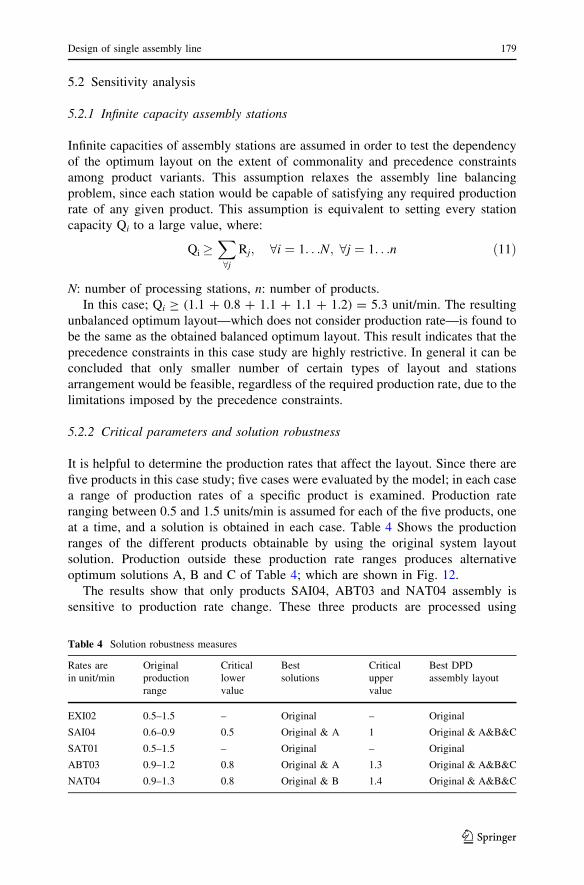
5.2.2 Critical parameters and solution robustness
It is helpful to determine the production rates that affect the layout. Since there are
five products in this case study; five cases were evaluated by the model; in each case
a range of production rates of a specific product is examined. Production rate
ranging between 0.5 and 1.5 units/min is assumed for each of the five products, one
at a time, and a solution is obtained in each case. Table 4 Shows the production
ranges of the different products obtainable by using the original system layout
solution. Production outside these production rate ranges produces alternative
optimum solutions A, B and C of Table 4; which are shown in Fig. 12.
The results show that only products SAI04, ABT03 and NAT04 assembly is
sensitive to production rate change. These three products are processed using
Table 4 Solution robustness measures
Rates are
in unit/min
Original
production
range
Critical
lower
value
Best
solutions
Critical
upper
value
Best DPD
assembly layout
EXI02 0.5–1.5 – Original – Original
SAI04 0.6–0.9 0.5 Original & A 1 Original & A&B&C
SAT01 0.5–1.5 – Original – Original
ABT03 0.9–1.2 0.8 Original & A 1.3 Original & A&B&C
NAT04 0.9–1.3 0.8 Original & B 1.4 Original & A&B&C
Design of single assembly line 179
123

common (the same) assembly stations before one differentiation point (station 4.1—
arm positioning) in the original solution (Fig. 10). The results also identify station
4.1 as being a bottleneck.
It can be noticed that the alternate layout solutions A, B and C do not propose
better delayed differentiation assembly layouts by altering processes sequence, since
the given precedence constraints do not allow much sequence alteration. The results
also show that there is more than one layout that match the original solution but do
not exceed it regarding minimizing the number of assembly stations or maximizing
the system utilization.
6 Conclusions
The proliferation of product varieties is mandated by competition and customer
demands. This trend is clearly evident in the automotive industry where each car
model has many options; consequently the constituent modules and subassemblies
have greater variety. This is well demonstrated in the example of car engine
accessories where families of products that exhibit wide variety exist; yet they have
many common functions, components and assembly processes. An assembly line
designed to postpone their form differentiation would exploit their similarities;
hence, reducing the negative effects resulting from their wide product variation.
A new method has been developed to integrate assembly line layout construction
with the assembly line balancing tasks. A novel model for synthesizing the
schematic layout of DPD assembly systems was introduced. The model adapts
Cladistics—a comparative data analysis tool used in Biology to establish evolution
course of living organisms—to conduct commonality analysis of the studied
products. This cladistics analysis was modified to incorporate assembly processes
precedence constraints and the required production rates for each variant.
Production capacities of the different assembly stations are considered in order to
determine the number of identical parallel stations required at each assembly stage
to fulfill the required production rates of various variants. The developed model was
applied to groups of product variants that have some common features and/or
assembly processes to be produced on a single assembly line/system. The balanced
layout model produced an optimum balanced assembly line layout for their delayed
products differentiation. Examining the assembled product variants cladogram
Fig. 12 The alternative solutions (layouts) in Table 4
180 T. AlGeddawy, H. ElMaraghy
123

identifies the candidate products features that could be made common in order to
combine and unify as many of the assembly stages as possible and postpone and
reduce the product-specific portions of the assembly system.
Sensitivity analysis indicated that the obtained optimum layouts are more
governed by the precedence constraints than by the required production rates of the
studied products. The sensitivity analysis also has identified the products and
stations that contribute to the superiority of the obtained layout and the ranges of
production rates where that solution outperforms all others.
A family of automobile engine accessories was used as an example of products
that exhibit demonstrable diversification and customization of the end product
according to the target application. Although the main components of each product
are essentially not different; it is their combination in different configurations that
results in the large variety of product models. The developed classification using
cladograms and optimization model successfully illustrated the use of mixed-model
combined assembly lines/systems compared to the dedicated single-model assembly
lines, commonly used in this industry due to the typically large production volumes,
to achieve the benefits of mass-customization through delayed product assembly
differentiation.
References
AlGeddawy T, ElMaraghy H (2009) Assembly systems layout design model for delayed products
differentiation. Int J Prod Res 48(18):5281–5305
Boysen N, Fliedner M, Scholl A (2007) A classification of assembly line balancing problems. Eur J Oper
Res 183:674–693
Boysen N, Fliedner M, Scholl A (2009) Production planning of mixed-model assembly lines: Overview
and extensions. Prod Plan Control Manage Operat 20(5):455–471
Bragg S (2004) Inventory best practices. Wiley, New Jersy
Cassidy RL, Fan SK, MacDonald RS, Samson WF (1979) Serpentine—extended life accessory drive.
SAE Preprints (790699)
Caux C, David F, Pierreval H (2006) Implementation of delayed differentitation in batch process
industries: a standardization problem. Int J Prod Res 44(16):3243–3255
Chen S, Kang H, Lee H (2006) Dynamic programming approach for analyzing delayed product
differentiation. Int J Adv Manuf Technol 28(5–6):445–449
De Lit P, Delchambre A, Henrioud JM (2003) An integrated approach for product family and assembly
system design. IEEE Trans Robotics Autom 19(2):324–334
ElMaraghy H, AlGeddawy T, Azab A (2008) Modelling evolution in manufacturing: a biological
analogy. CIRP Ann Manuf Technol 57(1):467–472
Fournier X, Agard B (2007) Improvement of earliness and lateness by postponement on an automotive
production line. Int J Flex Manuf Syst 19:107–121
Fujimoto H, Ahmed A, Iidda Y, Hanai M (2003) Assembly process design for managing manufacturing
complexities because of product varieties. Int J Flex Manuf Syst 15:283–307
Garg A, Tang C (1997) On postponement strategies for product families with multiple points of
differentiation. IIE Trans 29(8):641–650
Harrison A, Skipworth H (2008) Implications of form postponement to manufacturing: a cross case
comparison. Int J Prod Res 46(1):173–195
Hennig W (1966) Phylogenetic systematics. University of Illinois Press, Urbana (republished in 1999)
Hsu H, Wang W (2004) Dynamic programming for delayed product differentiation. Eur J Prod Res
156(1):183–193
Design of single assembly line 181
123

Kitching IJ, Forey PL, Humphries CJ, Williams DM (1998) Cladisitcs: the theory and practice of
parsimony analysis, second edition. Oxford University Press, the Systematics Association, Oxford
Klampfl E, Gusikhin O, Rossi G (2005) Optimization of workcell layouts in a mixed-model assembly line
environment. Int J Flex Manuf Sys 17:277–299
Ko J, Jack Hu S (2008) Balancing of manufacturing systems with complex configurations for delayed
product differentiation. Int J Prod Res 46(15):4285–4308
Lee H, Billington C (1994) Designing products and processes for postponement. In: Dasu S, Eastman C
(eds) Management of design: engineering, management perspectives. Kluwer Academic Publishers,
Boston
Lee HF, Johnson RV (1991) A line-balancing strategy for designing flexible assembly systems. Int J Flex
Manuf Syst 3:91–120
Lee L, Tang C (1997) Modelling the costs and benefits of delayed product differentiation. Manage Sci
43(1):40–53
Miltenburg J (2002) Balancing and scheduling mixed-model u-shaped production lines. Int J Flex Manuf
Syst 14:123–155
Rekiek B, Delchambre A (2006) Assembly line design: the balancing of mixed-model hybrid assembly
lines with genetic algorithms. Springer, London
Rekiek B, De Lit P, Delchambre A (2000) Designing mixed-product assembly lines. Robotics Autom
IEEE Trans 16(3):268–280
Shao X, Ji J (2008) Evaluation of postponement strategies in mass customization with service guarantees.
Int J Prod Res 46(1):153–171
Swaminathan J, Lee L (2003) Chapter 5: design for postponement. In: De-Kok A, Graves S (eds) Supply
chain management: design, coordination and operation. Elsevier, North-Holland, pp 199–226
Swaminathan J, Tayur S (1998) Managing broader product lines through delayed differentiation using
vanilla boxes. Manage Sci 44(12-part 2 of 2):161–172
Swaminathan J, Tayur S (1999) Managing design of assembly sequences for product lines that delay
product differentiation. IIE Trans 31(11):1015–1026
Ulrich K, Tung K (1991) Fundamentals of product modularity. ASME Issues Des/Manuf Integr 39(1):
73–79
Ulsoy AG, Whitesell JE, Hooven MD (1985) Design of belt-tensioner systems for dynamic stability.
ASME J Vibr Acoust Stress Reliab Des 107(3):282–290
Author Biographies
Tarek AlGeddawy graduated in Production and Mechanical engineering in 1999 from Cairo University,
Egypt, where he also received the M.Sc. degree in Industrial engineering in 2004. He joined the
Intelligent Manufacturing systems Centre (IMSC) as a Ph.D. candidate in 2006, at the University of
Windsor in Ontario, Canada. In 2008, he received a 3-years post-graduate research grant from the Natural
Sciences and Engineering Research Council of Canada (NSERC). His research activities are focused on
management of products variety/change and synthesis of manufacturing systems. He published 6 journal
and 10 conference papers.
Hoda ElMaraghy is a Professor of Industrial & Manufacturing Systems Engineering and the founding
Director of the Intelligent Manufacturing Systems (IMS) Centre at the University of Windsor. She holds a
Canada Research Chair in Manufacturing Systems since 2002. She obtained a Master and PhD degrees in
Mechanical Engineering from McMaster University where she became a Professor and founding Director
of its Flexible Manufacturing R&D Centre until she joined the University of Windsor in 1994 as the first
woman Dean of Engineering in Canada. Professor ElMaraghy is a Fellow of the International Academy of
Production Research (CIRP), Society of Manufacturing Engineers (SME), Canadian Society of
Mechanical Engineers (CSME) and Member of the American Society of Mechanical Engineers. She
serves on several international advisory boards and editorial boards of high impact international journals.
Professor ElMaraghy’s research interests include: Manufacturing Systems Flexibility, Reconfiguration
and Changeability, Products and Production Systems Co-Evolution, and Process and Production
Planning. She has over 380 publications and has contributed to training more than 100 highly qualified
personnel.
182 T. AlGeddawy, H. ElMaraghy
123