design example for analytical modeling of a …
TRANSCRIPT

Design Example for Analytical Modeling of a Curtainwall and Considering the Effects of Bridging (All -Steel Design Approach)
R E S E A R C H R E P O R T R P 1 8 - 2 A u g u s t 2 0 1 8
Committee on Specifications
for the Design of Cold-Formed
Steel Structural Members
re
sear
ch re
port
American Iron and Steel Institute
The material contained herein has been developed by researchers based on their research findings. The material has also been reviewed by the American Iron and Steel Institute Committee on Specifications for the Design of Cold-Formed Steel Structural Members. The Committee acknowledges and is grateful for the contributions of such researchers.
The material herein is for general information only. The information in it should not be used without first securing competent advice with respect to its suitability for any given application. The publication of the information is not intended as a representation or warranty on the part of the American Iron and Steel Institute, or of any other person named herein, that the information is suitable for any general or particular use or of freedom from infringement of any patent or patents. Anyone making use of the information assumes all liability arising from such use.
Copyright 2018 American Iron and Steel Institute
P a g e | 1
DESIGN EXAMPLE FOR ANALYTICAL MODELING OF A CURTAINWALL AND CONSIDERING THE EFFECTS OF BRIDGING
(ALL-STEEL DESIGN APPROACH)
INTRODUCTION
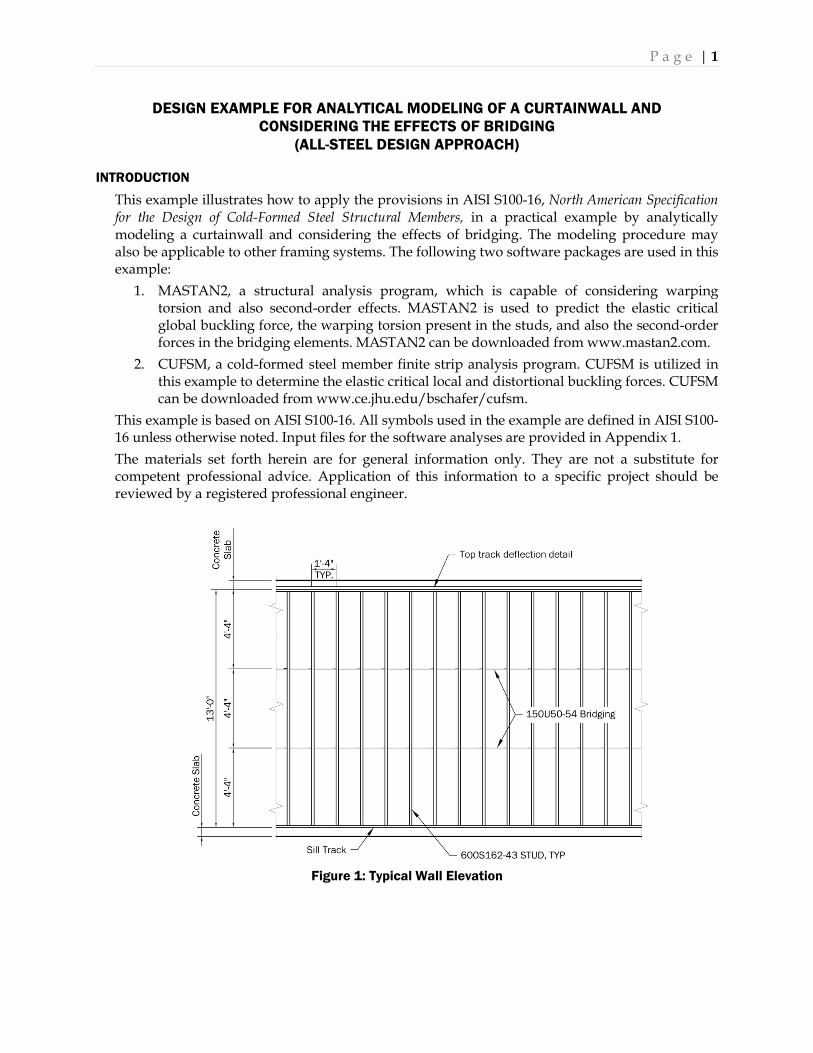
This example illustrates how to apply the provisions in AISI S100-16, North American Specification for the Design of Cold-Formed Steel Structural Members, in a practical example by analytically modeling a curtainwall and considering the effects of bridging. The modeling procedure may also be applicable to other framing systems. The following two software packages are used in this example:
1. MASTAN2, a structural analysis program, which is capable of considering warping torsion and also second-order effects. MASTAN2 is used to predict the elastic critical global buckling force, the warping torsion present in the studs, and also the second-order forces in the bridging elements. MASTAN2 can be downloaded from www.mastan2.com.
2. CUFSM, a cold-formed steel member finite strip analysis program. CUFSM is utilized in this example to determine the elastic critical local and distortional buckling forces. CUFSM can be downloaded from www.ce.jhu.edu/bschafer/cufsm.
This example is based on AISI S100-16. All symbols used in the example are defined in AISI S100-16 unless otherwise noted. Input files for the software analyses are provided in Appendix 1. The materials set forth herein are for general information only. They are not a substitute for competent professional advice. Application of this information to a specific project should be reviewed by a registered professional engineer.
Figure 1: Typical Wall Elevation
P a g e | 2 Given: 1. Wind bearing infill wall with an unsheathed design approach as shown in Figure 1. 2. Steel: Fy = 33 ksi, Fu = 45 ksi 3. Sections: 600S162-43 studs and 150U50-54 bridging as shown above with section properties per
Table 1. 4. Each stud is subject to a uniform wind load applied in line with the web centerline of 37.3 plf
using ASD load combinations. 5. Gravity load on wall is negligible. 6. Bridging is anchored at its ends and provides bracing to the studs. 7. Holes are present only at bridging locations and have a length of 4.5 in. and a width of 1.5 in. Required: 1. Using MASTAN2 and AISI S100 Section F2.1.1, perform an analysis to determine the critical
elastic lateral-torsional buckling stress for a typical stud. 2. Using CUFSM, perform an analysis to determine the critical elastic local and distortional
buckling stresses for the studs. 3. Using MASTAN2, determine the warping torsion present in the studs due to the shear center
eccentricity. 4. Verify the strength of the studs considering warping, bracing from the bridging, and the critical
elastic buckling stresses. 5. Using MASTAN2, perform a second-order analysis to determine the maximum moment in the
bridging.
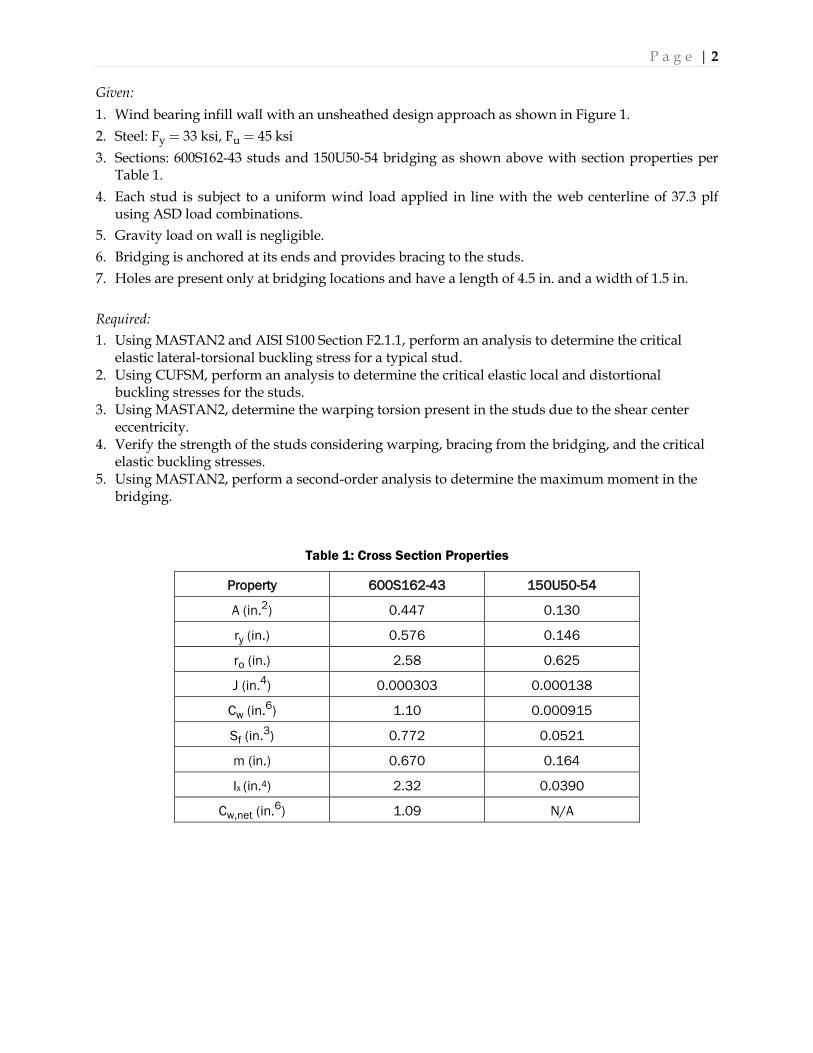
Table 1: Cross Section Properties
Property 600S162-43 150U50-54
A (in.2) 0.447 0.130
ry (in.) 0.576 0.146
ro (in.) 2.58 0.625
J (in.4) 0.000303 0.000138
Cw (in.6) 1.10 0.000915
Sf (in.3) 0.772 0.0521
m (in.) 0.670 0.164
Ix (in.4) 2.32 0.0390
Cw,net (in.6) 1.09 N/A
P a g e | 3 Solution:
1. Critical Elastic Global (Lateral-Torsional) Buckling Stress
Determination of the critical elastic lateral-torsional buckling stress, Fcre, is required in order to evaluate the limit state of yielding and global buckling according to AISI S100 Section F2. Fcre may be determined using the theoretical equations in AISI S100 Section F2.1.1 or by an analysis in accordance with AISI S100 Appendix 2, Section 2.2. Both methods are evaluated in the following sections and comparisons are made.
1a. AISI S100 Section F2.1.1 Method
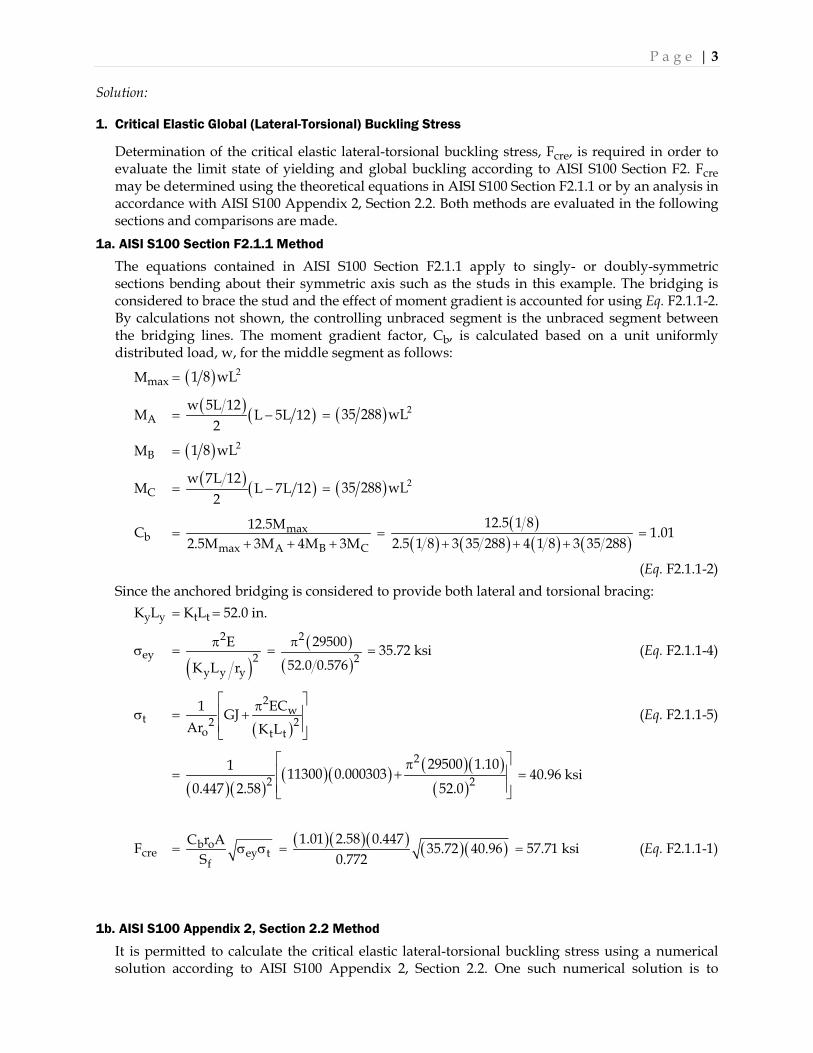
The equations contained in AISI S100 Section F2.1.1 apply to singly- or doubly-symmetric sections bending about their symmetric axis such as the studs in this example. The bridging is considered to brace the stud and the effect of moment gradient is accounted for using Eq. F2.1.1-2. By calculations not shown, the controlling unbraced segment is the unbraced segment between the bridging lines. The moment gradient factor, Cb, is calculated based on a unit uniformly distributed load, w, for the middle segment as follows:
Mmax = ( ) 21 8 wL
MA = ( ) ( )−w 5L 12
L 5L 122
= ( ) 235 288 wL
MB = ( ) 21 8 wL
MC = ( ) ( )w 7L 12L 7L 12
2− = ( ) 235 288 wL
Cb = + + +
max
max A B C
12.5M2.5M 3M 4M 3M
= ( )( ) ( ) ( ) ( )+ + +
12.5 1 82.5 1 8 3 35 288 4 1 8 3 35 288
= 1.01
(Eq. F2.1.1-2) Since the anchored bridging is considered to provide both lateral and torsional bracing:
KyLy = KtLt = 52.0 in.
σey = ( )
2
2y y y
E
K L r
π = ( )( )
2
229500
52.0 0.576
π = 35.72 ksi (Eq. F2.1.1-4)
σt = ( )
2w
2 2o t t
1 ECGJAr K L
π +
(Eq. F2.1.1-5)
= ( )( )
( )( ) ( )( )( )
2
2 229500 1.101 11300 0.000303
0.447 2.58 52.0
π +
= 40.96 ksi
Fcre = b oey t
f
C r AS
σ σ = ( )( )( ) ( )( )1.01 2.58 0.44735.72 40.96
0.772 = 57.71 ksi (Eq. F2.1.1-1)
1b. AISI S100 Appendix 2, Section 2.2 Method
It is permitted to calculate the critical elastic lateral-torsional buckling stress using a numerical solution according to AISI S100 Appendix 2, Section 2.2. One such numerical solution is to
P a g e | 4
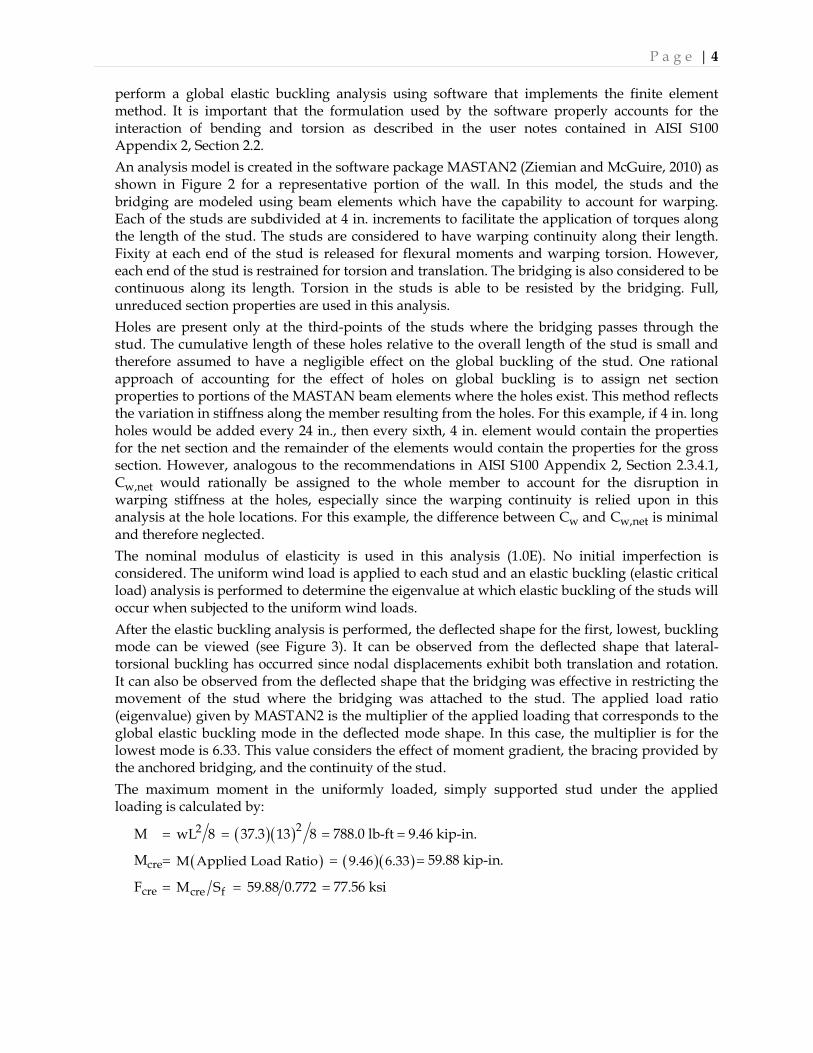
perform a global elastic buckling analysis using software that implements the finite element method. It is important that the formulation used by the software properly accounts for the interaction of bending and torsion as described in the user notes contained in AISI S100 Appendix 2, Section 2.2. An analysis model is created in the software package MASTAN2 (Ziemian and McGuire, 2010) as shown in Figure 2 for a representative portion of the wall. In this model, the studs and the bridging are modeled using beam elements which have the capability to account for warping. Each of the studs are subdivided at 4 in. increments to facilitate the application of torques along the length of the stud. The studs are considered to have warping continuity along their length. Fixity at each end of the stud is released for flexural moments and warping torsion. However, each end of the stud is restrained for torsion and translation. The bridging is also considered to be continuous along its length. Torsion in the studs is able to be resisted by the bridging. Full, unreduced section properties are used in this analysis. Holes are present only at the third-points of the studs where the bridging passes through the stud. The cumulative length of these holes relative to the overall length of the stud is small and therefore assumed to have a negligible effect on the global buckling of the stud. One rational approach of accounting for the effect of holes on global buckling is to assign net section properties to portions of the MASTAN beam elements where the holes exist. This method reflects the variation in stiffness along the member resulting from the holes. For this example, if 4 in. long holes would be added every 24 in., then every sixth, 4 in. element would contain the properties for the net section and the remainder of the elements would contain the properties for the gross section. However, analogous to the recommendations in AISI S100 Appendix 2, Section 2.3.4.1, Cw,net would rationally be assigned to the whole member to account for the disruption in warping stiffness at the holes, especially since the warping continuity is relied upon in this analysis at the hole locations. For this example, the difference between Cw and Cw,net is minimal and therefore neglected. The nominal modulus of elasticity is used in this analysis (1.0E). No initial imperfection is considered. The uniform wind load is applied to each stud and an elastic buckling (elastic critical load) analysis is performed to determine the eigenvalue at which elastic buckling of the studs will occur when subjected to the uniform wind loads. After the elastic buckling analysis is performed, the deflected shape for the first, lowest, buckling mode can be viewed (see Figure 3). It can be observed from the deflected shape that lateral-torsional buckling has occurred since nodal displacements exhibit both translation and rotation. It can also be observed from the deflected shape that the bridging was effective in restricting the movement of the stud where the bridging was attached to the stud. The applied load ratio (eigenvalue) given by MASTAN2 is the multiplier of the applied loading that corresponds to the global elastic buckling mode in the deflected mode shape. In this case, the multiplier is for the lowest mode is 6.33. This value considers the effect of moment gradient, the bracing provided by the anchored bridging, and the continuity of the stud. The maximum moment in the uniformly loaded, simply supported stud under the applied loading is calculated by:
M = 2wL 8 = ( )( )237.3 13 8 = 788.0 lb-ft = 9.46 kip-in.
Mcre = ( )M Applied Load Ratio = ( )( )9.46 6.33 = 59.88 kip-in.
Fcre = cre fM S = 59.88 0.772 = 77.56 ksi

P a g e | 5
Figure 2: MASTAN2 Analysis Model
Figure 3: Lateral-Torsional Buckling - Elastic Buckling Analysis
P a g e | 6 1c. Discussion
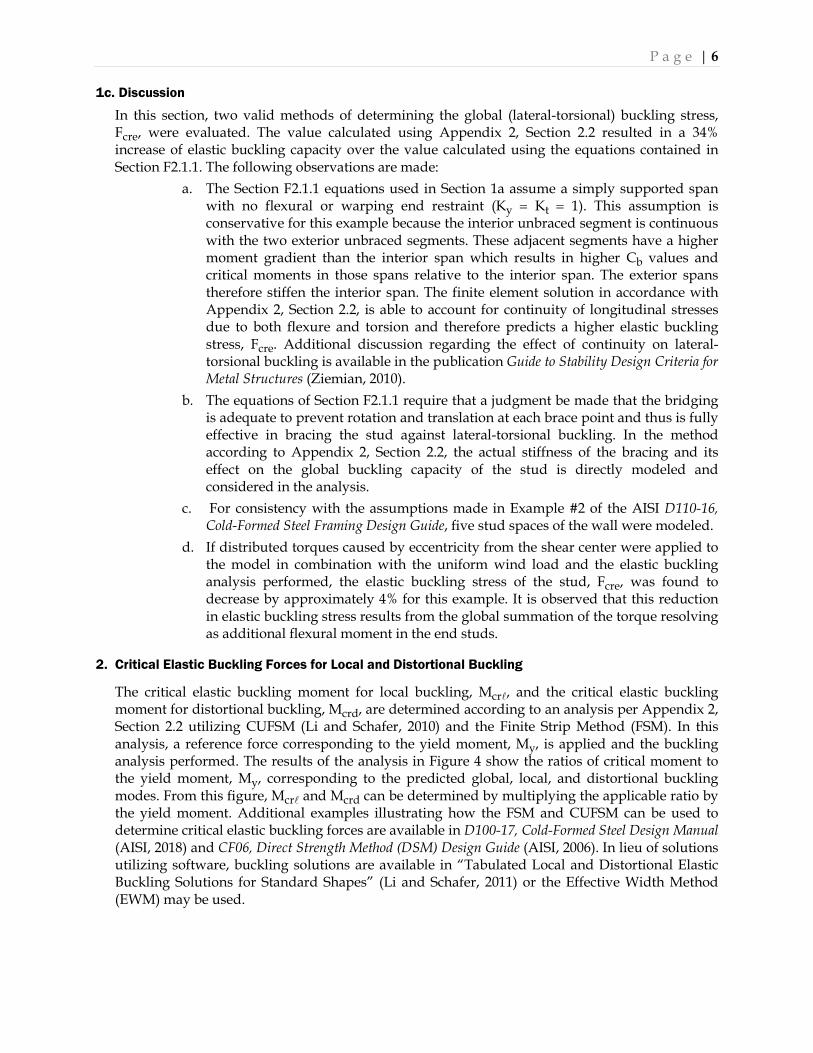
In this section, two valid methods of determining the global (lateral-torsional) buckling stress, Fcre, were evaluated. The value calculated using Appendix 2, Section 2.2 resulted in a 34% increase of elastic buckling capacity over the value calculated using the equations contained in Section F2.1.1. The following observations are made:
a. The Section F2.1.1 equations used in Section 1a assume a simply supported span with no flexural or warping end restraint (Ky = Kt = 1). This assumption is conservative for this example because the interior unbraced segment is continuous with the two exterior unbraced segments. These adjacent segments have a higher moment gradient than the interior span which results in higher Cb values and critical moments in those spans relative to the interior span. The exterior spans therefore stiffen the interior span. The finite element solution in accordance with Appendix 2, Section 2.2, is able to account for continuity of longitudinal stresses due to both flexure and torsion and therefore predicts a higher elastic buckling stress, Fcre. Additional discussion regarding the effect of continuity on lateral-torsional buckling is available in the publication Guide to Stability Design Criteria for Metal Structures (Ziemian, 2010).
b. The equations of Section F2.1.1 require that a judgment be made that the bridging is adequate to prevent rotation and translation at each brace point and thus is fully effective in bracing the stud against lateral-torsional buckling. In the method according to Appendix 2, Section 2.2, the actual stiffness of the bracing and its effect on the global buckling capacity of the stud is directly modeled and considered in the analysis.
c. For consistency with the assumptions made in Example #2 of the AISI D110-16, Cold-Formed Steel Framing Design Guide, five stud spaces of the wall were modeled.
d. If distributed torques caused by eccentricity from the shear center were applied to the model in combination with the uniform wind load and the elastic buckling analysis performed, the elastic buckling stress of the stud, Fcre, was found to decrease by approximately 4% for this example. It is observed that this reduction in elastic buckling stress results from the global summation of the torque resolving as additional flexural moment in the end studs.
2. Critical Elastic Buckling Forces for Local and Distortional Buckling
The critical elastic buckling moment for local buckling, Mcr, and the critical elastic buckling moment for distortional buckling, Mcrd, are determined according to an analysis per Appendix 2, Section 2.2 utilizing CUFSM (Li and Schafer, 2010) and the Finite Strip Method (FSM). In this analysis, a reference force corresponding to the yield moment, My, is applied and the buckling analysis performed. The results of the analysis in Figure 4 show the ratios of critical moment to the yield moment, My, corresponding to the predicted global, local, and distortional buckling modes. From this figure, Mcr and Mcrd can be determined by multiplying the applicable ratio by the yield moment. Additional examples illustrating how the FSM and CUFSM can be used to determine critical elastic buckling forces are available in D100-17, Cold-Formed Steel Design Manual (AISI, 2018) and CF06, Direct Strength Method (DSM) Design Guide (AISI, 2006). In lieu of solutions utilizing software, buckling solutions are available in “Tabulated Local and Distortional Elastic Buckling Solutions for Standard Shapes” (Li and Schafer, 2011) or the Effective Width Method (EWM) may be used.
P a g e | 7
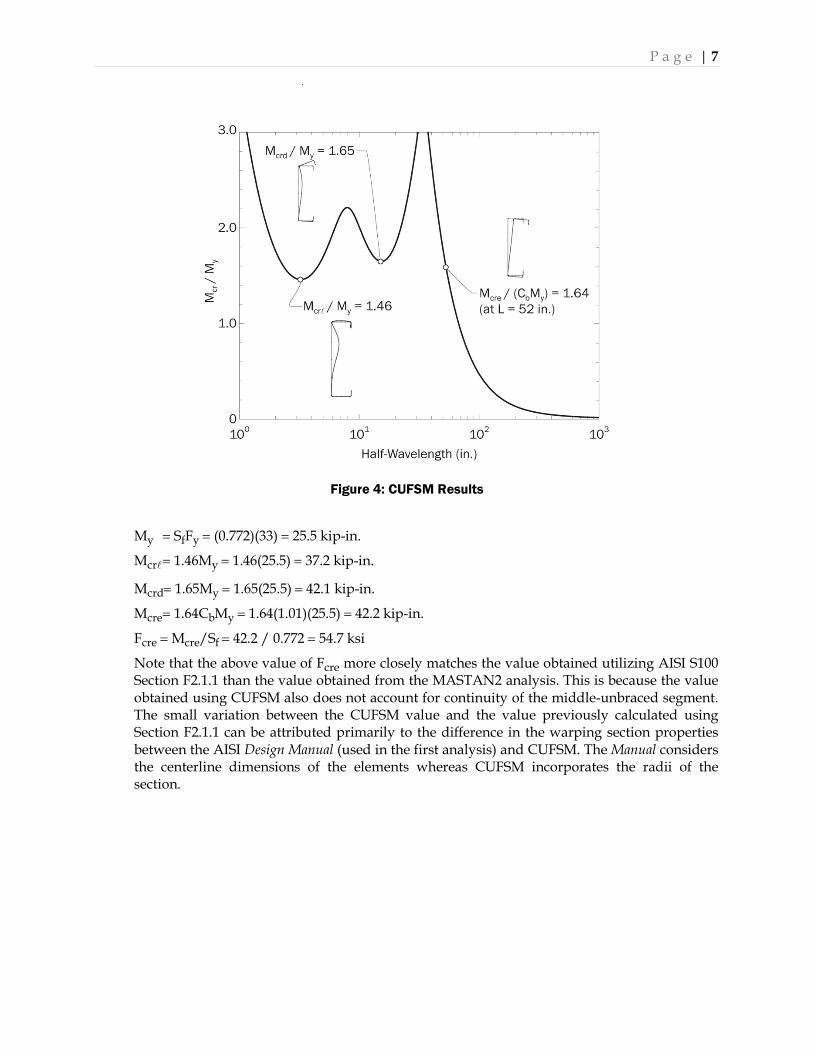
Figure 4: CUFSM Results
My = SfFy = (0.772)(33) = 25.5 kip-in.
Mcr = 1.46My = 1.46(25.5) = 37.2 kip-in.
Mcrd= 1.65My = 1.65(25.5) = 42.1 kip-in.
Mcre = 1.64CbMy = 1.64(1.01)(25.5) = 42.2 kip-in.
Fcre = Mcre/Sf = 42.2 / 0.772 = 54.7 ksi
Note that the above value of Fcre more closely matches the value obtained utilizing AISI S100 Section F2.1.1 than the value obtained from the MASTAN2 analysis. This is because the value obtained using CUFSM also does not account for continuity of the middle-unbraced segment. The small variation between the CUFSM value and the value previously calculated using Section F2.1.1 can be attributed primarily to the difference in the warping section properties between the AISI Design Manual (used in the first analysis) and CUFSM. The Manual considers the centerline dimensions of the elements whereas CUFSM incorporates the radii of the section.
P a g e | 8
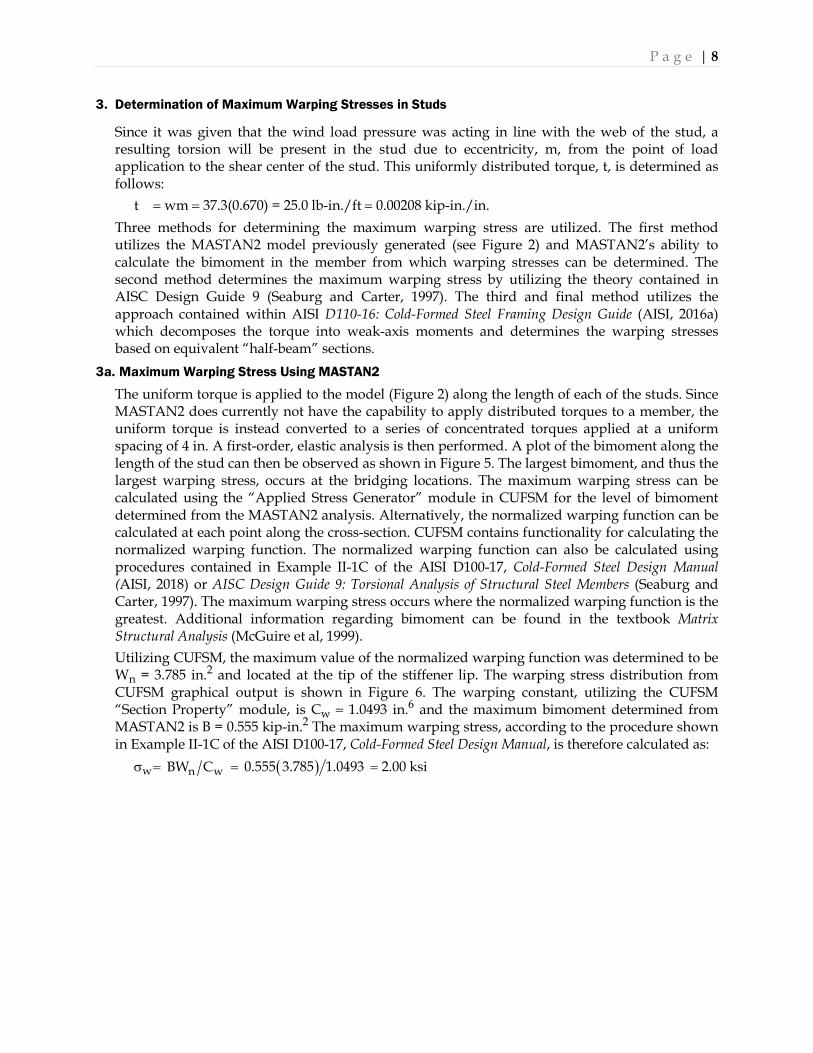
3. Determination of Maximum Warping Stresses in Studs
Since it was given that the wind load pressure was acting in line with the web of the stud, a resulting torsion will be present in the stud due to eccentricity, m, from the point of load application to the shear center of the stud. This uniformly distributed torque, t, is determined as follows:
t = wm = 37.3(0.670) = 25.0 lb-in./ft = 0.00208 kip-in./in. Three methods for determining the maximum warping stress are utilized. The first method utilizes the MASTAN2 model previously generated (see Figure 2) and MASTAN2’s ability to calculate the bimoment in the member from which warping stresses can be determined. The second method determines the maximum warping stress by utilizing the theory contained in AISC Design Guide 9 (Seaburg and Carter, 1997). The third and final method utilizes the approach contained within AISI D110-16: Cold-Formed Steel Framing Design Guide (AISI, 2016a) which decomposes the torque into weak-axis moments and determines the warping stresses based on equivalent “half-beam” sections.
3a. Maximum Warping Stress Using MASTAN2
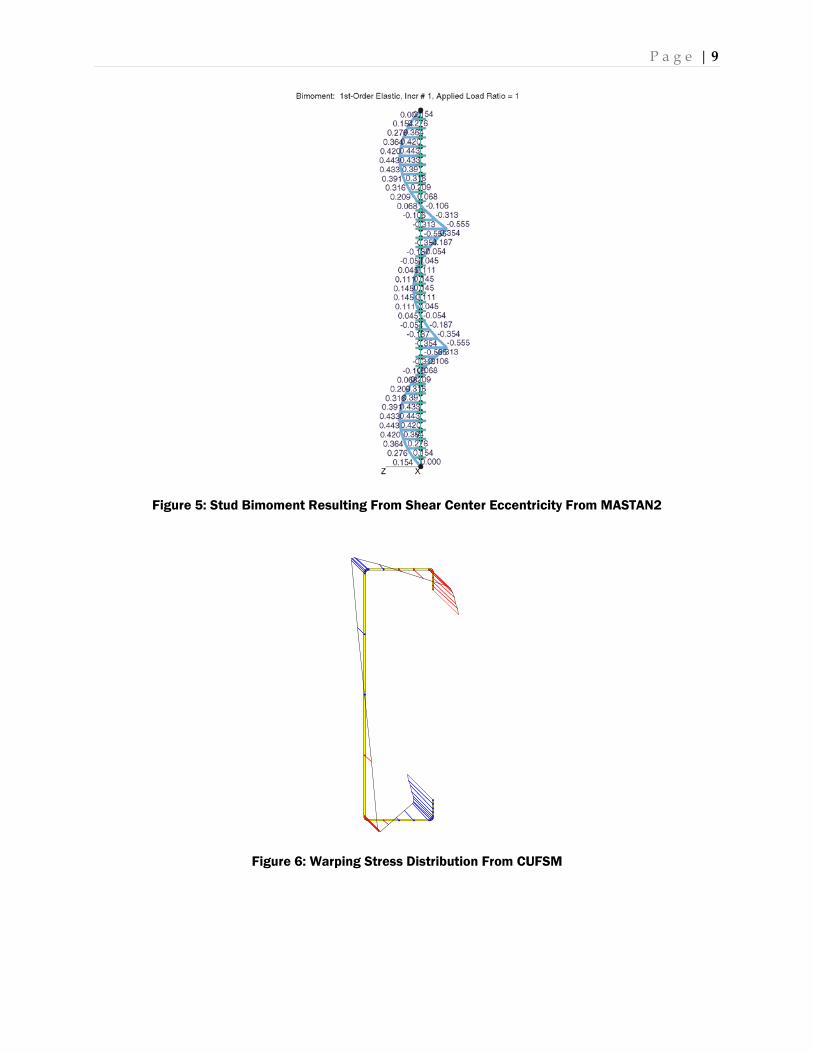
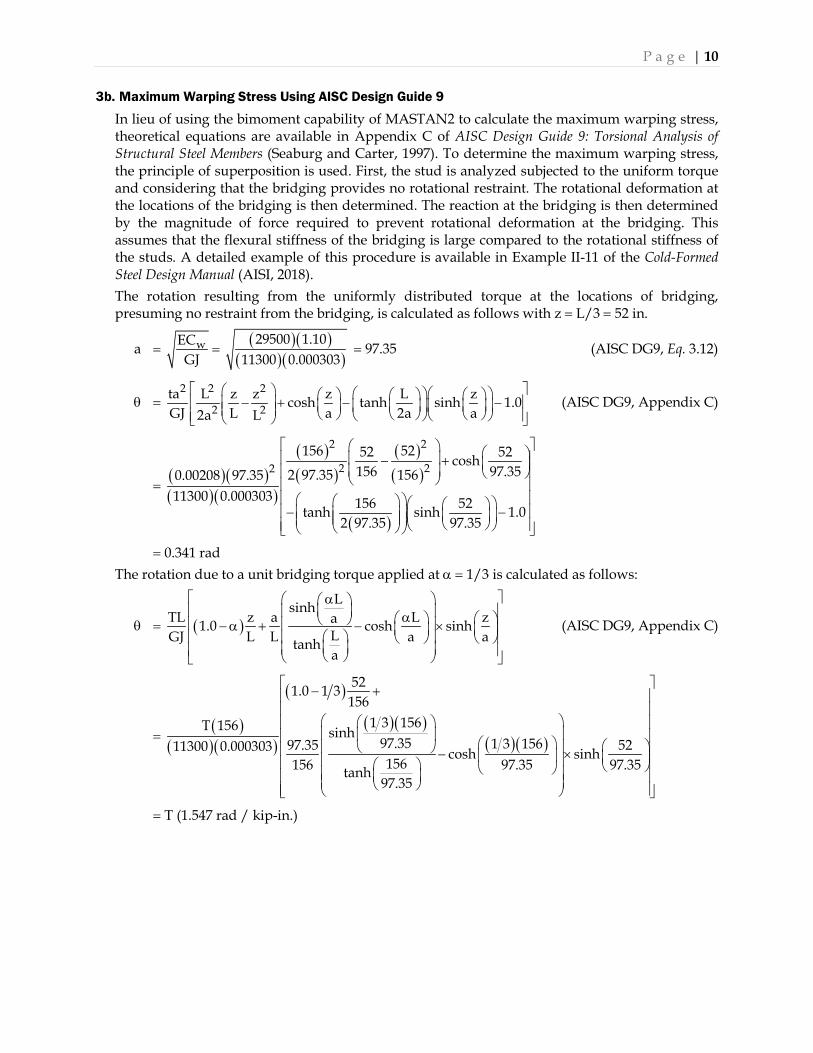
The uniform torque is applied to the model (Figure 2) along the length of each of the studs. Since MASTAN2 does currently not have the capability to apply distributed torques to a member, the uniform torque is instead converted to a series of concentrated torques applied at a uniform spacing of 4 in. A first-order, elastic analysis is then performed. A plot of the bimoment along the length of the stud can then be observed as shown in Figure 5. The largest bimoment, and thus the largest warping stress, occurs at the bridging locations. The maximum warping stress can be calculated using the “Applied Stress Generator” module in CUFSM for the level of bimoment determined from the MASTAN2 analysis. Alternatively, the normalized warping function can be calculated at each point along the cross-section. CUFSM contains functionality for calculating the normalized warping function. The normalized warping function can also be calculated using procedures contained in Example II-1C of the AISI D100-17, Cold-Formed Steel Design Manual (AISI, 2018) or AISC Design Guide 9: Torsional Analysis of Structural Steel Members (Seaburg and Carter, 1997). The maximum warping stress occurs where the normalized warping function is the greatest. Additional information regarding bimoment can be found in the textbook Matrix Structural Analysis (McGuire et al, 1999). Utilizing CUFSM, the maximum value of the normalized warping function was determined to be Wn = 3.785 in.2 and located at the tip of the stiffener lip. The warping stress distribution from CUFSM graphical output is shown in Figure 6. The warping constant, utilizing the CUFSM “Section Property” module, is Cw = 1.0493 in.6 and the maximum bimoment determined from MASTAN2 is B = 0.555 kip-in.2 The maximum warping stress, according to the procedure shown in Example II-1C of the AISI D100-17, Cold-Formed Steel Design Manual, is therefore calculated as:
σw = n wBW C = ( )0.555 3.785 1.0493 = 2.00 ksi
P a g e | 9
Figure 5: Stud Bimoment Resulting From Shear Center Eccentricity From MASTAN2
Figure 6: Warping Stress Distribution From CUFSM
P a g e | 10 3b. Maximum Warping Stress Using AISC Design Guide 9
In lieu of using the bimoment capability of MASTAN2 to calculate the maximum warping stress, theoretical equations are available in Appendix C of AISC Design Guide 9: Torsional Analysis of Structural Steel Members (Seaburg and Carter, 1997). To determine the maximum warping stress, the principle of superposition is used. First, the stud is analyzed subjected to the uniform torque and considering that the bridging provides no rotational restraint. The rotational deformation at the locations of the bridging is then determined. The reaction at the bridging is then determined by the magnitude of force required to prevent rotational deformation at the bridging. This assumes that the flexural stiffness of the bridging is large compared to the rotational stiffness of the studs. A detailed example of this procedure is available in Example II-11 of the Cold-Formed Steel Design Manual (AISI, 2018). The rotation resulting from the uniformly distributed torque at the locations of bridging, presuming no restraint from the bridging, is calculated as follows with z = L/3 = 52 in.
a = wECGJ
= ( )( )( )( )
29500 1.1011300 0.000303
= 97.35 (AISC DG9, Eq. 3.12)
θ = 2 2 2
2 2ta L z z z L zcosh tanh sinh 1.0GJ L a 2a a2a L
− + − − (AISC DG9, Appendix C)
= ( )( )( )( )
( )( )
( )( )
( )
2 2
2 22156 5252 52cosh
156 97.352 97.35 1560.00208 97.3511300 0.000303 156 52tanh sinh 1.0
2 97.35 97.35
− + − −
= 0.341 rad The rotation due to a unit bridging torque applied at a = 1/3 is calculated as follows:
θ = ( )
LsinhTL z a L za1.0 cosh sinh
LGJ L L a atanha
a a − a + − ×
(AISC DG9, Appendix C)
= ( )( )( )
( )
( )( )( )( )
521.0 1 3156
1 3 156T 156 sinh97.35 1 3 15697.35 5211300 0.000303 cosh sinh156156 97.35 97.35tanh
97.35
− +
− ×
= T (1.547 rad / kip-in.)
P a g e | 11
The rotation due to a bridging torque, T, applied at a = 2/3 is calculated as follows:
θ = ( )
LsinhTL z a L za1.0 cosh sinh
LGJ L L a atanha
a a − a + − ×
(AISC DG9, Appendix C)
= ( )( )( )
( )
( )( )( )( )
521.0 2 3156
2 3 156T 156 sinh97.35 2 3 15697.35 5211300 0.000303 cosh sinh156156 97.35 97.35tanh
97.35
− +
− ×
= T (1.320 rad / kip-in.) Due to symmetry, the bridging force is therefore calculated by solving the following equation for the bridging forces, T:
0 = 0.341 rad + T (1.547 rad / kip-in.) + T (1.320 rad / kip-in.) T = −0.119 kip-in.
The warping normal stress is related to the second derivative of θ. The second derivative of θ for the distributed torque is calculated as follows:
θ″ = t z L z1.0 cosh tanh sinhGJ a 2a a
− + −
= ( )( ) ( )
0.00208 52 156 521.0 cosh tanh sinh11300 0.000303 97.35 2 97.35 97.35
− + −
= −0.0001374 in.−2
The second derivative of θ for the reaction from the first bridging (a = 1/3) location is:
θ″ =
LsinhT L za cosh sinh
LaGJ a atanha
a a −
= ( )( )( )
( )( )( )( )
1 3 156sinh
97.35 1 3 1560.119 52cosh sinh15697.35 11300 0.000303 97.35 97.35tanh
97.35
− −
= 0.0001077 in.−2
The second derivative of θ for the reaction from the second bridging (a = 2/3) location is:
θ″ =
LsinhT L za cosh sinh
LaGJ a atanha
a a −

P a g e | 12
= ( )( )( )
( )( )( )( )
2 3 156sinh
97.35 2 3 1560.119 52cosh sinh15697.35 11300 0.000303 97.35 97.35tanh
97.35
− −
= 0.00004700 in.−2
Using the principle of superposition, and the maximum warping normal function value determined previously, the maximum warping stress is calculated as:
θ″ = −0.0001374 + 0.0001077 + 0.00004700 = 0.0000173 in.−2
σw= EWnθ″ = 29500(3.785)(0.0000173) = 1.93 ksi (AISC DG 9, Eq. 4.3a)
3c. Maximum Warping Stress Using AISI D110-16, Design Example #2
The maximum warping stress can also be determined using the approach outlined in AISI D110-16, Design Example #2 (AISI, 2016a). Design Example #2 is based on the same geometry and loading as this example and therefore the results are directly comparable. In the approach applied in D110, the distributed force is decomposed into a force couple that acts horizontally at the flange centerlines on an effective “half-beam” section. The half-beam section is then analyzed as a continuous three-span beam and the resulting stresses determined. The resulting equivalent warping stress from this approach as calculated in D110 is 1.58 ksi.
3d. Discussion
In this section, the maximum warping stresses were calculated using three different approaches and summarized in Table 2. Approach A resulted in the highest predicted warping stress. Approach B was near to Approach A and Approach C resulted in a lesser predicted warping stress for this example.
Table 2: Maximum Warping Stress Comparison
Approach Maximum Warping Stress Percent Difference Versus MASTAN
A: MASTAN2 Bimoment 2.00 ksi —
B: AISC Design Guide 9 1.93 ksi −3.50%
C: AISI D110-16 1.58 ksi −21.0%
P a g e | 13
4. Flexural Strength Evaluation
The strength of the stud is evaluated based on the previous analyses. Since the cross-section meets the limits of applicability contained in AISI S100 Table B4.1-1, the safety factors, Ω, contained in Chapters E through H may be used. It is assumed in this example that the only holes that exist in the studs are at the locations where the bridging passes through the webs of the studs. Since the holes are located at third-points where the moment is less than at the midspan of the stud, it is determined by calculations not shown that the governing location is at midspan of the studs where a hole is not assumed to be present.
4a. Required Flexural Strength (AISI S100 Section B3.2.1)
The required flexural strength based on statics is:
M = wL2/8 = 37.3 (13)2 / 8 = 788 lb-ft = 9.46 kip-in.
4b. Available Flexural Strength – Yielding and Global Buckling
Fcre = 77.56 ksi (see Section 1b)
Fy = 33 ksi
For 2.78Fy > Fcre > 0.56Fy,
Fn = yy
cre
10F10 F 19 36F
−
= = 32.3 ksi (Eq. F2.1-4)
Mne = SfFn = (0.772)(32.3) = 24.9 kip-in. (Eq. F2.1-1)
Ωb = 1.67
Ma = Mne/Ωb = 24.9/1.67 = 14.9 kip-in. > 9.46 kip-in. OK (Eq. B3.2.1-2)
4c. Available Flexural Strength – Local Buckling Interacting With Yielding and Global Buckling
Mcr = 37.2 kip-in. (see Section 2)
λ
= ne crM M
= 24.9 37.2 = 0.818 (Eq. F3.2.1-3)
Since λ
> 0.776,
Mn =0.4 0.4
cr crne
ne ne
M M1 0.15 MM M
−
(Eq. F3.2.1-2)
= ( )0.4 0.437.2 37.21 0.15 24.9
24.9 24.9
−
= 24.1 kip-in.
Ωb = 1.67
Ma = Mn/Ωb = 24.1/1.67 = 14.4 kip-in. > 9.46 kip-in. OK (Eq. B3.2.1-2)
Since Mn ≠ Mne, an increase in Fy resulting from cold-work of forming in accordance with Section A3.3.2 is not applicable.
( ) ( )( )
10 3310 33 19 36 77.56
−

P a g e | 14 4d. Available Flexural Strength – Distortional Buckling
Mcrd = 42.1 kip-in. (see Section 2)
λd = y crdM M = 25.5 42.1 = 0.778 (Eq. F4.1-3)
Since λd > 0.673,
Mnd =
0.5 0.5crd crd
yy y
M M1 0.22 MM M
−
(Eq. F4.1-2)
= ( )0.5 0.542.1 42.11 0.22 25.5
25.5 25.5
−
= 23.5 kip-in.
Ωb = 1.67
Ma = Mnd/Ωb = 23.5/1.67 = 14.1 kip-in. > 9.46 kip-in. OK (Eq. B3.2.1-2)
Since Mnd ≠ My, an increase in Fy resulting from cold-work of forming in accordance with Section A3.3.2 is not applicable.
4e. Combined Bending and Torsional Loading
The location of the maximum combined warping and flexural stresses must be determined. The maximum flexural moment occurs at the mid-height of the stud and the maximum warping stress occurs at the bridging locations. A more refined analysis is permitted which accounts for corresponding flexural and warping stresses at a given location; however, for simplicity, an envelope of the maximum warping stresses and flexural stresses are combined in this example. The maximum flexural moment, as determined in Section 4a, is M = 9.46 kip-in. and occurs at mid-height of the stud. The maximum bimoment, as determined in Section 3a, is B = 0.555 kip-in.2 and occurs at the bridging locations. The combined warping and flexural stresses are evaluated at each point of the cross-section and the point of maximum stress is found as follows.
fbending = Mc/I
Where M is the flexural moment, c is the distance of the point on the cross-section from the neutral axis of the gross section, and I is the moment of the inertia about the axis of bending of the gross section.
ftorsion = BWns/Cw
Where B is the bimoment, Wns is the warping normal function of the point on the cross-section, and Cw is the warping coefficient of the gross section. The values of I and Cw are determined for the cross-section from CUFSM. The values of Wns are determined at each point on the cross-section from CUFSM. The maximum combination of fbending and ftorsion was found to occur at the junction of the stiffener lip and flange. In CUFSM, this is node number 8.
M = 9.46 kip-in. (Section 4a) c = zcg − z = 2.9775 − 0.0071 = 2.9704 in. (CUFSM Input at Node 8)
I = 2.3142 in.4 (CUFSM Section Property Output) fbending = Mc/I = 9.46(2.9704)/2.3142 = 12.1 ksi (Flexural Stress at Node 8)
B = 0.555 kip-in.2 (Section 3a)
Wns = 2.56 in.2 (CUFSM Warping Output at Node 8)
Cw = 1.05 in.6 (CUFSM Section Property Output)
P a g e | 15
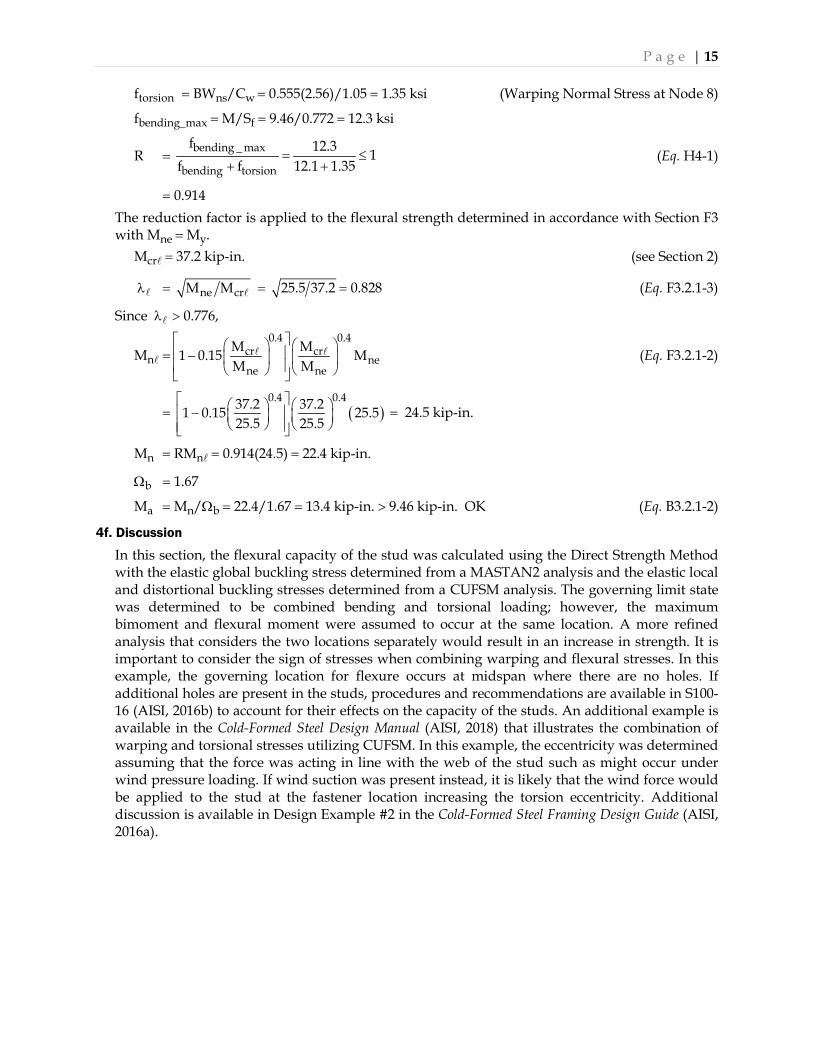
ftorsion = BWns/Cw = 0.555(2.56)/1.05 = 1.35 ksi (Warping Normal Stress at Node 8)
fbending_max = M/Sf = 9.46/0.772 = 12.3 ksi
R = (Eq. H4-1)
= 0.914 The reduction factor is applied to the flexural strength determined in accordance with Section F3 with Mne = My.
Mcr = 37.2 kip-in. (see Section 2)
λ
= ne crM M
= 25.5 37.2 = 0.828 (Eq. F3.2.1-3)
Since λ
> 0.776,
Mn =0.4 0.4
cr crne
ne ne
M M1 0.15 MM M
−
(Eq. F3.2.1-2)
= ( )0.4 0.437.2 37.21 0.15 25.5
25.5 25.5
−
= 24.5 kip-in.
Mn = RMn = 0.914(24.5) = 22.4 kip-in.
Ωb = 1.67
Ma = Mn/Ωb = 22.4/1.67 = 13.4 kip-in. > 9.46 kip-in. OK (Eq. B3.2.1-2)
4f. Discussion
In this section, the flexural capacity of the stud was calculated using the Direct Strength Method with the elastic global buckling stress determined from a MASTAN2 analysis and the elastic local and distortional buckling stresses determined from a CUFSM analysis. The governing limit state was determined to be combined bending and torsional loading; however, the maximum bimoment and flexural moment were assumed to occur at the same location. A more refined analysis that considers the two locations separately would result in an increase in strength. It is important to consider the sign of stresses when combining warping and flexural stresses. In this example, the governing location for flexure occurs at midspan where there are no holes. If additional holes are present in the studs, procedures and recommendations are available in S100-16 (AISI, 2016b) to account for their effects on the capacity of the studs. An additional example is available in the Cold-Formed Steel Design Manual (AISI, 2018) that illustrates the combination of warping and torsional stresses utilizing CUFSM. In this example, the eccentricity was determined assuming that the force was acting in line with the web of the stud such as might occur under wind pressure loading. If wind suction was present instead, it is likely that the wind force would be applied to the stud at the fastener location increasing the torsion eccentricity. Additional discussion is available in Design Example #2 in the Cold-Formed Steel Framing Design Guide (AISI, 2016a).
bending _ max
bending torsion
f 12.3 1f f 12.1 1.35
= ≤+ +
P a g e | 16
5. Maximum Bridging Forces by Second-Order Analysis
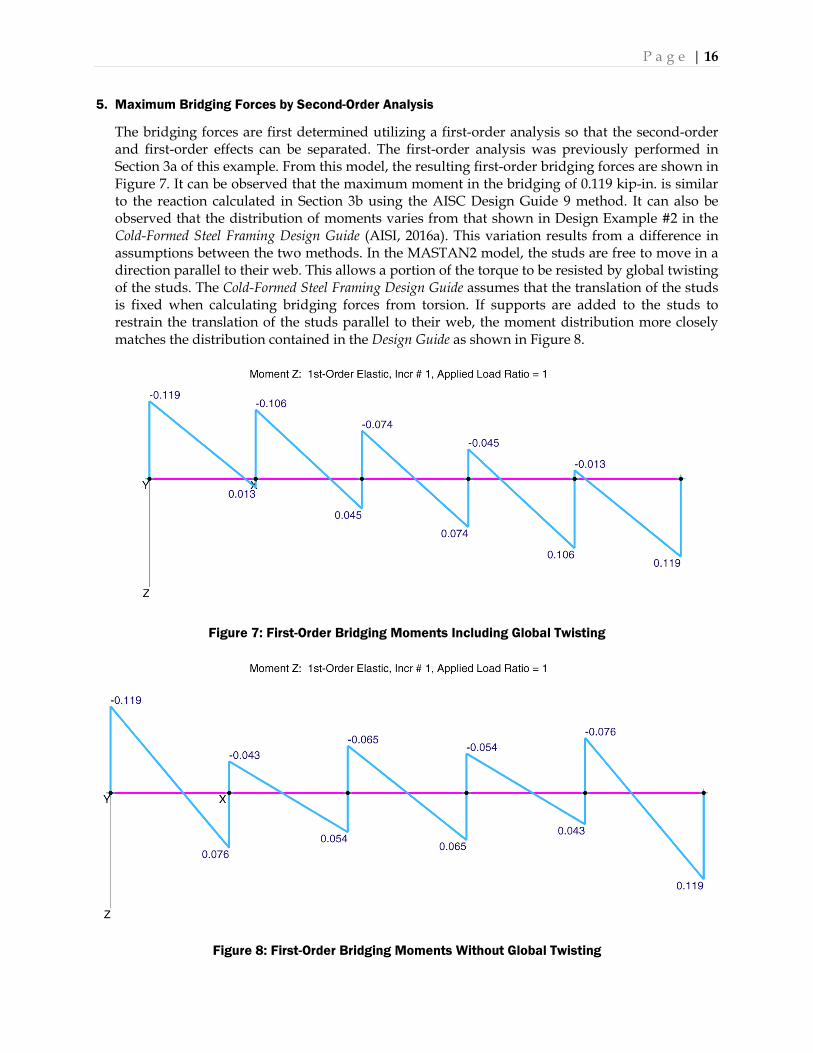
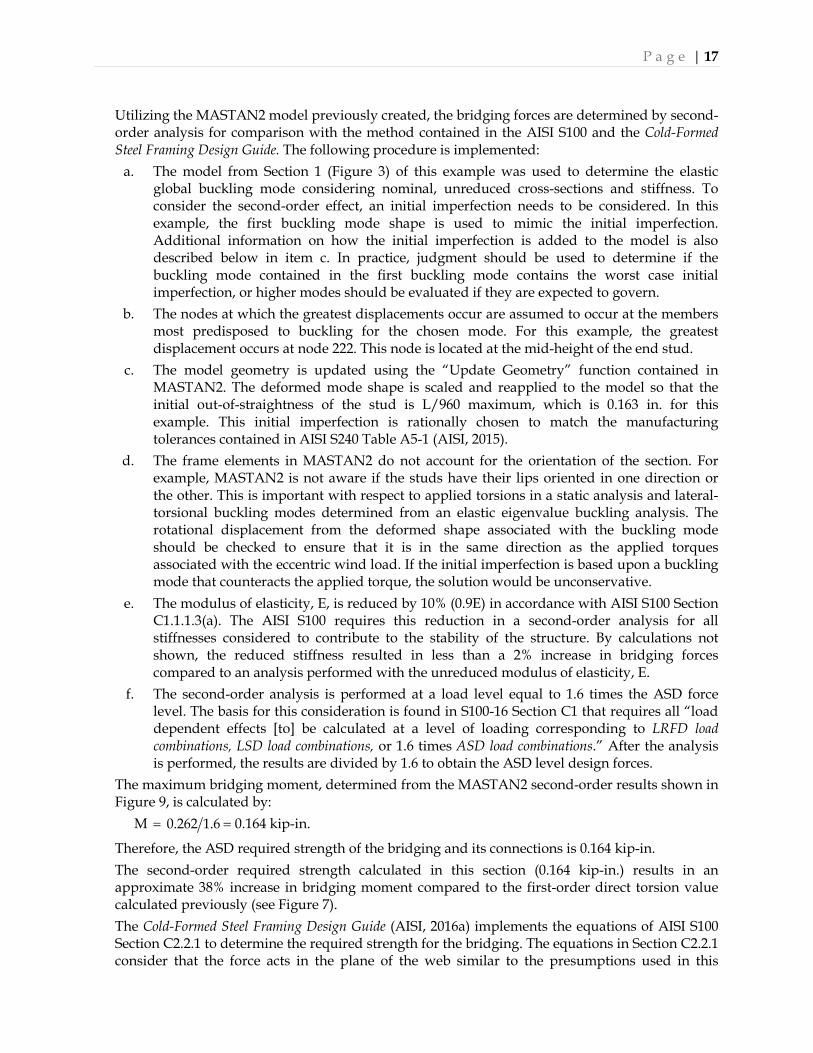
The bridging forces are first determined utilizing a first-order analysis so that the second-order and first-order effects can be separated. The first-order analysis was previously performed in Section 3a of this example. From this model, the resulting first-order bridging forces are shown in Figure 7. It can be observed that the maximum moment in the bridging of 0.119 kip-in. is similar to the reaction calculated in Section 3b using the AISC Design Guide 9 method. It can also be observed that the distribution of moments varies from that shown in Design Example #2 in the Cold-Formed Steel Framing Design Guide (AISI, 2016a). This variation results from a difference in assumptions between the two methods. In the MASTAN2 model, the studs are free to move in a direction parallel to their web. This allows a portion of the torque to be resisted by global twisting of the studs. The Cold-Formed Steel Framing Design Guide assumes that the translation of the studs is fixed when calculating bridging forces from torsion. If supports are added to the studs to restrain the translation of the studs parallel to their web, the moment distribution more closely matches the distribution contained in the Design Guide as shown in Figure 8.
Figure 7: First-Order Bridging Moments Including Global Twisting
Figure 8: First-Order Bridging Moments Without Global Twisting
P a g e | 17
Utilizing the MASTAN2 model previously created, the bridging forces are determined by second-order analysis for comparison with the method contained in the AISI S100 and the Cold-Formed Steel Framing Design Guide. The following procedure is implemented:
a. The model from Section 1 (Figure 3) of this example was used to determine the elastic global buckling mode considering nominal, unreduced cross-sections and stiffness. To consider the second-order effect, an initial imperfection needs to be considered. In this example, the first buckling mode shape is used to mimic the initial imperfection. Additional information on how the initial imperfection is added to the model is also described below in item c. In practice, judgment should be used to determine if the buckling mode contained in the first buckling mode contains the worst case initial imperfection, or higher modes should be evaluated if they are expected to govern.
b. The nodes at which the greatest displacements occur are assumed to occur at the members most predisposed to buckling for the chosen mode. For this example, the greatest displacement occurs at node 222. This node is located at the mid-height of the end stud.
c. The model geometry is updated using the “Update Geometry” function contained in MASTAN2. The deformed mode shape is scaled and reapplied to the model so that the initial out-of-straightness of the stud is L/960 maximum, which is 0.163 in. for this example. This initial imperfection is rationally chosen to match the manufacturing tolerances contained in AISI S240 Table A5-1 (AISI, 2015).
d. The frame elements in MASTAN2 do not account for the orientation of the section. For example, MASTAN2 is not aware if the studs have their lips oriented in one direction or the other. This is important with respect to applied torsions in a static analysis and lateral-torsional buckling modes determined from an elastic eigenvalue buckling analysis. The rotational displacement from the deformed shape associated with the buckling mode should be checked to ensure that it is in the same direction as the applied torques associated with the eccentric wind load. If the initial imperfection is based upon a buckling mode that counteracts the applied torque, the solution would be unconservative.
e. The modulus of elasticity, E, is reduced by 10% (0.9E) in accordance with AISI S100 Section C1.1.1.3(a). The AISI S100 requires this reduction in a second-order analysis for all stiffnesses considered to contribute to the stability of the structure. By calculations not shown, the reduced stiffness resulted in less than a 2% increase in bridging forces compared to an analysis performed with the unreduced modulus of elasticity, E.
f. The second-order analysis is performed at a load level equal to 1.6 times the ASD force level. The basis for this consideration is found in S100-16 Section C1 that requires all “load dependent effects [to] be calculated at a level of loading corresponding to LRFD load combinations, LSD load combinations, or 1.6 times ASD load combinations.” After the analysis is performed, the results are divided by 1.6 to obtain the ASD level design forces.
The maximum bridging moment, determined from the MASTAN2 second-order results shown in Figure 9, is calculated by:
M = 0.262 1.6 = 0.164 kip-in.
Therefore, the ASD required strength of the bridging and its connections is 0.164 kip-in. The second-order required strength calculated in this section (0.164 kip-in.) results in an approximate 38% increase in bridging moment compared to the first-order direct torsion value calculated previously (see Figure 7). The Cold-Formed Steel Framing Design Guide (AISI, 2016a) implements the equations of AISI S100 Section C2.2.1 to determine the required strength for the bridging. The equations in Section C2.2.1 consider that the force acts in the plane of the web similar to the presumptions used in this

P a g e | 18
example; however, the equations contain an additional 1.5 amplifier. Additional information regarding the derivation of these equations is available in the Commentary to AISI S100 Section C2.2.1. It is expected that the 1.5 is a conservative value; however, the results using this method more closely match the second-order analysis in this example. A summary of the design bridging moments is contained in Table 3.
Table 3: Comparison of Bridging Required Strengths
Approach ASD Required Strength for Bridging
Percent Difference Versus D110-16 Design Example #2
A: D110-16 Design Example #2 0.163 kip-in. —
B: First-order direct torsion only from MASTAN2 analysis
0.119 kip-in. −27.0%
C: Second-order MASTAN2 analysis including direct and
stability torsions
0.164 kip-in. +0.61%
Figure 9: Second-Order Bridging Moments Including Global Twisting – at 1.6 Times ASD Level
P a g e | 19
6. Observations
This example compared analysis-based methods with the methods contained in Design Example #2 of the Cold-Formed Steel Framing Design Guide for the determination of warping stresses, elastic buckling properties, and bridging required strengths. Additionally, the following key observations were made with respect to this example:
1. The 1.5 factor contained in AISI S100 Section C2.2.1 is assumed to be a conservative factor; however, it approximates the second-order analysis performed in this example as follows:
(0.119 kip-in.)(1.5) = 0.179 kip-in. > 0.164 kip-in. (9% difference) 2. The MASTAN2 buckling analysis does not differentiate between lateral-torsional buckling
toward members in a given left or right direction. The direction of the applied torques must therefore be evaluated to ensure that they are additive to the direction of buckling and initial imperfection.
3. The use of the reduced modulus of elasticity (0.9E) has a negligable effect on the results of this second-order analysis.
4. The second-order effects on the magnitude of the applied torsion on the stud were not considered in this example.
References
American Iron and Steel Institute (2006), Direct Strength Method (DSM) Design Guide, Design Guide CF 06-1, Washington, DC, 2006.
American Iron and Steel Institute (2015), AISI S240-15, North American Standard for Cold-Formed Steel Structural Framing, Washington, DC, 2015.
American Iron and Steel Institute (2016a), AISI D110-16, Cold-Formed Steel Framing Design Guide, Washington, DC, 2016.
American Iron and Steel Institute (2016b), AISI S100-16, North American Specification for the Design of Cold-Formed Steel Structural Members, Washington, DC, 2016.
American Iron and Steel Institute (2018), AISI D100-17, Cold-Formed Steel Design Manual, Washington, DC, 2018.
Li, Z. and B.W. Schafer (2010), “Buckling Analysis of Cold-Formed Steel Members with General Boundary Conditions using CUFSM: Conventional and Constrained Finite Strip Methods,” Proceedings of the 20th International Specialty Conference on Cold-Formed Steel Structures, St. Louis, MO, November, 2010.
Li, Z. and B.W. Schafer (2011), “Tabulated Local and Distortional Elastic Buckling Solutions for Standard Shapes,” Tech Note G103-11a, Cold-Formed Steel Engineers Institute, 2011.
McGuire, W., R.H. Gallagher, and R.D. Ziemian (1999). Matrix Structural Analysis, Wiley, 1999.
Seaburg, P. A. and C.J. Carter (1997), Steel Design Guide Series 9: Torsional Analysis of Strucutral Steel Members, American Institute of Steel Construction, Chicago, IL, 1997.
Ziemian, R.D. (Editor) (2010), Guide to Stability Design Criteria for Metal Structures, Sixth Edition, John Wiley and Sons, New York, NY, 2010.
Ziemian, R.D. and W. McGuire (2010), “MASTAN2,” Version 3.3, Computer Software, Wiley, Hoboken, NJ, 2010.

Note: The input data files can be downloaded from the following link:
https://www.dropbox.com/s/4zs0kf1az2rew2e/RP18-
2_CUFSM%26MASTAN%20InputFiles.zip?dl=0
Res
earc
h R
epor
t R
P-1
8-2
American Iron and Steel Institute
25 Massachusetts Avenue, NW Suite 800 Washington, DC 20001 www.steel.org