design and modelling of a reversible 3-phase to 6-phase ... thesis... · design and modeling of a...
TRANSCRIPT

DESIGN AND MODELING OF A REVERSIBLE 3-PHASE TO 6-PHASE
INDUCTION MOTOR FOR IMPROVED SURVIVABILITY
UNDER FAULTY CONDITIONS
by
Anushree Anantharaman Kadaba, B.S.E.E.
A Thesis Submitted to the Faculty
of the Graduate School,
Marquette University,
in Partial Fulfillment of
the Requirements for
the Degree of
Master of Science in Electrical and Computer Engineering
Milwaukee, Wisconsin
May, 2008

i
ABSTRACT
The Conventional standard three-phase induction motors have an inherent drawback in so
far as performance under loss of phase conditions. The two-Phase operation of a three-phase
induction motor doesn’t provide the necessary performance such as torque and output power
under applications which require high reliability such as in electric traction applications, electric
ship propulsion, etc. Therefore one of the means to overcome this drawback is by the addition of
more phases, which forms the main focus of this thesis.
The objective of this thesis is to develop a unique design for an induction motor which can
function in both the three-phase and six-phase modes thus obtaining a reversible three-phase to
six-phase operation. The functionality of this motor serves the purpose of a reliable operation in
the case of loss of phase or phases. In this thesis, a case-study 3-phase, 5-hp squirrel cage, 60hz,
6-pole, induction motor was tested and modeled using time-stepping finite-element simulation.
This motor was redesigned in this work for a six-phase stator winding configuration. This
redesigned motor was simulated under different types of phase loss scenarios using time-stepping
finite-element technique. A comparative analysis of the various phase loss conditions of the six-
phase configuration with respect to the healthy six-phase case is presented. The analysis of the
torque-ripple content with the help of current-space vector concepts was introduced. The ripple
content in the torque is shown to improve with the reversible three-phase to six-phase design
under loss of phase conditions. There are some thermal issues with regard to performance under
loss of phase conditions which emerged in light of the values of the stator phase currents under
such faults.

Abstract ii
In conclusion, it was shown that the reversible motor design appears promising in so far as
maintaining performance quality under faulty conditions, far better than the conventional three-
phase design.. Practical application of such a design would yield better results and an effective
means to provide higher performance sustainability /reliability under loss of phase / phases.

iii
ACKNOWLEDGEMENT
To Be Completed
iv
TABLE OF CONTENTS
List of Figures ………………………………………………………………………….. vi
List of Tables …………………………………………………………………………… xiv
Chapter 1: Introduction
1.1 Background ………………………………………………………………… 1
1.2 Literature Review ………………………………………………………….. 1
1.3 Thesis Contribution ………………………………………………………... 6
1.4 Thesis Organization ……………………………………………………….. 6
Chapter 2: Design of the three-phase case-study induction motor
2.1 Introduction …………………………………………………………………... 8
2.2 Basics of designing polyphase A.C. windings………………………………… 8
2.2.1 Basic rules for designing A.C. windings……………………………. 9
2.3 Design formulations and layout of the 5-HP case-study
three-phase induction motor …………………………………………………. 12
2.3.1 List of symbols …………………………………………………... 14
2.3.2 Characteristics of motor under study……………………..................15
2.3.3 Derivation of torque in closed form using design equations………. 16
2.4 Winding of stator……………………………………………………………. 20
2.4.1 MMF distribution…………………………………………………... 26
Chapter 3: Reconfiguration of a three-phase induction machine to a six-phase induction machine
3.1 Introduction ………………………………………………………………… 29
3.2 Steps involved in the stator winding reconfiguration process…………….. 30
3.3 Some considerations for the six-phase winding……………………………… 34
3.4 Connection scheme for the six-phase winding configuration………………... 36
3.5 The development of the six-phase winding……………………………………39
Chapter 4: Design of the six-phase induction motor
4.1 Introduction ………………………………………………………………… 43
4.2 The constraints and steps involved in the design…………………………….. 43

v
4.2.1 Some important characteristics of a “good winding”…………….. 44
4.3 Parameters of the six-phase induction motor………………………………... 44
4.3.1 Calculation of the number of turns per phase for the design………45
4.3.2 Calculation of the voltage rating of the six-phase motor…………. 48
4.4 Design of the stator winding………………………………………………….49
4.4.1 MMF distribution………………………………………………… 64
4.5 Connection scheme for the reversible three-phase to six-phase motor……….66
Chapter 5: Fundamentals of the time stepping finite element method
5.1 Introduction ………………………………………………………………... 70
5.2 Development of the finite element method…………………………………. 70
5.2.1 Basic Principles…………………………………………………….71
5.2.2 Finite element formulation…………………………………………73
5.2.3 Solution techniques……………………………………………… 75
5.3 The time stepping finite element method………………………………….. 76
Chapter 6: Experimental and Simulation Results
6.1 Introduction ………………………………………………………………. 80
6.2 Comparison of experimental and simulation results of the
three-phase operation ……………………… ………………………………. 81
6.3 Comparison of the time-stepping finite element simulation results of the
three-phase operation and six-phase operation…………………….……. 87
6.4 Simulation of the six-phase induction motor under various phase loss
scenarios……………………………………………………………………… 94
6.4.1 5-phase healthy and pne faulty phase operation……………………94
6.4.2 The four healthy phase-Two faulty phase operation………………..98
6.4.2.1 Loss of two adjacent phase……………………………… 98
6.4.2.2 Loss of two-non adjacent phases……………………… 102
6.4.3 The three-healthy phase and three faulty phase operation…………109
6.4.3.1 Loss of three adjacent phases……………………………110
6.4.3.2 Loss of three-non-adjacent phases………………………114
6.4.4 Simulation of the two-phase healthy operation with one faulty
phase in a three-phase motor……………………………………….121

vi
6.5 Observations and discussions on the reasons for torque ripples
in the faulty phase operations using current space vector concepts…………...125
6.5.1 Harmonic analysis and observations………………………………..131
6.5.2 Discussion about derating of the motor under various fault
scenarios……………………………………………………………..135
6.5.2.1 Verification of derating of the motor for the 5-healthy
phase and one faulty phase condition with loss of phase
A by time-stepping finite-element simulation…………….137
Chapter 7: Conclusions and Recommendations
7.1 Conclusions ………………………………………………………………. 146
7.2 Recommendations for Future Work ……………………………………… 147
References ……………………………………………………………………………. 149

vii
LIST OF FIGURES
2-1 Single Layer phase layout ………………………………………………… 10
2-2 Double layer phase layout ……………………………………………....... 12
2-3 Phasor representation of induced emfs on both sides of a single turn in
case of short-pithced coil………………………………………………………… 17
2-4 Flux Density Distribution per pole …………………………..………………. 19
2-5 MMF Distribution in the uniform air-gap …………………………………… 19
2-6 Phasor diagram of conductor emfs showing slots carrying their
respective phases. …………………………………………………………. 21
2-7 Spatial distribution of the Three Phases……………………………………… 22
2-8 Cross-Sectional view of stator slots showing the winding distributions
of the three phases for the short-pitched design………………………………….. 23
2-9 Cross-Sectional view of stator slots showing the winding distributions
of the three phases for the full-pitched design……………………………………. 24
2-10 Complete Winding Layout showing the connection of all the coils ………… .. 25
2-11 MMF Distribution produced by the Three-Phase winding under study …………. 27
3-1 Y-Connection of the 2 coil groups for Three-Phase Operation ………………… 30
3-2 Phasor representation Of Voltages In each coil group……………………………..31
3-3 Phasor diagram of Volatge across the coil groups for the high-voltage
connection ………………………………………………………………….. 32
3-4 Phasor diagram of Volatge across the coil groups for the low-voltage connection 33
3-5 Rearrangement Of the Voltage Phasors to form the Six-Phase configuration … 35
3-6 Connection Scheme For the Six-Phase winding ………………………………… 36
3-7 Spatial Distribution of phases in the Three-Phase And the Redesigned Six-Phase
configurations …………………………………………………………….. 38
3-8 Development Of The Six-Phase Winding ……………………………………. 40
3-9 Cross-sectional view of the stator slots showing the winding distributions of the Six
Phases.……….. ……………………………………………………………………42
4-1 Phasor diagram of the line and phase voltages in the 6-phase system …………… 48

viii
4-2 Six-Phase winding layout with, no. of poles = 6 , no. of slots per pole per phase = 1,
Double layered , lap-connected full pitch winding ……... ………………………...50
4-3 Connection Of the different Groups in the three-Phase configuration …….. 51
4-4 Connection Of the different Groups to form the Six-Phase configuration…….. 52
4-5 Connection of the coils of Group I and II constituting Phase A of the three-phase
machine ……………………………………………………………………….. 53
4-6 Connection of the coils of Group III and IV constituting Phase B of the three-phase
machine ……………...............................................................................................54
4-7 Connection of the coils of Group V and VI constituting Phase C of the three-phase
machine ……………………………………………………………………….. 55
4-8 Connection of coils of Group I constituting Phase A of the six-phase
machine…………………………………………………………………….. 56
4-9 Connection of coils of Group II constituting Phase D of the six-phase machine….57
4-10 Connection of coils of Group III constituting Phase C of the three-phase machine 58
4-11 Connection of coils of Group IV constituting Phase F of the six-phase machine 59
4-12 Connection of coils of Group V constituting Phase E of the six-phase machine …60
4-13 Connection of coils of Group VI constituting Phase B of the six-phase machine 61
4-14 Cross-sectional view of the stator slots showing the winding distributions of the
Six Phases. ………………………………………………………………… 62
4-15 Complete Winding layout Of The Reconfigured Six-Phase induction machine
Showing connections of all the coils……………………………………………….63
4-16 The mmf distribution produced by the currents in the six windings of the six-phase
machine. …………………………………………………………………… 65
4-17 Connection Scheme For Six-Phase Operation ……………………………. 67
4-18 Connection Scheme For Three-Phase Operation……………………………………….69
5-1 Typical triangular finite element connected to other finite elements………………74
5-2 Finite-element mesh of a portion of the case-study 5HP induction motor…. 78
6-1 Flow-Chart of types of phase-loss scenarios studied …………………………… 81
6-2 Line voltages obtained from experimental test for the case study 5HP , 3-phase
induction conditions ………………………………………………………. 82
6-3 Line voltages obtained from the TSFE simulation for the 5HP, 3-phase
induction motor ……………………………………………………………. 82

ix
6-4 Phase Currents obtained from experimental test for the 5HP, 3-phase induction
motor ………………………………………………………………………….. 83
6-5 Phase Currents obtained from the TSFE simulation for the 5HP, 3-phase
induction motor ……………………………………………………………. 83
6-6 steady state torque profile from experimental test for the 5HP , 3-phase
induction motor …………………………………………………………… 84
6-7 steady state torque profile from the TSFE simulation for the 5HP , 3-phase
induction motor ……………………………………………………………. 84
6-8 Flux plot of the 3-phase machine ……………………………………………. 88
6-9 Flux plot of the 6-phase machine ……………………………………………. 88
6-10 Plot of phase voltages in the 3-phase machine………………………………… 89
6-11 Plot of phase voltages in the 6-phase machine …………………………………… 89
6-12 Plot of flux-density in the mid-airgap of the 3-phase induction machine from
TSFE simulation …………………………………………………………….. 90
6-13 Plot of flux-density in the mid-airgap of the 6-phase induction machine from TSFE
simulation……………………………………………………………………. 90
6-14 Phase currents ia , ib and ic of the 3-phase induction machine from TSFE
simulation …………………………………………………………………. 91
6-15 Phase currents ia , ib , ic , id , ie and if of the 6-phase induction machine from
TSFE simulation……………………………………………………………….. 91
6-16 Torque profile of 3-phase induction motor under rated conditions from TSFE
simulation …………………………………..................................................... 92
6-17 Torque profile of 6-phase induction motor under rated conditions from TSFE
simulation ………………………………………………………………………… 92
6-18 Speed profile of 3-phase induction motor under rated conditions from TSFE
simulation……………………………………………………………………….. 93
6-19 Speed profile of 6-phase induction motor under rated conditions from TSFE
simulation ……………………………………………………………………… 93
6-20 Phasor representation of the voltages in six-phase healthy operation……………..95
6-21 Phasor representation of the voltages in the five-phase operation with loss
of Phase A ………….. …………………………………………………………...95
6-22 Torque profile of the healthy 6-phase case under full-load………………………. 96

x
6-23 Torque profile of the 5-healthy phase case with loss of phase A ……………… 96
6-24 Harmonic spectrum of the torque profile of the healthy 6-phase case ……….. 96
6-25 Harmonic spectrum of the torque profile of the 5-healthy phase case with loss
of phase A …………………………………………………………………….. 96
6-26 Phase currents ia , ib , ic , id , ie and if of the 5-healthy and one faulty phase
operation of the six-phase induction motor ……………………............................97
6-27 Phase currents ia , ib , ic , id , ie and if of the healthy six-phase induction motor…... 96
6-28 Flow chart summarizing the various cases of 4-phase operations studied........… 98
6-29 Phasor representation of the voltages in six-phase healthy operation ………… 99
6-30 Phasor representation of the voltages in the four-healthy phase operation with loss
of adjacent phases A and B ……………………………………………………. 99
6-31 Torque profile of the healthy 6-phase case under full-load…………………. 100
6-32 Torque profile of the 4-healthy phase case with loss two adjacent phases A
and B ………………………………………………………………………. 100
6-33 Harmonic spectrum of the torque profile of the healthy 6-phase case …………..100
6-34 Harmonic spectrum of the torque profile of the 4-healthy phase
case with loss of adjacent phases A and B …….............................................. 100
6-35 Phase currents ia , ib , ic , id , ie and if of the 4-healthy and two faulty phase
operation of the six-phase induction motor with loss of adjacent phases
A and B………………………………………………………………………… 101
6-36 Phase currents ia , ib , ic , id , ie and if of the healthy six-phase induction motor… 101
6-37 Phasor representation of the voltages in six-phase healthy operation………… 103
6-38 Phasor representation of the voltages in the four-healthy phases with
two non-adjacent faulty phase separated by 1200 e operation with loss
of phases A and C ………………………………………………………. …… 103
6-39 Torque profile of the healthy 6-phase case under full-load………………………104
6-40 Torque profile of the 4-healthy phase case with loss two non-adjacent phases separated
by 1200 e i.e. phases A and C ……………………………………………… 104
6-41 Harmonic spectrum of the torque profile of the healthy 6-phase case ………… 104

xi
6-42 Harmonic spectrum of the torque profile of the 4-healthy phase case with loss of non-
adjacent phases A and C …………………………………………………….. 104
6-43 Phase currents ia , ib , ic , id , ie and if of the 4-healthy and two faulty phase operation of
the six-phase induction motor with loss of non-adjacent phases A and C ……… 105
6-44 Phase currents ia , ib , ic , id , ie and if of the healthy six-phase induction motor ….. 105
6-45 Phasor representation of the voltages in six-phase healthy operation……………...106
6-46 Phasor representation of the voltages in the four-healthy phase with two non-adjacent
faulty phase separated by 1800 e operation with loss of phases A and D …………106
6-47 Torque profile of the healthy 6-phase case under full-load…………………… 107
6-48 Torque profile of the 4-healthy phase case with loss two non-adjacent phases separated
by 1800 e i.e. phases A and D) ………………………………………………….. 107
6-49 Harmonic spectrum of the torque profile of the healthy 6-phase case………… 107
6-50 Harmonic spectrum of the torque profile of the 4-healthy phase case with
loss of non-adjacent phases A and D …………………………………………… 107
6-51 Phase currents ia , ib , ic , id , ie and if of the 4-healthy and two faulty phase
operation of the six-phase induction motor with loss of non-adjacent phases
A and D…………………………………………………………………………….108
6-52 Phase currents ia , ib , ic , id , ie and if of the healthy six-phase induction motor… 108
6-53 Flow chart summarizing the various cases of 3-phase operations studied…………. 110
6-54 Phasor representation of the voltages in six-phase healthy operation……………...111
6-55 Phasor representation of the voltages in the three healthy phase with three
adjacent faulty phase loss operation with loss of phases A, B and C………………111
6-56 Torque profile of the healthy 6-phase case under full-load ………………………..112
6-57 Torque profile of the 3-healthy phase case with loss three adjacent phases separated by
600 e i.e. phases A , B and C …………………………………………………… 112
6-58 Harmonic spectrum of the torque profile of the healthy 6-phase case……………. 112
6-59 Harmonic spectrum of the torque profile of the 3-healthy phase case with loss of three
adjacent phases A,B and C …… …………………………………………………... 112
6-60 Phase currents ia , ib , ic , id , ie and if of the 3-healthy and three faulty phase operation
of the six-phase induction motor with loss of adjacent phases A , B and C ……… 113
6-61 Phase currents ia , ib , ic , id , ie and if of the healthy six-phase induction motor… 113
6-62 Phasor representation of the voltages in six-phase healthy operation……… 115

xii
6-63 Phasor representation of the voltages in the three healthy phase with three
non-adjacent phase loss operation separated by1200 e each i.e. with loss of
phases A, C and E………………………………………………………………….115
6-64 Torque profile of the healthy 6-phase case under full-load ………………………. 116
6-65 Torque profile of the 3-healthy phase case with loss three non- adjacent phases
separated by 1200 e i.e. phases A , C & E……………………………………… 116
6-66 Harmonic spectrum of the torque profile of the healthy 6-phase case……………..116
6-67 Harmonic spectrum of the torque profile of the 3-healthy phase case with
loss of three non-adjacent phases A,C & E ……………………………………….116
6-68 Phase currents ia , ib , ic , id , ie and if of the 3-healthy and three faulty phase
operation of the six-phase induction motor with loss of non-adjacent phases
A , C and E………………………………………………………………………. 117
6-69 Phase currents ia , ib , ic , id , ie and if of the healthy six-phase induction motor……117
6-70 Phasor representation of the voltages in six-phase healthy operation……………...118
6-71 Phasor representation of the voltages in the three healthy phase with three
non-adjacent faulty phase loss operation with loss of phases A, B and D………….118
6-72 Torque profile of the healthy 6-phase case under full-load……………………… 119
6-73 Torque profile of the 3-healthy phase case with loss three non- adjacent
phases separated by 1200 e and 60 0 e i.e. phases A , B and D…………………… 119
6-74 Harmonic spectrum of the torque profile of the healthy 6-phase case…………… 119
6-75 Harmonic spectrum of the torque profile of the 3-healthy phase case with loss of three
non-adjacent phases A,B & D………………………………………………………119
6-76 Phase currents ia , ib , ic , id , ie and if of the 3-healthy and three faulty phase
operation of the six-phase induction motor with loss of non-adjacent phases
A , B and D…………………………………………………………………………120
6-77 Phase currents ia , ib , ic , id , ie and if of the healthy six-phase induction motor……120
6-78 Phasor representation of the voltages in three-phase healthy operation……………122
6-79 Phasor representation of the voltages in the two healthy phase with loss of phase A. 122
6-80 Torque profile of the healthy 6-phase case under full-load……………………… 123
6-81 Torque profile of the 2-healthy phase case with loss of phase A………………… 123
6-82 Harmonic breakdown of the torque profile of the healthy 6-phase case………… 123
xiii
6-83 Harmonic breakdown of the torque profile of the 2-healthy phase case with
loss of phase A……………………………………………………………………… 123
6-84 Phase currents ia , ib , ic of the 2-healthy and one faulty phase operation of the three-phase
induction motor with loss of phase A………………………………………………... 124
6-85 Phase currents ia , ib , ic of the healthy three-phase induction motor…………………124
6-86 Locus of current space vector in the healthy 6-phase operation in a 6-phase motor…126
6-87 Locus of current space vector in the healthy 3-phase operation in a three-phase motor126
6-88 Locus of current space vector in the one faulty phase operation with loss of phase A in a
6-phase motor………………………………………………………………………………….127
6-89 Locus of current space vector in two faulty phases operation with loss of adjacent phases
A and B in a 6-phase motor……………………………………………………………………127
6-90 Locus of current space vector in the two faulty phases operation with loss of non-
adjacent phases separated by e0180 i.e. phases A and D in a 6-phase motor……………….128
6-91 Locus of the current space vector in the two faulty phases operation with loss of non-
adjacent phases separated by e0120 i.e. phases A and C, in a 6-phase motor……………….128
6-92 Locus of the current space vector in the three faulty phase operation with loss of non-
adjacent phases separated by e0120 i.e. phases A , C and E, in a 6-phase motor……………129
6-93 Locus of the current space vector in the three faulty phases operation with loss of
adjacent phases separated by e060 i.e. phases A , B and C, in a 6-phase motor……………..129
6-94 Locus of current space vector in the three-faulty phases operation with loss of non-
adjacent phases separated by e0120 and e060 i.e. phases A, B and D , in a 6-phase motor.130
6-95 Locus of the current space vector in the one-faulty phase operation with loss of Phase A ,
in a three-phase motor………………………………………………………………………….130
6-96 Variation of 2nd order harmonic in different cases…………………………………….131
6-97 Harmonic spectrum of the 6-phase healthy case…………………………………… 132 6-98 Harmonic spectrum of the 5-healthy phase and one faulty phase case………………..132 6-99 Harmonic Spectrum of the 4-healthy phase and two adjacent faulty phases A and B...132 6-100 Harmonic Spectrum of the 4-healthy phase and two non-adjacent faulty phases A and C………………………………………………………………….132

xiv
6-101 Harmonic Spectrum of the 4-healthy phase and two non-adjacent faulty phases A and D………………………………………………………………….132 6-102 Harmonic Spectrum of the 3-healthy phase and 3 adjacent faulty phases A ,B and C………………………………………………………………132 6-103 Harmonic Spectrum of the 3-healthy phase and 3 non- adjacent faulty phases A ,C and E………………………………………………………………………………………...132 6-104 Harmonic Spectrum of the 3-healthy phase and 3 non- adjacent faulty phases A ,B and D……………………………………………………………….132 6-105 Harmonic Spectrum of the 2-healthy phase and one faulty phase of a three phase motor…………………………………………………….132 6-106 Summarized chart showing the torque ripple content under different cases…………. 133 6-107 Phase currents in the 5-healthy and one faulty phase with loss of phase A before derating
the motor from TSFE simulation………………………………………………………………..140 6-108 Phase currents in the 5-healthy and one faulty phase with loss of phase A after derating the motor from TSFE simulation………………………………………………………………..140

xv
LIST OF TABLES
2-1 Possible slot combinations of 3-phase induction motors which can be readily reconfigured
to 6-phase induction motors……………………………………………………………..13
3-1 Relationship between Coils of The Three-Phase winding and their corresponding phases
in the Six-Phase machine……………………………………………………………......39
6-1 Harmonic breakdown of the experimental versus the TSFE simulation results of the line-
to-line voltage for the case study 5hp Induction motor………………………………...85
6-2 Harmonic breakdown of the experimental versus the TSFE simulation results of the
phase current for the case study 5hp Induction motor………………………………….86
6-3 Harmonic breakdown of the experimental versus the TSFE simulation results of the
torque for the case study 5hp Induction motor…………………………………………87
6-4 RMS values of phase currents under the various cases considered……………134
6-5 Power rating and the corresponding torque under various conditions after derating the
motor……………………………………………………………………………………144

1
CHAPTER 1: INTRODUCTION
1.1 BACKGROUND
In general, motors are classified by type and by electrical supply requirements. Basically
there are two broad classifications of alternating current machines. One type is the poly-phase
synchronous motor, in which the magnetic field associated with the rotor results from a rotor
(field) winding excited by direct current via slip rings or brushless exciter from permanent
magnets on the rotor structure. The second type of alternating current machine is the poly-phase
or single phase induction machine , in which the rotor magnetic field is created by
electromagnetic induction effects. Of all the electrical machines, Induction motors are probably
the most common in industry due to their simplicity, rugged structure, cheapness and easy
maintainability.
1.2 LITERATURE REVIEW
Very early Induction motors had two phases [1], but the three-phase version very soon
replaced these, and this eliminated the third harmonic problems associated with two-phase
machines and resulted in a motor that was generally better in all performance aspects. Increasing
the number of phases beyond three, though may be costly, has advantages which might be worth
considering for certain special applications.Among the advantages of poly-phase (more than
three) machines are the following
• Improved reliability since loss of one of many phases does not prevent the motor
from starting and running
Chapter 1: Introduction 2
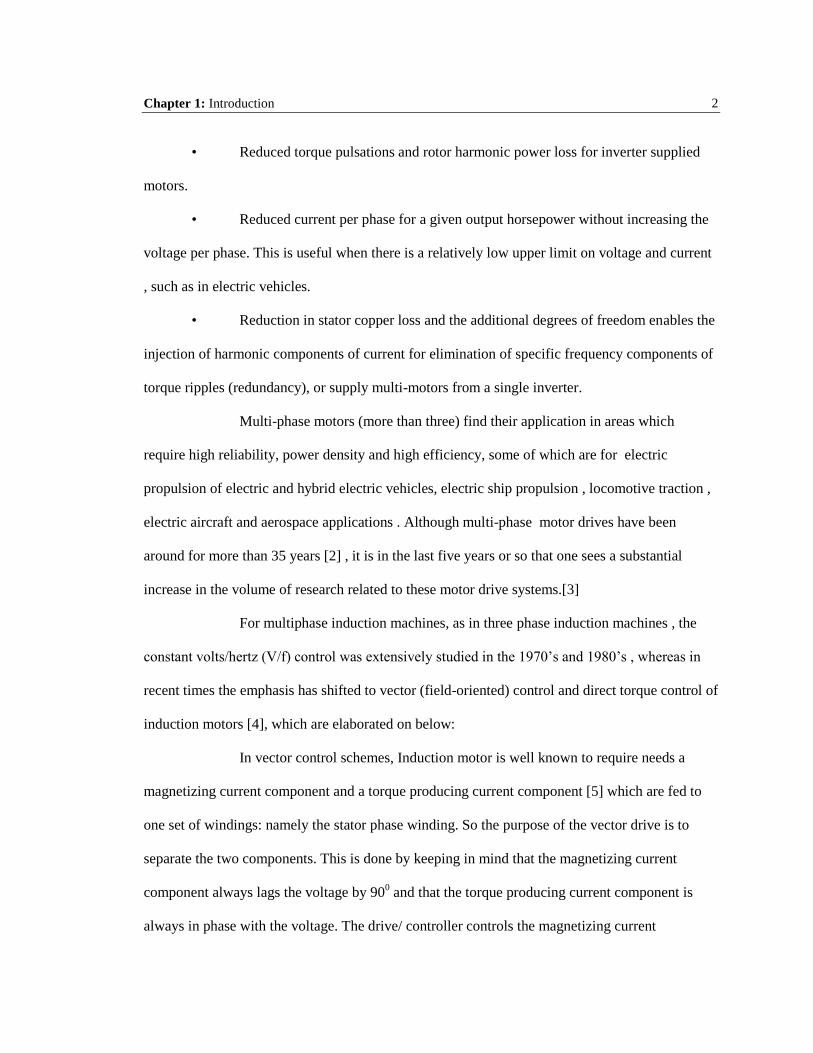
• Reduced torque pulsations and rotor harmonic power loss for inverter supplied
motors.
• Reduced current per phase for a given output horsepower without increasing the
voltage per phase. This is useful when there is a relatively low upper limit on voltage and current
, such as in electric vehicles.
• Reduction in stator copper loss and the additional degrees of freedom enables the
injection of harmonic components of current for elimination of specific frequency components of
torque ripples (redundancy), or supply multi-motors from a single inverter.
Multi-phase motors (more than three) find their application in areas which
require high reliability, power density and high efficiency, some of which are for electric
propulsion of electric and hybrid electric vehicles, electric ship propulsion , locomotive traction ,
electric aircraft and aerospace applications . Although multi-phase motor drives have been
around for more than 35 years [2] , it is in the last five years or so that one sees a substantial
increase in the volume of research related to these motor drive systems.[3]
For multiphase induction machines, as in three phase induction machines , the
constant volts/hertz (V/f) control was extensively studied in the 1970’s and 1980’s , whereas in
recent times the emphasis has shifted to vector (field-oriented) control and direct torque control of
induction motors [4], which are elaborated on below:
In vector control schemes, Induction motor is well known to require needs a
magnetizing current component and a torque producing current component [5] which are fed to
one set of windings: namely the stator phase winding. So the purpose of the vector drive is to
separate the two components. This is done by keeping in mind that the magnetizing current
component always lags the voltage by 900 and that the torque producing current component is
always in phase with the voltage. The drive/ controller controls the magnetizing current
Chapter 1: Introduction 3
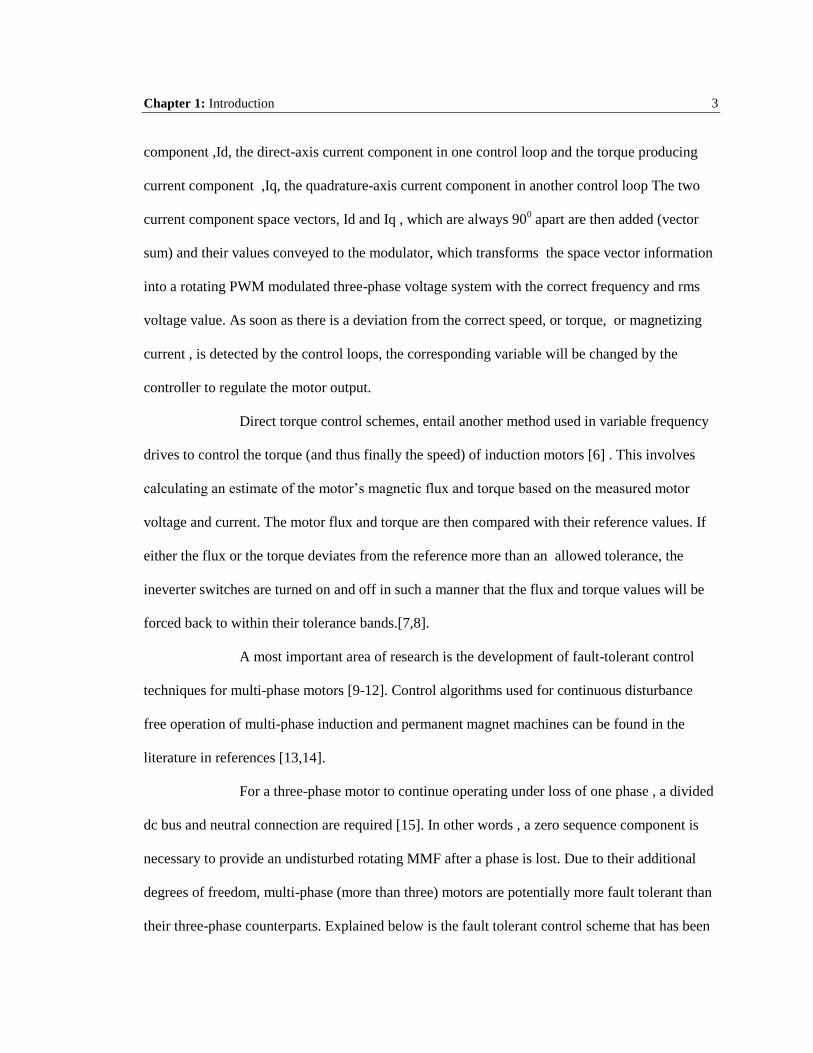
component ,Id, the direct-axis current component in one control loop and the torque producing
current component ,Iq, the quadrature-axis current component in another control loop The two
current component space vectors, Id and Iq , which are always 900 apart are then added (vector
sum) and their values conveyed to the modulator, which transforms the space vector information
into a rotating PWM modulated three-phase voltage system with the correct frequency and rms
voltage value. As soon as there is a deviation from the correct speed, or torque, or magnetizing
current , is detected by the control loops, the corresponding variable will be changed by the
controller to regulate the motor output.
Direct torque control schemes, entail another method used in variable frequency
drives to control the torque (and thus finally the speed) of induction motors [6] . This involves
calculating an estimate of the motor’s magnetic flux and torque based on the measured motor
voltage and current. The motor flux and torque are then compared with their reference values. If
either the flux or the torque deviates from the reference more than an allowed tolerance, the
ineverter switches are turned on and off in such a manner that the flux and torque values will be
forced back to within their tolerance bands.[7,8].
A most important area of research is the development of fault-tolerant control
techniques for multi-phase motors [9-12]. Control algorithms used for continuous disturbance
free operation of multi-phase induction and permanent magnet machines can be found in the
literature in references [13,14].
For a three-phase motor to continue operating under loss of one phase , a divided
dc bus and neutral connection are required [15]. In other words , a zero sequence component is
necessary to provide an undisturbed rotating MMF after a phase is lost. Due to their additional
degrees of freedom, multi-phase (more than three) motors are potentially more fault tolerant than
their three-phase counterparts. Explained below is the fault tolerant control scheme that has been

Chapter 1: Introduction 4
developed for continuous and safe operation under closed loop control of multi-phase machines
after losing more than one phase [16].This also eliminates the need for accessibility to the neutral
line. If one phase of a multi-phase machine is open circuited, the combination of phase currents
required to generate an undisturbed forward rotating MMF is no longer unique [17]. The most
important consideration then is to establish on optimum set of currents which would produce the
same value of MMF as under the healthy conditions .Therefore, with proper current control , an
undisturbed forward rotating MMF can be maintained, which can be used to control the
electromagnetic torque.
For example , the total stator MMF, Fs, of a five-phase machine can be formulated by the
following expression:
edcba NIaNIaNIaaNINIsF 432
(1-1)
Where, N is the number of turns/phase
aI is the rms value of current in Phase A
bI is the rms value of current in Phase B
cI is the rms value of current in Phase C
dI is the rms value of current in Phase D
eI is the rms value of current in Phase E
And a is 0721
Under normal conditions,
jeNIsF
2
5
(1-2)
Where t

Chapter 1: Introduction 5
Assuming that Phase a suddenly becomes open-circuited, then , after open-circuit , the
real and imaginary parts of equation (1-2) are
00 36cos)(72cos)(cos2
5
dceb IINIINNI (1-3)
00 36sin)(72sin)(sin2
5
dceb IINIINNI (1-4)
In this case, By assuming
db II and
ec II , it is possible to maintain the same
value of sF
Similar control algorithms can be worked out for any other multi-phase machine, in the
case of an open-circuit .Due to additional degrees of freedom , the current in the remaining phases
can be used to control the torque of the machine without the presence of negative-sequence or
zero-sequence current.
Some of the other areas of research include modeling of multi-phase induction machine
with structural unbalance [18], influence of the loss of a stator phase/phases on the stator current
spectrum. This is done through studying the behaviour of some of the frequency components
which depend on the speed/slip of the motor. The fluctuation of these frequencies was examined
to evaluate the effect of torque ripples generated by the negative sequence component in the
stator current which is associated with loss of a phase/phases [19].
In recent years, multi-phase (more than three) induction motors have gained importance
in industry because they have proved to be more advantageous when compared to their
conventional/standard three-phase counterpart particularly in survivability aspects under faulty
conditions. As mentioned earlier, One of their main advantages is an inherent higher reliability at
a system level and this is because, a multi-phase machine can operate with an asymmetrical
winding configuration even in the case of loss of more than one inverter leg/a machine

Chapter 1: Introduction 6
phase[20]. Recent research has therefore been centered on improving reliability of operation of
induction motors in case of phase-loss scenarios by incorporating the multi-phase (more than
three) design concept.
1.3 THESIS CONTRIBUTION
In this study, a novel design has been developed for a 6-phase induction machine,which
is based on an existing three-phase design. That is, this approach involves reconfiguration of an
existing 3-phase induction machine into a 6-phase induction machine winding design using the
same stator core lamination structure. Thus this leads to the development of a stator winding
configuration that allows a reversible 3-phase to 6-phase induction machine and vice versa.In
particular, the performance of the 6-phase machine is studied under various types of phase-loss
conditions like adjacent phase loss (i.e. loss of phases which are next to each other) and non-
adjacent phase loss (i.e. loss of phases which are separated by one or two other phases) under
drive open loop control or direct line feeding , so that this could later be applied to the
investigation of ‘Limp Home’ startergies without resort to excessive redundancy of system
components. The results of this work demonstrate the behaviour of the 6-phase machine under the
above mentioned fault conditions. Finally, a comparative analysis between the 3-phase and 6-
phase machines from the point of view of motor-drive system reliability is presented
1.4 THESIS ORGANIZATION
Including this introductory chapter, this thesis is organized in seven other chapters. In the
second chapter, The design layout of an existing three-phase , 5-hp, 6-pole , induction machine
will be presented. In chapter 3, the reconfiguration process of the three-phase induction machine
into six-phase motor will be explained in detail . In Chapter 4, the complete design of the
reconfigured six-phase induction motor will be shown. In Chapter 5, The fundamentals of the

Chapter 1: Introduction 7
time-stepping finite element approach used to model both the three-phase and six-phase
machines under study will be presented .In Chapter 6 ,the verifyting experimental results and
simulation results will be given. In Chapter 7, the conclusions and recommendations for future
work are presented.
8
CHAPTER 2: DESIGN OF THE THREE-PHASE CASE-STUDY INDUCTION MOTOR
2.1 INTRODUCTION
The most common family of motors used in home appliances, office appliances, and
industry is that of induction motors. Three-Phase induction motors are today standard
primemovers for industrial electrical drives.Cost, reliability, robustness, and maintenance free
operation are among the reasons these machines are replacing dc drive systems. Basically an
induction motor consists of a stationary member , the stator and rotating member , the rotor. The
slots of the stator and rotor cores of induction machines are filled with electric conductors,
insulated (in the stator) from cores, and connected in a certain way. This ensemble constitutes the
windings. The primary (or the stator) slots contain a polyphase a.c. winding. The rotor may have
either a three or two phase winding or a squirrel cage.
2.2 BASICS OF DESIGNING POLYPHASE A.C. WINDINGS
Designing a.c. windings means, in fact, assigning coils in the slots to various phases,
establishing the direction of currents in coil sides and coil connections per phase and between
phases, and finally calculating the number of turns for various coils and the conductor sizing.
The objective with polyphase a.c. windings is to produce a pure sinusoidally distributed
and rotating m.m.f., through proper feeding of various phases with sinusoidal time-varying
symmetrical currents. All this is in order to produce constant (ripple-free) torque under steady
state operating conditions.

Chapter 2: DESIGN OF THE THREE-PHASE CASE-STUDY INDUCTION MOTOR 9
Three-phase windings are layed out in one or two-layers in stator slots, that is single or
double-layer windings. The total number of coils equals half the number of stator slots, Ns, for
single-layer configurations, and is equal to Ns for double-layer configurations. Full-pitched and
short-pitched coils are used depending on the specific application. Windings for induction
machines are built with integer slots per pole per phase and, rarely, fractional slots per pole per
phase are used, when cogging or torque-speed characteristic inflection is of concern during
starting of such motors.
These windings are characterized by their mmf fundamental amplitude and the space
harmonic contents, (the lower the amplitudes of the higher harmonics, the better). The winding
factor, Kw , characterizes their fundamental harmonic content in terms of the peak mmf value of
the entire waveform. Another main concern is to produce balanced resistance and leakage
inductance per phase.
2.2.1 BASIC RULES FOR DESIGNING A.C.WINDINGS
1. The basic “winding building block” is represented by coils. It should be pointed
out that they may be lap connected or wave connected coils.
2. Coils for single layer windings are always not affected by the pitch factor in so
far as the harmonic content of their mmf waveforms.
3. The number of slots per pole per phase could be fractional or an integer whereas
the number of slots per pole is usually an integer.
4. As one coil side occupies one slot and its return occupies another slot, the
number of coil sides with inward current is obviously equal to the number of coil sides with
outward current .

Chapter 2: DESIGN OF THE THREE-PHASE CASE-STUDY INDUCTION MOTOR 10
5. The resulting traveling mmf will produce a flux density which will inturn self
induce sinusoidal emfs in the stator windings.The emfs induced in coil sides placed in
neighbouring slots are thus phase shifted by an angle , esα , expressible in electrical radians as
follows:
Ns
Pes
πα = (2-1)
Where, P = Number of poles and Ns = Number of stator slots.
6. The number of stator slots per phase is mN s / where m, is the number of phases in
the stator winding.Finally the phase shift between the emfs in two coil sides in two adjacent slots
in electrical radian measure is also esα , Eq. (2-1)
7. The allocation of slots to phases to produce a symmetrical winding is done as
follows:
For Single-layer windings:
The slots per pole per phase form a so-called phase belt of coil sides. These coil
sides return in another phase belt that is π electrical radians removed from the
original aforementioned phase belt, see Figure (2-1)
+
π e.rad
π e.radPhase Belt
Phase Belt
Figure 2-1: Single-Layer Phase Layout

Chapter 2: DESIGN OF THE THREE-PHASE CASE-STUDY INDUCTION MOTOR 11
Double-layer windings
The slots per pole per phase form a so-called phase belt of coil sides in the one
layer.These coil sides return in another phase belt in the another layer which is β
electrical radians from the original phase belt. But the start and return of coil sides
in the same layer are always separated by π electrical radians, see Figure (2-2)
Figure 2-2: Double-Layer Phase Layout
8. Placing the coils in slots:
For single-layer, full pitch windings, the inward and outward coil side occupy entirely the
allocated slots from left to right for each phase. There will be (Ns/2m) coils/phase ,where, m , is
the number of phases in the stator winding of the machine.
For short-pitched or full-pitched double-layer windings, the inward and outward coil
sides are placed from left to right of each phase, with one side in one layer (top layer closest to
the airgap) and the other side in the second layer(bottom layer farthest from the airgap). These

Chapter 2: DESIGN OF THE THREE-PHASE CASE-STUDY INDUCTION MOTOR 12
coil sides are connected by observing the inward and outward directions of currents in their
respective positions around the circumference of the machine as depicted in Figures (2-1) nd (2-
2) , for single-layer and double-layer windings, respectively.
9. Connecting the coils per phase:
The Ns/2m coils per phase for single-layer windings and the Ns/m coils per phase for
double-layer windings are connected in series (or series/parallel) such that the rules for the top
layer and the bottom layer emf polarity / current polarity , again see Figures(2-1) and (2-2) are
observed. With all coils per phase connected in series, we obtain a single current path (a = 1). We
may obtain “a” current paths if the coils from Ns/2ma coils for a number of parallel paths “a” are
connected in parallel in a single-layer winding. , and Ns/ma coils for a number of parallel paths
“a” are connected in parallel in a double-layer winding.
10. If the number of poles ,P, the number of slots per pole per phase, q, and number
of phases for such a design is known then the number of slots, Ns, is calculated as :
mqPNs ××= (2-2)
Again, where, P is the number of poles
q is the number of slots per pole per phase,
and m is the number of phases in the stator winding
2.3 DESIGN FORMULATIONS AND LAYOUT OF THE 5-HP CASE-STUDY THREE-PHASE INDUCTION MOTOR
It is a known fact that for a balanced three-phase winding, the number of slots should be a
multiple of 3 with a minimum of one slot per pole per phase.That is for a simple two-pole
machine and m phases the minimum number of slots is mP (i.e. 6 slots for a 2-pole , three-phase
case)

Chapter 2: DESIGN OF THE THREE-PHASE CASE-STUDY INDUCTION MOTOR 13
The table below shows the possible slot combinations for a 3-phase induction motors which can
be readily reconfigured into 6-phase induction motors.
No. of slots No. of poles No. of phases / No. of
slots per pole per phase
No. of phases / No. of
slots per pole per phase
2 3 / 2 6 / 1
4 3 / 1 6 / Fraction (½ ) NA
12
6 3 / Fraction ( 32 ) NA 6 / Fraction ( 3
1 ) NA
2 3 / 4 6 / 2
4 3 / 2 6 / 1
24
6 3 / Fraction ( 34 ) NA 6 / Fraction ( 3
2 ) NA
2 3 / 6 6 / 3
4 3 / 3 6 / Fraction ( 23 )NA
36
6 3 / 2 6 / 1
2 3 / 8 6 / 4
4 3 / 4 6 / 2
48
6 3 / Fraction ( 38 ) NA 6 / Fraction ( 3
4 ) NA
2 3 / 10 6 / 5
4 3 / 5
6 / Fraction ( 25 )NA
60
6 3 / Fraction ( 310 ) NA 6 / Fraction ( 3
5 ) NA
2 3 / 12 6 / 6
4 3 / 6 6 / 3
72
6 3 / 4 6 / 2
Table 2-1. Possible slot combinations of 3-phase induction motors which can be readily reconfigured to 6-
phase induction motors

Chapter 2: DESIGN OF THE THREE-PHASE CASE-STUDY INDUCTION MOTOR 14
As given and suggested in Table 2-1, it is preferable to avoid a fractional value of slots per pole
per phase. Therefore combinations like a 12 slot machine with 6 poles or 60 slot machine with 6
poles are not deemed applicable for the reconfigurable 3-phase to 6-phase machine design. The
slot and pole combination chosen for the work in this thesis is a Three-Phase , 36 slot induction
machine with 6 poles.
In the following chapter the design formulation and layout of an existing 5HP 3-Phase ,36
slot , squirrel cage induction motor ,with 6 poles, is discussed.
2.3.1 LIST OF SYMBOLS
For convenience of the reader the following is a list of symbols used throughout this thesis:
V = Line-Line Voltage (rms)
I = Rated current (rms)
L = length of the motor
g = height of the airgap
rD = Outer Diameter of the Rotor
sD = Inner Diameter of the Stator
phE = Induced Voltage/phase (rms)
f = frequency
P = number of poles
wK = winding factor
dK = distribution factor
pK = pitch factor
q = number of slots per pole per phase
Ns = no. of slots

Chapter 2: DESIGN OF THE THREE-PHASE CASE-STUDY INDUCTION MOTOR 15
β = coil span in degrees
γ = slot angle
srφ = Flux originating from one pole
phN = Number of turns per phase
maxsrB = maximum value of fundamental component of flux density
sF = fundamental peak value of the resulting magnetomotive force
maxsF = maximum value of stator mmf per pole
maxT = maximum torque developed.
2.3.2 CHARACTERISTICS OF THE MOTOR UNDER STUDY
This case-study motor is a 36-slot, 6-pole, 5-HP squirrel cage induction motor rated at
460 V (rms value of line-to-line voltage ) with a rated current of 6.8 A per phase.
The Inner diameter of the stator bore, sD = 5.75 inches.The stator winding is a lap
connected distributed winding with 20 turns per coil and 12 coils per phase. Therefore,
the number of turns per phase, phN = 240. Here,
q = 2 slots per pole per phase.
The Dimensions of the rotor are as follows:
rD = 5.72 inches
L = 5 inches
g = 0.015 inches

Chapter 2: DESIGN OF THE THREE-PHASE CASE-STUDY INDUCTION MOTOR 16
2.3.3 DERIVATION OF TORQUE IN CLOSED FORM USING DESIGN EQUATIONS
It is known that the induced phase voltage is the voltage induced in one conductor
multiplied by the number of turns phN . The equation for the induced voltage is,
phsrph NfE φ44.4= (2-3)
This is true if the winding is full-pitched and the slots per pole per phase, q = 1
If q > 1, then the voltage induced in one coil of a phase winding will have the same
magnitude as that of an adjacent coil but shifted by phase angle , esα , because of the spatially
distributed sinusoidal flux density waveform in the air gap. Thus the series connection of coils
does not give the algebraic sum of the induced voltages but a lesser value. Therefore the
calculated value has to be multiplied by the winding distribution factor , dK .Here,
the phase angle between the induced voltages in two neighbouring slots is,
Ns
P 0180×=γ (2-4)
Where, P = number of poles
Therefore, in this case, 00
30361806
=×
=γ (2-5)
Hence the distribution factor,
==coil
phd Eq
EK
)2sin(
)2sin(γ
γ
q (2-6)
where, q×γ = phase belt angle
Therefore, 966.0)2
302sin(30
)2302sin(
00
0
=××
×=dK (2-7)

Chapter 2: DESIGN OF THE THREE-PHASE CASE-STUDY INDUCTION MOTOR 17
Phasor representation of induced emfs on both sides of a single turn in case of short-pitched coils
where the induced emfs will not be in 1800 e (π e. radians) time phase with respect to each other
is represented in Figure 2-3,
Figure 2-3. Phasor representation of induced emfs on both sides of a single turn in case of short-pithced
coil
From Figure 2-3, The Pitch Factor can be defined as ,
)2sin(2β=×=
cond
turnp e
eK (2-8)
Where , ep
c 0180×=ττ
β (2-9)
Here pitchpoleandpitchcoil pc == ττ
In this case, since the winding is full-pitched, pc ττ =
Therefore, 0180=β and 1=pK
The Winding Factor , wK , is accordingly defined as,
966.0966.01 =×=
×= dpw KKK (2-10)
Now , Equation (2-3) yielding the induced emf per phase becomes
wphsrph KNfE φ44.4= (2-11)

Chapter 2: DESIGN OF THE THREE-PHASE CASE-STUDY INDUCTION MOTOR 18
In this case, 2653
4603
=== −LLph
VE V (2-12)
From Equations (2-11) and (2-12),
WbKfN
E
wph
phsr 0043.0
966.02406044.4265
44.4=
×××==φ (2-13)
It is known that the flux per pole, srpsr LBτπ
φ 2= , from which maximum flux density per pole,
srB can be expressed as ,
L
Bp
srsr ××
×=
τφπ
2 (2-14)
where, the pole-pitch , pτ , is,
P
Dp
×=πτ (2-15)
Here, the diameter , D , is
morgDDD rmidairgap 145.0"735.5"015.0"72.5 =+=+== (2-16)
Consequently,
mp 0762.06
145.0=
×=πτ (2-17)
Chapter 2: DESIGN OF THE THREE-PHASE CASE-STUDY INDUCTION MOTOR 19
Bsr
τp l
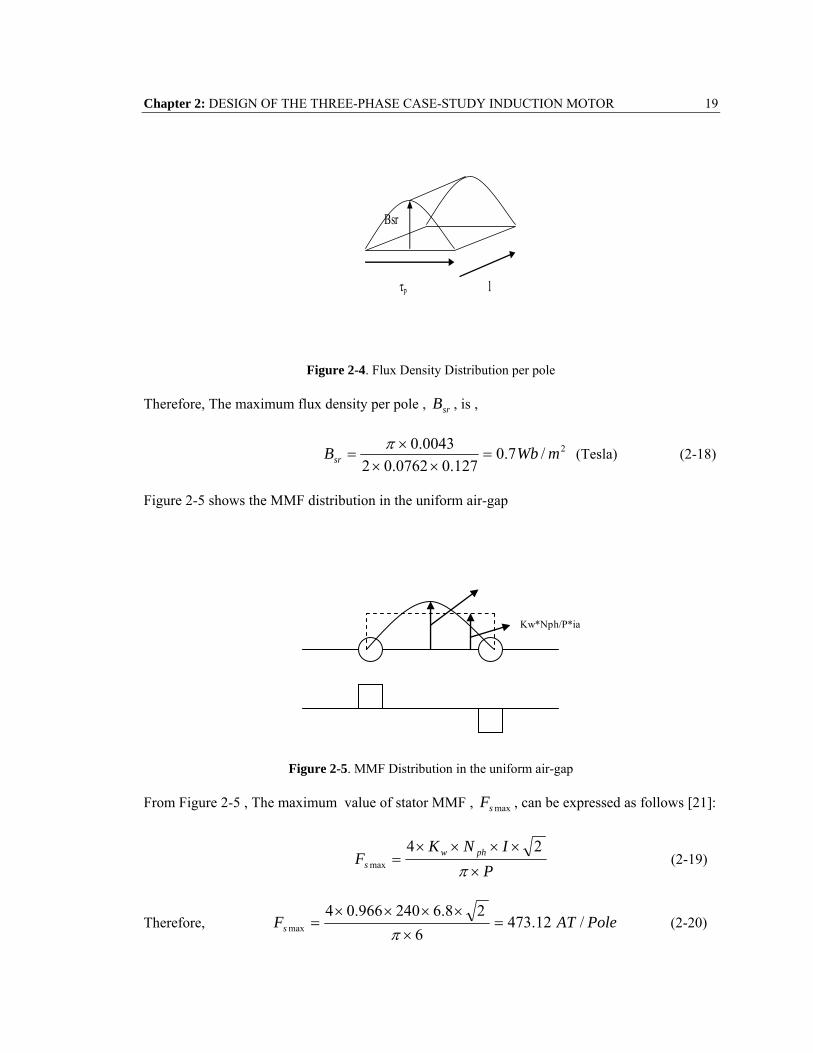
Figure 2-4. Flux Density Distribution per pole
Therefore, The maximum flux density per pole , srB , is ,
2/7.0127.00762.02
0043.0 mWbBsr =××
×=
π (Tesla) (2-18)
Figure 2-5 shows the MMF distribution in the uniform air-gap
Figure 2-5. MMF Distribution in the uniform air-gap
From Figure 2-5 , The maximum value of stator MMF , maxsF , can be expressed as follows [21]:
P
INKF phw
s ×
××××=
π24
max (2-19)
Therefore, PoleATFs /12.4736
28.6240966.04max =
×××××
=π
(2-20)
Kw*Nph/P*ia

Chapter 2: DESIGN OF THE THREE-PHASE CASE-STUDY INDUCTION MOTOR 20
In Balanced Three-Phase Induction Motors, The peak (amplitude) of the resultant stator mmf ,
sF is given by [21]:
PoleATFF ss /6.70912.47323
23
max =×=×= (2-21)
The Expression for maximum value of the developed electromechanical torque developed can be
expressed as follows [21]:
NmFPT ssr ×××= φπ 2max )
2(
2 (2-22)
Therefore, the maximum value of the developed electromechanical torque is computed as:
NmT 13.436.7090043.0)26(
22
max =×××=π
(2-23)
2.4 WINDING OF THE STATOR
The winding designed for the motor case at hand is a double-layered, distributed, lap-
connected winding with full –pitched coils. Following the rules of designing the windings as
explained earlier in Section 2.2.1, it follows that the number of slots per pole per phase , q = 2 ,
the number of phases , m = 3 , and the number of poles, P = 6, Therefore, from Equation 2-3,
number of slots slotsmqpNs 3632322 =×××=×××= . From Equation (2-2) ,
636
322 πππα =×
==Ns
pes (2-24)
The star of conductor emfs in the various 36 slots of the stator can be depicted as shown in Figure
2-6. This Figure bares a direct relationship to the winding layout labels shown in the machine
cross-section with the respective phase labeling, A, -A, B,-B,C,-C shown in Figure 2-9.

Chapter 2: DESIGN OF THE THREE-PHASE CASE-STUDY INDUCTION MOTOR 21
π/6
1,13,25
2,14,26
3,15,27
4,16,28
5,17,29
6,18,30
7,19,318,20,32
9,21,33
10,22,34
11,23,35
12,24,36 A
- A
B
-B
C
-C
Phasor diagram of conductor emf showing phasors which slot contains which phase
Figure 2-6. Phasor diagram of conductor emfs showing slots carrying their respective phases.
In the case of the 36 slot motor, considering 2 slots per pole per phase and a double-
layered winding configuration, the total number of coils per phase will be 12 . Placing the
subsequent coils for each winding will depend on the coil span which is 6 slot pitches .

Chapter 2: DESIGN OF THE THREE-PHASE CASE-STUDY INDUCTION MOTOR 22
Placement of coils of the other phases is done based on the spatial distribution of the windings.
Figure 2-7 shows how the phases are distributed in space and their associated angles in a simple
2-pole , 6-slot , winding layout .Meanwhile, from this principle depicted in Figure 2-7 , one can
obtain the winding configuration for a 36-slot , 6-pole , full-pitched coil stator depicted in the
motor cross-section of Figure 2-9, and its associated developed diagram / table shown below this
cross-section. The corresponding developed diagram of the winding layout for the case with full-
pitched coils is shown for completeness in Figure 2-10. Furthermore , this Figure will be helpful
in understanding the forthcoming 6-phase motor winding layout.
Figure 2-7. Spatial distribution of the Three Phases
Meanwhile for a corresponding short-pitched winding distribution for the case-study three phase
induction machine with 36 slots and a coil span of 1500 is shown in Figure 2-8. This is the actual
design of the winding of the 3-phase motor being simulated and tested in this work.
A
-B -C
C
-A
B
600
1200

Chapter 2: DESIGN OF THE THREE-PHASE CASE-STUDY INDUCTION MOTOR 23
1 2 3 4 5 6 7 8 9 10 11 12 13 14 15 16 17 18A7 C5- C6- B8 B7 A1- A2- C12 C11 B1- B2- A12 A11 C1- C2- B12 B11 A3-
A1 A2 C12- C11- B1 B2 A12- A11- C1 C2 B12- B11- A3 A4 C10- C9- B3 B4
19 20 21 22 23 24 25 26 27 28 29 30 31 32 33 34 35 36A4- C10 C9 B3- B4- A10 A9 C3- C4- B10 B9 A5- A6- C8 C7 B5- B6- A8
A10- A9- C3 C4 B10- B9- A5 A6 C8- C7- B5 B6 A8- A7- C5 C6 B8- B7-
TopBottom
TopBottom
Figure 2-8. . Cross-Sectional view of stator slots showing the winding distributions of the three phases for
the short-pitched design

Chapter 2: DESIGN OF THE THREE-PHASE CASE-STUDY INDUCTION MOTOR 24
1 2 3 4 5 6 7 8 9 10 11 12 13 14 15 16 17 18A8 A7 C5- C6- B8 B7 A1- A2- C12 C11 B1- B2- A12 A11 C1- C2- B12 B11
A1 A2 C12- C11- B1 B2 A12- A11- C1 C2 B12- B11- A3 A4 C10- C9- B3 B4
19 20 21 22 23 24 25 26 27 28 29 30 31 32 33 34 35 36A3- A4- C10 C9 B3- B4- A10 A9 C3- C4- B10 B9 A5- A6- C8 C7 B5- B6-
A10- A9- C3 C4 B10- B9- A5 A6 C8- C7- B5 B6 A8- A7- C5 C6 B8- B7-
TopBottom
TopBottom
Figure 2-9. Cross-Sectional view of stator slots showing the winding distributions of the three phases for
the full-pitched design.

Chapter 2: DESIGN OF THE THREE-PHASE CASE-STUDY INDUCTION MOTOR 25
Shown below in Figure 2-10 is the complete winding layout showing all the three phases for the
full-pitched design :
C B7
B2
6
B8
B1
5
B C6-
C11
-
4
C5-
C12
-
3
A A7
A2
2
A8
A1
1
B6-
B7-
36
B5-
B8-
35
C7
C6
34
C8
C5
33
A6-
A7-
32
A5-
A8-
31
B9
B6
30
B10
B5
29
C4-
C7-
28
C3-
C8-
27
A9
A6
26
A10
A5
25
B4-
B9-
24
B3-
B10
-
23
C9
C4
22
C10
C3
21
A4-
A9-
20
A3-
A10
-
19
B11
B4
18
B12
B3
17
C2-
C9-
16
C1-
C10
-
15
A11
A4
14
FB A12
A3
13
B2-
B11
-
12
SC
B1-
B12
-
11
C11
C2
10
FA C12
C1
9
A2-
A11
-
8
SB
A1-
A12
-
7
B7
B2
6
FC B8
B1
5
C6-
C11
-
4
SA
C5-
C12
-
3
A7
A2
2
A8
A1
1
Figure 2-10. Complete Winding Layout showing the connection of all the coils.

Chapter 2: DESIGN OF THE THREE-PHASE CASE-STUDY INDUCTION MOTOR 26
2.4.1 MMF DISTRIBUTION
As mentioned earlier, the objective of a poly-phase a.c. winding is to produce a rotating
MMF with a profile that is as close as possible to a sinusoidally shaped waveform. The equation
representing a rotating MMF of a distributed phase winding with q slots per pole per phase, and
electrical angular slot pitch,α , with short-pitched coils of span angle β is [21] :
)]cos()cos()2
sin()
2sin(
)2
sin()
2[sin(14),(
1thhh
hq
hqh
hmI
PN
tFk
h
phphph ⋅⋅×⋅×⋅×
⋅×
⋅⋅×⋅×××= ∑
=
ωθπα
αβ
πθ
which can inturn be written as: (2-25)
)]cos()cos([1),(1
max thhKKKh
FtF shdhph
k
hph ⋅⋅×⋅××××= ∑
=
ωθθ (2-26)
or )]cos()cos([1),(1
max thhKh
FtF wh
k
hph ⋅⋅×⋅××= ∑
=
ωθθ (2-27)
where, phN is the Number of turns per phase
P is the Number of Poles
m is the Number of phases
PoleATm
IP
NF phph /24
max ×××=π
(2-28)
and h is the harmonic number , for h = 1 , lfundamentaph FtF =),(θ
For a three-phase system the a,b,c mmfs are:
)]cos()cos([1),(1
max thhKh
FtF wh
k
ha ⋅⋅×⋅××= ∑
=
ωθθ (2-29)
)]3
2cos()3
2cos([1),(1
maxπωπθθ −⋅⋅×−⋅××= ∑
=
thhKh
FtF wh
k
hb (2-30)

Chapter 2: DESIGN OF THE THREE-PHASE CASE-STUDY INDUCTION MOTOR 27
)]3
4cos()3
4cos([1),(1
maxπωπθθ −⋅⋅×−⋅××= ∑
=
thhKh
FtF wh
k
hc (2-31)
Therefore it can be shown that, The resultant / total stator MMF , sF , can be exprseed as
follows:
)cos(23),(),(),( max tFtFtFtFF cbas ωθθθθ −××=++= (2-32)
The MMF distribution produced by the three-phase a, b and c windings under study is shown
versus the phase winding locations in Figure 2-11:
Figure 2-11.MMF Distribution produced by the Three-Phase winding under study.
)]cos()cos([1),(1
max thhKh
FtF wh
k
ha ⋅⋅×⋅××= ∑
=
ωθθ
1k
)]3
2cos()3
2cos([1),(1
maxπωπθθ −⋅⋅×−⋅××= ∑
=
thhKh
FtF wh
k
hb
)]3
4cos()3
4cos([1),(1
maxπωπθθ −⋅⋅×−⋅××= ∑
=
thhKh
FtF wh
k
hc

Chapter 2: DESIGN OF THE THREE-PHASE CASE-STUDY INDUCTION MOTOR 28
In Figure 2-11, the currents in the slots are considered to be infinitely thin elements so that the
mmf takes step-type jumps along the middle of each slot. The mmf distribution is symmetrical in
successive half waveforms and therefore the mmf is balanced.
The rectangular mmf distribution can be decomposed into harmonics for each phase.By
increasing the number of steps in the mmf waveform , it is possible to reduce
the harmonic content.
In summary, in this chapter the winding design of the existing 5-HP three-phase
induction motor was presented . This is a suitable introduction to the next chapter in which the
reconfiguration of the three-phase winding into a six-phase winding is presented.

29
CHAPTER 3: RECONFIGURATION OF A THREE- PHASE INDUCTION MACHINE INTO A SIX-PHASE INDUCTION MACHINE
3.1 INTRODUCTION
Power switching converters are sensitive to different types of failures. In A.C. a
motor-drive systems, these failures can occur at the converter side or at the control
subsystem side. The reliability of the motor-drive system is an important factor in applications
where continuous operation is mandated. When an open circuit fault occurs in the winding of an
induction machine, the electromagnetic torque exhibits very oscillatory behaviour with high
torque ripple content , and consequently the machine operation may have to be stopped for
maintenance. In order to reduce the costs related to maintenance stops and for purposes of
increasing the reliability of the motor-drive system it is necessary to introduce some fault
tolerance characteristics [22]. Frequently systems with redundancy are used. In recent years,
several research teams have focused on the development of fault-tolerant power conversion
systems [23-25]. Main attention has been given to the development of new analysis techniques,
fault detection, fault isolation and compensation of faults using the standard three-phase winding
configuration [26,27]. Many configurations include topologies with redundancy of components
such as switches/phases , cascaded inverters , four-leg inverter topology and systems with
multiple-phases were proposed and implemented in prototypes [24,25] .Machines with multiple
phases present inherent redundancy and can be used to provide fault tolerance [1-3,16]. This

Chapter 3: Reconfiguration of a Three-Phase Machine into a Six-Phase Machine 30
Chapter proposes a method to redesign the three-phase induction motor described in the previous
chapter by reconfiguring its stator winding into a six-phase configuration.
3.2 STEPS INVOLVED IN THE STATOR WINDING RECONFIGURATION PROCESS
The reconfiguration process basically involves an approach which converts the existing
three-phase winding described in the previous chapter into a six-phase winding. Consider a 2-pole
machine with 12 stator slots. In a three-phase winding configuration with a double-layer , lap-
type winding , there would exist 4 coils that belong to each of the three-phases , A, B , and C.
These coils would be connected into two groups per phase , each consisting of two coils
connected in series per group. This would form the coil groups A1, A2, B1, B2, C1, and C2
depicted in the connection of Figure 3-1 for the high voltage/460V line-line arrangement.
A2
3 PHASE SUPPLY
B2
C
B
A
C2
N
C1
A1
B1
Figure 3-1.Y-Connection of the 2 coil groups for Three-Phase Operation.

Chapter 3: Reconfiguration of a Three-Phase Machine into a Six-Phase Machine 31
In a balanced three-phase winding, such as the one depicted in Figure 3-1 supplied from a
balanced three-phase supply , the A,B and C voltages are:
VtVVA )cos(2 ⋅××= ω (3-1)
VtVVB )3
2cos(2 πω −⋅××= (3-2)
VtVVC )3
4cos(2 πω −⋅××= (3-3)
Where, V is the rms line to neutral voltage applied from the supply.
and fπω 2= , the angular frequency in rad/sec.
The voltage phasors in each of the aforementioned coil groups of Figure 3-1 can be
represented schematically and in voltage phasor form as in Figure 3-2
.
Figure 3-2.Phasor representation Of Voltages In each coil group.
1 2FB2
FB1
-
SC1
-
FC1
1 2
SA2
-
FC2
+
+
+SB2
+1 2
-
+
SC2
1 2
SA1
-1 2
+
1 2
FA1
FA2
-
SB1

Chapter 3: Reconfiguration of a Three-Phase Machine into a Six-Phase Machine 32
The two coil-groups can be further connected in two arrangements depending on the
current and voltage requirements, these two arrangements namely are:
1. The low voltage connection
2. The high voltage connection
In the high voltage connection, the 2 coil groups are connected in series so that the voltage in
each of the coils VA1 and VA2 is 230V and the total voltage VA = VA1+VA2 is 460V (Line-
Line). Here, Figure 3-3 shows the phasor diagram of voltages across the coils for the high
voltage connection
1 2FB2FB1
-
SC1 -FC1
1 2SA2
N-
FC2+
+
+SB2
+1 2
-
+
SC2
1 2SA1
-1 2
+
1 2
FA1 FA2
-SB1
Figure 3-3.Phasor diagram of Volatge across the coil groups for the high-voltage connection.

Chapter 3: Reconfiguration of a Three-Phase Machine into a Six-Phase Machine 33
In the Low-Voltage Connection the two coil groups are connected in parallel so that voltage in
each coil VA1 and VA2 is 230 V(L-L) and the total voltage VA is also 230V (L-L). Figure 3-4
shows the phasor diagram of voltages across the coils for the low voltage connection.
Figure 3-4.Phasor diagram of Volatge across the coil groups for the low-voltage connection.
1 2FB2
FB1
-
SC1
-
FC1
1 2
SA2
N
-
FC2
+
+
+SB2
+1 2
-
+
SC2
1 2
SA1
-1 2
+
1 2
FA1
FA2
-SB1

Chapter 3: Reconfiguration of a Three-Phase Machine into a Six-Phase Machine 34
3.3 SOME CONSIDERATIONS FOR THE SIX-PHASE WINDING
It is well known that the number of phases in a machine is assumed to be the same as the
number of stator terminals or leads, excluding the neutral. However , giving the number of phases
or leads is not always the adequate description. This is because ,for a given number of phases in
a machine, two versions are possible based on the two possible values of the phase belt angle.For
example three-phase motors can be wound with a phase belt angle of either 1200 or 600. Since the
phase belt angle governs certain harmonic characteristics, the 1200 case is different from the 600
case [2].
In dealing with the phase belt angle, it is convenient to specify the number of phase belts
per pole which is
ψ
0180=q (3-4) Where, β is the phase belt angle.
In this thesis, the design for the six-phase machine was chosen such that there is a
symmetrical 600 displacement between the windings and the phase belt angle is 600.
For transforming the 3-phase winding configuration into a 6-phase one, the voltage
phasors discussed in Figure 3-3 for the 2-pole , 12 stator slot example can be rearranged in a
way such that they form the a six-phase system with a phase belt angle of 600. The voltage
phasors in each of the coil groups can then be represented as shown in Figure 3-5

Chapter 3: Reconfiguration of a Three-Phase Machine into a Six-Phase Machine 35
Figure 3-5.Rearrangement Of the Voltage Phasors to form the Six-Phase configuration.
VA2
VB1
VA1
VB2
VC1
VC2
1200
2400
VA1
- VA2 = VD
VB1 = VC
- VB2 = VF
-VC2 = VB
VC1 = VE
VA1
VA2VC2
VC1
VB1
VB2
-VA2 = VD
-VB2 = VFVC1 = VE
VB1 = VC -VC2 = VB
VA1 = VA

Chapter 3: Reconfiguration of a Three-Phase Machine into a Six-Phase Machine 36
3.4 CONNECTION SCHEME FOR THE SIX-PHASE WINDING CONFIGURATION
In order to achieve the 600 displacement between the voltage phasors, each of the two
coil-groups in the three-phase system is separated and the starts and finishes of these coil are
connected as shown , to form the winding which is depicted schematically in Figure 3-6
1 2FB2
FB1
-
SC1
-
+
FC1
1 2
SA2
-
FC2
N
+
+
SB2
1 2
-
SC2
+
1 2
SA1
-1 2
+
1 2
FA1
+
FA2
-SB1
Figure 3-6.Connection Scheme For the Six-Phase winding
VFVE
VD
VC VB
VA
VSC1-FC1 VFB2-SB2
VSA1-FA1
VFC2-SC2VSB1-FB1
VFA2-SA2
FB2
SB2
SA1FA1
FC2
SC2
SC1
FC1
SA2 FA2
SC2
FC1

Chapter 3: Reconfiguration of a Three-Phase Machine into a Six-Phase Machine 37
From the above arrangement , it is clear that Phase A and Phase D are separated by 1800,
Phase B and Phase E are separated by 1800 & Phase C and Phase F are separated by 1800
.Therefore,the spatial distribution of the phases in the six-phase machine can be represented as in
shown in Figure 3-7
Three-Phase Case:
.
1 2 3 4 5 6 7 8 9 10 11 12 1 2
A A -C -C B B -A -A C C -B -B A A
A A -C -C B B -A -A C C -B -B A A
A
-B -C
C
-A
B
600
1200
Axis A
Axis C
Axis B

Chapter 3: Reconfiguration of a Three-Phase Machine into a Six-Phase Machine 38
Six-Phase Case:
1 2 3 4 5 6 7 8 9 10 11 12 1 2
-D -D -E -E -F -F -A -A -B -B -C -C -D -D
A A B B C C D D E E F F A A
Figure 3-7 Spatial Distribution of phases in the Three-Phase And the Redesigned Six-Phase configurations
A, -D
-C, F B, -E
-B, E
-A, D
C, -F
600
1200
Axis A
Axis B Axis C
Axis D
Axis E Axis F

Chapter 3: Reconfiguration of a Three-Phase Machine into a Six-Phase Machine 39
3.5 THE DEVELOPMENT OF THE SIX-PHASE WINDING
From the above analysis, phases A and D lie in the same slot, phases B and E lie in the
same slot and phases C and F lie in the same slot. Table 3-1 relates the coils of the existing Three-
Phase winding and its corresponding phase in the six-phase connection.
Table 3-1 . Relationship between Coils of The Three-Phase winding and their corresponding phases in the
Six-Phase machine.
From Table 3-2 and Figures 3-6 and 3-7 , one can proceed with the development of the Six-Phase
winding .A logical representation of this kind of connection is presented in Figure 3-8.In this
figure, each slot is represented by two two blocks on top of each other representing the double-
layer nature of the winding, in which each slot is occupied by two coil-sides that may or may not
belong to the same phase. Also, in Figure 3-8 the slots are numbered from right to left #1 through
#12 ,for an example 12 slot per pair of poles stator winding configuration.
COIL NAME NAME OF THE PHASE ( 3-PHASE) NAME OF THE PHASE (6-PHASE)
A1 Phase A Phase A
A2 Phase A Phase D
B1 Phase B Phase C
B2 Phase B Phase F
C1 Phase C Phase E
C2 Phase C Phase B

Chapter 3: Reconfiguration of a Three-Phase Machine into a Six-Phase Machine 40
Figure 3-8 Development Of The Six-Phase Winding
From Figure 3-8 , the following can be deduced :
(1) The start of the coil A1 of the 3-phase winding corresponds to the start of phase A of the
6-phase winding,
(2) The start of the coil A2 of the 3-phase winding corresponds to the finish of phase D of the
6-phase winding,
(3) The start of the coil B1 of the 3-phase winding corresponds to the start of phase C of the
6-phase winding,
-B
- B
- B
- B
C
C
C
C
-A
-A
-A
-A
B
B
B
B
-C
-C
-C
-c
A
A
A
A
1 2 3 4 5 6 7 8 9 10 11 12
SA1
SA2 FC1
FC2 SB1
SB2
SC1
SC2 FB1
FA2
FA1
FB1
- C
F
- C
F
- B
E
-B
E
-A
D
-A
D
-F
C
-F
C
- E
B
- E
B
-D
A
-D
A
1 2 3 4 5 6 7 8 9 10 11 12
SA
FD FE
SB SC
FF
SE
FB FC
SD
FA
SF
(b) Corresponding Starts and finishes of each phase to form the 6-phase winding
(a) Starts and finishes of each coil in the 3-phase machine

Chapter 3: Reconfiguration of a Three-Phase Machine into a Six-Phase Machine 41
(4) The start of the coil B2 of the 3-phase winding corresponds to the finish of phase F of the
6-phase winding,
(5) The start of the coil C1 of the 3-phase winding corresponds to the finish of phase E of the
6-phase winding,
(6) The start of the coil C2 of the 3-phase winding corresponds to the start of phase B of the
6-phase winding,
(7) The finish of the coil A1 of the 3-phase winding corresponds to the finish of phase A of the
6-phase winding,
(8) The finish of the coil A2 of the 3-phase winding corresponds to the start of phase D of the
6-phase winding,
(9) The finish of the coil B1 of the 3-phase winding corresponds to the finish of phase C of the
6-phase winding,
(10) The finish of the coil B2 of the 3-phase winding corresponds to the start of phase F of the
6-phase winding,
(11) The finish of the coil C1 of the 3-phase winding corresponds to the start of phase E of the
6-phase winding, and
(12) The finish of the coil C2 of the 3-phase winding corresponds to the finish of phase B of the
6-phase winding,
Following the above scheme, the six-phase machine winding is designed.Accordingly,
in this section , the development of the connection diagram for the reconfiguration of the three-
phase machine has just been presented. Hence, the 36 slot,6-pole,6-phase armature double-layer
winding can best be shown in cross-section as given in Figure 3-9, which is explained in detail in
the next chapter.

Chapter 3: Reconfiguration of a Three-Phase Machine into a Six-Phase Machine 42
1 2 3 4 5 6 7 8 9 10 11 12 13 14 15 16 17 18D5- D6- E5- E6- F5- F6- A1- A2- B1- B2- C1- C2- D1- D2- E1- E2- F1- F2-
A1 A2 B1 B2 C1 C2 D1 D2 E1 E2 F1 F2 A3 A4 B3 B4 C3 C4
19 20 21 22 23 24 25 26 27 28 29 30 31 32 33 34 35 36A3- A4- B3- B4- C3- C4- D3- D4- E3- E4- F3- F4- A5- A6- B5- B6- C5- C6-
D3 D4 E3 E4 F3 F4 A5 A6 B5 B6 C5 C6 D5 D6 E5 E6 F5 F6
TopBottom
TopBottom
Figure 3-9:Cross-sectional view of the stator slots showing the winding distributions of the Six Phases.

43
CHAPTER 4: DESIGN OF THE SIX-PHASE INDUCTION MOTOR
4.1 INTRODUCTION
In this chapter, the complete design layout of the reconfigured six-phase induction
motor is described. The main purpose of this chapter is to calculate the major design
parameters of the six-phase induction machine, and arrive at the actual design of the
stator winding by following the approach described in the previous chapter.
4.2 THE CONSTRAINTS AND STEPS INVOLVED IN THE DESIGN
The following are some constraints and aonsepts that were adhered t o in arriving at the
design of the reconfigured six-phase winding layout :
The main constraint is to keep the same values of the output torque and the same
maximum mid-airgap flux density of the existing 3-phase machine in the new
reconfigured 6-phase machine.
The output power of the reconfigured 6-phase machine is also maintained at the same
value as the existing 3-phase machine.
From the available design data of the 3-phase machine which were detailed in the
Chapter 2, the closed form equations of torque and magneto motive force are used here to
find the actual number of turns required for the 6-phase design.

Chapter 4: Design Of The Six-Phase Induction Motor 44
The winding is designed keeping in mind, the winding reconfiguration scheme which
was illustrated in detail in the previous chapter, including the required phase shifts
between the different phases, A,B,C,D,E and F, respectively.
4.2.1 SOME IMPORTANT CHARACTERISTICS OF A “ GOOD WINDING ”
The following are some of the important features that a designer should keep in mind
while choosing a particular winding layout configuration:
The winding should preserve symmetry in every phase. (This will occur only if the
electric angle between the phase voltages is exactly 3600/m.)
The phase voltage induced in the distributed phase windings with a given flux
density should be as large as possible; i.e. the winding factor should be high.
The mmf waveform created by the winding should be identical for every pair of
poles balanced and should contain as few harmonic components as possible with a
substantial fundamental component.
4.3 PARAMETERS OF THE SIX-PHASE INDUCTION MOTOR
Stator and rotor core cross sections and airgap height and mean diameter are the same
for both the six-phase and the three-phase machines. The six-phase machine is also a 36 stator
slot machine. Following the constraints discussed in section 4-2, the power rating of the six-phase
motor is maintained at a value of 5-HP. It has six poles and the number of slots per pole per
phase, q , is accordingly given by:
16/6/36// === mPNsq slots/pole/phase (4-1)
In the first step of the design , the number of turns per phase has to be calculated from
the closed form design equations . In the second step , the operating voltage of the motor is
obtained. Finally , the stator winding layout is arrived at.

Chapter 4: Design Of The Six-Phase Induction Motor 45
4.3.1 CALCULATION OF THE NUMBER OF TURNS PER PHASE FOR THE
DESIGN
From Equation 2-24, it is known that the maximum value of electromechanical torque
developed is expressed as, follows:
NmFPT ssr ×××= φπ 2max )
2(
2 (4-2)
in which all terms have been previously defined in Chapter 2.Since one constraint is to keep the
torque and flux density the same as in the 3-phase case,it follows from Equation 2-16, that the
peak resultant flux density at mid-airgap level , Bsr 6 phase, for the new six-phase design is as
follows:
We have, From equation 2-2
)(/7.0127.00762.02
0043.0 26 TeslamWbB phasesr =
×××
=π
(4-3)
where mp 0762.0=τ and mL 127.0= are remaining the same as in the 3-phase
original design
In addition the maximum torque for the six-phase design can also be written based on
Equation 4-2 as follows:
NmT phase 13.436.7090043.0)26(
22
6max =×××=π
(4-4)
which is the same value as given earlier in Equation (2-25) in Chapter 2.
Since the core dimensions of the six-phase machine are the same as the three-phase
machine , it follows that the flux per pole , srφ , as discussed in Chapter 2 is also of the same
value as for the 3-phase machine. That is,
Wbphasesr 0043.06 =φ (4-5)

Chapter 4: Design Of The Six-Phase Induction Motor 46
Hence , It follows from equation 4-2 that one can compute the peak stator mmf , phasesF 6 ,
as follows:
PoleATPT
Fphasesr
phasephases /6.709
0043.06813.438
26
26max
6 =×
×=
×
×=
φ (4-6)
For a balanced six-phase machine , maximum phase value of the stator mmf , maxsF , is
related to the total stator mmf per pole, phasesF 6 , by the following expression:
phasesphases FF 6max6 26×=
Therefore ,
ATFF phasesphases 5.2366.70962
62
66max =×=×= (4-7)
However , From Equation (2-21), maxsF is also equal to,
PINK
F phwphases ×
××××=
π24
6max (4-8)
Therefore,
ATP
INKF phw
phases 5.23624
6max =×
××××=
π (4-9)
From (4-9) The product phw NK × is found to be,
6.11528.645.2366
246max
66 =××
××=
××
××=×
ππ
I
FPNK phases
phasephphasew (4-10)
Since the rated current , I, is maintained the same as in the 3-phase case , which is equal
to 6.8A , and the winding factor , phasewK 6 can be written as follows:

Chapter 4: Design Of The Six-Phase Induction Motor 47
phasedphasepphasew KKK 666 ×= (4-11)
where, )2
sin(6β
=phasepK and 0180×=p
c
ττ
β
Hence, in the above case, because the chosen winding is full pitched , pc ττ = , that is 0180=β ,
it follos that 16 =phasepK .In addition , from equation 2-8 it follows that ,
)2sin(
)2sin(
666
66
6phase
phasephase
phasephase
phased
qK γ
γ
××
×= (4-12)
where, phase6γ , the slot angle is equal to 300 and phaseq6 , the number of slots per pole per phase is
equal to 1, hence 16 =phasedK , and based on Equation 4-11, 16 =phasewK (4-13)
Hence the Number of turns per phase is found to be, 1206.1156 ≈=phasephN
Thus , the chosen number of turns per phase for the six-phase design is 120.

Chapter 4: Design Of The Six-Phase Induction Motor 48
4.3.2 CALCULATION OF THE VOLTAGE RATING OF THE SIX-PHASE MOTOR
Since one of the constraints is to keep the same value of power rating for the six-phase
machine as the rating of the three-phase machine, one can state the following,
Volt-Ampere Output Of Three-Phase Machine = Volt-Ampere Output Of Six-Phase
Machine
i.e. phasephphasephphasephphaseph IVIV 6633 63 ××=×× (4-14)
From previous analysis, it is known that
VV phaseph 2653 = and AI phaseph 8.63 = (4-15)
However, From section 4-2, one knows that phasephphaseph II 36 = , Therefore, the rated value of
the phase current in the 6-phase machine , AI phaseph 8.66 =
Hence, from Equation 4-14,
VI
IVV
phaseph
phasephphasephphaseph 5.132
8.68.6265
63
63
6
336 =
××=
××= (4-16)
Furthermore, the line-to-line voltage can be deduced from the 6-phase voltage phasor diagram
shown in Figure 4-1
Figure 4-1. Phasor diagram of the line and phase voltages in the 6-phase system

Chapter 4: Design Of The Six-Phase Induction Motor 49
In Figure 4-1, it can be observed that each triangle formed by any two phase voltage
phasors and a line-to-line voltage phasor is an equilateral triangle. Therefore, as a result the
phaselinelineV 6− will be equal to phasephaseV 6 .
Hence VVV phasephasephaselineline 5.13266 ==− (4-17)
4.4 DESIGN OF THE STATOR WINDING
In the case of the 36 slot motor with 6 poles and 6 phases, the number of slots per pole
per phase is equal to one (1). Since the stator winding design is a double-layered layout, the total
number of coils per phase is 6 which is equal to half the number of coils per phase of the three-
phase machine . Also as derived earlier , each coil has half the number of turns of the three-phase
machine, that is each coil has 120 turns.
The slot pitch angle for the six-phase machine is accordingly calculated as follows:
electricalmechanicalPmechanicalor
mechanicalNs
phase
phase
0006
000
6
302610
210
1036
360360
=×=×=
===
γ
γ (4-18)
Therefore, if coil (1) of phase A starts in slot (1) , then coil (1) of phase B which is 060
away from phase A is placed in slot (3) . Similarly, coil (1) of phase C is placed in slot (5) , coil 1
of Phase D is placed in slot (7) , coil 1 of Phase E is placed in slot (9) and coil 1 of phase F is
placed in slot (11), see Figure 4-2 . Again a full –pitched winding design is adopted.Therefore,
the end of each coil is 0180 e away from the start of the coil and hence the coil span is (6) slot
pitches. For clarity, the layout of the first six pairs of coils in such a six-phase winding is shown
in Figure 4-2.

Chapter 4: Design Of The Six-Phase Induction Motor 50
Figure 4-2 . Six-Phase winding layout with, no. of poles = 6 , no. of slots per pole per phase = 1,
Double layered , lap-connected full pitch winding .
Placement of coils of the six phases is done based on the spatial distribution of the
windings in accordance with the following considerations:
As discussed in chapter 2 , the three-phase machine under study has 12 coils per
phase . To reconfigure this winding into a six-phase layout, which has 6 coils per
phase, the 12 coils of the three-phase are split into two groups each containing 6
coils. They can be denoted as follows:
Group I --- Coils A1- A6
Group II --- Coils A7-A12
Group III --- Coils B1-B6
Group IV --- Coils B7-B12
Group V --- Coils C1-C6
Group VI --- Coils C7-C12.
These groups are connected for three-phase operation as shown in Figure 4-3

Chapter 4: Design Of The Six-Phase Induction Motor 51
Figure 4-3. Connection Of the different Groups in the three-Phase configuration.
To reconfigure this grouping of coils into a six-phase winding , the terminal connections
of the coil Groups II , IV and VI are reversed (start becomes a finish and a finish becomes a start)
. Therefore , these groups of coils are connected to form the coils of phases D, F and B whereas
Groups I , V and III of coils are connected to form phases A, E and C. The rearrangement of this
coil grouping to form the 6-phase winding is best understood upon examination of the schematic
diagram shown in Figure 4-4.

Chapter 4: Design Of The Six-Phase Induction Motor 52
Figure 4-4. Connection Of the different Groups to form the Six-Phase configuration.
The connection of the coils of belonging to Group I and II constituting phase (A) in the 3-
phase machine are shown in Figure (4-5), the connection of the coils belonging to Group III and
Group IV constituting phase (B) in the 3-phase machine are shown in Figure (4-6) and the
connection of the coils belonging to Group V and Group VI constituting phase (C) in the 3-phase
machine are shown in Figure (4-7). Meanwhile , the connection of coils of Group I constituting
phase(A) in the 6-phase machine is shown in Figure (4-8) , the connection of coils of Group II
constituting phase (D) in the 6-phase machine is shown in Figure (4-9) , the connection of coils of
Group III constituting phase (C) in the 6-phase machine is shown in Figure (4-10) , the
connection of coils of Group IV constituting phase (F) in the 6-phase machine is shown in Figure
(4-11) , the connection of coils of Group V constituting phase (E) in the 6-phase machine is
shown in Figure (4-12) and the connection of coils of Group VI constituting phase (B) in the 6-
phase machine is shown in Figure (4-13).

Chapter 4: Design Of The Six-Phase Induction Motor 53
65
43
A7
A2 2
A8
A1 1
36
SA
2
3534
33
A6-
A7- 32
A5-
A8- 31
FA1
3029
2827
A9
A6 26
A10
A5 25
2423
2221
A4-
A9- 20
A3-
A10
-
1918
1716
15
A11
A4 14
A12
A3 13
1211
10
FA2
FA 9
A2-
A11
-
8
A1-
A12
-
76
54
SA
1
SA 3
A7
A2 2
A8
A1 1
Figure 4-5. Connection of the coils of Group I and II constituting Phase A of the three-phase machine

Chapter 4: Design Of The Six-Phase Induction Motor 54
B7
B2 6
B8
B1 5
4
SB
2
32
1
B6-
B7- 36
B5-
B8-
3534
FB1
3332
31
B9
B6 30
B10
B5 29
2827
2625
B4-
B9- 24
B3-
B10
-
2322
2120
19
B11
B4 18
B12
B3 17
1615
14
FB2
FB 13
B2-
B11
-
12
B1-
B12
-
1110
98
SB
1
SB 7
B7
B2 6
B8
B1 5
43
21
Figure 4-6. Connection of the coils of Group III and IV constituting Phase B of the three-phase machine

Chapter 4: Design Of The Six-Phase Induction Motor 55
65
C6-
C11
-
4
C5-
C12
-
32
FC1
136
35
C7
C6 34
C8
C5 33
32
SC
2
3130
29
C4-
C7- 28
C3-
C8- 27
2625
2423
C9
C4 22
C10
C3 21
2019
1817
C2-
C9- 16
C1-
C10
-
1514
1312
SC
1
SC 11
C11
C2 10
C12
C1 9
87
FC2
FC 65
C6-
C11
-
4
C5-
C12
-
32
1
Figure 4-7. Connection of the coils of Group V and VI constituting Phase C of the three-phase machine.

Chapter 4: Design Of The Six-Phase Induction Motor 56
3635
3433
A6- 32
A5- 31
FA 3029
2827
A6 26
A5
2524
2322
21
A4- 20
A3- 19
1817
1615
A4 14
A3 13
1211
109
A2- 8
A1- 7
65
4
SA 3
A2 2
A1
1
Figure 4-8. Connection of coils of Group I constituting Phase A of the six-phase machine.

Chapter 4: Design Of The Six-Phase Induction Motor 57
65
43
D6- 2
D5- 1
FD 3635
3433
D6 32
D5 31
3029
2827
D4- 26
D3- 25
2423
2221
D4 20
D3 19
1817
1615
D2- 14
D1- 13
1211
10
SD 9
D2 8
D1 7
65
43
21
Figure 4-9. Connection of coils of Group II constituting Phase D of the six-phase machine.

Chapter 4: Design Of The Six-Phase Induction Motor 58
65
43
21
C6- 36
C5- 35
FC 3433
3231
C6 30
C5 29
2827
2625
C4- 24
C3- 23
2221
2019
C4 18
C3 17
1615
1413
C2- 12
C1- 11
109
8
SC 7
C2 6
C1 5
43
21
Figure 4-10. Connection of coils of Group III constituting Phase C of the three-phase machine.

Chapter 4: Design Of The Six-Phase Induction Motor 59
F6-
6
F5-
5
FF 43
21
F6 36
F5 3534
3332
31
F4-
30
F3-
2928
2726
25
F4 24
F3 2322
2120
19
F2-
18
F1-
1716
1514
SF 13
F2 12
F1 1110
98
7
F6-
6
F5-
54
32
1
Figure 4-11. Connection of coils of Group IV constituting Phase F of the six-phase machine.

Chapter 4: Design Of The Six-Phase Induction Motor 60
65
E6- 4
E5- 3
2
FE 136
35
E6 34
E5 3332
3130
29
E4- 28
E3-
2726
2524
23
E4 22
E3 21
2019
1817
E2- 16
E1- 15
1413
12
SE 11
E2 10
E1 9
87
65
E6- 4
E5- 3
21
Figure 4-12. Connection of coils of Group V constituting Phase E of the six-phase machine.

Chapter 4: Design Of The Six-Phase Induction Motor 61
65
43
21
3635
B6- 34
B5- 33
32
FB 3130
29
B6 28
B5 27
2625
2423
B4- 22
B3- 21
2019
1817
B4 16
B3 15
1413
1211
B2- 10
B1- 9
87
6
SB 5
B2 4
B1 32
1
Figure 4-13. Connection of coils of Group VI constituting Phase B of the six-phase machine.

Chapter 4: Design Of The Six-Phase Induction Motor 62
The Winding layout/phase distributions for the six-phase induction machine with 36 slots and a
full-pitched coil span of 6 is shown in Figure 4-14. The complete winding layout of the
reconfigured six-phase induction machine is shown in Figure 4-15
1 2 3 4 5 6 7 8 9 10 11 12 13 14 15 16 17 18D5- D6- E5- E6- F5- F6- A1- A2- B1- B2- C1- C2- D1- D2- E1- E2- F1- F2-
A1 A2 B1 B2 C1 C2 D1 D2 E1 E2 F1 F2 A3 A4 B3 B4 C3 C4
19 20 21 22 23 24 25 26 27 28 29 30 31 32 33 34 35 36A3- A4- B3- B4- C3- C4- D3- D4- E3- E4- F3- F4- A5- A6- B5- B6- C5- C6-
D3 D4 E3 E4 F3 F4 A5 A6 B5 B6 C5 C6 D5 D6 E5 E6 F5 F6
TopBottom
TopBottom
Figure 4-14:Cross-sectional view of the stator slots showing the winding distributions of the Six Phases.

Chapter 4: Design Of The Six-Phase Induction Motor 63
F F6-
C2
6
9 F5-
C1
5
E FF E6-
B2
4
8 E5-
B1
3
D FE D6-
A2 2
7 D5-
A1
1
C FD C6-
F6 36
6 C5-
F5 35
B FC B6-
E6
34
5 B5-
E5
33
A FB A6-
D6
32
4 A5-
D5
31
FA F4-
C6
30
F3-
C5
29
E4-
B6
28
E3-
B5 27
D4-
A6
26
D3-
A5
25
C4-
F4 24
C3-
F3 23
B4-
E4 22
B3-
E3
21
A4-
D4
20
A3-
D3
19
F2-
C4
18
F1-
C3
17
E2-
B4
16
E1-
B3
15
12 D2-
A4 14
SF
D1-
A3
13
11 C2-
F2 12
SE
C1-
F1 11
10 B2-
E2
10
SD
B1-
E1
9
3 A2-
D2
8
SC
A1-
D1
7
2 F6-
C2
6
SB
F5-
C1
5
1 E6-
B2 4
SA
E5-
B1
3
D6-
A2
2
D5-
A1
1
Figure 4-15:Complete Winding layout Of The Reconfigured Six-Phase induction machine Showing
connections of all the coils

Chapter 4: Design Of The Six-Phase Induction Motor 64
4.4.1 MMF DISTRIBUTION
From Equation 2-33 , for a six-phase armature winding the MMFs of phases A, B, C, D,
E and F can be represented as follows:
)]cos()cos([1),(1
max thhKh
FtF wh
k
ha ⋅⋅×⋅××= ∑
=
ωθθ (4-21)
)]3
cos()3
cos([1),(1
maxπωπθθ −⋅⋅×−⋅××= ∑
=
thhKh
FtF wh
k
hb (4-22)
)]3
2cos()3
2cos([1),(1
maxπωπθθ −⋅⋅×−⋅××= ∑
=
thhKh
FtF wh
k
hc (4-23)
)]cos()cos([1),(1
max πωπθθ −⋅⋅×−⋅××= ∑=
thhKh
FtF wh
k
hd (4-24)
)]3
4cos()3
4cos([1),(1
maxπωπθθ −⋅⋅×−⋅××= ∑
=
thhKh
FtF wh
k
he (4-25)
)]3
5cos()3
5cos([1),(1
maxπωπθθ −⋅⋅×−⋅××= ∑
=
thhKh
FtF wh
k
hf (4-26)
Therefore, the resultant / total fundamental stator MMF , ),( tFs θ , can be expressed by adding
by adding all the first harmonic / fundamental terms in Equations (4-21) through (4-26) , which
yield the following upon proper trignometric / algebraic reductions:
)cos(26),(),(),(),(),(),( max tFtFtFtFtFtFtFF fedcbas ωθθθθθθθ −××=+++++=
where, PoleATm
IP
NF phph /24
max ×××=π
, phN is the Number of turns per phase, P is the
Number of poles, m is the Number of phases , h is the harmonic order, for the fundamental h =
1 , and whK is the winding factor for the harmonic order , h
The MMF distribution produced by the six-phase winding layout given earlier in Figure 4-15 is
shown in here in Figure 4-16, including a developed diagram of the layout of the six-phases.

Chapter 4: Design Of The Six-Phase Induction Motor 65
1 2 3 4 5 6 7 8 9 10 11 12 13 14 15 16 17 18 19 20 21 22 23 24 25 26 27 28 29 30 31 32 33 34 35 36
D5- D6- E5- E6- F5- F6- A1- A2- B1- B2- C1- C2- D1- D2- E1- E2- F1- F2- A3- A4- B3- B4- C3- C4- D3- D4- E3- E4- F3- F4- A5- A6- B5- B6- C5- C6-
A1 A2 B1 B2 C1 C2 D1 D2 E1 E2 F1 F2 A3 A4 B3 B4 C3 C4 D3 D4 E3 E4 F3 F4 A5 A6 B5 B6 C5 C6 D5 D6 E5 E6 F5 F6
Figure 4-16. The mmf distribution produced by the currents in the six windings of the six-phase
machine.
)]cos()cos([1),(1
max thhKh
FtF wh
k
ha ⋅⋅×⋅××= ∑
=
ωθθ
)]3
cos()3
cos([1),(1
maxπωπθθ −⋅⋅×−⋅××= ∑
=
thhKh
FtF wh
k
hb
)]3
5cos()3
5cos([1),(1
maxπωπθθ −⋅⋅×−⋅××= ∑
=
thhKh
FtF wh
k
hf
)]3
4cos()3
4cos([1),(1
maxπωπθθ −⋅⋅×−⋅××= ∑
=
thhKh
FtF wh
k
he
)]cos()cos([1),(1
max πωπθθ −⋅⋅×−⋅××= ∑=
thhKh
FtF wh
k
hd
)]3
2cos()3
2cos([1),(1
maxπωπθθ −⋅⋅×−⋅××= ∑
=
thhKh
FtF wh
k
hc

Chapter 4: Design Of The Six-Phase Induction Motor 66
4.5 CONNECTION SCHEME FOR THE REVERSIBLE THREE-PHASE TO
SIX-PHASE OPERATION
FOR SIX-PHASE OPERATION
The twelve (12) terminals of the individual phase windings referring to starts (S) and
finishes (F) of all the phases A, B, C, D, E and F are symbolized here by,
SA,SB,SC,SD,SE,SF,FA,FB,FC,FD,FE and FF as shown in Figure 4-17 of the reconfigured 6 –
phase machine. For the six-phase operation , line-to-line voltage phasors are separated by 600 e,
and are connected to terminals 1 , 2 , 3 , 10, 11 and 12 , respectively as shown in Figure 4-17. The
neutral point is formed by connecting terminals 4 , 5 , 6 , 7 , 8 , and 9 together. Thus terminals 1 ,
2 , 3 , 10 , 11 and 12 are the outer / input leads.

Chapter 4: Design Of The Six-Phase Induction Motor 67
Figure 4-17:Connection Scheme For Six-Phase Operation

Chapter 4: Design Of The Six-Phase Induction Motor 68
FOR THREE-PHASE OPERATION
The twelve terminals of the individual coils referring to the starts and finishes of the
reconfigured six-phase machine connection of Figure 4-17 , are connected as shown in Figure 4-
18 for three-phase operation, line-to-line voltages here are separated by 1200 e and connected to
terminals 1 , 3 and 11. It is important to note that for three-phase operation
terminal 4 is connected to terminal 7,
terminal 6 is connected to terminal 9,
and terminal 8 is connected to terminal 5. Here,
terminals 2, 10 and 12 are connected together to form the neutral.

Chapter 4: Design Of The Six-Phase Induction Motor 69
Figure 4-18:Connection Scheme For Three-Phase Operation

70
CHAPTER 5: FUNDAMENTALS OF THE TIME-
STEPPING FINITE ELEMENT METHOD
5.1 INTRODUCTION
In this chapter the development of the Time-Stepping Finite Element (TSFE) model will
be discussed. It should be noted that the TSFE model used in this thesis has been implemented in
the commercially available software package, namely MAGSOFT (Flux 2D). This chapter will
present some basic principles of the TSFE modeling approach .
5.2 DEVELOPMENT OF THE FINITE ELEMENT METHOD
Earlier the magnetic circuit or permeance (magnetic Ohms-law) method was used for
calculating approximate magnetic fields in devices of simple geometry [28,29]. For more accurate
calculations , however, finite element computer algorithms programs are necessary.
The key limitation of the magnetic circuit method is that it requires assumption of the
magnetic flux paths. The lengths and cross-sectional areas of all the paths must be known.
Usually the paths are assumed to consist of straight lines, which is erroneous to some extent. To
calculate the effects of flux fringing, saturation, and leakage flux one usually uses empirical
correction factors. If a motor or other magnetic device has had essentially the same type of design
for many years, then the empirical factors may be fairly well known.
Today’s motor designer is often involved with new motor design concepts for which the
flux paths and empirical factors are unknown. Even if the design is a well-understood older
design configuration or concept, there is a great need today for accurately determining the effects

Chapter 5: Fundamentals of the time-stepping finite element method 71
of geometric changes and saturation on motor efficiency and other performance parameters
related to the magnetic field.
The Finite Element (FE) method is readily available in the laboratory in the form of a
commercial computer software with the trade name “ MAGSOFT ”. The software requires no
assumption of flux paths or related empirical factors. This FE software accurately calculates
magnetic fields and the related motor design parameters for motors of complicated geometry,
with saturation , with significant armature reaction ,and with or without eddy currents.
5.3 BASIC PRINCIPLES
The finite element method is based on energy conservation. It is well known that the flux
density , B , field intensity , H , the current density , J , and the electric field , E , are related
to each other by the constitutive Equations 5-1 through 5-3 , as follows [30]:
HB (5-1)
BvH (5-2)
EJ (5-3)
where is the magnetic permeability of the material
v is the magnetic reluctivity of the material and
is the electrical conductivity in conductive regions of a given device.
The law of conservation of energy in electric motors may be derived from Maxwell’s equations
which are as follows [30]:
t
DJH
(Ampere’s law) (5-4)
t
BE
(Faraday’s law) (5-5) and

Chapter 5: Fundamentals of the time-stepping finite element method 72
0 B (5-6)
where , D is the electric flux density / displacement vector.
Applying the null identity , equation 5-6 can be rewritten as 0)( A , where , A is
defined here as the magnetic vector potential . Thus , the flux density in terms of magnetic vector
potential can be defined as follows:
AB (5-7)
From equations 5-7 , 5-4 and 5-2 , the differential equation describing a field distribution can be
can be expressed as follows [30]:
JAv ))(( (5-8)
Also from Faraday’s law i.e. equation 5-5 and 5-7 , one can write the following:
)()(t
AE
(5-9)
where is an arbitrary differentiable scalar potential function.Hence, from (5-9) it follows that:
)()(t
AE
(5-10)
Thus ,
)(t
AE
(5-11)
Finally from equation 5-3 and 5-11 , the current density , J , can be expressed as ,
)(t
AJ
(5-12)
Substituting equation 5-12 in 5-8 , one can obtain the following key partial differential equation
(pde):

Chapter 5: Fundamentals of the time-stepping finite element method 73
t
AAv
)())(( (5-13)
Equation 5-13 is the principle equation solved in time-stepping finite-element models of time-
domain electromagnetic events in electromechanical energy conversion devices or systems [30].
If time-domain events are not of concern , and the emphasis is on static magnetic field
computation in electromechanical devices , Equation 5-13 can be simplified to the static form in
which a current density , )( J , and hence one can write the following governing pde:
JAv ))(( (5-14)
Variational techniques such as the finite element method obtain solutions to field
problems by mimimizing a functional whose minimization satisfies either Equation 5-13 or 5-14,
and the associated boundary conditions simultaneously [31]. This energy functional [31]
expresses the difference between the stored magnetic energy and the input energy in the volume
of the device under study.
5.4 FINITE ELEMENT FORMULATION
Minimization of the magnetic energy functional [32] over a set of finite elements (called a mesh)
leads to a matrix equation that can be solved for the magnetic vector potential , (mvp) A ,
throughout the mesh.This is essentially a numerical solution of Equation 5-14 governing
magnetostatic fields. Figure 5-1 shows a typical finite element belonging to a finite element mesh.

Chapter 5: Fundamentals of the time-stepping finite element method 74
Figure 5-1: Typical triangular finite element connected to other finite elements
In this case, the device analyzed must be subdivided into triangles or quadrilaterals called finite
elements , each of which has three or four vertices called grid points. Given the motor geometry ,
MAGSOFT software automatically generates the finite element mesh for best solution
accuracy.Within each triangular finite element, the mvp, A, is assumed to vary linearly
according to a polynomial such as follows [33]:
)(2,,
YfXedA
A kkk
nmlk
k
(5-14)
Where, is the triangle area
An NN global finite element S A I is obtained , which matrix equation that is obtained is
solved for the vector , A , at the grid point potentials using Newton-Raphson based sparse matrix
techniques. Generally , all the interior grid points are unconstrained, while grid points on the
exterior of the mesh are constrained in a manner dependent on the boundary conditions at the
exterior of the region analysed. In two-dimensional planar problems a flux line is a line of
l
m
n

Chapter 5: Fundamentals of the time-stepping finite element method 75
constant magnetic vector potential , A. For most electrical machines with steel exterior surfaces,
the flux is assumed to be confined to the steel outer boundary. By using the boundary condition,
A=0 , flux lines are constrained to follow the boundary. Many electrical machines have identical
poles, or even identical half-poles. The matrix equation with size NN can be greatly reduced
if the mesh contains only one-pole or one-half pole. Absence of any constraint on an exterior grid
point can be shown to cause the flux lines to be perpendicular to the finite element mesh
boundary. This perpendicularity is called the natural boundary condition.
5.5 SOLUTION TECHNIQUES
Once the matrix equation , S A I , has been assembled and the mvp constraints have
been enforced, solution for the mvp vector , A , at the unconstrained grid points may proceed.
The advantage of using the mvp stems from the fact that all parameters used to characterize
magnetic fields, such as, the magnetic field intensity, H
, and the magnetic flux density, B
, are
readily obtainable from the knowledge of magnetic vector potential vector , A , at the grid nodes ,
and hence the need of using multiple physical quantities to characterize the field is eliminated.
If the permeability is known throughout the region , then the flux density can be solved
directly by Gauss-Jordan elimination. If the permeability is not constant, then the matrix
equations depends on the magnitude of B ( and J). In this case an iterative procedure is
developed. The matrix is first estimated from an initial solution using approximate material
permeabilities. Then the equations are solved repeatedly (iteratively) using a Newton-raphson
based approach, which depends on the latest values of A , enabling rapid convergence to the
correct saturable condition mvps, A .
In the algorithm of MAGSOFT, the parameters are automatically computed from the B-H
curves applied as input data.While the distribution of the resulting mvp , A , has little meaning to

Chapter 5: Fundamentals of the time-stepping finite element method 76
design engineers , many useful performance parameters can be calculated from A .The
MAGSOFT postprocesses A to obtain parameters of significant interest such as the flux density
B , is calculated in each finite element using the curl of the mvp , A , as in equation 5-7.From
the mvps , A , the flux flowing between any two points (nodes) is easily obtained by using the
equation:
ldA (5-15)
For two-dimensional problems the flux between two grid points 1 and 2 is simply:
dAA )( 2112 (5-16) where d is the axial depth or stack length in
a motor or a machine.Also calculable from the A distribution are the various flux linkages and
the inductances.
5.6 THE TIME-STEPPING FINITE ELEMENT METHOD
The time-stepping finite element method is one in which 5-13 is solved , hich is a
solution of a time-varying electromagnetic field throughout the cross-section of a device. Such
solution enables one to directly predict essentially all the performance parameters of a device
whether it is a motor, generator, or a transformer. The Time-stepping finite element software [34]
provides more thorough and accurate prediction of a motor performance than the state-space-
finite element approach in which a series of state field solutions are utilized [34-39]. All motor
performance parameters, such as torque, induced or eddy currents, and winding currents are
predicted as functions of time. Thus cogging torques and harmonic currents are predicted as well
as average torque and fundamental current. The time-stepping finite element software must allow
the rotor to move, either at constant speed or in response to motor torque and mechanical load.
The theory of time-stepping finite element computation of motor performance is best
summarized as given next.

Chapter 5: Fundamentals of the time-stepping finite element method 77
The power source driving the motor , the motor’s electromagnetic fields , and the
motor-mechanical load dynamic equations are all time-dependent subject to the appropriate
initial conditions. Kirchoff’s electric circuits voltage law is used to describe the connection
between the power source and the windings of the motor. Two types of conductors are considered
:solid conductors in which eddy currents can be induced, and stranded conductors without eddy
currents.
Because motion occurs in motors, the field equations for the stator and the rotor can
be written in their own coordinate systems to avoid the rotational speed appearing explicitly in
the formulation. Conductors are normally connected to produce multiturn windings. To represent
voltage-fed windings in motors , circuit equations are coupled with field equations.
The equation of motion of the rotor of any motor is typically expressable as follows:
appem TTJ (5-17)
Where onacceleratiangular
velocityangularrotational
inertiaofmomentJ
frictionoftcoefficien
torqueneticelectromagdevelopedTem
torquemechanicalappliedexternallyTapp
At each time step,the electromagnetic torque is computed from the time-stepping finite-element
magnetic field solution using the method of virtual work involved. This is followed by solving the
equation of motion, which allows computation of a new rotor angular acceleration versus time
and thus the rotor speed and angular position versus time.

Chapter 5: Fundamentals of the time-stepping finite element method 78
To allow the rotor to move in the finite element mesh, the MAGSOFT software uses the
moving surface method [34]. The idea is to share a common slip surface between the rotor mesh
and the stator mesh, One side of the surface is attached to the stator and the other moves with the
rotor. After any computed angular motion during the time step, the two independent meshes are
automatically coupled together within the finite element functions. Thus the rotor mesh is free to
move to any specified angle without remeshing.
In this work , finite element analysis method was used to model the case-study 5-hp
induction machine.The generated meshes for the case-study 5-hp motor resulted in a total of
13563 nodes and 6622 elements. A parital view of the motor cross-section subdivided into finite
elements is shown in Figure 5-2. Notice the high density of meshing in the rotor slots and sirgap
as well as at the tips of the stator slots. The FE grid is much coarser in the cores, where flux
density variations are less severe than near the airgap.
Figure 5.2 Finite-element mesh of a portion of the case-study 5HP induction motor

Chapter 5: Fundamentals of the time-stepping finite element method 79
The results of simulations using the commercially available MAGSOFT time-stepping finite
element software package are given in the next chapter.
80
CHAPTER 6: EXPERIMENTAL AND SIMULATION RESULTS
6.1 INTRODUCTION
In this chapter, the experimental and simulation results of the case-study 5HP squirrel
cage induction motor used in this thesis will be presented in detail for various operating
conditions.In the first section the experimental and simulation results of the 3-phase operation
will be considered. Following this , a comparitive analysis of the simulation results of the 3-phase
versus the simulation results of the 6-phase operations will be studied. It should be mentiond that
the experimental and simulation results for the 3-phase operation will be presented whereas for
the 6-phase operation , only the simulation results are presented, because of the lack of
availability of a rewound machine. It should also be mentioned that the experimental and
simulation results presented here were obtained at rated operating conditions, with the machine
developing a torque of 30Nm under rated conditions at a corresponding speed of 1165 rpm. This
was accomplished while the machine was supplied from a balanced 3-phase 460-V (line-to-
line),60hz voltage source.The results include both laboratory obtained performance data and
Time-stepping-finite-element (TSFE) simulation obtained performance data . Furthermore , for
the 6-phase induction machine supplied from a balanced 6-phase , 132.5-V(line-to-line), 60hz
source ,only TSFE simulation obtained performance results are presented.
Most importantly, the operation of the 6-phase machine was studied through TSFE
simulation results obtained under different types of phase loss scenarios to predict the 5-phase , 4-

Chapter 6: Experimental and Simulation results 81
phase and 3-phase operations. A flow-chart of the various cases considered is presented in Figure
6-1
Figure 6-1: Flow-Chart of types of phase-loss scenarios studied.
6.2 COMPARISON OF EXPERIMENTAL AND SIMULATION RESULTS OF THE 3-PHASE OPERATION
In this section , the experimental results are obtained for the 3-phase machine with a short-
pitched winding, the cross-section of which is shown in Figure (2-18), and the design details of
which were given earlier in Chapter 2 . These results were compared with the Time-Stepping
Finite-Element (TSFE) simulation results for the 3-phase machine with the same short-pithced
and the full-pitched winding whose cross-section is shown in Figure (2-19). It turned out that the
current and voltage waveforms, as well as the torque profiles of the short-pitched and full-pitched
windings are identical.
Depicted in Figure 6-2 and Figure 6-3 are the line voltages , Vab,Vbc and Vca obtained from
experimental test and the TSFE simulation respectively. In Figures 6-4 and 6-5 , the rated
Phase Loss conditions
5-Healthy Phase condition
4-Healthy Phase condition
3-Healthy Phase condition
Adjacent phase loss Non-Adjacent Phase loss
Adjacent phase loss Non-Adjacent Phase loss

Chapter 6: Experimental and Simulation results 82
currents ia , ib and ic obtained from experimental test and TSFE are shown. Futhermore, in
Figures 6-6 and 6-7 , the rated torque from experimental test and TSFE simulation are compared.
It should be mentioned that the experimental results were obtained at a sampling frequency rate
of 50khz
0 0.02 0.04 0.06 0.08 0.1-800
-600
-400
-200
0
200
400
600
800
Time (sec)
Line
volta
ge (vo
lts)
vabvbcvca
Figure 6-2 : Line voltages obtained from experimental test for the case study 5HP , 3-phase induction
0 0.02 0.04 0.06 0.08 0.1-800
-600
-400
-200
0
200
400
600
800
Time (sec)
Line
Vol
tage
(vo
lts)
vabvbcvca
Figure 6-3:Line voltages obtained from the TSFE simulation for the 5HP, 3-phase induction motor .

Chapter 6: Experimental and Simulation results 83
0.2 0.22 0.24 0.26 0.28 0.3-10
-8
-6
-4
-2
0
2
4
6
8
10
Time (sec)
Cur
rent
(A)
iaibic
Figure 6-4: Phase Currents obtained from experimental test for the 5HP, 3-phase induction motor.
0.2 0.22 0.24 0.26 0.28 0.3-10
-8
-6
-4
-2
0
2
4
6
8
10
Time (sec)
Cur
rent
(A)
iaibic
Figure 6-5: Phase Currents obtained from the TSFE simulation for the 5HP, 3-phase induction motor.
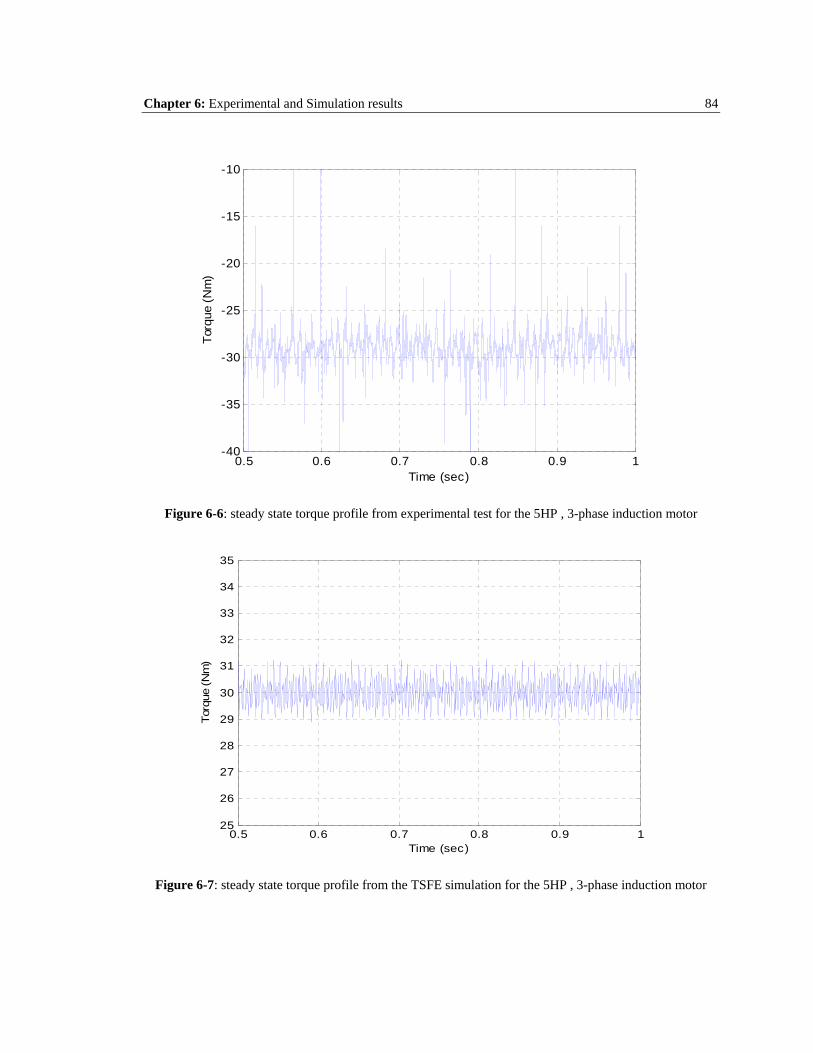
Chapter 6: Experimental and Simulation results 84
0.5 0.6 0.7 0.8 0.9 1-40
-35
-30
-25
-20
-15
-10
Time (sec)
Torq
ue (
Nm
)
Figure 6-6: steady state torque profile from experimental test for the 5HP , 3-phase induction motor
0.5 0.6 0.7 0.8 0.9 125
26
27
28
29
30
31
32
33
34
35
Time (sec)
Torq
ue (
Nm
)
Figure 6-7: steady state torque profile from the TSFE simulation for the 5HP , 3-phase induction motor

Chapter 6: Experimental and Simulation results 85
Upon careful examination of the above results , it can be noticed that the experimental
results are very similar to the results obtained from the TSFE simulation . The rms value of the
rated current obtained in both the cases is about 6.8 A and the average value of steady state
torque is about 30 Nm.
The harmonic breakdowns of both the experimental voltage, current and torque data are
compared with their respective TSFE simulation data in Tables 6-1 through 6-3. Again regarding
the fundamental and major low-order harmonic components , there exists a reasonable
engineering correlation.
Magnitude (V) Harmonic order
Experimental TSFE Simulation
Fundamental component 1 649.5 650
2 1.955 0
4 2.238 0
6 2.013 0
8 1.2 0
10 0.67 0
12 0.65 0
14 0.6531 0
Table 6-1: Harmonic breakdown of the experimental versus the TSFE simulation results of the line-to-line voltage for the case study
5hp Induction motor

Chapter 6: Experimental and Simulation results 86
Table 6-2: Harmonic breakdown of the experimental versus the TSFE simulation results of the phase current for the case study 5hp
Induction motor.
Magnitude (A) Harmonic order
Experimental TSFE Simulation
Fundamental component 1 9.3 8.9
2 0.0002504 0
4 0.0001117 0
6 0.0006211 0
8 0.0002762 0
10 0.00000105 0
12 0.0000256 0
14 0.00000002 0

Chapter 6: Experimental and Simulation results 87
Magnitude (Nm) Harmonic order
Experimental TSFE Simulation
Fundamental component 0 30 30
2 0.02 0
4 0.007 0
6 0.1 0
8 0.00036 0
10 0.00253 0
12 0.00087 0
14 0.00006 0
Table 6-3: Harmonic breakdown of the experimental versus the TSFE simulation results of the torque for the case study
5hp Induction motor.
6.3 COMPARISON OF THE TIME-STEPPING FINITE-ELEMENT SIMULATION RESULTS OF THE 3-PHASE OPERATION AND 6-PHASE OPEARTION Here , a comparative analysis between the TSFE simulation results of the operation
performance of the 3-phase and 6-phase winding configuration are presented. In Figures
6-8 and 6-9 , the flux plots generated by the TSFE technique are shown for the 3-phase
and 6-phase machine designs, respectively.These flux plots were obtained at a time
instant t=0.9 sec in the TSFE simulation, at which time the machine has reached steady
state operation. It can be observed that these flux plots demonstrate the fact that both the
machines have a six-pole arrangement, and the field distribution are almost
indistinguishable from each other.

Chapter 6: Experimental and Simulation results 88
Figure 6-8: Flux plot of the 3-phase machine
Figure 6-9: Flux plot of the 6-phase machine
Depicted in Figures 6-10 and 6-11 are the comparison of phase voltages under rated
conditions of the 3-phase and 6-phase machines, respectively. In Figures 6-12 and 6-13 , the flux-
density waveform (profile) at the mid-airgap, are given for the 3-phase and 6-phase machines ,
respectively .These waveforms were plotted against the mid-airgap circumference of the machine
in mm at a time instant t= 0.85 sec. , at which time the machine has reached steady state
operation. Further , In Figures 6-14 and 6-15 , the phase currents ia , ib and ic for the 3-phase
machine and the phase currents ia , ib , ic , id , ie and if for the 6-phase machine are shown. It can
be observed that the phase currents in the 3-phase case are phase shifted by 1200 e whereas the
phase currents in the 6-phase machine are phase shifted by 600 e , respectively. The steady-state
torque profiles of the 3-phase and 6-phase machines are shown in Figures 6-16 and 6-17, and the
steady-state profile of the angular velocity versus time for the 3-phase and 6-phase machines are
shown in Figures 6-18 and 6-19 , respectively. Notice that in both the torque and speed profiles of
Figures 6-16 through 6-19, the initial transients appearing in these profiles are not natural but
numerical in nature , arising from the mismatch between the given initial conditions and the
natural steady state forced response of the electromagnetic /electromechanical energy motor-load
system.

Chapter 6: Experimental and Simulation results 89
0.95 0.955 0.96 0.965 0.97 0.975 0.98 0.985 0.99 0.995 1-400
-300
-200
-100
0
100
200
300
400
Time (sec)
Pha
se v
olta
ge (V
olts
)
VaVbVc
Figure 6-10 : plot of phase voltages in the 3-phase machine
0.95 0.955 0.96 0.965 0.97 0.975 0.98 0.985 0.99 0.995 1-200
-150
-100
-50
0
50
100
150
200
Time (sec)
Pha
se v
olta
ge (V
olts
)
VaVbVcVdVeVf
Figure 6-11 : plot of phase voltages in the 6-phase machine

Chapter 6: Experimental and Simulation results 90
0 50 100 150 200 250 300 350 400 450-1.5
-1
-0.5
0
0.5
1
Circumference in mm
Tesl
a
Figure 6-12: Plot of flux-density in the mid-airgap of the 3-phase induction machine from TSFE simulation
0 50 100 150 200 250 300 350 400 450-1.5
-1
-0.5
0
0.5
1
Circumference in mm
Tesl
a
Figure 6-13: Plot of flux-density in the mid-airgap of the 6-phase induction machine from TSFE simulation
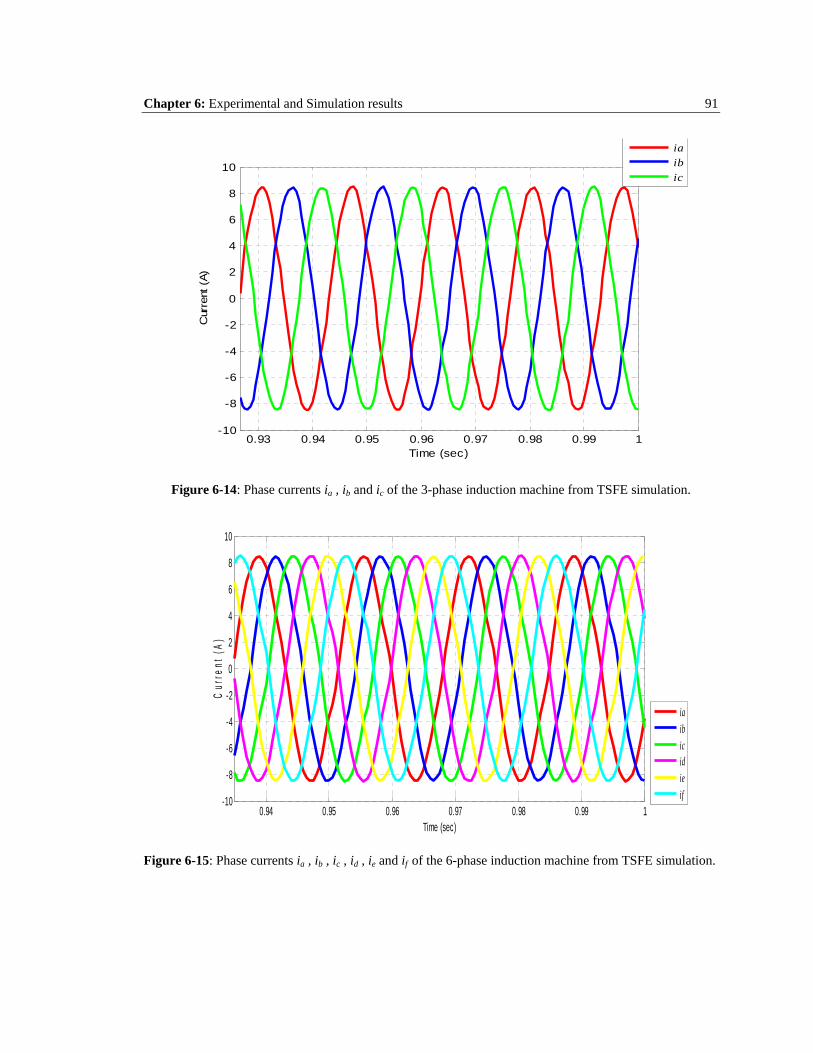
Chapter 6: Experimental and Simulation results 91
0.93 0.94 0.95 0.96 0.97 0.98 0.99 1-10
-8
-6
-4
-2
0
2
4
6
8
10
Time (sec)
Cur
rent
(A)
iaibic
Figure 6-14: Phase currents ia , ib and ic of the 3-phase induction machine from TSFE simulation.
0.94 0.95 0.96 0.97 0.98 0.99 1-10
-8
-6
-4
-2
0
2
4
6
8
10
Time (sec)
Cur
rent
(A)
iaibicidieif
Figure 6-15: Phase currents ia , ib , ic , id , ie and if of the 6-phase induction machine from TSFE simulation.

Chapter 6: Experimental and Simulation results 92
0 0.1 0.2 0.3 0.4 0.5 0.6 0.7 0.8 0.9 1-100
-80
-60
-40
-20
0
20
40
60
80
100
Time (sec)
Torq
ue (N
m)
Figure 6-16: Torque profile of 3-phase induction motor under rated conditions from TSFE simulation.
0 0.1 0.2 0.3 0.4 0.5 0.6 0.7 0.8 0.9 1-100
-80
-60
-40
-20
0
20
40
60
80
100
Time (sec)
Torq
ue (N
m)
Figure 6-17: Torque profile of 6-phase induction motor under rated conditions from TSFE simulation.

Chapter 6: Experimental and Simulation results 93
0 0.1 0.2 0.3 0.4 0.5 0.6 0.7 0.8 0.9 1950
1000
1050
1100
1150
1200
Time (sec)
Spe
ed (r
pm)
Figure 6-18: Speed profile of 3-phase induction motor under rated conditions from TSFE simulation.
0 0.1 0.2 0.3 0.4 0.5 0.6 0.7 0.8 0.9 1950
1000
1050
1100
1150
1200
Time (sec)
Spe
ed (r
pm)
Figure 6-19: Speed profile of 6-phase induction motor under rated conditions from TSFE simulation.

Chapter 6: Experimental and Simulation results 94
6.4 SIMULATION OF THE SIX-PHASE INDUCTION MOTOR UNDER VARIOUS PHASE LOSS SCENARIOS
As depicted in Figure 6-1 , the phase loss scenarios studied in this work are , 5-phase
operation where there is a loss of one phase , 4-phase operation where there is a loss of two
phases and 3-phase operation where there is a loss of three phases. Furthermore, the 4-phase and
3-phase operations, in which two or three phases have been taken out of service, were studied
under conditions where there is a loss of adjacent phases that is a loss of phases which are located
adjacent to each other or alternately a loss of two or more phases which are non-adjacent to each
other, that is the loss of phases separated by one or two other healthy phases were also studied in
this work.
6.4.1 5-HEALTHY PHASE AND ONE FAULTY PHASE OPERATION
Here ,the six-phase motor is TSFE- simulated with the loss of phase A .Figures 6-20 and
6-21 show the phasor representation of voltages in the six-phase healthy case and the five-phase
healthy and one faulty phase case, under the loss of phase A. In Figures 6-22 and 6-23 , the torque
profiles of the faulty case with 5 healthy phases should be compared with the 6-phase healthy
case. These figures are accompanied by a magnified (zoom) , portion of the steady-state torque
profiles, in order to obtain a better sense of the consequences of the loss of one phase on the
torque-ripple content in the resulting time-domain torque profile. In Figures 6-24 and 6-25 , the
Harmonic breakdown of the steady state torque profile for the 6-phase healthy case and the faulty
case with 5 healthy phases are shown. Notice that the 2nd order harmonic is more pronounced in
the faulty case with 5 healthy phases with a magnitude of 2.776 Nm when compared to the
healthy case for which the 2nd order harmonic has a magnitude of 0.1345 Nm .

Chapter 6: Experimental and Simulation results 95
Figure 6-20 : Phasor representation of the voltages in six-phase healthy operation
Figure 6-21 : Phasor representation of the voltages in the five-phase operation with loss of Phase A
VB
VC
VD
VE
VF
VA
VB
VC
VD
VE
VF

Chapter 6: Experimental and Simulation results 96
0.2 0.3 0.4 0.5 0.6 0.7 0.8 0.9 125
26
27
28
29
30
31
32
33
34
35
Time (sec)
Torq
ue (N
m)
0.2 0.3 0.4 0.5 0.6 0.7 0.8 0.9 1
25
26
27
28
29
30
31
32
33
34
35
Time (sec)
Torq
ue (N
m)
0.95 0.955 0.96 0.965 0.97 0.975 0.98 0.985 0.99 0.995 1
25
26
27
28
29
30
31
32
33
34
35
Time(sec)
Torq
ue(N
m)
Figure 6.22 : Torque profile of the healthy 6-phase case under full-load
0.95 0.955 0.96 0.965 0.97 0.975 0.98 0.985 0.99 0.995 125
26
27
28
29
30
31
32
33
34
35
Time (sec)
Torq
ue (N
m)
Figure 6.23:Torque profile of the 5-healthy phase case with loss of phase A
0 2 4 6 8 10 12 14 160
5
10
15
20
25
30X: 0Y: 30
Mag
nitu
de (N
m)
Harmonic Order
Figure 6.24:Harmonic spectrum of the torque profile of the healthy 6-
phase case
0 2 4 6 8 10 12 14 160
5
10
15
20
25
30
X: 1.999Y: 2.776
Mag
nitu
de (
Nm
)
Harmonic Order
X:0Y:30
Figure 6.25:Harmonic spectrum of the torque profile of the
5-healthy phase case with loss of phase A
RIPPLE CONTENT: 18.33 %RIPPLE CONTENT: 6.67 %

Chapter 6: Experimental and Simulation results 97
Figure 6-26 and 6-27 shows the phase currents in the 5-healthy phase and one faulty phase with
loss of phases A and the healthy six-phase operations.
0.95 0.955 0.96 0.965 0.97 0.975 0.98 0.985 0.99 0.995 1-20
-15
-10
-5
0
5
10
15
20
Time (seconds)
Cur
rent
(A)
iaibicidieif
Figure 6-26 : Phase currents ia , ib , ic , id , ie and if of the 5-healthy and one faulty phase operation of the six-phase induction motor.
0.94 0.95 0.96 0.97 0.98 0.99 1-10
-8
-6
-4
-2
0
2
4
6
8
10
Time (sec)
Cur
rent
(A)
iaibicidieif
Figure 6-27 : Phase currents ia , ib , ic , id , ie and if of the healthy six-phase induction motor.

Chapter 6: Experimental and Simulation results 98
From the above analysis , the torque ripple content in the resulting torque is 18.33% with the 5-
healthy phases and one faulty phase case, in comparison with 6.67% torque ripple content in the
healthy six-phase case.
6.4.2 THE FOUR HEALTHY PHASE – TWO FAULTY PHASE OPERATION
As mentioned earlier , here two cases are considered ,One case is the loss of two adjacent
phases and the other case is the loss of two non-adjacent phases. Figure 6-28 summarizes the
four-healthy phase and two faulty phase operations which are considered in this thesis.
Figure 6-28: Flow chart summarizing the various cases of 4-phase operations studied.
6.4.2.1 LOSS OF TWO ADJACENT PHASES
In this case , the six-phase motor is simulated under loss of two adjacent phases
,namely Phase A and Phase B . Figures 6-29 and 6-30 show the phasor representation of voltages
in the six-phase healthy case and the four-healthy phase faulty two-phase case under loss of phase
4 HEALTHY PHASE
OPERATION
TWO ADJACENT FAULTY
PHASE LOSS
TWO NON-ADJACENT FAULTY
PHASE LOSS
LOSS OF TWO PHASES
SEPARATED BY 0180 e
LOSS OF TWO PHASES SEPARATED
BY 060 e
LOSS OF PHASE A AND PHASE B
LOSS OF PHASE A AND PHASE C
LOSS OF PHASE A AND PHASE D
LOSS OF TWO PHASES SEPARATED
BY 0120 e

Chapter 6: Experimental and Simulation results 99
A and phase B. In Figures 6-31 and 6-32 , the torque profiles of the 4-healthy phase and two-
faulty phase case is compared with the six-healthy phase case. These figures are accompanied by
a magnified (zoom) portion of the steady-state torque profile. In Figures 6-33 and 6-34 , the
Harmonic breakdown of the steady state torque profile for the 6-phase healthy case and the faulty
case with 4 healthy phases are two faulty phases which are adjacent to each other are shown.
Notice that the 2nd order harmonic is more pronounced in the faulty case with 4 healthy phases
and two faulty phases adjacent to each other with a magnitude of 6.984 Nm when compared to
the healthy case for which the 2nd order harmonic has a magnitude of 0.1345 Nm .
Figure 6-29 : Phasor representation of the voltages
in six-phase healthy operation
Figure 6-30 : Phasor representation of the voltages
in the four-healthy phase operation with loss of
adjacent phases A and B
VC
VD
VE
VF
VA
VB
VC
VD
VE
VF

Chapter 6: Experimental and Simulation results 100
0.2 0.3 0.4 0.5 0.6 0.7 0.8 0.9 120
22
24
26
28
30
32
34
36
38
40
Time (sec)
Torq
ue (N
m)
0.2 0.3 0.4 0.5 0.6 0.7 0.8 0.9 120
22
24
26
28
30
32
34
36
38
40
Time (sec)
Torq
ue(N
m)
0.95 0.955 0.96 0.965 0.97 0.975 0.98 0.985 0.99 0.995 125
26
27
28
29
30
31
32
33
34
35
Time(sec)
Torq
ue(N
m)
Figure 6.31 : Torque profile of the healthy 6-phase case under full-load
0.95 0.955 0.96 0.965 0.97 0.975 0.98 0.985 0.99 0.995 120
22
24
26
28
30
32
34
36
38
40
Time (sec)
Torq
ue (N
m)
Figure 6.32:Torque profile of the 4-healthy phase case with loss two adjacent phases A and B
0 2 4 6 8 10 12 14 160
5
10
15
20
25
30X: 0Y: 30
Mag
nitu
de (N
m)
Harmonic Order
Figure 6.33:Harmonic spectrum of the torque profile of the healthy 6-phase case
0 2 4 6 8 10 12 14 160
5
10
15
20
25
30
Mag
nitu
de (
Nm
)
Harmonic Order
X: 1.999Y: 6.984
X:0Y:30
Figure 6.34::Harmonic spectrum of the torque profile of the 4-healthy phase case with loss of adjacent phases A and B
RIPPLE CONTENT: 49.667 %RIPPLE CONTENT: 6.67%

Chapter 6: Experimental and Simulation results 101
Figure 6-35 and 6-36 shows the phase currents in the 4-healthy phase and two faulty phase with
loss of phases A and B and the healthy six-phase operations.
0.95 0.955 0.96 0.965 0.97 0.975 0.98 0.985 0.99 0.995 1-20
-15
-10
-5
0
5
10
15
20
Time (seconds)
Cur
rent
(A)
iaibicidieif
Figure 6-35 : Phase currents ia , ib , ic , id , ie and if of the 4-healthy and two faulty phase operation of the six-phase induction motor with loss of adjacent phases A and B
0.94 0.95 0.96 0.97 0.98 0.99 1-10
-8
-6
-4
-2
0
2
4
6
8
10
Time (sec)
Cur
rent
(A)
iaibicidieif
Figure 6-36: Phase currents ia , ib , ic , id , ie and if of the healthy six-phase induction motor.

Chapter 6: Experimental and Simulation results 102
From the above analysis , the torque ripple content in the resulting torque is 49.667 % with the 4-
healthy phases and two faulty phase adjacent to each other , in comparison with 6.67% torque
ripple content in the healthy six-phase case. This is significant , and some applications may
constitute an unacceptable performance.
6.4.2.2 LOSS OF TWO NON-ADJACENT PHASES
Here , the two non-adjacent faulty phase cases shown in Figure 6-28 are considered ,
In the first case , the six-phase motor is simulated under loss of two non-adjacent phases
separated by 1200 e , i.e. , loss of phase A and phase C are considered. Figures 6-37 and 6-38
show the phasor representation of the voltages in the six-phase healthy case and the four-healthy
phase faulty two-phase case such as under loss of phase A and phase C. In Figures 6-39 and 6-40
, the torque profile of the 4-healthy phase with two faulty phases separated by 1200 should be
compared with the 6-phase healthy case. These figures are accompanied by a magnified (zoom)
portion of the steady-state torque profile. In Figures 6-41 and 6-42 , the Harmonic breakdown of
the steady state torque profile for the 6-phase healthy case and the faulty case with 4 healthy
phases are two faulty phases separated by 1200 are shown. Notice that the 2nd order harmonic is
in the faulty case with 4 healthy phases and two non-adjacent faulty phases separated by 1200 has
a magnitude of 0.8318 when compared to the healthy case for which the 2nd order harmonic has a
magnitude of 0.1345 . Here the magnitudes of the 2nd order harmonics in both the cases are
almost equal to each other.
In the second case, the six-phase motor is simulated under loss of two non-adjacent
phases separated by 1800 e , i.e. , the loss of phase A and phase D are considered. Figures 6-45
and 6-46 show the phasor representation of voltages in the six-phase healthy case and the four-
phase healthy case with two non-adjacent faulty phases separated by 1800 e under loss of phase A
and phase D. In Figures 6-47 and 6-48 , the torque profile of the four-phase healthy case with two

Chapter 6: Experimental and Simulation results 103
non-adjacent faulty phases separated by 1800 e should be compared with the 6-phase healthy
case. Again, these figures are accompanied by a magnified (zoom) portion of the steady-state
torque profile. In Figures 6-49 and 6-50 , the Harmonic breakdown of the steady state torque
profile for the 6-phase healthy case and the faulty case with 4 healthy phases are two faulty
phases separated by 1800 are shown.Notice that the 2nd order harmonic is more pronounced in the
faulty case with 4 healthy phases and two non-adjacent faulty phases separated by 1800 e than in
the case with 4 healthy phases and two non-adjacent faulty phases separated by 1200 e with a
magnitude of 16.06 Nm when compared to the healthy case for which the 2nd order harmonic has
a magnitude of 0.1345 Nm .
Figure 6-37 : Phasor representation of the voltages
in six-phase healthy operation
Figure 6-38 : Phasor representation of the voltages
in the four-healthy phases with two non-adjacent
faulty phase separated by 1200 e operation with loss
of phases A and C
VB
VC
VD
VE
VF
VA
VB
VC
VD
VE
VF

Chapter 6: Experimental and Simulation results 104
0.2 0.3 0.4 0.5 0.6 0.7 0.8 0.9 125
26
27
28
29
30
31
32
33
34
35
Time(sec)
Torq
ue(N
m)
0.2 0.3 0.4 0.5 0.6 0.7 0.8 0.9 1
25
26
27
28
29
30
31
32
33
34
35
Time (sec)
Torq
ue(N
m)
0.95 0.955 0.96 0.965 0.97 0.975 0.98 0.985 0.99 0.995 125
26
27
28
29
30
31
32
33
34
35
Time(sec)
Torq
ue(N
m)
Figure 6.39 : Torque profile of the healthy 6-phase case under full-load
0.95 0.955 0.96 0.965 0.97 0.975 0.98 0.985 0.99 0.995 125
26
27
28
29
30
31
32
33
34
35
Time (sec)
Torq
ue(N
m)
Figure 6.40:Torque profile of the 4-healthy phase case with loss two non-adjacent phases separated by 1200 e i.e. phases A and C
0 2 4 6 8 10 12 14 160
5
10
15
20
25
30X: 0Y: 30
Mag
nitu
de (N
m)
Harmonic Order
Figure 6.41:Harmonic spectrum of the torque profile of the healthy 6-phase case
0 2 4 6 8 10 12 14 160
5
10
15
20
25
30
Mag
nitu
de (
Nm
)
Harmonic Order
X: 1.999Y: 0.8318
X:0Y:30
Figure 6.42::Harmonic spectrum of the torque profile of the 4-healthy phase case with loss of non-adjacent phases A and C
RIPPLE CONTENT: 10.33% RIPPLE CONTENT: 6.67 %
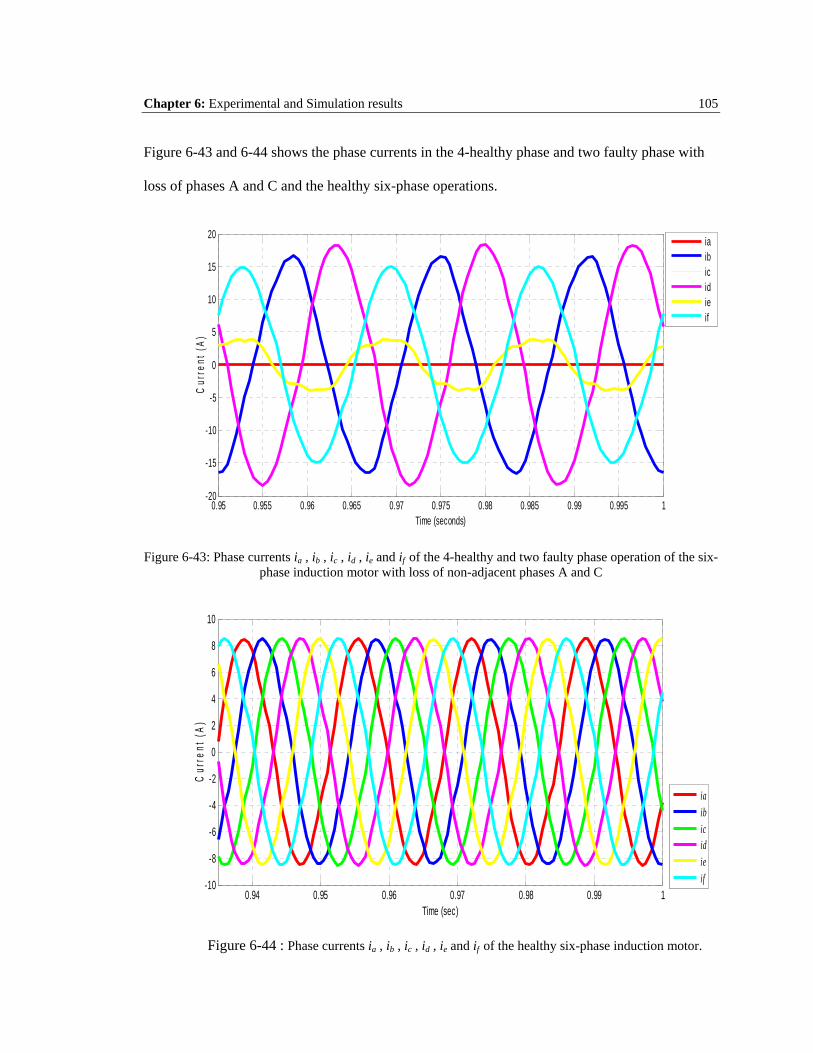
Chapter 6: Experimental and Simulation results 105
Figure 6-43 and 6-44 shows the phase currents in the 4-healthy phase and two faulty phase with
loss of phases A and C and the healthy six-phase operations.
0.95 0.955 0.96 0.965 0.97 0.975 0.98 0.985 0.99 0.995 1-20
-15
-10
-5
0
5
10
15
20
Time (seconds)
Cur
rent
(A)
iaibicidieif
Figure 6-43: Phase currents ia , ib , ic , id , ie and if of the 4-healthy and two faulty phase operation of the six-phase induction motor with loss of non-adjacent phases A and C
0.94 0.95 0.96 0.97 0.98 0.99 1-10
-8
-6
-4
-2
0
2
4
6
8
10
Time (sec)
Cur
rent
(A)
iaibicidieif
Figure 6-44 : Phase currents ia , ib , ic , id , ie and if of the healthy six-phase induction motor.

Chapter 6: Experimental and Simulation results 106
Figure 6-45 : Phasor representation of the voltages in
six-phase healthy operation
Figure 6-46 : Phasor representation of the voltages
in the four-healthy phase with two non-adjacent
faulty phase separated by 1800 e operation with loss
of phases A and D
VB
VC VE
VF
VA
VB
VC
VD
VE
VF
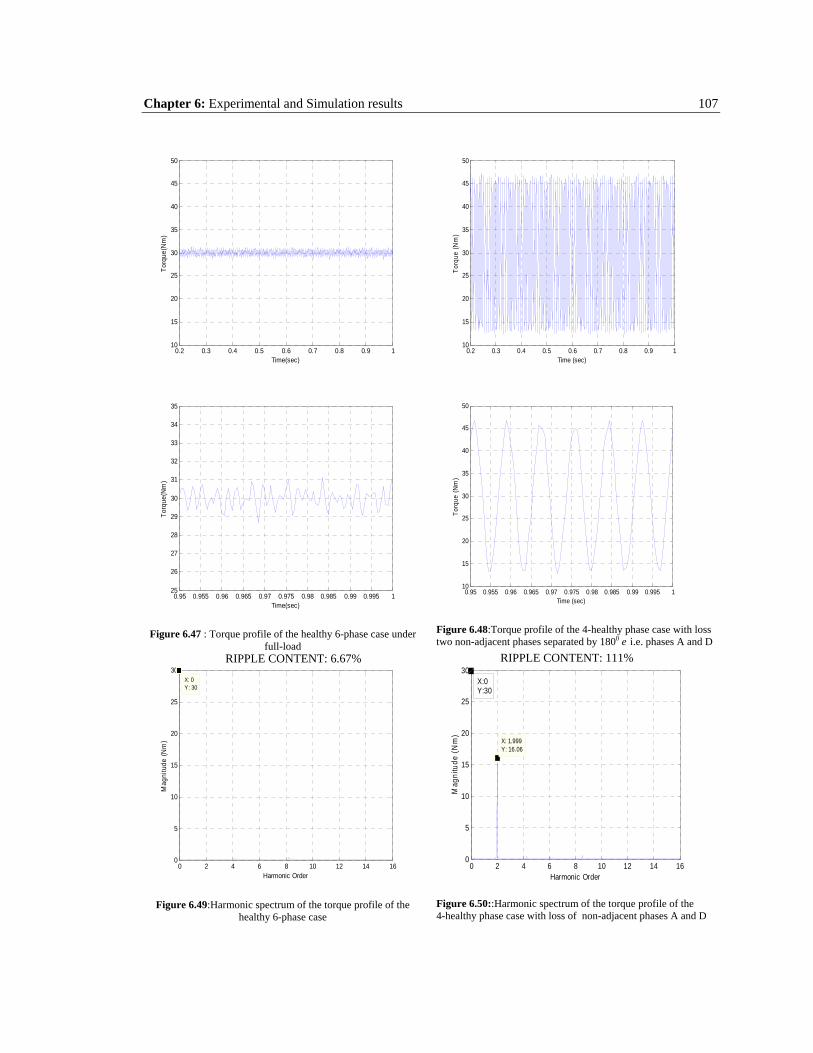
Chapter 6: Experimental and Simulation results 107
0.2 0.3 0.4 0.5 0.6 0.7 0.8 0.9 110
15
20
25
30
35
40
45
50
Time(sec)
Torq
ue(N
m)
0.2 0.3 0.4 0.5 0.6 0.7 0.8 0.9 1
10
15
20
25
30
35
40
45
50
Time (sec)
Torq
ue (N
m)
0.95 0.955 0.96 0.965 0.97 0.975 0.98 0.985 0.99 0.995 125
26
27
28
29
30
31
32
33
34
35
Time(sec)
Torq
ue(N
m)
Figure 6.47 : Torque profile of the healthy 6-phase case under full-load
0.95 0.955 0.96 0.965 0.97 0.975 0.98 0.985 0.99 0.995 110
15
20
25
30
35
40
45
50
Time (sec)
Torq
ue (N
m)
Figure 6.48:Torque profile of the 4-healthy phase case with loss two non-adjacent phases separated by 1800 e i.e. phases A and D
0 2 4 6 8 10 12 14 160
5
10
15
20
25
30X: 0Y: 30
Mag
nitu
de (N
m)
Harmonic Order
Figure 6.49:Harmonic spectrum of the torque profile of the healthy 6-phase case
0 2 4 6 8 10 12 14 160
5
10
15
20
25
30
Mag
nitu
de (
Nm
)
Harmonic Order
X: 1.999Y: 16.06
X:0Y:30
Figure 6.50::Harmonic spectrum of the torque profile of the 4-healthy phase case with loss of non-adjacent phases A and D
RIPPLE CONTENT: 111% RIPPLE CONTENT: 6.67%

Chapter 6: Experimental and Simulation results 108
Figure 6-51 and 6-52 shows the phase currents in the 4-healthy phase and two faulty phase with
loss of phases A and D and the healthy six-phase operations.
0.95 0.955 0.96 0.965 0.97 0.975 0.98 0.985 0.99 0.995 1-15
-10
-5
0
5
10
15
Time (seconds)
Cur
rent
(A)
ia
ib
ic
id
ie
if
Figure 6-51: Phase currents ia , ib , ic , id , ie and if of the 4-healthy and two faulty phase operation of the six-phase induction motor with loss of non-adjacent phases A and D
0.94 0.95 0.96 0.97 0.98 0.99 1-10
-8
-6
-4
-2
0
2
4
6
8
10
Time (sec)
Cur
rent
(A)
iaibicidieif
Figure 6-52 : Phase currents ia , ib , ic , id , ie and if of the healthy six-phase induction motor.

Chapter 6: Experimental and Simulation results 109
From the above analysis , the torque ripple content in the resulting torque is 10.33 %
with the 4-healthy phases and two non-adjacent faulty phase separated by 1200 e, in comparison
with 6.67% torque ripple content in the healthy six-phase case whereas , the torque ripple content
in the 4-healthy phases and two non-adjacent faulty phase separated by 1800 e is 111% in
comparison with 6.67% torque ripple content in the healthy six-phase case. It should be
observed that for the two non-adjacent faulty phase cases there is a marked difference between
the 1200 e separation and the 1800 e separation cases in so far as the adverse effect on the
ripple content in the time-domain torque profile. The 1200 e separation is far less severe.
A quasi-quantitative explanation of the deterioration of the quality of the torque
profile using current space vector concepts is presented later-on in this chapter.
6.4.3 THE THREE-HEALTHY PHASE AND THREE FAULTY PHASE
OPERATION
As in the 4-healthy phase and two faulty phase operation , here also , there are two
possible cases , Namely this is when there is loss of three adjacent phases each separated by
e060 , and when there is loss of three non-adjacent phases each separated by e0120 . Figure 6-
53 summarizes the phase loss scenarios of the three-healthy phase and three faulty phase
operations studied in this thesis.

Chapter 6: Experimental and Simulation results 110
Figure 6-53: Flow chart summarizing the various cases of 3-phase operations studied.
6.4.3.1 LOSS OF THREE ADJACENT PHASES
Here , the six-phase motor is simulated under loss of three phases adjacent to each
other such as when phase A , phase B and phase C become faulty and are taken out of operation.
Figures 6-54 and 6-55 show the phasor representation of voltages in the six-phase healthy case
and the three-healthy phase and three adjacent faulty phase case under loss of phase A , phase B
and phase C. In Figures 6-56 and 6-57, the torque profile of the three-healthy phase and three
adjacent faulty phase case should be compared with the 6-phase healthy case. These figures are
accompanied by a magnified (zoom) portion of the steady-state torque profile. In Figures 6-58
and 6-59 , the Harmonic breakdown of the steady state torque profile for the 6-phase healthy case
and the faulty case with three healthy phases are three faulty phases which are adjacent to each
other are shown. Notice that the 2nd order harmonic is more pronounced in the faulty case with 3
healthy phases and three faulty phases adjacent to each other with a magnitude of 26.45 Nm
when compared to the healthy case for which the 2nd order harmonic has a magnitude of 0.1345
Nm .
3-HEALTHY PHASE OPERATION
THREE ADJACENT FAULTY PHASE LOSS
THREE NON-ADJACENT FAULTY PHASE LOSS
LOSS OF THREE PHASES
SEPARATED BY 0120 e
LOSS OF THREE PHASES
SEPARATED BY 060 e
LOSS OF PHASE A , PHASE B AND PHASE C
LOSS OF PHASE A, PHASE C AND PHASE E
LOSS OF THREE PHASES SEPARATED BY
0120 e AND 060 e
LOSS OF PHASE A, PHASE B AND PHASE D

Chapter 6: Experimental and Simulation results 111
Figure 6-54 : Phasor representation of the voltages in six-phase healthy operation
Figure 6-55 : Phasor representation of the voltages in the three healthy phase with three adjacent faulty phase loss operation with loss of phases A, B and C
VD
VE
VF
VA
VB
VC
VD
VE
VF

Chapter 6: Experimental and Simulation results 112
0.2 0.3 0.4 0.5 0.6 0.7 0.8 0.9 10
10
20
30
40
50
60
70
Time (sec)
Torq
ue (N
m)
0.2 0.3 0.4 0.5 0.6 0.7 0.8 0.9 10
10
20
30
40
50
60
70
Time(sec)
Torq
ue(N
m)
0.95 0.955 0.96 0.965 0.97 0.975 0.98 0.985 0.99 0.995 125
26
27
28
29
30
31
32
33
34
35
Time(sec)
Torq
ue(N
m)
Figure 6.56 : Torque profile of the healthy 6-phase case under full-load
0.95 0.955 0.96 0.965 0.97 0.975 0.98 0.985 0.99 0.995 10
10
20
30
40
50
60
Time (sec)
Torq
ue(N
m)
Figure 6.57:Torque profile of the 3-healthy phase case with loss three adjacent phases separated by 600 e i.e. phases A , B and C
0 2 4 6 8 10 12 14 160
5
10
15
20
25
30X: 0Y: 30
Mag
nitu
de (N
m)
Harmonic Order
Figure 6.58::Harmonic spectrum of the torque profile of the healthy 6-phase case
0 2 4 6 8 10 12 14 160
5
10
15
20
25
30
X: 1.999Y: 26.45
Mag
nitu
de (
Nm
)
Harmonic Order
X:0Y:30
Figure 6.59::Harmonic spectrum of the torque profile of the 3-healthy phase case with loss of three djacent phases A,B and C
RIPPLE CONTENT: 178% RIPPLE CONTENT: 6.67%

Chapter 6: Experimental and Simulation results 113
Figure 6-60 and 6-61 shows the phase currents in the 3-healthy phase and three faulty phase with
loss of phases A,B and C and the healthy six-phase operations.
0.95 0.955 0.96 0.965 0.97 0.975 0.98 0.985 0.99 0.995 1-40
-30
-20
-10
0
10
20
30
40
Time (seconds)
Cur
rent
(A)
iaibicidieif
Figure 6-60: Phase currents ia , ib , ic , id , ie and if of the 3-healthy and three faulty phase operation of the six-phase induction motor with loss of adjacent phases A , B and C
0.94 0.95 0.96 0.97 0.98 0.99 1-10
-8
-6
-4
-2
0
2
4
6
8
10
Time (sec)
Cur
rent
(A)
iaibicidieif
Figure 6-61: Phase currents ia , ib , ic , id , ie and if of the healthy six-phase induction motor.

Chapter 6: Experimental and Simulation results 114
From the above analysis , the torque ripple content in the resulting torque is 178
% with the 3-healthy phases and three adjacent faulty phase, in comparison with 6.67% torque
ripple content in the healthy six-phase case. This is a very significant amount of torque ripple and
is not suitable.
6.4.3.2 LOSS OF THREE NON-ADJACENT PHASES
Here , the two non-adjacent faulty phase cases shown in Figure 6-53 are
considered , In the first case , the six-phase motor is simulated under loss of three non-adjacent
phases each separated by 1200 e , such as the loss of phase A and phase C and phase E. Figures 6-
62 and 6-63 show the phasor representation of the voltages in the six-phase healthy case and the
three-healthy phase and three non-adjacent faulty phase separated by 1200 e case such as under
loss of phase A , phase C and phase E. In Figures 6-64 and 6-65 , the torque profile of the 3-
healthy phase with three faulty phases each separated by 1200 should be compared with the 6-
phase healthy case. These figures are accompanied by a magnified (zoom) portion of the steady-
state torque profile. In Figures 6-66 and 6-67 , the Harmonic breakdown of the steady state torque
profile for the 6-phase healthy case and the faulty case with 3 healthy phases are three faulty
phases each separated by 1200 are shown. Notice that the 2nd order harmonic is in the faulty case
with 3 healthy phases and three non-adjacent faulty phases separated by 1200 has a magnitude of
0.1345 Nm when compared to the healthy case for which the 2nd order harmonic has a magnitude
of 0.1345 Nm . Here the magnitudes of the 2nd order harmonics in both the cases are equal to
each other.
In the second case, the six-phase motor is simulated under loss of three non-adjacent
phases , two of which are separated by 600 e and the other is separated by 1200 e , i.e. , the loss of
phase A , phase B and phase D are considered. Figures 6-70 and 6-71 show the phasor
representation of voltages in the six-phase healthy case and the three-phase healthy case with
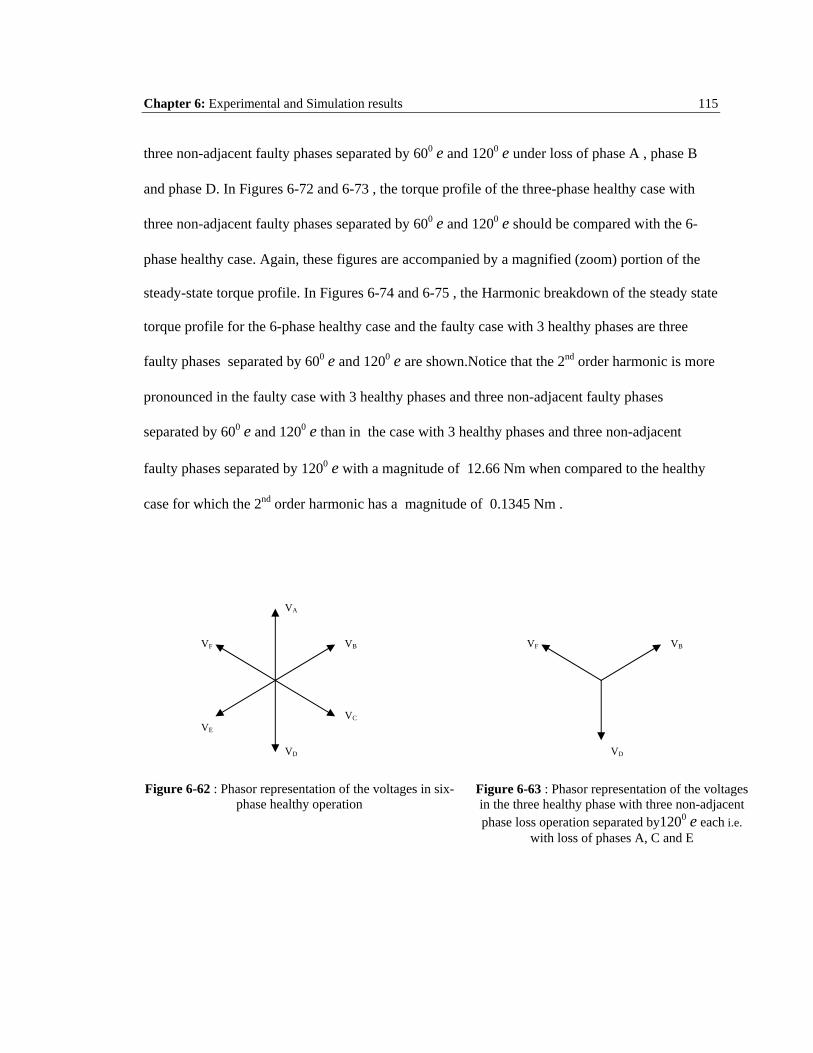
Chapter 6: Experimental and Simulation results 115
three non-adjacent faulty phases separated by 600 e and 1200 e under loss of phase A , phase B
and phase D. In Figures 6-72 and 6-73 , the torque profile of the three-phase healthy case with
three non-adjacent faulty phases separated by 600 e and 1200 e should be compared with the 6-
phase healthy case. Again, these figures are accompanied by a magnified (zoom) portion of the
steady-state torque profile. In Figures 6-74 and 6-75 , the Harmonic breakdown of the steady state
torque profile for the 6-phase healthy case and the faulty case with 3 healthy phases are three
faulty phases separated by 600 e and 1200 e are shown.Notice that the 2nd order harmonic is more
pronounced in the faulty case with 3 healthy phases and three non-adjacent faulty phases
separated by 600 e and 1200 e than in the case with 3 healthy phases and three non-adjacent
faulty phases separated by 1200 e with a magnitude of 12.66 Nm when compared to the healthy
case for which the 2nd order harmonic has a magnitude of 0.1345 Nm .
Figure 6-62 : Phasor representation of the voltages in six-phase healthy operation
Figure 6-63 : Phasor representation of the voltages in the three healthy phase with three non-adjacent phase loss operation separated by1200 e each i.e.
with loss of phases A, C and E
VD
VF VB
VA
VB
VC
VD
VE
VF
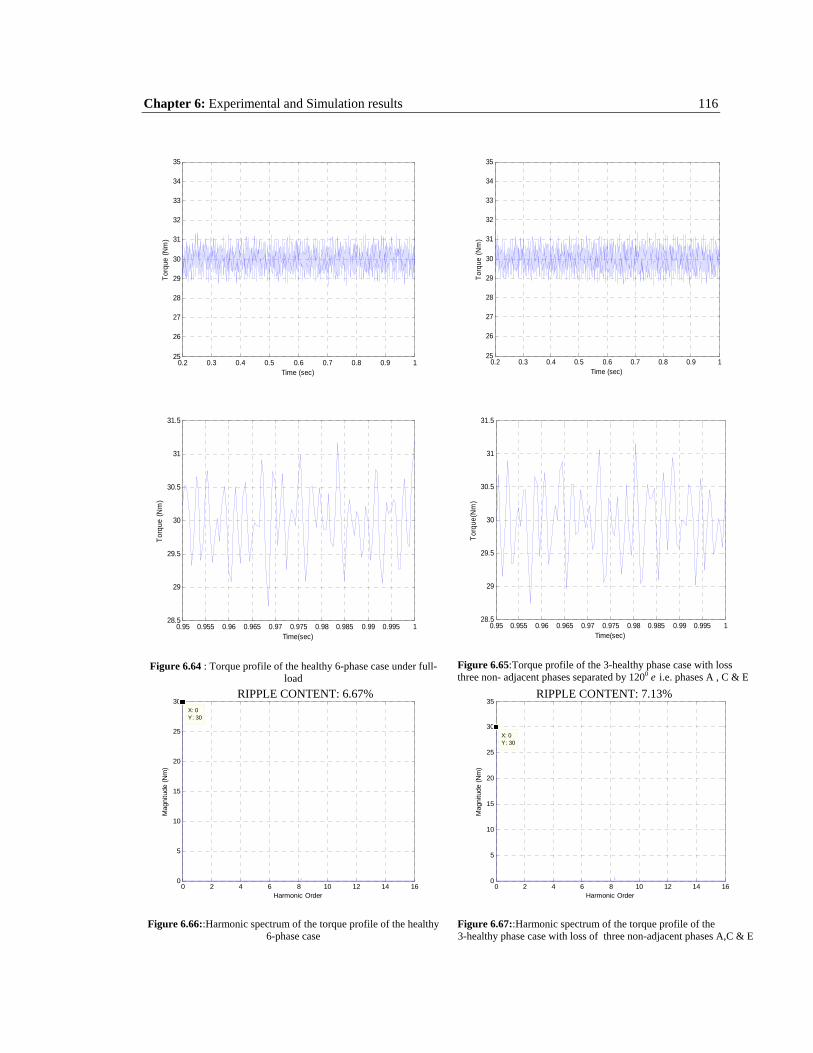
Chapter 6: Experimental and Simulation results 116
0.2 0.3 0.4 0.5 0.6 0.7 0.8 0.9 125
26
27
28
29
30
31
32
33
34
35
Time (sec)
Torq
ue (N
m)
0.2 0.3 0.4 0.5 0.6 0.7 0.8 0.9 125
26
27
28
29
30
31
32
33
34
35
Time (sec)
Torq
ue (N
m)
0.95 0.955 0.96 0.965 0.97 0.975 0.98 0.985 0.99 0.995 128.5
29
29.5
30
30.5
31
31.5
Time(sec)
Torq
ue (N
m)
Figure 6.64 : Torque profile of the healthy 6-phase case under full-load
0.95 0.955 0.96 0.965 0.97 0.975 0.98 0.985 0.99 0.995 128.5
29
29.5
30
30.5
31
31.5
Time(sec)
Torq
ue(N
m)
Figure 6.65:Torque profile of the 3-healthy phase case with loss three non- adjacent phases separated by 1200 e i.e. phases A , C & E
0 2 4 6 8 10 12 14 160
5
10
15
20
25
30X: 0Y: 30
Mag
nitu
de (N
m)
Harmonic Order
Figure 6.66::Harmonic spectrum of the torque profile of the healthy 6-phase case
0 2 4 6 8 10 12 14 160
5
10
15
20
25
30
35
X: 0Y: 30
Mag
nitu
de (N
m)
Harmonic Order
Figure 6.67::Harmonic spectrum of the torque profile of the 3-healthy phase case with loss of three non-adjacent phases A,C & E
RIPPLE CONTENT: 7.13%RIPPLE CONTENT: 6.67%

Chapter 6: Experimental and Simulation results 117
Figure 6-68 and 6-69 shows the phase currents in the 3-healthy phase and three faulty phase with
loss of phases A,C and E and the healthy six-phase operations.
0.95 0.955 0.96 0.965 0.97 0.975 0.98 0.985 0.99 0.995 1-20
-15
-10
-5
0
5
10
15
20
Time (seconds)
Cur
rent
(A)
iaibicidieif
Figure 6-68: Phase currents ia , ib , ic , id , ie and if of the 3-healthy and three faulty phase operation of the six-phase induction motor with loss of non-adjacent phases A , C and E
0.94 0.95 0.96 0.97 0.98 0.99 1-10
-8
-6
-4
-2
0
2
4
6
8
10
Time (sec)
Cur
rent
(A)
iaibicidieif
Figure 6-69 : Phase currents ia , ib , ic , id , ie and if of the healthy six-phase induction motor.

Chapter 6: Experimental and Simulation results 118
Figure 6-70 : Phasor representation of the voltages in six-phase healthy operation
Figure 6-71: Phasor representation of the voltages in the three healthy phase with three non-adjacent faulty phase loss operation with loss of phases A, B and D
VC VE
VF
VA
VB
VC
VD
VE
VF

Chapter 6: Experimental and Simulation results 119
0.2 0.3 0.4 0.5 0.6 0.7 0.8 0.9 110
15
20
25
30
35
40
45
50
Time(sec)
Torq
ue(N
m)
0.2 0.3 0.4 0.5 0.6 0.7 0.8 0.9 110
15
20
25
30
35
40
45
50
Time (sec)
Torq
ue (N
m)
0.95 0.955 0.96 0.965 0.97 0.975 0.98 0.985 0.99 0.995 125
26
27
28
29
30
31
32
33
34
35
Time(sec)
Torq
ue(N
m)
Figure 6.72: Torque profile of the healthy 6-phase case under full-load
0.95 0.955 0.96 0.965 0.97 0.975 0.98 0.985 0.99 0.995 110
15
20
25
30
35
40
45
50
Time (sec)
Torq
ue (N
m)
Figure 6.73:Torque profile of the 3-healthy phase case with loss three non- adjacent phases separated by 1200 e and 60 0 e i.e. phases A , B and D
0 2 4 6 8 10 12 14 160
5
10
15
20
25
30X: 0Y: 30
Mag
nitu
de (N
m)
Harmonic Order
Figure 6.74::Harmonic spectrum of the torque profile of the healthy 6-phase case
0 2 4 6 8 10 12 14 160
5
10
15
20
25
30
Mag
nitu
de (
Nm
)
Harmonic Order
X: 1.999Y: 12.25
X:0Y:30
Figure 6.75::Harmonic spectrum of the torque profile of the 3-healthy phase case with loss of three non-adjacent phases A,B & D
RIPPLE CONTENT: 83.6% RIPPLE CONTENT: 6.67%

Chapter 6: Experimental and Simulation results 120
Figure 6-76 and 6-77 shows the phase currents in the 3-healthy phase and three faulty phase
with loss of phases A,B and D and the healthy six-phase operations.
0.95 0.955 0.96 0.965 0.97 0.975 0.98 0.985 0.99 0.995 1-30
-20
-10
0
10
20
30
Time (seconds)
Cur
rent
(A)
iaibicidieif
Figure 6-76: Phase currents ia , ib , ic , id , ie and if of the 3-healthy and three faulty phase operation of the six-phase induction motor with loss of non-adjacent phases A , B and D
0.94 0.95 0.96 0.97 0.98 0.99 1-10
-8
-6
-4
-2
0
2
4
6
8
10
Time (sec)
Cur
rent
(A)
iaibicidieif
Figure 6-77 : Phase currents ia , ib , ic , id , ie and if of the healthy six-phase induction motor.

Chapter 6: Experimental and Simulation results 121
From the above analysis , the torque ripple content in the resulting torque is 7.13 %
with the 3-healthy phases and three non-adjacent faulty phases each separated by 1200 e, in
comparison with 6.67% torque ripple content in the healthy six-phase case whereas , the torque
ripple content in the 3-healthy phases and three non-adjacent faulty phase separated by 1200 e
and 600 e is 83.6 % in comparison with 6.67% torque ripple content in the healthy six-phase
case. It should be observed that for the three non-adjacent faulty phase cases there is a marked
difference between the 1200 e separation and the phases separated by 1200 e and 600 e cases
in so far as the adverse effect on the ripple content in the time-domain torque profile. The
1200 e separation is far less severe.It should also be observed that the ripple content in the
three healthy phase and three non-adjacent faulty phase separated by 1200 e and 600 e is far
less when compared to the three phase healthy and three adjacent faulty phase operation.
This would be acceptable in certain applications.
6.4.4 SIMULATION OF THE TWO-PHASE HEALTHY OPERATION WITH ONE
FAULTY PHASE IN A THREE-PHASE MOTOR
Here , the case-study 5HP, 3-phase induction motor was simulated with the
loss of one phase. Figures 6-78 and 6-79 show the phasor representation of voltages in the three-
phase healthy case and the two-phase healthy and one-phase faulty case under the loss of phase
A. In Figures 6-80 and 6-81, the torque profiles of the two-phase faulty operation and the healthy
3-phase operation should be compared. In Figures 6-82 and 6-83 , the Harmonic breakdown of
the steady state torque profile for the 3-phase healthy case and the two-phase healthy operations
are shown. Notice that the 2nd harmonic is critical in the two-healthy phase case with a magnitude
of 33.59 Nm when compared with the healthy 3-phase case which has a magnitude of 0.134 Nm.

Chapter 6: Experimental and Simulation results 122
Figure 6-78 : Phasor representation of the voltages in three-phase healthy operation
Figure 6-79: Phasor representation of the voltages in the two healthy phase with loss of phase A.
VB VC
VA
VB VC

Chapter 6: Experimental and Simulation results 123
0.2 0.3 0.4 0.5 0.6 0.7 0.8 0.9 1-10
0
10
20
30
40
50
60
70
Time (sec)
Torq
ue (N
m)
0.2 0.3 0.4 0.5 0.6 0.7 0.8 0.9 1-10
0
10
20
30
40
50
60
70
X: 0.413Y: 1.027
Time (sec)
Torq
ue (N
m)
0.95 0.955 0.96 0.965 0.97 0.975 0.98 0.985 0.99 0.995 125
26
27
28
29
30
31
32
33
34
35
Time(sec)
Torq
ue(N
m)
Figure 6.80 : Torque profile of the healthy 6-phase case under full-load
0.95 0.955 0.96 0.965 0.97 0.975 0.98 0.985 0.99 0.995 1-10
0
10
20
30
40
50
60
70
Time (sec)
Torq
ue (N
m)
Figure 6.81:Torque profile of the 2-healthy phase case with loss of phase A
0 2 4 6 8 10 12 14 160
5
10
15
20
25
30X: 0Y: 30
Mag
nitu
de (N
m)
Harmonic Order
Figure 6.82::Harmonic breakdown of the torque profile of the healthy 6-phase case
0 2 4 6 8 10 12 14 160
5
10
15
20
25
30
35
Mag
nitu
de (
Nm
)
Harmonic Order
X: 1.999Y: 33.27
X:0Y:30
Figure 6.83::Harmonic breakdown of the torque profile of the 2-healthy phase case with loss of phase A
RIPPLE CONTENT: 213%RIPPLE CONTENT: 6.67%

Chapter 6: Experimental and Simulation results 124
Figure 6-84 and 6-85 shows the phase currents in the 2-healthy phase and one faulty phase of a
three-phase induction motor with loss of phase A and the healthy six-phase operations.
0.95 0.955 0.96 0.965 0.97 0.975 0.98 0.985 0.99 0.995 1-20
-15
-10
-5
0
5
10
15
20
Time (seconds)
Cur
rent
(A)
iaibic
Figure 6-84: Phase currents ia , ib , ic of the 2-healthy and one faulty phase operation of the three-phase induction motor with loss of phase A .
0.93 0.94 0.95 0.96 0.97 0.98 0.99 1-10
-8
-6
-4
-2
0
2
4
6
8
10
Time (sec)
Cur
rent
(A)
iaibic
Figure 6-85: Phase currents ia , ib , ic of the healthy three-phase induction motor.

Chapter 6: Experimental and Simulation results 125
From the above analysis , the torque ripple content in the resulting torque is 213 % with the 2-
healthy phase operation , in comparison with 6.67% torque ripple content in the healthy three-
phase case. This case yields the highest and has the most adverse effect on the torque ripple
content when compared to any of the cases discussed earlier.
6.5 OBSEVATIONS AND DISCUSSIONS ON THE REASONS FOR TORQUE
RIPPLES IN THE FAULTY PHASE OPERATIONS USING CURRENT SPACE
VECTOR CONCEPTS
Now the results from the various unbalanced operations considered are used to obtain the
locus of the stator current space vector , si , for all the 3-phase and 6-phase healthy and faulty
operation modes.
In the 3-phase motor case , the stator current space vector is defined as :
cbas iaiaii ⋅+⋅+= 2
where eeaj
032
1201321 ∠=∠== ππ
In the 6-phase motor case , the stator current space vector is defined as:
fedcbas iaiaiaiaiaii ⋅+⋅+⋅+⋅+⋅+= 5432
where eeaj
03 60131 ∠=∠== ππ
Figures 6-86 through 6-95 give a comparitive study of the locus of the current space vector , si ,
distribution under all the various operating conditions studied in the previous sections of this
chapter.

Chapter 6: Experimental and Simulation results 126
10
20
30
30
210
60
240
90
270
120
300
150
330
180 0
Figure 6.86: Locus of current space vector in the healthy 6-phase operation in a 6-phase motor.
10
20
30
30
210
60
240
90
270
120
300
150
330
180 0
Figure 6.87: Locus of current space vector in the healthy 3-phase operation in a three-phase motor.

Chapter 6: Experimental and Simulation results 127
10
20
30
30
210
60
240
90
270
120
300
150
330
180 0
Figure 6.88: Locus of current space vector in the one faulty phase operation with loss of phase A in a 6-
phase motor.
10
20
30
40
30
210
60
240
90
270
120
300
150
330
180 0
Figure 6.89: Locus of current space vector in two faulty phases operation with loss of adjacent phases A
and B in a 6-phase motor.

Chapter 6: Experimental and Simulation results 128
10
20
30
40
50
30
210
60
240
90
270
120
300
150
330
180 0
Figure 6.90:Locus of current space vector in the two faulty phases operation with loss of non-adjacent
phases separated by e0180 i.e. phases A and D in a 6-phase motor.
10
20
30
30
210
60
240
90
270
120
300
150
330
180 0
Figure 6.91 : Locus of the current space vector in the two faulty phases operation with loss of non-
adjacent phases separated by e0120 i.e. phases A and C, in a 6-phase motor.

Chapter 6: Experimental and Simulation results 129
10
20
30
30
210
60
240
90
270
120
300
150
330
180 0
Figure 6.92:Locus of the current space vector in the three faulty phase operation with loss of non-adjacent
phases separated by e0120 i.e. phases A , C and E, in a 6-phase motor.
20
40
60
80
30
210
60
240
90
270
120
300
150
330
180 0
Figure 6.93:Locus of the current space vector in the three faulty phases operation with loss of adjacent
phases separated by e060 i.e. phases A , B and C, in a 6-phase motor.

Chapter 6: Experimental and Simulation results 130
10
20
30
40
30
210
60
240
90
270
120
300
150
330
180 0
Figure 6.94:Locus of current space vector in the three-faulty phases operation with loss of non-adjacent
phases separated by e0120 and e060 i.e. phases A, B and D , in a 6-phase motor.
20
40
60
30
210
60
240
90
270
120
300
150
330
180 0
Figure 6.95:Locus of the current space vector in the one-faulty phase operation with loss of Phase A , in a
three-phase motor.

Chapter 6: Experimental and Simulation results 131
6.5.1 HARMONIC ANALYSIS AND OBSERVATIONS
In Figures 6-97 through 6-105 , the harmonic spectrum of all the various operating modes
studied in the previous sections are shown. Upon analyzing these results , it can be observed that
the magnitude of the 2nd order harmonic bears a direct relationship to the ripple content in the
torque profile which means that the magnitude of the 2nd harmonic increases with the increase in
the ripple content in the time-domain torque profile. This is because of the negative sequence
component induced in the unbalanced cases , which creates a field rotating in the backward
direction. Therefore , the relative speed between the stator and rotor fields is 2ω which results in
the dominant 2nd order harmonic. Figure 6-96 gives a comparative description of the various cases
and the magnitude of the 2nd order harmonic .
1 2 3 4 5 6 7 8 90
5
10
15
20
25
30
35
cases 1 through 9
Mag
nitu
de o
f 2nd
ord
er H
arm
onic
in N
m
From Figure 6-96 , it is evident that the two-phase operation of a three-phase motor has
the highest magnitude of 2nd order harmonic when compared to any of the other cases. Thus it can
Case 1: Healthy 6-phase Case 2: Three-Healthy Phases with loss of phases A, C and E Case 3: Four-Healthy Phases with loss of phases A and C Case 4: Five-Healthy Phases with loss of phase A Case 5: Four-Healthy Phases with loss of phases A and B Case 6: Three-Healthy phases with loss of phases A , B and D Case 7: Four-Healthy Phases with loss of phases A and D Case 8: Three-Healthy phases with loss of phases A , B and C Case 9: Two-Healthy Phases of a three-phase motor
Figure 6-96: Variation of 2nd order harmonic in different cases
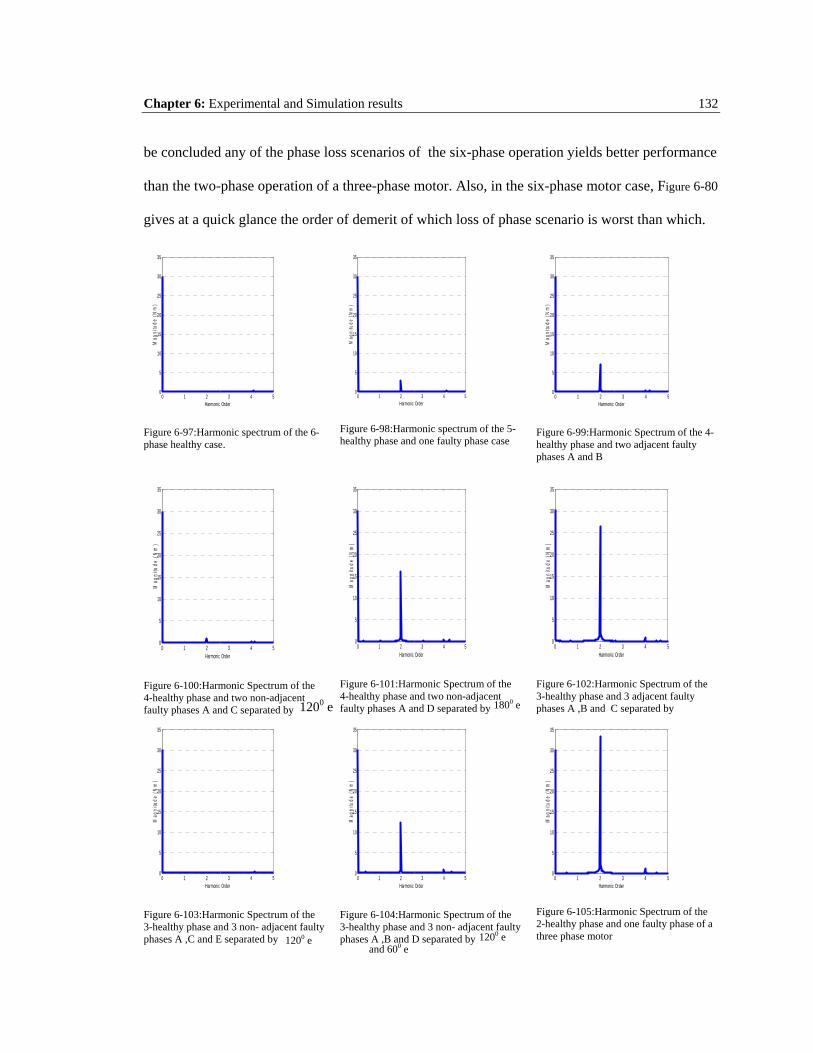
Chapter 6: Experimental and Simulation results 132
be concluded any of the phase loss scenarios of the six-phase operation yields better performance
than the two-phase operation of a three-phase motor. Also, in the six-phase motor case, Figure 6-80
gives at a quick glance the order of demerit of which loss of phase scenario is worst than which.
0 1 2 3 4 50
5
10
15
20
25
30
35
Mag
nitu
de (
Nm
)
Harmonic Order
Figure 6-97:Harmonic spectrum of the 6-phase healthy case.
0 1 2 3 4 50
5
10
15
20
25
30
35
Mag
nitu
de (
Nm
)
Harmonic Order
Figure 6-98:Harmonic spectrum of the 5-healthy phase and one faulty phase case
0 1 2 3 4 50
5
10
15
20
25
30
35
Mag
nitu
de (
Nm
)
Harmonic Order
Figure 6-99:Harmonic Spectrum of the 4-healthy phase and two adjacent faulty phases A and B
0 1 2 3 4 50
5
10
15
20
25
30
35
Mag
nitu
de (
Nm
)
Harmonic Order
Figure 6-100:Harmonic Spectrum of the 4-healthy phase and two non-adjacent faulty phases A and C separated by
0 1 2 3 4 50
5
10
15
20
25
30
35
Mag
nitu
de (
Nm
)
Harmonic Order
Figure 6-101:Harmonic Spectrum of the 4-healthy phase and two non-adjacent faulty phases A and D separated by
0 1 2 3 4 50
5
10
15
20
25
30
35
Mag
nitu
de (
Nm
)
Harmonic Order
Figure 6-102:Harmonic Spectrum of the 3-healthy phase and 3 adjacent faulty phases A ,B and C separated by
0 1 2 3 4 50
5
10
15
20
25
30
35
Mag
nitu
de (
Nm
)
Harmonic Order
Figure 6-103:Harmonic Spectrum of the 3-healthy phase and 3 non- adjacent faulty phases A ,C and E separated by
0 1 2 3 4 50
5
10
15
20
25
30
35
Mag
nitu
de (
Nm
)
Harmonic Order
Figure 6-104:Harmonic Spectrum of the 3-healthy phase and 3 non- adjacent faulty phases A ,B and D separated by
0 1 2 3 4 50
5
10
15
20
25
30
35
Mag
nitu
de (
Nm
)
Harmonic Order
Figure 6-105:Harmonic Spectrum of the 2-healthy phase and one faulty phase of a three phase motor 1200 e
1200 e 1800 e
1200 e and 600 e

Chapter 6: Experimental and Simulation results 133
Upon close examination of Figures 6-86 through 6-95 , it can be observed that the
locus (trace) of the stator current space vector becomes closer to the elliptical / oval shape in
unbalanced cases, whereas it is closer to a circle in the healthy case. From the detailed analysis of
the results obtained , it can be observed that the 6-phase machine exhibits better performance
under phase-loss conditions when compared to the 3-phase machine. A summary chart
representing the percentage torque ripple content for various faults considered in percent of the
developed average torque is shown in Figure 6-106
Figure 6-106. Summarized chart showing the torque ripple content under different cases.
0.00%
50.00%
100.00%
150.00%
200.00%
250.00%
HEALTHY 5-HEALTHY
PH (A)
4-HEALTHYPH (ADJ-
A,B)
4-HEALTHYPH NON-
ADJ (A&C)
4-HEALTHYPH NON-
ADJ (A&D)
3-HEALTHYPH (ADJ-
A,B,C)
3-HEALTHYPH NON
ADJ-A,C,E
3-HEALTHYPH NON
ADJ-A,B,D
2PH
Percentage Torque Ripple

Chapter 6: Experimental and Simulation results 134
Figure 6-106 clearly indicates that the 5-healthy phase operation with one faulty phase ,
3-healthy phase and three non-adjacent faulty phase operation and 4-healthy phase and two non-
adjacent faulty phase operation considering loss of phases separated by 1200 e yields the least
amount of torque ripple and are almost equal in ripple content , to the healthy case. The current
space vector locus diagrams affirm these results in being closest in shape to a circle. Even the 4-
healthy phase non-adjacent operation considering loss of phases separated by 1800 e , the 4-
healthy phase adjacent phase-loss operation and the 3-healthy phase non-adjacent phase-loss
operation exhibit relatively lower amount of torque ripple content when compared to the standard
two-phase operation of a three-phase motor.
Table 6-4 gives a comparison between the rms values of phase currents in the various
cases studied given earlier in this chapter, in which the motor was developing an average torque
of 30Nm approximately:
CONDITION RMS VALUE OF PHASE CURRENT (A)
Healthy 6-phase 6.8
5-healthy phase and one faulty phase with loss of phase A 10.92
4-healthy phase and two faulty phase with loss of adjacent phases A and B
13.496
4-healthy phase and two faulty phase with loss of non-adjacent phases A and C
12.8
4-healthy phase and two faulty phase with loss of non-adjacent phases A and D
9.8995
3-healthy phase and three faulty phase with loss of adjacent phases A ,B and C
24.3245
3-healthy phase and three faulty phase with loss of non-adjacent phases A ,C and E
12.1662
3-healthy phase and three faulty phase with loss of non-adjacent phases A ,B and D
25.3568
2-healthy phases and one faulty phase of a 3-phase motor 12.6572
Table 6-4: RMS values of phase currents under the various cases considered.

Chapter 6: Experimental and Simulation results 135
From Table 6-4 it can be observed that the rms value of phase current increases under
phase-loss conditions. A solution to this issue involving a derating of the motor output torque and
power is suggested in the next section. This is in order to prevent winding overheating and hence
preserve the thermal integrity of the motor.
6.5.2 DISCUSSION REGARDING DERATING OF THE MOTOR OUTPUT UNDER
VARIOUS FAULT SCENARIOS
It is well known that as the current increases in the phases, the motor is prone to
overheating and thermal degradation . Under very high currents , the motor windings may even
burn. In order to overcome this problem, it is necessary to derate the motor output under fault
conditions, while permitting the running of the motor for limited periods for “limp-home”
purposes. The concept of derating can be explained as follows:
The total electromagnetic power in a 6-phase machine is given by ,
)(6 222 s
RIPem = (6-1)
where 2I = the equivalent rms value of the rotor current /phase referred to the stator side.
=2R the equivalent rotor resistance /phase referred to the stator side.
and s is the slip.
Here, the total developed power is as follows:
22
2 )1(6 RssIPdev
−= (6-2)
For the purposes of this discussion, it can be assumed that the stator current per phase ,
21 II ≈ . Therefore, the total ohmic loses in a 6-phase machine can be given as follows:
22
22
22
22
22
22
22
1 RIRIRIRIRIRIRIP fedcbaohmic +++++== ∑ (6-3)
where fedcba IandIIIII ,,,,, are the values of the phase currents in phases A,B,C,D,E and F.

Chapter 6: Experimental and Simulation results 136
From the standpoint thermal heating considerations, the ohmic losses in the machine can be taken
indirectly proportional to the developed or output power , that is,
outputP or ohmic
rating PP 1
∝ (6-4)
The heating in a machine is directly dependent on the ohmic losses, which means that as the
ohmic losses increases, the heating in the machine also increases .Therefore, the so-called “heat
index” for the machine can be defined as follows:
2rmsphIIndexHeat ∑= (6-5)
From Equations 6-3 and 6-4 , one can write the following for the six-phase case:
2
22
22
22
22
22
22
21 666666
11RIRIRIRIRIRIRI
Pfedcba
rating+++++
∝∝∑
(6-6)
Accordingly, for the six-phase healthy condition Equation 6-6 can be rewritten as follows:
22
22
22
22
22
22
22
1)()(
666666
11RIRIRIRIRIRIRI
Pfedcba
phasesixhealthyrating+++++
∝∝∑− (6-7)
For the faulty case , considering the 5-healthy phase and one faulty phase condition , where there
is loss of phase A , one can write
22
22
22
22
22
22
1)5)((
55555
11RIRIRIRIRIRI
Pfedcb
faultyoneandhealthyfaultynewrating ++++∝∝
∑− (6-8)
Dividing Equation 6-8 by Equation 6-7 , one obtains
22
22
22
22
22
22
22
22
22
22
22
))((
)5)((
55555
666666
RIRIRIRIRIRIRIRIRIRIRI
PP
fedcb
fedcba
phasesixhealthyrating
faultyoneandhealthyfaultynewrating
++++
+++++=
−
− (6-9)
Or
22222
222222
))((
)5)((
55555
666666
fedcb
fedcba
phasesixhealthyrating
faultyoneandhealthyfaultynewrating
IIIIIIIIIII
PP
++++
+++++=
−
− (6-10)

Chapter 6: Experimental and Simulation results 137
Therefore, from Equation 6-5,
)5)((
))((
))((
)5)((
faultyoneandhealthyfaulty
phasesixhealthy
phasesixhealthyrating
faultyoneandhealthyfaultynewrating
IndexHeatIndexHeat
PP
−
−
−
− = (6-11)
Equation 6-10 is a more conservative formula which can be modified in order to include the worst
condition possible, where all the currents in phases of the faulty case are assumed to be equal to
the maximum value of the unbalanced phase currents in the faulty case. With this conservative
notion, Equation 6-10 can be simplified and rewritten as follows:
))((2
2
)( ])([max6
6phasesixhealthyrating
rmsphH
rmsphfaultynewrating P
INI
Pfaulty
−×
×= (6-12)
where , HN is the number of healthy phases,
and ])([maxfaultyrmsphI is the highest value of rms current in the remaining healthy phases.
For the faulty case , considering the 5-healthy phases and one faulty phase condition , where there
is a loss of phase A , Equation 6-12 becomes
))((2
2
)5( ])([max56
5
6phasesixhealthyrating
rmsph
rmsphphasefaultyoneandhealthynewrating P
II
Pphasefaultyoneandhealthy
−−
−×
×= (6-13)
Since the ))(( phasesixhealthyratingP − is known , From Equation 6-11, the new )( faultynewratingP for the
faulty case can be found such that , if the motor is derated to operate at the new value of the
calculated output power , the highest current in the phases would be nearly maintained at the
same value as in the six healthy phase case , thus avoiding the thermal overstress of winding
insulation and possible damage to the motor, and ensuring a safe “limp-home” operation.

Chapter 6: Experimental and Simulation results 138
6.5.2.1 VERIFICATION OF DERATING OF THE MOTOR FOR THE 5-HEALTHY
PHASE AND ONE FAULTY PHASE CONDITION WITH LOSS OF PHASE A
BY TIME-STEPPING FINITE-ELEMENT SIMULATION
For the case study 5-hp six-phase machine , AI rmsph 8.66= , according to the nameplate and
design data.
From the TSFE simulation, the maximum rms phase current value under rated condition is ,
AIphasefaultyoneandhealthyrmsph 98.10)(max
5=
−
Therefore , from Equation 6-13 ,
))((2
2
)5( ])([max56
5
6phasesixhealthyrating
rmsph
rmsphphasefaultyoneandhealthynewrating P
II
Pphasefaultyoneandhealthy
−−
−×
×=
For this motor, ))(( phasesixhealthyratingP − = 3728.5 W. Therefore, according to Equation 6-13 for the 5-
healthy phases/one faulty phase condition, one can write the following:
5.372898.1058.66
2
2
)5)(( ×××
=− faultyoneandhealthyfaultynewratingP
=− )5)(( faultyoneandhealthyfaultynewratingP 1716.04 W
Hence, the new value of torque that the motor would be operating at to produce the rated current
would be
ω)5)(( faultyoneandhealthyfaultynewrating
new
PT −=
where ω is the rated speed in mech. rad/sec.Since the rated speed is 1165 r/min for the case-
study 5-hp induction motor, That is
sec/.1226021165 radmech=×=πω
Hence,

Chapter 6: Experimental and Simulation results 139
NmP
T faultyoneandhealthyfaultynewratingnew 14
12204.1716)5)(( === −
ω
Therefore , after derating the 6-phase motor under loss of one phase , to the new value of the
calculated power , the motor would produce a developed average torque of 14 Nm , without
exceeding the rated design value of current in the phases. Figures 6-107 and 6-108 shows the
TSFE simulation results of the phase currents in the 5-healthy and one faulty phase case, with the
loss of phase A , before and after derating the motor , that is for a torque of 30Nm and 14Nm,
respectively.

Chapter 6: Experimental and Simulation results 140
0.95 0.955 0.96 0.965 0.97 0.975 0.98 0.985 0.99 0.995 1-20
-15
-10
-5
0
5
10
15
20
Time (seconds)
Cur
rent
(A)
iaibicidieif
Figure 6-107: Phase currents in the 5-healthy and one faulty phase with loss of phase A before derating the motor from TSFE simulation.
0.45 0.455 0.46 0.465 0.47 0.475 0.48 0.485 0.49 0.495 0.5-10
-8
-6
-4
-2
0
2
4
6
8
10
Time (seconds)
Cur
rent
(A)
ifieidicibia
Figure 6-108: Phase currents in the 5-healthy and one faulty phase with loss of phase A after derating the motor from TSFE simulation.

Chapter 6: Experimental and Simulation results 141
From Figures 6-107 and 6-108 , it can be observed that the rms value of the highest value of
phase currents after derating the motor has dropped to 6.4 A which is below the rated current
value of 6.8 A, of the original design.
Similarly , the motor can be derated under the other faulty cases as well , to bring down
the current in the phases under “limp-home” operation scenarios to values close to the rated
current of 6.8A, thus avoiding any potential winding overheating, damage to the motor.
Accordingly, for the 4-healthy phases and the two faulty phase operation scenario with the loss of
two adjacent phases A and B ,
Upon applying Equation 6-12 for derating the motor output as discussed earlier, it is found that,
))((2
2
)4( ])([max46
4
6phasesixhealthyrating
rmsph
rmsphphasefaultytwoandhealthynewrating P
II
Pphasefaultytwoandhealthy
−−
−×
×=
The maximum rms phase current was found to be 13.484 A, hence,
5.3728484.1348.66
2
2
)4)(( ××
=− faultytwoandhealthyfaultynewratingP
=− )4)(( faultytwoandhealthyfaultynewratingP 1422.34 W
and the new value of the developed torque would be ,
== −
ω)4)(( faultytwoandhealthyfaultynewrating
new
PT 11.65 Nm
For the 4-healthy phase and the two faulty phase operation scenario with the loss of two non-
adjacent phases A and C,
Upon applying Equation 6-12 for derating the motor output as discussed earlier, it is found that,
))((2
2
)4( ])([max46
4
6phasesixhealthyrating
rmsph
rmsphphasefaultytwoandhealthynewrating P
II
Pphasefaultytwoandhealthy
−−
−×
×=
The maximum rms phase current was found to be 12.94 A, hence,

Chapter 6: Experimental and Simulation results 142
5.372894.1248.66
2
2
)4)(( ××
=− faultytwoandhealthyfaultynewratingP
=− )4)(( faultytwoandhealthyfaultynewratingP 1544.45 W
and the new value of the developed torque would be ,
== −
ω)4)(( faultytwoandhealthyfaultynewrating
new
PT 12.65 Nm
For the 4-healthy phase and the two faulty phase operation scenarion with the loss of two non-
adjacent phases A and D,
Upon applying Equation 6-12 for derating the motor output as discussed earlier, it is found that,
))((2
2
)4( ])([max46
4
6phasesixhealthyrating
rmsph
rmsphphasefaultytwoandhealthynewrating P
II
Pphasefaultytwoandhealthy
−−
−×
×=
The maximum rms phase current was found to be 10.04 A, hence,
5.372804.1048.66
2
2
)4)(( ××
=− faultytwoandhealthyfaultynewratingP
=− )4)(( faultytwoandhealthyfaultynewratingP 2565.5 W
and the new value of the developed torque would be ,
== −
ω)4)(( faultytwoandhealthyfaultynewrating
new
PT 21.02 Nm
For the 3-healthy phase and the three faulty phase operation scenario with the loss of three
adjacent phases A, B and C
Upon applying Equation 6-12 for derating the motor output as discussed earlier, it is found that,
))((2
2
)3( ])([max36
3
6phasesixhealthyrating
rmsph
rmsphphasefaultythreeandhealthynewrating P
II
Pphasefaultythreeandhealthy
−−
−×
×=
The maximum rms phase current was found to be 25.23 A, hence,

Chapter 6: Experimental and Simulation results 143
5.372823.2538.66
2
2
)3)(( ××
=− faultythreeandhealthyfaultynewratingP
=− )3)(( faultythreeandhealthyfaultynewratingP 541.6 W
and the new value of the developed torque would be ,
== −
ω)3)(( faultythreeandhealthyfaultynewrating
new
PT 4 Nm
For the 3-healthy phase and the three faulty phase operation scenario with the loss of three non-
adjacent phases A, C and E
Upon applying Equation 6-12 for derating the motor output as discussed earlier, it is found that,
))((2
2
)3( ])([max36
3
6phasesixhealthyrating
rmsph
rmsphphasefaultythreeandhealthynewrating P
II
Pphasefaultythreeandhealthy
−−
−×
×=
The maximum rms phase current was found to be 12.17 A, hence,
5.372817.1238.66
2
2
)3)(( ××
=− faultythreeandhealthyfaultynewratingP
=− )3)(( faultythreeandhealthyfaultynewratingP 2328.09 W
and the new value of the developed torque would be ,
== −
ω)3)(( faultythreeandhealthyfaultynewrating
new
PT 19.08 Nm
For the 3-healthy phase and the three faulty phase operation scenario with the loss of three non-
adjacent phases A, B and D
Upon applying Equation 6-12 for derating the motor output as discussed earlier, it is found that,
))((2
2
)3( ])([max36
3
6phasesixhealthyrating
rmsph
rmsphphasefaultythreeandhealthynewrating P
II
Pphasefaultythreeandhealthy
−−
−×
×=
The maximum rms phase current was found to be 18.66 A, hence,

Chapter 6: Experimental and Simulation results 144
5.372866.1838.66
2
2
)3)(( ××
=− faultythreeandhealthyfaultynewratingP
=− )3)(( faultythreeandhealthyfaultynewratingP 990.28 W
and the new value of the developed torque would be ,
== −
ω)3)(( faultythreeandhealthyfaultynewrating
new
PT 8.11 Nm
In summary to the above discussion on derating the motor output under various fault scenarios,
Table 6-5 gives the power rating of the motor and the torque developed after derating of the
motor output under the various faulty cases:
CONDITION POWER RATING (W) TORQUE (Nm)
6-Healthy phases 3728.5 30
5-Healthy and one faulty phase 1716.05 14
4-Healthy and two adjacent faulty phase with loss of phases A and
B
1422.64 11.65
4-Healthy and two non-adjacent faulty phase with loss of phases A
and C
1544.45 12.65
4-Healthy and two non-adjacent faulty phase with loss of phases A
and D
2565.5 21.02
3-Healthy and three adjacent faulty phase with loss of phases A
, B and C
541.6 4
3-Healthy and three non-adjacent faulty phase with loss of phases A
C and E
2328.09 19.08
3-Healthy and three non-adjacent faulty phase with loss of phases A
B and D
990.28 8.11
Table 6-5 : Power rating and the corresponding torque under various conditions after derating the motor.

Chapter 6: Experimental and Simulation results 145
It can be observed that by derating the motor under the various faulty cases, the operation
of the motor can be continued for a sufficient amount of time for “limp-home” purposes without
exceeding the rated current. This would definitely be useful in cases where reliability is a huge
concern. Also since most of the practical motor operations are carried out at or below 60% of the
full load capacity of such motors, the problem related to excessive currents is quite rare. Also it
is important to note that the faulty cases studied in this work are limited to faults that would
necessitate taking out one or more of the motor phases because of faults occurring in the drive or
between the drive and the motor terminals, and not faults occurring in the actual motor winding
turns inside the core of the machine.

146
CHAPTER 7: CONCLUSIONS AND
RECOMMENDATIONS
7.1 CONCLUSIONS
In this thesis, a unique and useful design for a reversible three-phase to six-phase induction
machine was developed. The main aim of this design was to introduce multiple phases in order to
improve the reliability of the motor under loss of phase or phases due to external fault conditions
to the motor. The design approach was to maintain the same structure / core for both the three-
phase and the six-phase operations. Thus, by reconnecting the coils available at the terminals ,
both of the three-phase and six-phase operations could be achieved. Both configurations were
TSFE simulated for their performance characteristics and parameters to check whether the
reconfigured six-phase case meets the required specifications. The TSFE simulation results were
verified by experimental data for the three-phase operation. More specifically, effects of different
types of phase-loss scenarios on the torque of the six-phase motor were studied and a comparitive
analysis of the various phase-loss conditions with respect to the healthy case was presented.
The analysis of the ripple content in the torque under various loss of phase / phases
conditions were presented and reasoned by using the concept of locus of current space-vector,
which pictorially and effectively reflects the deterioration of the quality of the torque-profile
under the different cases. The closer the locus is to the shape of a circle the better the quality of
the torque developed by the motor. Also the harmonic analysis of the time-domain torque profiles

Chapter 7: Conclusions 147
under these various faulty-phase cases reveals the effect of the magnitude of the second order
harmonic on the ripple content in the torque.
Overall , It was shown that the six-phase motor exhibits better performance under the loss of
phases than the three-phase motor without any external control techniques. Moreover, some of
the cases gave results which were very close to the healthy operation.
Although , there are some thermal issues with regard to excessive phase currents under loss
of phase conditions, these issues have been addressed here. Namely, one of the solutions to this
issue presented in this work is the concept of derating the motor output. It was shown that this
method of derating is an effective way to minimize the current in the phases thereby rendering a
safe operation. It is important to note that these thermal issues come into play only under full-load
conditions. But since most of practical motor operations are carried out at or below 60 % of the
rated condition, it is quite rare that this problem would be encountered under many of these loss
of phase/phases scenarios. Thus , the reversible three-phase/six-phase motor design was
successfully achieved, and serves the purposes of maintaining performance quality under faulty
conditions far better than the conventional three-phase design.
7.2 RECOMMENDATIONS FOR FUTURE WORK
In this work , the main focus was given to the design aspects of the reversible three-phase to
six-phase induction motor. The six-phase configuration was then studied under different types of
phase-loss conditions under direct line energization. This work can later be applied to study the
limp-home stratergies under operation from a six-phase open-loop and closed-loop inverters .
Also exploration of different inverter control algorithms for enhanced performance under faulty
conditions should be explored in light of the possible use of the additional degrees of freedom
(phase currents and voltages) available , where one can / might effectively improve the overall
performance of the motor , in so far as achieving the least amount of ripple in the steady state

Chapter 7: Conclusions 148
torque, even under some of the loss of phase cases presented in this thesis, with possible
minimization of the imbalance between the phase currents through drive control techniques.

149
REFERENCES
[1] T.M. Jahns. "Improved Reliability in Solid-State AC Drives by Means of Multiple
Independent Phase-Drive Units." IEEE Transactions on Industry Applications,Vol. IA-16,
pp. 321-331. May/June,1980.
[2] E.A. Klingshirn, "High phase order induction motors - Part I –Description and theoretical
consideration," IEEE Transactions on PowerApparatus and Systems, vol. PAS-102, n° 1, January
1983, pp.47 -53.
[3] G.K. Singh, “Multi-phase induction machine drive research – a survey,” Electric Power
Systems Research, vol. 61, no. 2, pp.139-147, 2002.
[4] H.A. Toliyat and H. Xu, “DSP-based direct torque control (DTC) for five-phase induction
machines,” Proc. Int. PowerElectronics Conf. IPEC, Tokyo, Japan, pp.1195-1200, 2000.
[5] E. Levi, S.N. Vukosavic and M. Jones, “Vector control schemes for series-connected six-
phase two-motor drive systems,” IEE Proc. – Electric Power Applications, vol. 152, no. 2, pp.
226-238, 2005.
[6] R. Bojoi, F. Farina, G. Griva, F. Profumo and A. Tenconi, “Direct torque control for dual
three-phase induction motor drives,” IEEE Trans. on Industry Applications, vol. 41, no.
6,pp.1627-1636, 2005.

References 150
[7] Peter Vas, Sensorless Vector and Direct Torque Control,Oxford University Press, 1998.
[8] B. K. Bose, Power Electronics and AC Drives, Prentice-Hall,Englewood Cliffs, New
Jersey, 1986.
[9] J.B. Wang, K. Atallah and D. Howe, “Optimal torque control of fault-tolerant permanent
magnet brushless machines,” IEEE Trans. on Magnetics, vol. 39, no. 5, pp. 2962-2964, 2003.
[10] B.C. Mecrow, A.G. Jack, D.J. Atkinson, S.R. Green, G.J.Atkinson, A. King and B. Green,
“Design and testing of a Four phase fault-tolerant permanent magnet machine for an engine fuel
pump,” IEEE Trans. on Energy Conversion, vol.19, no. 3, pp. 671-678, 2004.
[11] G.J. Atkinson, B.C. Mecrow, A.G. Jack, D.J. Atkinson, P.Sangha and M. Benarous, “The
design of fault tolerant machines for aerospace applications,” Proc. IEEE Int. Electric Machines
and Drives Conf. IEMDC, San Antonio, TX, pp.1863-1869, 2005.
[12] A.J. Mitcham, G. Antonopoulos and J.J.A. Cullen, “Favourable slot and pole number
combinations for fault-tolerant PM machines,” IEE Proc. - Electrical Power Applications,
vol.151, no. 5, pp. 520-525, 2004.
[13] J. R. Fu and T.A. Lipo, “Disturbance free operation of a multiphase current regulated
motor drive with an open phase”, IEEE Trans on .Ind Applications,Vol. 30, Issue.5, Sep. – Oct.
1994, pp.1267 -1274.
[14] Leila Parsa, Hamid A. Toliyat, “Fault-Tolerant Interior-Permanent-magnet Machines for
Hybrid Electric Vehicle Applications” , IEEE Transactions on Vehicular Technology,
Vol.56,No.4,July 2007,pp.1546-1552.
[15] T. H. Liu, J. R. Fu, and T. A. Lipo, “A strategy for improving reliability of field oriented
controlled induction motor drives,” 1991 IEEE U S Annu. Meet. Conf. Rec., vol. 1, pp. 449-455,
1991.
[16] C. B. Jacobina, R. S. Miranda, M. B. de R. Corrêa, A. M. N. Lima, “Disturbance-Free

References 151
operation of a six-phase AC motor drive system”, IEEE Power Electronics Specialist Conference,
Aachen Germany, 2004.
[17] H. A. Toliyat, “Analysis and simulation of multi-phase variable speed induction motor
drives under asymmetrical connections”, APEC '96, Volume 2, 3-7 March 1996 , pp.586 -592.
[18] Yifan Zhao, Thomas A. Lipo, “Modeling and control of a multi-phase induction machine
with structural unbalance”, IEEE Transactions on Energy Conversion, vol.11,No.3,September
1996, pp.578-584.
[19] Gerard Aroquiadassou, Humberto Henao, “Experimental Analysis of the dqo stator current
component spectra of a 42V fault-tolerant six-phase induction machine drive with opened stator
phases”, Diagnostics for Electric Machines, Power Electronics and Drives, 2007. September
2007 , pp. 52-57.
[20] J. P. Martin and F. Meibody-Tabar, “Multi-phase permanent magnet synchronous
machine supplied by VSIs, working under fault conditions”, IEEE Industry Applications
Conference, Volume 3, 8-12 Oct. 2000, pp.1710-1717.
[21] N.A.O. Demerdash, “Design and Analysis of Electric Motors in Adjustable Speed
Drives” Class Notes for EECE 185, Department of Electrical and Computer Engineering,
Marquette University, Milwaukee, Wisconsin, Fall 2007.
[22] C. B. Jacobina, R. S. Miranda, and A. M. N. Lima, “Reconfigurable Fault Tolerant Dual-
Winding AC Motor Drive System,”IEEE Trans. On Power Electron. , 2005 Page(s):1574 – 1579.
[23] R. Peuget, S. Courtine, and J. P. Rognon, “Fault detection and isolation on a pwm inverter
by knowledge-based model,” IEEE Trans. Ind. Aplicat., vol. 34, pp. 1318–1326, Nov./Dec. 1998.
[24] R. Ribeiro, C. Jacobina, E. da Silva, and A. Lima, “Fault detection in voltage-fed pwm
motor drive systems,” in Conf. Rec. PESC, pp. 242–247, 2000.
[25] M. Correa, C. Jacobina, E. da Silva, and A. Lima, “An induction motor drive system with

References 152
improved fault tolerance,” IEEE Trans. Ind. Applic., vol. 37, pp. 873–879, May/June 2001.
[26] Chia-Chou Yeh, and Nabeel A. O. Demerdash, “Fault Tolerant Operations in Adjustable-
Speed Drives and Soft Starters for Induction Motors,” IEEE Trans. On Power Electronics, 17-21
June 2007 Page(s):1942 - 1949
[27] Ahmed Sayed-Ahmed, Chia-Chou Yeh, Behrooz Mirafzal, and Nabeel A. O. Demerdash,
“Analysis of Stator Winding Inter-Turn Short-CircuitFaults in Induction Machines for
Identification of the Faulty Phase,” IEEE Trans. Ind. Applications, Volume 3, 8-12 Oct. 2006
Page(s):1519 – 1524.
[28] Sarani, E., Abbaszadeh, K., and Ardebili, M, “Modeling and simulation of turn-fault and
unbalance magnetic pull in induction motor based on magnetic equivalent circuit method”,
Electrical machines and Systems, 2005, ICEMS 2005.Proceedings of the Eighth Intenational
Conference on, vol. 1, pp. 52-56, 27-29 Sept. 2005.
[29] Gennadi. Y. Sizov, “Analysis, Modeling, and Diagnostics of Adjacent and Nonadjacent
Broken Rotor Bars in Squirrel-Cage Induction Machines”, M.S. Thesis , Marquette University ,
Wisconsin , U.S.A., 2007.
[30] Behrooz Mirafzal, “Incipient Fault Diagnosis In Squirrel-Cage Induction Motors”,
Ph.D. dissertation, Marquette University, Milwaukee, WI, 2005.
[31] S.C. Tandon, A.F. Armor, and M.V.K. Chari, “Nonlinear Transient Finite Element Field
Computation for Electrical Machines and Devices”, IEEE Transactions on Power Apparatus and
Systems, Vol. PAS-102, No. 5, pp. 1089-1096 May 1983.
[32] M.V.K. Chari, G. Bedrosian, J. D'Angelo, and A. Konrad, “Finite Element Applications
in Electrical Engineering”, IEEE Transactions On Magnetics, Vol. 29, No. 2, pp. 1306-1314
March 1993.
[33] P. Silvester, and Madabushi V. K. Chari, “Finite Element Solution of Saturable Magnetic

References 153
Field Problems”, IEEE Transactions On Power Apparatus and Systems, vol. PAS-89, no. 7, pp.
1642-1651 September/October 1970.
[34] Demerdash, N. A., Bangura, J. F., Isaac, F. N. and Arkadan, A. A., “A Time-Stepping
Coupled Finite Element-State-Space Model for Induction Motor Drives-Part 1: Model
Formulation and Machine Parameter Computation and Part 2 Machine Performance Computation
and Verification,” Papers No. 376 and 377 Presented at the IEEE-IEMDC, May 1997. and
Accepted for Publication in the IEEE Transactions on Energy Conversion.
[35] J. F. Bangura, “A time-stepping coupled finite element-state space modeling for on-line
diagnosis of squirrel-cage induction motor faults,” Ph.D. dissertation, Marquette University,
Milwaukee, WI, 1999.
[36] N. A. Demerdash and J. F. Bangura, “A time-stepping coupled finite element-state space
modeling for analysis and performance quality assessment of induction motors in adjustable
speed drives applications,”presented at the Naval Symposium on Electric Machines, Newport, RI,
1997.
[37] J. F. Bangura and N. A. Demerdash, “Diagnosis and characterization of effects of broken
rotor bars and connectors in squirrel-cage induction motors by a time-stepping coupled finite-
element-state space modeling approach,” IEEE Trans. Energy Conv., vol. 14, pp. 1167–1175,
Dec. 1999.
[38] J. F. Bangura and N. A. Demerdash, “Simulation of inverter-fed induction motor drives
with pulse-width modulation by a time-stepping coupled finite element-flux linkage-based state
space model,” IEEE Trans. Energy Conv., vol. 14, pp. 518–525, Sept. 1999.
[39] J. F. Bangura and N. A. O. Demerdash, “Effects of broken bars/end-ring connectors
and airgap eccentricities on ohmic and core losses of induction motors in ASDs using a coupled
finite element-state space method,” IEEE Trans. Energy Conv., vol. 15, pp. 40–47, Mar. 2000.