design and construction of mat foundations
TRANSCRIPT
MISCELLANEOUS PAPER GL-89-27
DESIGN AND CONSTRUCTIONOF MAT FOUNDATIONS
by
'" Lawrence D. Johnson
to Geotechnical Laboratory
DEPARTMENT OF THE ARMY
Waterways Experiment Station, Corps of Engineers3909 Halls Ferry Road, Vicksburg, Mississippi 39180-6199
/WA) DTICELECTE
,. . ~S DEC291989
November 1989Appre Fr PFinal Report
'II
Prepared for DEPARTMENT OF THE ARMYUS Army Corps of EngineersWashington, DC 20314-1000
-LABORATORY Under RDT&E Work Unit AT 22/AO/010
89 12 28 096
Unclassified
SECURITY CLASS:F!CATiON OF :,H.S PAGE
REPORT DOCUMENTATION PAGE Mo NoO74-O1"
la. REPORT SECURITY CLASSIFICATION lb RESTRICTIVE MARKINGS
Unclassified2a. SECURITY CLASSIFICATION AUTHORITY 3 DISTRIBUTION/AVAILABILITY OF REPORT
2b DECLASSIFICATION, DOWNGRADING SCHEDULE Approved for public release;
distribution unlimited.4 PERFORMING ORGANIZATION REPORT NUMBER(S) S MONITORING ORGANIZATION REPORT NUMBER(S)
Miscellaneous Paper GL-89-27
6& NAME OF PERFORMING ORGANIZATION 6b OFFICE SYMBOL 7a. NAME OF MONITORING ORGANIZATIONUSAEWES (if applicable)Geotechnical Laboratory 1
6c. ADDRESS (City, State, and ZIP Code) 7b ADDRESS (City, State, and ZIP Code)3909 Halls Ferry RoadVicksburg, MS 39180-6199
8a NAME OF FUNDINGSPONSORING 8b OFFICE SYMBOL 9 PROCUREMENT INSTRUMENT IDENTIFICATION NUMBERORGANIZATION US Army Corps of (If applicable)
Engineers I
8c. ADDRESS (City, State, and ZIP Code) 10 SOURCE OF FUNDING NUMBERSPROGRAM PROJECT TASK WORK UNITELEMENT NO. NO NO. ACCESSION NO
Washington, DC 20314-1000 AT22/AO/01
11 TITLE (Include Security Classification)
Design and Construction of Mat Foundations
12 PERSONAL AUTHOR(S)
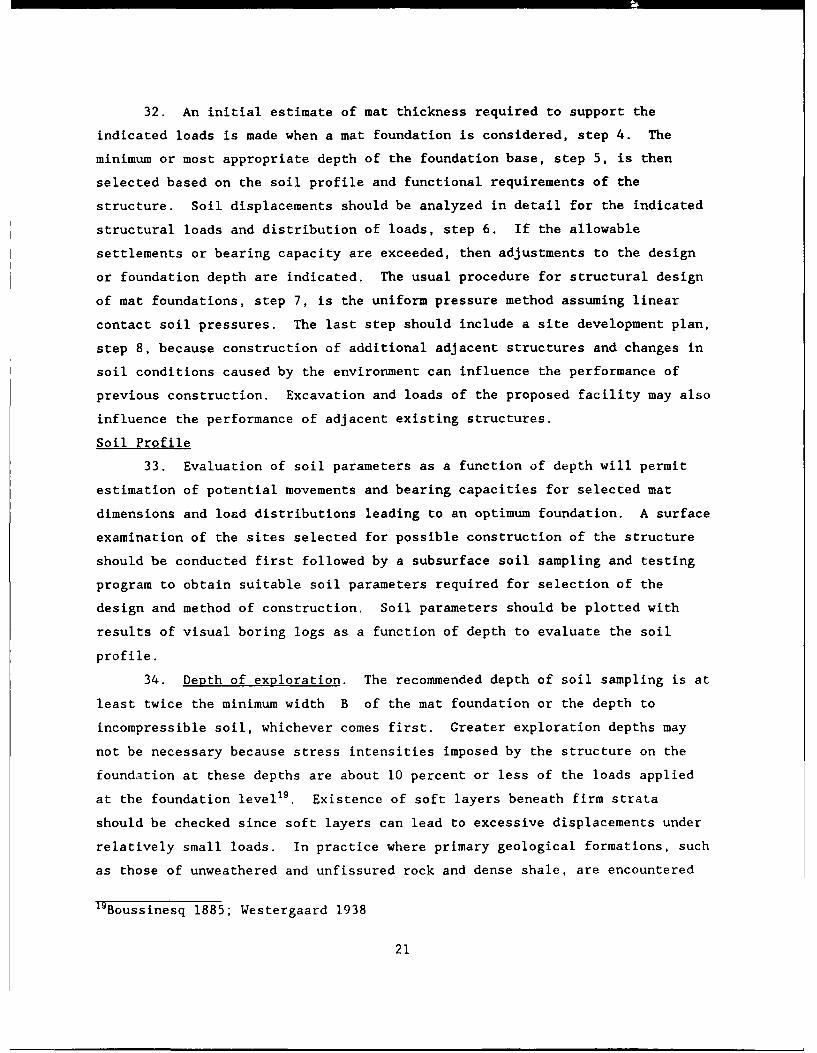
Johnson, Lawrence D.13a. TYPE OF REPORT 13b TIME COVERED 14 DATE OF REPORT (Year, Month, Day) 15 PAGE COUNT
Final report FROM _ TO November 1989 354
16 SUPPLEMENTARY NOTATION This report is available from the National Tecnhnical InformationService, 3285 Port Royal Road, Springfield, VA 22161.
17 COSATI CODES I SUBJECT TERMS (Continue on reverse if necessary and identify by block number)FIELD GROUP SUB-GROUP Expansive soil Mat foundation Soil-structure
Heave Settlement interaction
19 ABSTRACT (Continue on reverse if necessary and identify by block number)
-Mat foundations commonly support all types of structures. Flat mats from 2 to 8 ft
in thickness often containing two-way steel reinforcement top and bottom usually support
multistory or heavy structures. Mats less than I ft thick often constructed with steel
reinforced ribs or stiffening crossbeams usually support light one or two story structures.Man, of these mats have been designed and constructed for supporting permanent military
facilities, particularly in heaving/shrinking and compressible soil. Some of thesemats have experienced significant differential movement leading to cracking in the
stricture and have required costly remedial work. Attempts to reduce such maintenance
expenses of some structures have lead to substantially increased design and (knstruction
c:sts for mat foundations.Ihis report provides information on serviceability of structures, guidelines for
evaluation of soil, and some structure input parameters for design analysis and guide-
lines for design and construction of ribbed mat foundations in expansive soils. Methods(Cont inue'd
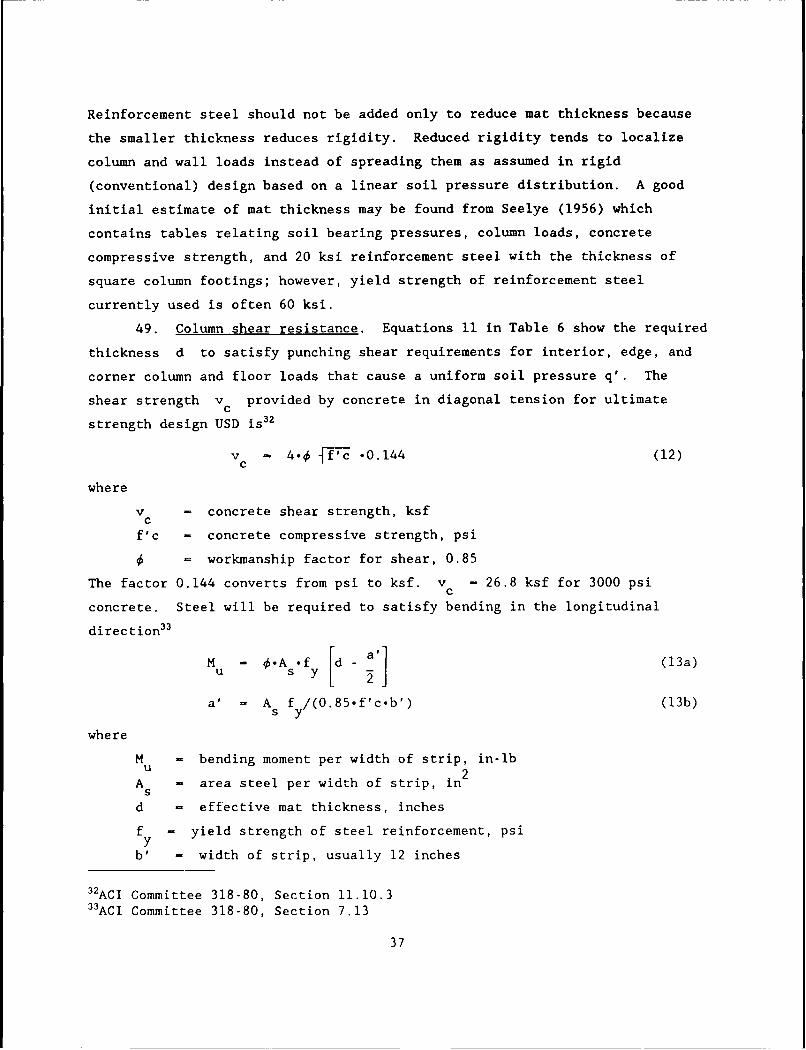
20 DISTRIBUTION/AVAILABILITY OF ABSTRACT 21 ABSTRACT SECURITY CLASSIFICATIONQ UNCLASSIFEDfUNLIMITED 0 SAME AS RPT C3 DTIC USERS Unclassified
22a. NA;,4E OF RESPONSIBLE INDIVIDUAL 22b TELEPHONE (Include Area Code) 22c OFFICE SYMBOL
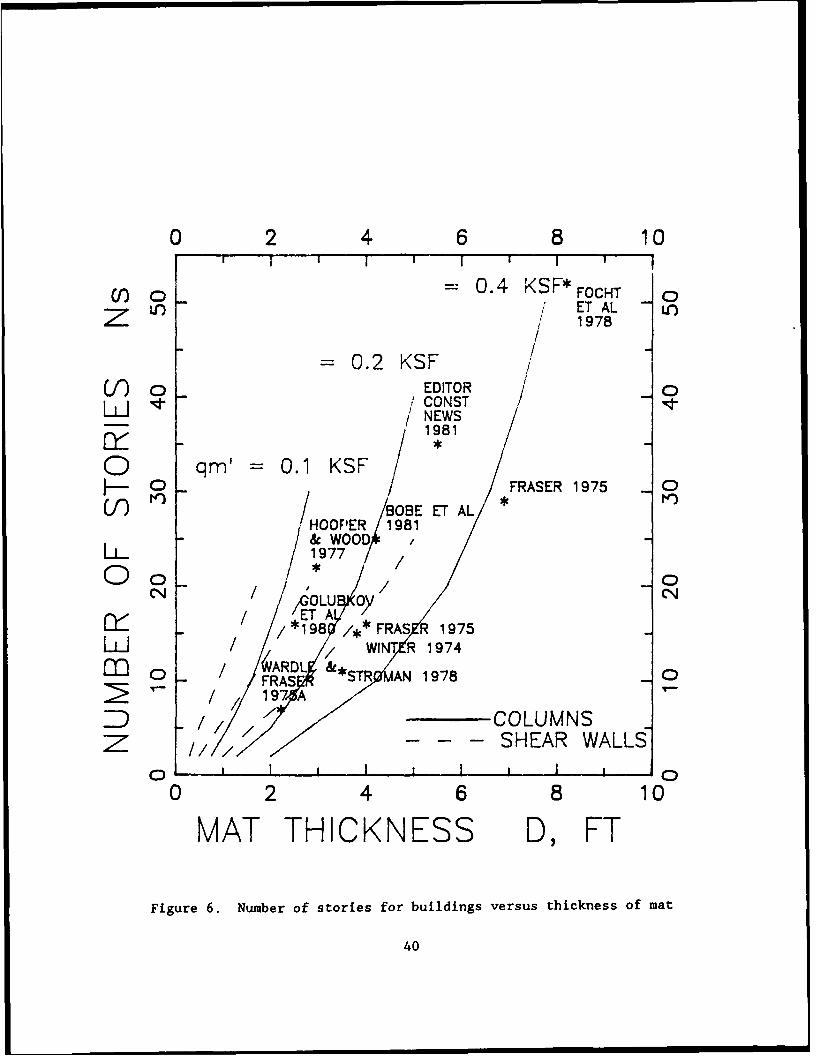
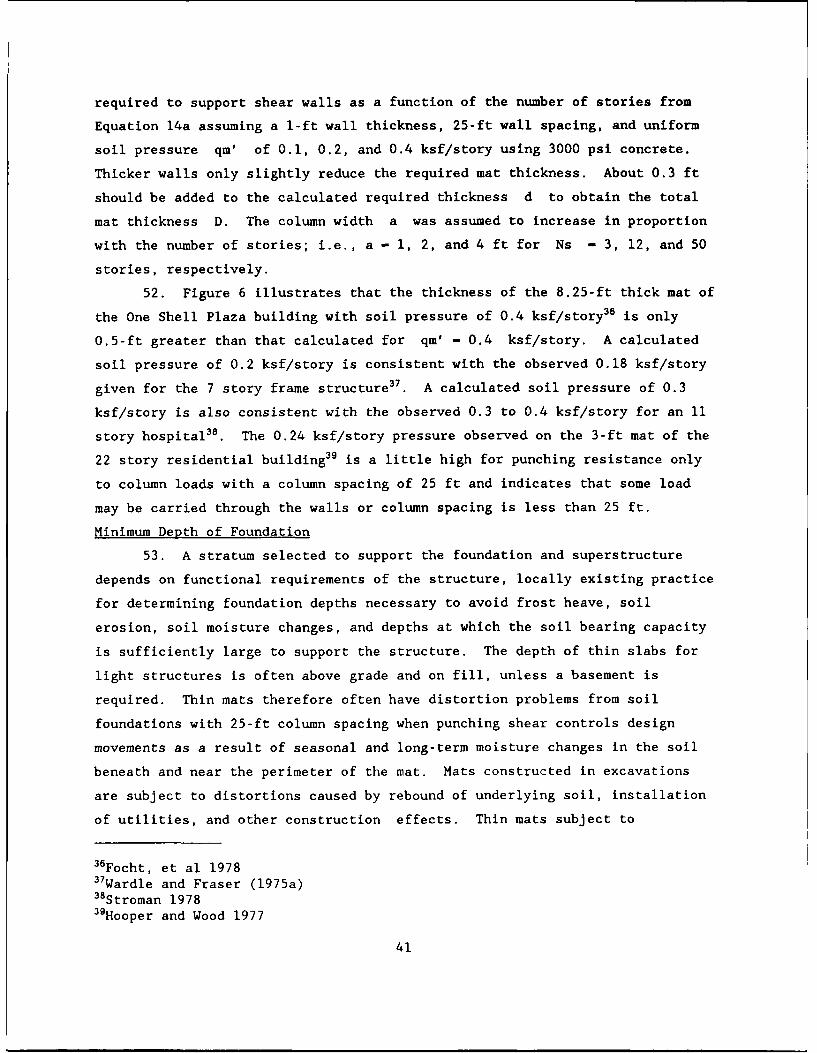
DO Form 1473. JUN 86 Previouselitions are obsolete SECURITY CLASSIFICATION OF THIS PAGEUnclassified
UnclassifiedSECURITY CLASSIFICATION OF THIS PAGE
20. ABSTRACT (Continued).
have been developed for evaluation of effective soil elastic moduli and stiffness ofstructures. New concepts are proposed for determining some soil input parameters fordesign in expansive soils such as the depth of the active zone for heave and edge moisturevariation distance. Several case history studies of ribbed and flat mat foundationshave been investigated to assist determination of suitable procedures for calculatingdeformati-n behavior of mat foundations.
Analysis of the performance of a large ribbed mat foundation supporting building 333,
Red River Army Depot, proves the viability of selected instrumentation and methodology.The observed earth pressure distribution shows extremely large concentrations of soilpressure near the perimeter indicating rigid behavior on an elastic soil or soil shearat the perimeter. The extended distribution of earth pressures from column loadsindicates the effectiveness of stiffening beams in spreading applied loads. Evidenceis presented indicating that concrete shrinkage and foundation distortions duringconstruction may sometimes let stiffening beams of ribbed mats hang in the trencheswithout soil support, which may contribute to mat fractures when superstructure loads areapplied. Observed strains in the concrete mat were generally consistent with observed
deformation patterns.A preliminary systematic damage record system was developed to catalog most
frequent damages, assist identification of causes of damage from foundation movements,and assist determination of requirements for maintenance and repair of military facil-ities. Recommendations are made for field surveys of detailed surface soil and founda-tion movement patterns and other work to investigate a new frequency spectrum approachand ground modification methods to improve understanding and performance of militaryfacilities, improve design of foundations, and reduce maintenance and repair requirements.
Accession For
NTIS GRA&IPTU'_ TAB
Justification
Di-stribut ion/-
Availaibility CodesS -Avail and/or
Dist 9pecial
Unclassified
SECURITY CLASSIFICATION OF THIS PAGE
PREFACE
This report provides a comprehensive review and analysis of design and
construction technology of mat foundations as of 1988 with guidelines for
design and construction of ribbed mats in expansive soil. This report
completes RDT&E Work Unit AT22/AO/010, "Mat Foundations for Intermediate and
Heavy Military Structures," sponsored by the Office, Chief of Engineers (OCE),
US Army. This work unit was begun in October 1982 and completed September
1988. Miscellaneous Papers GL-85-16, "BOSEF: Beam on Swelling Elastic
Foundation", and Miscellaneous Paper GL-88-6, "Proceedings of the Workshop on
Design, Construction, and Research for Ribbed Mat Foundations" were prepared
to complete earlier phases of this study. Contract reports DACA39-87-M0835,
"A Computer Program For Analysis of Transient Suction Potential in Clays,"
DACA39-87-M0557, "Study of Surface Deformations of Mat Foundations on
Expansive Soils," and DACA39-87-M0754, "Selection of Design Parameters For
Foundations on Expansive Soils," were also prepared to assist in completing
this work unit. Mr. A. F. Muller, Mr. Richard F. Davidson and Mr. Wayne King
were the OCE Technical Monitors.
This report was prepared by Dr. Lawrence D. Johnson, Research Group,
Soil Mechanics Division (SMD), Geotechnical Laboratory (GL), US Army
Engineer Waterways Experiment Station (WES). The Foundation and Materials
Branch, Savannah District, South Atlantic Division (SAD), contributed data for
analysis of the mat supporting Fort Gordon Hospital, Georgia. The Foundation
and Materials Branch, Fort Worth District (FWD), Southwestern Division (SWD),
contributed data for analysis of mats supporting military facilities in San
Antonio, Texas. Messrs. R. L. James and B. H. James (SWD), Mr. W. R. Stroman
(FWD), Messrs. G. B. Mitchell, C. L. McAnear, and Dr. L. D. Johnson (SMD), and
Mr. A. F. Muller (OCE) participated in the field trip of May 1984 to San
Antonio, TX, to assess visual performance of mat foundations.
Many helpful comments were provided by Dr. P. F. Hadala, Assistant Chief
(CL), Mr. A. L. Branch, Jr. (FWD), Dr. G. Wayne Clough, Virginia Polytechnic
Institute, Mr. J. P. Hartman (SWD), Dr. A. D. Kerr, University of Delaware,
Mr. Wayne King (OCE), Mr. R. L. Mosher, Information Technology Laboratory
(WES), and Mr. W. R. Stroman. In situ soil tests for analysis of the ribbed
mat supporting Building 333, Red River Army Depot, were performed by the
following: pressuremeter tests by Briaud Engineers, College Station, TX, cone
penetration tests by Fugro Inter, Inc., Houston, TX, and plate load tests by
the Fort Worth District (SWD). Messrs. R. H. Floyd and T. Rosamond,
Instrumentation Services Division (WES) installed earth pressure cells and
strain gages in portions of the mat supporting building 333.
The work was performed under the direct supervision of Mr. C. L.
McAnear, Chief, SMD, and general supervision of Dr. W. F. Marcuson III, Chief,
GL. COL Larry B. Fulton, EN, was Commander and Director of WES during the
preparation of this report. Dr. Robert W. Whalin was Technical Director.
2
CONTENTS
Page
PREFACE..................................1
CONVERSION FACTORS, INCH-POUND TO METRIC (SI) UNITS OF MEASUREMENT .5
PART I: INTRODUCTION..........................6
Background ............................. 6Description and Applications of Mats ................ 6Description of Foundation Movements................9Serviceability .......................... 11Philosophy of Design ....................... 14Current Limitations cf Design...................16Purpose and Scope........................17
PART II: REVIEW OF METHODOLOGY ..................... 19
Introduction...........................19General Design Procedure.....................19
Soil Profile.......................21Total Displacements ..................... 24Initial Mat Thickness .................... 35Minimum Depth of Foundation. ............... 41Differential Soil Displacements. ............. 45Final Design........................52
PART III: CASE HISTORY STUDIES ..................... 61
Introduction..........................61Soil Parameters ....................... 61Structural Parameters .................... 62
Ribbed Mat Foundations......................64Gymnasium, Brooks Air Force BAse ............. 69Data Processing Facility, Randolph Air Force Base . . .. 77Maintenance Shop and Warehouse, US Army Reserve Center .85Dental and Medical Clinics.................93Pest Management Training Facility .............. 104Summary and Conclusions. ... .............. 1l
Flat Mat Foundations.......................112Wilford Hall Hospital. .................. 113Fort Cordon Hospital....................123Fort Polk Hospital.....................131Summary and Conclusions. ................. 137
PART IV: APPLICATION OF FIELD PERFORMANCE..............140
Introduction..........................140Description of Soil........................143
Classification Tests....................143Laboratory Strength Tests. ................ 143Consolidometer Swell Tests ................ 148In Situ Soil Tests.....................149
3
PageField Instrumentation.......................154
Piezometers.........................154Elevation Surveys......................154Earth Pressure Cells ................... 163Strain Gages........................169
Analyses............................182Input Parameters......................182Plate on Elastic Foundation ................ 193Beam on Winkler Foundation................196Frequency Spectrum Model ................. 198
Summary and Conclusions......................200
PART V: GUIDELINES FOR DESIGN AND CONSTRUCTION OF RIBBED MATS . . . 202
Applicability of Mat Foundations................202Expansive Soil Behavior. .................... 202
Center Lift.........................203Edge Lift.........................203
Soil Exploration.........................205Site Characterization ................... 205Soil Characterization. .................. 206
Design of Ribbed Mats.......................213Input Parameters......................213Foundation Plan. ..................... 213Rib Dimensions.......................220
Construction...........................220Minimizing Problems. ................... 220Preparation for Mat Construction..............225Site Finishing ...................... 234Followup..........................235
PART V: RECOMMENDATIONS........................238
REFERENCES..............................240
APPENDIX A: EQUIVALENT SOIL ELASTIC MODULUS ............. Al
APPENDIX B: INFLUENCE OF SUPERSTRUCTURE RIGIDITY...........BI
APPENDIX C: USER'S MANUAL FOR COMPUTER PROGRAM SLAB2. ......... Cl
APPENDIX D: PERFORMANCE ANALYSIS, CENTRALIZED TROOP CLINIC,FORT SAM HOUSTON, TEXAS ................. Dl
APPENDIX E: INFLUENCE OF SOIL MODEL ON MAT PERFORMANCE. ........ El
APPENDIX F: LIGHT TRACK VEHICLE FOUNDATION DESIGN .. .......... Fl
APPENDIX G: FIELD TESTS.........................l
4

CONVERSION FACTORS, NON-SI TO SI (METRIC)UNITS OF MEASUREMENT
Non-SI units of measurement used in this report can be converted to SI (met-
ric) units as follows:
Multiply By To Obtain
cubic yards 0.7645549 cubic metres
Fahrenheit degrees 5/9 Celsius degrees or Kelvins*
feet 0.3048 metres
inches 2.54 centimetres
inch-poundss (force) 0.1129848 metre-newtons
kips (force) 4.448222 kilonewtons
miles (US statute) 1.609347 kilometres
pounds (force) 4.448222 newtons
pounds (force) per inch 175.1268 newtons per metre
pounds (force) per square foot 47.88026 pascals
pounds (force) per square inch 6.894757 pascals
pounds (mass) per cubic foot 16.01846 kilograms per cubic metre
pounds (mass) per cubic yard 0.593276 kilograms per cubic metre
square feet 0.09290304 square metres
square feet squared 0.0086309 square metres squared
square inches squared 416,231.4256 square millimetres squared
tons (2,000 pounds, mass)-feet 276.5098966 kilogram-metres
tons (2,000 pounds, mass)-
square feet 84.280216 kilogram-square metres
tons (torce) 8.896444 kilonewtons
tons (2000 pounds, mass) 907.1847 kilograms
tons (2000 pounds, mass) per
cubic foot 32,036.92148 kilograms per cubic metre
tons (2000 pounds, mass) per
foot 2,976.327756 kilograms per metre
tons (2000 pounds, mass) per
square foot 9,764.856 kilograms per square metre
* To obtain Celsius (C) temperature readings from Fahrenheit (F) readings,
use the following formula: C = (5/9)(F - 32). To obtain Kelvin (K) read-
ings, use K = (5/9)(F - 32) + 273.15
5
DESIGN AND CONSTRUCTION OF MAT FOUNDATIONS
PART I: INTRODUCTION
Background
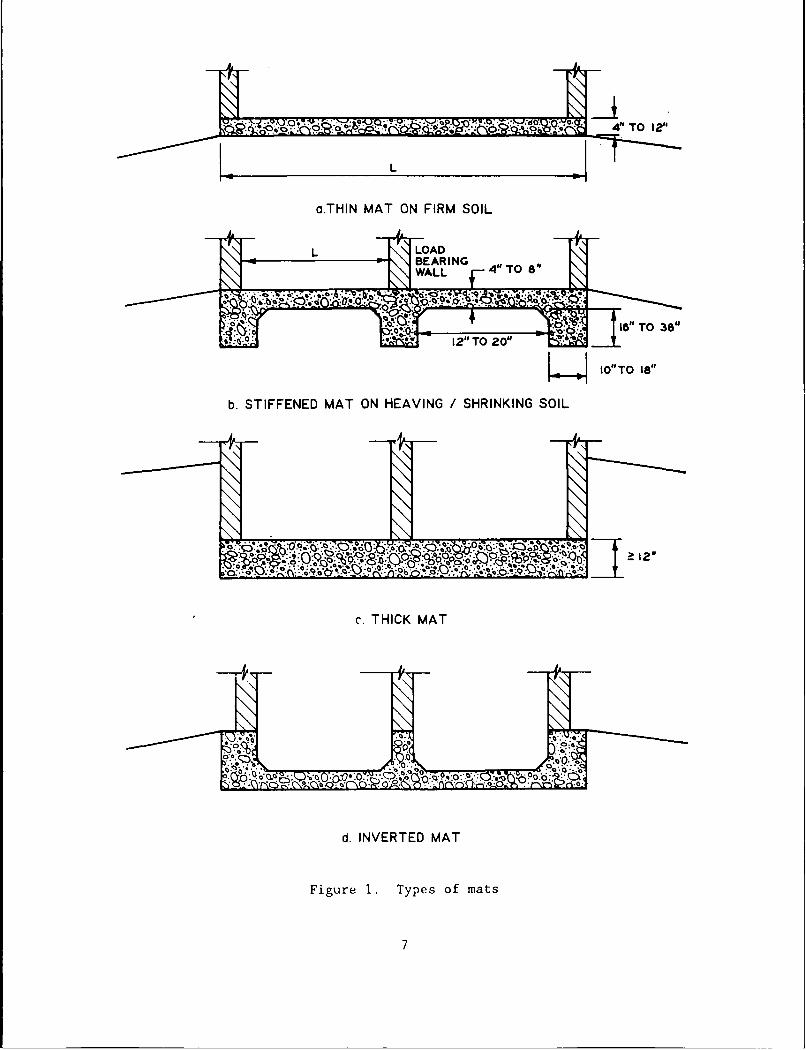
Description and Applications of mats
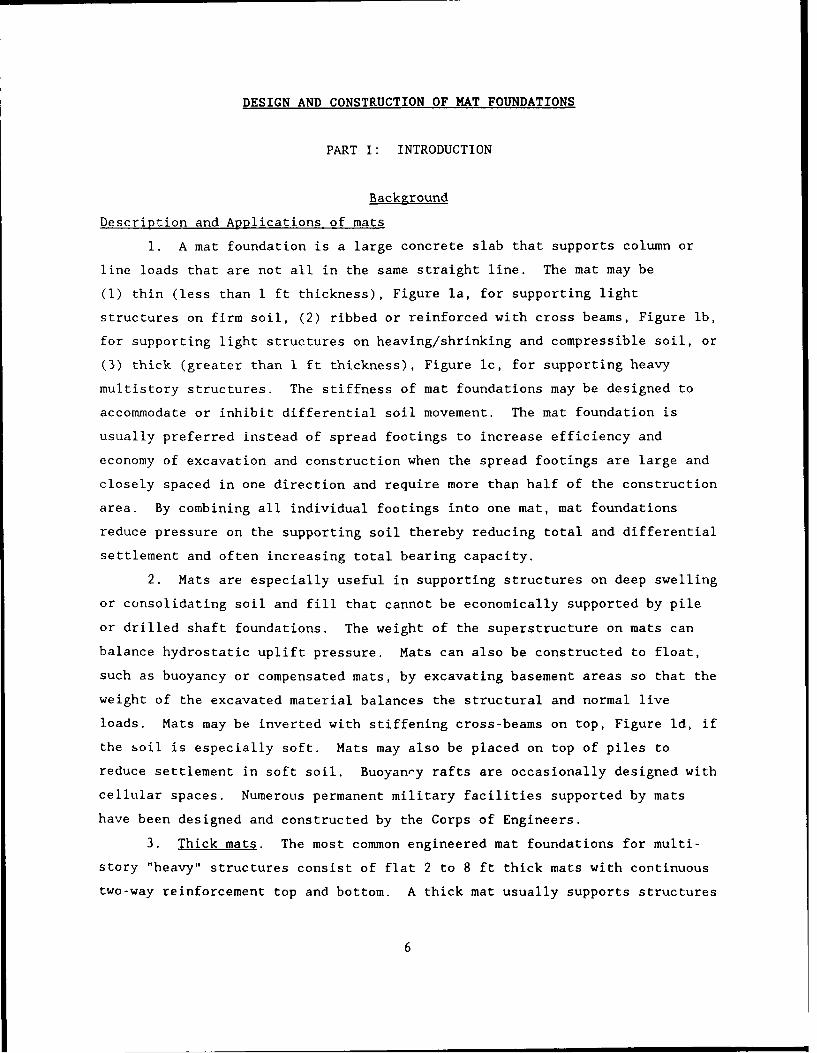
1. A mat foundation is a large concrete slab that supports column or
line loads that are not all in the same straight line. The mat may be
(1) thin (less than 1 ft thickness), Figure la, for supporting light
structures on firm soil, (2) ribbed or reinforced with cross beams, Figure lb,
for supporting light structures on heaving/shrinking and compressible soil, or
(3) thick (greater than 1 ft thickness), Figure 1c, for supporting heavy
multistory structures. The stiffness of mat foundations may be designed to
accommodate or inhibit differential soil movement. The mat foundation is
usually preferred instead of spread footings to increase efficiency and
economy of excavation and construction when the spread footings are large and
closely spaced in one direction and require more than half of the construction
area. By combining all individual footings into one mat, mat foundations
reduce pressure on the supporting soil thereby reducing total and differential
settlement and often increasing total bearing capacity.
2. Mats are especially useful in supporting structures on deep swelling
or consolidating soil and fill that cannot be economically supported by pile
or drilled shaft foundations. The weight of the superstructure on mats can
balance hydrostatic uplift pressure. Mats can also be constructed to float,
such as buoyancy or compensated mats, by excavating basement areas so that the
weight of the excavated material balances the structural and normal live
loads. Mats may be inverted with stiffening cross-beams on top, Figure ld, if
the soil is especially soft. Mats may also be placed on top of piles to
reduce settlement in soft soil. Buoyancy rafts are occasionally designed with
cellular spaces. Numerous permanent military facilities supported by mats
have been designed and constructed by the Corps of Engineers.
3. Thick mats. The most common engineered mat foundations for multi-
story "heavy" structures consist of flat 2 to 8 ft thick mats with continuous
two-way reinforcement top and bottom. A thick mat usually supports structures
6
~e *.o" 0. 4~ 0*.;** ~ ~ *0
. 4"TO 12'
K L
a.THIN MAT ON FIRM SOIL
L LOADBEARING 4 O8WALL 4 O6
16O TO 36"
K-. t"TO 18"
b. STIFFENED MAT ON HEAVING /SHRINKING SOIL
c. THICK MAT
d. INVERTED MAT
Figure 1. Types of mats
7
with more than 2 stories, but some 1 and 2 story structures could have large
column loads causing these structures to be in the heavy category. Post-
tensioned slabs of about 1-ft thickness may support light structures and
reduce differential movement on soft or heaving soil. Mats may be square or
rectangular shaped for supporting buildings or circular shaped for suppcrting
chimneys, silos, and water tanks.
4. American practice tends to overdesign thick mats because of
uncertainty involved with current analysis methodology. The extra cost of the
additional unknown safety against a structural failure is considered
relatively small for reasonable overdesign'. Problems with thick mats
supporting storage tanks and silos, where foundation economy is essential,
have occurred from excessivp tilt and soil shear failures when supported by
soft and weak soil2 .
5. Thin mats. Foundation costs of thin mats 4 to 8 inches thick are a
greater proportion of the total cost of the structure than that for thick mats
supporting multi-story structures. These foundations usually support light
and intermediate structures on and near the ground surface in unstable soil
areas such as expansive and collapsible soil. Thin mats are often reinforced
with stiffening beams and placed on compacted nonexpansive low plasticity fill
to reduce differential movements. These mats may be underdesigned because of
inadequate knowledge of the soil profile, lack of design guidance, or to
reduce construction costs. Underdesign leads to excessive total and
differential movements that interfere with proper function of utilities,
machinery, efficiency and comfort of occupants and damage to the
superstructure. Overdesign leads to excessive construction time and cost.
Ribbed and other mats also occasionally crack during and soon after
construction.
6. Inadequate flatness from deficient design, construction or long-term
distortion of foundation soils impairs performance of structures and it is
costly to repair. Little guidance is available for specifying appropriate
floor flatness for specific functional requirements. Long-term repair and
maintenance expenses can be substantial exceeding the original cost of the
foundation. The cost of repair of damage from heaving soil is typically
'Bowles 1976; refer to REFERENCES for complete listing2Burland and Davidson 1976; Tomlinson 1980; Buttling and Wood 1982
8
greater than cost of repair of damage in settling soil because structures are
generally less able to accommodate heaving. Heave tends to put the
superstructure in tension, while settlement puts the superstructure in
compression; structures are usually less able to resist tensile than
compressive stress. Design guidelines for flexible (thin) mats are not well
advanced beyond the relatively costly uniform pressure method applicable to
rigid (thick) mats.
Description of Foundation Movements
7. Static and dynamic loads cause total and differential movements.
Total movement is the magnitude of vertical heave or downward settlement.
Vertical heave is caused by wetting and subsequent volume increase of
expansive clay soils. Settlement is caused by elastic compression and
consolidation of foundation soils under load and the collapse of meta-stable
arrangements of particles in some unsaturated soils. Differential movement is
the difference in vertical movement between various locations of the structure
and distorts the structure. Ribbed mats with stiffening beams and mats
subject to the stiffening action of a properly designed and connected
superstructure increase stiffness and reduce differential movement caused by
nonuniform heave and shrinkage of expansive soil or consolidation and collapse
of other foundation soil.
8. Differential movements cause distortion and damage in structures.
These are a function of soil moisture change and uniformity, stiffness of the
structure and soil, and distribution of loads within the structure. Excessive
differential movement may lead to tilting that can interfere with adjacent
structures and disrupt the performance of machinery and people. Differential
movement can cause cracking in the structure, distorted and jammed doors and
windows, uneven floors and stairways, and other damage. Widespread cracking
can impair structural integrity and lead to collapse of the structure,
particularly during earthquakes. The height that a wall can be constructed on
a foundation without cracking is related to the deflection/span length ratio
A/L and angular distortion 9 of the foundation.
9. The deflection ratio A/L is a measure of the maximum differential
movement A in the span length L, Figure 2. The span length may be between
9

LSAG_
a. COMBINATION L SAG AND L HOG
L
b RE3ULAR SETTLEMENT
c. IRREGULAR SETTLEMENT
Figure 2. Schematic illustration of angular distortion ratio 9 - 6/ anddeflection ratio A/i. for settling (sagging) and heaving (hogging) profiles
10
two adjacent columns, LSAG or LHOG, Figure 2a. Angular distortion 9 - 6/1
is a measure of differential movement 6 between two adjacent points
separated by the distance 1, Figure 2. Settlement (sagging) occurs from
elastic compression, collapse, and consolidation of the foundation soil.
Heave (hogging) occurs from swelling soil, shrinking or subsidence near the
edges, downdrag from adjacent structures and movement from nearby excavations.
Serviceability
10. Serviceability is an obscure term, partly because it depends on the
purpose of the structure, its response to movements, and the reaction of the
owner and users of the structure to movement and cracking. Serviceability or
performance of structures is especially related to limitations of total and
differential movements to within acceptable values. Considerable judgment
enters into evaluating whether a structure has performed "adequately" because
the definition of adequate is subjective. A simple curtain wall for dividing
space that cracks when subject to excessive differential movement can be
easily repaired to full serviceability with a plastic joint filler, but the
owner of that wall may not be satisfied with the appearance and may consider
the wall a failure.
11. Functions of serviceability. Serviceability depends on the
flexibility of structural members, joints, and other architectural details.
Articulation by inclusion of joints in structures, steel frames, steel and
wood studs, interior paneling and wallboard among other features increase
structural flexibility. Expansion and crack control joints placed at regular
intervals relieve stresses that would otherwise occur in walls and the mat
foundation. Expansion joints are commonly placed at 150-ft intervals in
ribbed mats, while construction joints in walls may be placed at approximately
25-ft intervals or less. Horizontal and vertical impervious membranes have
been successfully used to reduce differential movement from soil moisture
changes. Ground modification methods using chemicals or nonexpansive fills
are uspful for reducing total heaves to less than 1 inch.
12. Although superstructure stiffness tends to reduce differential
movement of the foundation, modeling techniques are not yet able to simulate
stiffness of the total structure so that calculated foundation movements agree
11
with field displacement measurements3. A contributing factor is that
construction materials often display different stiffnesses than those used in
design. External and internal loads on the superstructure can lead to
distress and damage, even if the foundation performs within specifications,
because of a trend toward longer spans between columns, higher permissible
stresses, greater brittleness of wall and facing components, and larger
structurally independent units.
13. Disturbance of the foundation soil during construction can
influence serviceability by altering soil parameters used for design such as
strength, elastic modulus and the modulus of subgrade reaction. Many things
done to a site during construction such as soil disturbance during clearing,
excavation, drainage or wetting of an adjacent area, and environmental effects
can lead to greater differential movement. Care should be exercised by the
contractor during construction to minimize differential movement by use of
proper drainage, compaction control of fills, and grading.
14. Nonstructural damage occurs predominantly by long-term differential
movement, while both immediate and long-term movement contribute to structural
damage4 . Structures on soil with relatively little long-term movement such as
sands tend to show least superficial or cosmetic damage, although structural
damage could occur during construction. This is probably related to the later
placement of facing materials after most of the immediate settlement had
occurred following construction of the structural members.
15. Limitations of total movement. Many structures can tolerate
substantial total movement without cracking. Polshin and Tokar (1957) had
indicated maximum total settlement of 3 inches for unreinforced masonry walls
and 6 inches for reinforced brick and concrete walls; however, total
settlement should not exceed 2 inches in practice for most facilities to help
maintain differential movements within acceptable levels, minimize damage to
connections with outside utilities, maintain adequate drainage, and maintain
adequate serviceability of entry ways. A typical allowable total settlement
for buildings is 1 inch. Total foundation heave, even without surcharge
pressure from the mat foundation, should usually not exceed I to 1.5 inches.
3Focht Jr., Khan, and Gemeinhardt 1978; Bobe, Hertwig, and Seiffert 19814Skempton and McDonald 1956
12
16. Limitations of differential movements. Perimeter or center
movements beneath mats exceeding I to 1.5 inches can be nearly impractical and
not economical to accommodate in design. Larger differential movements may
require innovative superstructure designs to increase flexibility such as
vertical construction joints in walls, slip joints in interior walls and
flexible, watertight utility connections5. Differential movements that can
cause operation problems occur within some limited lateral distance; therefore
these movements are better expressed in terms of angular distortion and
deflection ratio. Chapter 2 of EM 1110-1-1904 provides guidelines of angular
distortions and deflection ratios for different types of structures.
17. The maximum angular distortion from regular settlement, Figure 2b,
occurs at the corner of a mat foundation. m is 4A/L from geometricalmax
relationships if settlement is in the shape of a circular arc. The deflection
6 between the center and corner of a mat is 0.75 of the center settlement if
the Boussinesq stress distribution of a foundation on an elastic soil is
applicable; therefore, the maximum angular distortion will be
m = 3 (la)max L
L
where
PC = center settlement, ft
L - the diagonal length (N-1)1, ft
= distance between columns along the diagonal, ft
N - number of columns on the diagonal
A safe limit of angular distortion for no cracking in buildings is 1/5004.6.
Cracking should be anticipated when 9 exceeds 1/300. Considerable cracking
in panels and brick walls and structural damage is expected when & is
greater than 1/150. Equation la indicates that the differential displacement
A should be less than 0.5 inch to maintain m < 1/500 for span lengths Lmax
of 60 to 80 ft. Allowable angular distortions in the superstructure should
exceed the maximum angular distortion expected in the foundation to avoid
structural distress. Tilting can be observed if 9 > 1/250 and must be
5Technical Manual 5-818-7, "Foundations in Expansive Soils"6Feld 1965; Wahls 1981
13

limited to allow clearance between adjacent buildings, particularly in high
winds. Underpinning may be necessary if tilt is excessive. The tilt angle W
is indicated in Figure 2.
18. Limiting A/L ratios for design is in the range of 1/240 to 1/600.
This range is substantially greater than the 1/2500 limit required to avoid
all cracking in masonry structures7 ,8; however, stiffness contributed by
components in an assembled brick structure help maintain deflection ratios
near 1/2500. The height that a wall can be constructed on a beam without a
cracking failure is related to the deflection/span length A/L and the
distortion 6 by7
A max1 + 3.9 (HL)2(lb)
L 3 + 2.6 (H2/L)
where
A - differential displacement, ft
L -span length, ft
H - wall height, ftW
6max - maximum angular distortion at support, L = 0
Equation lb considers that cracking is initiated at a critical strain C crit -
0.075 percent. crit was based on field observations of the onset of visible
cracking in beams as a function of the wall height/span length ratio. If
m - 1/500 for initiation of damage the corresponding deflection/span lengthmax
ratio A/L is about 1/1333 or 6max is about 3 times greater than A/L.
Philosophy of Design
19. Mat foundations should be designed and constructed to be safe
against a soil shear failure and with loads sufficiently less than the soil
bearing capacity to maintain total and differential displacements that
optimize the functional purpose and structural (shear and bending moment)
capacity of the structure. The maximum pressure applied to foundation soil
should be less than the maximum past pressure to avoid virgin consolidation
settlements; therefore, heavy structures may be supported by compensated or
7Burland and Wroth 19788Polshin and Tokar 1957
14

floating mats placed in deep excavations. Thick mats are commonly designed by
the uniform (rigid) pressure method described below assuming undrained soil
conditions; however, the difference in material and construction expenses
saved by using a flexible analysis may be significant. Many structures,
especially I or 2 story buildings, are flexible or semi-flexible structures
supported on stiffened ribbed mats.
20. Uniform pressure method. Mats designed by this method satisfy two
criteria: the centroid of the area in contact with the soil should lie on the
line of action of resultant loads applied .o the soil, which promotes a
uniform pressure distribution, and the mat dimensions are selected so that the
allowable soil pressure is not exceeded. Mats should neither settle or tilt
excessively if these two criteria are satisfied. The allowable pressure
required to limit foundation settlement to within suitable values may be
estimated by applying factors of safety (FS) to the ultimate bearing capacity.
If the allowable pressure is less than the applied pressure or initial
estimates of total settlement exceed allowable settlement, then a compensated
mat or pile supported mat may be considered.
21. The structural design of mats by the American Concrete Institute
Ultimate Strength Method (ACI 318-80) usually results in a nonuniform linear
soil pressure distribution because column loads are multiplied by load factors
and the mat size should be increased to accommodate the larger service loads
specified by the building code9 . The uniform pressure method with an
illustrative example is described by Peck, Hanson, and Thornburn (1974).
22. Flexible method. Wrayl° documented 16 procedures applicable to
design of flexible mats. Of these methods the Post-Tensioning Institute11 and
the US Army Engineer Southwestern Division 12 pocedures are more commonly used
by designers. Flexible mat foundations may also be designed by soil-structure
interaction analysis using finite difference or finite element numerical
techniques. During the late 1970's, the Corps of Engineers designed and
constructed several military hospital foundations with thick mats such as the
Wilford Hall Hospital addition in Lackland Air Force Base, Texas, and the
gAmerican Concrete Institute 318-80, Section 17.31 Johnson 198811Post-Tensioning Institute 198012Hartman and James 1988
15
hospital in Fort Polk, Louisiana. The design of these mats used a finite
element computer program13 containing a hyperbolic stress-strain soil model to
better define foundation movements. This model is applicable to soil for
strains not exceeding the strain level at peak strengths. Program SLAB211 is
a two-dimensional plate on elastic foundation finite element program modified
to accommodate stiffening beams. Beam on Winkler foundation methods14,15 have
also been applied to design of flexible mats.
Current Limitations of Design
23. Soil input parameters. Advanced design methodology for mat
foundations such as plate on elastic foundation, beam on Winkler foundation,
and use of finite difference or finite element methods require thorough
geotechnical investigations to assist evaluation of reasonable values for soil
input parameters. These parameters include the elastic soil modulus and
Poisson's ratio for the plate on elastic foundation, coefficient of subgrade
reaction for a beam on a Winkler foundation, soil swell pressure, compression
and swell indices, depth of the active zone of heaving soil, and edge moisture
variation distance.
24. Adequate guidelines for evaluation of elastic soil modulus E andS
coefficient of subgrade reaction for a foundation ksf are not yet available.
Adequate estimates of kf required in the Winkler foundation is especially
difficult to provide because proper modeling of soil behavior requires at
least two parameters such as the elastic modulus and Poisson's ratio. Single
parameter models cannot properly calculate both displacements and bending
moments simultaneously 16,17. For example, an appropriate ksf for bending of
ribbed mat T-sections (the stiffening beam or web with some width of the flat
mat extending on each side of the stiffening beam, Figure lb) may be different
than that evaluated for settlement. The American Concrete Institute specifies
that for bending an effective T-section width S e L/4 where L is the spane
length; the effective overhang distance on each side of the web shall be less
than 1/2 the distance to the next web or stiffening beam and not exceed 8D
13Duncan amd Clough 197114Godden 1965
15Dawkins 198216Vesic 196117Vesic and Saxena 1968
16
where D is the thickness of the flat portion of the mat 8. This
implies that the effective support of the soil is provided within the width
S . Actual support of ribbed mats by the underlying soil is not known.e
25. Adequate guidelines for other soil parameters such as the active
depth for heaving soil Z and the edge moisture variation distance e area m
especially incomplete. Z is defined as the depth below which vertical soila
movements are insignificant. The amount of vertical soil strain that is
considered insignificant at depth Za is unknown, consequently Za is poorly
defined. e is the lateral distance beneath the mat from the mat perimeterm
subject to vertical movement from seasonal and long-term soil moisture
changes.
26. Advanced facilities. Mat foundations are being used more
frequently to support structures with functional requirements that limit the
acceptable differential movement. For example, warehouses and service centers
are becoming automated with robotic equipment that requires close tolerances
on vertical alignment and "superflat" floor slabs. Experience is still
limited concerning the toleration of this equipment to differential movement.
Facilities containing specialized machinery establish requirements for limited
differential movements. Technology does not yet exist that allows the
reliable prediction of foundation movements under the given structural loads
and soil conditions to the accuracy needed to assure "superflat" conditions.
Adequate guidelines do not exist that allow economic design of foundations
that can control deformations to within acceptable limits. The serviceability
of these new facilities may therefore be restricted by the performance of the
foundation.
Purpose and Scope
27. This report was prepared to provide guidelines for design and
construction of mat foundations with emphasis on ribbed mats in expansive
soil. A review of methodology, Part II, was initially completed as an aid in
determining useful methodologies and current design limitations. Case
histories of the performance of existing construction are discussed in Part
III to provide documentation leading to appropriate procedures for design. A
'8American Concrete Institute 318-80, Section 8.10.2
17
field study of a partially instrumented stiffened and ribbed mat described in
Part IV documents the actual performance of a ribbed mat under service
conditions. Guidelines for soil exploration, evaluation of soil input
parameters for design of ribbed mat foundations, a procedure developed by the
Southwestern Division of the Corps of Engineers for design of ribbed mat
foundations in expansive soil using these input parameters12 , and construction
methodology are described in Part V. Part VI concludes with recommendations
for future work to improve serviceability of permanent military facilities,
reduce requirements for design through ground modification or soil moisture
stabilization methods, and to reduce maintenance and repair costs.
28. The scope of this report excludes the design of mats on piles. A
study of methods for reducing foundation soil movements such as ground
modification or soil moisture stabilization is also excluded.
18
PART II: REVIEW OF METHODOLOGY
Introduction
29. Design is a multi-discipline area that includes functional,
aesthetic, geotechnical, structural, mechanical, and electrical
considerations. Consequently, a satisfactory design for a structure is
normally accomplished through cooperation between the owner, architect,
geotechnical engineer, structural engineer, and others. This review is
concerned only with those design functions necessary to analyze the
performance of the foundation and supporting soil.
30. Serviceability of the structure is approached in terms of the
expected total and differential foundation displacements and comparison with
the allowable movements. Ultimate bearing capacities of the foundation soil
normally do not control design because structural loads must be limited in
order to maintain displacements within allowable total and differential
movements. Allowable bearing capacities may be estimated from calculated
ultimate bearing capacities using factors of safety that have been shown to
maintain displacements within acceptable levels.
General Design Procedure
31. A general procedure for design of mat foundations is proposed in
Table 1. An initial function of the geotechnical engineer is to evaluate
different types of potentially applicable foundations and their relative
economy and performance compatible with the soil profile, step 1, and
structural requirements, step 2. Soil displacements, step 3, are estimated
from given structural loads as an aid in selection of a suitable foundation.
The most suitable foundation is subsequently determined in cooperation between
the geotechnical engineer, structural engineer, architect, construction
engineer, and the owner/operator. A mat may be selected if construction costs
compare favorably with other foundation types, expected displacements are
within structural limits, and expertise required for construction is locally
available. Other items impacting the decision may include construction time,
ease of construction, and ability to limit angular deformations or
architectural distress.
19
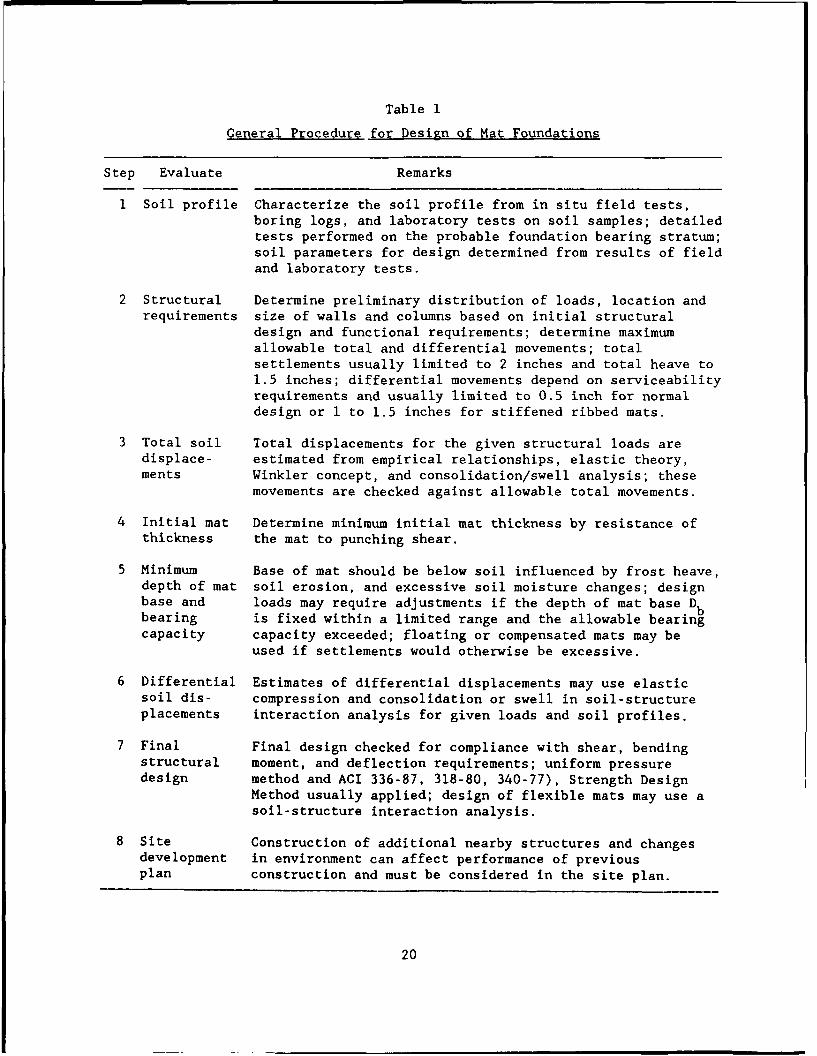
Table 1
General Procedure for Design of Mat Foundations
Step Evaluate Remarks
1 Soil profile Characterize the soil profile from in situ field tests,boring logs, and laboratory tests on soil samples; detailedtests performed on the probable foundation bearing stratum;soil parameters for design determined from results of fieldand laboratory tests.
2 Structural Determine preliminary distribution of loads, location andrequirements size of walls and columns based on initial structural
design and functional requirements; determine maximumallowable total and differential movements; totalsettlements usually limited to 2 inches and total heave to1.5 inches; differential movements depend on serviceabilityrequirements and usually limited to 0.5 inch for normaldesign or 1 to 1.5 inches for stiffened ribbed mats.
3 Total soil Total displacements for the given structural loads aredisplace- estimated from empirical relationships, elastic theory,ments Winkler concept, and consolidation/swell analysis; these
movements are checked against allowable total movements.
4 Initial mat Determine minimum initial mat thickness by resistance ofthickness the mat to punching shear.
5 Minimum Base of mat should be below soil influenced by frost heave,depth of mat soil erosion, and excessive soil moisture changes; designbase and loads may require adjustments if the depth of mat base Dbbearing is fixed within a limited range and the allowable bearingcapacity capacity exceeded; floating or compensated mats may be
used if settlements would otherwise be excessive.
6 Differential Estimates of differential displacements may use elasticsoil dis- compression and consolidation or swell in soil-structureplacements interaction analysis for given loads and soil profiles.
7 Final Final design checked for compliance with shear, bendingstructural moment, and deflection requirements; uniform pressuredesign method and ACI 336-87, 318-80, 340-77), Strength Design
Method usually applied; design of flexible mats may use asoil-structure interaction analysis.
8 Site Construction of additional nearby structures and changesdevelopment in environment can affect performance of previousplan construction and must be considered in the site plan.
20
32. An initial estimate of mat thickness required to support the
indicated loads is made when a mat foundation is considered, step 4. The
minimum or most appropriate depth of the foundation base, step 5, is then
selected based on the soil profile and functional requirements of the
structure. Soil displacements should be analyzed in detail for the indicated
structural loads and distribution of loads, step 6. If the allowable
settlements or bearing capacity are exceeded, then adjustments to the design
or foundation depth are indicated. The usual procedure for structural design
of mat foundations, step 7, is the uniform pressure method assuming linear
contact soil pressures. The last step should include a site development plan,
step 8, because construction of additional adjacent structures and changes in
soil conditions caused by the environment can influence the performance of
previous construction. Excavation and loads of the proposed facility may also
influence the performance of adjacent existing structures.
Soil Profile
33. Evaluation of soil parameters as a function of depth will permit
estimation of potential movements and bearing capacities for selected mat
dimensions and load distributions leading to an optimum foundation. A surface
examination of the sites selected for possible construction of the structure
should be conducted first followed by a subsurface soil sampling and testing
program to obtain suitable soil parameters required for selection of the
design and method of construction. Soil parameters should be plotted with
results of visual boring logs as a function of depth to evaluate the soil
profile.
34. Depth of exploration. The recommended depth of soil sampling is at
least twice the minimum width B of the mat foundation or the depth to
incompressible soil, whichever comes first. Greater exploration depths may
not be necessary because stress intensities imposed by the structure on the
foundation at these depths are about 10 percent or less of the loads applied
at the foundation level19 . Existence of soft layers beneath firm strata
should be checked since soft layers can lead to excessive displacements under
relatively small loads. In practice where primary geological formations, such
as those of unweathered and unfissured rock and dense shale, are encountered
'9Boussinesq 1885; Westergaard 1938
21
the depth of exploration is often not related to the size of the structure.
It may be sufficient to limit exploration to a depth that includes the
weathered and fissured materials and depths influenced by the effects of
construction. Consideration should be given to obtaining samples near the
proposed center, corner, and mid-edge of the structure. Details of surface
and subsurface exploration programs are available in EM 1110-2-1804,
"Geotechnical Investigations".
35. Field tests. In situ tests may be conducted to evaluate soil
strength and deformation behavior. These tests are suitable as an aid to
foundation design and construction, especially if undisturbed samples cannot
be easily obtained during sampling such as in strata containing cohesionless
soil. Field tests are often less costly than soil sampling and laboratory
testing programs. An important limitation of field tests is that they are not
a direct measure of soil parameters required for design, but are used to
estimate soil parameters through correlation factors. Correlation factors
vary substantially between types of soil; therefore, laboratory and different
types of field tests should be performed whenever possible to verify soil
parameters used for design. Some field tests appropriate for evaluation of
soil parameters useful to mat foundation design are outlined in Table 2.
36. Laboratory tests. Laboratory tests such as Atterberg limits are
initially performed on disturbed samples at relatively frequent depth
intervals (within 5 ft) to identify soil suitable as a bearing stratum.
Atterberg limits can be used to make a preliminary estimate of the relative
potential for soil volume changes5. Unconfined compression (UC) and
unconsolidated undrained (Q) tests will provide undrained parameters for
analysis of bearing capacity and undrained soil elastic modulus for estimates
of immediate displacements. UC tests may underestimate strengths because
confining pressures are not applied. Confining pressures for Q tests should
be on the order of in situ overburden pressures. Consolidated undrained tests
with pore pressure measurements (R), although not commonly performed on
cohesive soils, provide drained strength parameters for analysis of bearing
capacity and drained soil elastic moduli for estimates of long-term
displacements. One-dimensional (1D) consolidation and swell tests may be
performed to evaluate long-term consolidation and heave. Results of 1D tests
22

Table 2
Field Soil Tests Useful for Analysis ofPerformance of Mat Foundations
Test Application Advantages Disadvantages
Standard Bearing Data easily obtained during Numerous factorspenetration capacity, exploration using standard influence blowcountSPT (ASTM elastic soil split spoon sampler; useful such as variation inD 1586) modulus, and in soils difficult to drop height, inter-
settlement sample such as sands and ference with freesilts; inexpensive when fall, distortedperformed in association sampler, and failurewith sampling for labora- to seat sampler on
tory classification tests undisturbed soil
Cone Undrained Simulates shape of a pile Substantial scatterpenetration shear strength so tip and side friction in correlationsCPT (ASTM friction angle some function of same in between differentD 3441) elastic modulus pile foundations; soil soils; pore pressure
and bearing parameters usually multiple buildup duringcapacity for of tip resistance driving mayclays and sands influence readings
Pressure- Most soil Readings theoretically Requires carefullymeter PMT parameters for related with soil stiffness prepared borehole;(ASTM D clays, silts, useful in design of deep careful calibration4719) and sands foundations of device; more
costly than SPT orCPT; inconsistenciesin results common
Plate Plate Direct measure of k within Costly; must
loaddepth twice plate diameter; extrapolate to mat(ASTM subgrade useful to estimate elastic dimensions; resultsD 1194) reaction k not useful to depthsp soil modulus up to depths below twice plate
for any soil twice plate diameter diametediameter
Dilatometer Most soil Uses same pushing equipment Data depends on(Schmert- parameters for as CPT; elastic modulus small 1.1 mmmann 1986) clays, silts, theoretically related with motion of membrane;
and sands test data soil disturbancefrom pushing probemay influence data
23
may be corrected to three-dimensional behavior by using the Skempton and
Bjerrum procedure20 , but practical experience using one-dimensional analysis
7with normally consolidated soil indicates reasonable (± 50 percent) accuracy
Total Displacements
37. Settlement of foundations cause by applied loads on underlying soil
consists of elastic (immediate) and time dependent components
Pt I IPi + Ut'Pconj '5 jPfj (2a)
e - e
0 t (2b)eo0- e f
where
Pt - total settlement at time t, ft
Pi = immediate settlement, ft
Pcon - consolidation settlement, ft
Pf - long-term or final total settiemert, ft
U - consolidation ratf, at time tt
e - initial void ratio
e - void ratio at time t
e f long-term or final void ratio
These settlements are negative values, while heave is denoted as positive.
Immediate settlement occurs during placement of loads from elastic and
inelastic soil deformation without change in water content. Consolidation
settlement can be substantial in clays and occurs when pressures applied to
the soil exceed the preconsolidation stress in the soil. Consolidation
settlement is a result of volume reduction in the soil caused by expulsion of
pore water from the soil and may be evaluated by standard consolidation
analysis21 . If the stresses beneath the base of the mat do not exceed the
preconsolidation stress, then deformation will be limited to recompression
settlement. Some heave may occur if stresses in soil beneath the base of the
mat are significantly less than the actual swell pressure in the founding soil
system and free water is made available to the founding system.
2°Skempton and Bjerrum 195721Chapter 3, Engineer Manual 1110-1-1904, "Settlement Analysis"
24
38. Elastic settlement. Experimental data show that the immediate
settlement of foundation soil resembles that of an elastic, isotropic
solid 17'22 and may be calculated from Young's soil modulus Es and Poisson's
ratio ps' Poisson's ratio for soil usually varies from 0.25 to 0.49 with
saturated soils approaching 0.49. Reasonable overall values of Poisson's
ratio are 0.30 to 0.40. Calculation of elastic settlement is usually much
more sensitive to in situ variations in elastic modulus rather than errors in
estimating a value for js"
39. Typical values of elastic modulus are shown in Table 3. An
appropriate measure of E from laboratory consolidated-undrained triaxials
strength tests is the initial tangent modulus Eti - 1/a of the hyperbolic
model where a is the intercept of a plot of the ratio of strain/deviator
stress versus strain, Figure 323. The elastic modulus may also be taken as
Esec' the mean secant modulus at 1/2 of the undrained soil compression
strength, Figure 3a24. Table 4 summarizes some methods of estimating the
elastic modulus from in situ test resultrs. Initial elastic moduli such as
Et, or unload-reload moduli such ai from the PMT, Table 4, often better
simulate stiffness of su, . ...ah mat foundations because earth pressures are
usually small. Soil disturbance may also cause low estimates of elastic
modulus from test data. E should be evaluated by several methods whenevers
possible such as those described in Table 4, particularly for important
structures.
40. The average immediate settlement of a foundation on an elastic soil
may be given by the improved Jambu approximation25
qo 1P i 1A " o 'A i " ( 3 )
E*s
where
Po -influence factor for depth D of foundation below
ground surface, Figure 4
Ali influence factor for foundation shape, Figure 4
22p ickett and Ray 195123 Duncan and Chang 197024 Skempton 195125 Christian and Carrier 1978
25
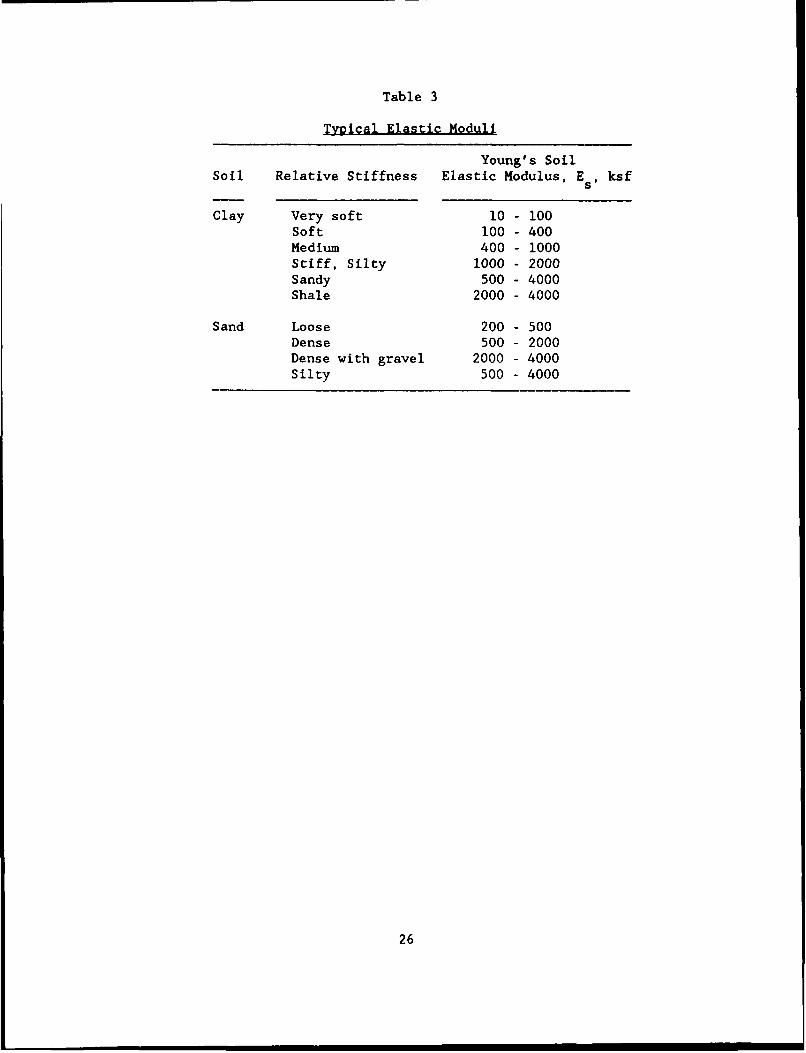
Table 3
Typical Elastic Moduli
Young's SoilSoil Relative Stiffness Elastic Modulus, Es, ksf
Clay Very soft 10 - 100Soft 100 - 400Medium 400 - 1000Stiff, Silty 1000 - 2000Sandy 500 - 4000Shale 2000 - 4000
Sand Loose 200 - 500Dense 500 - 2000Dense with gravel 2000 - 4000Silty 500 - 4000
26
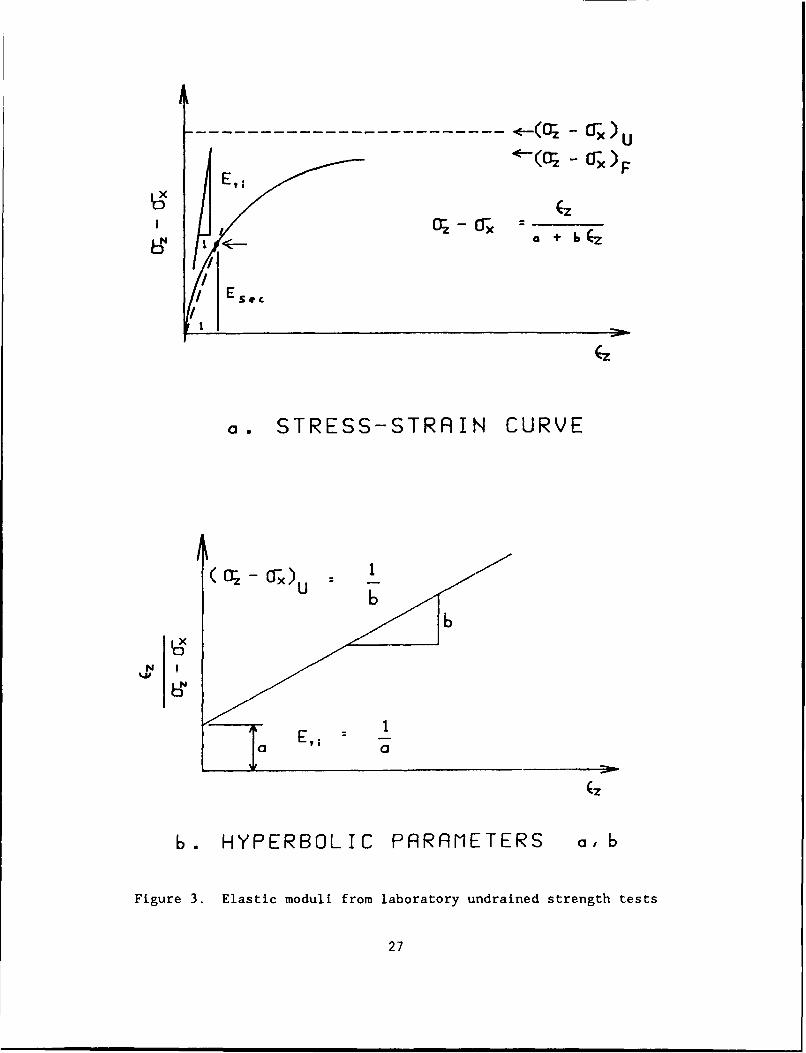
- ---- ---- ---- --- - * ( G Z - C F ) u
l (C-r -- -
Icr-- ° j~ + 6 (
a. STRESS-STRAIN CURVE
6b
N !
b. HYPERBOLIC PARAMETERS a,b
Figure 3. Elastic moduli from laboratory undrained strength tests
27
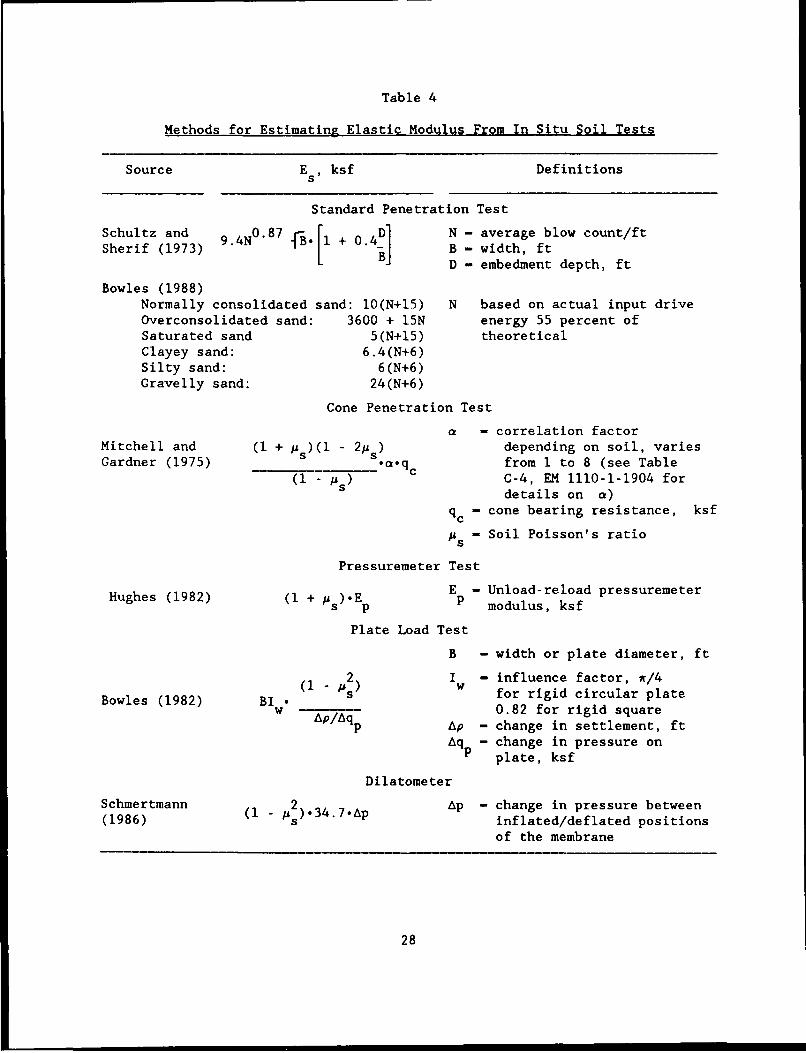
Table 4
Methods for Estimating Elastic Modulus From In Situ Soil Tests
Source E , ksf Definitions
Standard Penetration Test
Schultz and 9.4N0 . 8 7 B.[I + 0.4_ ] N - average blow count/ftSherif (1973) 0 B - width, ft
I BD - embedment depth, ft
Bowles (1988)Normally consolidated sand: 10(N+15) N based on actual input driveOverconsolidated sand: 3600 + 15N energy 55 percent ofSaturated sand 5(N+15) theoreticalClayey sand: 6.4(N+6)Silty sand: 6(N+6)Gravelly sand: 24(N+6)
Cone Penetration Test
S- correlation factorMitchell and (I + 's )(l - 2j ) depending on soil, variesGardner (1975) "_'q c from I to 8 (see Table
(I - AS) C-4, EM 1110-1-1904 fordetails on a)
qc - cone bearing resistance, ksf
A - Soil Poisson's ratio
Pressuremeter Test
Hughes (1982) (1 + ))E E - Unload-reload pressuremeterp modulus, ksf
Plate Load Test
B - width or plate diameter, ft
2 I w - influence factor, w/4(1 8) ) w for rigid circular plateB (1982 B0.82 for rigid square
Ap Ap - change in settlement, ft
Aq -change in pressure onP plate, ksf
Dilatometer
Schmertmann 2 Ap - change in pressure between(1986) (1 - As) 34 .7.Ap inflated/deflated positions
of the membrane
28
0
°0 5 10 15 20
D/B
L/B =oo L/B -- 10
,_ . . ..... L/ B 2 .
CICL
0 I I l ll[ I I I l l lJ I I ! I I I f I lI J i ll
101 1 10 10 2 lo 3
H/B
qo*B
Pi - -/ O'l "
s
qo - CONTACT PRESSURE, KIPS
L - LENGTH, FT
B - WIDTH, FTE* = YOUNG'S SOIL MODULUS, KSF
s
Figure 4. Chart for estimating immediate settlement in cohesive soil.Reprinted by permission of the National Research Council of Canada from the
Canadian Geotechnical Jouirnal, Vol 15, 1978, "Janbu, Bjerrum, and Kjaernsli'sChart Reinterpreted", by J. T. Christian and W. D. Carrier III, p 127
29
q 0 bearing pressure, ksf
E - equivalent Young's modulus of the soil, ksfs
Comparison of test calculations and results of finite element analysis have
indicated errors from Equation 3 usually less than 10 percent and always less
than 20 percent for H/B between 0.3 and 10, L/B between 1 and 5, and D/B
between 0.3 and 3, Figure 425. Reasonable results are given in most cases
when p is set equal to unity.
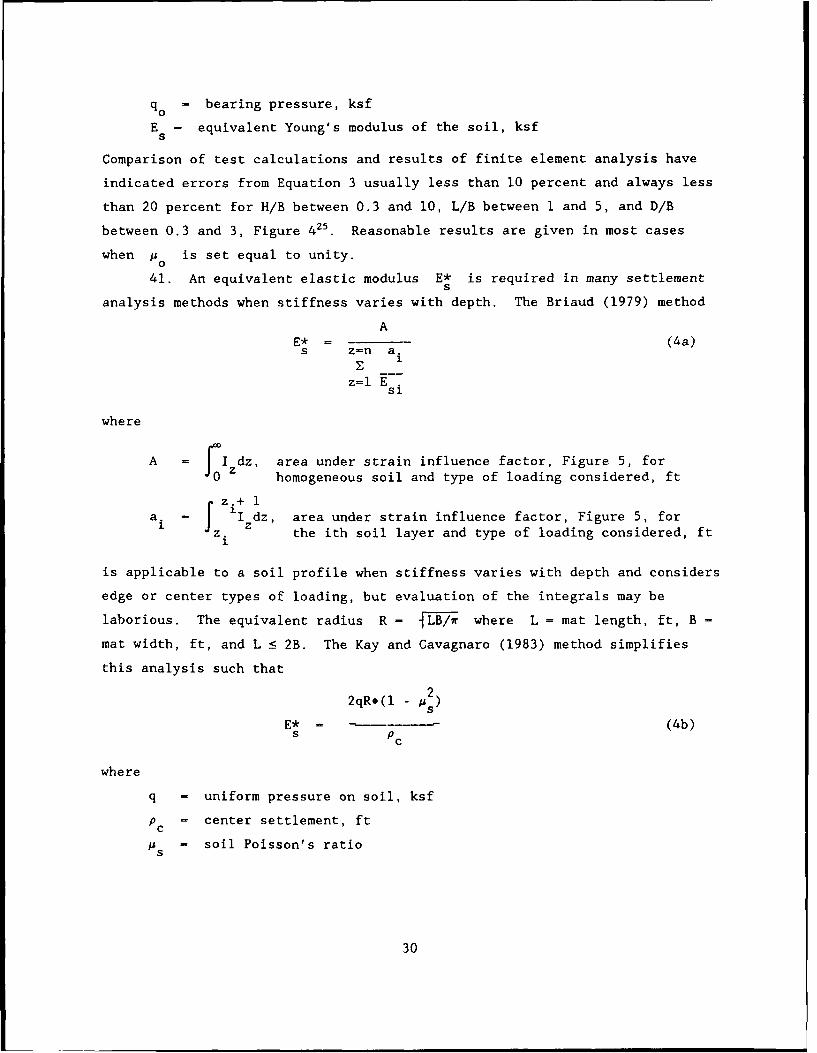
41. An equivalent elastic modulus E* is required in many settlements
analysis methods when stiffness varies with depth. The Briaud (1979) method
AE* - (4a)s z=n a.
z=l Esi
where
A rIzdZ, area under strain influence factor, Figure 5, forj 0 homogeneous soil and type of loading considered, ft
a. j= lzdz, area under strain influence factor, Figure 5, forz. the ith soil layer and type of loading considered, ft1
is applicable to a soil profile when stiffness varies with depth and considers
edge or center types of loading, but evaluation of the integrals may be
laborious. The equivalent radius R - LB/r where L = mat length, ft, B -
mat width, ft, and L : 2B. The Kay and Cavagnaro (1983) method simplifies
this analysis such that
2qRo(l - u)
E* -- (4b)s PC
where
q - uniform pressure on soil, ksf
p = center settlement, ft
As - soil Poisson's ratio
30
0.0 0.2 0.4 0.6 0.8 1.0 0.0 0.2 0.4
~.-0.5 .4 .2 p.-0.5 .2I IT "
N
<~' U- L O -
I
I I/
I e
COCD CD CO
n r
0)M a) __ _D_0
0~ 0.2 0.4 0.6 0.8 1 .0' 0. 0.2 0.4
Figure 5. Influence factors I Cfor center and I efor edge settlement
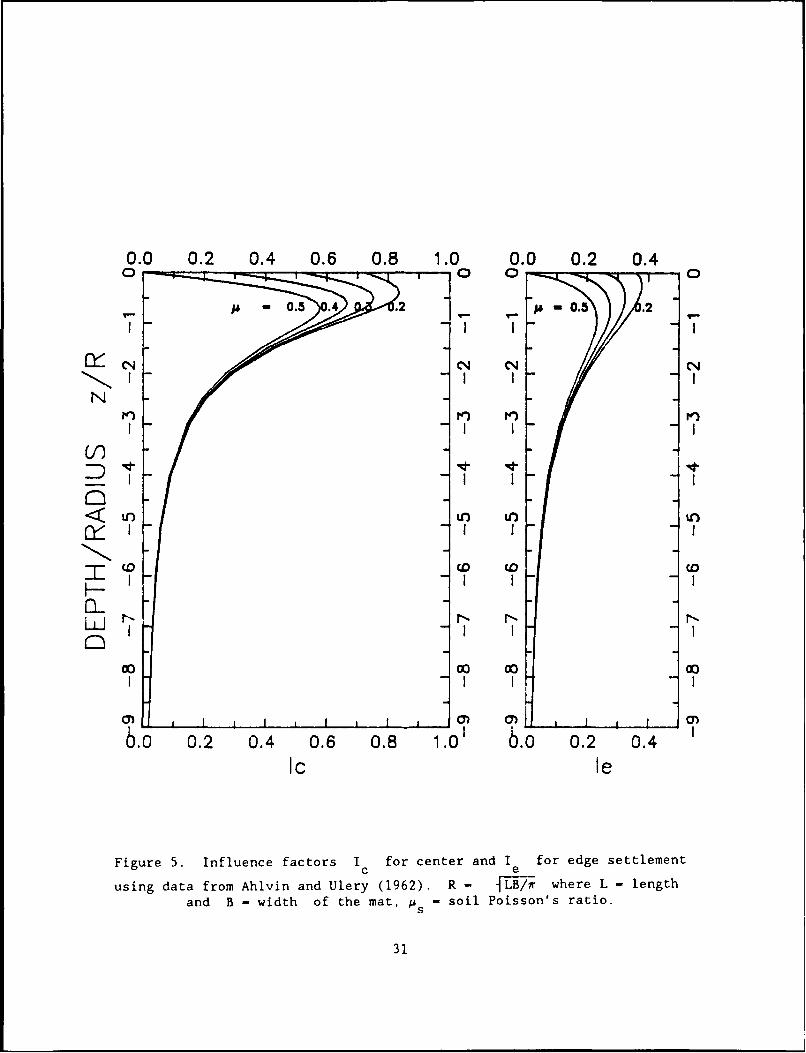
using data from Ahivin and Ulery (1962). R - {tLB/ where L - lengthand B - width of the mat, ps - soil Poisson's ratio.
31
The center settlement may be calculated for a uniform pressure q as
discussed later in paragraph 68. If the elastic modulus increases linearly
with depth, then from Appendix A
2kR(I - )s
E* - (4c)s 0.7 + (2 .3 -4 , S)log n
where
k - constant relating E with depth z, ksf/fts
E - Young's elastic soil modulus, E + kz, ksfs o
E - initial elastic soil modulus at the ground surface, ksf0
n - kR/(E + kDb)
Db - depth of mat below ground surface, ft
Equation 4c is applicable to a mat with base at depth Db and the soil at
depths greater than 2B is incompressible. The Gibson model (1967)
BkE* - - (4d)
S 2
is applicable for elastic moduli increasing linearly with depth from zero at
the ;ound surface for the mat base at the ground surface,
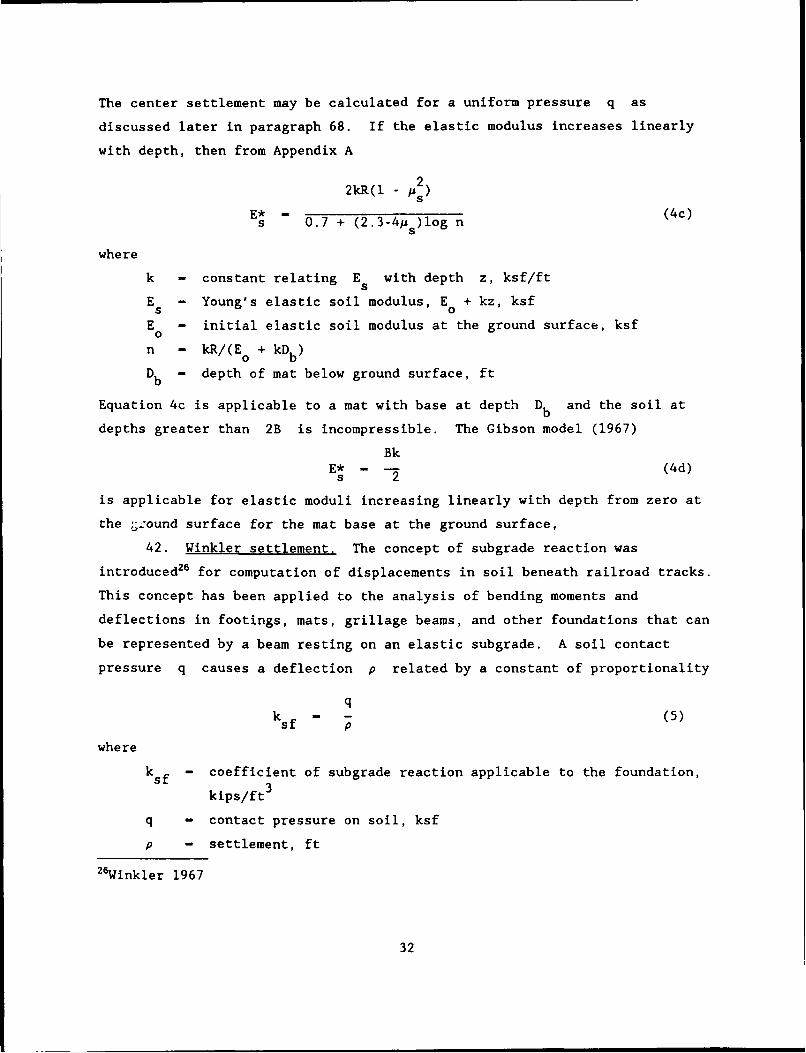
42. Winkler settlement, The concept of subgrade reaction was
introduced26 for computation of displacements in soil beneath railroad tracks.
This concept has been applied to the analysis of bending moments and
deflections in footings, mats, grillage beams, and other foundations that can
be represented by a beam resting on an elastic subgrade. A soil contact
pressure q causes a deflection p related by a constant of proportionality
qk - - (5)
Sf p
where
ksf - coefficient of subgrade reaction applicable to the foundation,
kips/ft3
q - contact pressure on soil, ksf
p - settlement, ft
26Winkler 1967
32

Each point behaves independently of any other as though the supporting soil is
a fluid. Stress and strain computations are more easily and economically
accomplished using the Winkler hypothesis than elastic theory. Displacements
and bending moments in mats may be estimated from influence charts22 for given
loading pressure, mat characteristics, and the coefficient of subgrade
reaction. Theoretical and experimental investigations have shown that the
Winkler hypothesis is generally not satisfied except for beams of infinite
length such as railroad ballast, roads, and embankments resting on a semi-
infinite elastic subgrade. Appropriate values of ksf are not easily
determined because they are not unique depending on the location in the mat,
mat size and depth of base, and whether bending moments or displacements are
being determined 17 . Little is known on how k sf varies across the mat.
43. Terzaghi's experience (1955) indicates that for long beams or
continuous footings on the ground surface
(S+l)2
Sands: ksfo - k sp* 2S (6a)
Clays: ksf ° - k spo5S (6b)
where
k sf° - coefficient of subgrade reaction at the ground surface beneaththe footing, ksf/ft
k - coefficient of subgrade reaction of 1-ft by 1-ft plate orbeam 1-ft wide at the ground surface, ksf/ft
S - spacing of column or line loads on mat, ft
Table 5 provides some values of k for sands and clays if plate load testssp
are not performed. If loads are applied to the mat by columns, then the
influence of these loads becomes less with increasing distance from the
columns. The maximum length of influence is about 7D where D is the mat
thickness, ft27 . S is therefore : 7D for locally applied loads. If the
footings are in sand with the base below the ground surface, then28
ksf - ksfo (1 + 2Db/B)1/ 2 (7a)
27Terzaghi 195528Ramasamy, Rao, and Prakash 1982
33
Table 5
Empirical Estimates of plate coefficientof Subgrade Reaction
27
Sand Clay
Relative ksp , ksf/ft Undrained k____________Shear sp'Density Consistency Strength, ksf ksf/ft
Dry/Moist Submerged
Loose 80 50 Stiff 1 - 2 150Medium 260 160 Very Stiff 2 - 4 300Dense 1000 600 Hard > 4 600
11/2k - k (1+Ko0) (1+2D b/B )1/2bsf kfz [1+2K 40D z/B) 7
where
ksf z 'Oefficient of subgrade reaction at depth Dz, ksf/ft
Db embedment depth, ft
K 0 coefficient of earth pressure at rest
B - footing width, ft
44. kf may also be estimated from elasticity theory by substituting
Equation 3 into Equation 5 to give
E*kf - s
k0 IB (8a)
where y0 and yi are found from Figure 4. Vesic and Saxena (1968) had
performed parametric analysis that indicated good correlations with bending
moments for
3EE* Eb
.sfm 2 (8b)E k( - ps)D
where
34
k sfm - coefficient of subgrade reaction consistent with bendingmoments, ksf/ft
E - elastic modulus of concrete, ksfc
D - mat thickness, ft
Equation 8b must be divided by 2.4 to obtain good correlation with
displacements17 . The Winkler foundation does not provide unique values of
ksf for both calculation of bending moments and displacements for mat
foundations. If the coefficient of compressibility is known, then 29
1
ksf - fm S (9)v
where
f - factor from 0.5 to 1
m - coefficient of compressibility, ksf 1
The coefficient of compressibility may be estimated from in situ dilatometer
DMT tests or laboratory consolidation tests on undisturbed specimens.
45. A comparison of Equations 6b, 8a and 8b for a concrete mat of depth
D - I ft on a medium stiff clay with Es - 400 ksf, As - 0.33, Ec - 432,000
ksf, B - spacing of loads - 25 ft is shown as follows:
Equation Coefficient of Subgrade Reaction ksf, ksf/ft
6b 14.3 ksf/ft8a 16.7 ksf/ft8b 43.8 ksf/ft
For Equation 6b, ksf is assumed to be about 150 ksf/ft and S - 7D or 7 ft.
For Equation 8a, the length to width ratio L/B is assumed 2 so that Al -
0.96, Figure 4, and po is assumed unity. The result of Equation 8b is valid
for a comparison of bending moments. Dividing results of Equation 8b by 2.4
is 18.2 ksf/ft, which is consistent with results of Equations 6b and 8a.
Initial Mat Thickness
46. Thickness and reinforced steel requirements of mat foundations
depend on applied loads and differential movements in the supporting
"Yong 1960
35

foundation soil. Applied loads should be arranged to cause a uniform pressure
on thp underlying foundation soil thereby reducing differential movement. A
uniform distribution of pressure on the soil occurs when corner Q C edge Qey
and interior Qi column loads are in the ratio of 1 to 2 to 4; e.g., Qc -
Qi/4 and Qe - Qi/2. Corners and edges of structures will nearly always have
wall loads added to the floor loads, which can be accommodated to make a
uniform pressure distribution, if necessary, by widening the mat beyond the
limits of the superstructure. The total edge load Qe at perimeter walls
relative to the interior required to maintain uniform soil pressure also
depends on the deck framing system. In order to avoid secondary moments in
the mat, perimeter wall loads should be about 1/3 of the first interior column
load and 3/8 of the next interior column load.
47. The initial mat thickness is evaluated to resist punching shear
based on principles of statics. The force on the critical shear section of
the concrete is equal to the force on the mat beyond the shear section caused
by the soil pressure. The soil reaction pressure is assumed uniform. The
critical shear section for diagonal tension failure is assumed to intersect at
the base of the slab a distance d/2 from the face of a column support where
d is the effective depth measured to the center of gravity of the
reinforcement steel. This is the depth required to satisfy shear30 .
Perimeter and interior load bearing (shear) walls are checked for wide-beam
shear at a distance d from the wall face'.
48. The total mat thickness D required, after steel reinforcement is
added to satisfy bending moments, isi
D - d + db + Cover (10)
where
d - depth to satisfy shear, ft
db - distance from center of gravity of reinforcing steel to thebottom edge of the reinforcing steel (bar diameter/2), ft
Cover - 3 inches for reinforced concrete cast against and permanentlyin contact with ground; otherwise, 2 inches for No. 6 bars orlarger and 1.5 inches for No. 5 bars and smaller
31
30ACI Committee 340-7731ACI Committee 318-80, Section 7.7.1
36
Reinforcement steel should not be added only to reduce mat thickness because
the smaller thickness reduces rigidity. Reduced rigidity tends to localize
column and wall loads instead of spreading them as assumed in rigid
(conventional) design based on a linear soil pressure distribution. A good
initial estimate of mat thickness may be found from Seelye (1956) which
contains tables relating soil bearing pressures, column loads, concrete
compressive strength, and 20 ksi reinforcement steel with the thickness of
square column footings; however, yield strength of reinforcement steel
currently used is often 60 ksi.
49. Column shear resistance. Equations 11 in Table 6 show the required
thickness d to satisfy punching shear requirements for interior, edge, and
corner column and floor loads that cause a uniform soil pressure q'. The
shear strength v provided by concrete in diagonal tension for ultimatec
strength design USD is32
vc - 4. f;c .0.144 (12)
where
v - concrete shear strength, ksf
f'c - concrete compressive strength, psi
= workmanship factor for shear, 0.85
The factor 0.144 converts from psi to ksf. vc - 26.8 ksf for 3000 psi
concrete. Steel will be required to satisfy bending in the longitudinal
direction33
M - S.A .f d - a] (13a)u s 2
a' = A f /(0.85.f'c.b') (13b)s y
where
M - bending moment per width of strip, in-lbu .2
A - area steel per width of strip, ins
d - effective mat thickness, inches
f - yield strength of steel reinforcement, psiY
b' - width of strip, usually 12 inches
32ACI Committee 318-80, Section 11.10.333ACI Committee 318-80, Section 7.13
37
Table 6
Required Thickness to Resist Punching Shear
DiagramLocation P Equations
Plan Section
Interior For equilibrium:
4v cd(a + d) - q'S2
- (a + d)2
+ S (3ea + 2 F2q--S2
d = (1a)a +d e*
Edge - " d For equilibrium (0 5 b 5 d/2):
-- -- -[2(b+a+ d + (a+d)]d q' ~4f -(a+d)(b+a+ d)]
b + S 2 +d -(b+ 3 )e + [fb+ 3) e] 2+ 2q a* f~ - a(a+bl
I 2 vcb+a+d/2 c d-e lb
- ---- ---- ------------ -- -- - ubf
Corner For equilibrium (0 5 b 5 d/2):
-- b+a+d/2 c b - q[safd - (b+a+_)2]
b
+ ~ +a + d /22-2(a+b)e + 2C4La+b)J2 + q'.*.*2 -(a+b) 2]aj + c _
d/21 d = (1c)
b 4
Notation: a - column width, ft
b - distance column from edge/corner, ftd effective depth of mat, ftS = column spacing, ftVc - concrete shear strength, kaf
q' - soil pressure resisting punching shear, ksfe = 2 + q'Iv c
a* - 4 + q'/v c
f - b + (a+S)/2
38
Equations 11 foi typical column widths a of 1 to 4 ft, column spacings of 10
to 30 ft, and distance b from the edge/corner of 1 ft indicate that the
thickness of concrete mats may be 7 percent less at the edge and 20 percent
less at the corner than in the interior of the mat.
50. Wall punching resistance. The mat thickness required to resist
wide-beam shear for reinforced concrete walls and an applied uniform soil
pressure q' is
q-- (S - a)
d - c (14a)q
1+ -v
c
where
vc - 2. fT7F .0.144 ksf 34; note that this is 1/2 the resistancepermitted for columns
d - effective depth, ft
a - wall thickness, ft
S - wall spacing, ft
ff- workmanship factor for shear, 0.85
For masonry walls,
d- c (14b)
qI1+ -
c
The concrete shear strength v = - 13.41 ksf for 3000 psi concrete. Equations
14 were developed similar to those in Table 6
51. Figure 6 illustrates the trend in mat thickness d required to
resist punching shear for interior 25-ft column spacings based on Equation llb
for applied uniform soil pressures qm' of 0.1, 0.2, and 0.4 ksf/story. qm'
is the average pressure per story and equal to q'/Ns where Ns is the number
of stories. Figure 6 also shows the distribution of mat thickness d
34Uniform Strength Design method ACI Committee 318-80, Section 11.10.la35after method of Bowles 1982
39
0 2 4 6 8 10I I I j
Cf)0 = 0.4 KSF* FOCHT 0O/ ET AL -u)Z 1978
=0.2 KSF /
0/)o EDITOR 0I CONST // NEWSrY' / 1981
0 qm' =0.1 KSFI-0 / FRASER 1975 0
C) / /BOBEEL */HOOF'ER 1981
/ & WOOD // 1977 /0 c 0
/?OLU Oy/"/*198 /** FRAS R 1975
LI / / WIN R 1974
M FRS &kSTR AN 1978 O
/ / 197
S / //C COLUMNSz / / -SHEAR WALLS-
0 I I I I 0
0 2 4 6 8 10
MAT THICKNESS D, FT
Figure 6. Number of stories for buildings versus thickness of mat
40
required to support shear walls as a function of the number of stories from
Equation 14a assuming a 1-ft wall thickness, 25-ft wall spacing, and uniform
soil pressure qm' of 0.1, 0.2, and 0.4 ksf/story using 3000 psi concrete.
Thicker walls only slightly reduce the required mat thickness. About 0.3 ft
should be added to the calculated required thickness d to obtain the total
mat thickness D. The column width a was assumed to increase in proportion
with the number of stories; i.e., a - 1, 2, and 4 ft for Ns - 3, 12, and 50
stories, respectively.
52. Figure 6 illustrates that the thickness of the 8.25-ft thick mat of
the One Shell Plaza building with soil pressure of 0.4 ksf/story36 is only
0.5-ft greater than that calculated for qm' - 0.4 ksf/story. A calculated
soil pressure of 0.2 ksf/story is consistent with the observed 0.18 ksf/story
given for the 7 story frame structure37 . A calculated soil pressure of 0.3
ksf/story is also consistent with the observed 0.3 to 0.4 ksf/story for an 11
story hospital38 . The 0.24 ksf/story pressure observed on the 3-ft mat of the
22 story residential building39 is a little high for punching resistance only
to column loads with a column spacing of 25 ft and indicates that some load
may be carried through the walls or column spacing is less than 25 ft.
Minimum Depth of Foundation
53. A stratum selected to support the foundation and superstructure
depends on functional requirements of the structure, locally existing practice
for determining foundation depths necessary to avoid frost heave, soil
erosion, soil moisture changes, and depths at which the soil bearing capacity
is sufficiently large to support the structure. The depth of thin slabs for
light structures is often above grade and on fill, unless a basement is
required. Thin mats therefore often have distortion problems from soil
foundations with 25-ft column spacing when punching shear controls design
movements as a result of seasonal and long-term moisture changes in the soil
beneath and near the perimeter of the mat. Mats constructed in excavations
are subject to distortions caused by rebound of underlying soil, installation
of utilities, and other construction effects. Thin mats subject to
36Focht, et al 197837Wardle and Fraser (1975a)38Stroman 19783 Hooper and Wood 1977
41
distortion 9 > 1/500 are often designed with ribs or crossbeams to provide
the stiffness necessary to maintain differential displacements within
functional requirements.
54. Stresses applied to supporting foundation soil should be limited to
maintain settlements within levels tolerated by the structure and to optimize
functional usefulness. Soil pressure should therefore be less than the
precompression stress to avoid consolidation settlement and commonly limited
to a value denoted as the allowable bearing capacity. The allowable bearing
capacity is usually given so that settlement is about 1 inch. Evaluation of
the allowable bearing capacity requires determination of the ultimate bearing
capacity, increase in stress intensity in soil beneath the base of the
foundation through any compressible soil layer subject to the applied loads,
and guidelines for estimating appropriate factors of safety FS. Stress
distributions in soil beneath foundations may be found by methodology in
Appendix B, EM 1110-1-1904.
55. Ultimate bearing capacity. Mat foundations are required to be
stable against a deep shear failure, which may cause rotation or a vertical
punching failure. One of the first equations for estimating the vertical
stress required to cause a shear failure is40
qu 1.3cN + 0.47'B N + qo Nq (15a)
wherequ - ultimate bearing capacity, ksf
c - cohesion or undrained shear strength C , ksf
N - dimensionless bearing capacity factor for cohesionc
I' - effective unit soil weight, kips/ft3
B - mat width, ft
N - dimensionless bearing capacity factor for surcharge
qo - pressure applied to the soil at the mat base, ksfN - dimensionless bearing capacity factor for frictionq
Improvements to determining ultimate bearing capacity accounting for
foundation rigidity and shape, inclined and eccentric loading, base tilt and
depth, and slope at the ground surface led to41
4°Terzaghi 194341Hansen 1961, 1970
42
- Nc 6 c + BI'N 7 6 + 7'D b Nq 6q (15b)
where
Db - depth of mat base beneath the ground surface, ft
Nc) N , Nq - dimensionless bearing capacity factors
6c, 6 , 6q - dimensionless adjustment factors
Data from Milovic (1965) and Muhs (1959) indicate excellent agreiment of
bearing capacities with Equation 15b. For cases where bearing capacity may be
critical such as in soft, cohesive soil, Equation 15a calculates an ultimate
bearing capacity qu - 6.68c, while Equation 15b with modifications to account
for soil compressibility42 calculates q - 6.36c. The ultimate bearing
capacity appears to be at least 6C for practical applications where C isu u
the average undrained shear strength in the bearing stratum.
56. Allowable capacity using factors of safety. Limiting soil
pressures to the allowable bearing capacity is useful to limit settlements
tolerated by the structure. Experience has shown that allowable bearing
pressure q a can often be evaluated using factors of safety applied to the
ultimate capacity
q u - (16a)FS
where FS = 2 or 3 are usually used for limiting settlements to less than 2
inches in cohesionless and cohesive soils', respectively. Table 7 illustrates
some methods of using results of field tests for estimating allowable bearing
capacity and limiting settlement to 1 inch. These methods may be applied to
estimating q a of soil beneath stiffening beams of ribbed mats or footings
supporting column loads. The plate load test is not included because
extrapolation of results to mats is not reliable for B > 3 times the plate
width.
57. Factors of safety applicable to applied uniform pressures on mats
are variable and usually greater than 3 for limiting elastic settlements to
less than I inch. If settlement p is to be limited to about 1 inch, then
substituting Equation 16a into Equation 3 of the theory of elasticity and
assuming qo " qa and qu - 6Cu leads to
42Vesic 1975
43
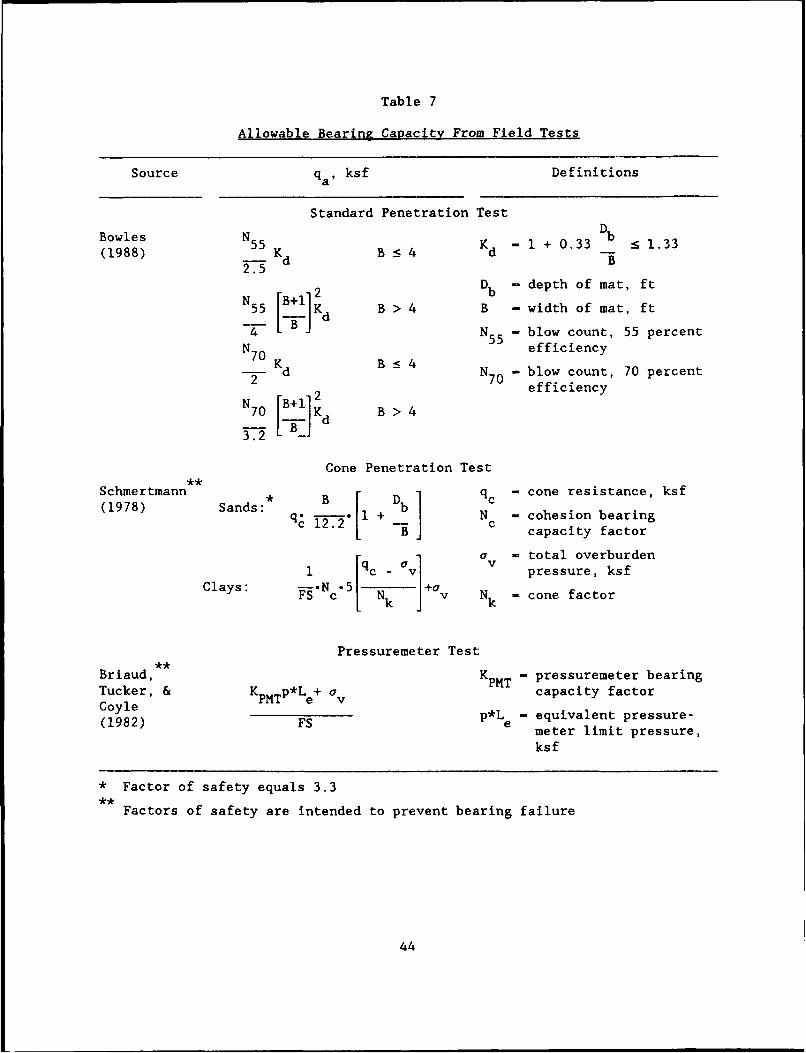
Table 7
Allowable Bearing Capacity From Field Tests
Source q ksf Definitions
Standard Penetration Test
Bowles N5 5 K -1+ 0.33 Db <133(1988) K B 4 d -
2.5
N Bi 2 Db - depth of mat, ftN5 5 [B+IIKd B > 4 B - width of mat, ft
- LB N55 - blow count, 55 percent
N7 0 efficiency
-2 d N70 - blow count, 70 percent
N B+ 2 efficiency
N70[ K d B> 4
Cone Penetration Test
Schmertmann * B D I qc - cone resistance, ksf(1978) Sands: q 122" 1 + bN C- cohesion bearing
•L. -B c capacity factor
a, a - total overburdenqc av pressure, ksf
Clays: F-sNc" 5 Nk +av Nk - cone factor
Pressuremeter Test
Briaud, KPMT - pressuremeter bearingTucker, & KPMTP*Le+ a v capacity factorCoyle p*L - equivalent pressure-(1982) FS e meter limit pressure,
ksf
• Factor of safety equals 3.3
Factors of safety are intended to prevent bearing failure
44
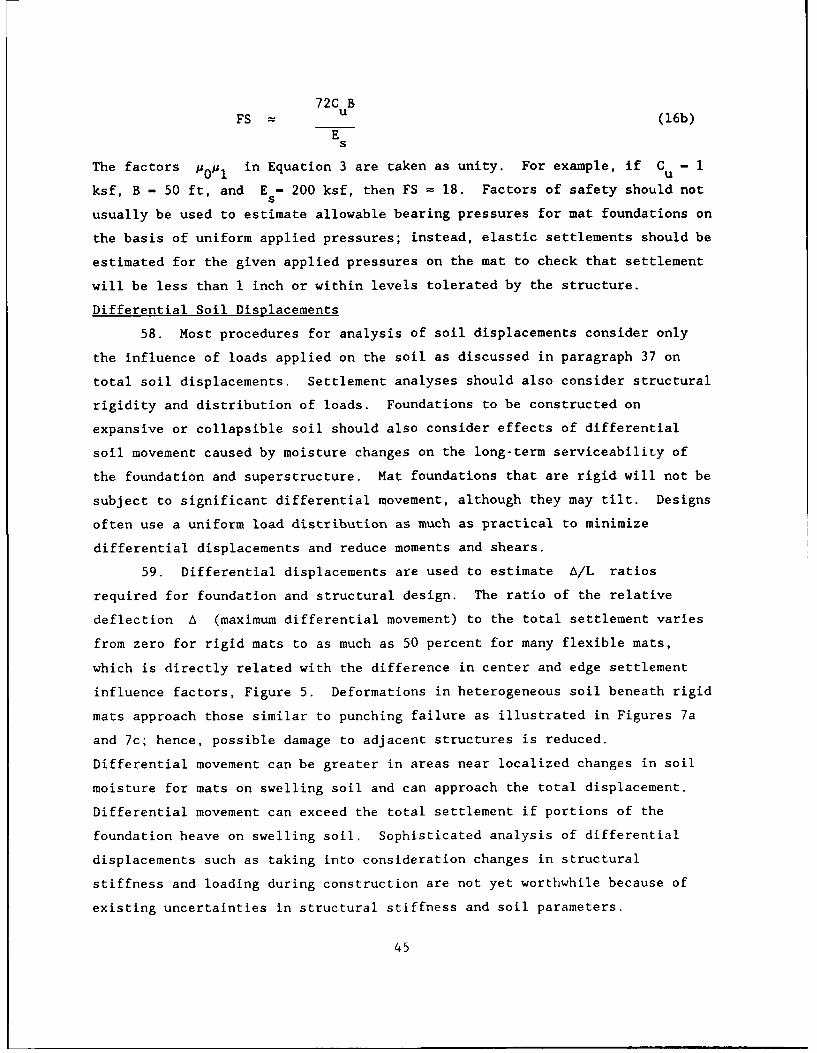
72C BFS u (16b)
Es
The factors pop, in Equation 3 are taken as unity. For example, if Cu - 1
ksf, B - 50 ft, and E - 200 ksf, then FS = 18. Factors of safety should not
usually be used to estimate allowable bearing pressures for mat foundations on
the basis of uniform applied pressures; instead, elastic settlements should be
estimated for the given applied pressures on the mat to check that settlement
will be less than 1 inch or within levels tolerated by the structure.
Differential Soil Displacements
58. Most procedures for analysis of soil displacements consider only
the influence of loads applied on the soil as discussed in paragraph 37 on
total soil displacements. Settlement analyses should also consider structural
rigidity and distribution of loads. Foundations to be constructed on
expansive or collapsible soil should also consider effects of differential
soil movement caused by moisture changes on the long-term serviceability of
the foundation and superstructure. Mat foundations that are rigid will not be
subject to significant differential movement, although they may tilt. Designs
often use a uniform load distribution as much as practical to minimize
differential displacements and reduce moments and shears.
59. Differential displacements are used to estimate A/L ratios
required for foundation and structural design. The ratio of the relative
deflection A (maximum differential movement) to the total settlement varies
from zero for rigid mats to as much as 50 percent for many flexible mats,
which is directly related with the difference in center and edge settlement
influence factors, Figure 5. Deformations in heterogeneous soil beneath rigid
mats approach those similar to punching failure as illustrated in Figures 7a
and 7c; hence, possible damage to adjacent structures is reduced.
Differential movement can be greater in areas near localized changes in soil
moisture for mats on swelling soil and can approach the total displacement.
Differential movement can exceed the total settlement if portions of the
foundation heave on swelling soil. Sophisticated analysis of differential
displacements such as taking into consideration changes in structural
stiffness and loading during construction are not yet worthwhile because of
existing uncertainties in structural stiffness and soil parameters.
45
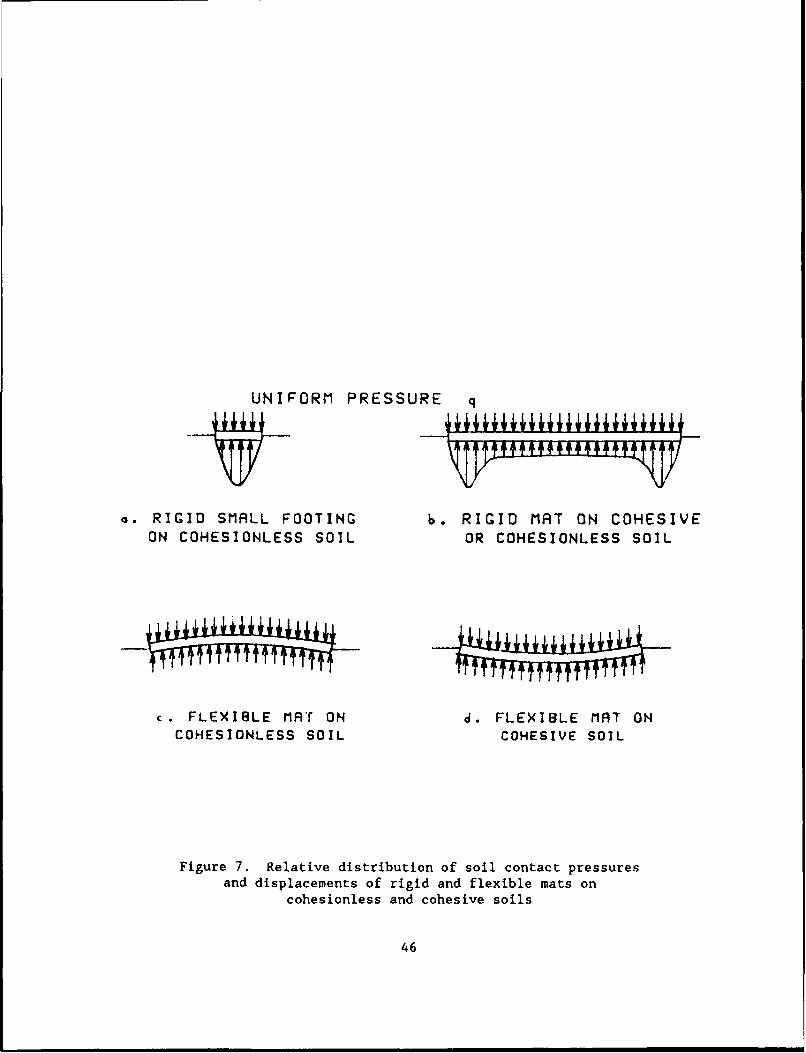
UNIFORM PRESSURE q
a. RIGID SMALL FOOTING b. RIGID MAT ON COHESIVEON COHESIONLESS SOIL OR COHESIONLESS SOIL
c. FLEXIBLE MAT ON J. FLEXIBLE MAT ONCOHESIONLESS SOIL COHESIVE SOIL
Figure 7. Relative distribution of soil contact pressuresand displacements of rigid and flexible mats on
cohesionless and cohesive soils
46
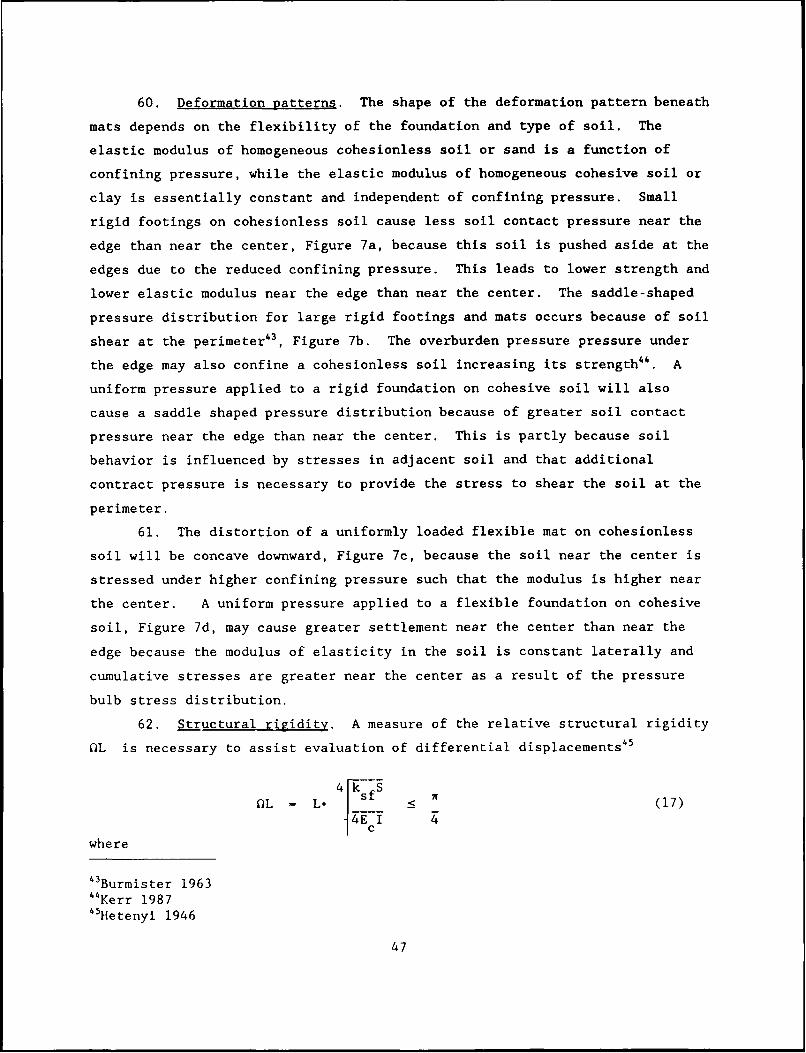
60. Deformation patterns. The shape of the deformation pattern beneath
mats depends on the flexibility of the foundation and type of soil. The
elastic modulus of homogeneous cohesionless soil or sand is a function of
confining pressure, while the elastic modulus of homogeneous cohesive soil or
clay is essentially constant and independent of confining pressure. Small
rigid footings on cohesionless soil cause less soil contact pressure near the
edge than near the center, Figure 7a, because this soil is pushed aside at the
edges due to the reduced confining pressure. This leads to lower strength and
lower elastic modulus near the edge than near the center. The saddle-shaped
pressure distribution for large rigid footings and mats occurs because of soil
shear at the perimeter43, Figure 7b. The overburden pressure pressure under
the edge may also confine a cohesionless soil increasing its strength44. A
uniform pressure applied to a rigid foundation on cohesive soil will also
cause a saddle shaped pressure distribution because of greater soil contact
pressure near the edge than near the center. This is partly because soil
behavior is influenced by stresses in adjacent soil and that additional
contract pressure is necessary to provide the stress to shear the soil at the
perimeter.
61. The distortion of a uniformly loaded flexible mat on cohesionless
soil will be concave downward, Figure 7c, because the soil near the center is
stressed under higher confining pressure such that the modulus is higher near
the center. A uniform pressure applied to a flexible foundation on cohesive
soil, Figure 7d, may cause greater settlement near the center than near the
edge because the modulus of elasticity in the soil is constant laterally and
cumulative stresses are greater near the center as a result of the pressure
bulb stress distribution.
62. Structural rigidity. A measure of the relative structural rigidity
OL is necessary to assist evaluation of differential displacements45
4 ksfS
OL = L. }s : (17)
where
43Burmister 196344Kerr 198745Hetenyi 1946
47
O - relative rigidity per foot, ft-
L - length of member, ft
ksf - coefficient of subgrade reaction, ksf/ft
S = width of member, ft
E - Young's modulus of concrete, ksf
I - moment of inertia, ft4
When QL is less than or equal to w/4 or 0.785, the mat is considered
rigid. The mat is divided into strips of width S equal to the spacing
between column or shear walls. A mat is more likely to be rigid on soft soil
or soil with a small coefficient k sf A mat may be considered flexible if
OL 1.75 and semi-flexible for 1.75 > OL > w/4.
63. The soil pressure distribution under flexible mats depends on a
variety of nonlinear factors that include (1) immediate settlement caused by
loading increments during construction, (2) distribution of loads on the mat,
(3) consolidation settlement or heave that overlaps immediate settlement even
duting construction, (4) increasing stiffness of the mat during construction,
and (5) redistribution of loads and soil pressures on the mat from long-term
differential movement. Optimum analysis requires sorting out each of these
effects so that each contribution to the resultant soil pressure distribution
can be individually analyzed.
64. Numerical analysis using finite element or finite difference
computer programs is often used to assist computation of stress and strain
because of the above complexity. The problem is simplified some by assuming
that soil and structural components are linear elastic materials, which has
been justified because of relatively low working loads and displacements
usually observed in practice46 . Even with this assumption, the analysis still
requires programs and large capacity computers. A further simplification may
be made by condensing the stiffness of the superstructure and foundation into
an equivalent mat thickness. Differential displacements were reduced by about
1/2 when the stiffness of a 7 story open frame superstructure on a 2.2-ft
thick mat was condensed into an equivalent mat of 3.1 ft thickness using
Meyerhof's method 37. This method described in Appendix B also considers
46Hooper 1978
48
additional stiffness from filling of the open frame structure so as to form
continuous shear walls. A simple alternative method for estimating the
influence of superstructure rigidity on deformation patterns is also proposed
in Appendix B.
65. Methodology. Differential displacements may be estimated from the
theory of elasticity using soil moduli from results of laboratory strength
tests conducted on undisturbed samples from different locations and depths
beneath the proposed foundation. Soil-structure interaction analyses that use
the theory of elasticity in the solution of differential displacements include
plate on elastic foundation programs such as SLAB2"1. SLAB2 also evaluates
benaing moments and shears that are required for design. Soil displacements
and reaction pressures may be analyzed with variable and nonlinear soil moduli
using two-dimensional finite element computer programs such as AXIPLN47. The
theory of elasticity generally indicates differential displacements from 0 to
50 percent of the total displacement for uniform applied pressures depending
on the relative stiffness of the mat and thickness of compressible soil.
66. Mat foundations should be designed to accommodate the maximum
angular distortion max* Unfortunately, many observed differential movements
are irregular, Figure 2c, making nearly impossible estimation of the maximum
angular distortion prior to construction. Moreover, estimation of imax
should consider and compare structural loads to heave, heave potential, and
loading pressures. A rough estimate of Pmax may be obtained from Equation
la. A practical method for quickly estimating the maximum angular distortion
when a potential for heave occurs is
S -p.
= max i (18)max /
where
Pi = immediate settlement, ft
S - maximum potential heave,ftmax
2 - distance between points of maximum and minimum settlement, ft
47Withiam and Kulhawy 1978
49
The maximum settlement may occur beneath the most heavily loaded part of the
structure such as beneath columns and consist only of immediate elastic
settlement; consolidation may not occur in a soil with potential for heave in
situ. The maximum potential heave is a positive number (settlement is
negative) and may occur beneath the most lightly loaded part of the foundation
such as midpoint between diagonal columns. The total differential movement is
the sum of Smax and -pi Nonuniform soil wetting may be caused by leaking
water, sewer, and drain lines.
67. A simple method for estimating differential displacements that
considers structural rigidity calculates elastic settlement at a particular
location by48
n I..h.
Pi = q Z ' ' (19)
i=l Esi
where
q = soil pressure applied by the foundation, ksf
I. - influence factor for layer iI
h - thickness of layer i, ft
Esi - Young's soil modulus of layer i, ksf
The influence factor I. is given for center and edge settlement in Figure 5
and shown in Figure 8 for ps - 0.2, 0.3, 0.4, and 0.5. The mat is converted
to an equivalent circular raft of radius R - {LB/r in which the length to
diameter ratio L/B should be : 2.
68. Figure 8 shows that the Kay and Cavagnaro (1983) method can be
arranged to provide simple estimates of total and differential settlement
relative to the center and edge of the mat. Edge settlement appears roughly
1/2 of the center settlement for a completely flexible mat. The differential
settlement is found from
P - (PC - Pe ) Rs (20)
wherep - differential settlement, ft
PC - center settlement, ft
48Kay and Cavagnaro 1983
50
INFLUENCE FACTOR q. KSF SETTLEMENT, FT
CENTER EDG CEN7 l TE UGh. FT KSF, IC .J =
0 0 N~/~,'/-O3 01Io I I,\
40 0510TOTAL Pc FT p - FT
Rs IFROM CHARTs _
SLOG'° KR'
RIGIDITY ,oR (c-O ,,T
__________________________EGUIVALENT RADIUS MAT R * __.___FT
MAT THICKNESS D - FT
POISSON'S RATIO SOIL "P______
08 -MAT MODULUS OF ELASTICITY Ec * ____ KSF
z
(~J
E 04 '
02 - "O
-2 -I R4
Figure 8. Settlement computation
(after Kay and Cavagnaro 1983)
51
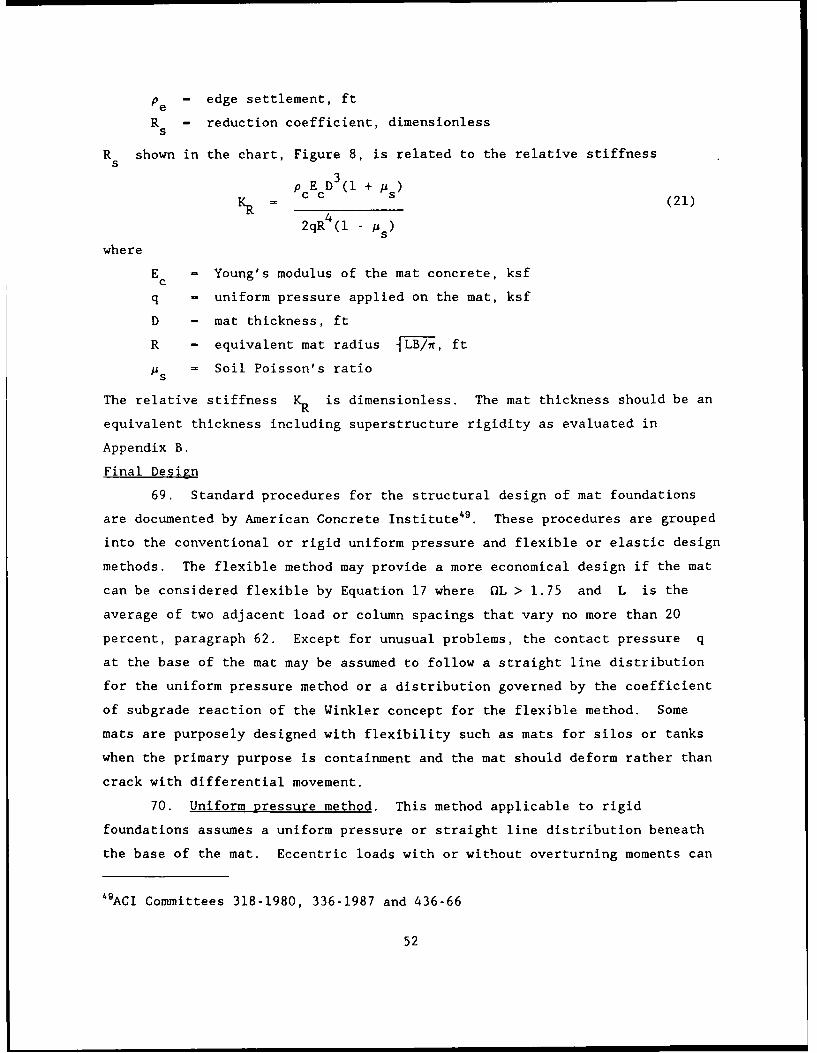
Pe - edge settlement, ft
R = reduction coefficient, dimensionlesss
R shown in the chart, Figure 8, is related to the relative stiffnesss
p cE cD 3(1 + S)KR cc s(21)
2qR4 (1 - p S)
where
E = Young's modulus of the mat concrete, ksfc
q - uniform pressure applied on the mat, ksf
D - mat thickness, ft
R - equivalent mat radius {L7B/, ft
ps = Soil Poisson's ratio
The relative stiffness KR is dimensionless. The mat thickness should be an
equivalent thickness including superstructure rigidity as evaluated in
Appendix B.
Final Design
69. Standard procedures for the structural design of mat foundations
are documented by American Concrete Institute49. These procedures are grouped
into the conventional or rigid uniform pressure and flexible or elastic design
methods. The flexible method may provide a more economical design if the mat
can be considered flexible by Equation 17 where OL > 1.75 and L is the
average of two adjacent load or column spacings that vary no more than 20
percent, paragraph 62. Except for unusual problems, the contact pressure q
at the base of the mat may be assumed to follow a straight line distribution
for the uniform pressure method or a distribution governed by the coefficient
of subgrade reaction of the Winkler concept for the flexible method. Some
mats are purposely designed with flexibility such as mats for silos or tanks
when the primary purpose is containment and the mat should deform rather than
crack with differential movement.
70. Uniform pressure method. This method applicable to rigid
foundations assumes a uniform pressure or straight line distribution beneath
the base of the mat. Eccentric loads with or without overturning moments can
49ACI Committees 318-1980, 336-1987 and 436-66
52
lead to trapezoidal (or nonuniform) pressure distributions and rotation of the
foundation. The length of the foundation is made sufficiently large such that
the resultant of overturning moments and axial loads from all columns in a
line is located in the center of the length of the foundation and the
resultant soil pressure distribution will be uniform provided the mat is
rigid.
71. The general design procedure is as follows: (1) mat dimensions are
selected such that the center of the mat and center of gravity coincide, (2)
the mat may be divided into a series of equivalent beams centered on rows of
columns, (3) a shear and moment diagram may be constructed assuming that the
column loads are point loads, (4) the mat depth is selected to resist the
maximum shear without reinforcement, and (5) the amount of reinforcement is
subsequently selected to resist the maximum bending moment. Detailed criteria
for design of rigid mats are provided in the literature49 .50 ' 1 Concrete floor
slabs subject to heavy concentrated loads may be designed by procedures
described in TM 5-809-12, "Concrete Floor Slabs on Grades Subjected to Heavy
Loads". The uniform method may be recommended for mats on mud, soft clay,
peat, organic soils, or even clays of medium stiffness.
72. Winkler foundation. The Winkler foundation may be applicable to
mats subject to plane strain such as dry docks with long walls, pavements, or
roads. The design of flexible mats commonly use the beam on Winkler
foundation concept of ksf to evaluate design parameters from charts22 or
computer programs 15,52,53. Design parameters take the form
45
d4
Pressure intensity q': q' - E I d P (22a)kips/ft/ft width cdx 4
Shear V: V - E I d P (22b)kips/ft width c dx3
50Teng 197551Bowles 198852Haliburton 197253Chou 1981
53
Bending moment M: M - E I d2p (22c)kips-ft/ft width dx2
where
E = Young's elastic modulus of concrete, ksfC
I = moment of inertia, ft4
p = displacement, ft
x = horizontal distance along beam or mat stripof width S, ft
A simple solution to Equations 22 is accomplished by equating q' - - ksSp.
The solution should be checked against allowable design parameters determined
by criteria of the American Concrete Institute49 . Deflections and bending
moments determined by American Concrete Institute 318 and 336 should be
consistent with calculated values from computer programs51. The solution
depends on boundary conditions such as distribution of applied loads, beam
length, and distribution of the soil reaction pressure. Soil response curves
required for input are found by multiplying appropriate values of ksf
by width S. A major disadvantage of this approach is that reliable
guidelines are not available for determining appropriate values of ksf and
how ksf varies with horizontal locations.
73. The finite element method may be applied to relate forces and
displacements of each element by53
[F] = [K].(6f) + ksfab.(6 s (23)
where
- matrix of 3 forces (vertical force, moment about x-axis, momentabout y-axis for each node of the element)
[K] - stiffness matrix of the foundation element (function of matdimensions a and b of the element, Young's modulus andPoisson's ratio of the foundation), lb/ft
6f - displacement array for each node in the foundation element, ft
ksf - coefficient of subgrade reaction of foundation soil, ksf/ft
6s - displacements array in the soil, ft
The finite element method for the Winkler concept was applied to develop
program WESLIQID 53 .
54

74. Elastic foundation. Flexible mats may also be analyzed using the
plate on elastic semi-infinite foundation to evaluate design parameters n1 53'5 4
Boussinesq's solution and Burmister's layered elastic solution are used to
compute subgrade surface deflections for homogeneous and layered elastic
foundations, respectively. The relationship between forces and displacements
of each element can be written similar to Equation 23
(F) - ([Kf] + [Ks]).(6 (24)
where(F) - externally applied nodal forces, lb
[Kf] - stiffness matrix of the foundation (function of the finiteelement configuration and flexural rigidity of the mat), lb/ft
[K J - stiffness matrix of the subgrade (function of nodal spacing,Young's modulus and Poisson's ratio of the soil), lb/ft
(6) - nodal displacement array, consisting of a vertical deflectionand two rotations, ft
The finite element method for the elastic foundation was applied in programs
SLAB2 n , WESLAYER53 , FOCALS55 , SAP- 5 6 and ANSYS 57 .
75. The basic difference between Winkler and elastic foundations is
that the Winkler deflections at a given node depend only on the forces at the
node, while elastic deflections at a given node depends on the forces at the
node and forces or deflections at other nodes.
76. Applications. Some specialized simple solutions of thin mats on
swelling/shrinking soils are available and compared in Table 8. An improved
design procedure for perimeter loads on ribbed thin mats up to 18 inches thick
constructed in swelling soil have also been developed by the Post Tensioning
Institute (1980) using program SLAB2 (Appendix C). Many of these simple
methods assume some shape of the soil mound
mYm C Cm x (25)
where
Ym - maximum soil heave without surcharge load, ft
x - horizontal distance, ft
54 Huang 1974a, 1974b"Wardle and Fraser 1975b56Bathe, et al 197857DeSalvo and Swanson 1982
55
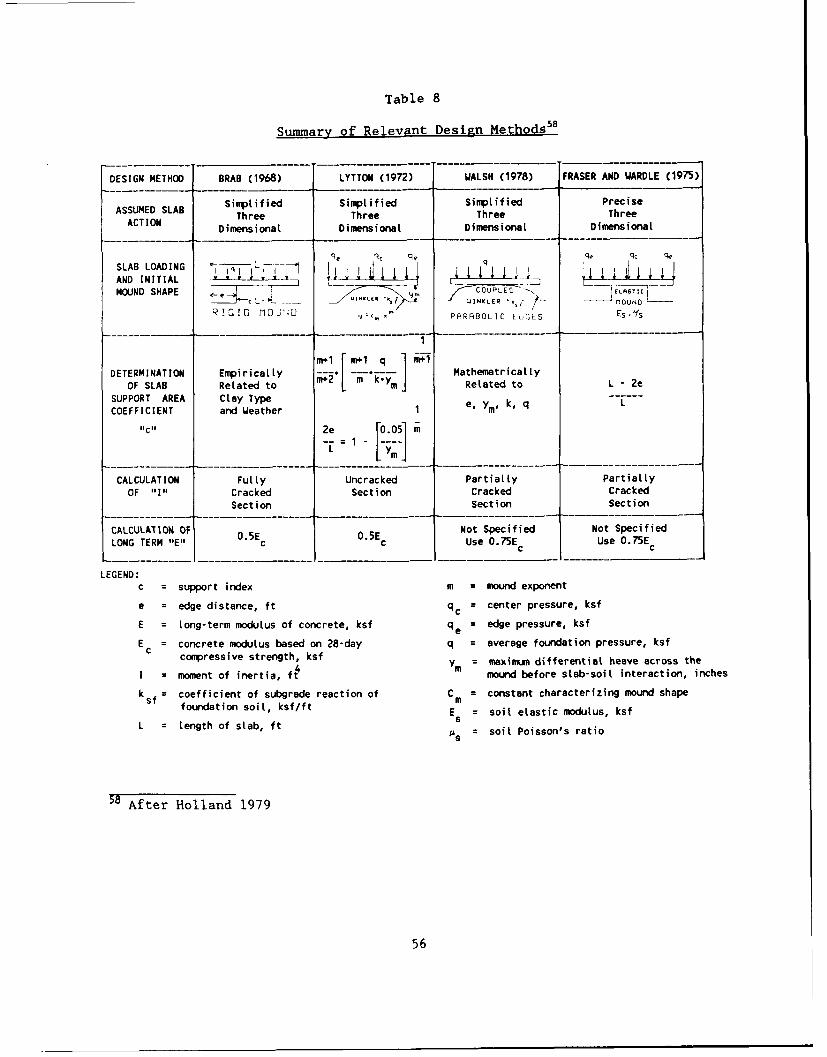
Table 8
Summary of Relevant Design Methods58
DESIGN METHOD BRAB (1968) LYTTON (1972) WALSH (1978) FRASER AND WARDLE (1975)
Simplified Simplified Simplified PreciseASSUMED SLAB Three Three Three Three
ACTION Dimensional Dimensional Dimensional Dimensional
L q, qe q qC 0,e
SLAB LOADING -TqL---j -- I I , ,
AND INITIAL -MOUND SHAPE COUPLED - TC
W I N K L E R ' k " E L O
; fIG O I-JJm PARRBOLIC E[-LS EsI s
DETERMINATION Empirically --2 - -Mathematrically
OF SLAB Related to -m-kY Related to L -eSUPPORT AREA Clay Type e,y k,q LCOEFFICIENT and Weather 1 m
"c"1 2e [0.05] mL = Ym
CALCULATION Fully Uncracked Partially PartiallyOF "II Cracked Section Cracked Cracked
Section Section Section
CALCULATION OF 0.5E 0.5E Not Specified Not Specified
LONG TERM "E" c c Use O.75E Use O.75Ec c
LEGEND:
c = support index m = mound exponent
e = edge distance, ft qc = center pressure, ksf
E = Long-term modulus of concrete, ksf q e = edge pressure, ksf
E = concrete modulus based on 28-day q = average foundation pressure, ksfC compressive strength, ksf
c mo e fiesrethf4 Ym = maximum differential heave across the
= mont of imound before stab-soil interaction, inches
k = coefficient of subgrade reaction of C = constant characterizing mound shapefoundation soil, ksf/ft E = soil elastic modulus, ksf
L = Length of slab, ft soil Poisson's ratio
58 After Holland 1979
56
Cm, m - empirical constants
A reasonable value for m is 311,59. A value of m : 2 provides a mound
that rises too quickly, while m z 4 appears to flatten out the heave profile
too much.
77. The Post Tensioning Institute design procedure is applicable to
conventionally reinforced or post-tensioned ribbed mats for light, perimeter
loads. Required soil input parameters include Atterberg limits, cation
exchange capacity, percent clay less than 2 microns, unconfined compressive
strength, elastic soil modulus and Poisson's ratio, edge moisture variation
distance, and depth of active zone for soil heave. Required foundation
parameters include the concrete compressive strength, elastic modulus and
Poisson's ratio and yield strength of reinforcing steel. Development of the
design equations used a parametric analysis that assumed the coefficient of
subgrade reaction ksf 7 ksf/ft. This method should not be used for
perimeter wall loads exceeding 2 kips/ft, stiffening beam depths exceeding 3
ft, beam spacing exceeding 20 ft, differential center lift movements exceeding
4 inches, differential edge movements exceeding 1.5 inches, and mat lengths
and widths exceeding 300 ft, or for structures with significant concentrated
loads on either the interior or perimeter. The procedure should tend to
produce conservative designs because the analysis assumes simultaneous
perimeter loads on all four edges, while many practical structures such as
houses experience perimeter loads on only two edges. The procedure considers
effect of climate on edge moisture variation distance and potential
differential soil heave, but other effects such as unusual desiccated soil and
rainfall, removal of pre-construction vegetation, and downhill creep are not
considered.
78. A simple "untried" method of evaluating the required stiffness E Ic
of a mat foundation to maintain differential movements within acceptable
levels may be found from an application of the frequency spectrum approach,
which was applied to the design of pavements on expansive soil6 . This model
assumes a beam on a Winkler foundation to evaluate El from the relative
rigidity OL, Equation 17. The relative rigidity per foot 0 times a model
59Lytton 19726 McKeen and Lytton 1984
57
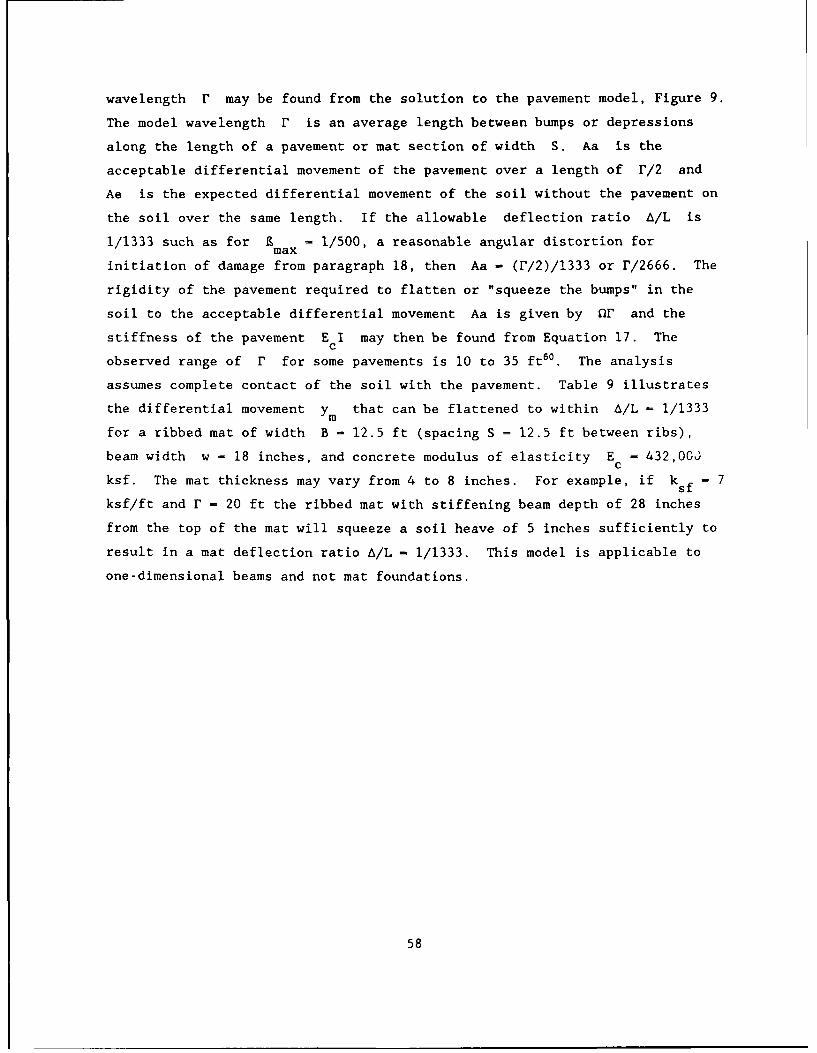
wavelength r may be found from the solution to the pavement model, Figure 9.
The model wavelength r is an average length between bumps or depressions
along the length of a pavement or mat section of width S. Aa is the
acceptable differential movement of the pavement over a length of r/2 and
Ae is the expected differential movement of the soil without the pavement on
the soil over the same length. If the allowable deflection ratio A/L is
1/1333 such as for 9 m 1/500, a reasonable angular distortion formax
initiation of damage from paragraph 18, then Aa - (r/2)/1333 or r/2666. The
rigidity of the pavement required to flatten or "squeeze the bumps" in the
soil to the acceptable differential movement Aa is given by for and the
stiffness of the pavement E I may then be found from Equation 17. Thec
observed range of r for some pavements is 10 to 35 ft6 °. The analysis
assumes complete contact of the soil with the pavement. Table 9 illustrates
the differential movement ym that can be flattened to within A/L = 1/1333
for a ribbed mat of width B = 12.5 ft (spacing S = 12.5 ft between ribs),
beam width w - 18 inches, and concrete modulus of elasticity E - 432,003c
ksf. The mat thickness may vary from 4 to 8 inches. For example, if k - 7• sf
ksf/ft and P - 20 ft the ribbed mat with stiffening beam depth of 28 inches
from the top of the mat will squeeze a soil heave of 5 inches sufficiently to
result in a mat deflection ratio A/L - 1/1333. This model is applicable to
one-dimensional beams and not mat foundations.
58
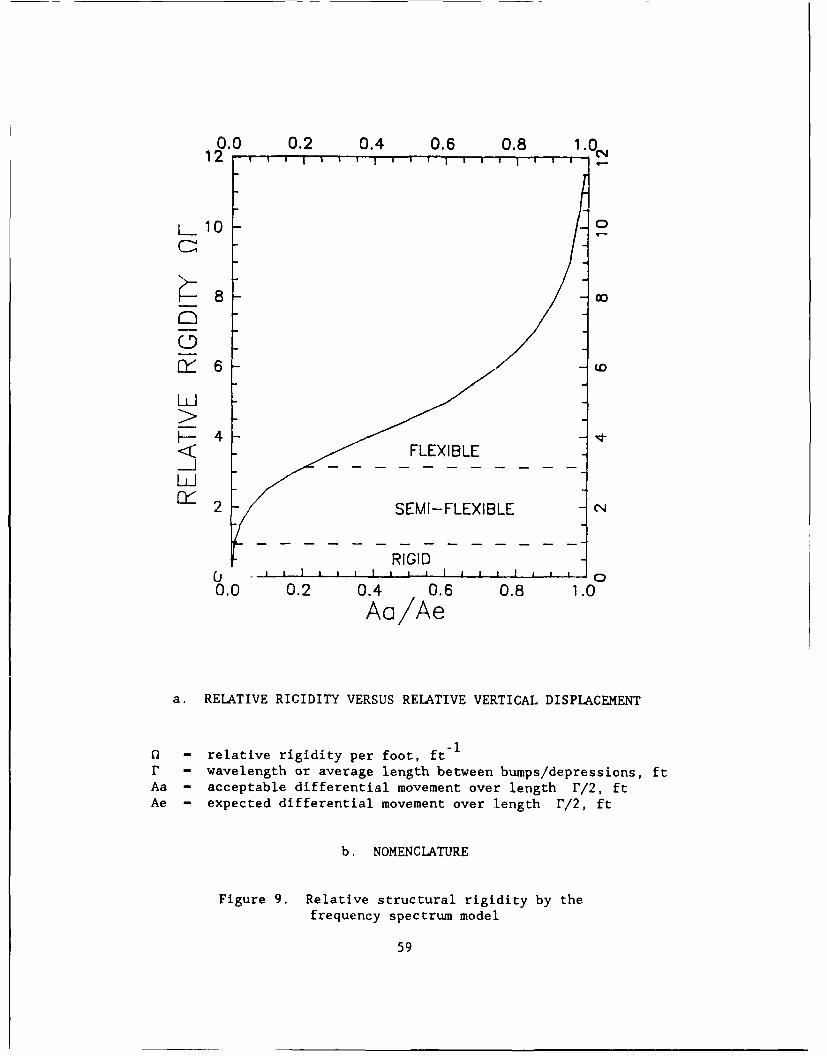
0.0 0.2 0.4 0.6 0.8 1.0
12 C 4
110 ,
80
Ch 6
< FLEXIBLE-J
Fy 2 SEMI-FLEXIBLE
RIGID
0.0 0.2 0.4 0.6 0.8 1.0Aa/Ae
a. RELATIVE RIGIDITY VERSUS RELATIVE VERTICAL DISPLACEMENT
- relative rigidity per foot, ft1
r - wavelength or average length between bumps/depressions, ftAa - acceptable differential movement over length r/2, ftAe - expected differential movement over length r/2, ft
b. NOMENCLATURE
Figure 9. Relative structural rigidity by thefrequency spectrum model
59
Table 9
Examples of Maximum Soil Heave Squeezed to A/L - 1/1333 By aRibbed Mat 12.5 ft Wide With Beams 18 Inches Wide
Maximum soil Heave yml inches
Coefficient ofSubgrade Reaction Wavelength r, ft Beam Depth Below Top of Mat, inchesksf ksf/ftsf' 20 28 36
4 10 6.0 9.0 11.020 4.0 7.5 10.030 2.3 4.5 7.050 0.8 1.7 3.0
7 10 5.0 7.5 9.020 3.0 5.0 9.030 1.5 2.9 4.950 0.6 1.2 2.1
10 10 4.7 6.4 8.020 3.0 5.0 9.0
30 1.3 2.7 3.650 0.5 0.9 1.4
14 10 4.0 6.0 7.520 1.9 3.3 4.0
30 0.8 2.1 2.950 0.4 0.7 1.2
60
PART III: CASE HISTORY STUDIES
Introduction
79. Seven ribbed mats supporting moderate loads and three thick flat
mats supporting heavy loads from multistory hospital buildings were analyzed
to provide design information on soil parameters. These mats are located in
San Antonio, TX, except for the thick mats supporting the hospital in Fort
Gordon, GA, and Fort Polk, LA. Soil data available from field and laboratory
investigations and elevation readings of the mats permit some analyses of the
structural performance based on uniform pressure, Winkler, and plate on
elastic foundation methods. Representatives of the Corps of Engineers from
the Southwestern Division, Fort Worth District, Waterways Experiment Station,
and Office, Chief of Engineers, visually examined these facilities in San
Antonio in May 1984 to assist evaluation of performance. Results of these
analyses are compared with design requirements given by the American Concrete
Institute (ACI) and flexure theory. Application of the frequency spectrum
method is made in Part IV.
Soil Parameters
80. Soil parameters were evaluated from results of laboratory tests
performed on soil samples taken from the field before construction. Disturbed
samples were obtained with an 8-inch auger. Relatively undisturbed samples
were obtained with 6-inch Denison and core barrel samplers. Selected samples
were sealed in airtight containers and shipped by truck to laboratories for
testing. Boring holes were usually left open about 24 hr to detect perched
water levels associated with gravel and other pervious strata, then backfilled
with lean cement grout to inhibit seepage of perched water into underlying
desiccated soil.
81. Shear strengths of the soil were evaluated from results of
unconsolidated-undrained Q triaxial strength tests and occasionally from
consolidated-undrained R tests. The elastic soil modulus E was evaluateds
from stress-strain data as a function of depth using the hyperbolic model,
paragraph 39. Constrained modulus Ed was also evaluated from results of
consolidometer tests by61
61Lambe and Whitman 1969
61
E = (1 + eo)a (6E d 0v(26)
0. 435C
wheree - initial void ratio0
a - vertical overburden pressure on the in situv soil, ksfC - compression C or swell C index
C s
Both compression and swell indices were used to provide a range of Ed ' The
constrained modulus from Equation 26 includes the influence of consolidation
or plastic strains and will usually be less than E evaluated from elastic5
strains of Q test results. Since Ed assumes negligible lateral
deformation, while E includes lateral deformation, Ed > E .E d should
equal E when ps = 0.0. An equiv.1ent or uniform elastic modulus E* and5 5
coefficient of subgrade reaction required for the analyzes were estimated from
results of soil tests using methodology in PART II.
Structural Parameters
82. Bending moments and shears were evaluated from methods of the
American Concrete Institute6 2 and compared with values calculated from plate
on elastic foundation program SLAB211 and beam on Winkler foundation program
CBEAMC 5 . Observed displacements were compared with displacements calculated
from SLAB2 and CBEAMC. Input parameters for SLAB2 include Young's elastic
modulus of the mat concrete E normally assumed to be 432,000 ksf, Poisson'sc
ratio of the mat concrete uc - 0.15, an equivalent Young's elastic modulus of
the soil E*, and Poisson's ratio of the soil u. Poisson's ratio of the
soil was assumed 0.3. The total moment of inertia I of the entire mat
cross-section in each of the long L and short S directions is also input
to permit computation of the flexure stiffness E I in each of the twoc
orientations. Tables Bl and B2 describe evaluation of I for each cross-
sections of mat foundations, which may be added together to evaluate the total
moment of inertia. Program SLAB2 can be made to simulate soil center heave
patterns by imposing edge gaps and edge heave by imposing center gaps.
83. Program SLAB2 requires input of a uniform Young's elastic soil
modulus that is applicable for the entire mat E*. However, mats placed ons
62Eshbach 1954
62
the ground surface and on expansive soil characteristic of this study are
subject to soil deformation caused by moisture changes in the active zone of
soil heave. This active zone of heave may include 20 or more feet of soil
beneath the mat. The effective soil modulus representing heave beneath ribbed
mats is therefore assumed in this study to be the average modulus within 50 ft
beneath the ground surface. E* may be evaluated from Equations 4.s
84. Beam on Winkler foundation program CBEAMC15 was also applied because
beam programs are often used for design and they are simpler and more
economical to operate than plate on elastic foundation programs. Input
parameters of CBEAMC include the moment of inertia of the section (Tables BI
and B2). Program CBEAMC can simulate heave patterns by specifying
displacements. Results of a CBEAMC analysis for uniform pressure applied on a
soil of uniform stiffness will cause zero bending moments and shears in the
mat section. The soil stiffness k' input into CBEAMC is in units of ksf and
found from the coefficient of subgrade reaction of the mat ksf by
k' - k S (27)ksf"
where S is assumed the spacing between columns or T-sections of ribbed mats.
ksf may be calculated from known soil pressure/settlement ratios, Equation 5
or estimated from Equations 6 to 9. The values of ksf are consistent for
displacements; therefore, bending moments calculated with these ksf for the
Winkler foundation may not be correct because ksf are not unique for mat
foundations. Winkler analysis is further handicapped because the extent of
soil support under the flat portion of the ribbed mat is not known. Paragraph
24, PART I, describes the American Concrete Institute specification for
bending of an effective T-section width that can be substantially less than
the spacing S between ribs, which may partly compensate for the 2.4 times
larger ksf required to compute bending moments than that required for
displacements described in paragraph 44. Because of these uncertain
corrections for evaluating ksf , the stiffness k' is calculated from
Equation 27 with k evaluated from given applied pressures andsf
displacements calculated from SLAB2 analysis.
63
Ribbed Mat Foundations
85. Ribbed mats are composed of cross-beams supporting a flat floor
slab, Figure 10. Mats selected for analysis and identified in Table 10 were
constructed on about 4 ft of nonexpansive, low plasticity compacted fill
overlying expansive soil strata. This fill is compacted to not less than 92
percent of maximum density after ASTM D1557. Trenches of about 3 ft in depth
were excavated in the fill for placement of reinforcing steel and concrete for
stiffening beams. Stiffness parameters of the compacted fill were not
determined, but were assumed similar to those of the underlying soil. Six
inches of granular material were placed on the prepared surface of the
compacted fill between stiffening beams of all the mats. A polyethylene vapor
barrier was placed on the granular fill beneath the flat portions of the mat
prior to concrete placement and snugly fitted against the walls of the
trenches for the stiffening beams.
86. Reliable benchmarks for level surveys were not available for any of
these mat foundations. Reference benchmarks consisted of 2 or 3 manholes used
for drainage located in the immediate vicinity of the ribbed mats. These
benchmarks are identical to those used by the contractor during construction.
Differences in displacements relative to the original elevations measured by
the contractor therefore include both differences in elevation readings,
elevation changes in these benchmarks, and contractor error. Consequently,
only rough comparisons may be made between these measured displacements and
those calculated from the analyses.
87. Table 10 illustrates the structural capacity of the T-beams of the
selected ribbed mat foundations62. Letters A and B in the left column of
Table 10 indicate T-sections described later in plan views of each mat.
Numbers 1 to 6, U. S. Army Reserve Center Warehouse, indicate each of the six
stiffening beams parallel with the short direction. All of these mats are
flexible with OL >> 1.75 (see paragraph 62) as shown in Table lla. Maximum
differential displacement A between the center and edge of these mats will
be at least 80 percent of the difference between center and edge settlement of
a fully flexible mat as shown in Table llb. Table 12 illustrates bending
moments developed in these mats for the given maximum differential soil heave
Ym using the Walsh (1978) method for a beam on a Winkler foundation, Table 8.
64
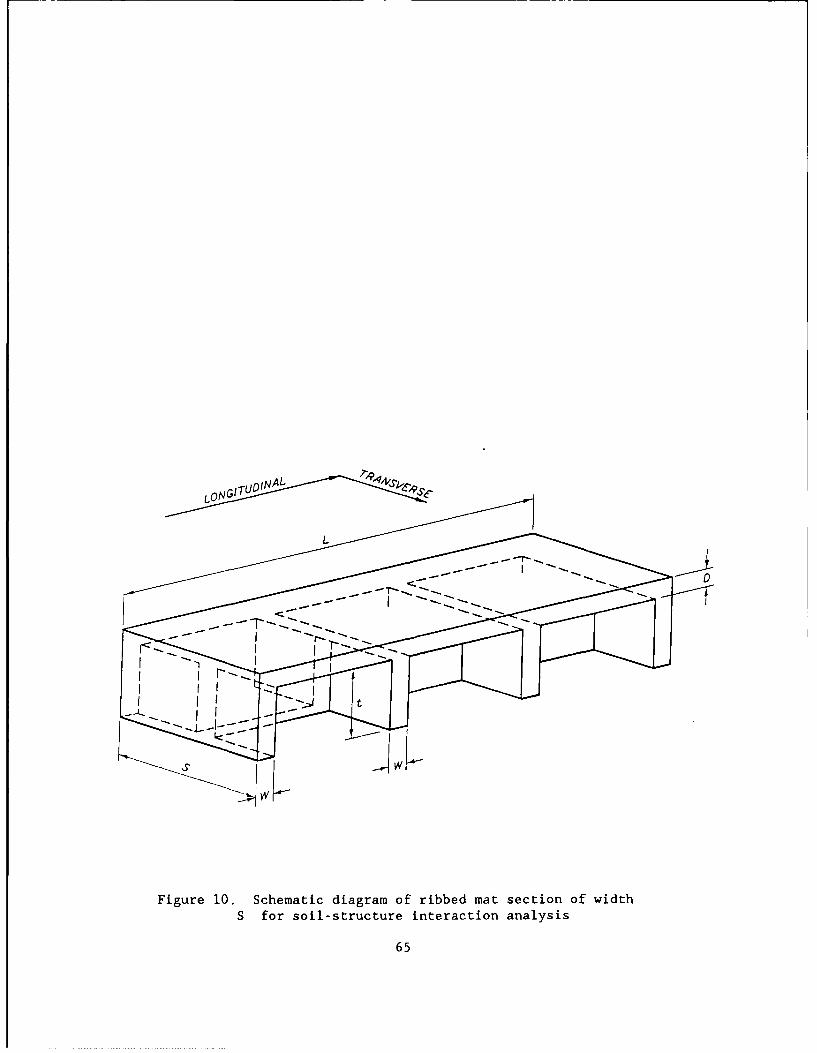
LNGIUIN 7;9
I w
. . .............. .. .... .....
Figure 10. Schematic diagram of ribbed mat section of width
S for soil-structure interaction analysis
65
Table 10
a. Structural Parameters for T-Beams
A , W, d, M, V, Flexure Rigidity,
Mat 2 in. in. j ft-kips kips E I , kips-ft2
Mat in. E~cloormkp- 2
GymnasiumBrooks - A 3.12 18 33 0.91 ± 468 71 3,915,600
AFB - B 3.12 18 33 0.91 ± 468 71 3,776,502Data Processing FacilityRandolph - A 3.27 12 33 0.91 - 490 47 3.062,108
AFB - B 4.00 12 33 0.91 + 600 47 3,062,108
US Army Reserve Center WarehouseFort Sam - 1 3.12 18 27 0.90 ± 380 59 2,485,398
Houston - 2 3.12 18 36 0.91 ± 513 76 4,940,494- 3 3.12 18 44 0.92 ± 631 92 8,541,116- 4 3.12 18 53 0.93 ± 765 108 13,453,350- 5 3.12 18 61 0.93 ± 885 126 21,649,488- 6 3.12 18 69 0.93 ±1005 142 30,037,626
Maintenance Building- A 1.20 18 33 0.94 ± 186 71 3,951,668- B 3.12 18 33 0.91 ± 468 71 4,085,270
Dental ClinicFort Sam - A 3.00 16 29 0.90 ± 392 56 2,367,360
Houston - B 3.00 16 29 0.90 ± 392 56 2,336,562Medical ClinicFort Sam - A 3.00 16 29 0.90 ± 267 71 3,818,284
Houston - B 3.00 16 29 0.90 ± 267 71 3,540,180
Pest Management Training FacilityFort Sam - A 2.00 12 27 0.90 ± 243 39 1,567,097Houston - B 2.00 12 27 0.90 ± 243 39 1,600,245
* + indicates compression and - indicates tension in top fibers** Includes steel***Refers to the T-section analyzed in the mat described later
b. Nomenclature
S M - AsfsJd, maximum bending n = Est/Ec
moment resisted by steel,_- f Dbin v = allowable shearing
lb-in, stress resi ted by
L2 W 2 V - VcA, allowable vertical concrete, 2 fc
S - secton spacng, in.shear resisted by beam10.psspacing, in. section, lb f'c - ultimate concrete
W - beam width, in. fs - teel tensile strength, c8sdaystrensafter
D - slab thickness, in. 60,000 psi
A " beam cross-section, W(3+d) in.2 - I - k/3 I oor= composite moment ofinertia of ribbed mat
d - beam depth plus slab thickness r 211/2 T-section, in.4
minus 3 in. k - [2pn + (pn)J - pn (Equation B13)
A area steel, in.2 - A/Wd
------ 6- -
66
Table 11
Relative Flexibility of Mats
a. Hetenyi (1946) Method
Mat B, k of S, E c 1, L, Uft kaf/ft ft C 2 ft-1
ftkips-ft f-
Gymnasium, Brooks AFB 85.3 5.2 17.3 3,776,502 0.050 85.3 4.20Section Bl
Data Processing Facility, Randolph 149.8 3.0 18.5 3,062,108 0.047 149.8 6.90AFB, Section A
Maintenance Bldg, 72.7 6.1 27.0 3,951,668 0.058 72.7 4.14Section A
Troop Dental Clinic, Fort Sam 109.7 4.0 13.8 2,367,360 0.050 109.7 5.38Houston, Section A
Troop Medical Clinic, Fort Sam 164.0 2.7 15.0 3,818,284 0.041 164.0 6.59Houston, Section A
Pest Management Facility, Fort Sam 58.7 7.5 15.0 1,567,097 0.066 98.7 6.42Houston, Section A
Ek ES - 400 ksf ** 4 S * 1.75ksf 5 f, U >1.75 ieldsa
2s - JA = 0.3 4 I flexible mat
(1- )BI - 1.0 cw
b. Kay and Cavagnaro (1983) Method
Mat S, I, EcI, D, L, B, Ri ** R
ft 4 kipsct 2 ft ft ft ft LogKR R5
Gymnasium, Brooks AFB 17.3 8.74 3,776,502 1.82 89.3 85.3 49.2 -1.03 0.80Section Bi
Data Processing Facility, Randolph 18.5 7.09 3,062,108 1.66 199.8 149.8 97.6 -2.05 0.95AFB, Section A
Maintenance Bldg, 27.0 9.15 3,951,668 1.60 204.0 72.7 68.7 -1.64 0.90Section A
Troop Dental Clinic, Fort Sam 13.7 5.48 2,367,360 1.68 143.3 109.7 70.7 -1.61 0.90Houston, Section A
Troop Medical Clinic, Fort Sam 15.0 8.84 3,818,284 1.92 190.0 164.0 99.6 -1.88 0.92Houston, Section A
Pest Management Facility, Fort Sam 15.0 3.63 1,567,097 1.43 98.7 58.7 42.9 -1.17 0.80Houston, Section A
*3 r- c + 2[ 13 Ec p .D F-21 R - KR
= D - E - 432,000 ksf
a E = 400 ksf
67
Table 12
Maximum Bending Moments by Walsh (1978) Method
Mat L, e /L w, Lift Ym' A/Ym w/(k'ym ) C1 Mft kips/ft Mode inches kips-ft
Gymnasium, Brooks AFB 85.33 0.2 2.3 Edge 0.25 0.25 0.5 0.98 42Section B1 1.00 1.00 4.0 0.94 124
Data Processing Facility, 150.00 0.2 4.8 Center 0.60 0.40 2.0 0.98 270Fort Sam HoustonSection A
Maintenance Building, Fort 72.67 0.4 4.6 Center 2.00 0.10 4.0 0.86 429Sam Houston, Section A
Dental Clinic, Fort Sam 109.67 0.2 3.0 Center 1.00 0.20 1.0 0.96 180Houston, Section A
Medical Clinic, Fort Sam 164.00 0.4 2.7 Center 0.60 0.20 2.0 0.98 182Houston, Section A
Pest Management Facility, 58.67 0.4 2.5 Edge 2.00 0.10 2.0 0.79 226Fort Sam Houston,Section B
Notation: L = length of section, ft
am - edge moisture penetration distance, ft
A = maximum tolerable differential movement, in.
ym = maximum differential heave, in.
w - applied load/length of section, kips/ft
k' = stiffness, k fS, kips/ft length/ft displacement
C1 = constant obtained from Table 1 of Walsh (1978)
M - maximum bending moment, kip-ft, (1 - C1 )WL 2/8
68
The deflection requirement A/L is taken as 1/1333 from Equation lb assuming
9 - 1/500 where L is the spacing S between adjacent beams. The Walshmax
method can calculate large changes in bending moments for small change in the
constant C1 when C1 approaches 1.0, Table 12.
Gymnasium, Brooks Air Force Base
88. The gymnasium is an L-shaped building located in the south portion
of Brooks Air Force Base near San Antonio, Texas, at the intersection of West
Gate and Inner Circle Roads. Construction was initiated in the fall of 1981.
Superstructure framing consists of a steel roof deck on open web steel joists
supported by steel trusses and concrete columns in the gym area and load
bearing masonry walls and steel beams in the locker room areas. Stiffening
beams, Figure 11, are 18 inches wide by 3 ft depth below the mat top. Beam
spacing S is variable from 8 to 34 ft. Mat thickness D between stiffening
beams is 5 inches. The building was equipped with downspouts and 2-ft long
splash blocks directing rainfall away from the mat foundation. The grade was
nearly flat around the building.
89. Soil parameters. Soil parameters from results of laboratory tests
on soil samples from five borings taken in June 1977 are shown in Figure 12.
Overburden soil consists of lean clay, sands, and silts of generally alluvial
origin down to a depth of about 15 ft. A perched water table was found about
8 ft below ground surface in the gravel GC stratum. Below the overburden
soil is 4 to 7 ft of yellow-brown medium plastic CH-CL clay with caliche
weathered from the underlying primary formation. The primary stratum consists
of about 75 ft of noncalcareous, bentonitic clay shales of the Midway
formation of Tertiary age.
90. The results of Q triaxial strength tests on specimens from
relatively undisturbed boring samples indicated an undrained shear strength
C of about 1.6 ksf that increases at a rate of about 0.04 ksf/ft of depth,u
Figure 12. The ultimate bearing capacity of this soil is at least 10 ksf
providing an allowable bearing capacity for pressures on the stiffening beams
of more than 3 ksf assuming a factor of safety of 3. The elastic soil modulus
E appears to be about 400 ksf, while the constrained modulus Ed is much
less at about 80 ksf based on swell indices. Swell pressure tests (Method C,
69
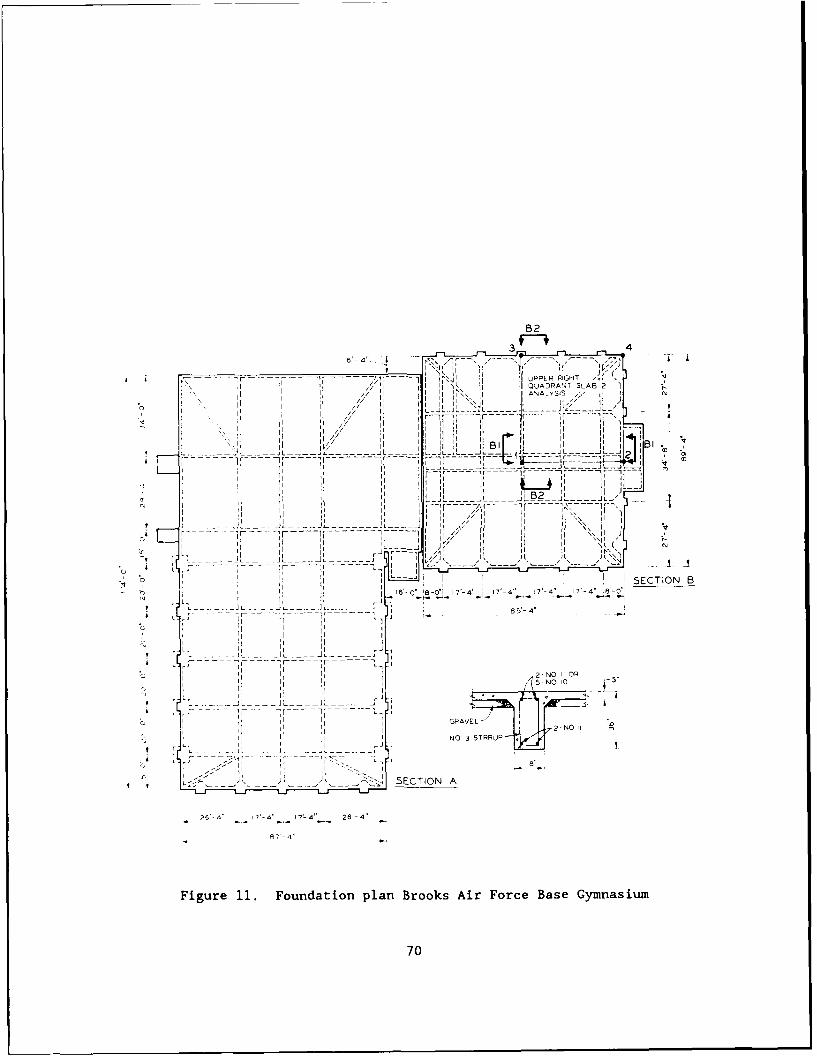
B2
11 UPPER RIGHT1"1[ QUADRANT SLAR
1ANALYSIS,, I N
L I 4_-4 1' -- , 2J
SL 1 - f r - - r--- ---. --.-.. -.
IL -J, ]FJL - - - -I
ILI
p~ -I -I - I -L ?J .---
lij I L,''
I ~ ~ N I I~ HI L -iJ--J H L
SSECTION B
2-N 7I- 4
Figur 11. Fonainpa rosArFreBs5ynsu
70i
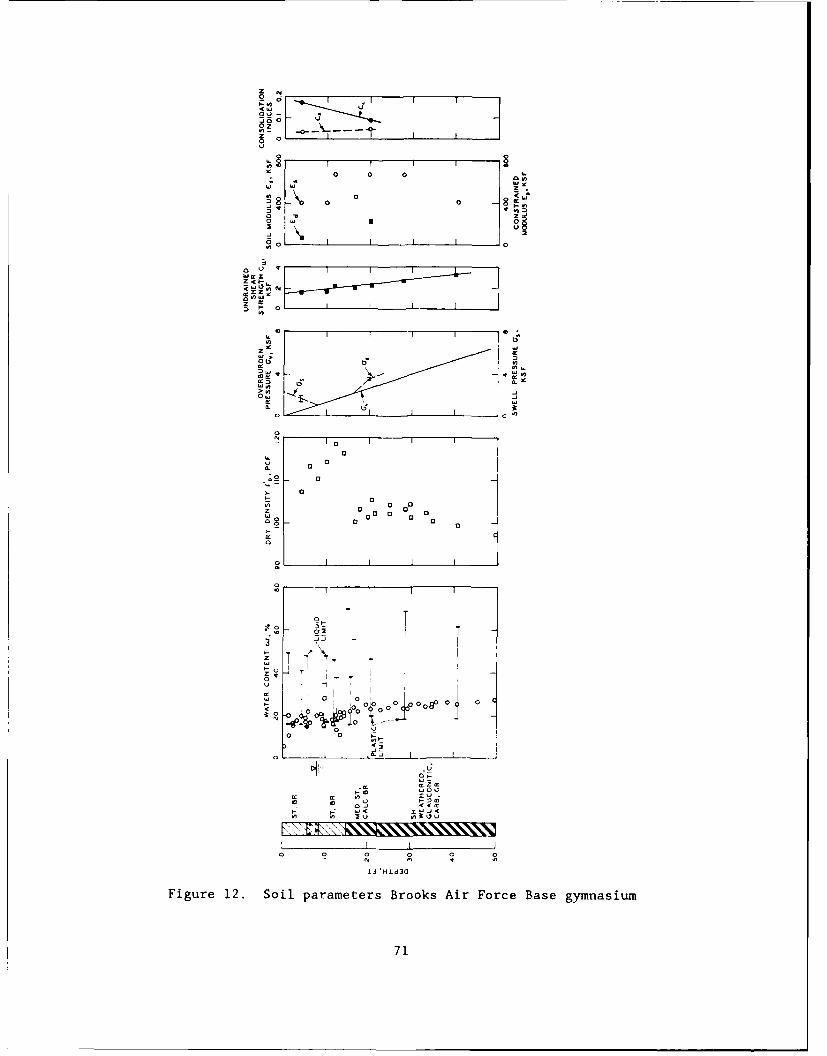
Z 4r
GUO
0 0 0
UU
000
U-
a I,50.
52 x
at,
>- ]
a 13*
al
cc C
3 t TST 7'!
0 7-
0 00 a P - 0
0 00
N N ~U N00
I I I
IA NHLd3O
Figure 12. Soil parameters Brooks Air Force Base gymnasium
71
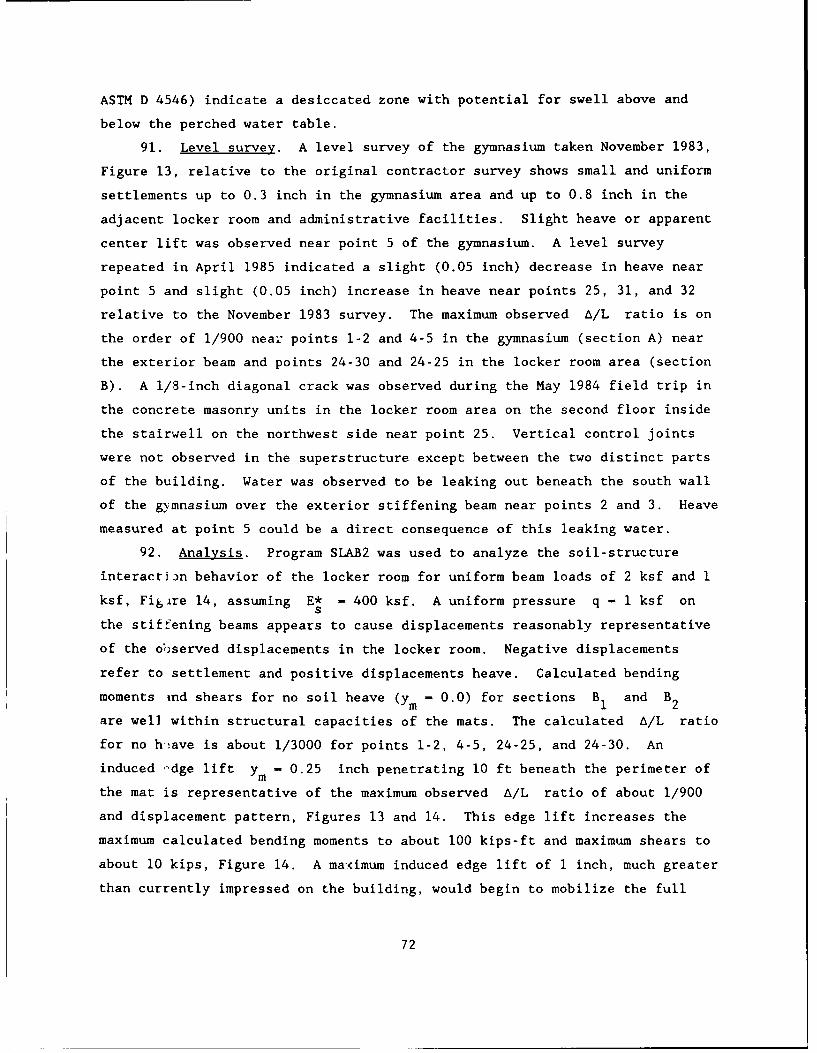
ASTM D 4546) indicate a desiccated zone with potential for swell above and
below the perched water table.
91. Level survey. A level survey of the gymnasium taken November 1983,
Figure 13, relative to the original contractor survey shows small and uniform
settlements up to 0.3 inch in the gymnasium area and up to 0.8 inch in the
adjacent locker room and administrative facilities. Slight heave or apparent
center lift was observed near point 5 of the gymnasium. A level survey
repeated in April 1985 indicated a slight (0.05 inch) decrease in heave near
point 5 and slight (0.05 inch) increase in heave near points 25, 31, and 32
relative to the November 1983 survey. The maximum observed A/L ratio is on
the order of 1/900 near points 1-2 and 4-5 in the gymnasium (section A) near
the exterior beam and points 24-30 and 24-25 in the locker room area (section
B). A 1/8-inch diagonal crack was observed during the May 1984 field trip in
the concrete masonry units in the locker room area on the second floor inside
the stairwell on the northwest side near point 25. Vertical control joints
were not observed in the superstructure except between the two distinct parts
of the building. Water was observed to be leaking out beneath the south wall
of the gymnasium over the exterior stiffening beam near points 2 and 3. Heave
measured at point 5 could be a direct consequence of this leaking water.
92. Analysis. Program SLAB2 was used to analyze the soil-structure
interactian behavior of the locker room for uniform beam loads of 2 ksf and 1
ksf, Figire 14, assuming E* - 400 ksf. A uniform pressure q - 1 ksf onS
the stiffening beams appears to cause displacements reasonably representative
of the observed displacements in the locker room. Negative displacements
refer to settlement and positive displacements heave. Calculated bending
moments ind shears for no soil heave (Ym - 0.0) for sections B and B(y -00)fo ecios 1 2
are well within structural capacities of the mats. The calculated A/L ratio
for no h!ave is about 1/3000 for points 1-2, 4-5, 24-25, and 24-30. An
induced -dge lift ym - 0.25 inch penetrating 10 ft beneath the perimeter of
the mat is representative of the maximum observed A/L ratio of about 1/900
and displacement pattern, Figures 13 and 14. This edge lift increases the
maximum calculated bending moments to about 100 kips-ft and maximum shears to
about 10 kips, Figure 14. A maximum induced edge lift of 1 inch, much greater
than currently impressed on the building, would begin to mobilize the full
72
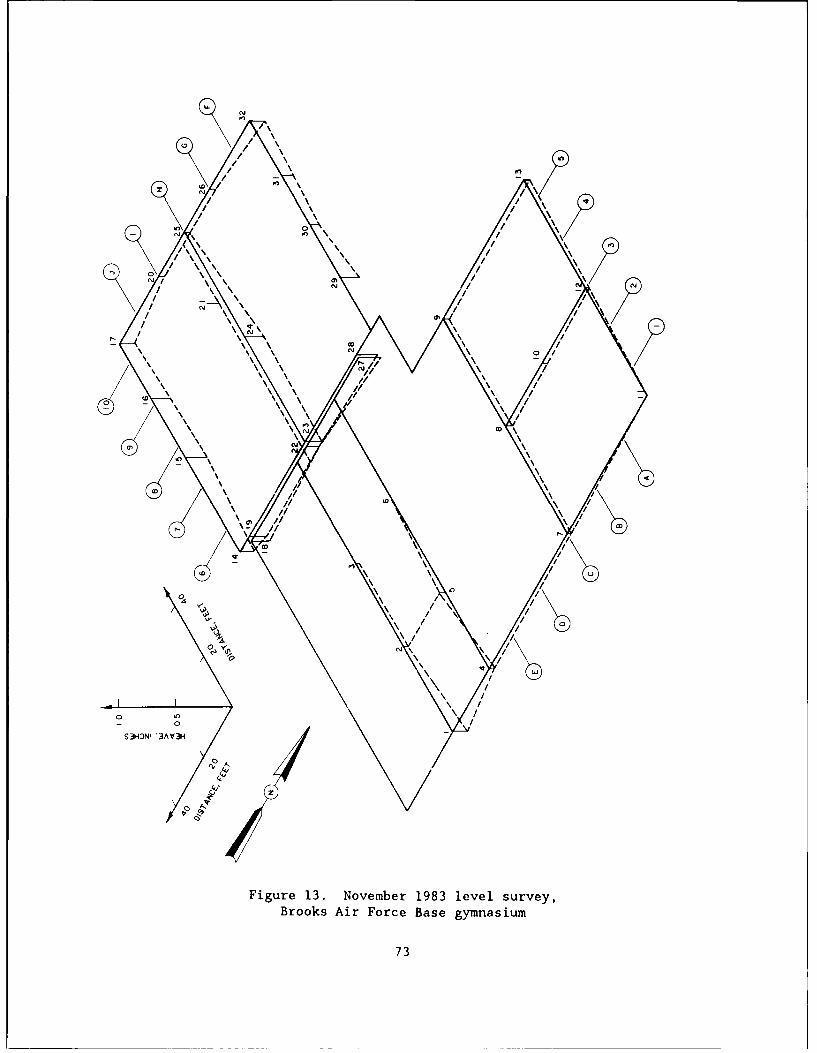
Ll.
NN
(D \
e)C
IIY
CO /
X~
CD/
CY/
S3HONI'3AV/
- el,0A,
4C"'
Figue 13 Novmbe 198 levl suveyBroos Ar Foce ase ymnsiu
73/
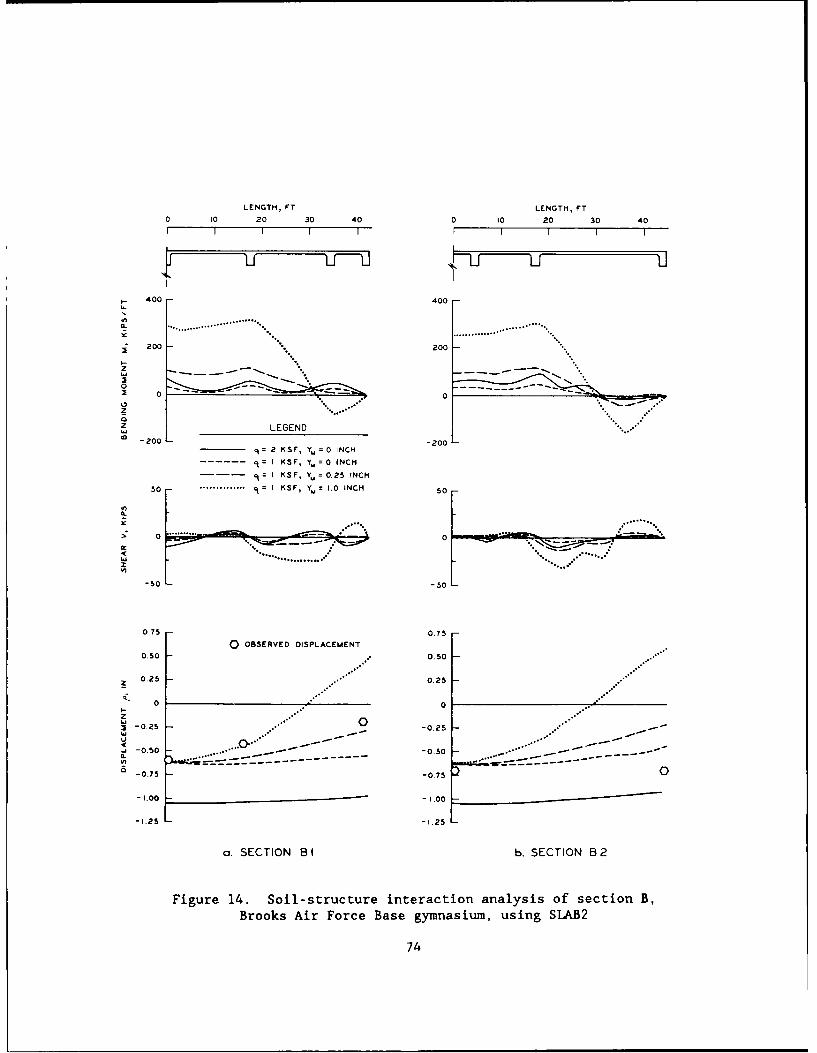
LENGTH, FT LENGTH, FT
0 10 20 30 40 0 0 20 30 40I I fI FI I I
11
_ 400 400
..i/1ILo ................. ...°... .°" ' .
f. .......................
£200 200
2 0 0 !p
z LEGEND ....,. - --
-200 -200- 2 KSF, Y.=0 INCH
...- c= I KSF, Y. = 0 INCH
'= I KSF, YM = 0.25 INCH
50 .............. = I KSF, Y.
= 1,0 INCH 50
; .......... Z '..... .--.. ."..0 "..........-..
I*J °°°".......... ......... ° ." °.....
-50 -- 50
075 0.75
Q OBSERVED DISPLACEMENT0.50 , 0.50
0.25 - 0.25
0 0
-025 0-025 -
-0 50 -0.50 ..
- -----.........* -- - - - - -07 - - - -
-0.75 -0.7S 0
-1.00 -1.00
-1.25 -1.25
a. SECTION B b. SECTION B2
Figure 14. Soil-structure interaction analysis of section B,
Brooks Air Force Base gymnasium, using SLAB2
74
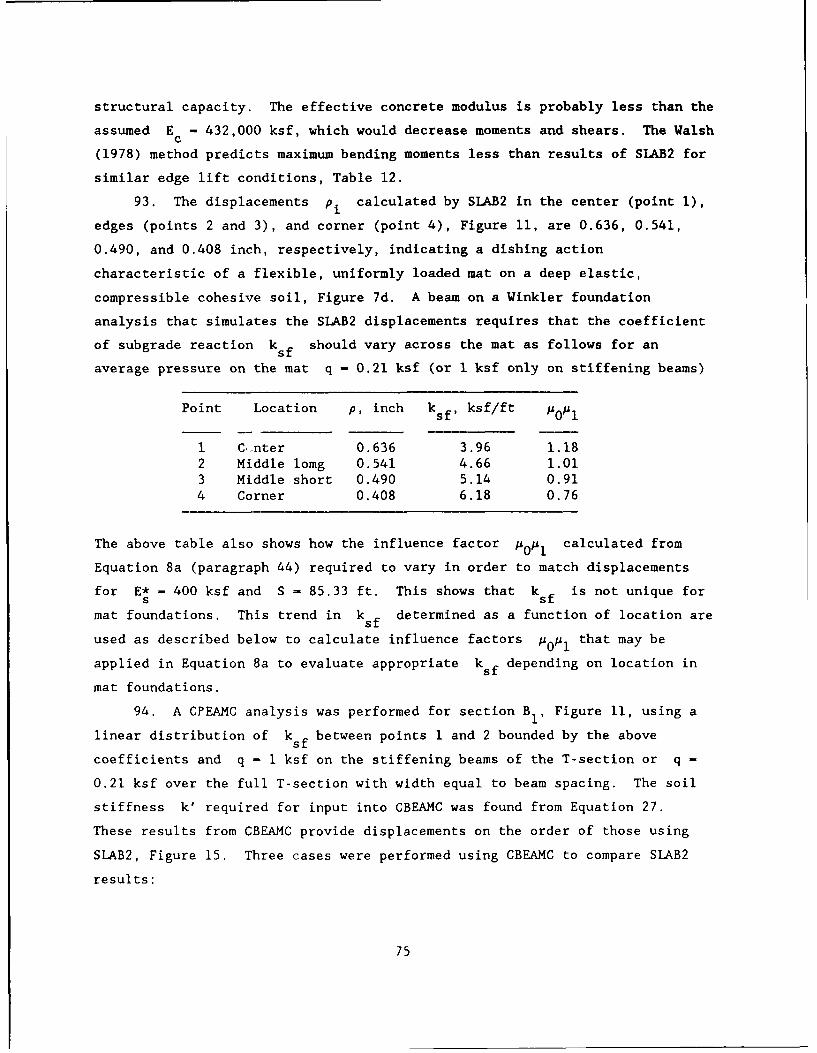
structural capacity. The effective concrete modulus is probably less than the
assumed E - 432,000 ksf, which would decrease moments and shears. The Walshc
(1978) method predicts maximum bending moments less than results of SLAB2 for
similar edge lift conditions, Table 12.
93. The displacements pi calculated by SLAB2 in the center (point 1),
edges (points 2 and 3), and corner (point 4), Figure 11, are 0.636, 0.541,
0.490, and 0.408 inch, respectively, indicating a dishing action
characteristic of a flexible, uniformly loaded mat on a deep elastic,
compressible cohesive soil, Figure 7d. A beam on a Winkler foundation
analysis that simulates the SLAB2 displacements requires that the coefficient
of subgrade reaction ksf should vary across the mat as follows for an
average pressure on the mat q - 0.21 ksf (or 1 ksf only on stiffening beams)
Point Location p, inch ksf, ksf/ft A0 i
1 C.nter 0.636 3.96 1.182 Middle lomg 0.541 4.66 1.013 Middle short 0.490 5.14 0.914 Corner 0.408 6.18 0.76
The above table also shows how the influence factor poi calculated from
Equation 8a (paragraph 44) required to vary in order to match displacements
for E* - 400 ksf and S = 85.33 ft. This shows that kf is not unique fors
mat foundations. This trend in ksf determined as a function of location are
used as described below to calculate influence factors p0 i that may be
applied in Equation 8a to evaluate appropriate ksf depending on location in
mat foundations.
94. A CPEAMC analysis was performed for section B1 , Figure 11, using a
linear distribution of ksf between points 1 and 2 bounded by the above
coefficients and q - 1 ksf on the stiffening beams of the T-section or q -
0.21 ksf over the full T-section with width equal to beam spacing. The soil
stiffness k' required for input into CBEAMC was found from Equation 27.
These results from CBEAMC provide displacements on the order of those using
SLAB2, Figure 15. Three cases were performed using CBEAMC to compare SLAB2
results:
75
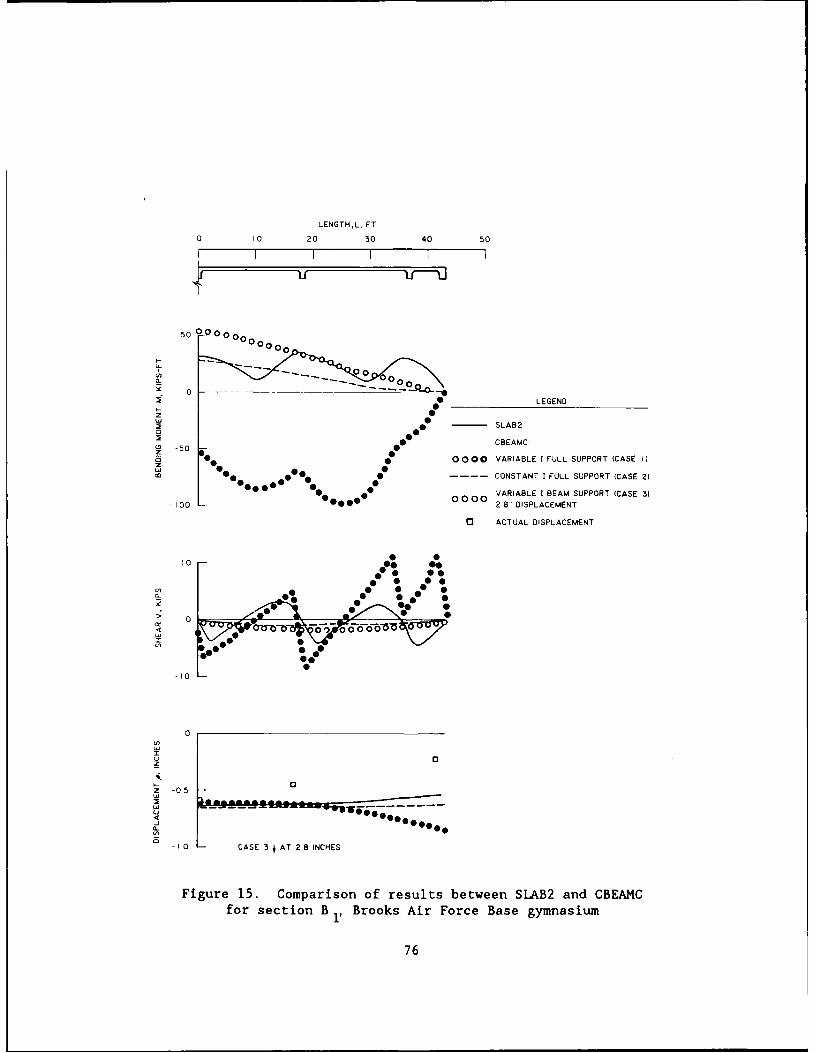
LENGTH.L, FT
0 10 20 30 40 50
00LEGEND
0
(3 -50z e 0000 VARIABLE I FULL SUPPORT (CASE 1)
0% ---- CONSTANT I FULL SUPPORT (CASE 21
00 os!00 VARIABLE I BEAM SUPPORT (CASE 3)-100 0.02 8- DISPLACEMENT
C3 ACTUAL DISPLACEMENT
10
00
-(0
0
U)
z
z -05
Uj
-j
-0 CASE 3 AT 2 8 INCHES
Figure 15. Comparison of results between SLAB2 and CBEAMCfor section B 1,Brooks Air Force Base gymnasium
76
Case Description
1. Variable I, The moment of inertia is that of the T-beamfull support section indicated in Table 10b between cross-
beams, but equal to
S(t + D)3
12
at each cross-beam, Figure 10. Soil supportwas used under the entire T-beam section.All stiffening beams loaded q - 1 ksf.
2. Constant I, Moment of inertia represented only by thefull support T-beam section, Table lob. Cross-beam
I excluded. Soil support provided underthe full T-section
3. Variable I, Moment of inertia same as case 1, but soilbeam support supports only the stiffening beams.
Case 2 simulates SLAB2 results best, but moments at each cross-beam are not
simulated because loads were not applied on the cross-beams. Case 1 where
loads were applied on the portion of the mat supported by stiffening beams
caused large edge settlements and negative bending moments (tension in the top
fibers) that contrasted with the positive moments from SLAB2 (compression in
top fibers). Results of case 3 show that the flat portion of the mat
contributes substantial support since actual displacements are much less than
2.8 inches.
Data Processing Facility, Randolph Air Force Base
95. The data processing facility, located on Randolph Air Force Base
near San Antonio, Texas, between First Street East and First Street West
adjacent to J street, was completed in 1975. The facility is a rectangular
200 by 150-ft single story masonry building constructed on a ribbed mat with
fairly regular beam spacings from 13 to 19 ft, Figure 16. Beam width is
normally 12 inches and beam depth below the mat top is 36 inches. Mat
thickness between stiffening beams is 6 inches.
96. Soil parameters. Soil parameters from results of laboratory tests
on soil samples from five borngs taken in May 1972 are shown in Figure 17.
77
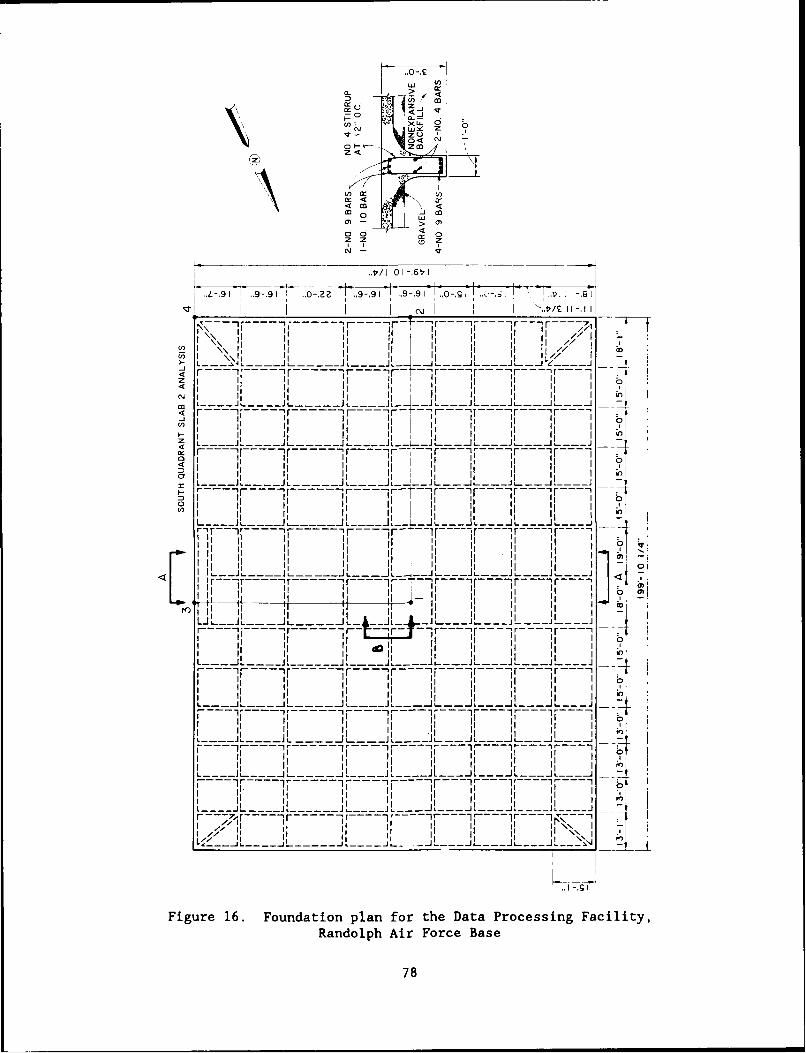
..0-,
a -U)
I--~~Z~:LJ 0 b
0< N0I ~~ zm
U) cc )
< <O0
-z z ' o'
1f I OI ,-.6tr,...-. 91 .9-.91 .0- ,9-,9I - .9-.9 !Io -,g i
I iI I , i , ! " .. , ,, -.,
I Ii II I i I
z ,jII II I I ,I I Ii i I1 L.J L.---JL.rJ -J - .
VJ
, j IJ
r-i-]r .-- 7 I----IF- - - -- If---7 - -- -
<m i ' L I -
--+1
D ini 1 -r- I- - -
L J..J L L AL JL. L.
r I - - I
rJ 'K4L-I---I I . I' I II I II
7 - - ----- ' r-r - r-1
I
.1 bD11---J - -A
I II
1 I --- -- - Ir ir
_L _ ___L___ ___J___
L L -- I j
Figure 16. Foundation plan for the Data Processing Facility,Randolph Air Force Base
78
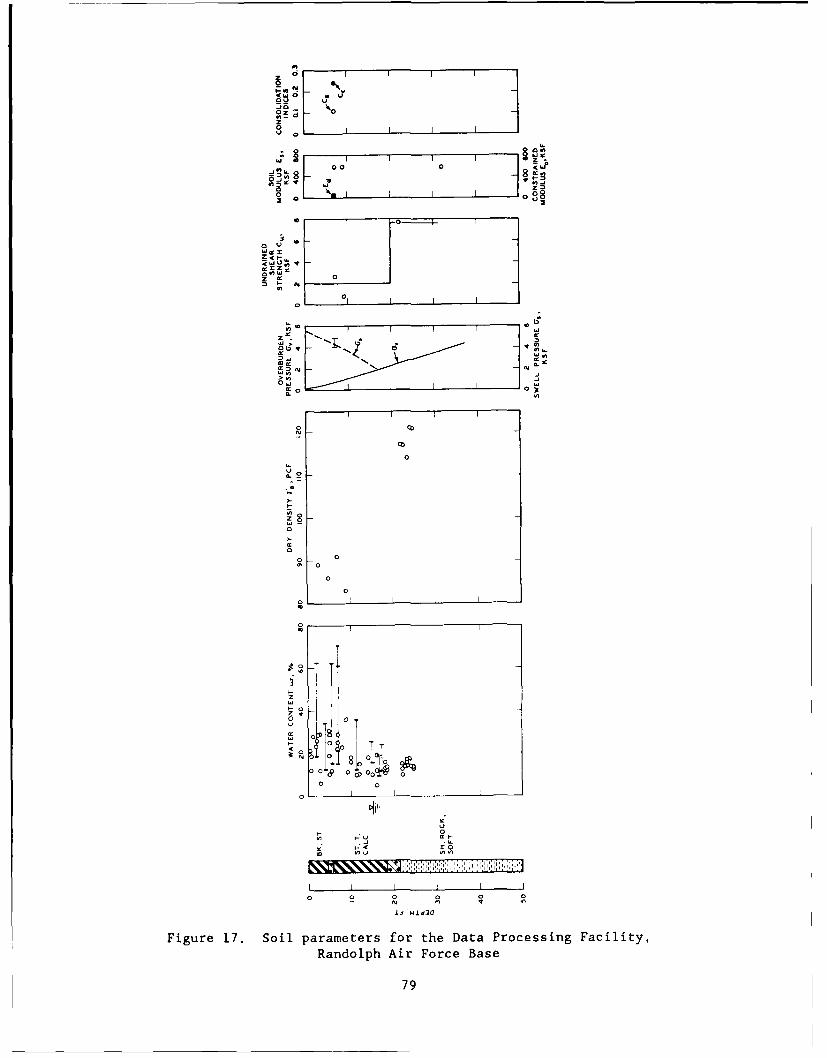
0_ I I I I
u. o I 0
0 a
w I I I
_.00 0 -C
N I I I I I0 QuO
* II
0 0 j 0z ~'0
0-
zu -0. 0
Z Cc
o
01
00
cc 0
0 o
0
I- ,
z8
0
0 0
00
o 70
I I I
0 0 0 (3 0 0
0 0
Figure 17. Soil parameters for the Data Processing Facility,
Randolph Air Force Base
79
The overburden soil consists of about 8 to 10 ft of plastic CH dark gray to
black, noncalcareous, stiff clay containing some scattered, discontinuous
zones of clayey gravel. About 7 to 9 ft of tan to light gray, low to medium
plastic CL clay containing calcareous particles up to cobble size was
encountered beneath the surface overburden soil. Two to 3 ft of clayey and
silty gravel overlying the primary formation was encountered about 18 ft below
the ground surface. A perched water table was observed 12 to 15 ft below
ground surface, which probably collected in the permeable gravel layer
overlying the relatively impervious tan to gray clay shale of the primary
formation. The primary formation is Taylor marl of Cretaceous age.
97. Results of several undrained triaxial Q tests shown in Figure 17
indicate that the allowable bearing capacity should be at least 2 ksf assuming
a safety factor of about 3. Young's soil modulus evaluated from results of Q
tests is about 600 ksf, .,hile the constrained modulus Ed is only about 60
ksf based on swell indices and Equation 26. Swell pressure from a
consolidometer/swell test (Method C, ASTM D 4546) on an undisturbed specimen
taken 7 ft below ground surface in the overburden soil was 4 ksf indicating
desiccation.
98. Level survey. A level survey conducted in November 1983 indicated
center lift up to 0.5 inch toward the southwest portion of the mat, Figure 18.
Settlement is about 0.3 inch in the West corner increasing to about 0.6 inch
at the south and north corners. The east corner shows substantial settlement
of about 1.1 inches. A 20-ft addition had been added to the northeast side
and east corner during 1979. This addition was secured with dowels into the
existing building. A level survey conducted in April 1985 indicated a general
heave increasing to 0.25 inch at the east corner relative to the November 1983
survey.
99. Distress was not observed prior to 1979 before the addition. A long
fracture was observed in the mat in May 1984, Figure 18, inside the building
near the east corner. The ceiling and floor tiles were showing several inches
of lateral distortion near the center of the original building. Excessive
settlement caused by the addition appears to be contributing to the interior
distress in the superstructure; therefore, consideration should be given to
80
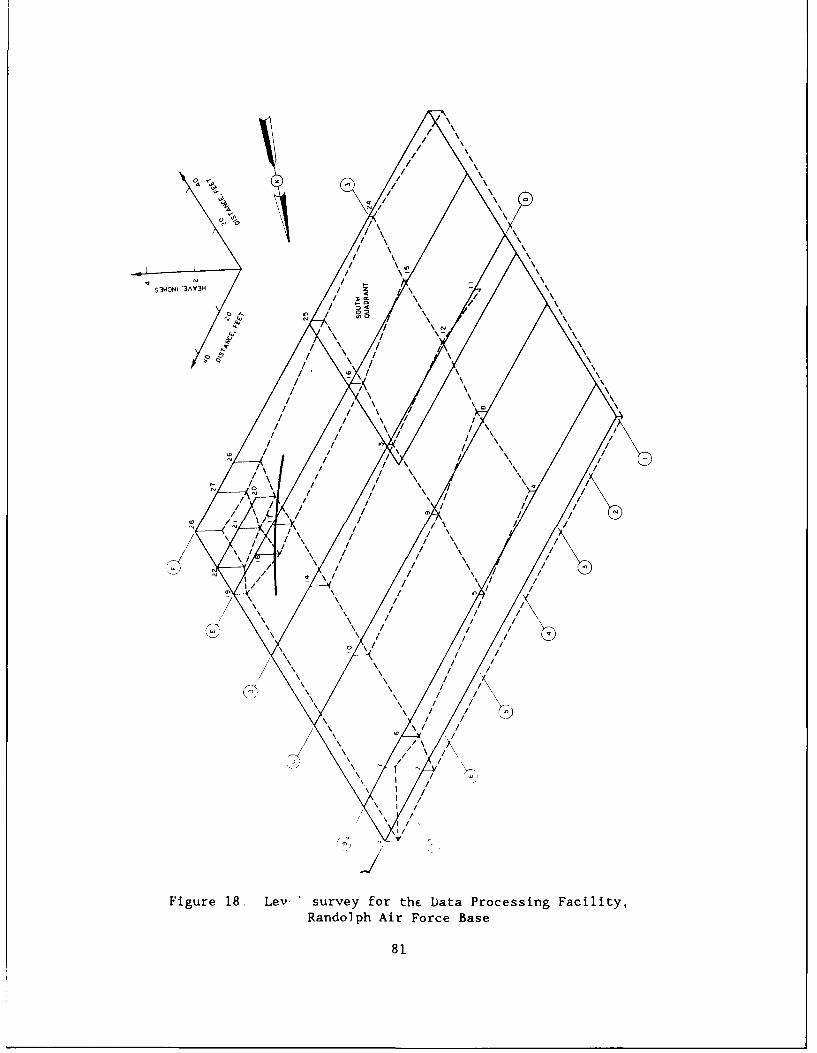
\ //
\\\
/ \
//// '\
\I \I !V3R \\
,, ,, '/. , 4/,i // \
I iI
/ \// \ /
//\ \/ /0 / \/\
/.. ) '//",
/ / 4. /\ '4:\,/ /, ,, , \\ \/ \\ /II'
/\I / /
/ I \ '
/ \ !
'4\,/ ../\\
/., I '44.4. /
/ \ /
Fiue1 . Le./sre fo/h t Pr singFciiy
Randolp A/ Foc Bs
81 '~I
providing flexible connections with new additions. The grade around the
perimeter was about 1 percent or more. The maximum observed A/L ratio was
1/400 near points 19-22.
100. Analysis. Soil-structure interaction analyses were performed for
sections A and B shown in Figure 16 using program CBEAMC and for the south
quadrant using program SLAB2. Option NSYM - 4 in SLAB2, Table C3, requires
analysis of only 1/4 of the mat with symmetry about the X and Y axes. The
soil elastic modulus was taken as 600 ksf. Loading pressure on the stiffening
beams was assumed 2 ksf. For section A, the beam width is 18.5 ft with length
150 ft and for section B, the beam width is 16.5 ft with half length of 100
ft. The mat coefficient ksf for the CBEAMC analysis is 3.1 ksf/ft leading
to a soil stiffness k' = 56.4 ksf for section A and 50.3 ksf for section B.
The finite element mesh for program SLAB2 is illustrated in Figure 19.
101. Results of program SLAB2 for the south quadrant sections A and B,
Figure 16, are shown in Figure 20. Calculated moments and shears for no
imposed heave are small with a maximum center settlement of 1.1 inches.
Settlement calculated by CBEAMC for sections A and B for loads consistent with
the SLAB2 analysis are 0.92 and 1.0 inches, respectively. While settlements
calculated by CBEAMC are flat, SLAB2 settlements resemble a shallow bowl. The
distribution of ksf required to duplicate SLAB2 displacements using program
CBEAMC for points 1 to 4, Figure 18, for an average pressure q - 0.264 ksf,
E* - 600 ksf, and B - 149.8 ft iss
Point Location p, inch ksf , ksf/ft 0/i
1 Center 1.073 2.82 1.422 Middle short 0.789 3.96 1.013 Middle long 0.814 3.76 1.074 Corner 0.610 5.13 0.78
The above -able also shows the distribution for the influence factor Popi,Equation 8a. The A/L ratio between center and edge is a maximum of 1/1800
such that cracking is not expected if heave is not imposed on the foundation.
102. Figure 20 shows that the locations of the maximum (+) and minimum
(-) moments and shears for no imposed heave are located near the midedge and
82

10 20 30 40 50 60 70 80 90 100 1 10 120 130 140
9 Q- - - 139___..I I39
-+x
8 _138
7 137
6 136
5135
4 134@ +x
__ 133
0® _
y 2- ----------------- 132
00 -Y 09
11 21 31 41 51 61 71 81 91 101 111 121 131
LEGEND
-x A MINIMUM MOMENT x DIRECTION+x A MAXIMUM MOMENT x DIRECTION-y A MINIMUM MOMENT y DIRECTION+y A MAXIMUM MOMENT y DIRECTION- 0 MINIMUM SHEAR+ 0 MAXIMUM SHEAR
Figure 19. Finite element mesh for SLAB2 analysis,Data Processing Facility, Randolph Air Force Base
83
LENGTH L, FT
0 20 40 60 60 100 120 140 100 120 140 160 ISO 200
~- 200
Q. A A. A0 -' wA~ ~/ A A-i..
2 -200 I I
A ,A , I !" A- A/
m -400
0 'Aj A At
> 50 -OSEVE DISLAEM N
z A. A A A [LB2 UPPE RIGH SECTIONA
L 8 2
-OBSERVED DISPLCCE NTIL
I A025E
2 A A A SLAB2. UPPER RIGHT SECTIONwA
~ -00LENTER HEAVE 0 6 A
0-AA A A A A
A SECTION A B SECTION B
Figure 20. Soil-structure interaction analysis, Data
Processing Facility, Randolph Air Force Base. q - 2 ksf
84

corner, respectively. Distances from the edge and corner are approximately
the same or less than the relative stiffness length11
4E-- c (28)
where
9' = relative stiffness length, ft
E = Young's concrete modulus, 432,000 ksfc
E - Young's soil modulus, 600 ksf
I - moment of inertia of the mat cross-section, ft4
103. Imposing zero center displacement for sections A and B using CBEAMC
and edge-down gaps in the south quadrant using SLAB2 roughly simulated the
observed displacements, Figure 20. Displacements calculated by SLAB2 were
realigned to simulate zero displacement near the mat center. Calculated
moments and shears from both programs CBEAMC and SLAB2 appear to be similar
and approach the capacity of the T-beams, Table 10 The maximum and minimum
moments and shears calculated by SLAB2 were located near the mat corners
within distance 9', Equation 28, and approximated the mat capacity. The
Walsh method, Table 12 predicts high bending moments of 270 kip-ft, but still
within the mat capacity.
Maintenance Shop and WarehouseUS Army Reserve Center
104 The maintenance s!'op and warehouse of the US Army Reserve Center
were constructed in 1980 and are located between Sultan and Winans Road near
Harry Wurzback Road in Fort Sam Houston, Texas. They are steel frame
rectangular buildings with metal siding and concrete masonry unit walls. The
layout and size of the foundations are illustrated in Figure 21. Beam
spacings vary from 17 to 27 ft. Beam depth for the maintenance shop is 3 ft
including the 5 inch thickness of the flat portion of the mat between
stiffening beams. The depth of each of the six beams for the warehouse mat
from left to right varies from 2.5 to 6 ft (numbers 1 to 6, Table 10)
including the 5-inch thick flat slab between stiffening beams. Beam width
varies from I ft at the bottom to 2.5 ft near the top; analyses assumed an
average width of 1.5 ft. Steel reinforcement consists of two number 11 bars
85

A
E. -- - ,--, .. .- - r - - -- ...- -- -7 .-i --I Ii/- I III II I' II II 1$.. . _L. . . .. L J,-_ _-LL JL iL i .J1,L..__
--- T -~---------LIL--II I II :I- . . . -r . . . -~ -- -' --" -r --- ---} [ ii Il A[ "t I ,i I ,Jr - -- - -- r---- -- ---- ---
- -. - - - - ---- - - - - ...r
IL ~ -r - - - - -- '-II II I/I II_ _ _ ' . . ,'J IL L . .
i -[ ... . -J -... --r ... -... - r Ir- . .. -- -- ---
24-8- .20'0 20i-0- 2 I 27-0 27-0 27-0 21-6 6-10
204'-0"
MAINTENANCE BUILDING
I II / i I I I \
i II t, II i i ,I I !I \
- .- . ' .- - - - - L - - -. - -_ _ ",_
I I ! I I IIII II
I I
25- 250 2- I 250 2-
Si:
US rm Reev Cetr ot! a oso
I 8
._25*-'-o . 25 -'. __25'-o; .. 25'-o- - 25-o"
WAREHOUSE
Figure 21. Foundation plan Maintenance Shop and Warehouse,US Army Reserve Center, Fort Sam Houston
86
top and bottom in each beam, except beams in the short direction of the
maintenance shop contain two number 7 bars top and bottom.
105. Soil parameters. Soil parameters evaluated from results of
laboratory tests on soil samples of 34 core borings obtained October and
November 1978 are shown in Figure 22. Overburden materials consist of about 2
ft of medium plasticity (CL) black clay, 3 or 4 ft of high plasticity (CH)
brown clay, about 7 ft of white, calcareous medium plastic (CL) clay, and
about 3 ft of clayey gravel. The gravel contains a perched water table with
water level beginning about 14 ft below ground surface. The primary material
underlying the overburden is a tan to gray, weathered and jointed clay shale
of the Anacacho formation of Cretaceous age. This material is about 200 ft
thick and consists predominantly of moderately hard calcareous shale with
occasional hard limestone interbeds up to 20 ft thick. Weathered shale is
found down to about 49 ft below ground surface and the unweathered, hard, blue
shale is found below this depth.
106. Results of triaxial undrained strength Q tests indicate that the
soil has an undrained shear strength of 2 ksf near the ground surface
increasing linearly with depth at the rate of 2 ksf/15 ft of depth. The
allowable bearing capacity of soil beneath the stiffening beams is at least 4
ksf. The elastic Young's soil modulus is about 400 ksf down to 30 ft and 800
ksf or more below this depth. The constrained modulus is about 200 ksf or
less down to 30 ft and more than 400 ksf below this depth.
Consolidometer/swell test results indicate swell pressures of about 2 ksf and
significant swell potential above 14 ft of depth.
107. Level survey. A survey conducted on the mat surface of the
maintenance building in November 1983, Figure 23, shows a general settlement
increasing toward the north from 0.5 to 1.2 inches. An unusual, symmetrical
dual-shaped differential heave in the n hern part of the mat appears, which
could be a construction error in the mat elevation. The northern half of the
mat was designed with a slope that caused the east and west perimeters to be 4
inches lower than the center to permit drainage of runoff water from washing
operations. A 1-inch error in the slope at points 19-13-9 and 17-11-7 will
account for this unusual displacement pattern. Visual observations in May
1984 indicate no distress, except for a small crack in the concrete masonry
87
8
0 0
0 0 0
0
o.. 0
I ]8T 008
0 0 0 J
00
8o 0
0 0 00
00o o~
0000
00 00
0 '1 0 40b
8o
0 0
Figure 22. Soil parameters Maintenance Shop and Warehouse,US Army Reserve Center, Fort Sam Houston
88
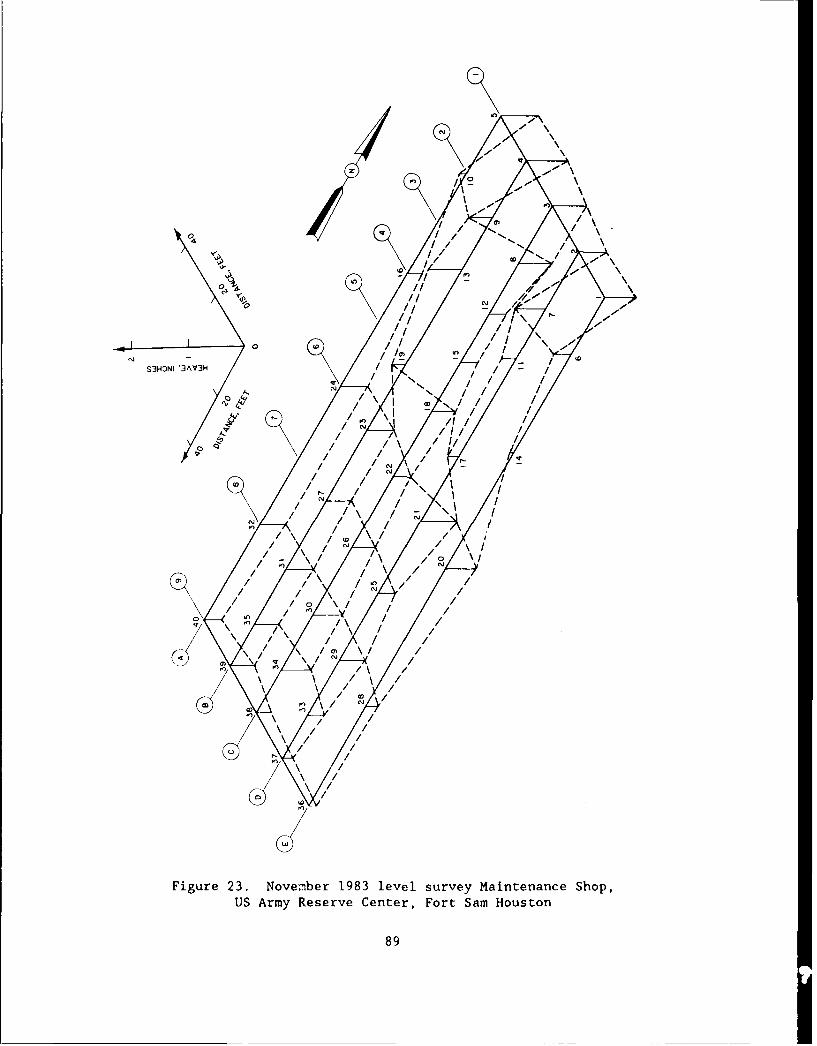
N I
I\0
In ~ N
S3HONI '3AV3HIIj
N /
In'
ICD n
S3~I3'~ / / 0
Fiue2. Noeme 198 lee suve Maneac/hp
/ ,
/, / ,
/ ~/
S/ / 89
/ \/
/ ~ /0) / /~ /
Fiur /3 Noe \e 198 lee uvyMineac hp
o SAm eev eteFr a oso
\ /0) \ 89
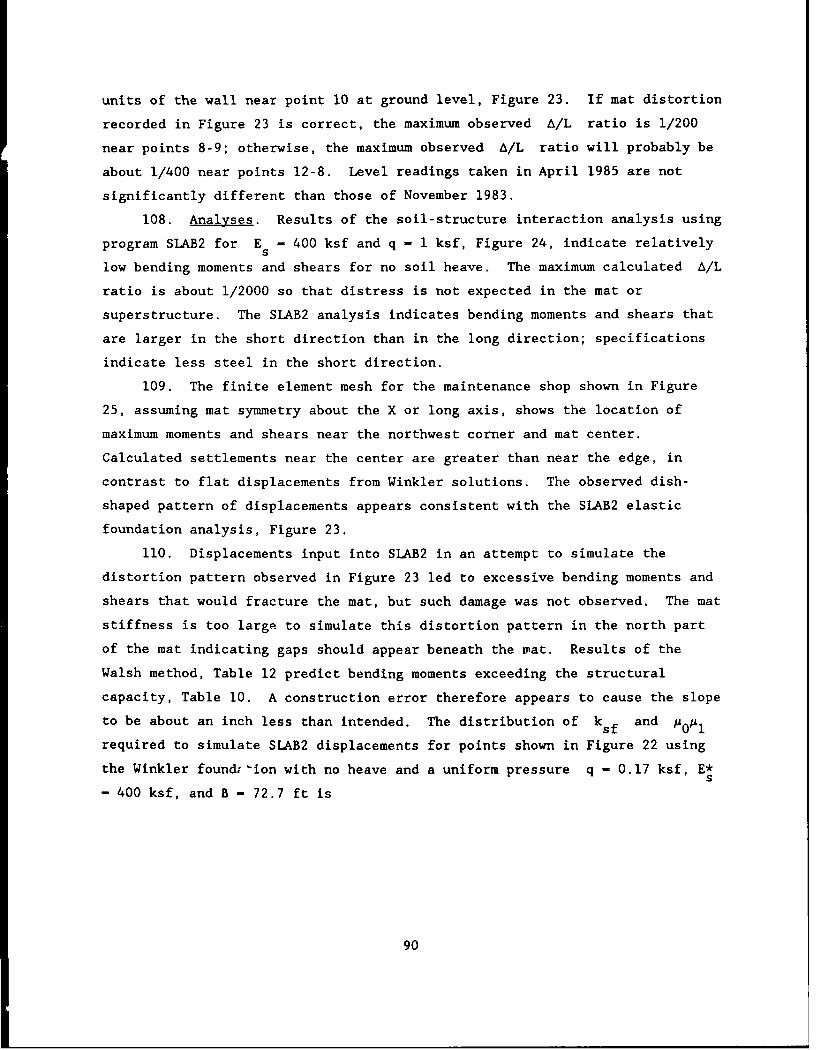
units of the wall near point 10 at ground level, Figure 23. If mat distortion
recorded in Figure 23 is correct, the maximum observed A/L ratio is 1/200
near points 8-9; otherwise, the maximum observed A/L ratio will probably be
about 1/400 near points 12-8. Level readings taken in April 1985 are not
significantly different than those of November 1983.
108. Analyses. Results of the soil-structure interaction analysis using
program SLAB2 for E - 400 ksf and q - I ksf, Figure 24, indicate relatively5
low bending moments and shears for no soil heave. The maximum calculated A/L
ratio is about 1/2000 so that distress is not expected in the mat or
superstructure. The SLAB2 analysis indicates bending moments and shears that
are larger in the short direction than in the long direction; specifications
indicate less steel in the short direction.
109. The finite element mesh for the maintenance shop shown in Figure
25, assuming mat symmetry about the X or long axis, shows the location of
maximum moments and shears near the northwest corner and mat center.
Calculated settlements near the center are greater than near the edge, in
contrast to flat displacements from Winkler solutions. The observed dish-
shaped pattern of displacements appears consistent with the SLAB2 elastic
foundation analysis, Figure 23.
110. Displacements input into SLAB2 in an attempt to simulate the
distortion pattern observed in Figure 23 led to excessive bending moments and
shears that would fracture the mat, but such damage was not observed. The mat
stiffness is too large to simulate this distortion pattern in the north part
of the mat indicating gaps should appear beneath the ipat. Results of the
Walsh method, Table 12 predict bending moments exceeding the structural
capacity, Table 10. A construction error therefore appears to cause the slope
to be about an inch less than intended. The distribution of ksf and P0 i
required to simulate SLAB2 displacements for points shown in Figure 22 using
the Winkler found,-ion with no heave and a uniform pressure q - 0.17 ksf, E*s
- 400 ksf, and B - 72.7 ft is
90
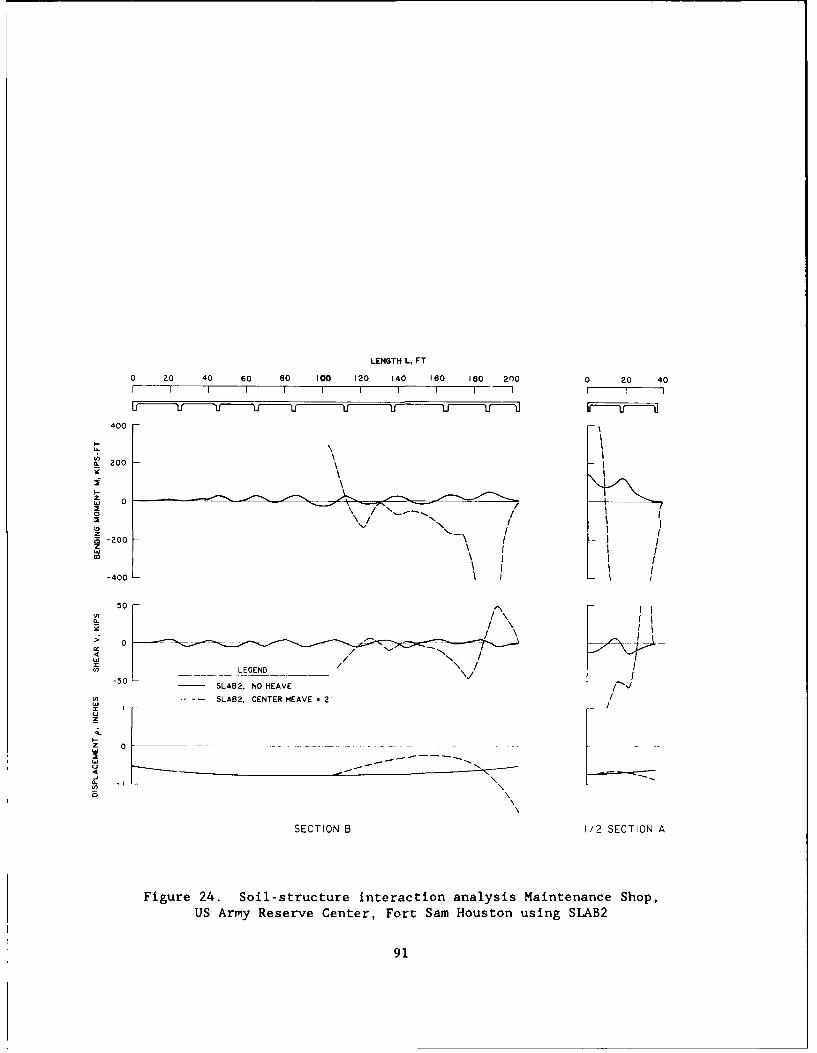
LENGTH L, FT
0 20 40 60 80 100 120 140 160 8SO 200 0 20 401 I I I I _ _ _ _ _ I1 -
400
(L 200
.-
w 0
200
-400
50
>E 0
-50 SLAB2. NO HEAVE
SLAB2 CENTER HEAVE "2-
\ I i
\ -
Z 0 __ -- -- - - -
L.J -J" [ /
zw 0
o\
SECTION 8 1/2 SECTION A
Figure 24. Soil-structure interaction analysis Maintenance Shop,US Army Reserve Center, Fort Sam Houston using SLAB2
91
1 HOIM J4VH
0 0 0
I I I
- -®N
X>>-
- 0
- -
xx
-
> 0
S0 0 0
x x
Figure 25. Finite element mesh of the mat supporting theMaintenance Shop, US Army Reserve Center
92

Point Location p, inch ksf , ksf/ft 0pi
I Center 0.737 2.77 1.992 Middle short 0.541. 3.77 1.463 Middle long 0.628 3.25 1.694 Corner 0.450 4.53 1.21
Dental and Medical Clinics
111. The dental and medical clinics, located in northeastern Fort Sam
Houston near Garden Avenue and Harvey Road, were constructed in 1980 and 1981.
The clinics are single story, rectangular brick and concrete masonry
structures supported on ribbed mats, Figure 26. Vertical construction joints
were closely placed in the superstructure at approximately 4-ft intervals to
increase flexibility. The site slopes downward from northwest to southeast at
a slope of about 3 percent leading to a grade differential close to 8 ft
across the diagonal of both structures. Beam spacings vary from 10 to 15 't
in the dental clinic and 11 to 30 ft in the medical clinic. Beam depth of the
dental clinic mat is 2 ft 8 inches from the mat top with beam width of 1 ft 4
inches. Beam depth of the medical clinic is 3 ft from the mat top with beam
width of I ft 6 inches. Thickness of the flat part of the mat is 6 inches.
Reinforcement steel consists of three number 9 bars placed both top and bottom
in the stiffening beams supporting the medical clinic.
112. Soil parameters. Results of laboratory tests on soil samples from
borings taken at the dental clinic site in December 1977 and January 1978 are
shown in Figure 27a. Results of laboratory tests on soil samples from five
additional borings obtained at the medical clinic site in January 1979 are
shown in Figure 27b. Overburden material varies from 6 to 16 ft thick and
consists of dark brown to black, gravelly, medium CL to high CH plasticity
clay and clayey gravel GC. Figure 27a shows about 10 ft of black CH clay
overlying about 6 ft of clayey gravel beneath the dental clinic site. Figure
27b shows about 6 ft of black CL to CH gravelly clay overlying about 2 ft of
sandy gravel beneath the medical clinic site. The clayey gravel contains a
perched water table with water level 7 to 12 ft below ground surface. The
primary material below the overburden is the Taylor formation of upper
Cretaceous age. This material is yellow-brown, calcareous, slightly silty,
93
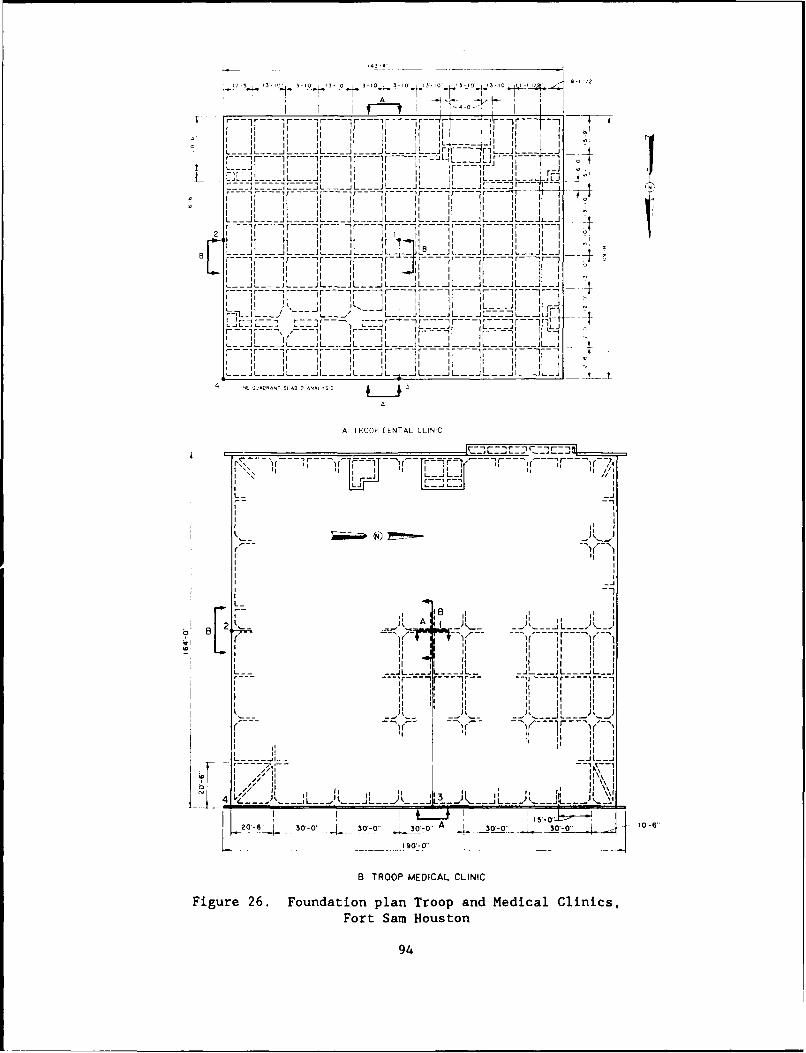
AA
II ' I
' LL. ' JffIr1f ' JLJJ i i3T -4
3 4 -'oI I n
I -II
_- : I! - - -, L L LrL* L al _jN-- -- I- -..-.
r~- l ! I ',i- , I I, I I ;
LJ r I- - - - - L --
L L-L__LJL_ JL JL JL -L- ,311
L J_ _I _ .. J L -_ _J L_ ... L L- - J L L --- - - -'- --
II 1
L-_ -I _ _, __ , __J__ ,-- '--- .--. ,---,,--..J-, __ i__
I'----- " 1 i ---- ''------''-----' ---------- '------'------'--------- --- 'i'F--, I ' , "
- J __1 1-J__ -- J " L - L__ J jL. J = L _11 -r- '
F -- -1 i -- -- \ /- -- -1 Ir --- -- - Ir :- --- -; r l:' - Lr-T
-- -- - 1*I r ' I i
I I I II II I
iI 1
* I I I II III
ii I ]
..... 4 06
4 d .' ADPANT SLAB 2 ANAL
A
A TROOP MENTAL CLINIC
L-
if [
11L
L( - -i- J L _.. _ _ J l
-- .... L,_b'-O q -. AI .. . ..... -
Figure 26. Foundation plan Troop and Medical Clinics,
Fort Sam Houston
94
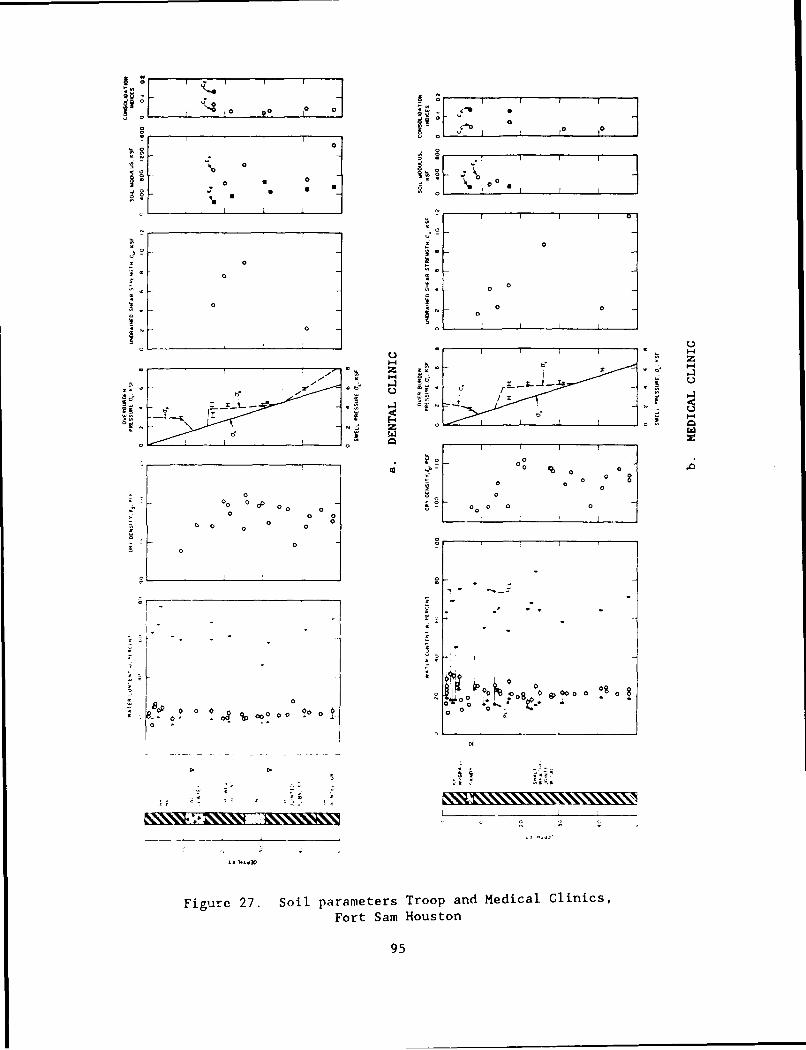
00
0 00 0C 0 0
00
g __ _ _ I__ _ __ __ _ _
FP -
II-I l C
zz
.0 0 0E0
- o o
00
000
00
"~~~~0 r ' ,"" P /0 0 0
0 0j C 0 0 I I
0
0 -
"io o--.00 ow,. o4 oo
?PL 00 QIo 00000 1
Figure 27. Soil parameters Troop and Medical Clinics,
Fort Sam Houston
95

soft to moderately hard (Rock classification) clay shale containing occasional
hard marl up to 3 ft thick. The shale is expansive CH jointed and weathered
clay up to 50 or 60 ft below ground surface.
113. Results of triaxial undrained Q strength tests indicated an
undrained shear strength of 1.6 ksf about 9 ft below ground surface with
substantially greater strengths below this depth. The allowable bearing
capacity is at least 3 ksf. The soil elastic modulus E varies from 200 tos
400 ksf within the top 15 ft of soil and 600 to 1000 ksf below 15 ft from the
ground surface. Results of consolidometer/swell tests indicate a potential
for swell and swell pressures exceeding calculated vertical overburden
pressures above 7 ft and below 17 ft, Figure 27.
114. Level survey, dental clinic. A level survey of the dental clinic
conducted in November 1983, Figure 28, indicates a tendency toward center
heave up to about I inch. Settlement of about 0.5 inch was measured near the
east edge. The April 1985 survey indicated about 0.3 inch reduction in
settlement (or heave) near the east edge relative to the November 1983 survey
and about 0.1 inch more heave near the mat center. Visual observations of the
building in May 1984 indicated no cracks in the exterior brick panels; these
panels include vertical construction joints at 4-ft intervals. Cracks were
observed in the exterior stiffening beams on both east and west sides of the
dental clinic mat. The maximum observed A/L ratio was about 1/250 near
points 6-16, 9-20, and 27-28, Figure 28, running east to west.
115. Analysis. dental clinic. Results of soil-structure interaction
analysis of the dental clinic mat, Figure 29, were completed for sections A
and B in Figure 26a using CBEAMC and for the northeast quadrant of Figure 28
using SLAB2. The soil modulus E* was taken as 400 ksf. Mat settlement fors
a uniform pressure of 1 ksf on the stiffening beams of section A was 0.83 inch
using CBEAMC. SLAB2 calculated about 1.0 inch of center settlement and 0.8
inch edge settlement. The distribution of k for points 1 to 4, Figuresf
26a required to simulate SLAB2 displacements using the Winkler foundation, q -
0.22 ksf uniform pressure, E* - 400 ksf and B - 109.7 ft iss
96
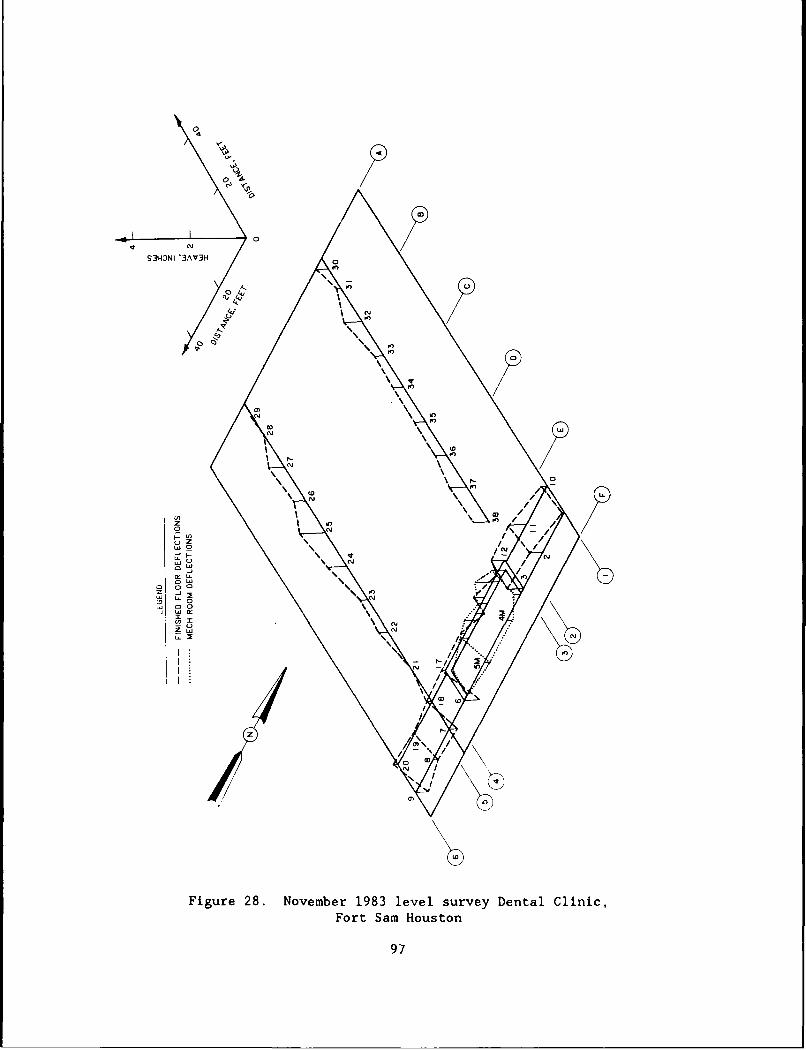
IA
0
S3H:)NI '3AV3H
'S DI.,In
0~0
w 0
'CY
CYC
0' 0
CV'
'C N "C / A
w~ 0INDC
0 oO 'S
Figue 28 Novmbe 198 levl suveyDentl Clnic
For Na oso
~ 00 97
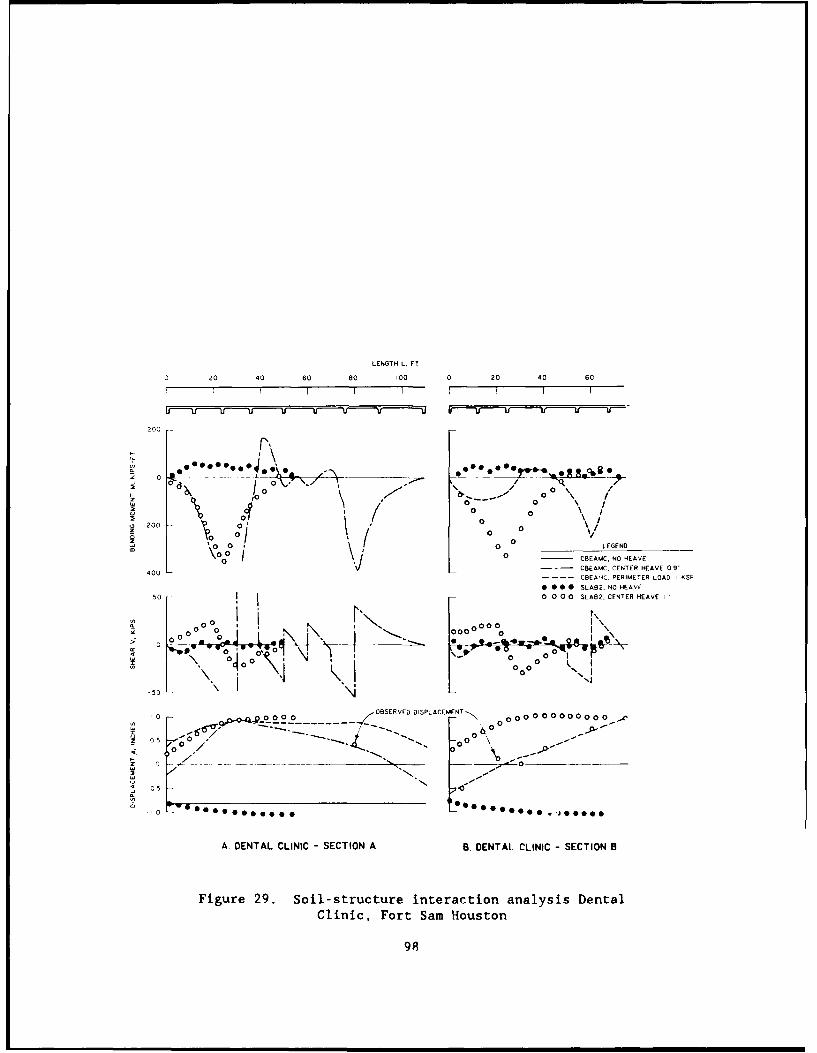
LENGTH L. FT
0 20 40 60 80 100 0 20 40 60
SII ! I I
200
o d ~ /0 0IV* 0 0"" " "'-\ --- ".; ",-'
0 /
01 1 0-200 0i 0 0
0 0 LEGEND
0 O -- CBEAMC, NO HEAVE
-400 ---- CREAMC. CENTER HEAVE 0 9CBEA'4C. PERIMETER LOAD I KSF
0 000 SLAB2, NO HEAVE
50 0 0 SLAB2, CENTER HEAVE I
oO I
NJ0 00
0 000 0 0 O00RE DSP 00MNTN 00 0 0 0 0 0 .
0 0 000
% 000
-50
10 0 ~~~OBSERVED DISPLACEMENT-, 0 0 0 0 0 0 r
- - - - -- --- -- - -- "
,0
E-WO000000000. .. J*000
A. DENTAL CLINIC - SECTION A S. DENTAL CLINIC - SECTION S
Figure 29. Soil-structure interaction analysis Dental
Clinic, Fort Sam Houston
98
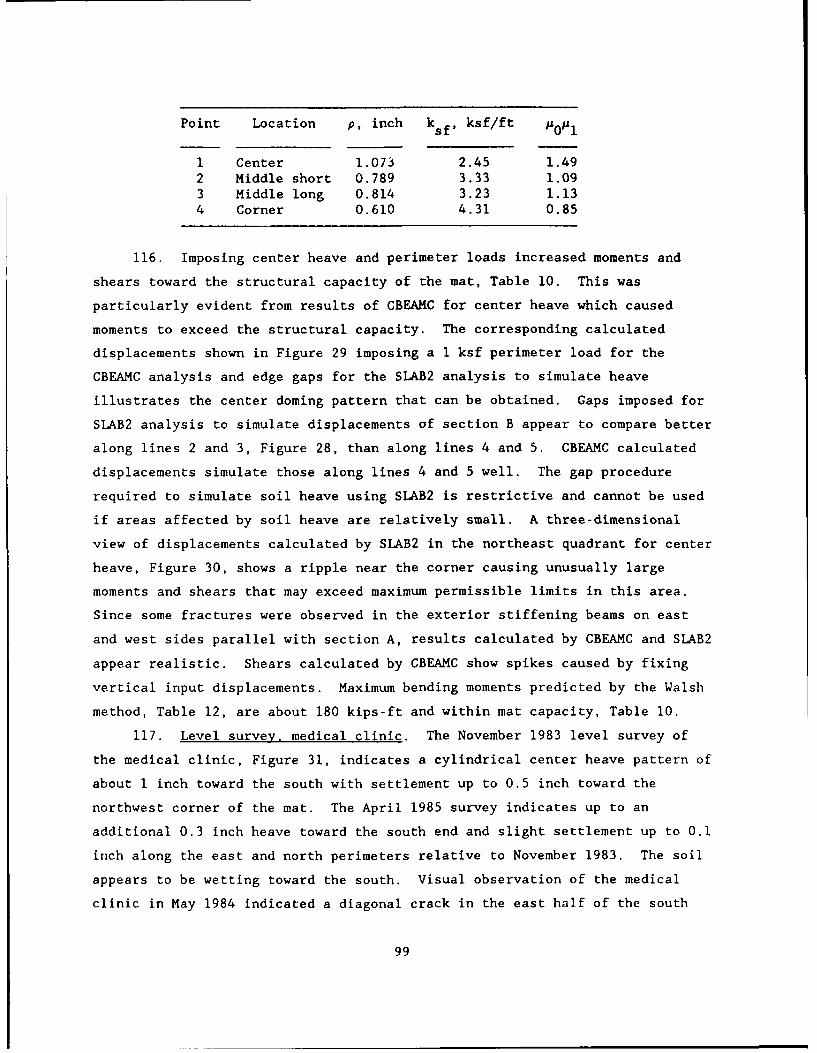
Point Location p, inch ksf, ksf/ft Po0i
1 Center 1.073 2.45 1.492 Middle short 0.789 3.33 1.093 Middle long 0.814 3.23 1.134 Corner 0.610 4.31 0.85
116. Imposing center heave and perimeter loads increased moments and
shears toward the structural capacity of the mat, Table 10. This was
particularly evident from results of CBEAMC for center heave which caused
moments to exceed the structural capacity. The corresponding calculated
displacements shown in Figure 29 imposing a I ksf perimeter load for the
CBEAMC analysis and edge gaps for the SLAB2 analysis to simulate heave
illustrates the center doming pattern that can be obtained. Gaps imposed for
SLAB2 analysis to simulate displacements of section B appear to compare better
along lines 2 and 3, Figure 28, than along lines 4 and 5. CBEAMC calculated
displacements simulate those along lines 4 and 5 well. The gap procedure
required to simulate soil heave using SLAB2 is restrictive and cannot be used
if areas affected by soil heave are relatively small. A three-dimensional
view of displacements calculated by SLAB2 in the northeast quadrant for center
heave, Figure 30, shows a ripple near the corner causing unusually large
moments and shears that may exceed maximum permissible limits in this area.
Since some fractures were observed in the exterior stiffening beams on east
and west sides parallel with section A, results calculated by CBEAMC and SLAB2
appear realistic. Shears calculated by CBEAMC show spikes caused by fixing
vertical input displacements. Maximum bending moments predicted by the Walsh
method, Table 12, are about 180 kips-ft and within mat capacity, Table 10.
117. Level survey, medical clinic. The November 1983 level survey of
the medical clinic, Figure 31, indicates a cylindrical center heave pattern of
about 1 inch toward the south with settlement up to 0.5 inch toward the
northwest corner of the mat. The April 1985 survey indicates up to an
additional 0.3 inch heave toward the south end and slight settlement up to 0.1
inch along the east and north perimeters relative to November 1983. The soil
appears to be wetting toward the south. Visual observation of the medical
clinic in May 1984 indicated a diagonal crack in the east half of the south
99
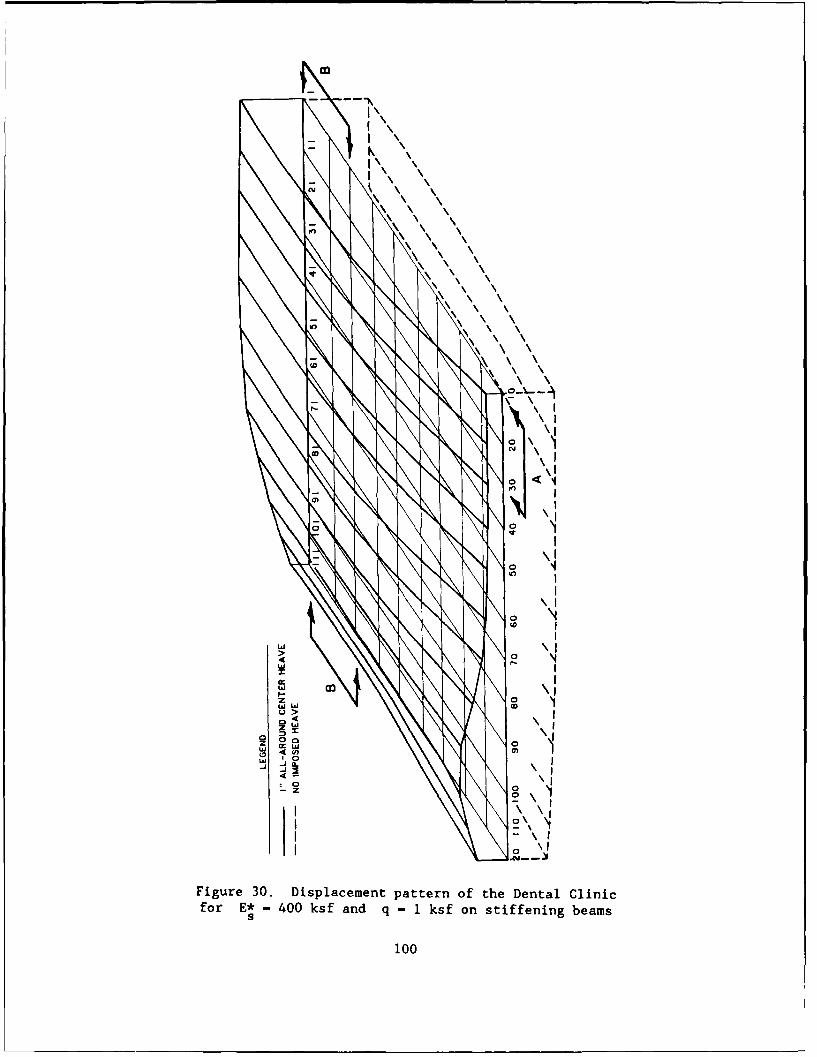
InI
N 0
NN '0
C
w w CO0
0-z
Figure 30. Displacement pattern of the Dental Clinicfor E* - 400 ksf and q - 1 ksf on stiffening beams
s
100
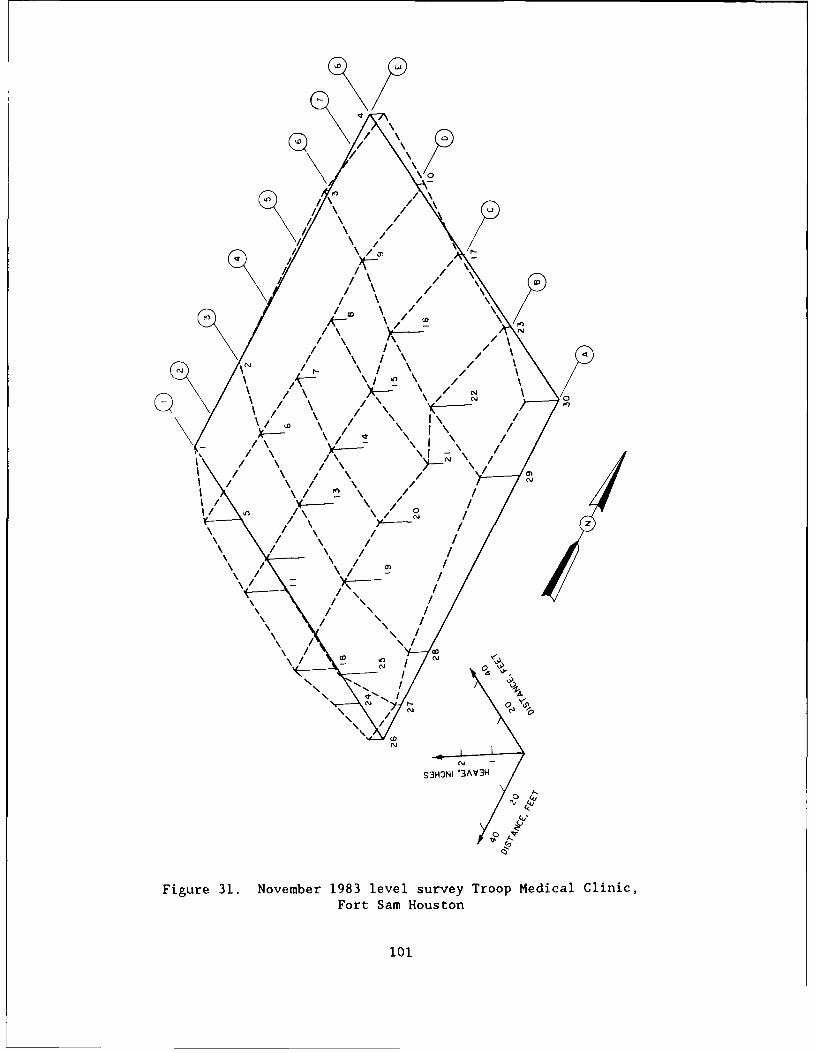
S' ,
(1
\0 IU
\ /\
/ \ / \\
,3HON '3,3
/ \ // \/
/ \ /\// \/ \ /\
( \ / \ / \ /
/ \ I\, X-- -\ " " IX
N N \ / \I
' \ X- x / I
/i\ ur \31. N 0I / \ / \
Fort Sam Hout /
/ \ o1I\/ \ /
/ /
\? \ ///N /
,//1 \\i
\\/
/ \O x'./ \ / , .
/ --\ 3 / o ', "
'3/3
£igre 1. oveberlg8 lee su9yA>o' edclClnc
Fot aN Huso
101

exterior wall. A vertical crack over the door of the main entrance in the
east wall existed since construction. Cracks were observed on the inside wall
partitions near the south wall directly opposite the exterior diagonal crack.
Vertical control joints had not been placed in the brick exterior wall. The
maximum observed A/L ratio is 1/250 near points 27-25 of Figure 31 in the
area of the observed cracks near the south walls of the medical clinic.
118. Analysis, medical clinic. Settlement of section A calculated by
CBEAMC for loads on the stiffening beam of 1 ksf is 1.1 inches, Figure 32,
which compares well with settlements calculated by SLAB2. The distribution of
ksf to simulate SLAB2 displacements using a Winkler foundation, average
pressure on the mat q - 0.18 ksf, E* - 400 ksf, and B - 164 ft for points 1s
to 4, Figure 26b, is
Point Location p, inch ksf, ksf/ft Ao'01
1 Center 1.301 1.67 1.462 Middle short 0.944 2.30 1.063 Middle long 0.957 2.27 1.074 Corner 0.715 3.04 0.80
119. Observed displacements were reasonably simulated by imposing center
heave (i.e., perimeter gaps) using SLAB2 or perimeter loading using CBEAMC and
translating calculated displacements as shown in Figure 32. Moments and
shears calculated for these displacements approach the maximum capacity, Table
10. A rough estimate of maximum bending moment by the Walsh method, Table 12,
is about 2/3 of the maximum capacity. The maximum calculated and observed
A/L ratios are about 1/500 which should not cause damage in the mat, but some
superstructure damage is possible. Fractures were observed in May 1984 in the
south brick exterior wall. The exterior walls of the medical clinic did not
have vertical control joints. Upper portions of a nearby interior wall made
of concrete masonry units parallel with the south exterior wall also exhibited
cracking. Appendix D describes results of a movement study of the medical
clinic completed by the Fort Worth District, which is in general agreement
with this analysis.
102
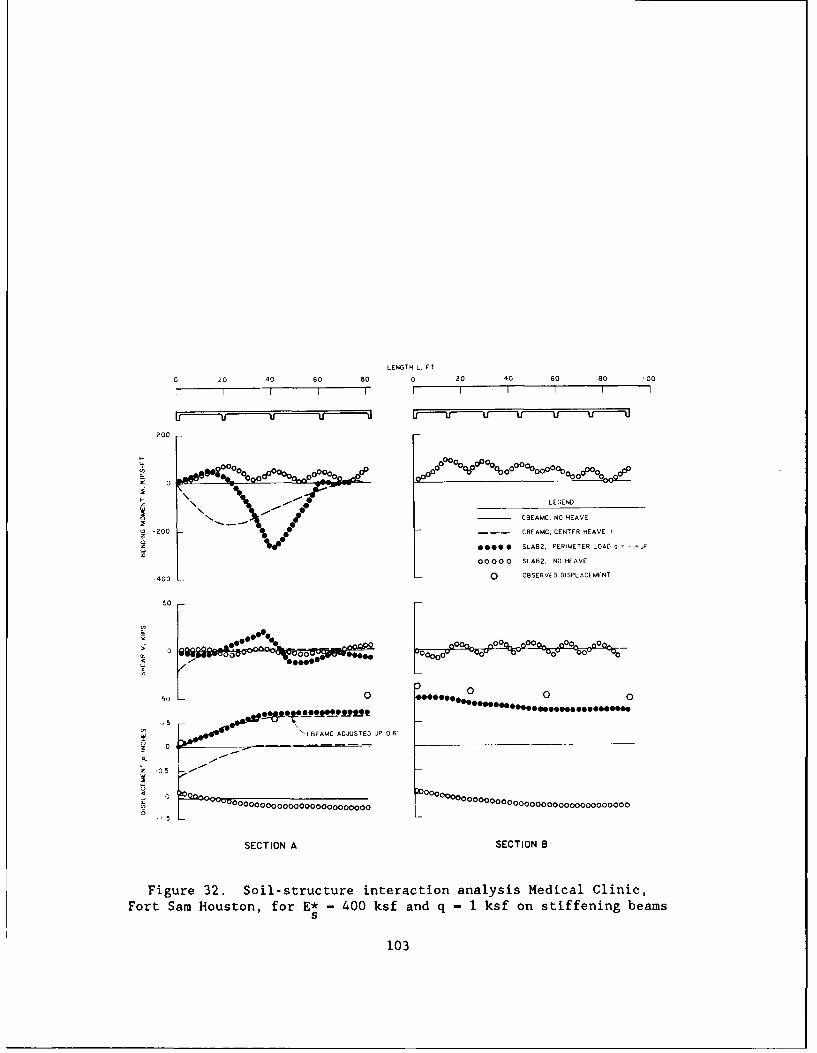
LENGTH L, FT
0 20 40 60 80 0 20 40 60 80 0
I I I I I I I I I I
U 'uU U U
200
It 0000 0000
0 , oosee -- -oO Oooo 0oOooo
z 0 LEGEND
0 CBEAMC. NO HEAVE
-200 CBEAMC. CENTER HEAVE I
00000 SLAB2, PERIMETER LOAD q I -F
00000 SLAB2. NO HEAVE
-400 0 OBSERVED DISPLACEMENT
50
a-~ ~~~0 10o0ca~O~~~
50 0 9000 ~0
'"CBEAMC ADJUSTED UP 0 6
0000002000000 0000000000000000000000000000000000
5
SECTION A SECTION B
Figure 32. Soil-structure interaction analysis Medical Clinic,Fort Sam Houston, for E* - 400 ksf and q - 1 ksf on stiffening beams
s
103
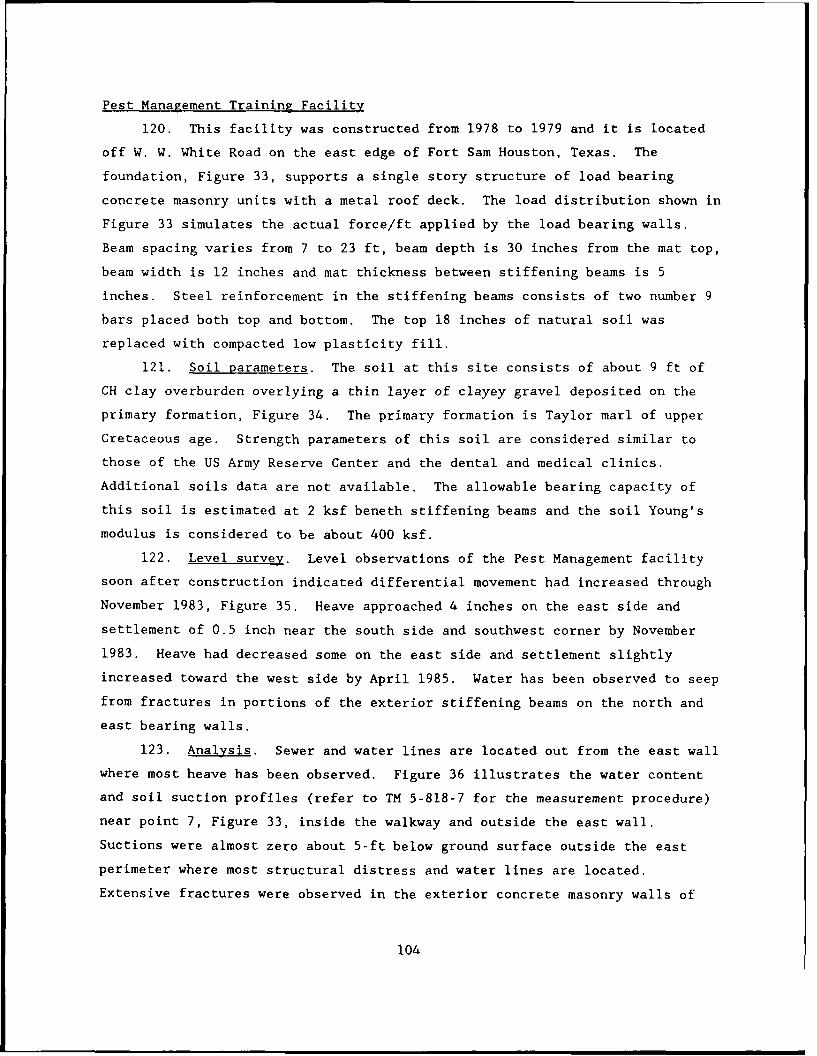
Pest Management Training Facility
120. This facility was constructed from 1978 to 1979 and it is located
off W. W. White Road on the east edge of Fort Sam Houston, Texas. The
foundation, Figure 33, supports a single story structure of load bearing
concrete masonry units with a metal roof deck. The load distribution shown in
Figure 33 simulates the actual force/ft applied by the load bearing walls.
Beam spacing varies from 7 to 23 ft, beam depth is 30 inches from the mat top,
beam width is 12 inches and mat thickness between stiffening beams is 5
inches. Steel reinforcement in the stiffening beams consists of two number 9
bars placed both top and bottom. The top 18 inches of natural soil was
replaced with compacted low plasticity fill.
121. Soil parameters. The soil at this site consists of about 9 ft of
CH clay overburden overlying a thin layer of clayey gravel deposited on the
primary formation, Figure 34. The primary formation is Taylor marl of upper
Cretaceous age. Strength parameters of this soil are considered similar to
those of the US Army Reserve Center and the dental and medical clinics.
Additional soils data are not available. The allowable bearing capacity of
this soil is estimated at 2 ksf beneth stiffening beams and the soil Young's
modulus is considered to be about 400 ksf.
122. Level survey. Level observations of the Pest Management facility
soon after construction indicated differential movement had increased through
November 1983, Figure 35. Heave approached 4 inches on the east side and
settlement of 0.5 inch near the south side and southwest corner by November
1983. Heave had decreased some on the east side and settlement slightly
increased toward the west side by April 1985. Water has been observed to seep
from fractures in portions of the exterior stiffening beams on the north and
east bearing walls.
123. Analysis. Sewer and water lines are located out from the east wall
where most heave has been observed. Figure 36 illustrates the water content
and soil suction profiles (refer to TM 5-818-7 for the measurement procedure)
near point 7, Figure 33, inside the walkway and outside the east wall.
Suctions were almost zero about 5-ft below ground surface outside the east
perimeter where most structural distress and water lines are located.
Extensive fractures were observed in the exterior concrete masonry walls of
104
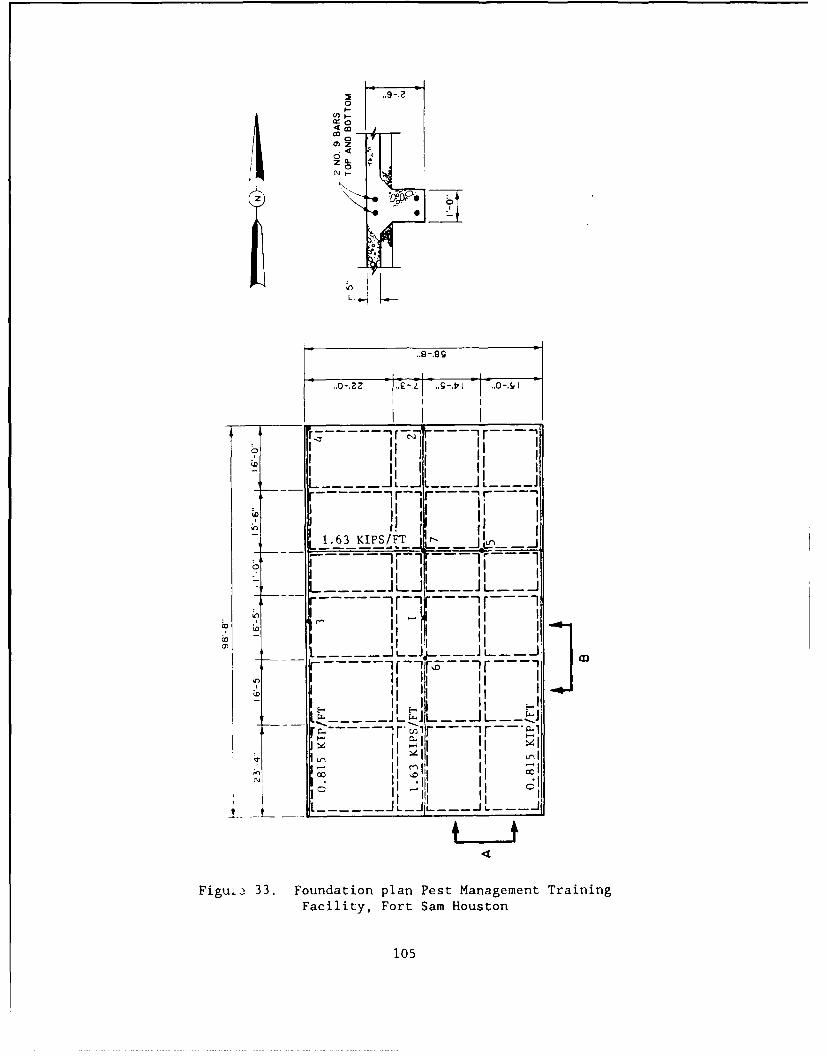
4v.0
oz
S I I b I , I__
_I:
__ _
_________
II i
r
-
,
I I
1.63 KIPS FT rL_
o ------ N--1---ij--L / L
Ju__II -
I Hi
Figui 33. Foundation
plan Pest Management Training
Facility, Fort Sam Houston
105
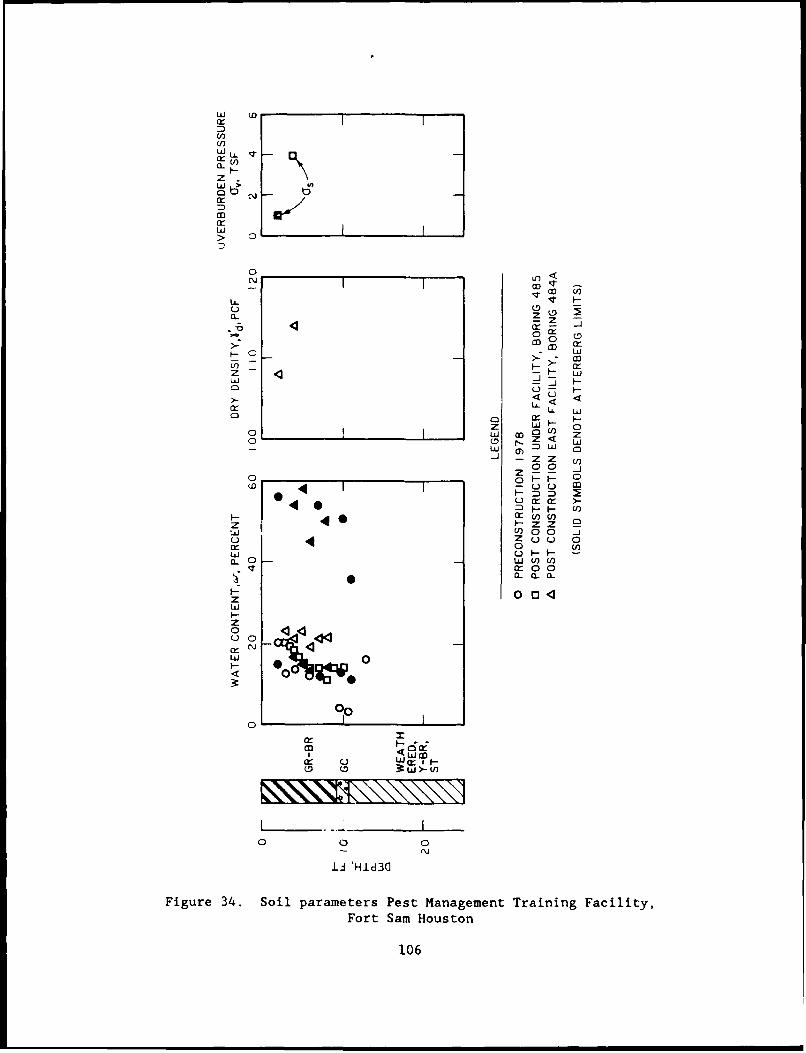
CrU)
a-
z-wb
a: /~
CO U
> 0
0: M
z -za:-1-
U) 0 > V)
Z 22 -Hj~2 0- 0
U0 U
- x U U )z z z-
D -00 -j
Ir 0UHH U
Cr 4 ZO
F: 0 3.
z
oi 44;00
LU00
0-
a:-
0 0 0
13J Hid3O
Figure 34. Soil parameters Pest Management Training Facility,Fort Sam Houston
106
Q' (- C OC
S3H:)NI '3AV3H
Figure 35. Level surveys Pest Management Training Facility,Fort Sam Houston
107
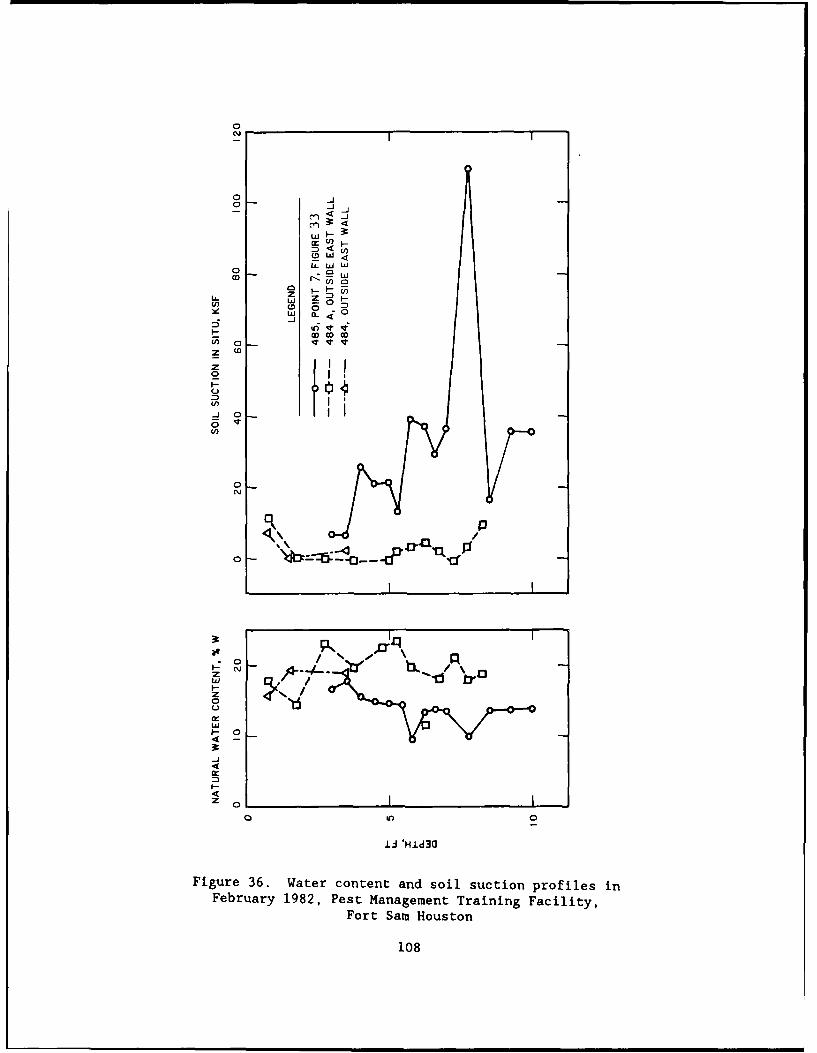
0
oJ
O _j
C')
u. w O0 LL W w
V) 0r- U
* J
I-I
U) o F
O to f q
ID OD C IO
0- ,
U)
¢nj
z
Cc)w-- 0
Z4O-
I--
0 "m 0
1.= 'Hid3a
Figure 36. Water content and soil suction profiles inFebruary 1982, Pest Management Training Facility,
Fort Sam Houston
108
this facility with cracks up to an inch in width. The maximum A/L ratio is
about 1/120, which should lead to structural damage in single story buildings.
Vertical control joints were not used in this structure, which contributed to
the observed superstructure damage. Parts of the mat that could be observed
inside the facility did not indicate unusual distress and the interior floor
tile was found in a satisfactory condition. The grade around the facility
provided positive drainage.
124. Results of the soil-structure interaction analysis for uniform
pressure on the stiffening beams of q - 1 ksf and E* - 400 ksf are shown ins
Figure 37. Settlement of section B calculated by CBEAMC was 0.4 inch and in
close agreement with results of SLAB2. The distribution of ksf required to
simulate the settlements of an elastic foundation using the Winkler foundation
based on an average pressure q - 0.15 ksf, E* - 400 ksf, and B - 58.7 ft for
points 1 to 4, Figure 33, is
Point Location p, inch ksf , ksf/ft P0Ai
I Center 0.465 3.87 1.762 Middle short 0.338 5.33 1.283 Middle long 0.358 5.03 1.354 Corner 0.263 6.85 0.99
An additional analysis performed using SLAB2 for the more realistic load
distribution of 1.63 kips/ft on internal beams and 0.815 kip/ft on exterior
beams indicate maximum moments of 48 kips-ft located near point 5 on section A
and 72 kips-ft near point 6 on section B, Figure 33. Maximum settlement was
0.3 inch at point 7 and minimum settlement was 0.15 inch at the southeast
corner.
125. A 2-inch center heave was simulated using SLAB2 and 2-inch gaps
around the edges. This gap simulation for heave approximated movement along
section A, but not along section B. A 2-inch edge heave was simulated in
CBEAMC for section B and the calculated settlement translated up 1.7 inches.
Calculated moments from both programs CBEAMC and SLAB2 greatly exceeded
structural capacity, Table 10. The Walsh method, Table 12, indicates maximum
moments near the structural capacity of the mat. Structural distress is
therefore expected from these calculations.
109

LENGTH. FT WIDTH. FT
0 20 40 60 80 100 0 20 40 60
U U U U U U U U
400
S200
~~00000000 000Wg
0 0M000
zQ -200 0LEGEND00Z
w0 CBEAMC, NO HEAVES __ *
* - CBEAMC, 2" HEAVE-400 - 0000 SLAB2, NO HEAVE 0
0000 SLAB2, 2' HEAVE100 -0 OBSERVED DISPLACEMENT
50 on_-
-50 00
-i L 00
z %
0 --
-50o 0 0 o00000 0
UP110
-1000
Summary and Conclusions
126. Observed long-term displacement patterns of these mats are
influenced by heave in addition to settlement and cannot be readily predicted
from the available data. Reliable predictions of displacements require
reasonable estimates of soil moisture changes and distribution of applied
loads. Some moisture changes that caused heaves such as those observed in the
Gymnasium, Brooks Air Force Base and Pest Management Training Facility are
attributed to leaks in plumbing and poor drainage that cannot be readily
predicted. Observed distress is in general agreement with calculated
deflection ratios A/L.
127. All of these ribbed mats are flexible and require consideration of
soil-structure interaction effects for proper analysis of mat performance.
Programs SLAB2 and CBEAMC appear to provide comparable and realistic bending
moments for similar given displacement patterns. Plate program SLAB2
considers two-dimensional lateral restraint of ribbed mats, which strongly
influences mat performance. One-dimensional Winkler foundation program CBEAMC
will calculate bending moments and shears similar to SLAB2 if soil movements
can be anticipated and input into CBEAMC. Larger bending moments were
observed in the short direction than the long direction of the Maintenance
Shop, US Army Reserve Center.
128. The Winkler foundation requires evaluation of a coefficient of
subgrade reaction ksf that varies with location beneath the mat in order to
simulate displacements of an elastic foundation. ksf may be evaluated from
Equation 8a where the influence factor pop, as a function of the
length/width ratio L/B is
L Short Edge Long EdgeCenter (B/2 from (L/2 from Corner
B center) center)
1.0 1.3 1.0 0.9 0.71.5 1.6 1.3 1.1 0.92.0 1.8 1.5 1.3 1.12.5 1.9 1.6 1.4 1.23.0 2.0 1.8 1.6 1.3
i11

The Pbove factors illustrate the dishing action of mats on the surface of
compressible, cohesive soils with a variation of about 30 percent settlement
between the center and edge and about 45 percent between the center and
corner.
129. Soil stiffness and movements within the top 50 ft of soil beneath
the mat appeared to determine the effective soil modulus. The effective soil
modulus for SLAB2 analysis is approximately 400 ksf and may be given by the
initial tangent modulus of soil from UU test results on undisturbed soil
samples.
130. The flat portion of the mat provides some support. The American
Concrete Institute considers this by recommending a standard effective T-
section width (ACI 318, art. 8.10.2). Additional analyses of ribbed mats
instrumented to allow estimates of bending moments from strains and
measurements of soil pressures exerted by the mat are necessary to provide
data to improve guidelines for estimating effective T-section widths. Plate
load tests may provide reasonable values of the coefficient of subgrade
reaction ksf that simulate loading pressures on stiffening beams.
Flat Mat Foundations
131. Thick mats of uniform thickness supporting three hospitals were
analyzed using a rigid beam with Godden's (1965) Winkler foundation method,
plate on elastic foundation program SLAB211, beam on Winkler foundation
program CBEAMC 15, and plate on Winkler foundation program WESLIQID5 3. Godden's
method using a rigid beam is similar to the uniform pressure method and
designated below as the uniform pressure method. WESLIQID was modified to
calculate bending moments and shears in addition to displacements. Hand
methods of calculating soil-structure interaction behavior of a plate on a
Winkler foundation based on results of parametric analyses50 are beyond
practical application for this size of problem. The results of a single
series of correct hand calculations should provide results similar to WESLIQID
for a single point on the mat.
132. The three mats support Wilford Hall hospital, Lackland Air Force
Base, Texas; Fort Gordon hospital, Georgia; and Fort Polk hospital, Louisiana.
Level elevations were referenced to the elevations of permanent deep
112

benchmarks near these hospitals. Displacements are elastic, recompression
settlements because applied loads are compensated by construction of the mats
in excavations.
133. These mats excluding the stiffness of the superstructure are
flexible after Equation 17. The superstructure, however, increases the
effective flexural stiffness of the mat by an unknown amount. Increases in
stiffness from the superstructures of these hospitals were estimated using
Equation B6 to calculate a composite moment of inertia of the combined mat and
superstructure I oofm* The equivalent thickness of each mat was subsequently
determined using Equation Bll.
Wilford Hall Hospital
134. The mat addition to the hospital complex supports an 11 story tower
located in the northwest sector of Lackland Air Force Base near San Antonio,
Texas. The mat, constructed in 1977, is 3.5 ft thick by 108.33 ft wide by
209.83 ft long and it was placed in an excavation 27 ft below the existing
ground surface. This mat is adjacent to and east of the existing hospital
complex supported on drilled shafts. Steel reinforcement in the mat
constitutes 5 percent of the cross-section and it is located in both top and
bottom parts of the mat. The superstructure is built of a structural steel
frame supporting a masonry facing.
135. Load pattern. The dead and live column load distribution, Figure
38, leads to a weight of about 55,000 kips plus 12,000 kips contributed by the
mat weight or a total building weight of about 67,000 kips. The applied
uniform pressure excluding weight of the mat concrete q = 2.415 ksf. Weight
of soil displaced by the building is about 74,000 kips so that there may be a
small net loss of weight on the foundation soil beneath the mat.
136. The mat is designed for bending moments of 36,000 kips-ft per 26-ft
wide section from Equation 13a. The required thickness for the maximum
applied column loads is about 2.5 ft from Equation lla, which is about 1 ft
less than the actual thickness. The effective structural stiffness that
includes stiffness contributed by the tower for an average ceiling height of
10 ft leads to an equivalent mat thickess of 36.8 ft from Equation Bll,
excluding stiffness from steel reinforcement. Significant stiffness is also
contributed by the reinforced concrete walls of the basement.
113

0 O0 __ _
0 -
T--
zz
II (T, I LLI I I I I
q 0~ 0 0 DO0D 0f ~
--0 0 P ~ ~ W
Figre 8. ounaton lanWilor Hal HspialLakadArFreBswihclmjod nkp
-. 114

137. Soil parameters. Soil parameters, Figure 39, indicate an expansive
plastic CH clay overburden and shale with a perched water table about 23 ft
below ground surface. The soil profile consists of overburden, Lower Midway,
and Navarro formations with an occasional stratum of clayey gravel in the
vicinity of the perched water table. Consolidometer/swell tests indicate
potential for swell in the overburden down to about 17 ft below ground surface
and within a 10-ft thickness of soil immediately beneath the mat.
138. Results of undrained triaxial shear strength tests indicate
relatively large shear strengths and adequate bearing capacity. The soil
elastic modulus can be approximated as increasing linearly with depth
E - kz - 25z (29)s
where E is in units of ksf and depth z is in feet. The elastic moduluss
at the ground surface E is taken as zero. An upper range is also shown in0
Figure 40 where k = 32 ksf/ft.
139. The equivalent soil modulus E* and coefficient of subgrades
reaction k must be evaluated to complete the soil-structure interactionsf
analysis. Figure 8 was used to obtain a center settlement pc - 0.127 ft
for a loading pressure of q - 2.415 excluding the mat weight as shown in
Figure 40. From Equation 4b, the equivalent soil modulus is
E* - 2.2.415.85.06.(l - 0.32) - 2943 ksfs 0.127
The compressible soil depth beneath the mat was taken as 320 ft or nearly 4
times the equivalent mat radius R - 85.06 ft. Poisson's ratio was assumed
0.3. E* = 3100 ksf from Equation 4c assuming an infinite depth of elastics
soil beneath the mat and using k = 25 ksf/ft from Equation 29. Equation 4a
should provide similar results to Equations 4b and 4c.
140. Assuming E* - 2943 ksf is reasonable, the settlement from Equations
3 is
p - 0.96. 2.415-108.33 - 0.085 ft2943
or 1 inch, where - 0.96 (L/B - 2) and p0 - 1.0. The effective
coefficient of subgrade reaction from Equation 5 should be approximately
115
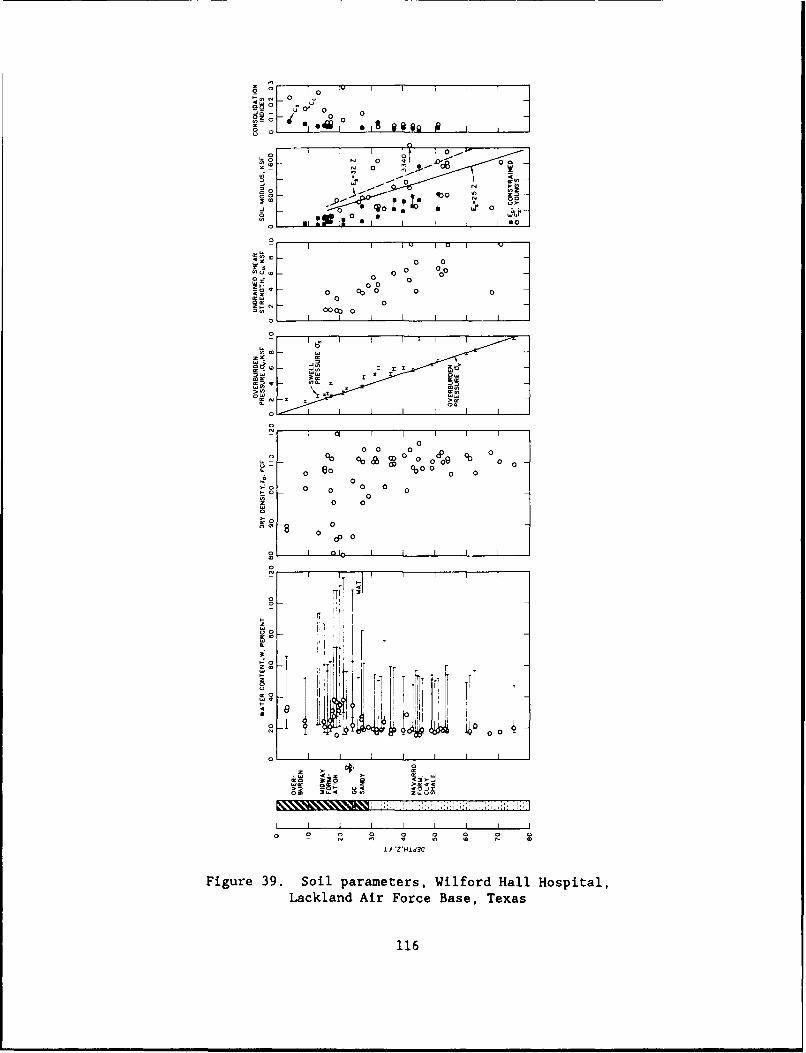
o i I I I I I
0, 00 0:
o 0 0
1 00
0 0 ~ 0.
_oI I I u I O I I
20b0
<z1 L0 000 0
I' w~Lip
6Q 0
0~
a Oo 00
00
0 00
=, 0000.- I 0 Cb 0 0
o I I t I00 0
20
00
CD ~ 00 60 00
00 0n~ 0 2
40 0
o o 1. o o o o i i
I I I I I I I Io [ 8 0 0 0 0 000
I ZIdt
Figure 39. Soil parameters, Wilford Hall Hospital,Lackland Air Force Base, Texas
116
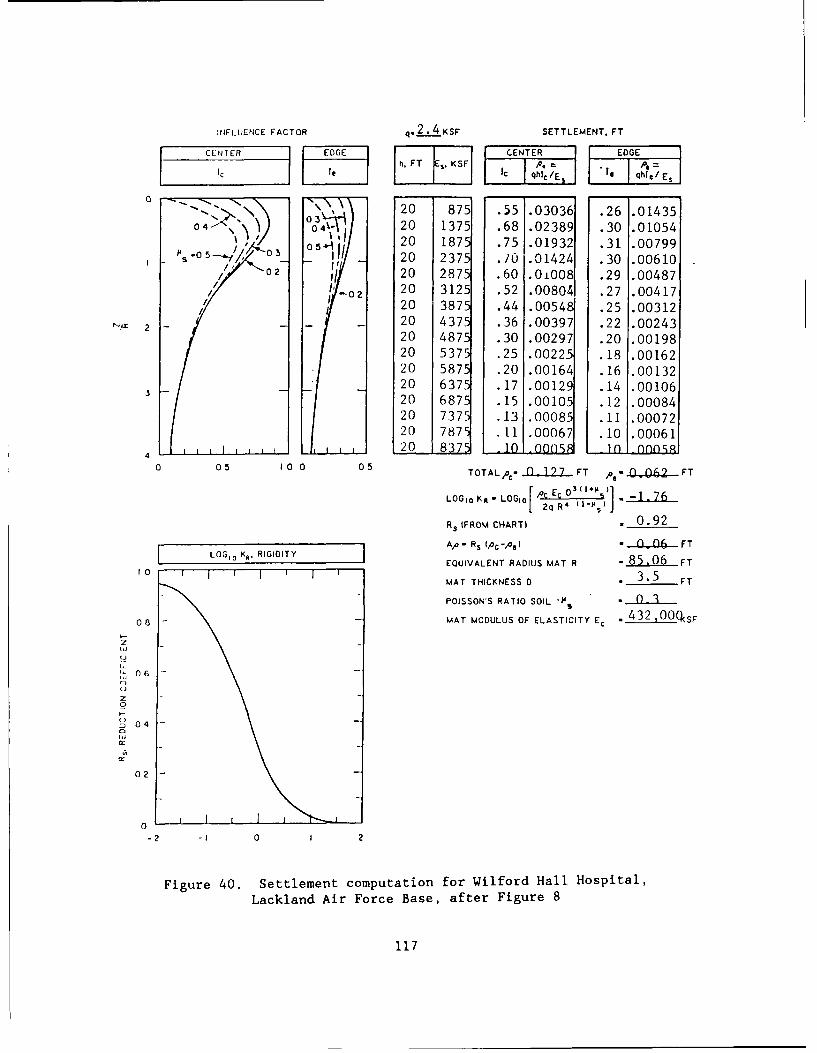
INFLUENCE FACTOR q.2. 4 KSF SETTLEMENT. FT
h, FT E" KSF O=• Pe =
P
lTE Re e qh c/E qhle/Es
0 - 20 875 .55 .03036 .26 .0143520 1375 .68 .02389 .30 .01054
05lI 20 1875 .75 .01932 .31 .00799I 0511/ 20 2375 .70 .01424 .30 .00610
I -I 1 02 20 2875 .60 .0100 .29 .00487I -02 20 3125 .52 .00804 .27 .00417
20 3875 .44 .00548 .25 .00312r 2 - 20 4375 .36 .00397 .22 .00243
20 4875 .30 .00297 .20 .0019820 5375 .25 .00225 .18 .0016220 5875 .20 .00164 .16 .0013220 6375 .17 .00129 .14 .0010620 6875 .15 .00105 .12 .0008420 7375 .13 .00085 .11 .0007220 787 .11 .00067 .10 .00061
1 20 8 1 .10 in .00nmR4
0 05 100 05 TOTALpc- n-J127 FT p(-._( 2FT
LOGIo KR " LOGIo ,!c Ec D '" -1 7612 q R' I-
RsIFROM CHART) . 0.92A,- Rs l,Oc-O) .o0_06.FT[LOG,,oK,. RIGIDITY A/I lc-p --Q6 FEQUIVALENT RADIUS MAT R 85.06 FT
MAT THICKNESS D 3 FT
POISSON'S RATIO SOIL 0C
0 - MAT MODULUS OF ELASTICITY E c 432, 000S F
I-
06
z
04I-
0 2-
0-2 - 2
Figure 40. Settlement computation for Wilford Hall Hospital,
Lackland Air Force Base, after Figure 8
117
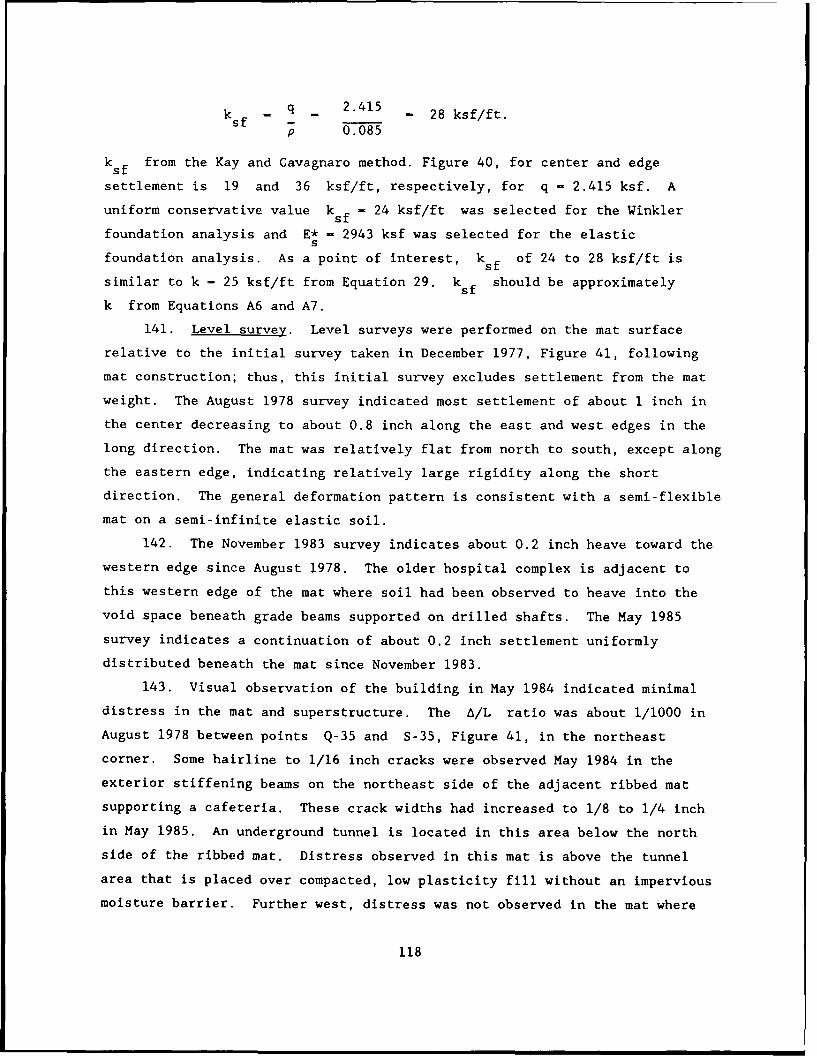
k q 2.415 - 28 ksf/ft.sf - p 0.085
ksf from the Kay and Cavagnaro method. Figure 40, for center and edge
settlement is 19 and 36 ksf/ft, respectively, for q - 2.415 ksf. Auniform conservative value ksf - 24 ksf/ft was selected for the Winkler
foundation analysis and E* - 2943 ksf was selected for the elastics
foundation analysis. As a point of interest, ksf of 24 to 28 ksf/ft is
similar to k - 25 ksf/ft from Equation 29. ksf should be approximately
k from Equations A6 and A7.
141. Level survey. Level surveys were performed on the mat surface
relative to the initial survey taken in December 1977, Figure 41, following
mat construction; thus, this initial survey excludes settlement from the mat
weight. The August 1978 survey indicated most settlement of about 1 inch in
the center decreasing to about 0.8 inch along the east and west edges in the
long direction. The mat was relatively flat from north to south, except along
the eastern edge, indicating relatively large rigidity along the short
direction. The general deformation pattern is consistent with a semi-flexible
mat on a semi-infinite elastic soil.
142. The November 1983 survey indicates about 0.2 inch heave toward the
western edge since August 1978. The older hospital complex is adjacent to
this western edge of the mat where soil had been observed to heave into the
void space beneath grade beams supported on drilled shafts. The May 1985
survey indicates a continuation of about 0.2 inch settlement uniformly
distributed beneath the mat since November 1983.
143. Visual observation of the building in May 1984 indicated minimal
distress in the mat and superstructure. The A/L ratio was about 1/1000 in
August 1978 between points Q-35 and S-35, Figure 41, in the northeast
corner. Some hairline to 1/16 inch cracks were observed May 1984 in the
exterior stiffening beams on the northeast side of the adjacent ribbed mat
supporting a cafeteria. These crack widths had increased to 1/8 to 1/4 inch
in May 1985. An underground tunnel is located in this area below the north
side of the ribbed mat. Distress observed in this mat is above the tunnel
area that is placed over compacted, low plasticity fill without an impervious
moisture barrier. Further west, distress was not observed in the mat where
118
zz
X\X
I,, /
.// \c ,
z 4 / / 3
" /, /,,
4\\
- 7
0
'I'
Figure 41. Level surveys, Wilford Hall Hospital,Lackland Air Force Base
119
the tunnel was constructed over a chlorinated polyethylene impervious moisture
barrier placed directly on the natural expansive soil.
144. Analysis. Results of soil-structure interaction analyses of
sections A and B of Figure 38 are shown in Figure 42. Winkler soil programs
CBEAMC and WESLIQID using high mat stiffness (an effective concrete modulus of
500,000,000 ksf or mat thickness 36.8 ft to include superstructure stiffness)
and the uniform pressure method (Godden's procedure for a rigid beam14) all
provide similar results for section A, Figure 42a. The magnitudes of negative
bending moments are greatest for the plate on the Winkler foundation
calculated by WESLIQID. These bending moments are well within the mat
structural capacity of 36,000 kips-ft from Equation 13a. Negative bending
moments indicate tension in the mat top or an edge down displacement pattern.
145. Bending moments calculated by SLAB2 for the 35-ft thick mat are
relatively small, Figure 42b, and well within mat bending resistance
calculated by Equation 13a. Bending moments calculated by SLAB2 for the
complete structure using an equivalent mat thickness D of 36.8 ft (frome
Equation Bll) were positive and substantially larger than those calculated for
the mat on a Winkler soil. The bending resistance of the composite structure
including stiffness of the superstructure is about 8 times that calculated by
Equation lla using Equation B15; therefore, calculated bending moments of the
structure are still well within capacity.
146. Observed displacements shown in Figure 41 for May 1985 are
generally consistent with the dish-shaped or center down displacement pattern
calculated from SLAB2. The flexible mat of 3.5-ft thickness ignoring rigidity
contributed by the superstructure is generally consistent with the observed
displacement pattern. Observed displacements in May 1985 tend to be slightly
less than those calculated, but observed displacements do not include the
unmeasured settlement caused by the mat weight. Overall, the assumed soil
modulus and coefficient of subgrade reaction are reasonable.
147. A finite element soil-structure plane strain analysis performed in
1977 on the Wilford Hall 3.5-ft thick mat used similar loads38. The analysis
was made using the hyperbolic soil model 23. Calculated settlements of about
0.7 inch were determined using a representative soil modulus of about 1600 ksf
and 80 ft of foundation soil beneath the mat underlain by an incompressible
120
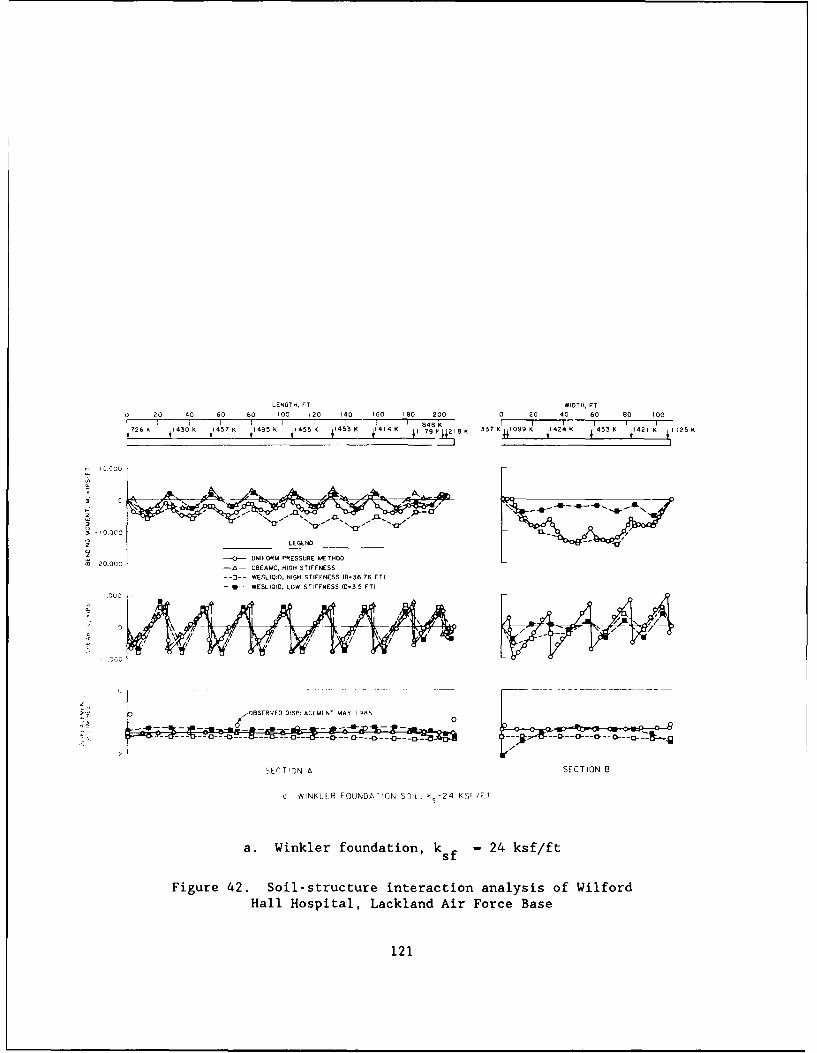
LENGTH, FT W IDTH, FT
0 20 40 60 80 100 120 140 160 180 200 0 20 40 60 80 100
7266 K 14306 K 457 K 1495 K 545 5K 41414 K1 1 7 9
V j1 8 6
K 37 K 41099 K 1424 K 1453 K 1421 K 1 125 K
~ -1010-
-0-UNIFORM PRESSURE METHOD-20.000-6- CBEAMC. HIGH STIFFNESS
-- 0-- WESLIQIG. HIGH STIFFNESS 1D.36 76 FT)-0-I- WESLIOID. LOW STIFFNESS (D-3 5 FTI
0 OB8SERVED DISPLACEMENT MAY 985
SECT CN A SECTION 8
a NIl.KLER FOUNDATICN SOIL. IK,=24 KSF/FT
a. Winkler foundation, k sf 24 ksf/ft
Figure 42. Soil-structure interaction analysis of WilfordHall Hospital, Lackland Air Force Base
121
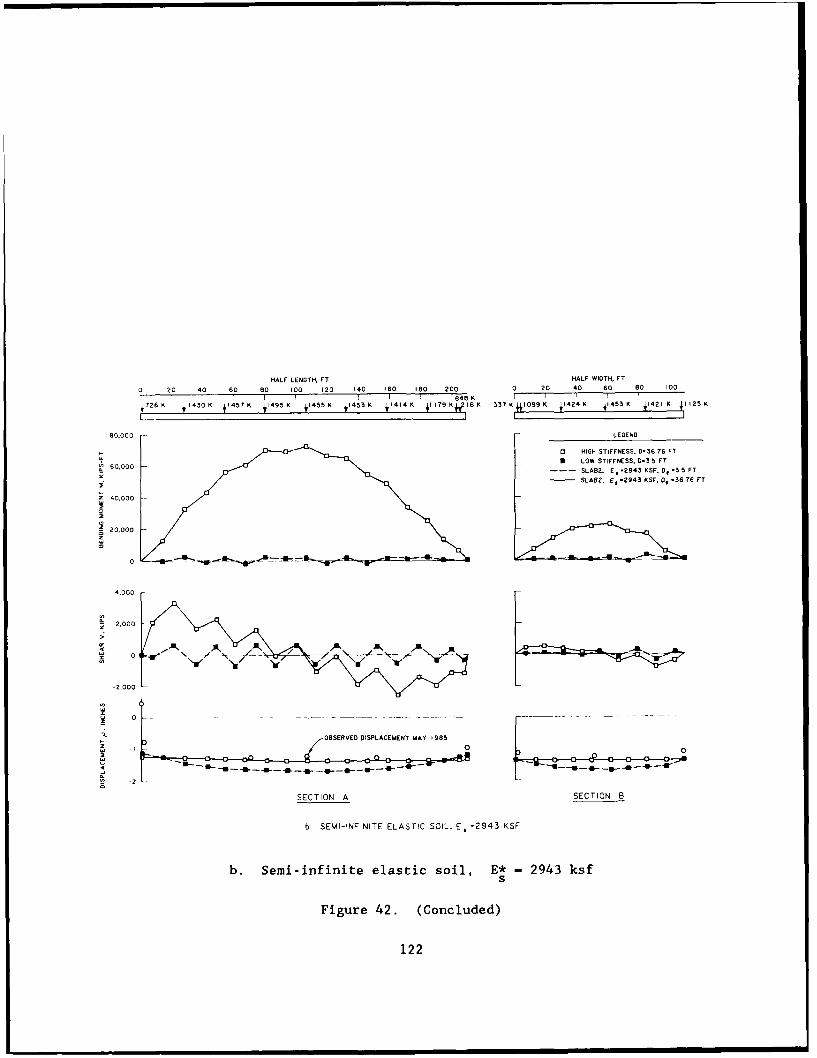
HALF LENG TH. FT HALF WIDTH ' FT
0 20 40 60 60 100 120 140 160 180 200 0 20 40 60 80 100
72 40K 14576 K 1495 K J1455 K J1453 K J1414 K 4i 79 KW 16K 33? K +I 099 K J1424 K J15 +1421 K 1 25 K
80.000 LEGEND
0 HIGH STIFFNESS. D.36 76 FT
60.00 LOW STIFFNESS. D-3 5 FTSLAB2. E, 2943 6SF. 0. :35 FT
____SLA62. E, -2943 KSF. 0. .36 76 FT
z 20.000
4.000
- 2.000
ZOBSERVED DISPLACEMENT MAY 1985I
SECTION A SECTION B
b SEMI-INFINITE ELASTIC SOIL. C, =2943 KSF
b. Semi-infinite elastic soil, E* - 2943 ksfS
Figure 42. (Concluded)
122
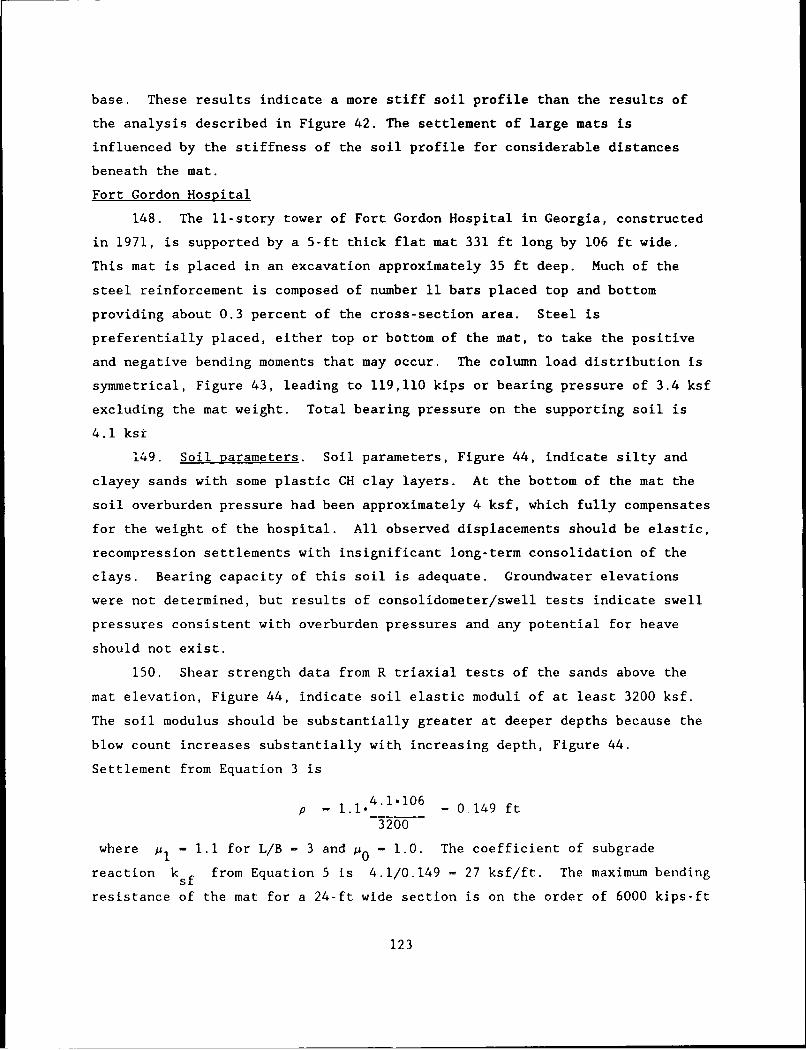
base. These results indicate a more stiff soil profile than the results of
the analysis described in Figure 42. The settlement of large mats is
influenced by the stiffness of the soil profile for considerable distances
beneath the mat.
Fort Gordon Hospital
148. The l-story tower of Fort Gordon Hospital in Georgia, constructed
in 1971, is supported by a 5-ft thick flat mat 331 ft long by 106 ft wide.
This mat is placed in an excavation approximately 35 ft deep. Much of the
steel reinforcement is composed of number 11 bars placed top and bottom
providing about 0.3 percent of the cross-section area. Steel is
preferentially placed, either top or bottom of the mat, to take the positive
and negative bending moments that may occur. The column load distribution is
symmetrical, Figure 43, leading to 119,110 kips or bearing pressure of 3.4 ksf
excluding the mat weight. Total bearing pressure on the supporting soil is
4.1 kst
149. Soil parameters. Soil parameters, Figure 44, indicate silty and
clayey sands with some plastic CH clay layers. At the bottom of the mat the
soil overburden pressure had been approximately 4 ksf, which fully compensates
for the weight of the hospital. All observed displacements should be elastic,
recompression settlements with insignificant long-term consolidation of the
clays. Bearing capacity of this soil is adequate. Groundwater elevations
were not determined, but results of consolidometer/swell tests indicate swell
pressures consistent with overburden pressures and any potential for heave
should not exist.
150. Shear strength data from R triaxial tests of the sands above the
mat elevation, Figure 44, indicate soil elastic moduli of at least 3200 ksf.
The soil modulus should be substantially greater at deeper depths because the
blow count increases substantially with increasing depth, Figure 44.
Settlement from Equation 3 is
p= 1.1. .1106 = 0.149 ft
3200
where 1 .= 1. for L/B = 3 and p0 = 1.0. The coefficient of subgrade
reaction ksf from Equation 5 is 4.1/0.149 = 27 ksf/ft. The maximum bending
resistance of the mat for a 24-ft wide section is on the order of 6000 kips-ft
123
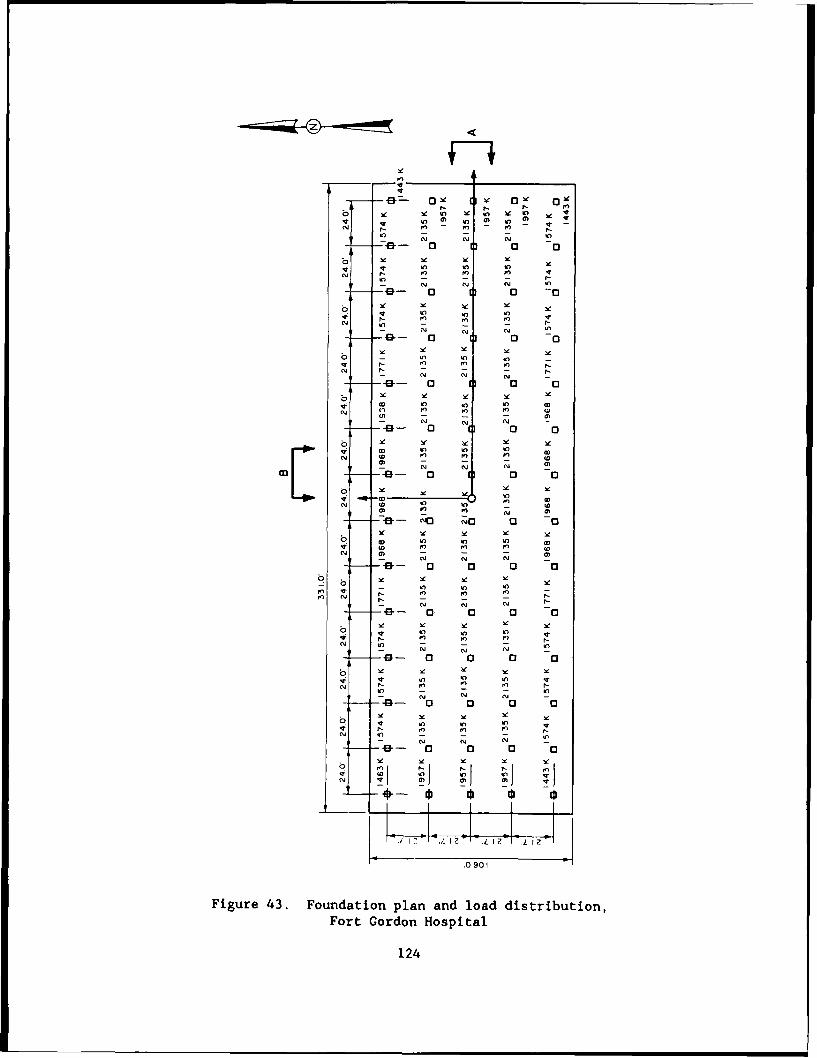
_ife0-a'4_tecl
b -O ~aW) C) Id
1* to at ~ t ~P3CYt - V
If)-
v fn
0- 0 0 - m0 to 0
w 2e
N t -7: - -1
N Utff NO -v - a-4 N N N
at o to nt
- W) N N
-04- 0 C) C3
It a
o W) It
WCN N N 3 1
yt vIT V)
IT NlN N
1 7- Jt I? 1
N to - .090 t
Figure ~ ~ N3 Nonato Nlnadla itiuin
Fo - aodo Hospita
124~t t o a
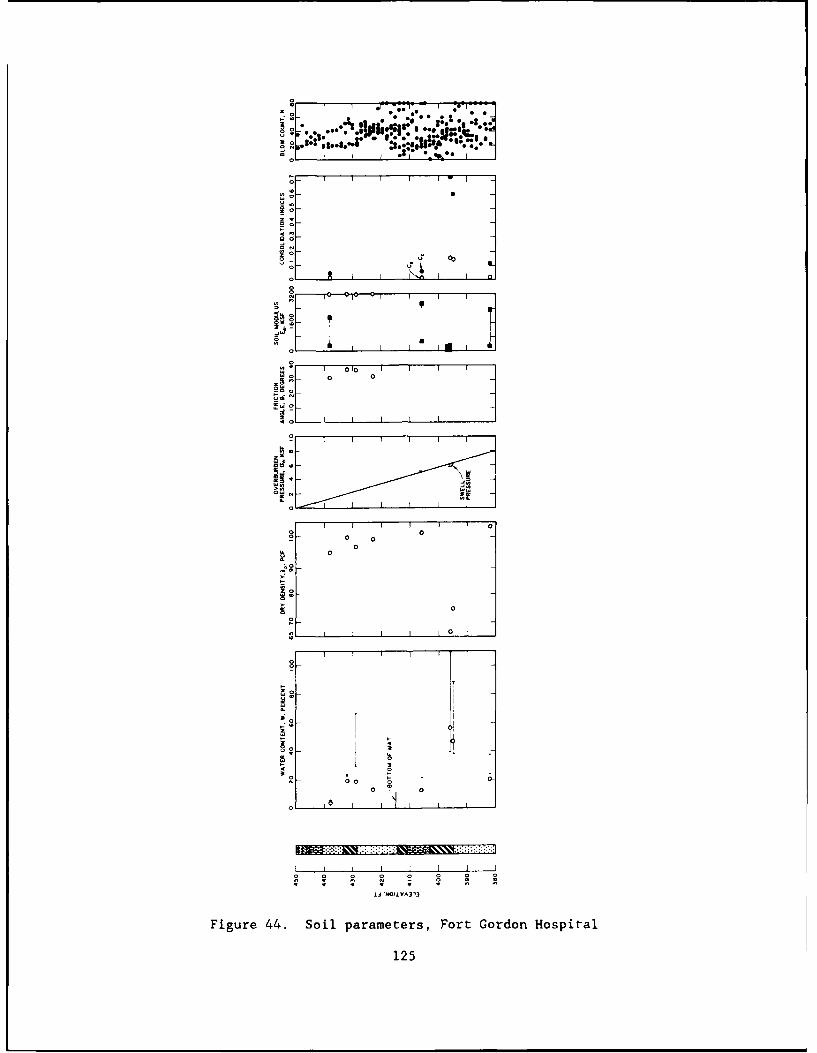
= .I . . . . .. -*-"/. ., O|_ * . e |* *.,*o
14-
or I I *s *o j
zI H
C, I_ _
0~0
0 1 I I I
I I I L I I I
L I I F I
o
ao
SI I I o
I T I 0
So o
0
C' I I I I I a
Figure 44. Soil parameters, Fort Gordon Hospital
125
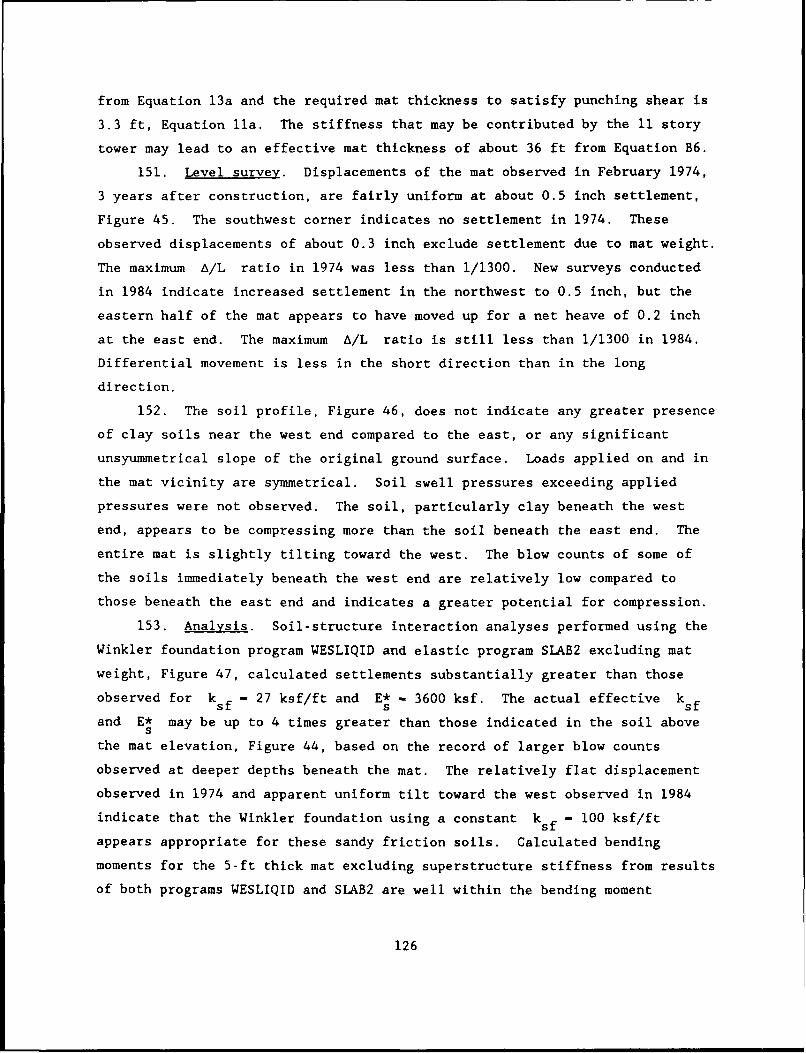
from Equation 13a and the required mat thickness to satisfy punching shear is
3.3 ft, Equation lla. The stiffness that may be contributed by the 11 story
tower may lead to an effective mat thickness of about 36 ft from Equation B6.
151. Level survey. Displacements of the mat observed in February 1974,
3 years after construction, are fairly uniform at about 0.5 inch settlement,
Figure 45. The southwest corner indicates no settlement in 1974. These
observed displacements of about 0.3 inch exclude settlement due to mat weight.
The maximum A/L ratio in 1974 was less than 1/1300. New surveys conducted
in 1984 indicate increased settlement in the northwest to 0.5 inch, but the
eastern half of the mat appears to have moved up for a net heave of 0.2 inch
at the east end. The maximum A/L ratio is still less than 1/1300 in 1984.
Differential movement is less in the short direction than in the long
direction.
152. The soil profile, Figure 46, does not indicate any greater presence
of clay soils near the west end compared to the east, or any significant
unsyummetrical slope of the original ground surface. Loads applied on and in
the mat vicinity are symmetrical. Soil swell pressures exceeding applied
pressures were not observed. The soil, particularly clay beneath the west
end, appears to be compressing more than the soil beneath the east end. The
entire mat is slightly tilting toward the west. The blow counts of some of
the soils immediately beneath the west end are relatively low compared to
those beneath the east end and indicates a greater potential for compression.
153. Analysis. Soil-structure interaction analyses performed using the
Winkler foundation program WESLIQID and elastic program SLAB2 excluding mat
weight, Figure 47, calculated settlements substantially greater than those
observed for kf - 27 ksf/ft and E* - 3600 ksf. The actual effective kf
and E* may be up to 4 times greater than those indicated in the soil aboves
the mat elevation, Figure 44, based on the record of larger blow counts
observed at deeper depths beneath the mat. The relatively flat displacement
observed in 1974 and apparent uniform tilt toward the west observed in 1984
indicate that the Winkler foundation using a constant ksf - 100 ksf/ft
appears appropriate for these sandy friction soils. Calculated bending
moments for the 5-ft thick mat excluding superstructure stiffness from results
of both programs WESLIQID and SLAB2 are well within the bending moment
126
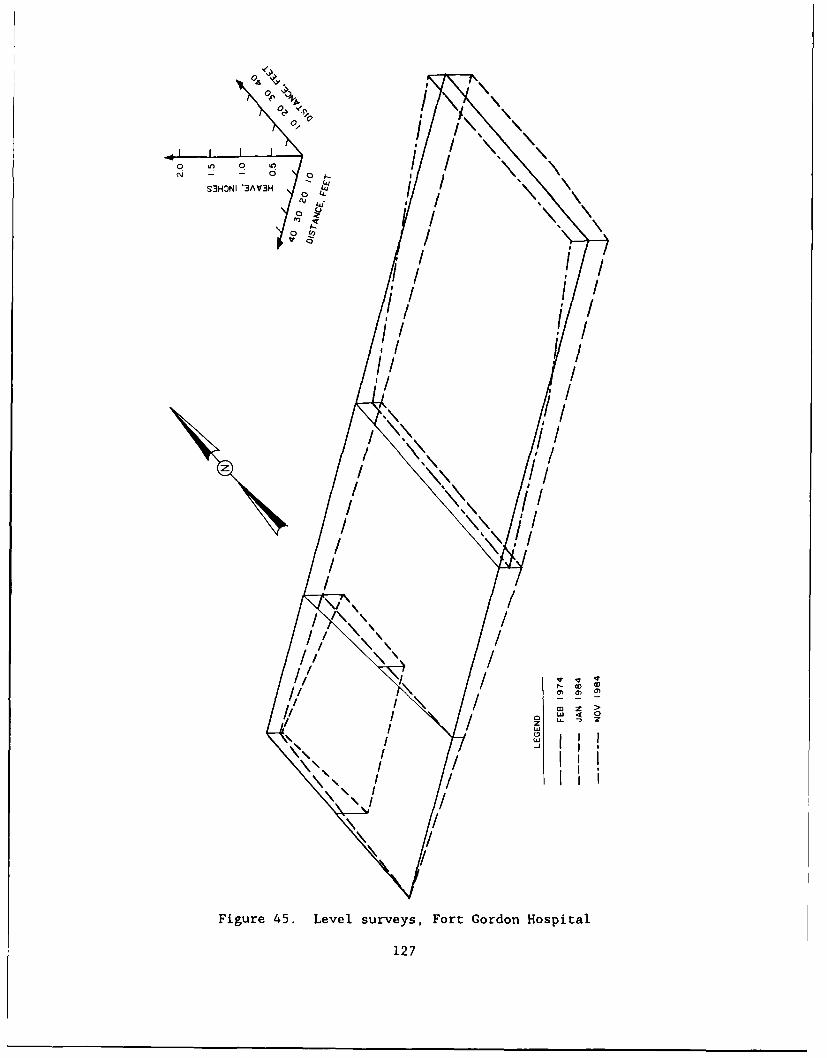
% %
0,0/ %%0 i 0 / \ \
N .o,. ^- 0 7 a
°U /o ''
I/i/IN iiIVH~
II
/ I!
/ \,, \i/ ,II! !i
/ I/u \\ // /12
I /t
/ I\I
\/ / I
Figure 45. Level surveys, Fort Cordon Htospital
127
x:0001 00CWV: *04X v x-02
I Coj
I
U) I= N o w:a : 0f.! :
zz
00
0
_ U))
00
'I.,,
IIn
a; I I c ON ON "a IN ,, 0 a1
CD~~ 0CN - 0 0
IJ 'NOIIVA3-13
Figure 46. Soil profile, Fort Gordon Hospital
128
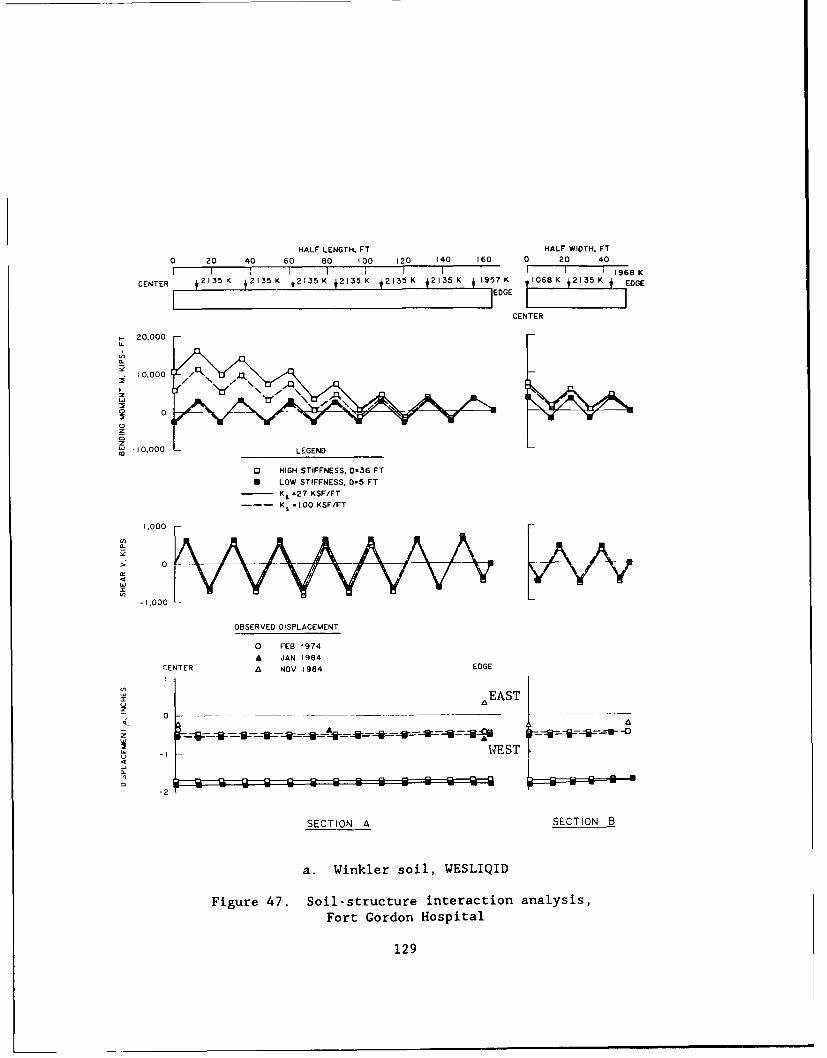
HALF LENGTH, FT HALF WIDTH, FT0 20 40 60 80 100 120 140 160 0 20 40
I I I I I I i 1968 K
CENTER 12135K 12135K +2135K J2135K +2135K +2135K ,957K I068BKJ2
135 K EDGE__G
E DG E m
CENTER
20,000
00
zw - 0,000 LEGEND
0 HIGH STIFFNESS. D-36 FT
m LOW STIFFNESS, 0=5 FT
- K s =27 KSF/FT
Ks -IO0 KSF/FT
AAA AA AA-1.000
0"
OBSERVED DISPLACEMENT
0 FEB f974
A JAN 1984CENTER A NOV 1984 EDGE
I
AEAST
- 0 zA-_-.B~--_i--- -0
0~ _, . T, ST
-2
SECTION A SECTION B
a. Winkler soil, WESLIQID
Figure 47. Soil-structure interaction analysis,
Fort Gordon Hospital
129
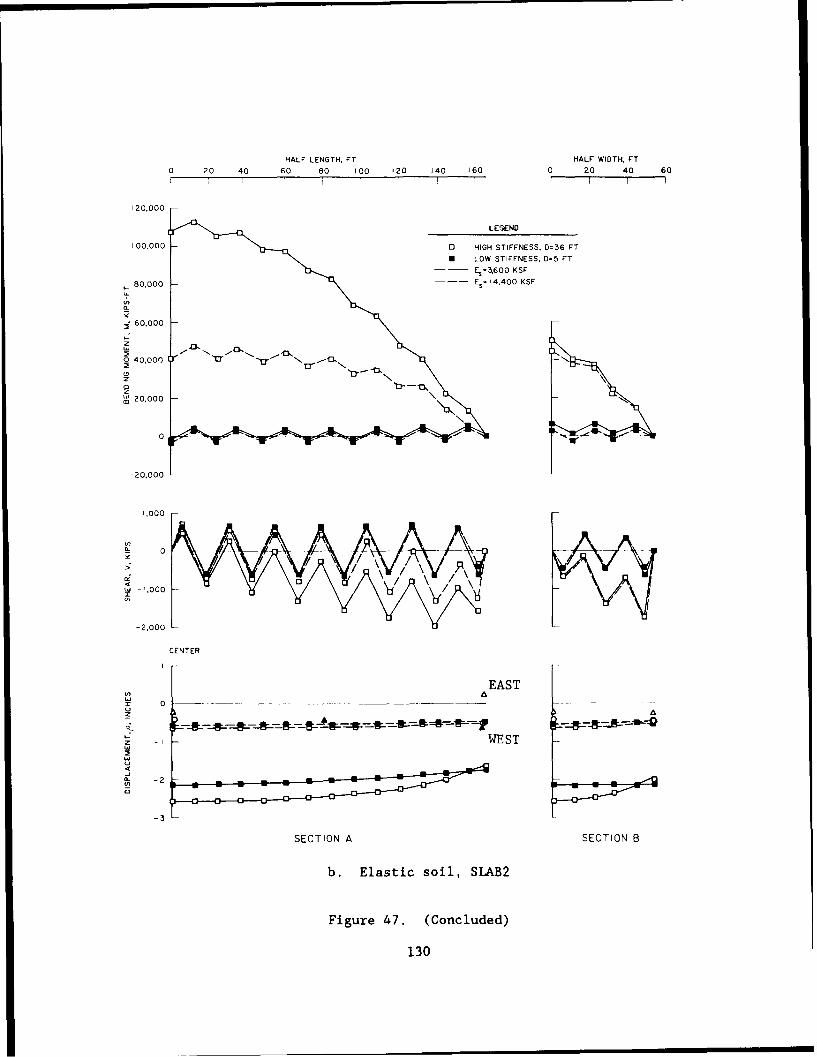
HALF LENGTH. FT HALF WIDTH, FT
O 20 40 60 80 100 120 140 160 0 20 40 60
120,000
LEGEND
100.000 -0 HIGH STIFFNESS. 0=36 FT
m LOW STIFFNESS, D=5 FTE,=3,600 KSF
80.000 -Esz 14,400 KSF
60.000
z
0
- 20,000
0
-1.000
- 2,000
CENTER
EAST
-'WEST
-3
SECTION A SECTION 8
b. Elastic soil, SLAB2
Figure 47. (Concluded)
130
resistance of 6000 kips-ft. The structure is performing in a satisfactory
manner.
Fort Polk Hospital
154. This hospital, constructed in 1978-1979, is located south of 3rd
street, west of Mississippi Avenue on South Fort Polk, Louisiana. The
topography is hilly and slopes down to the south and southwest at
approximately an 8 percent grade. The 242.5-ft by 259-ft rectangular
multistory structure consists of a 7 story central tower section with adjacent
2 story elements. The mat supporting the hospital is 3 ft thick beneath the
tower section and 2 ft thick beneath the low rise sections as illustrated in
the west half of the foundation plan, Figure 48. Minimum bottom reinforcement
in the 3-ft thick portion of the mat consists of number 10 bars at 12-inch
centers eac', way, whlich contributes a positive (tension in bottom fibers)
bending moment resistance of 171.4 kips-ft/ft width of mat from Equation Ila.
The superstructure is relatively flexible consisting of precast concrete
panels on a structural steel frame. Column loads, Figure 48, lead to an
average pressure of 1.4 ksf. The mat weight contributes an additional 0.5 ksf
for a total average applied pressure q - 1.9 ksf.
155. Soil parameters. Thirty-two borings were made from December 1976
through March 1977 for the purpose of obtaining information for foundation
design and to select the optimum site. Surface soil consists of loose, silty
sands (SM, SC) from a few inches to about 2 ft in thickness underlain by beds
of high CH to medium CL plasticity clays of the Blount Creek member of the
Fisk formation, Figure 49. Water content of the clays is approximately 20
percent. A perched water table is indicated within 10 ft beneath the mat
base.
156. Consolidometer/swell tests indicate swell pressures in excess of
the overburden pressure with possible potential for soil swell at depths
exceeding 10 ft beneath the mat. The pressure exerted by the structure and
overlying soil is less than the swell pressure so that the soil can heave on
wetting and some uplift of the structure may occur. The soil elastic modulus
within 30 ft beneath the mat base appears highly variable and may be as large
as 3300 ksf.
131

al -T 0) C - 0 0 0 'a I 04- N o N 0 Na r4 40 40 0 0
0 ) col NNj I ~ 1 1 '
v C' . I~ )
0- In0
'n 0) 10 0l No 0w C, c
o'Z' ULO '- 0 !-Y. N
--E- U Ui
- ()0 N D CU) - 0 6
o 6) 6) 0 6 ) ) 0
C n, f'Y v) ( IN a o o0 ~ , re .0 0 O0 0 -oN (D
- U NO 01 0 I - OI . N
Ch ®I D 10 V0 q1 0 0
cov N1 0t' 0 ' 0 ci
I~ .. U U
* v 01 NIOD NI 0
r-0 o .0 1 W) 0Y 0 ' j (a
0DV .0 IOIN NIn~ N N N, a
LO N- ~ a~0 ) i a)I
For Pol Hopia, Loisan
U132
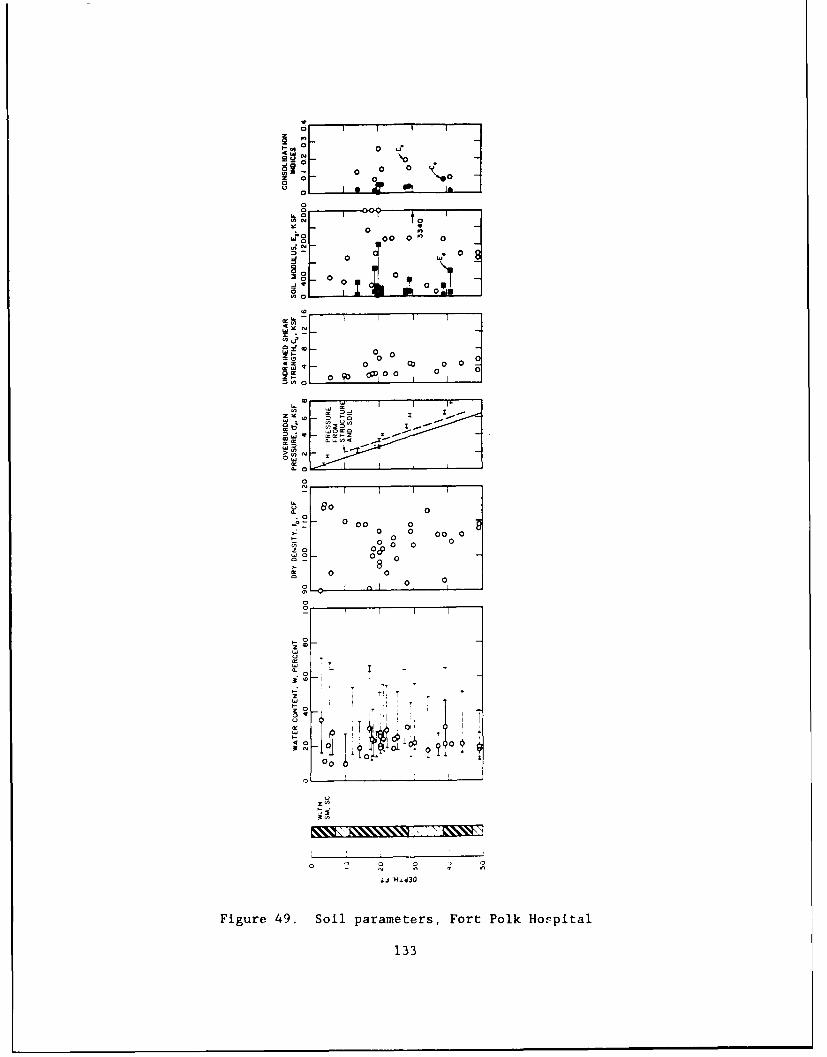
~N0I
0 0 0
00
0 -' 00 0~ 0
0 0
0n 0
0o0.0o
0 0 0
0 0
Soo 0 00 0 O0
0
w
00 0i
8o
00 0 0
®1 T I '- T"
0 0
z- 0 T I
b 88w. 00
00 01 0 0
20
0 0
oi-
00 0
Figure 49. Soil parameters, Fort Polk Hospital
133

157. Level survey. Level surveys conducted following construction of
the mat in September 1979, Figure 50, indicate an initial slight rebound in
November 1979 to a maximum of 0.35 inch near the northeast corner where the
depth of excavation of about 15 ft is greatest. At that time the center west
edge appeared to experience the greatest differential movement of about 1/500
and settlement of about 0.4 inch. During further construction and placement
of the superstructure to April 1980, the entire mat settled and reached a
maximum settlement near the north perimeter. Average settlement was about 0.3
inch. 0.5 inch was taken as the actual settlement to compensate for some
swell. The effective modulus E* is 11,000 ksf from Equation 3 assuming p -s
0.5 inch, q - 1.9 ksf, p, - 0.7 and y0 - 1.0. This modulus is substantially
larger than those from soil tests.
158. A level survey conducted in February 1981, about 1.5 years
following completion of construction, indicated a small heave of about 0.5
inch relative to April 1980 distributed fairly evenly over the mat except in
the southeast corner. The basis for this heave is presumably the potential
for swell, Figure 49. Level readings taken in March 1982 indicate a fairly
uniform settlement relative to February 1981. The overall displacement by
March 1982 relative to the initial readings in September 1979 was only about
0.1 inch of settlement. The maximum recorded settlement in March 1982 was 0.4
inch near the southeast corner and maximum recorded heave of about 0.5 inch
was near the northeast corner. Structural distress had not been observed in
the hospital. The dishing action characteristic of uniformly loaded flexible
mats on deep, compressible, cohesive soil is not readily apparent.
159. Analysis. Results of soil-structure interaction analyses performed
using programs WESLIQID, CBEAMC, and SLAB2 are shown in Figure 51. Analysis
denoted as Run 1 used a constant mat thickness D - 3 ft, constant coefficient
of subgrade reaction ksf - 27.6 ksf/ft, and Ec - 432,000 ksf. ksf - 27.6
ksf/ft is approximately equivalent to E* - 5500 ksf for an elastic analyiss
when simulating displacements. Analysis denoted as Run 2 used a variable ksf
calculated from Equation 8a using E* - 11,000 ksf and influence factor POP,
derived from the ribbed mat analyses. These influence factors are in part
justified by noting that the stiffness of this mat should approximately be the
same stiffness as thp ribbed mats. Results show that bending moments and
134
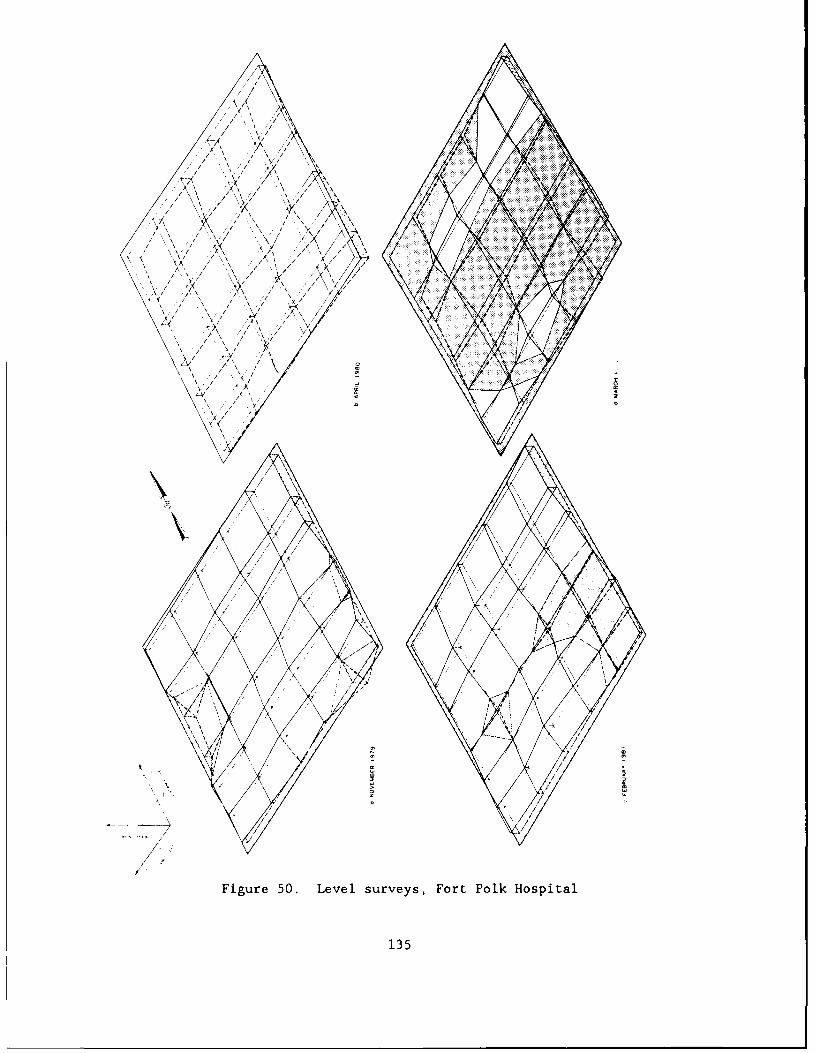
/// \
I
~\ /I'
/ \ ,\/ ~\ / \
/ ~ /
4/Ax \ /
, ,/ \' 'I'
~' ' ~-V/ ~'\ '-
./ \ ,/ \,/ \\ / / ' /
// \\ / Al~ / \ /\~
,// \ I
*~i ~A,/ ~<'\
,' , /~\ ~ /
/ \' ~ C'
/ \)(// //
/ A'A~ /I \ / <V
/\\ ,/ ~\ /
\,/,2/ A\ ~/ \
,/ ~/ /
v,/21 /1
V/
/ \
Figure 50. Level surveys, Fort Polk Hospital
135
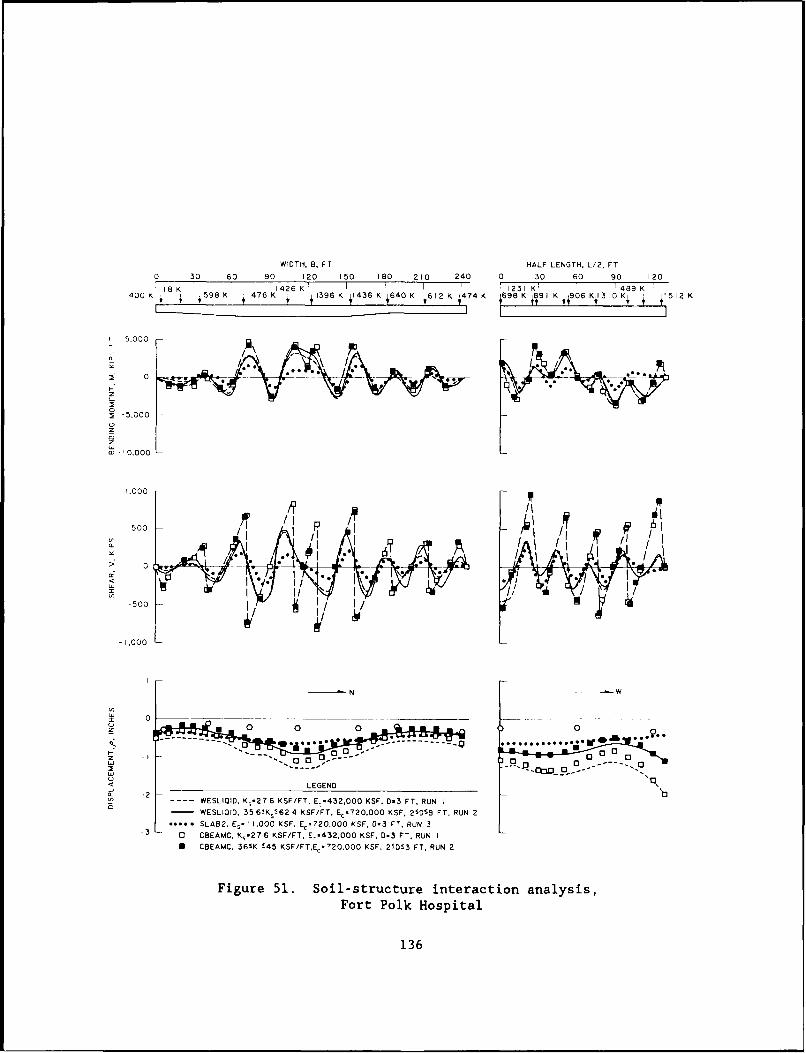
WIDTH, 8. FT HALF LENGTH. L/2, FT0 30 60 90 120 150 180 210 240 0 30 60 90 120
1 18K 11426 K7 _ F i 1231 K' 14,39K400 K 598 K 1476 K 1396 K i1436 K 640 K t612 K 474 K 698 K 89 1 K 906 K1310 K 1512 K
5.000
z
0
w 0,000
.000
>
-50I I i'- II/I
- 1,000
N -I
0~-
0 BAC z.7 S/T C-3,0 K0.03FT U
1363
shears from SLAB2 are least, while those from CBEAMC are greatest. All
bending resistances are within capacity.
160. Calculated displacements for the Winkler foundation indicate
maximum settlement near the center section A with edge down behavior.
Calculated displacements at the edge of section B had substantial edge down
movement. CBEAMC results indicated slightly smaller settlements than
W#ESLIQID results from Runs I and 2. Results from SLAB2 indicate center down
displacements relative to the edges and appear most representative of the
observed mat performance. A comparison of WESLIQID and SLAB2 displacements is
better given in Figure 52. Modeling the variations in mat thickness and
varying ksf across the mat dimensions appear to have limited influence on
the calculated performance. Actual displacements are less than calculated
because the soil stiffness may be greater than that assumed and some soil
heave had occurred. The SLAB2 analysis indicates less differential movement
in the short direction than in the long direction.
161. A two-dimensional finite element plane strain program using the
hyperbolic model soil model was performed in 1977 (data furnished by the Fort
Worth District) that simulated excavation and construction loading increments.
The soil elastic modulus was similar to E* - 5500 ksf. The maximum depth ofs
the finite element mesh was about 60 ft beneath the mat base. Calculated mat
displacements for section A was a maximum of 1 inch settlement in the center
with a net heave of about 0.4 inch near the north end. Actual movements
observed in 1982, Figure 50d, indicate heave in the north corner of about 0.4
inch and maximum settlement of about 0.5 inch in the center.
Summary and Conclusions
162. Settlement of these multistory structures is primarily from
recompression of the soil. The influence of environmental changes such as
moisture flow and heave could be observed on differential movements, but these
differential movements did not significantly reduce performance. Differential
movement in the short direction was less than in the long direction.
163. The stiffness of these complete structures on flat mats is semi-
flexible. Plate on elastic foundation computer program SLAB2 appeared to
provide an adequate correlation of calculated deformation of flat mats in
cohesive soil, while the Winkler foundation using a constant ksf appeared
137
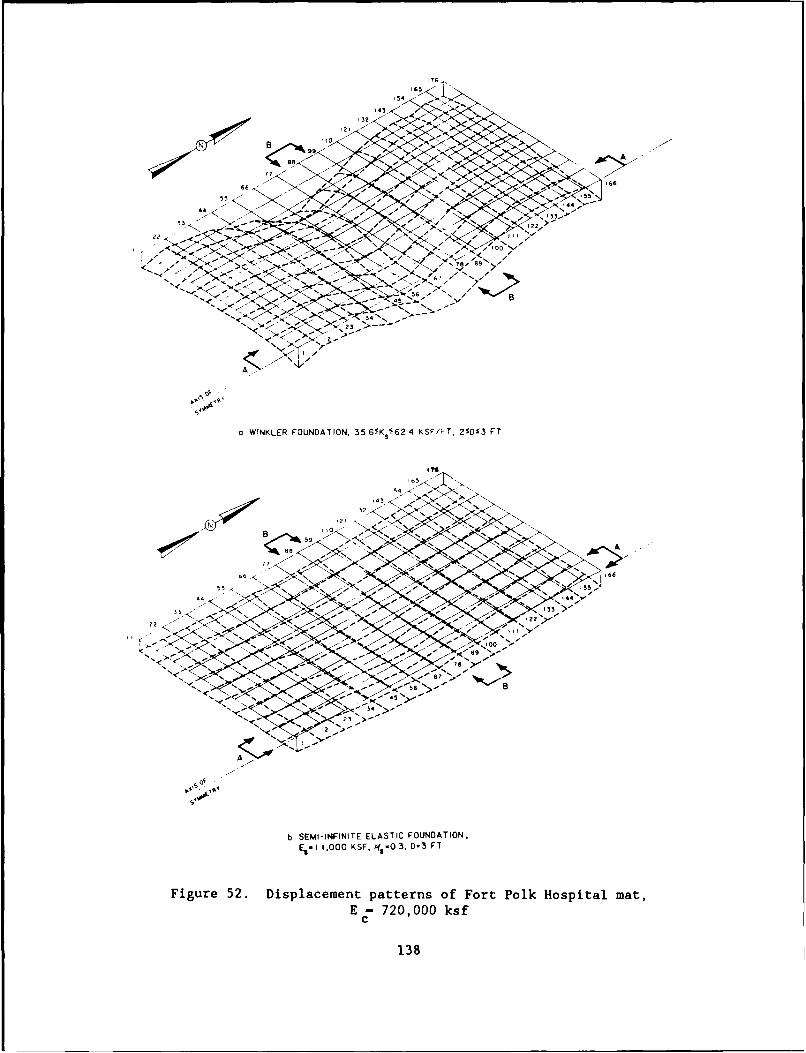
6
154
143, " ,
1 32 .
N B .. ~ ''f -
t:-72,0 -s£
66 , 366
44 ---- 144
'A )'~-, - 122,
'N 00
> .~
'.23
<<
a WINKLER FOUNDATION, 35 65K S'2 4 KSF/FT, 2SO63 FT
.2 A
55 '1'5
5 <
1 0'
A
b SEMI-INFINITE ELASTIC FOUNDATION,S-1 1.000 KSF. Af- 3. 0-3 FT
Figure 52. Displacement patterns of Fort Polk Hospital mat,E - 720,000 ksf
138
superior in cohesionless soil. ksf may be evaluated from elasticity theory
using Equation 8a when simulating displacements. ksf is also similar to the
constant k relating the Young's soil modulus with depth z, Equation 29.
This observation is consistent with the correlation between ksf and k
given in Appendix A. Young's soil modulus is taken as the initial tangent
modulus evaluated by the hyperbolic soil model from results of triaxial
strength Q tests. A representative elastic modulus may be calculated from
Equations 4 for nonuniform soil and depends on the soil stiffness for
substantial depths beneath the mat. The depth of soil testing should be about
twice the minimum width of uniformly loaded flat mats.
164. Stresses in mat foundations developed by heaving soil as a result
of changes in soil moisture are often significantly more severe than stresses
caused by normal displacements under structural loads. Appendix E shows that
bending moments substantially increase in mats supported by soil of greater
stiffness for given soil heave patterns. The soil heave pattern is typically
random for these studies and not easily predictable for any of these
structures. If differential movements caused by changes in soil volume do not
occur, increasing soil stiffness decreases bending moments because of
imnproved soil support, reduced settlement and distortion.
139
PART IV: APPLICATION OF FIELD PERFORMANCE
Introduction
165. A field study of building 333 at the Red River Army Depot (RRAD),
"Light Track Vehicle Shop" of the Maintenance modernization Project was
initiated to provide improved understanding of the performance of ribbed mats
constructed in cohesive/expansive soil. The site is located on the eastern
edge of the RRAD west of Texarkana, TX, bounded by Texas Avenue on the north,
K avenue on the east, 8th street on the south, and C Avenue on the west.
166. Building 333, under construction from 1983 to 1985, is a flexible,
steel framed structure on a ribbed mat spanning 678 ft by 304 ft and includes
two expansion joints dividing the mat into three monolithic units, Figure 53a.
Stiffening beams are placed on 12.5-ft centers near the perimeter with
interior beams on 25-ft centers as indicated by an enlarged view of the
Southeast corner of the mat plan, Figure 53b. All stiffening beams are 1.5-ft
wide by 3-ft in depth below the top surface of the mat. Column loads are
placed on enlarged sections of the stiffening beams up to 10.5 ft on a side as
illustrated in Figure 53b by the squares for interior columns and triangles
for the perimeter or corner columns. Reinforcement steel consists of two No.
11 bars placed top and bottom with 4 inches of concrete cover below the top
surface of the mat and above the bottom of each stiffening beam. Steel was
not continuous between each monolithic unit at the expansion joints.
167. Excavation of from 5 to 8 ft of overburden and placement of
compacted cohesive, nonexpansive, low plasticity fill was initiated on the
north end of the site during 1983 and completed on the south end by August
1984. A 6-inch gravel layer and a plastic polyethylene vapor barrier were
placed on the fill. A vapor barrier was also placed in the bottom of the
stiffening beam excavation trenches and seated snugly against the walls of the
trenches. The limits of the fill extend 5 ft outside of the ribbed mat
perimeter. The construction site also includes an old drainage ditch aligned
along the east-west direction near line 23 (shown later in Figure 55a).
Appendix F provides the foundation design by the Facilities System Engineering
Corporation using the Post-Tensioning Institute method1 1 and foundation design
analysis by the US Army Engineer District, Fort Worth.
140
m
Ld( r00 00 0 0 (fl
w
Z D0000 -4
DM0000 0 zI0- 0 o
Dz 0 1-U
~Ld
0 0I.-
0 0 0
0 0 0 0 0 Q
)000 0 0 c 0 -
0 0
0 00 V
o. 0 ,,hO .--
0 Lii0 0 0 0 0 0C
Figure 53a. Plan view of mat for building 333
141
0@ 00@0000@
w 0
II I It I Uw gy '-CIF-17~ EI I-ILa7~~ 0Wcc 0
1:1E1-1E wCea_N' GDDD CGDLZDE CLwC)aa
I: 3
CU 0 sCU
0 am we
0a
4
Figure 53b. Southeast corner of the mat plan
142
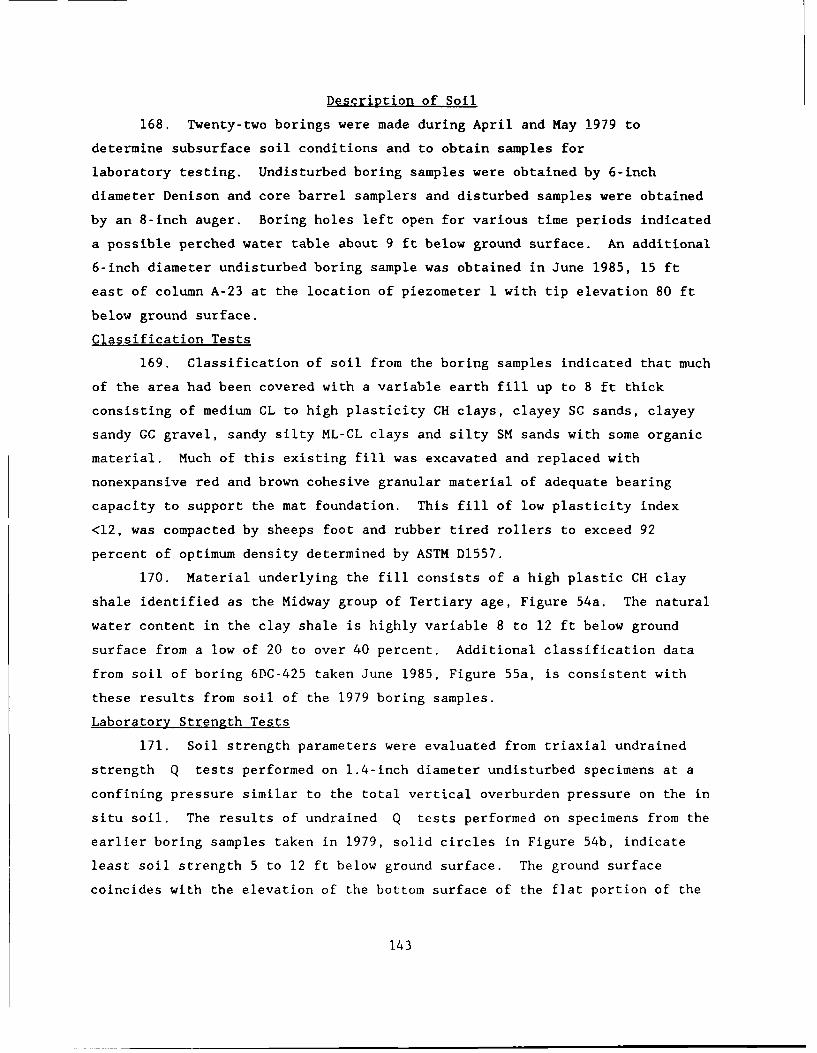
Description of Soil
168. Twenty-two borings were made during April and May 1979 to
determine subsurface soil conditions and to obtain samples for
laboratory testing. Undisturbed boring samples were obtained by 6-inch
diameter Denison and core barrel samplers and disturbed samples were obtained
by an 8-inch auger. Boring holes left open for various time periods indicated
a possible perched water table about 9 ft below ground surface. An additional
6-inch diameter undisturbed boring sample was obtained in June 1985, 15 ft
east of column A-23 at the location of piezometer 1 with tip elevation 80 ft
below ground surface.
Classification Tests
169. Classification of soil from the boring samples indicated that much
of the area had been covered with a variable earth fill up to 8 ft thick
consisting of medium CL to high plasticity CH clays, clayey SC sands, clayey
sandy GC gravel, sandy silty ML-CL clays and silty SM sands with some organic
material. Much of this existing fill was excavated and replaced with
nonexpansive red and brown cohesive granular material of adequate bearing
capacity to support the mat foundation. This fill of low plasticity index
<12, was compacted by sheeps foot and rubber tired rollers to exceed 92
percent of optimum density determined by ASTM D1557.
170. Material underlying the fill consists of a high plastic CH clay
shale identified as the Midway group of Tertiary age, Figure 54a. The natural
water content in the clay shale is highly variable 8 to 12 ft below ground
surface from a low of 20 to over 40 percent. Additional classification data
from soil of boring 6DC-425 taken June 1985, Figure 55a, is consistent with
these results from soil of the 1979 boring samples.
Laboratory Strength Tests
171. Soil strength parameters were evaluated from triaxial undrained
strength Q tests performed on 1.4-inch diameter undisturbed specimens at a
confining pressure similar to the total vertical overburden pressure on the in
situ soil. The results of undrained Q tests performed on specimens from the
earlier boring samples taken in 1979, solid circles in Figure 54b, indicate
least soil strength 5 to 12 ft below ground surface. The ground surface
coincides with the elevation of the bottom surface of the flat portion of the
143
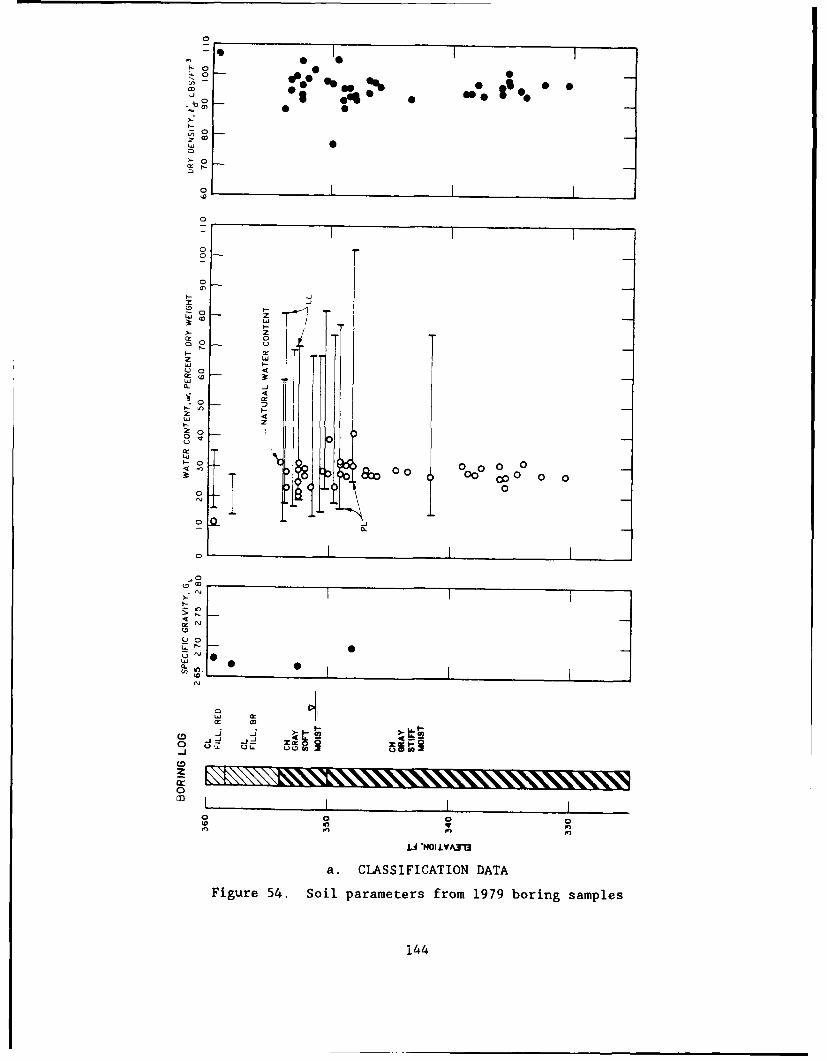
.0 Z CO
~000
0
0
0M
CD0
ED 0L.J1:
z
CLi
0
w~0 0
0 .4
~~00
01
0
L.)
QC-
00
F,.
a. CLASSIFICATION DATA
Figure 54. Soil parameters from 1979 boring samples
144
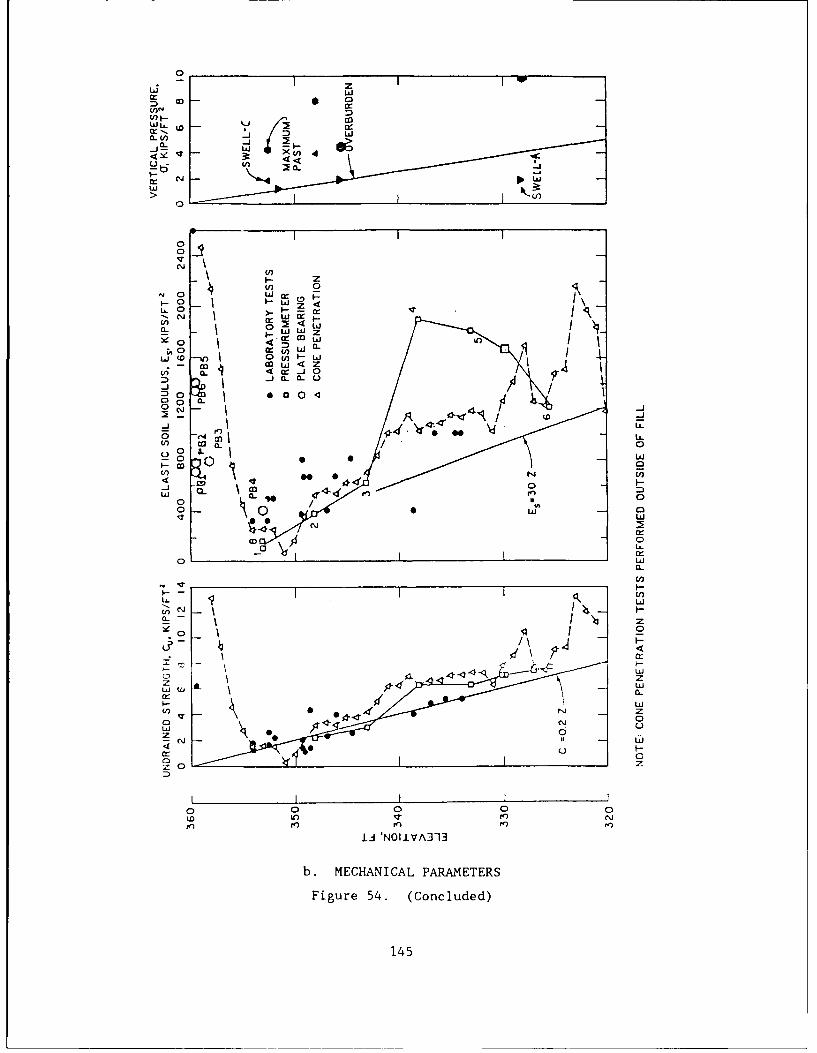
F- cCL W
a.44-i wU x
>-k
0
0
0 WC
F- 0
-N c1 r
0N
-j (L
.00
-J C1 C -.
0 0
00
0 C,,
LL
0N w
-I 0
*0
LdW
0U
W LO> 0
Y,0
00z zJ
MEHNIA PARAETERFiur 54ICocudd
145

0
01
Ij 0
O')
0
0
LLJ~ C1a-,
I) w
Q3 I
C0 O_- OZ- OC- Ot- 09- 09- OL- 08-Ii 'Hid]G
a. CLASSIFICATION DATA
Figure 55. Soil parameters from boring 6DC-425, June 1985
146
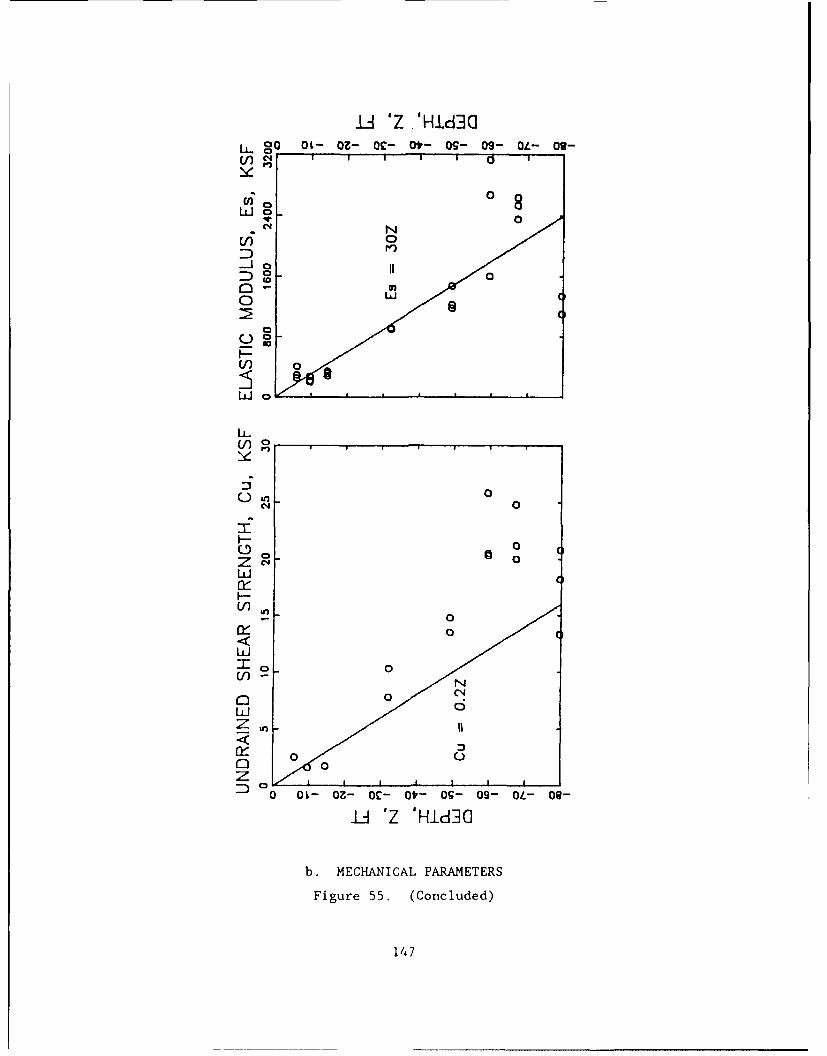
iA 'Z .Hid3CI~ Q 01- Oz- aV- Ot- Os- 09- OL- 09-
e. 0NN
0-
0-
0
U-
0 in
C4 0
0
0:0
LJ100
0 C
D 00 0- UZ ~ ~ ~ 9 L 9
iJ 'Z 'Hid3G
b. MECHANICAL PARAMETERS
Figure 55. (Concluded)
147
mat, elevation 365.33 ft above sea level. The nominal elevation of the finish
floor surface is 366.00 ft. The undrained strength may increase linearly with
depth below 5 ft of depth by
C - 0.2z, z > 5 ft (30)
u
where
C = undrained strength, ksfu
z - depth, ft
Additional strength tests performed on specimens from boring sample 6DC-425
taken June 1985 confirm earlier results, Figure 55b.
172. The elastic soil moduli E determined from laboratory tests,s
solid symbols in Figures 54b and 55b, are the initial moduli calculated by the
hyperbolic model23. The elastic modulus approaches a minimum of 200 ksf from
6 to 10 ft below the ground surface and appears to increase with depth below
10 ft approximately by
E - 30z, z > 5 ft (31)s
where E is the soil elastic Young's modulus, ksf. Combining equations 30s
and 31 indicate that E is about 150 times Cs u
Consolidometer Swell Tests
173. Two consolidometer swell tests were performed on undisturbed
specimens from soil samples obtained in 1979 after ASTM D4546 method C
(labeled SWELL-C in Figure 54b) and an additional three tests were performed
on undisturbed specimens from boring sample 6DC-425 after ASTM D 4546 method A
(labeled SWELL-A in Figure 54b). The results of method C on the 1979 soil
specimens indicate that swell pressures a exceed the vertical overburden
pressure above 20 ft of depth. Results of method A on the 1985 soil specimens
indicate a on the order of the vertical overburden pressure above 20 ft and
a - 1.95 tsf or about 1/2 of the total vertical overburden pressure at 32 ft
of depth. The soil is overconsolidated with an overconsolidation ratio (OCR)
of about 4 above 20 ft and an OCR of 10 at 32 ft of depth. The compression
index C is 0.20 ± 0.05 and the swell index C is about 0.07 ± 0.1.c s
174. A shallow water table may exist at this site based on comparison
of the overburden pressures with swell pressure results from the 1985 soil
148
specimens using method A. Removal of these specimens from the field had
relieved the vertical and lateral confining pressures and caused the pore
pressures in these specimens to decrease by approximately the mean normal
confining pressure
a (1 + 2K 0)
am v (32)3
where
a - mean normal confining pressure, ksf
a - total vertical overburden pressure, ksf
K - coefficient of earth pressure at rest0
For OCR of 4 to 10, K is about 1.2 to 1.563. At 32 ft a is about 5.2 ksfo m
where a is about 3.8 ksf and K is about 1.5. Assuming the effective
stress remains constant following removal of the soil samples from the field,
the in situ positive pore water pressure u - a - a or 5.2 - 3.8 - 1.4w m s
ksf. This translates to a pressure head of 23 ft at 32 ft of depth. The
groundwater level should be about 9 ft below ground surface assuming that the
pore water pressure is hydrostatic. This is consistent with the actual
observed groundwater level of 9 ft below ground surface in open boreholes
during soil sampling. Piezometric data described later as part of the field
instrumentation program show that a shallow perched water table exists
following construction above 50 ft of depth with groundwater level
approximately 5 ft below ground surface.
In Situ Soil Tests
175. Pressuremeter, cone penetration, and plate bearing tests were
performed to complement results of the laboratory tests. Figure 56
illustrates the relative location of these field tests. Details of these
tests are provided in Appendix G.
176. Pressuremeter. Eight tests, besides calibration tests to
compensate for volume losses and membrane resistances, were performed 26
November 1983 in two hand augered holes. One test was conducted in a borehole
10 ft west of column A on line 26 of the planned location of building 333,
Figure 56, in the bottom of the open excavation prior to placement of the
63Brooker and Ireland 1965
149
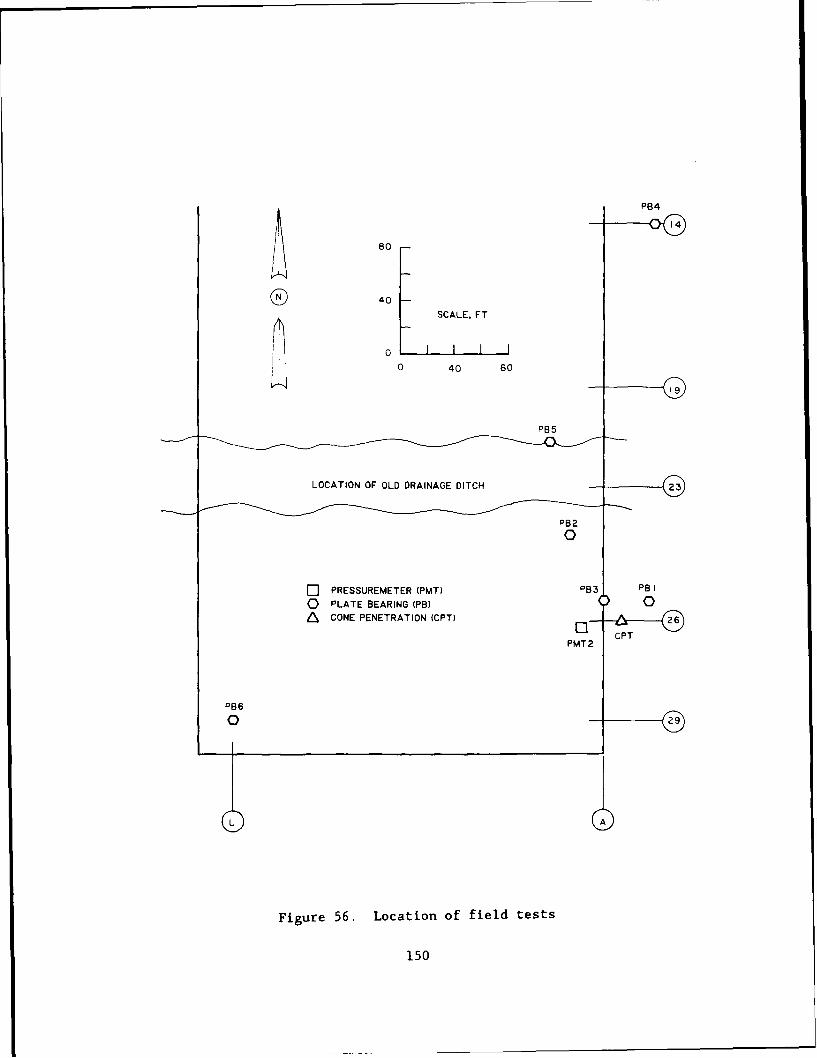
PB4
80 1
SCALE, FT
'1, 0
0 40 so
0
E PRESSUREMETER (PMT) B P
0 PLATE BEARING (PB)0
ZS CONE PENETRATION (CPT) 2
PB6
0 2
L A
Figure 56. Location of field tests
150
compacted fill. The remaining tests were conducted 16 ft west and 6 ft south
of location A-26, at the bottom of the excavation. Results of the
pressuremeter tests were used to estimate the undrained shear strength and
Young's elastic soil modulus.
177. The undrained shear strength evaluated from the pressuremeter
limit pressure by
C - L + 0.5 (33)10
whereC - undrained shear strength, ksf
u
PL* - limit pressure, ksf
compares well with results of the laboratory undrained strength data, except
between 330 to 345 ft, Figure 54b. An anomaly such as this may be due to
local variations in soil stiffness. Equation 33 provides estimates of soil
shear strength that are least among several methods64.
178. The pressuremeter modulus may be evaluated by
(1 + s) AP (R + AR m )E =- (34)
AR
where
As - Poisson's ratio of soil, 0.33
AP - change in pressure measured by the pressuremeter, ksf
R - probe radius, 2.28 inches0
AR = change in radius from R at midpoint of straight portion ofm o
pressuremeter curve, inches
AR - change in radius between selected straight portions ofpressuremeter curve, inches
The first load pressuremeter modulus calculated from Equation 34 was evaluated
from the slope of the straight portion of the pressuremeter curves on loading.
This pressuremeter modulus, Figure 54b, is consistent with the initial soil
modulus evaluated from the undrained triaxial strength test results for soil
above 20 ft of depth, but substantially greater than laboratory data between
64Baguelin, Jezequel, and Shields 1978
151

20 and 30 ft. Table 4 indicates that the elastic modulus is (I + s),E p; this
is consistent with the initial soil modulus from laboratory strength tests.
179. Cone penetration. The cone penetration test (CPT) was conducted
15 ft east of location A-26, Figure 56, on 17 August 1984 in accordance with
ASTM D3441 with the exception of the rate of penetration. This test was
conducted outside the limits of the compacted fill, Figure 56. The cone is a
Fugro electronic friction sleeve type hydraulically pushed into the ground at
a constant rate of 4.72 inches/sec. The CPT sounding was conducted to a depth
of 40 ft before the test was terminated due to friction buildup on the cone
rods that exceeded the 20-ton capacity of the truck.
180. The CPT data indicated a soil classification consistent with that
observed from laboratory classification tests on soil specimens, Figure 54a.
Estimates of the undrained shear strength may be made from the tip resistance
by
C = c v (35)u Nk
where
qc - tip resistance, ksf
a - vertical overburden pressure, ksf
Nk = tip cone factor
Figure 54b shows estimates of Cu determined from q c at 1-ft increments for
Nk equal to 20. These cone derived strengths are initially high exceeding 12
ksf in the natural subgrade and decreasing rapidly to about 1.5 ksf in the
Midway clay. An exceptionally low value of 0.4 ksf was observed in the Midway
clay 9 ft below grade indicating a soft material. Results from other tests
were not available to check the cone strength at 9 ft. The CPT is able to
provide a continuous log of soil parameters in the profile and can detect the
existence of thin strata that might otherwise be missed. Undrained strengths
below 9 ft increase at approximately a constant rate slightly greater than
0.2 ksf/ft as the depth increases.
181. The constrained soil moduli may be roughly estimated from qc by
Ed - a.qc (36)
where a is an empirical constant that often varies from 3 to 8 for lean
152
clays when q is less than 14 ksf. Ed estimated from Equation 36 for
- 8 is shown in Figure 54b. Young's soil elastic modulus will be roughly 30
percent of the constrained modulus for ps - 0.4; these moduli are reasonably
consistent with results of the other tests.
182. Plate bearing. A series of plate bearing tests was performed 16
to 20 July 1984 in general accordance with ASTM Standard Test Method D1194 at
six different locations on prepared surfaces, Figure 56. The soil surface at
each location was initially leveled by scraping away loose material within a
3-ft diameter. Clean, fine sand was subsequtently sprinkled on the prepared
soil surface to assist leveling of the plates. Three circular steel bearing
plates at least 1 inch thick each with diameters of 12, 18, and 30 inches were
concentrically positioned at each location with the 30-inch plate on the
bottom. The maximum pressure applied through the 12 and 18-inch plates to
the 30 inch plate by the truck and water tank loading system was 30 psi.
183. The plate coefficient of subgrade reaction k measured fromsp
these tests was converted to an elastic soil modulus by the elastic equation8a
Es - popiksp B p (37)
where
A0 = depth influence factor, Figure 3
Ai = shape influence factor, 0.62 (Figure 3)
k = plate coefficient of subgrade reaction, ksf/ftsp
B - plate diameter, 2.5 ftP
The depth influence factor p was normally 1.0 for tests conducted at the
ground surface except for test PB-4 where p was taken as 0.9 because the
test was conducted 6.7 ft below ground surface. The elastic soil modulus
surface. The elastic soil modulus evaluated by Equation 37 from results of
the plate bearing test, Appendix G, shows values from 700 to 1300 ksf in the
compacted fill or natural grade.
184. After plate bearing test PB-2, a 6-inch diameter mold was pushed
into the compacted red fill by the hydraulic jack reacting against the truck
weight at this same location, Figure 56, to obtain a soil sample for
laboratory tests. Results of an unconsolidated-undrained triaxial test of a
153
specimen cut from this soil sample indicated an elastic modulus of 2600 ksf.
The elastic moduli evaluated from results of the plate bearing test are
influenced by the soil stiffness down to about twice the plate diameter or
about 5 ft below the plate. Therefore, the average elastic soil modulus in
the fill may be substantially less than the 260C ksf that was measured within
the fill near the ground surface. Result of plate bearing test PB-4 conducted
6.7 ft below grade is consistent with results of E evaluated from5
laboratory strength tests, but more than twice E evaluated from Equation 34P
for the pressuremeter first load modulus, Figure 54b.
Field Instrumentation
Piezometers
185. Six Casagrande type porous stone piezometers I through 6 were
installed with tips at depths of 80, 50, 40, 26, 8, and 5 ft, respectively,
below ground surface in front of building 333 in June 1985 near column A-26,
Figure 53b. Detail of the tip installation is shown in Figure 57. Tip
locations of piezometers 5 (8 ft) and 6 (5 ft) were selected to determine the
ground water level just below the base of the fill and within the fill.
Piezometers 2 (50 ft), 3 (40 ft) and 4 (26 ft) were selected to evaluate the
hydraulic head in the clay shale. The piezometer tip at 80 ft is used to
detect any deep water level within 80 ft of the ground surface.
186. Piezometric readilngs from August 1985 through June 1988 indicate a
shallow permanent perched water table with water level about 5 ft below ground
surface, Figure 58. The piezometric head from this shallow water table
decreases below 40 ft; however, pore pressures are increasing 50 ft below
ground surface. Falling head tests in these piezometers indicated-8
permeability of about 10 cm/sec, while permeability of the shallow clay is-5
about 10 cm/sec. The piezometer at 50 ft may not yet have reached
equilibrium. The dry piezometer at 80 ft indicates no deep water table within
80 ft of the ground surface.
Elevation Surveys
187. Elevation surveys were periodically performed on at least 114
locations on the mat surface, Figure 53a. These locations are fixed with
brass boltheads set in the concrete floor during mat construction in August
154
5" DIAfl SCREW-ON PIPE 3/8"0. PVC PIPE CAPCAP (W/I/80 VENT HOLE) W/ 1/8" VENT HOLE
5" DIAM PVC PROTECTIVE
4' MIN ~ PIPE THREADED ON TOP
3/8"1 01MM PIPEGROUT TORIEGROUNDS URF AC E
9~NTN!TEBENTONITE
CONCRETESANDSESN
1. 5" Y. 24'ZN
POROUS PLASTIC
TIP
*R!SER SH,-,U!L[ EXTEND I" TO~ 2" ABOVE PROTECTIVE
,2r'E WJHEN PR31wTi 'E P'IPE CR1P IS REr10- t,
Figure 57. Piezometer installation detail
155
JA 'Hld3G01- Oz- 0c- 0*- 09- 09Z
11 I L
C -0
mr~m
'.44
xn I
00
Figue 58 Pizomeric ead
156n
1984. Additional elevations were determined along line 26 at 12.5-ft
increments from Column A to Column N.
188. Temporary benchmarks were established at six different locations
by the contractor during construction. These temporary benchmarks include
rims of two concrete manholes for sewer lines, a concrete foundation for a
pump station adjacent to a sludge pond, concrete docks of buildings 345 and
315, and a railroad rail. The initial elevation survey made 6 September 1984,
31 October 1984 survey and the 28 Jan 1985 survey used these temporary
benchmarks. A permanent deep benchmark with tip elevation 80 ft below ground
surface was installed about 100 ft NW of the NW corner of building 333 in June
1985 with details shown in Figure 59. Tabulated elevations from all surveys
are provided in Appendix G.
189. Figure 60 illustrates three dimensional views of the displacement
of this mat from results of the surveys relative to 6 September 1984.
Settlement through May 1987 is approximately 0.1 to 0.3 inch with most
settlement near the center. A slight heave was observed in the south end
along line 26. One distinctive feature observed from these plots is the
unusual V-shaped settlement approximately 1/3 of the way from the south end of
the mat. This settlement, which exceeded 1 inch after August 1985, coincides
with an old drainage ditch that passed through the construction site, Figure
56. Softening of the subsoil below this drainage ditch from long-term
wetting, possible reduction of compaction efficiency above this soft soil,
deeper fill depth at this location, and the expansion joint at this location
may have contributed to this settlement. This settlement has not hindered
operations. A second feature is the appearance of the dish-shaped pattern
characteristic of flexible plates on a semi-infinite elastic foundation. The
mat appears stiffer in the east-west or short direction consistent with
results of plate on elastic foundation analysis in the short direction in Part
III. The mat appeared to have reduced edge-down distortion in the south end
after August 1985 to June 1986. This correlates well with the removal of
heavy equipment temporarily stored on the south end prior to installation.
190. Two-dimensional views of the deformation patterns in the long
(line G) and short (line 26) directions of the mat are shown in Figure 61.
The length is taken from line 1 to line 30 (0 to 678 ft) and the width is
157
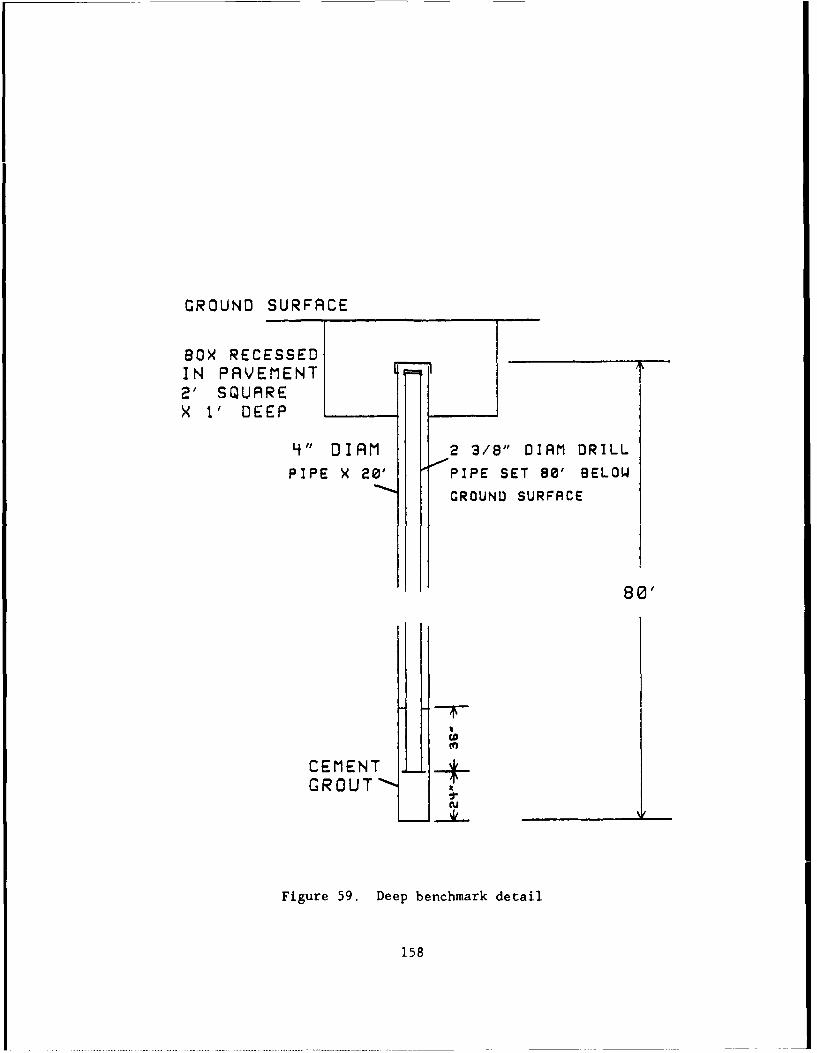
GROUND SURFACE
BOX RECESSED
IN PAVEMENT2' SQUAREX ' DEEP
4" DIAM 2 3/8" DIAM DRILL
PIPE X 20' PIPE SET 80' BELOW
GROUND SURFACE
80'
CEMENTGROUT -
Figure 59. Deep benchmark detail
158
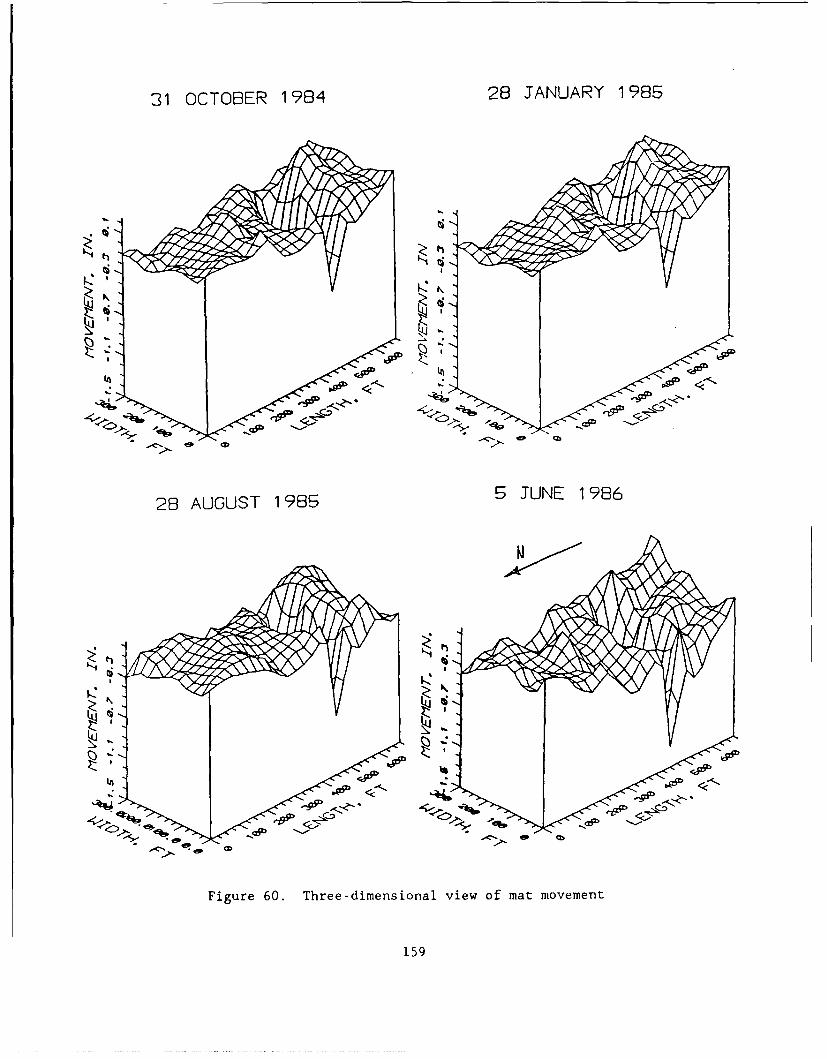
31 OCTOBER 1984 28 JANUARY 1985
I - a,.
28 AUGUST 1985 5 JUNE 1986
Figure 60. Three-dimensional view of mat movement
159
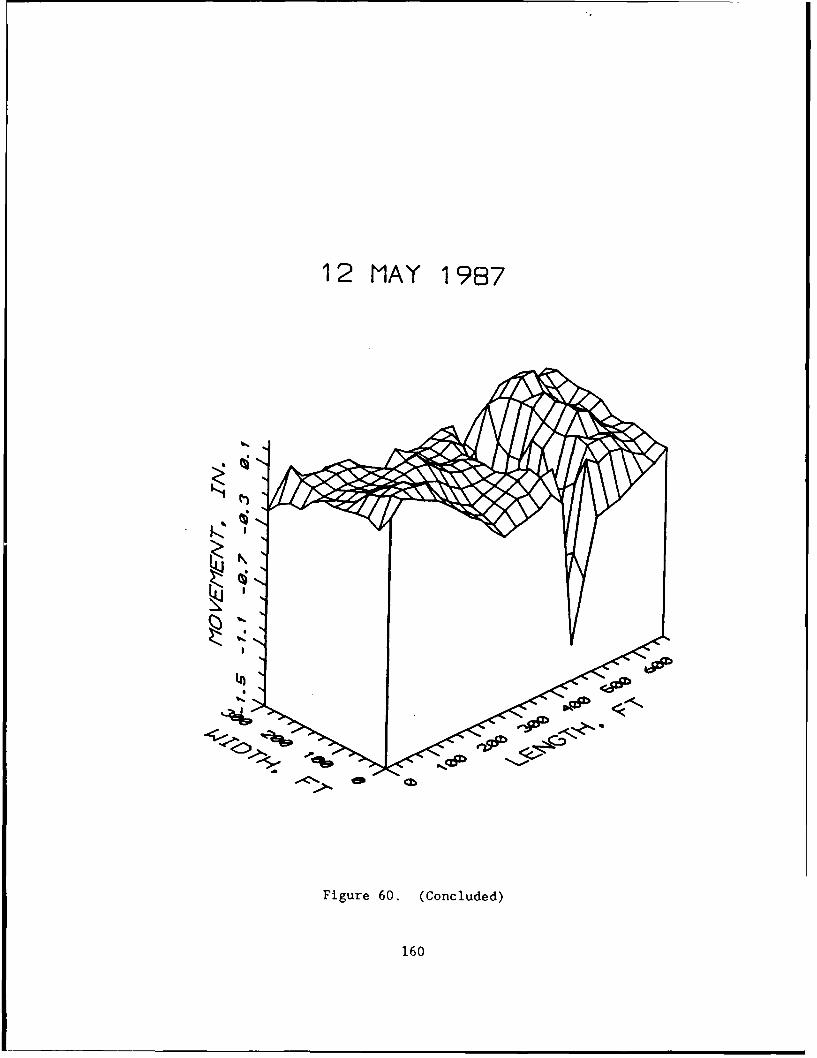
12 MAY 1987
Figure 60. (Concluded)
160
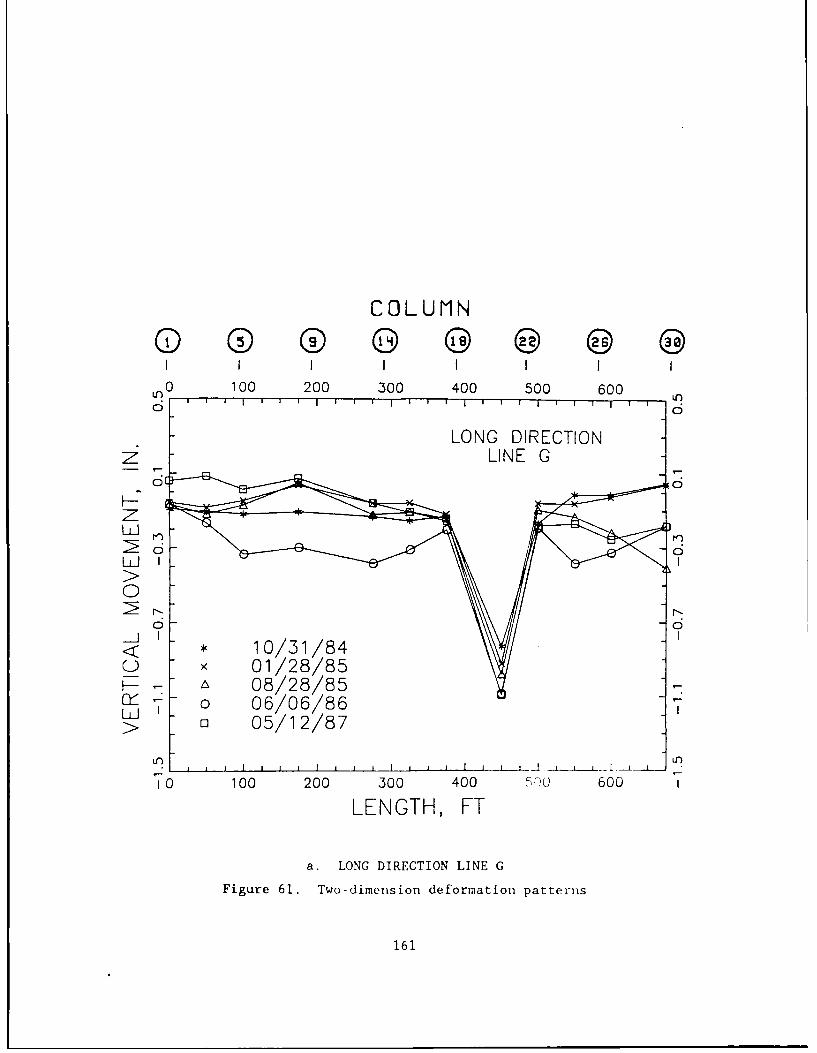
COLUMN(D G) G @ 9@
I I I I I I II
n0 100 200 300 400 500 600
0 If
LONG DIRECTIONz LINE G
L.J sWII0
__j< -• 10/31/84_ x 01/28/85
I- " 08/28/85,-ry o 06/06/86 -> " 05/12/87t
0 100 200 300 400 5oo 600
LENGTH, FT
a. LONG DIRECTION LINE G
Figure 61. Two-dimension deformation patterns
161
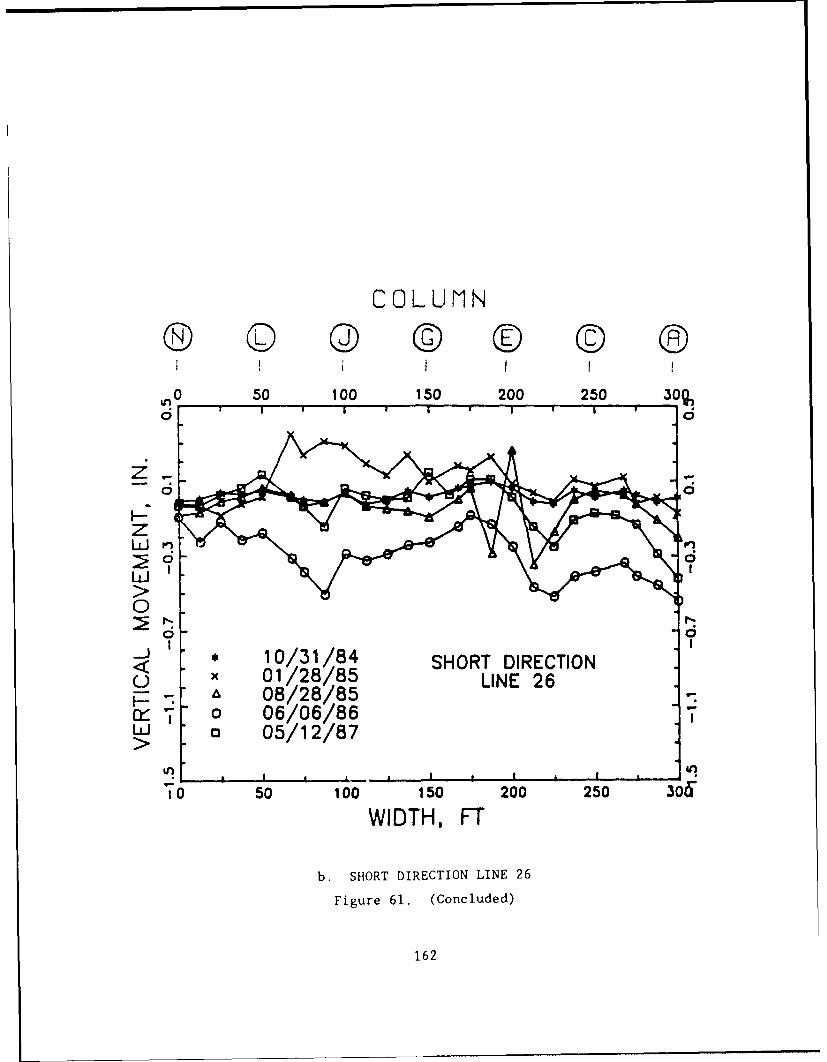
COLUMN
0 50 100 150 200 250 30%
LU'
0
I II i "
,i * 10/31/84 SHORT DIRECTION.08/28/.85 LINE 26:. . 08/28/85 -
o 06/06/86U> 05/12/87
In In
0 50 100 150 200 250 306"
WIDTH, FT
b. SHORT DIRECTION LINE 26
Figure 61. (Concluded)
162
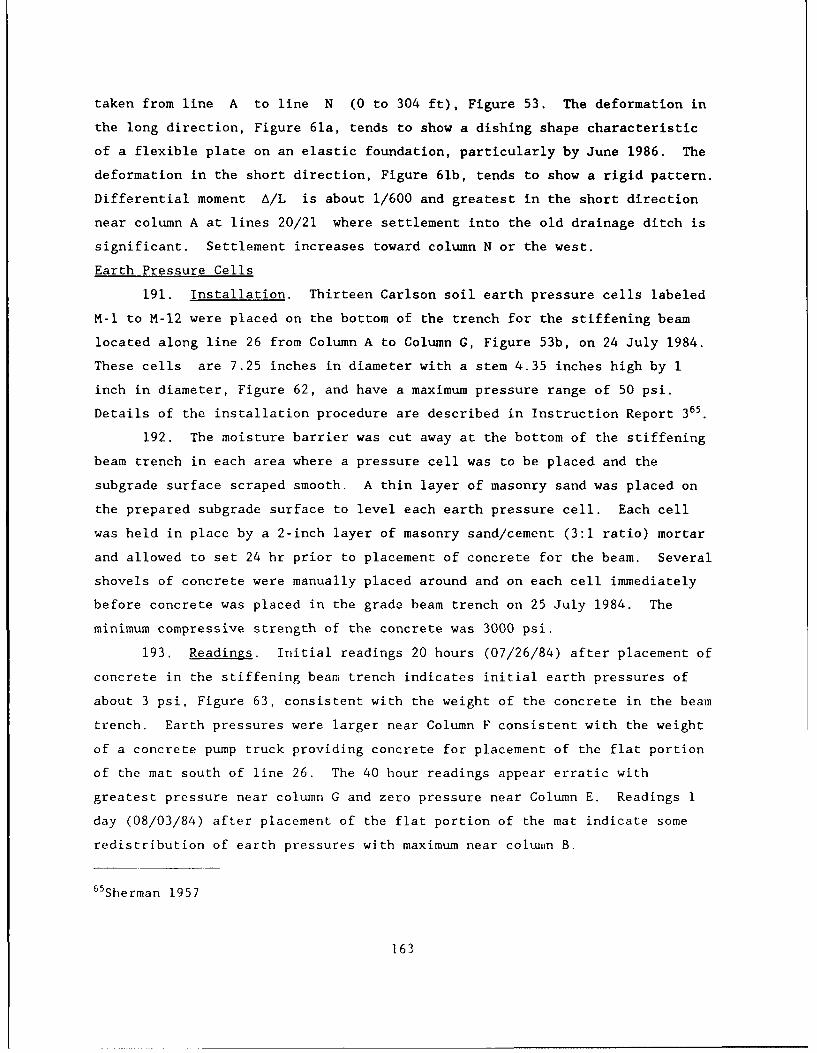
taken from line A to line N (0 to 304 ft), Figure 53. The deformation in
the long direction, Figure 61a, tends to show a dishing shape characteristic
of a flexible plate on an elastic foundation, particularly by June 1986. The
deformation in the short direction, Figure 61b, tends to show a rigid pattern.
Differential moment A/L is about 1/600 and greatest in the short direction
near column A at lines 20/21 where settlement into the old drainage ditch is
significant. Settlement increases toward column N or the west.
Earth Pressure Cells
191. Installation. Thirteen Carlson soil earth pressure cells labeled
M-1 to M-12 were placed on the bottom of the trench for the stiffening beam
located along line 26 from Column A to Column G, Figure 53b, on 24 July 1984.
These cells are 7.25 inches in diameter with a stem 4.35 inches high by 1
inch in diameter, Figure 62, and have a maximum pressure range of 50 psi.
Details of the installation procedure are described in Instruction Report 365
192. The moisture barrier was cut away at the bottom of the stiffening
beam trench in each area where a pressure cell was to be placed and the
subgrade surface scraped smooth. A thin layer of masonry sand was placed on
the prepared subgrade surface to level each earth pressure cell. Each cell
was held in place by a 2-inch layer of masonry sand/cement (3:1 ratio) mortar
and allowed to set 24 hr prior to placement of concrete for the beam. Several
shovels of concrete were manually placed around and on each cell immediately
before concrete was placed in the grade beam trench on 25 July 1984. The
minimum compressive strength of the concrete was 3000 psi.
193. Readings. Initial readings 20 hours (07/26/84) after placement of
concrete in the stiffening beam trench indicates initial earth pressures of
about 3 psi, Figure 63, consistent with the weight of the concrete in the beam
trench. Earth pressures were larger near Column F consistent with the weight
of a concrete pump truck providing concrete for placement of the flat portion
of the mat south of line 26. The 40 hour readings appear erratic with
greatest pressure near column G and zero pressure near Column E. Readings I
day (08/03/84) after placement of the flat portion of the mat indicate some
redistribution of earth pressures with maximum near colunn B.
65Sherman 1957
163
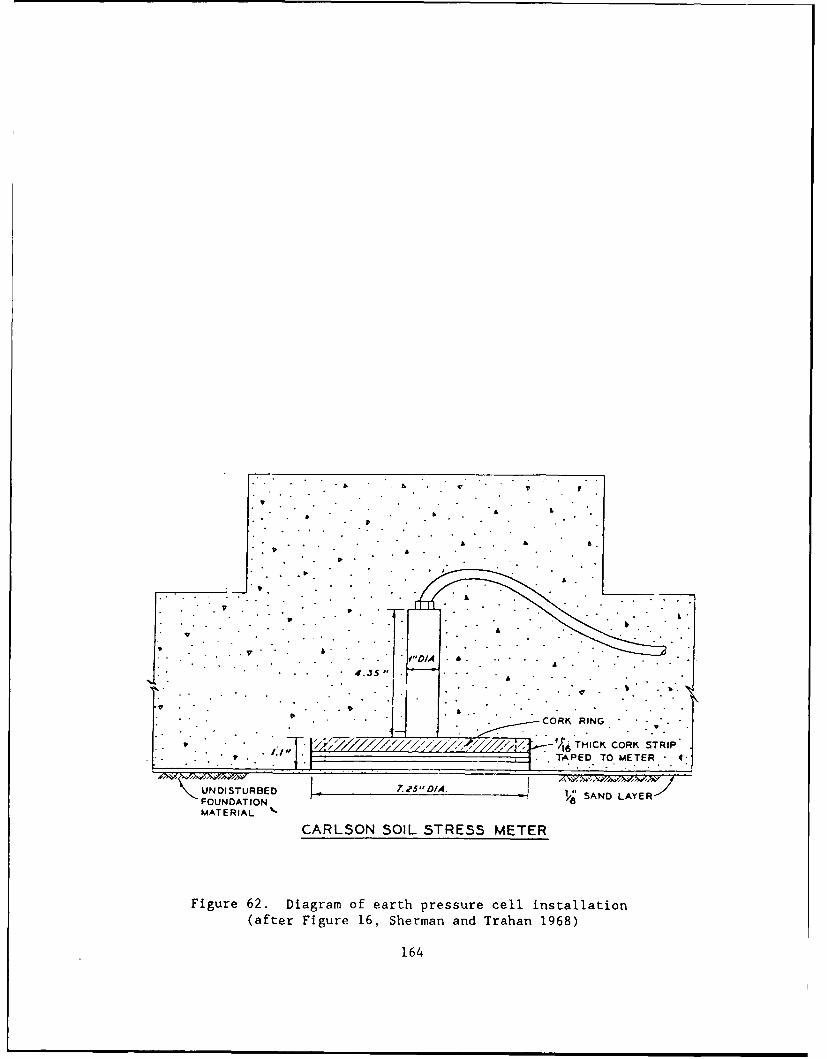
TAE TO METE 41
A. W.>1,Z
' NDSTU BE .17 " I A D L W
FOUNDATIO
CALO SOILE TOES METER
Figure 62. Diagram of earth pressure cell installation(after Figure 16, Sherman and Trahart 1968)
164

N N 4U') * 07/26/84 20 HRS AFTER BEAM U)0... x 07/26/84 40 HRS AFTER BEAM CL.
.~ + 08/03/84 1 DAY AFTER MAT C.
rCrV) Lii
G F EDCBA
C) *08/17/84 15 DAYS AFTER MAT Cr)LL x 09/07/84 36 DAYS AFTER MAT 0
S+ 11/08/84 2 MONTHS AFTER MATW
Cr) U')Li Li
G F E D C A
_N N _
U5 02/12/85 ALL ROOF DL )CL x 06/05/85 ROOF AND CRANE DL 0.
+o-i 08/23/85 ALL DL o
a:D
CL01..
G F E D C BA
Figure 63. Earth pressures during construction
165

194. Readings taken 15 days (08/17/84) to 2 months (11/08/84) after mat
placement, Figure 63, indicate earth pressures had decreased to zero or near
zero between Columns F and A. Concrete shrinkage during cure appears to be
transferring weight of the overlying beam and mat from the soil beneath the
beam to adjacent soil beneath the flat portion of the mat to let the beam
"hang" in the trench. This may increase the probability of cracking in the
mat as loads are applied to the stiffening beams during construction until the
stiffening beams are firmly seated on the underlying soil.
195. Permanent loads such as the roof dead load, roof live load, crane
dead load, and wall loads for building 333 lead to axial loads of
approximately 32, 64, and 128 kips for corners, edges, and interior columns
(see paragraph 216). These loads are placed on widened beam sections of side
10.5 ft beneath each column, Figure 53b: squares for interior columns and
triangles for perimeter or corner columns. The pressure applied on these
widened sections assuming that all of the column load is concentrated only on
these sections is about 8 psi. This pressure drops to about 4 psi assuming
loads are actually distributed to a soil area twice the area of the widened
beams. Maximum pressure on the foundation soil is designed to be less than 2
ksf or 14 psi.
196. Permanent dead loads from construction of the superstructure were
in place by 23 August 1985. Earth pressures in 1985, Figure 63, vary from 4
to 6 psi near columns G and D. Earth pressures near the perimeter column A
appear to be increasing substantially to at least 16 psi by 23 August 1985.
Pressures between the column loads such as FE and CB are negligible.
197. Installation of equipment within the building continued from
August 1985 through 1987. Earth pressures increased to about 9 psi at column
G, remained stable at about 4 psi near column D and had increased
substantially near column A exceeding 40 psi by 23 February 1987, Figure 64.
Earth pressures at column G during operations of 25 May 1988, Figure 65,
decreased to about 8 psi.
198. The extremely large perimeter earth pressure is consistent with
the behavior in the short direction of a rigid mat on a semi-infinite elastic
foundation cohesive (or cohesiunless) soil and attributed to shear43 . The
relative displacement diagrams in Figures 60 and 61 tend to show rigidity in
166
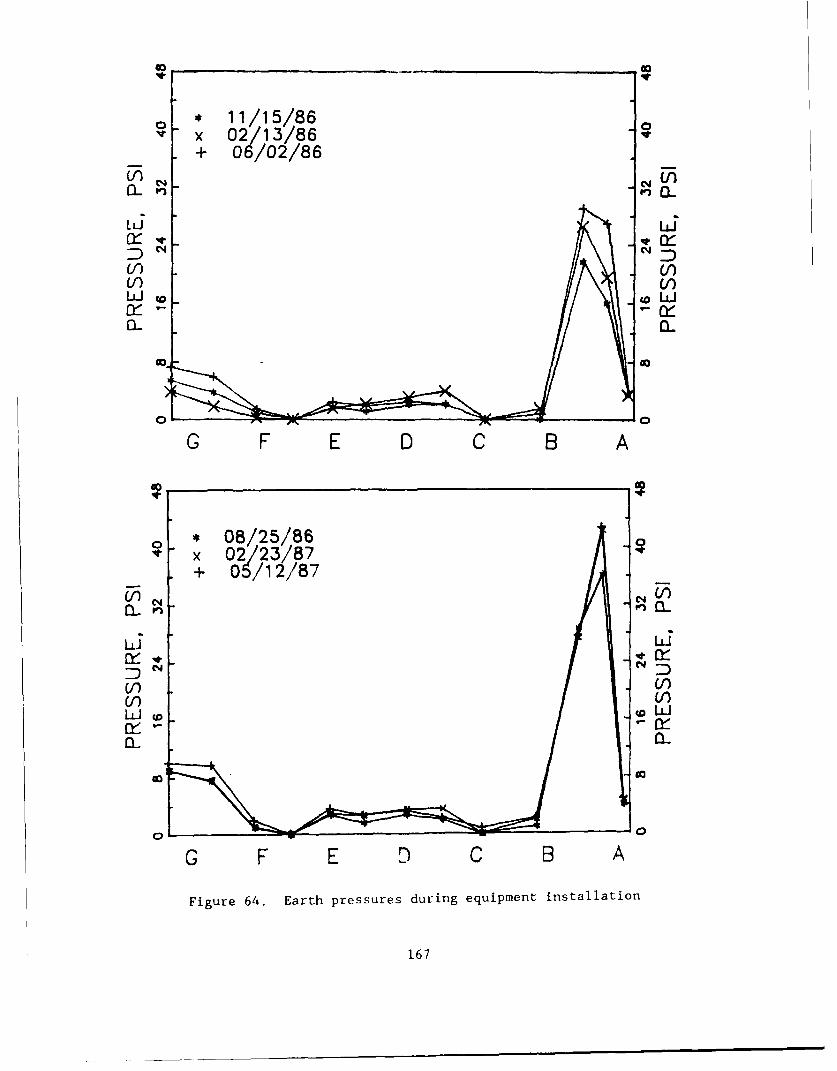
* 11/15/86x 02/13/86+ 06/02/86
cn ~U)
Ld Li
DN ND
LI) Cl)
to 40
G F E D CB A
*08/25/86
+ 05/2/&
Cr
DN ND
CI) Cr)
of0
G F E D C B A
Figure 64. Earth pressures during equipment installation
167
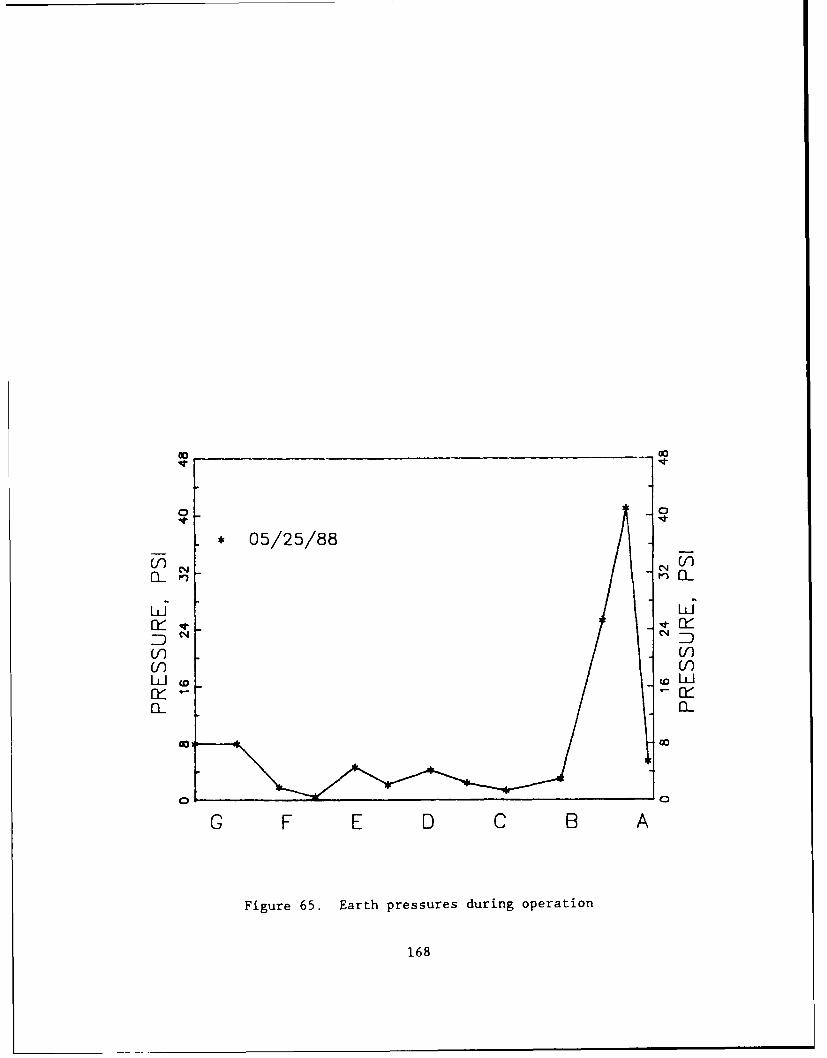
o 0
0-4
* 05/25/88
- w
Li LdCKoD N
ccoLJ W
0 0
G F E D C B A
Figure 65. Earth pressures during operation
168
the short direction parallel with line 26 of the instrumented beam and the
characteristic dish-shaped flexible behavior in the long direction. The
distribution of earth pressures on both sides of column D shows the effect of
beam stiffness on spreading the column loads to the underlying soil. Higher
earth pressures at column G than at D may indicate less distribution of
pressures from the footing to the soil beneath column G and possible fracture
in the stiffening beam of the mat near column G. Visual observations indicate
cracks in the mat betweem columns G and F. These observed earth pressures
along line 26 appear consistent with observed deformation of the mat.
Strain Gages
199. Installation. Ten SR-4 type temperature compensated strain gages
labeled SG-I to SG-10 were mounted with epoxy cement to 3-ft lengths of No. 4
reinforcement bars at the Waterways Experiment Station by the Instrumentatiom
Services Division. Strain gage assemblies SG-6 to SG-10 were tied to the
inside of the bottom left No. 11 reinforcement bars looking west from Column
A-26, Figure 53b. Strain gage assemblies SG-I to SG-5 were tied to one of the
two top No. 11 reinforcement bars. SG-I and SG-2 were tied beneath the top
left No. 11 bar (looking west from Column A-26) and SG-3, SG-4, and SG-5 were
placed on the right side of the top left No. 11 bar. The top No. 11 bars are
separated by 28 inches from the bottom reinforcement bars. Locations of these
strain gages are illustrated in Figure 53b.
200. Cables from both earth pressure cells and strain gages were
threaded through 2-inch diameter plastic electrical conduit placed on the
existing ground surface 20 inches above the bottom of the stiffening beam
adjacent to the stiffening beam on line 26. The electrical conduit and cables
at Column A-26 were conducted ouside the mat perimeter through a 6-inch
diameter opening made in the exterior stiffening beam. This opening is
located about 18 inches above the bottom of the beam and 5 ft left of the
center of Column A-26 viewing toward the west. The cable ends were coiled and
placed in two concrete street light ground boxes located adjacent to the mat
perimeter and level with the surface of the concrete ramp used by robot
operated cargo containers.
201. Readings. Twenty hours (07/26/84) after the concrete was placed
in the beam trench the initial readings of the five bottom gages indicated
169
about 90 microinches/inch of tension, Figure 66a. This tension is attributed
to natural drying shrinkage of concrete6. Forty hours (07/27/84) after
concrete placement the readings of the bottom gages indicated over 100
microinches/inch of compression beneath Column G. The stiffening beam near
column G appears to be curling down consistent with the increased earth
pressure observed near column G at this same time, Figure 63 (07/26/84). The
compression continues to increase in the bottom strain gage beneath column G
at 1 day (08/03/84) and 15 days (08/17/84) following placement of the concrete
for the mat, Figure 66a. All of the bottom strain gages indicate some
reduction in the initial tensile strains by 15 days after the mat concrete was
placed indicative of an edge-down (or center heave) behavior. The top strain
gages at this time are covered with concrete of the flat portion of the mat
and indicate about 100 microinches/inch of tensile strain again attributed to
natural drying shrinkage of concrete. Except for strains beneath and near
column G, strains appear fairly uniform. The mat may be heaving slightly on
line 26, which appears confirmed by the level survey along line 26 conducted
31 October 1984, Figure 60. This apparent heave may be attributed to arching
from settlement exceeding 1 inch observed near lines 20/21 and settlement of
about 0.2 inch observed at the perimeter on line 30, Figure 60. Heavy
equipment stored in the south end of the building prior to installation may
have contributed to settlement near the perimeter, Figure 60.
202. Continued construction of the superstructure with increased column
lo-is cause substantial increases in compressive strains in the bottom strain
gages beneath and near column G, Figure 66b. Some tensile strain still
remains in the bottom gage beneath column G and near column A. The top strain
gages indicate about -100 microinches/inch of tensile strain except beneath
column G where compression is building up 2 months (11/08/84) after placement
of the mat. By 12 February 1985, Figure 66b, compressive strain in the bottom
gage beneath column G had peaked at about 800 microinches/inch and dropped
back to about 400 microinches/inch by 5 June 1985. Tensile strains seem to be
increasing in the top strain gages to about -150 microinches/inch by 5 June
1985, except beneath column G where compression had increased to about 250
66Ytterberg 1987
170
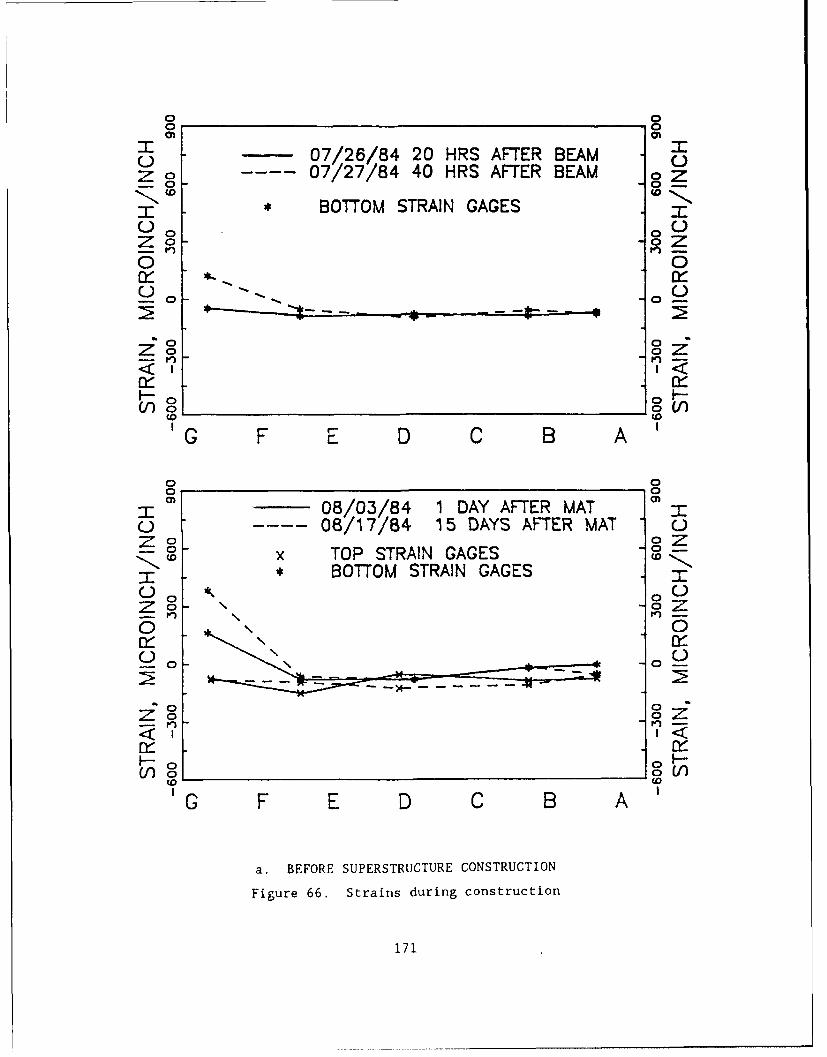
o oo o
00
"o- 07/26/84 20 HRS AFTER BEAM ," 07/27/84 40 HRS AFTER BEAM Z
• BOTTOM STRAIN GAGES
0 0( o " o ('
oV) 0C.)
1 G F E D C B A I
o o0 0"T" 0 08/03/84 1 DAY AFTER MAT o 1(._)08/17/84 15 DAYS AFTER MAT
Zo oZ
,, x TOP STRAIN GAGES:£ * BOTTrOM STRAIN GAGEST
-- j
H00
Z z
(o o~f'C F E D C B A '
o 0
o 0
~0
C-)
a. BEFORE SUPERSTRUCTURE CONSTRUCTION
Figure 66. Strains during construction
171
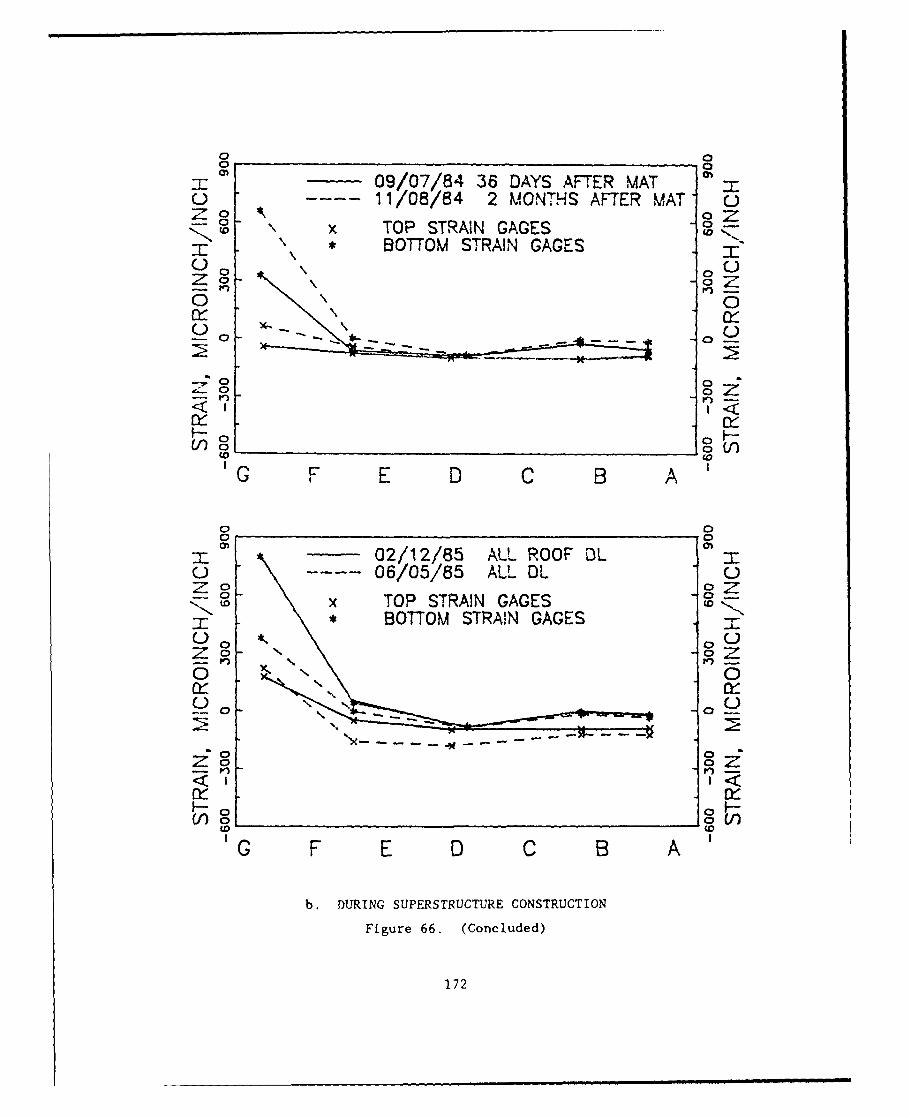
o Cn - 09/07/84 36 DAYS AFTER MAT
U - - - -11/08/84 2 MONTHS AFTER MAT'x TOP STRAIN GAGES
* BOTTOM STRAIN GAGES
o 0
co V)
<I 14
H05
u 4
U 06/05/85 ALL DL U
00
T0
~0 CT85A oZ
H0
0 0
G F ED C B
b. DURING SUPERSTRUCTURE CONSTRUCTION
Figure 66. (Concluded)
172

microinches/inch in the top strain gage. Continued drying shrinkage may have
contributed to the greater tensile strains in the top gages. These strains
indicate a concentration of strains (and stress) in the footing of column G.
The level survey conducted 28 January 1985 indicate an increased center hump
that diminished by 28 August 1985, Figure 60. Upward curling near edges or
the perimeter attributed to moisture loss from the upper surface of the mat
and drying shrinkage does not appear significant. Earth pressure cells
indicate increased soil pressures beneath the columns, Figure 63, during
superstructure construction.
203. The top strain gages are generally subject to more tensile strain
than the bottom gages during equipment installation from 23 August 1985 to 2
June 1986, Figure 67. The plastic vapor barrier beneath the stiffening beams
appears to have restricted evaporation of moisture from near the bottom
of the stiffening beams, while evaporation and drying shrinkage continued from
the mat surface. The level surveys of 28 August 1985 and 28 January 1986
confirm a humped distortion pattern along line 26, Figure 60. Compressive
strains were increasing in the bottom strain gage beneath column G from 23
August 1985 through 13 February 1986, then dropped substantially indicating a
large tensile strain of about 300 microinches/inch by 2 June 1986.
204. By 25 August 1986 tensile strain in the bottom strain gage near
column G had increased in tension much further to -3000 microinches/inch
suggesting a possible fracture in the bottom of the beam beneath or near
column G, Figure 67. The compressive strain in the bottom gage near column F
dropped nearly to zero by 25 August 1986. From 25 August 1986 through 23
February 1987 the strains in the two bottom gages near columns G and F appear
to have rebounded and become positive; strains in the bottom gages indicate
increasing tension near columns G, F, and A by 25 May 1988. Tensile strains
in the top gages appear fairly steady from 23 February 1987 through 25 May
1988. Additional drying shrinkage appears insignificant since August 1986.
The level survey conducted 6 June 1986, Figure 61b, shows a reversal of
curvature near column C compared to the earlier level survey of 28 August
1985. Column G appears to have risen some from 6 June 1986 to 12 Moy 1987
consistent with increased compression in the bottom gages near G and F from
25 August 1986 to 23 February 1987, Figure 67.
173
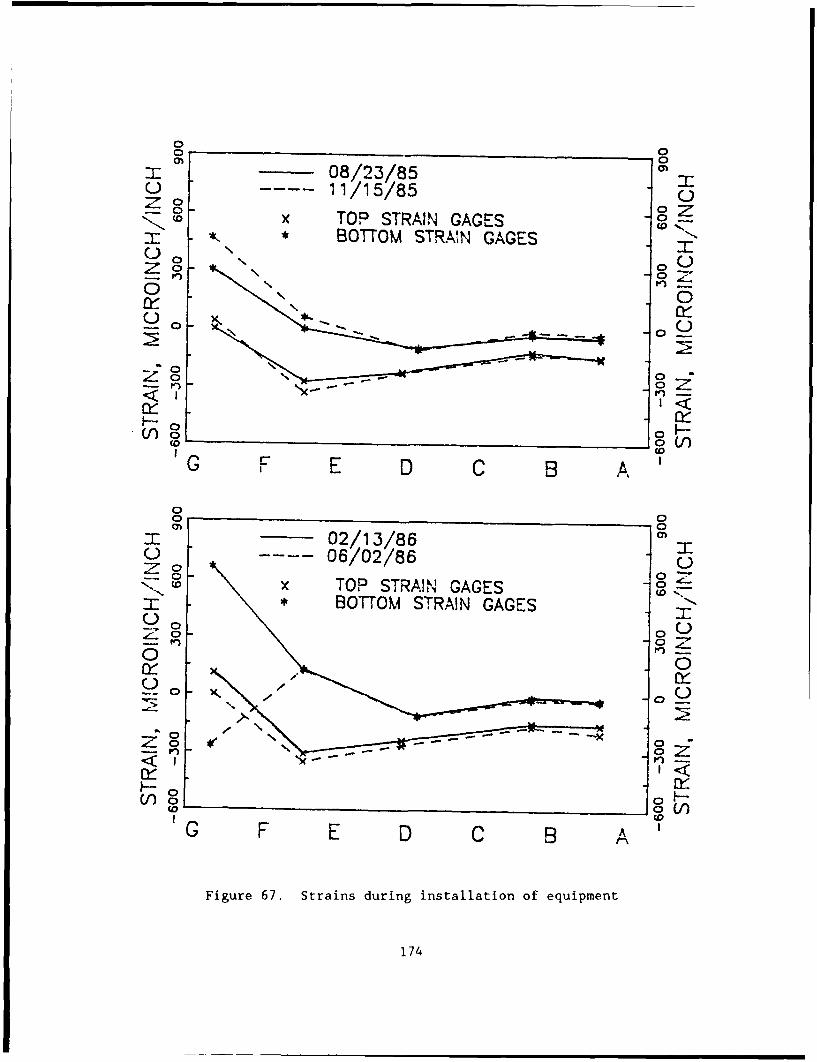
0o 0
08/23/85
20 tox TOP STRAIN GAGES 02* BOTTOM STRAIN GAGES
00Z0 -0
00-Zo 0Of
0o C:)
F E D C B A'
0 00 0
I 02/13/860-- 06/02/860w x ~TOP STRAIN GAGESw
* BOTTOM STRAIN GAGES
020 0
0:
000V0 0 coZ
174
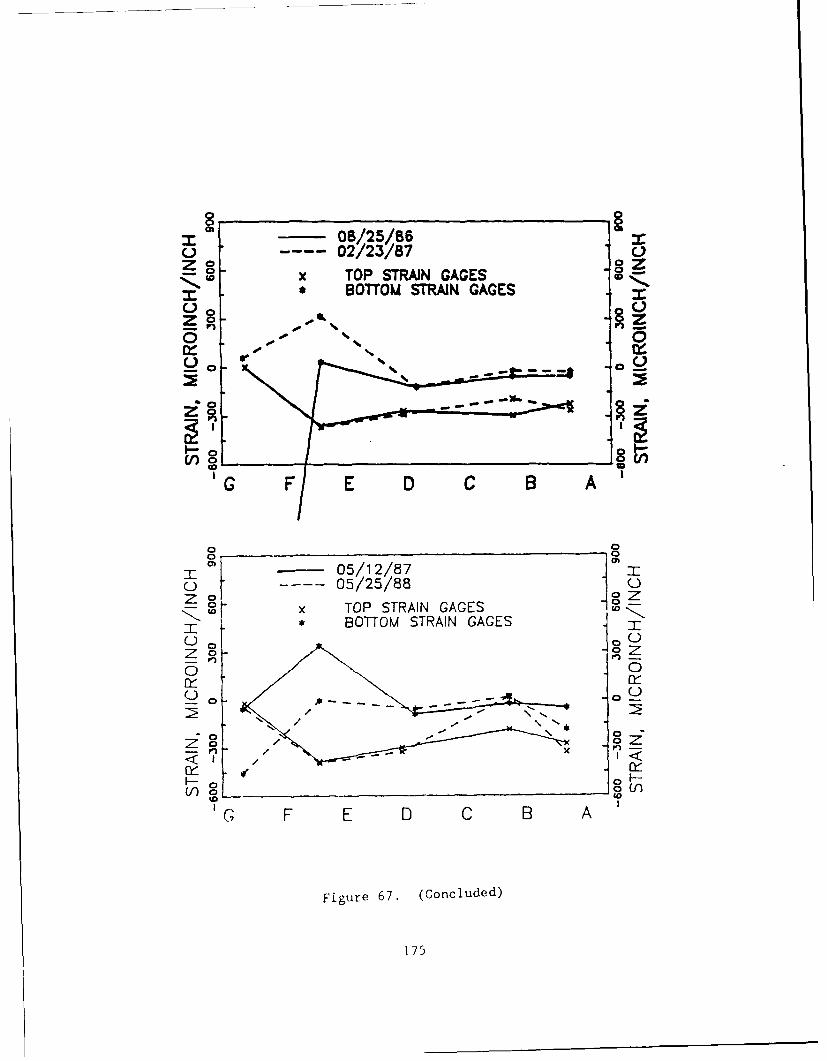
0 08/25/86--- 02/23/87
x TOP STRAIN GAGES* BOTTOM STRAIN GAGES
0 0
0 0
CFj E D C B A'
_ 05/12/87o-- 05/25/88
x TOP STRAIN GAGES* BOTTOM STRAIN GAGES
0 0
0F
Cfo S .. o
>G F E D C B A &D
Figure 67. (Concluded)
175
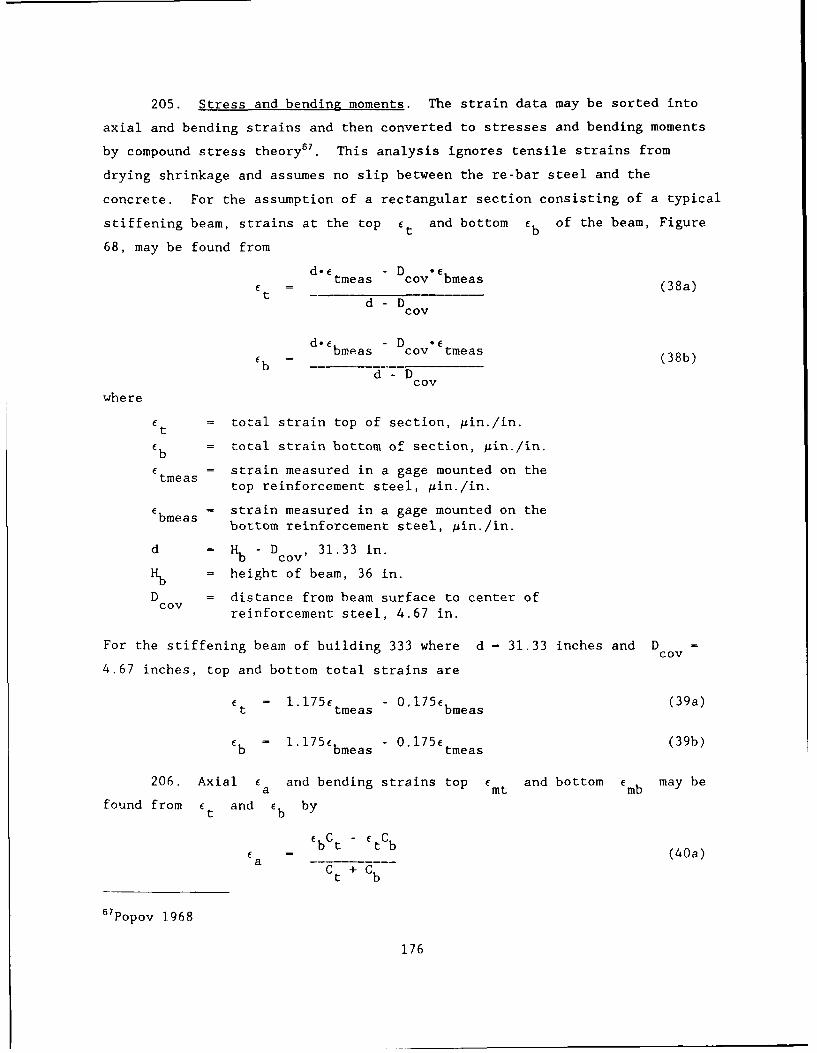
205. Stress and bending moments. The strain data may be sorted into
axial and bending strains and then converted to stresses and bending moments
by compound stress theory 7 . This analysis ignores tensile strains from
drying shrinkage and assumes no slip between the re-bar steel and the
concrete. For the assumption of a rectangular section consisting of a typical
stiffening beam, strains at the top et and bottom Eb of the beam, Figure
68, may be found fromd.e D *C tmeas cov Cbmeas
(38a)t d D
cov
dC bmeas Dcov 4tmeas (38b)
b d -Dcov
where
ft = total strain top of section, Ain./in.
Eb = total strain bottom of section, Ain./in.
4 tmeas = strain measured in a gage mounted on thetop reinforcement steel, Ain./in.
f bmeas = strain measured in a gage mounted on the
bottom reinforcement steel, pin./in.
d = Hb - Dcov, 31.33 in.
Hb = height of beam, 36 in.
D = distance from beam surface to center ofcoy reinforcement steel, 4.67 in.
For the stiffening beam of building 333 where d = 31.33 inches and D c =
4.67 inches, top and bottom total strains are
ft = l.175c tmeas - 0175cbmeas (39a)
fb = l.175cbmeas - 0,175ctmeas (39b)
206. Axial ca and bending strains top cmt and bottom cmb may be
found from ct and cb by
CbCt - Ct~bb t t b(40a)
a Ct + Cb
67popov 1968
176
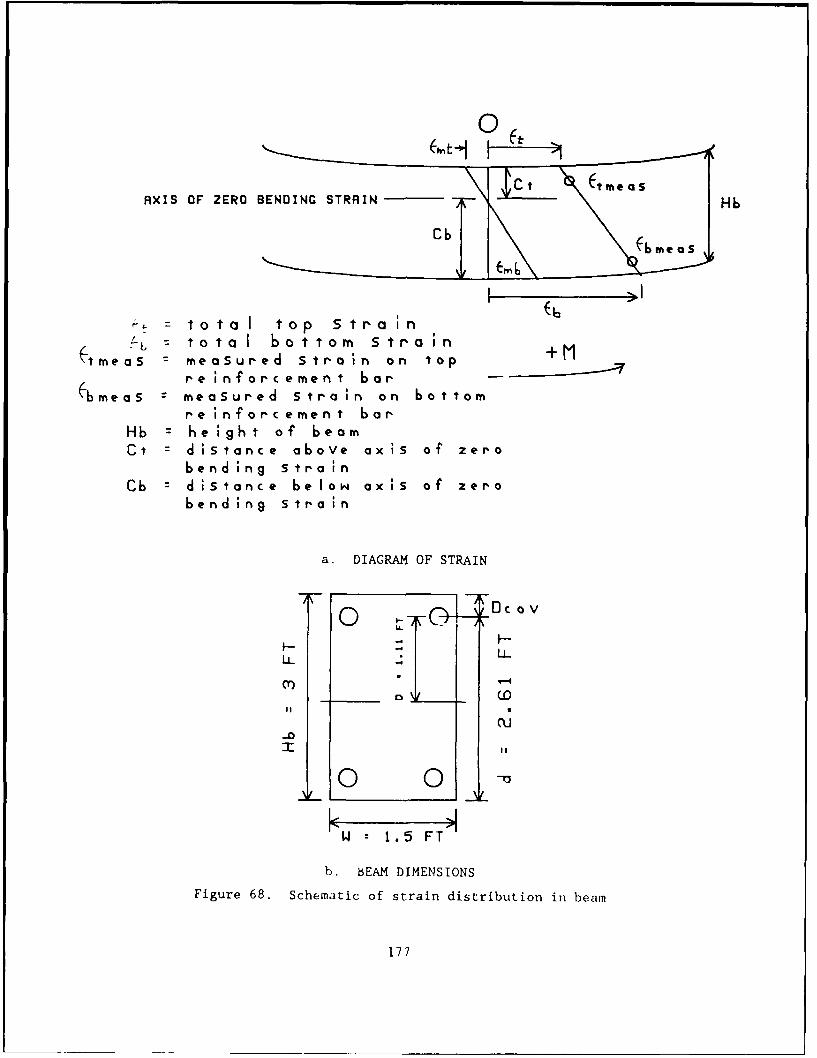
0
AXIS OF ZERO BENDING STRAIN Hb
Cb EbmeaS
to ta I top strainto ta l bot tom s tra i n
(tmeaS 2 measured stra in on topre ;nforcement bar
bmeaS measured strain on bottomre ; nfor emen t bar
Hb = height of beamCt = distance above axis of zero
bending strainCb = d ;stance be low axis of zero
bend;ng Strain
a. DIAGRAM OF STRAIN
oDc ov
. AM DI-- LL
LL
-0~2:
10 0 -
b. BEAM DIMENSIONS
Figure 68. Schematic of strain distribution in beam
177
Ct
fmt - (Ct Cb) Ct+C (40b)Ct + Cb
f mb = (Cb - Ct b (40c)Ct + Cb
t b
where
C a axial strain, pin./in.
fmt - top bending strain, pin./in.
E mb - bottom bending strain, pin./in.
Ct = distance from top to axis of zero bending strain, in.
Cb - distance from bottom to axis of zero bending strain, in.
The neutral axis is the axis of zero bending strain and has been taken as the
distance kd below the top of the mat where kd is defined in Table 10. The
actual depth of the neutral axis in the T-section will probably be in the
upper half of the beam below the bottom of the slab or the T-section flange.
207. The axis of zero bending in the rectangular section of interest in
this analysis is assumed for simplicity to be in the centroid. Then, Ct -Cb
and
a b (41a)a2
- Eb (41b)mt2
mb - b t (41c)mb 2
208. Axial stress aa may be evaluated from
a Eeff fa (42)
where
aa - axial stress, ksf
Eeff - effective modulus of elasticity of the section, ksf
178

The effective modulus of the rectangle section may be found from
ElI + E( I - I)
Eef f - s cc S (43a)I
c
%3WHb 3 (43b)
c 12
I 41 + 4Asd2 (43c)5 so sl
where
E s modulus of elasticity of steel, 4,320,000 ksfs
E c modulus of elaticity of concrete, 432,000 ksf
I steel moment of iertia, .054 ft4
I - concrete moment of iertia, 3.375 ft4
cW - width of beam, 1.5 ft
Itb - height of beam, 3 ft4 4
I s (/4)r , ftsor = radius of reinforcement steel, .059 ft
A = cross-section area of steel bar, .0108 ft2s
d I distance from center of beam to center of reinforcement steel,1.1108 ft
Substituting the above values into Equation 43a leads to Eef f - 489,600 ksf.
209. Figure 69a shows the distribution of axial stress on line 26
including drying shrinkage from A to G calculated using Equation 42 from the
strain measurements for 12 May 1987 and 25 May 1988 assuming Eeff - 489,600
ksf. Figure 69b shows the axial stress distribution with the initial tensile
strain of at least -90 pin./in. subtracted from the measured strains. The
stiffening beam is still in tension except near B where level measurements
indicate a slight hump, Figure 60. The initial tensile strains may be
associated with the drying shrinkage.
210. The bending moment M may be evaluated from
M - -beff c (44)Cb
where
179
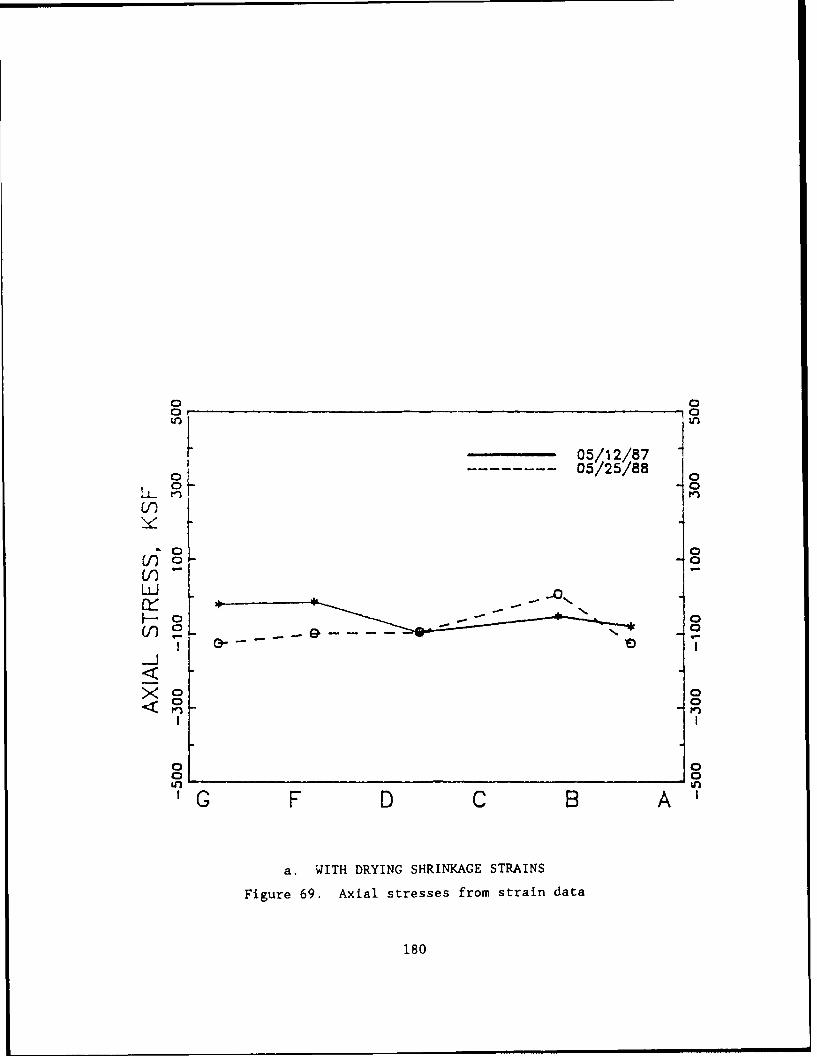
o 0010
05/12/87 i
0 ------ 05/25/88 0
a 0
LUI
180
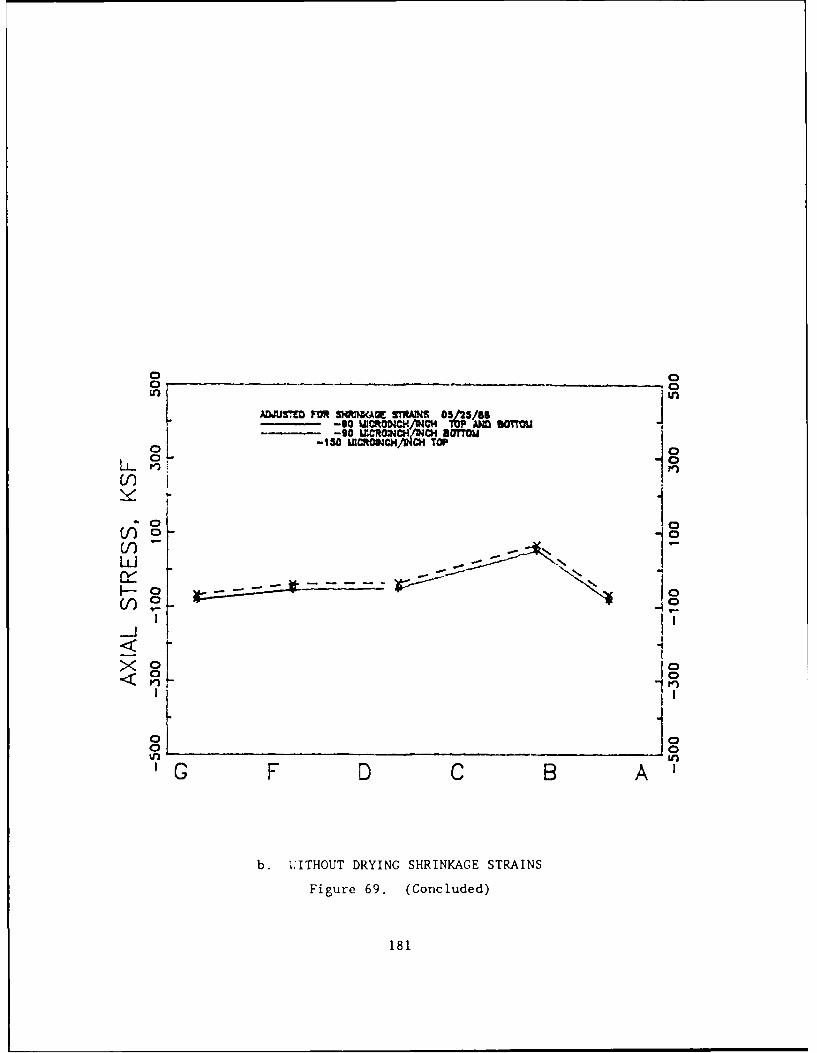
ADJUSTED MO WMIAGE SRAJS 0523- -90 ___NH/W U
01f)o
co4 0
GC F D C B A'
b. 'VITHOUT DRYING SHRINKAGE STRAINS
Figure 69. (Concluded)
181
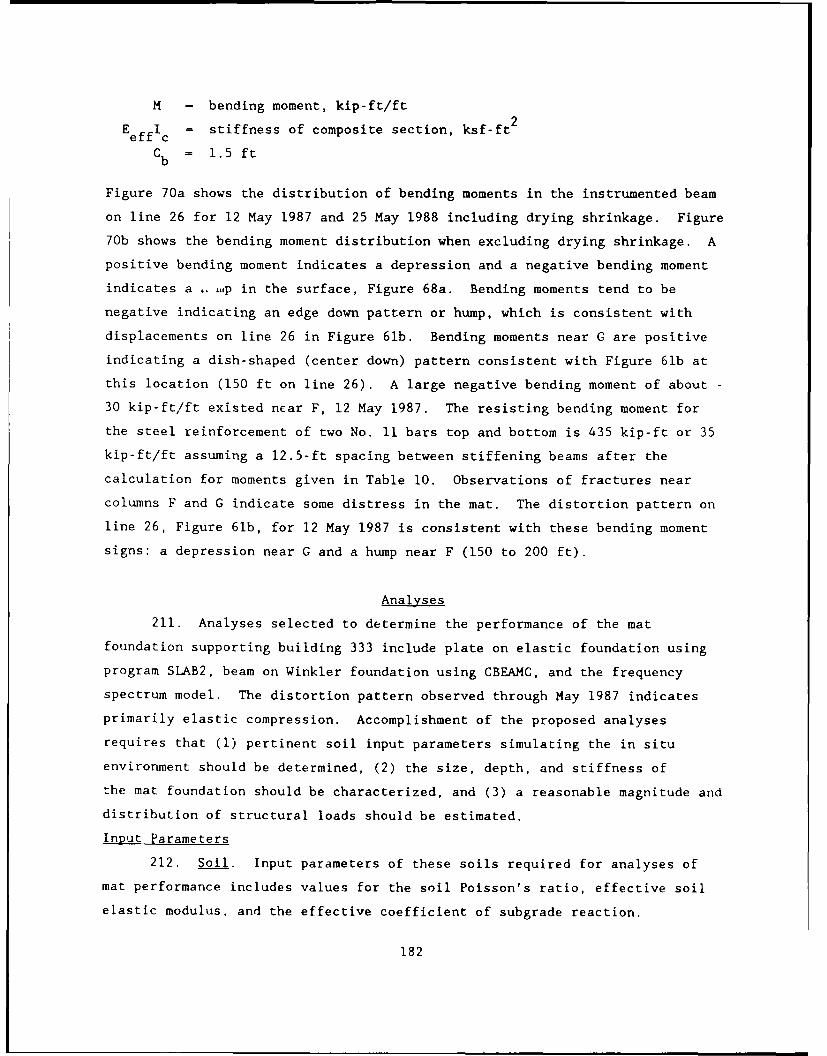
M - bending moment, kip-ft/ft
Eefflc = stiffness of composite section, ksf-ft2
Cb = 1.5 ft
Figure 70a shows the distribution of bending moments in the instrumented beam
on line 26 for 12 May 1987 and 25 May 1988 including drying shrinkage. Figure
70b shows the bending moment distribution when excluding drying shrinkage. A
positive bending moment indicates a depression and a negative bending moment
indicates a .....p in the surface, Figure 68a. Bending moments tend to be
negative indicating an edge down pattern or hump, which is consistent with
displacements on line 26 in Figure 61b. Bending moments near G are positive
indicating a dish-shaped (center down) pattern consistent with Figure 61b at
this location (150 ft on line 26). A large negative bending moment of about -
30 kip-ft/ft existed near F, 12 May 1987. The resisting bending moment for
the steel reinforcement of two No. 11 bars top and bottom is 435 kip-ft or 35
kip-ft/ft assuming a 12.5-ft spacing between stiffening beams after the
calculation for moments given in Table 10. Observations of fractures near
columns F and G indicate some distress in the mat. The distortion pattern on
line 26, Figure 61b, for 12 May 1987 is consistent with these bending moment
signs: a depression near G and a hump near F (150 to 200 ft).
Analyses
211. Analyses selected to determine the performance of the mat
foundation supporting building 333 include plate on elastic foundation using
program SLAB2, beam on Winkler foundation using CBEAMC, and the frequency
spectrum model. The distortion pattern observed through May 1987 indicates
primarily elastic compression. Accomplishment of the proposed analyses
requires that (1) pertinent soil input parameters simulating the in situ
environment should be determined, (2) the size, depth, and stiffness of
the mat foundation should be characterized, and (3) a reasonable magnitude and
distribution of structural loads should be estimated.
Input Parameters
212. Soil. Input parameters of these soils required for analyses of
mat performance includes values for the soil Poisson's ratio, effective soil
elastic modulus, and the effective coefficient of subgrade reaction.
182
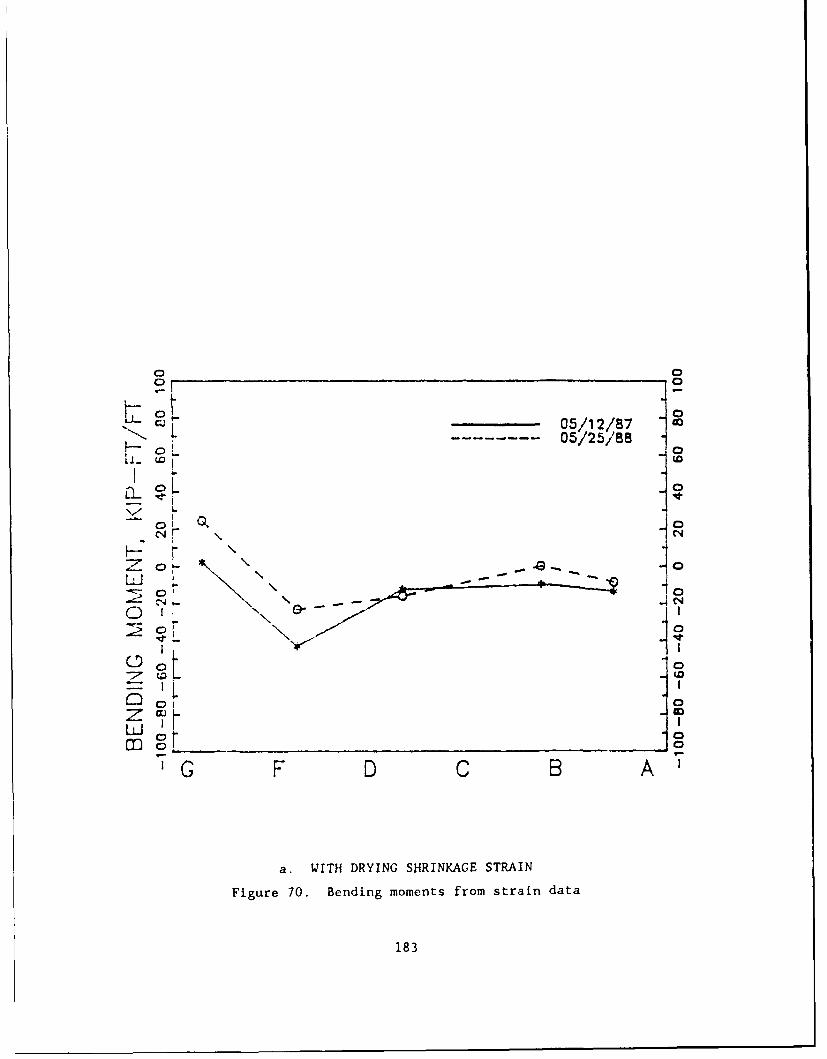
05/12/87-- - 05/25/88
L o
c'J \ \ "" 0
0 0
o , i°
42Ld
'GF D C 8 A T
a. WITH DRYING SHRINKAGE STRAIN
Figure 70. Bending moments from strain data
183
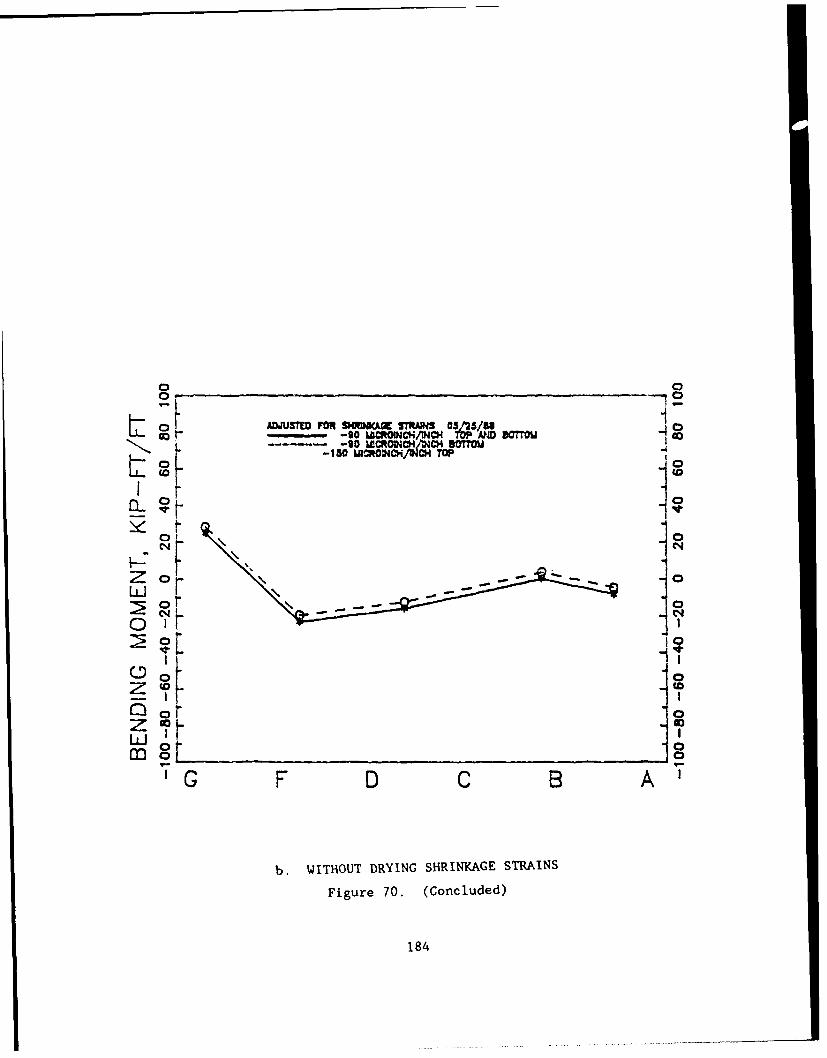
ADJ1JST FOR SHRNCAX TRN4S 03'/2Uco-90 macR1i4}C4O 3OTum-
L -150 1MONCX/1CS4 TOP
0 0 r
L.IiC1.8
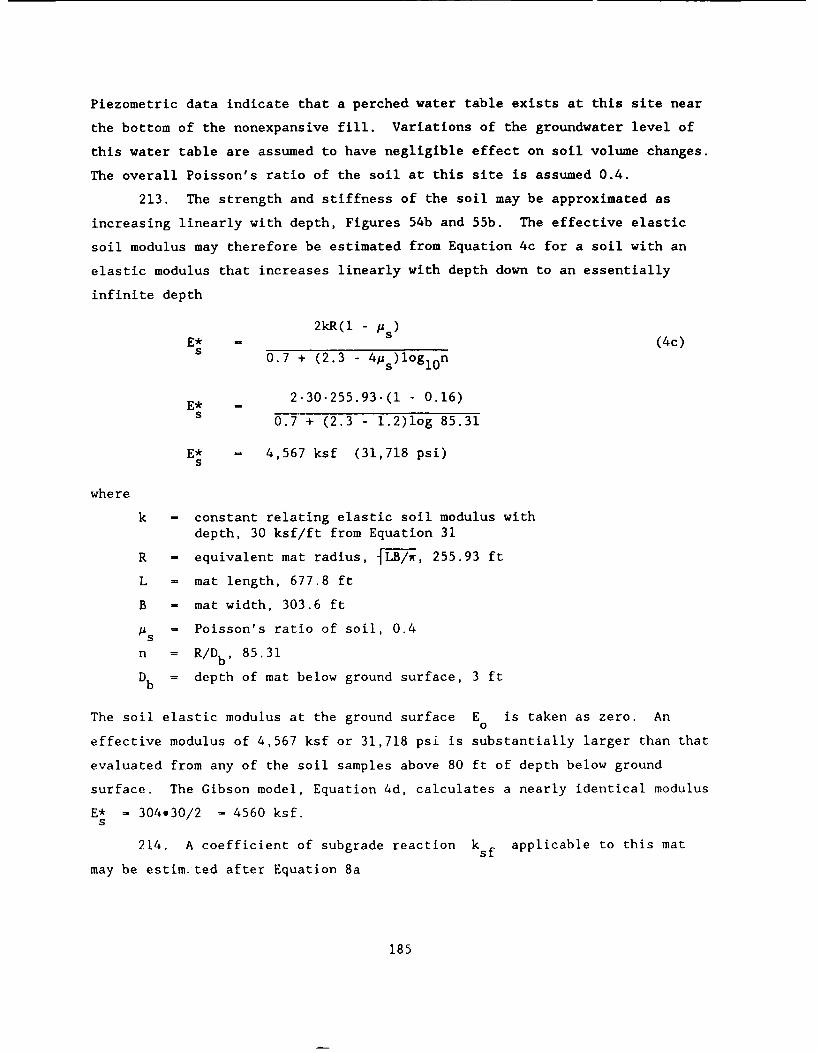
Piezometric data indicate that a perched water table exists at this site near
the bottom of the nonexpansive fill. Variations of the groundwater level of
this water table are assumed to have negligible effect on soil volume changes.
The overall Poisson's ratio of the soil at this site is assumed 0.4.
213. The strength and stiffness of the soil may be approximated as
increasing linearly with depth, Figures 54b and 55b. The effective elastic
soil modulus may therefore be estimated from Equation 4c for a soil with an
elastic modulus that increases linearly with depth down to an essentially
infinite depth
2kR(l - p)
E* - j_ (4c)s 0.7 + (2.3 - 4 s)loglon
E* = 2.30.255.93.(l - 0.16)s 0.7 + (2.3 - 1.2)log 85.31
E* - 4,567 ksf (31,718 psi)s
where
k - constant relating elastic soil modulus withdepth, 30 ksf/ft from Equation 31
R - equivalent mat radius, f-EB2, 255.93 ft
L - mat length, 677.8 ft
B - mat width, 303.6 ft
s = Poisson's ratio of soil, 0.4
n = R/Db, 85.31
Db = depth of mat below ground surface, 3 ft
The soil elastic modulus at the ground surface E is taken as zero. Ano
effective modulus of 4,567 ksf or 31,718 psi is substantially larger than that
evaluated from any of the soil samples above 80 ft of depth below ground
surface. The Gibson model, Equation 4d, calculates a nearly identical modulus
E* - 304.30/2 - 4560 ksf.s
214. A coefficient of subgrade reaction k applicable to this mat
may be estim. ted after Equation 8a
185
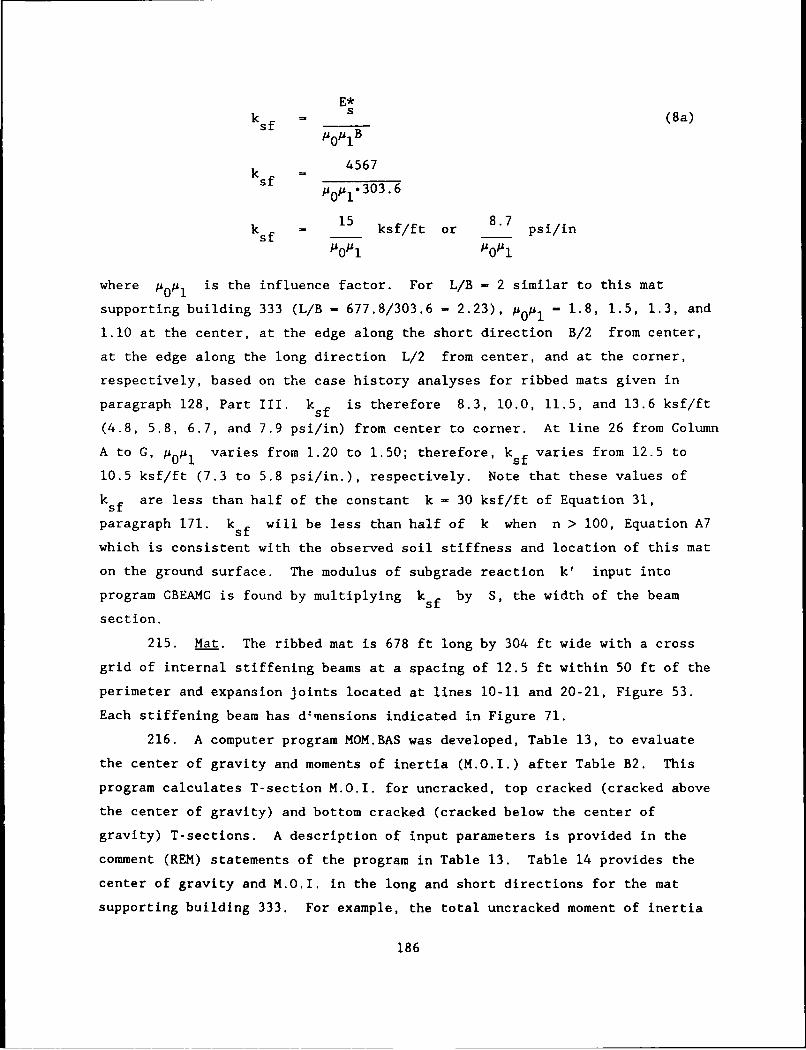
E*
ksf = s (8a)Y0pi
B
k sf 4567sf0* 303.6
15 8.7 piik s f 15 ksf/ft or psi/in
P0 pi A0 pI
where pop, is the influence factor. For L/B = 2 similar to this mat
supporting building 333 (L/B - 677.8/303.6 - 2.23), pop, = 1.8, 1.5, 1.3, and
1.10 at the center, at the edge along the short direction B/2 from center,
at the edge along the long direction L/2 from center, and at the corner,
respectively, based on the case history analyses for ribbed mats given in
paragraph 128, Part III. ksf is therefore 8.3, 10.0, 11.5, and 13.6 ksf/ft
(4.8, 5.8, 6.7, and 7.9 psi/in) from center to corner. At line 26 from Column
A to G, pop, varies from 1.20 to 1.50; therefore, ksf varies from 12.5 to
10.5 ksf/ft (7.3 to 5.8 psi/in.), respectively. Note that these values of
ksf are less than half of the constant k = 30 ksf/ft of Equation 31,
paragraph 171. ksf will be less than half of k when n > 100, Equation A7
which is consistent with the observed soil stiffness and location of this mat
on the ground surface. The modulus of subgrade reaction k' input into
program CBEAMC is found by multiplying ksf by S, the width of the beam
section.
215. Mat. The ribbed mat is 678 ft long by 304 ft wide with a cross
grid of internal stiffening beams at a spacing of 12.5 ft within 50 ft of the
perimeter and expansion joints located at lines 10-11 and 20-21, Figure 53.
Each stiffening beam has d~mensions indicated in Figure 71.
216. A computer program MOM.BAS was developed, Table 13, to evaluate
the center of gravity and moments of inertia (M.O.I.) after Table B2. This
program calculates T-section M.O.I. for uncracked, top cracked (cracked above
the center of gravity) and bottom cracked (cracked below the center of
gravity) T-sections. A description of input parameters is provided in the
comment (REM) statements of the program in Table 13. Table 14 provides the
center of gravity and M.O.I. in the long and short directions for the mat
supporting building 333. For example, the total uncracked moment of inertia
186
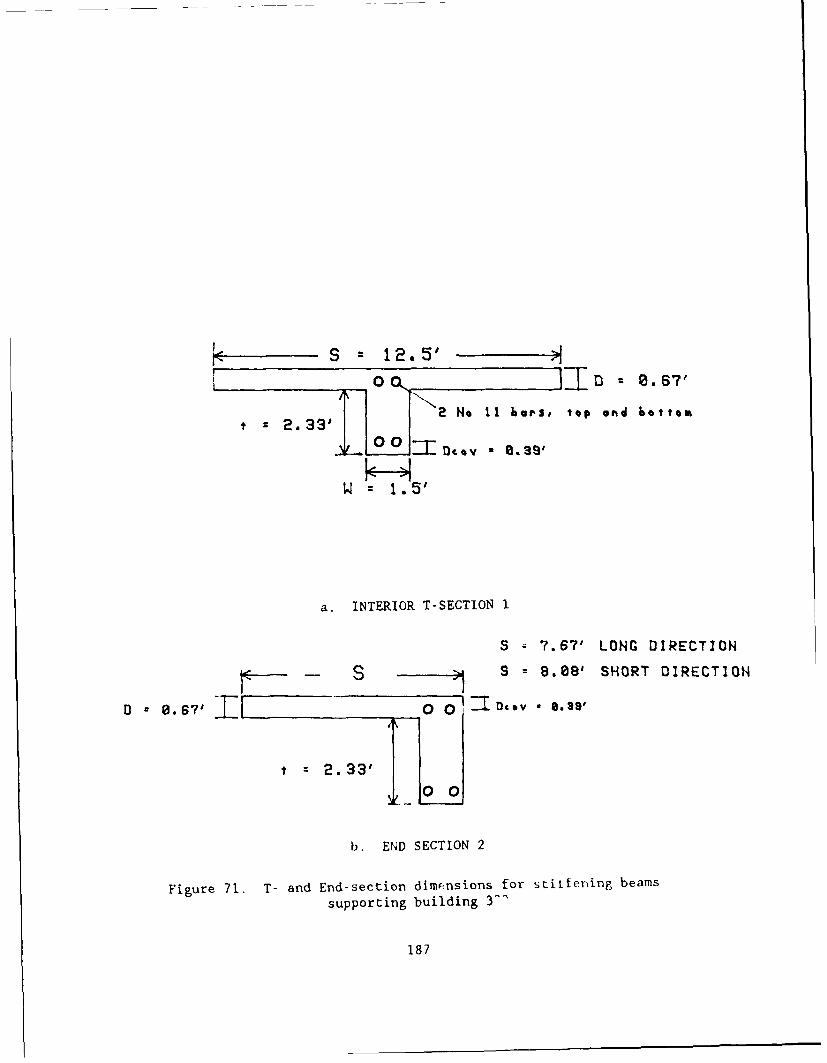
S - =S 12.5' -
22 No 11 bars, top and bottom-2.33'00v • , 3'
W 1.5'
a. INTERIOR T-SECTION 1
S - 7.67' LONG DIRECTION
S . S 8.8' SHORT DIRECTION
B 0.6?71L _ 0 ocv a 0.89'
2. 33'
b. END SECTION 2
Figure 71. T- and End-section dimensions for stitfering beams
supporting building 3^'
187
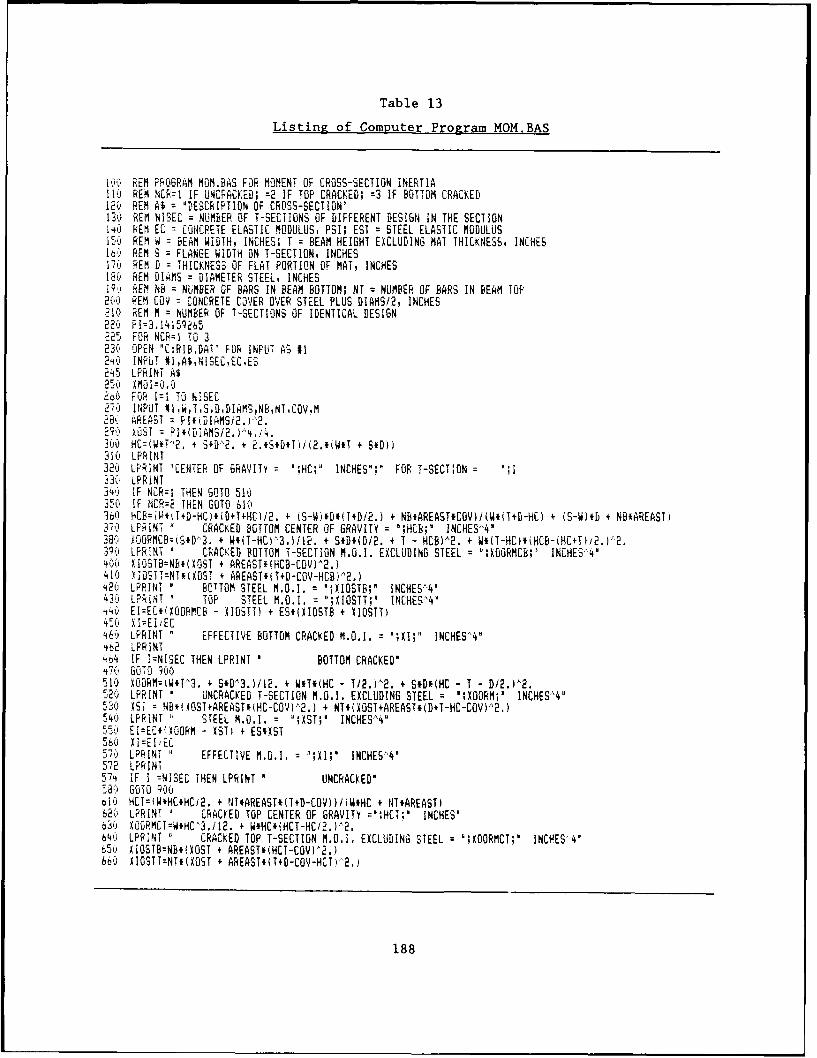
Table 13
Listing of Computer Program MOMBAS
h~ REM PPROGPAM M13M.BAS FOR MOMENT OF CROSS-SECTION INERTIA110 REM NCP I1 IF UNEPACKED; =2 IF TOP CRACKED; =3 IF BOTTOM CRACKED120 REM A$ iDESCRIPTION OF CROSS-SECTION'131" REM NISEC =NUMBER OF T-SECTIONS OF DIFFERENT DESIGN IN THE SECTIONi±l REM EC CONCPETE ELASTIC MODULUS, PSI; EST = STEEL ELASTIC MODULUSi50 REM W BEAM WIDTH, INCHES; T =BEAM HEIGHT EXCLUDING MAT THICKNESS. INCHEs160 PEM S FLANGE WIDTH ON T-SECTION. INCHES17't REM D IHICKNESS OF FLAT PORTION OF MAT, INCHES180 REM D1kM' = DIAMETER STEEL, INCHES191. REM NB NUMBER GF BARS IN BEAM BOTTOM; MT = NUMBER OF BARS IN BEAM TOP'20u' REM CuOV CONCRETE C3VER OYER STEEL PLUS DIAMS12, INCHES10 *REM M = NUMBER OF T-SECTIONS OF IDENTICAL DESIGN
22v' PI=3.141592b522r FOR NCR=I TO 3230 OPEN "C:RIB,D)AT" FOR IN PUT AS #124 INPUT #WA$,NI3EC!EC,Er324r~ LPRINT As
o' FOR 1=1 TO NISEC,.INPUT 11W,TS,,DDIAMS,NB,NT.COV.MAB REAST = Pi *DIAMS *2.)- 2.
2g, XO'ST = PI*(DIMS/2.)"*.1;4.300 HC=fW*T-'2. + S*D',2. + 2.*S*D*Tii(2.*(W*T + S*Dfl310 LPRiNT320 LPRINT 'CENTER OF GRAVITY =';HC;" INCHES";" FOR T-SECTION ";33() LPRiNT4, 1F NCR=I THEN GO10 510
350 IF NCR=2 THEN GO10 610360: HCB=iV*T+D-HC)*(D+T+HCU/2. + (G-WJ#*T+Di2.) + NB*AREAST.COV)i(W*U4+D-HE) + (S-WI#D + NB*AREAST
30LPRINT CRACKED BOTTOM CENTER OF GRAVITY = ';HCB;' INCHES^4'380 XOGRMCB=kS*D 3. + W*(T-HC)3.)/12. + S*D*iD/2. + HCB). + W#(T-HC )*kHCB-(HC+T)i2.)"2.390 LPRINT ' CRACKED BOTTOM T-SECTION M.O.I. EXCLUDING STEEL = ;XDORMCB;7 INCHES-4'4~06 XIOSTB=NB#*UOST + AREAST*(HCB-CDV)A2.)410 X1ITT =NT*UO3GT + AREAST*(U4D-COV-HCBv- 2.)420 LPR INT . BOTTOM STEEL M.O.I. = ";XIGSTB;K INCHES 4'430" LRIHT - TOP STEEL M.O.I. = ;ISTT;' INCHES'Y,444-V EI=EC*(XGOPMCB - XIOGTT) + ES*(XIOSTB + XIOSTT!45 j(, I=EitEC460 LPRINT EFFECTIVE BOTTOM CRACKED M.O.I. = ";XI;" INCHES.4'462 LPRiNT464 IF I=NISEC THEN LPRINT *BOTTOM CRACKED'
q'jGOTO goo510 XOIORM=(W#T A3. + S*D A .)12. + W*(HC - T/2.)'2. +S*D*iHC - T - D/2.)A 2..r,2" LPRINT UNCRACKED T-SECTION M.O.I. EXCLUDING STEEL = ';XOORM;o INCHESA 4"'3 .ES_ NB*(XOST4AREAST.(HC-COV)P2.) + NT#I(XST.AREAST.(D+T-HC-COV)",2.)'.40 LPRINT 11 STEEL M.O.I. = ;AST;' INCHES",'
EI=EC#1XOORM -XST) + ES*XST56 XI=EIEC51, LPP.INT EFFECTIVE M.G.]. = ;XI; INCHES"'4572 LPRINT574, IF I =NISOEC THEN LPRINT UNCRACKED"53ci GO010900
o0HCT=)W*HC#HCI2. 4 NT.AREAST*(T+D-COV))/)U;HC + NT*AREAST)62e LPRI NT CRAC ED TOP CENTER OF GRAVITY =';HCT;l INCHES"b30 XOGRMCT=W#HC 3,/12. +W*HC* HCT-HCQ2.)2.646 LPRINT " CRACKED TOP T-SECTION M.O.i. EXCLUDING STEEL = ;XOORMCT;' INCPES 4
6r IOSTBtNB*(XOST + AREAST'HCT-CO)V2.660 XIOSTT=NT*(XOST + AREAST*(T+D-COV-HCTI 2.)
188
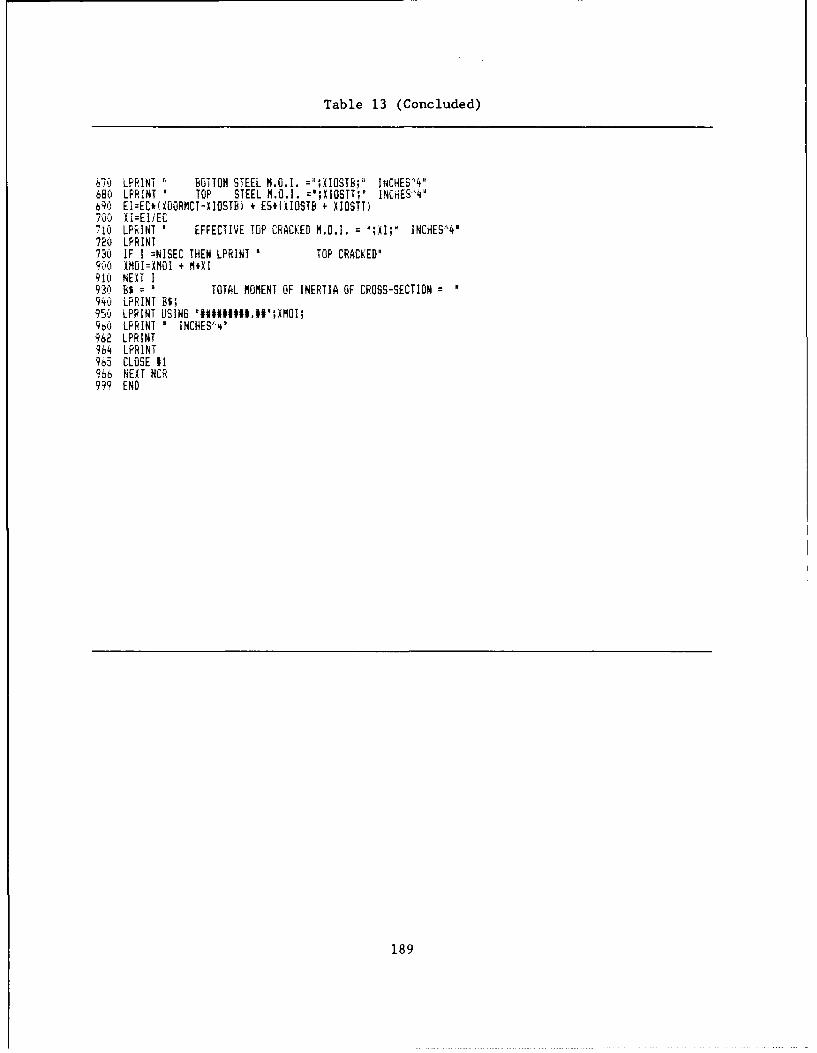
Table 13 (Concluded)
610 LPRIN! I BOTTOM STEEL M.O.I. =";XIOSTB;" INCHES -4'680 LFRINT " TOP STEEL M.O.I. =';XIOSTT;l INCHES- °4b90 EI=EC*(XOORMCT-XIOSTB) + ES*iXIOSTB + XIOSTTi00 Xi=EIiEC
710 LPRINT ' EFFECTIVE TOP CRACKED H.O.I. = ';XI;" INCHESA41720 LPRINT730 IF I =NISEC THEN LPRINT TOP CRACKED'900 XMOI=XMOI + M*XI91( NEXT I930 B$ = ' TOTAL MOMENT OF INERTIA OF CROSS-SECTION940 LPRINT WS;9V5 LPRINT USING 'W#####I .#14;XMOI;9 0 LPRINT ' INCHES '.4962 LPRINT964 LPRINT965 CLOSE #1966 NEXT NCR999 END
189

Table 14
Calculations of Moments of Inertia for building 333
a. Long Direction
LUNG DIMENSION BUILDING 333
CENTER OF GRAVITY = 26.67606 INCHES FOR T-SECTION 1
UNCRACKED T-SECTION M.O.I. EXCLUDING STEEL = 154325.2 INCHESA4STEEL M.O.I. 1695.099 INCHES-4EFFECTIVE MO.I. = 169016.1 INCHES'4
CENTER OF GRAVITY = 24.68387 INCHES FOR T-SECTION 2
UNCRACKED T-SECTION M.O.I. EXCLUDING STEEL = 133777.4 INCHES 4STEEL M.O.I. = 1503.979 INCHES"4EFFECTIVE M.O.I. = 146811.9 INCHES 4
UNCRACKEDTOTAL MOMENT OF INERTIA OF CROSS-SECTION = 9251474.00 INCHESA4
LONG DIMENSION BUILDING 333
CENTER OF GRAVITY = 26.67606 INCHES FOR T-SECTION 1
CRACKED TOP CENTER OF GRAVITY = 13.45862 INCHESCRACKED TOP T-SECTION M.O.I. EXCLUDING STEEL = 28481.48 INCHESA4BOTTOM STEEL M.O.I. = 279.7796 INCHES4TOP STEEL M.O.I. = 1073.988 INCHESA4EFFECTIVE TOP CRACKED M.O.I. = 41288.12 INCHESA4
CENTER OF GRAVITY = 24.68387 INCHES FOR T-SECTION = 2
CRACKED TOP CENTER OF GRAVITY = 12.47914 INCHESCRACKED TOP T-SECTION M.O.I. EXCLUDING STEEL = 22567.94 INCHES'4BOTTOM STEEL M.O.I. = 224.9115 INCHES^4TOP STEEL M.O.I. = 1190.413 INCHESA4EFFECTIVE TOP CRACKED M.O.I. = 36024.5 INCHES^4
TOP CRACKEDTOTAL MOMENT OF INERTIA OF CROSS-SECTION 2260320.00 INCHES'4
LONG DIMENSION BUILDING 333
CENTER OF GRAVITY = 26.67606 INCHES FOR T-SECTION 1
CRACKED BOTTOM CENTER OF GRAVITY = 31.83818 INCHES"4CRACKED BOTTOM T-SECTION M.O.I. EXCLUDING STEEL = 6917.514BOTTOM STEEL M.G.I. = 2420.525 INCHESA4TOP STEEL M.O.I. = .460G128 INCHES 4EFFECTIVE BOTTOM CRACKED M.O.I. = 30313.99 INCHES4
190

Table 14 (Continued)
CENTER OF GRAVITY = 24.68387 INCHES FOR T-SECTION = 2
CRACKED BOTTOM CENTER OF GRAVITY = 31.46775 INCHES'4CRACKED BOTTOM T-SECTION M.O.I. EXCLUDING STEEL = 5756.839BOTTOM STEEL MO.I. = 2356.544 INCHESA4TOP STEEL M.O.I. z 1.272744 INCHES^4EFFECTIVE BOTTOM CRACKED M.O.I. = 28547.8 INCHES'4
BOTTOM CRACKEDTOTAL MOMENT OF INERTIA OF CROSS-SECTION 1664055.00 INCHES^4
DATA FOR LONG DIRECTION
'LONG DIMENSION BUILDING 333",2,3.EO6,29.OE06lB.,28.,150.0,8.,1.410,2,2,4.0,53IB.,28.,92.0,8.,1.410,2,2,4.0,2
b. Short Direction
SHORT DIMENSION BUILDING 333
CENTER OF GRAVITY = 26.67606 INCHES FOR T-SECTION I
UNCRACKED T-SECTION M.O.I. EXCLUDING STEEL = 154325.2 INCHES 4STEEL M.O.I. = 1695.099 INCHES 4EFFECTIVE M.O.I. = 169016.1 INCHES"4
CENTER OF GRAVITY = 24.9125 INCHES FOR T-SECTION 2
UNCRACKED T-SECTION M.O.I. ExCLUDING STEEL = 136064.9 INCHES 4STEEL M.O.I. = 1523.394 INCHES 4EFFECTIVE M.O.I. = 149267.6 INCHES-4
UNCRACKEDTOTAL MOMENT OF INERTIA OF CROSS-SECTION 418590 4.06 INCHES 4
SHORT DIMENSION BUILDING 333
CENTER OF GRAVITV = 26.67606 INCHES FOR T-SECTION I
CRACKED TOP CENTER OF GRAVITY = 13.45862 INCHESCRAC ED TOP T-SECTION M.O.I. EXCLUDING STEEL = 28481.4B INCHES'4BOTTOM STEEL MO.I. = 279.77% INCHES'.TOP STEEL M.O.I. = 1073,988 INCHES'4EFFECTIVE TOP CRACKED MO.I. = 4128.12 INCHES 4
191
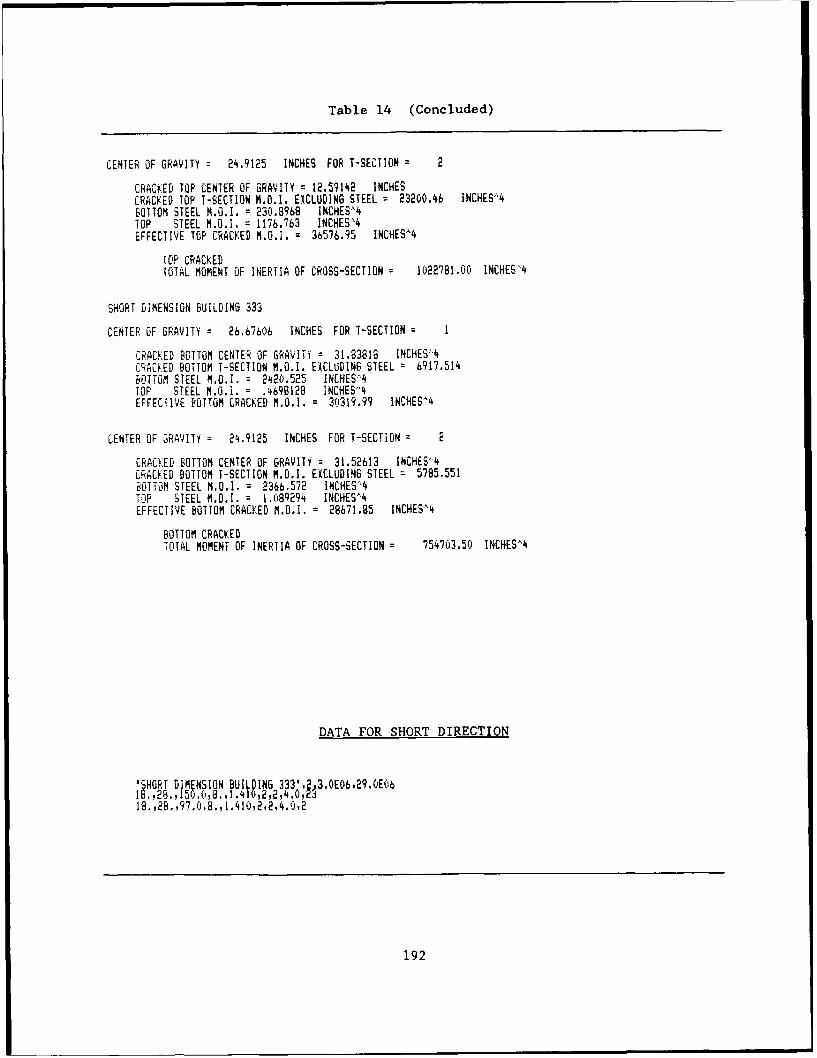
Table 14 (Concluded)
CENTER OF GRAVITY = 24.9125 INCHES FOR T-SECTION 2
CRACKED TOP CENTER OF GRAVITY = 12.59142 INCHESCRACKED TOP T-SECTION M.O.I. EXCLUDING STEEL = 23200.46 INCHESA4BOTTOM STEEL M.O.I. = 230.8968 INCHESA4TOP STEEL M.O.I. = 1176.763 INCHESA 4EFFECTIVE TOP CRACKED M.O.i. = 36576.95 INCHES'4
TOP CRACKEDTOTAL MOMENT OF INERTIA OF CROSS-SECTION 1022781.00 INCHES 4
SHORT DIMENSION BUILDING 333
CENTER OF GRAVITY = 26.67606 INCHES FOR T-SECTION I
CRACKED BOTTOM CENTER OF GRAVITY = 31.83818 INCHES'4CRACKED BOTTOM T-SECTION M.O.I. EXCLUDING STEEL = 6917.514BOTTOM STEEL M.O.I. = 2420.525 INCHES '4TOP STEEL M.O.i. .4698I28 INCHES-4EFFECTIVE BOTTOM CRACKED M.O.I. = 30319.99 INCHES'4
CENTER OF 3RAVITY = 24.9125 INCHES FOR T-SECTION = 2
CRACKED BOTTOM CENTER OF GRAVITY = 31.52613 INCHES 4CRACKED BOTTOM T-SECTION M.O.I. EXCLUDING STEEL = 5785.551iOTTOM STEEL M.O.I. = 2366.572 INCHES"4TOP STEEL M.O.I. = 1.089294 INCHES"4EFFECTIVE BOTTOM CRACKED M.O.I. = 28671.85 INCHESA4
BOTTOM CRACKEDTOTAL MOMENT OF INERTIA OF CROSS-SECTION 754703.50 INCHESA4
DATA FOR SHORT DIRECTION
;'SHORT DIMENSION BUILDING 333',W 06,29.OE06
1828. .0,p8.,1.410,2,24 .0,2
192
of the mat cross-section parallel with the long direction is 9,251,474 inches4
and the total mat uncracked M.O.I. parallel with thr short direction is
4,185,904 inches. This calculation assumes T-section dimensions indicated in
Figure 71 with stiffening beams uniformly placed with spacing at 12.5-ft
centers. Table 14 also shows the input data listing for program MOM.BAS. A
simplified arrangement of vertical loads applied only at the columns is
assumed for these analyses. A reasonable assumption of structural dead loads
excluding wind and snow loads is approximately 32, 64, and 128 kips on the
corner, edge, and interior columns. A 32, 64, and 128 kip load distribution
will cause approximately 8 psi pressure on the widened beams or footings
beneath each column.
Plate on Elastic Foundation
217. A finite element mesh, Figure 72, describes the dimensions and
load distribution. Loads were assumed to be uniformly distributed within the
rectangle at each column area indicated in Figure 72. The area of these
rectangles is about twice the actual footing size beneath each column leading
to an applied pressure of 4 psi consistent with the earth pressures measured
near column D. The total load applied at each column is assumed to spill on
to some of the soil adjacent to that beneath each column.
218. Soil input parameters include an equivalent soil elastic modulus
E* - 30,000 psi (4320 ksf) and soil Poisson's ratio us - 0.4. Mat inputS
parameters include an elastic modulus of concrete E - 1,500,000 psi (216,000c
ksf) with a concrete Poisson's ratio yc = 0.15. A partial gap beneath line
20-21 at the expansion joint was also input to simulate the loss of support in
the softened soil in this area. The computer analyses also assumed a joint at
line 20-21 to simulate the expansion joint, Figure 53a. Analyses were
performed with and without the weight of the mat.
219. Analysis for the southeast quadrant, Figure 73, indicate
displacements of 0.05 ft without the mat weight and 0.15 ft with the mat
weight. These displacements bound the 0.1 ft measured in the southeast
quadrant 12 May 1987, Figure 74. The calculated V-shaped settlement, Figure
73, also reasonably matches the measured settlement, Figure 74. The results
of additional computez aiialyses performed without the expansion joint were
similar to those in Figure 73.
193
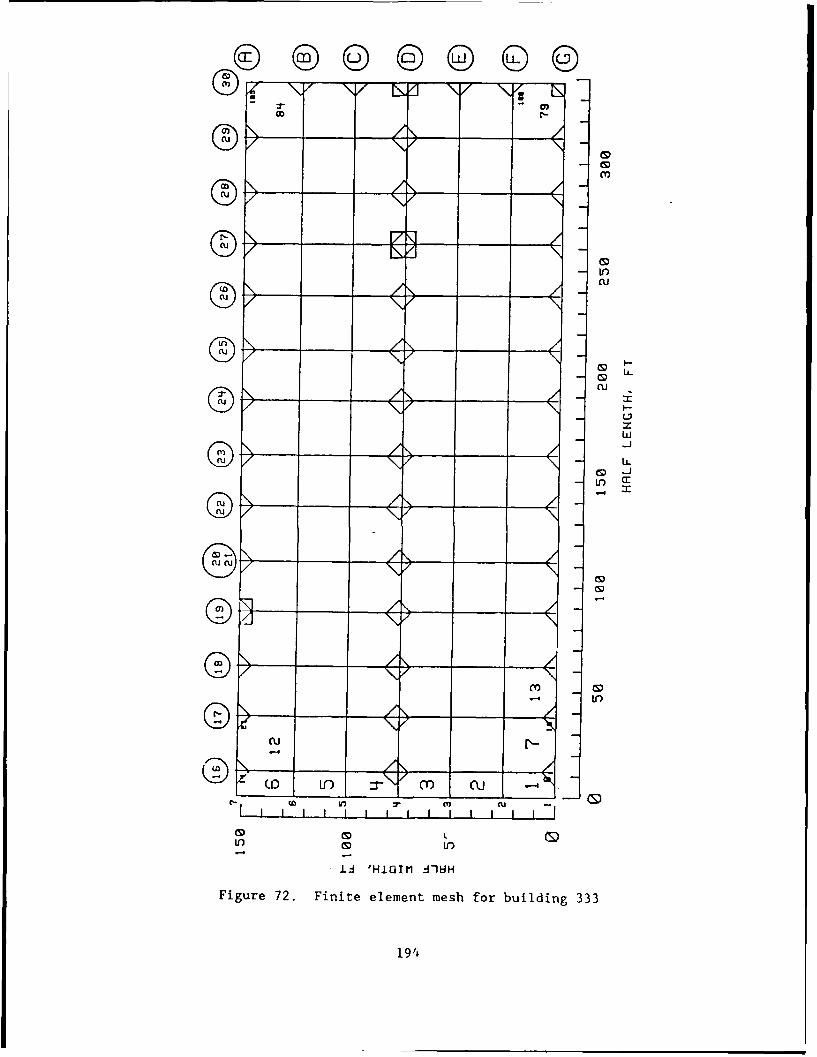
CYu
GD-
z
Lr a:
cD DLJ ' I. all
In IfO
Figure 72. Finite element mesh for building 333
194
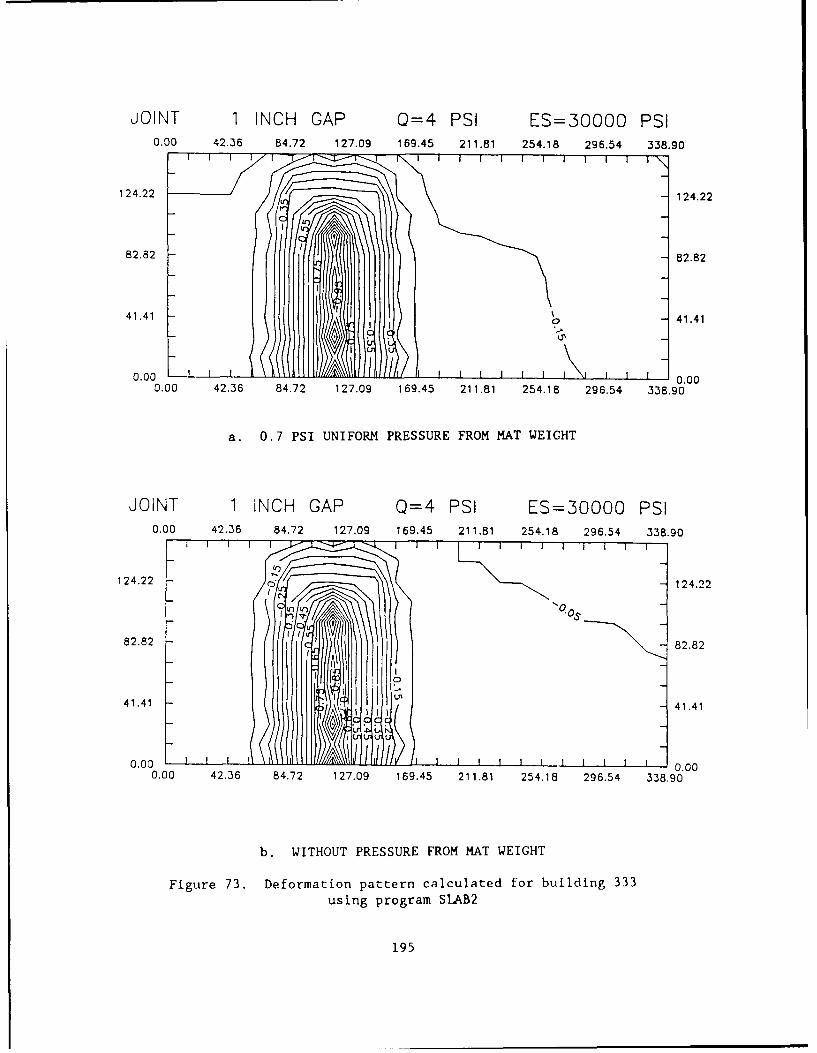
JOINT 1 INCH GAP Q=4 PSI ES=30000 PSI0.00 42.36 84.72 127.09 169.45 211.81 254.18 296.54 338.90
124.22 124.22
82.82 82.82
41.41 41.41
0.00 10.000.00 42.36 84.72 127.09 169.45 211.81 254.18 296.54 338.90
a. 0.7 PSI UNIFORM PRESSURE FROM MAT WEIGHT
JOINT 1 INCH GAP Q=4 PSI ES=30000 PSI0.00 42.36 84.72 127.09 169.45 211.81 254.18 296.54 338.90
124.22 124.22
82.82 82.82
41.41 - - 41.41
0.00 1 0.000.00 42.36 84.72 127.09 169.45 211.81 254.18 296.54 338.90
b. WITHOUT PRESSURE FROM MAT WEIGHT
Figure 73. Deformation pattern calculated for building 333using program SLAB2
195
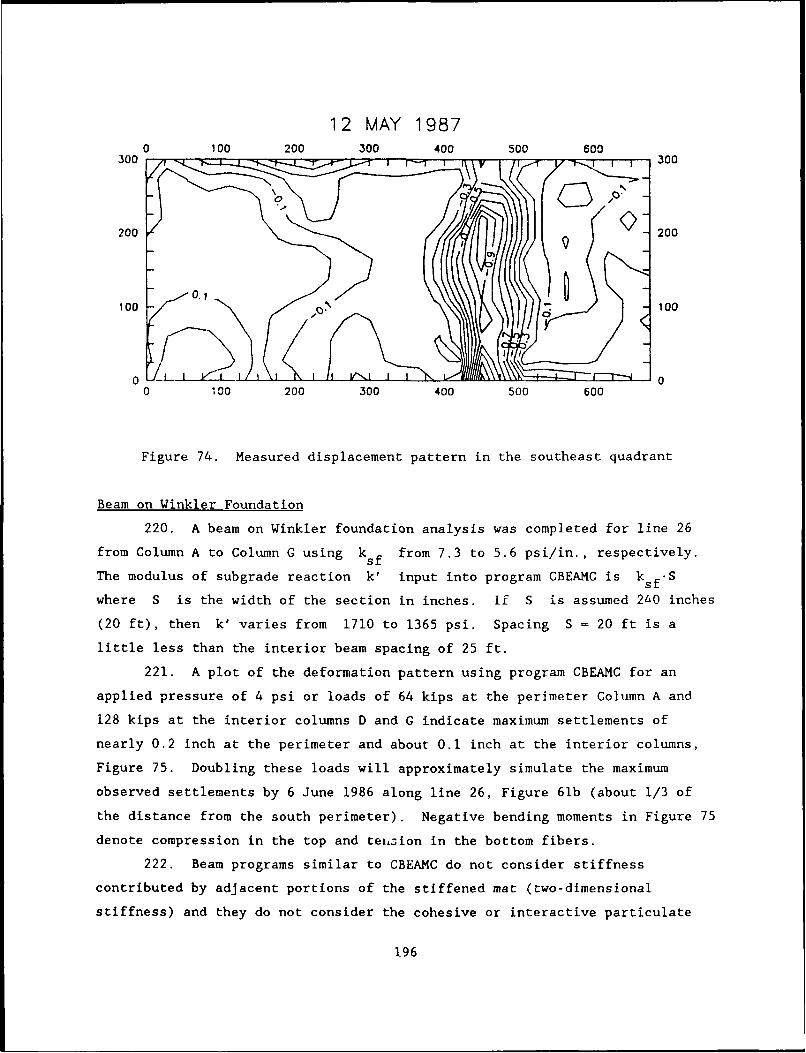
12 MAY 19870 100 200 300 400 500 600
300 V 1300
200 200
100 /100
o - 00 100 200 300 400 500 600
Figure 74. Measured displacement pattern in the southeast quadrant
Beam on Winkler Foundation
220. A beam on Winkler foundation analysis was completed for line 26
from Column A to Column G using ksf from 7.3 to 5.6 psi/in., respectively.
The modulus of subgrade reaction k' input into program CBEAMC is ksf. S
where S is the width of the section in inches. If S is assumed 260 inches
(20 ft), then k' varies from 1710 to 1365 psi. Spacing S - 20 ft is a
little less than the interior beam spacing of 25 ft.
221. A plot of the deformation pattern using program CBEAMC for an
applied pressure of 4 psi or loads of 64 kips at the perimeter Column A and
128 kips at the interior columns D and G indicate maximum settlements of
nearly 0.2 inch at the perimeter and about 0.1 inch at the interior columns,
Figure 75. Doubling these loads will approximately simulate the maximum
observed settlements by 6 June 1986 along line 26, Figure 61b (about 1/3 of
the distance from the south perimeter). Negative bending moments in Figure 75
denote compression in the top and tel,3ion in the bottom fibers.
222. Beam programs similar to CBEAMC do not consider stiffness
contributed by adjacent portions of the stiffened mat (two-dimensional
stiffness) and they do not consider the cohesive or interactive particulate
196
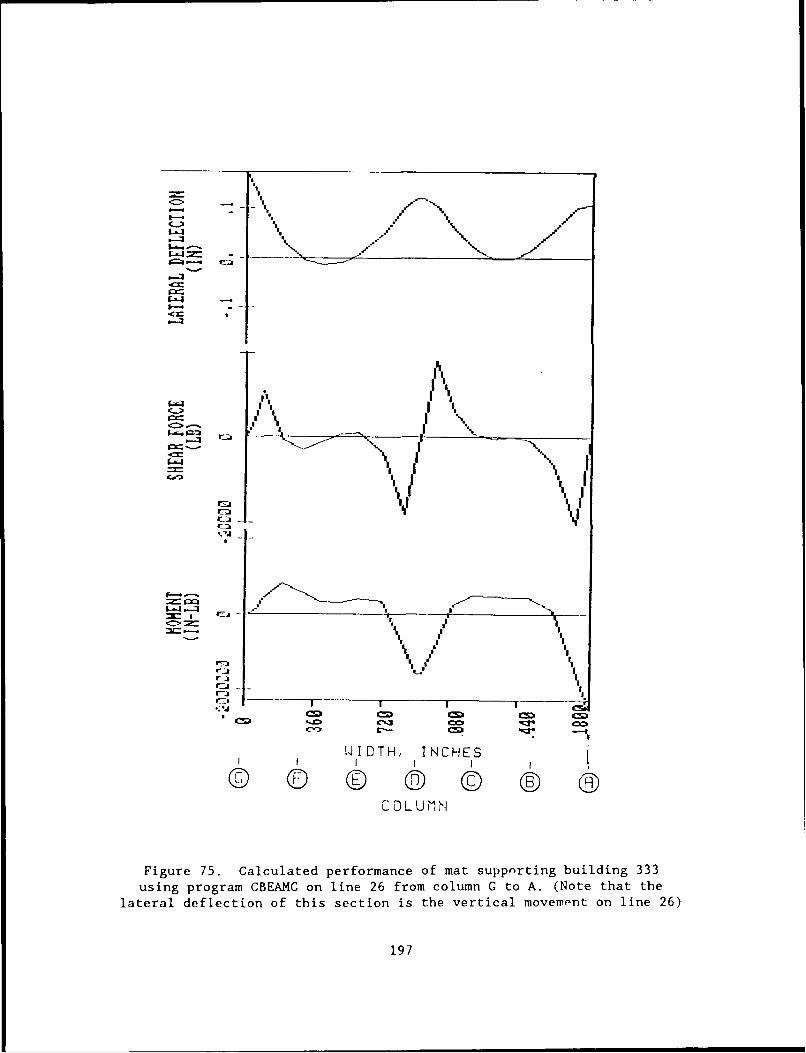
- I
% % , , /
<3=
__- . .. - , I -\ I
C ..- .- 1' "
I I I-,,J-- I'
rj- I
II o
r I TH, INC E I
II I I-I .
CO0LU ii
Figure 75. Calculated performance of mat supprorting building 333using program CBEAMC on line 26 from column C to A. (Note that the
lateral deflection of this section is the vertical movement on line 26)
197
nature of soil; that is, soil does not behave as an independent bed of springs
simulated by the Winkler foundation. Calculated perimeter settlements are
therefore greater than interior settlements for this type of loading pattern.
Vertical deformations predicted by an independent method must be input into
beam on Winkler foundation models to calculate proper stresses and bending
moments. The Winkler procedure for design of ribbed mats developed by the
Southwestern Division of the US Army Corps of Engineers 12 uses movement data.
Frequency Spectrum Model
223. An application of the pavement frequency spectrum model described
in paragraph 78 to this mat foundation is provided in Table 15. This model
ignores the two-dimensional stiffness of the mat. The relative rigidity/ft 0
is evaluated from Equation 17, paragraph 62, for the given stiffness E I ofcthe mat. Minimum and maximum values for the foundation coefficients of
subgrade reaction ksf are assumed 4 and 14 ksf/ft. The n evaluated for
this range is multiplied by the wavelength r of 10, 20, and 30 ft to obtain
the relative rigidity. Figure 9 is subsequently used to evaluate the ratio of
the acceptable to the expected amplitude Aa/Ae. The accepted amplitude or
deflection A of the mat is r/2666 from paragraph 84 for an allowable
deflection ratio Fm - 1/500. The maximum amplitude or displacement of themax
soil without the mat in feet for the given mat stiffness E I is shown in thec
last column on the right, Table 15.
224. Table 15 shows that the uncracked T-section with spacing S - 12.5
ft can squeeze soil with ksf - 4 ksf/ft down to A/L < 1/1333 for heaves
without the mat > 8 inches and soil wavelengths of 10 to 30 ft. If the
section is cracked, then the maximum heave is reduced to about 3 inches. If
the section contains only steel, then the maximum heave is reduced further.
The maximum heave tolerated for harder soil, ksf - 14 ksf/ft, is
substantially less than for the softer soil. The observed deformation of the
mat at the expansion joint (line 20/21) lying over the old drainage area
appears consistent with this model. Although these computations only indicate
trends in performance because loads are not considered, the model is limited
to one dimension and soil wavelengths and amplitudes beneath facilities are
not known, this application illustrates the simplicity and potential power of
frequency spectrum models when developed for mat applications.
198
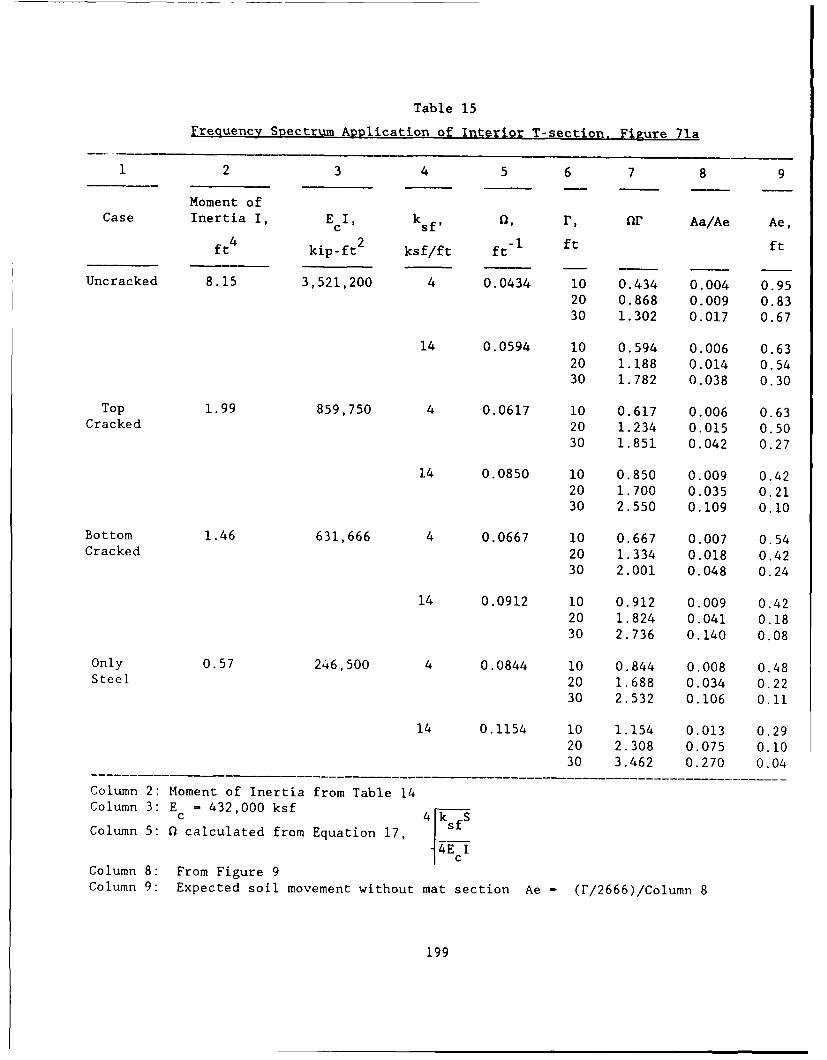
Table 15
Frequency Spectrum ADplication of Interior T-section. Figure 71a
2 3 4 5 6 7 8 9
Moment ofCase Inertia I, E I, k sf , r, or Aa/Ae Ae,
ft4 kip-ft2 ksf/ft ft "I ft ft
Uncracked 8.15 3,521,200 4 0.0434 10 0.434 0.004 0.9520 0.868 0.009 0.8330 1.302 0.017 0.67
14 0.0594 10 0.594 0.006 0.6320 1.188 0.014 0.5430 1.782 0.038 0.30
Top 1.99 859,750 4 0.0617 10 0.617 0.006 0.63Cracked 20 1.234 0.015 0.50
30 1.851 0.042 0.27
14 0.0850 10 0.850 0.009 0.4220 1.700 0.035 0.2130 2.550 0.109 0.10
Bottom 1.46 631,666 4 0.0667 10 0.667 0.007 0.54Cracked 20 1.334 0.018 0.42
30 2.001 0.048 0.24
14 0.0912 10 0.912 0.009 0.4220 1.824 0.041 0.1830 2.736 0.140 0.08
Only 0.57 246,500 4 0.0844 10 0.844 0.008 0.48Steel 20 1.688 0.034 0.22
30 2.532 0.106 0.11
14 0.1154 10 1.154 0.013 0.2920 2.308 0.075 0.1030 3.462 0.270 0.04
--------------------- --- --- -------- -----
Column 2: Moment of Inertia from Table 14Column 3: E - 432,000 ksf 4 k s
Column 5: 0 calculated from Equation 17,
4E Ic
Column 8: From Figure 9Column 9: Expected soil movement without mat section Ae - (r/2666)/Column 8
199
Summary and Conclusions
225. The soil supporting building 333 is of an expansive nature, but
the placement of an engineered nonexpansive fill to depths of 5 to 8 ft and
the existence of a perched water table with groundwater level about 5 ft below
ground surface have essentially eliminated any potential for swell or
shrinkage at this site. Soil swell may have been realized if a perched water
table had not existed prior to construction, but developed later in the life
of the project. This site was cleared of trees and vegetation and supported
earlier facilities. Construction in a previously forested site may not
contain a perched water table because trees take moisture out of the soil.
226. Data from field instruments show that the mat performance is
similar to a plate on an elastic foundation. Elevation surveys show that
loads applied through August 1987 have led to relatively small settlements
from 0.1 to 0.3 inch, except where a drainage ditch had previously existed.
Settlement in this area exceeds 1 inch perhaps because of settlement of an
increased fill thickness and softening of the subsurface soil; less efficient
compaction of fill is possible above softened soil. Observed distortions are
consistent with data from earth pressure cells and strain gages. The
distortion pattern shows rigid behavior in the short direction consistent with
the exceptionally large earth pressures observed near the perimeter simulating
a plate on an elastic soil. The observed tensile and compressive strains are
consistent with the depression and hump observed on line 26. The hump may
have developed because of arching in the mat from (1) temporary heavy loads
placed near line 30 from A to N leading to additional settlement and (2)
settlement approaching 1.5 inch near line 20-21. The stiffening beam on line
26 near column G appears to have fractured based on the unusually large
strains measured near G; fractures were observed on the mat during
construction between columns G and F near line 26. Stiffening beams hanging
in the trenches without soil support following shrinkage from concrete cure or
arching of the mat may aggravate fracture in the mat following beam loading
during construction of the superstructure. Axial stress and bending moments
calculated from the strain gages assuming a rectangular beam are generally
reasonable.
200
227. Analyses show that an equivalent elastic modulus may be evaluated
leading to good comparisons of calculated with measured settlement using plate
on eastic program SLAB2. Beam on Winkler foundation program CBEAMC did not
provide realistic results. One-dimension, single parameter models such as the
Winkler concept will not calculate reliable stresses and bending moments
unless displacements can be accurately predicted and input into the analysis
such as observed in Part III. The frequency spectrum model indicates
consistent distortions for the given mat stiffness. The mat may be
overdesigned, except where the old drainage ditch was located, because the
design was based on a potential heave ym of 1.5 inches (Appendix F), while
the actual heave potential may be negligible. Field measurements of
wavelengths and amplitudes of soil movements beneath and adjacent to
facilities and correlations with distress of facilities are recommended to
calibrate the frequency spectrum model to foundations.
201
PART V: GUIDELINES FOR DESIGN AND CONSTRUCTION
Applicability of Mat Foundations
228. Mats are an appropriate, economical foundation system,
particularly where a stable bearing stratum not subject to significant volume
change is more than 30 ft below the ground surface. Ribbed mats useful for
supporting light (family housing) and intermediate (warehouses, operational
and maintenance facilities) consist of a thin slab on grade monolithic with a
grid of stiffening beams beneath the slab. The stiffening beams or ribs may
be cast into trenches excavated in the foundation soil. Flat mats useful for
supporting heavy multi-story structures such as hospitals are usually 3 to 5
ft thick and often constructed 25 to 30 ft below grade such that the net
increase in pressure on the bearing stratum is insignificant. Settlement of
such floating foundations is limited to elastic recompression. Mats
supporting heavy structures designed by conventional techniques49 50,5 1 have
performed adequately. Mats supporting light and intermediate structures in
expansive soil have been subject to distress and therefore design of these
mats is the subject of this part.
Expansive Soil Behavior
229. Expansive soil exhibits volume changes caused by changes in soil
moisture that occur predominantly in the vertical direction. The plastic CH
cohesive soils containing montmorillonitic clay minerals are most susceptible
to volume changes, although lean CL clays can also lead to structural damage
if soil water content changes are sufficiently large. These soils when
exposed to the natural environment swell and shrink during wet and dry
seasons. The natural fissure system inherent in these soils influences the
amount of volume change that occurs within a given time frame or season.
Numerous fissures, for example, promotes flow of free water from surface
runoff through the soil into deeper, possibly desiccated zones increasing the
depth of active soil volume change Za , while fewer fissures restrict the flow
of free water limiting the depth of penetration and volume change that can
occur within a single season. Soil movement for analysis of foundation
performance is characterized by center and edge lift deformation modes.
202
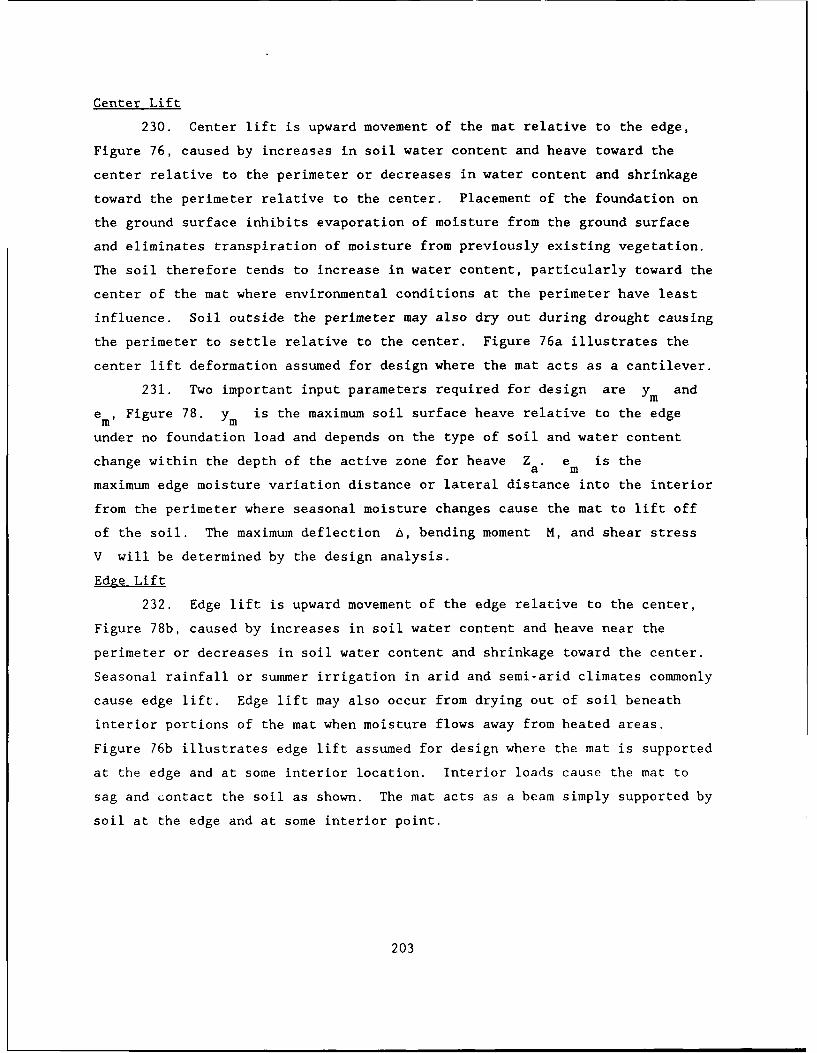
Center Lift
230. Center lift is upward movement of the mat relative to the edge,
Figure 76, caused by increases in soil water content and heave toward the
center relative to the perimeter or decreases in water content and shrinkage
toward the perimeter relative to the center. Placement of the foundation on
the ground surface inhibits evaporation of moisture from the ground surface
and eliminates transpiration of moisture from previously existing vegetation.
The soil therefore tends to increase in water content, particularly toward the
center of the mat where environmental conditions at the perimeter have least
influence. Soil outside the perimeter may also dry out during drought causing
the perimeter to settle relative to the center. Figure 76a illustrates the
center lift deformation assumed for design where the mat acts as a cantilever.
231. Two important input parameters required for design are Ym and
e M Figure 78. ym is the maximum soil surface heave relative to the edge
under no foundation load and depends on the type of soil and water content
change within the depth of the active zone for heave Z . e is thea m
maximum edge moisture variation distance or lateral distance into the interior
from the perimeter where seasonal moisture changes cause the mat to lift off
of the soil. The maximum deflection 6, bending moment M, and shear stress
V will be determined by the design analysis.
Edge Lift
232. Edge lift is upward movement of the edge relative to the center,
Figure 78b, caused by increases in soil water content and heave near the
perimeter or decreases in soil water content and shrinkage toward the center.
Seasonal rainfall or summer irrigation in arid and semi-arid climates commonly
cause edge lift. Edge lift may also occur from drying out of soil beneath
interior portions of the mat when moisture flows away from heated areas.
Figure 76b illustrates edge lift assumed for design where the mat is supported
at the edge and at some interior location. Interior loads cause the mat to
sag and contact the soil as shown. The mat acts as a beam simply supported by
soil at the edge and at some interior point.
203
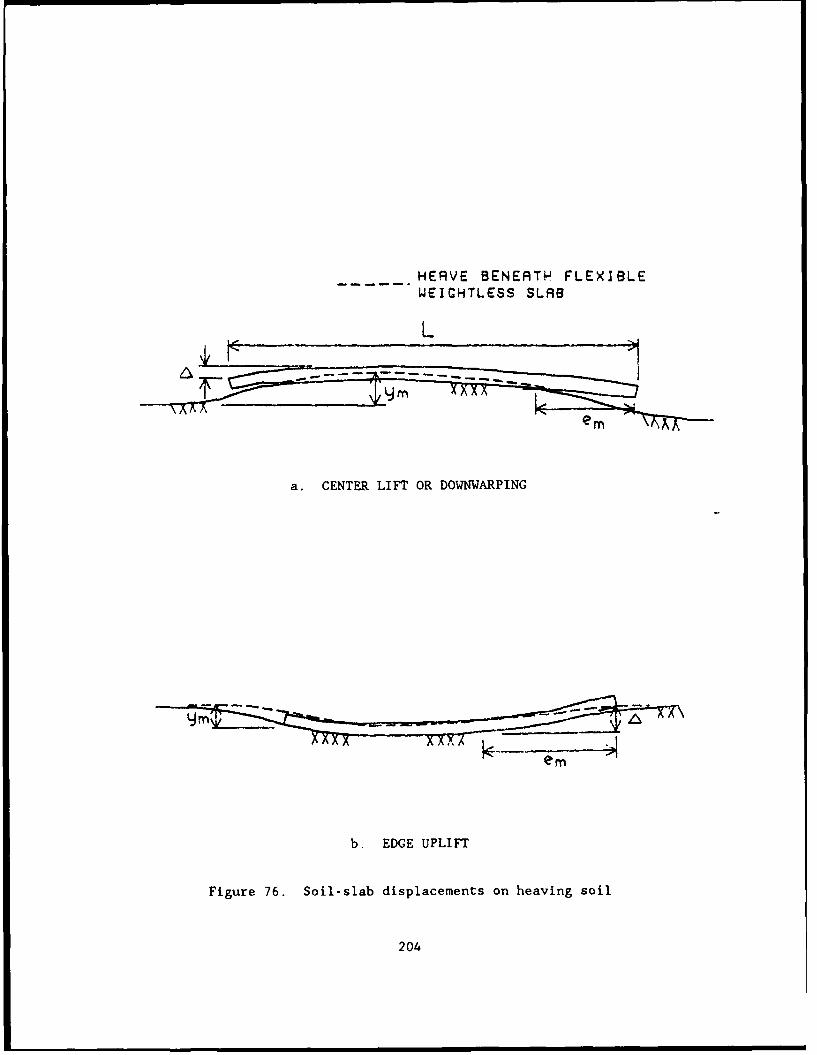
--- -- HERVE BENEATH FLEXIBLEWEICHTLESS SLAB
Le
a. CENTER LIFT OR DOWNWARPING
em
b. EDGE UPLIFT
Figure 76. Soil-slab displacements on heaving soil
204
Soil Exploration
233. A thorough field investigation must be conducted of the proposed
construction site to determine site characteristics for construction and soil
input parameters to accomplish the design.
Site Characterization
234. Foundation soil and groundwater characteristics should be
determined early in the design process to avoid unexpected obstacles to
construction such as underground streams, sink holes, boulders, poor site
trafficability, poor drainage, unstable excavation slopes, excessive heave of
excavation bottoms, and loss of ground adjacent to excavations.
235. Surface soil. Surface soils within and near the potential
construction site should be identified to determine trafficability of
construction equipment and suitability of the soil to support the structure or
use as fill. Plastic soils can reduce site trafficability and may be
potentially expansive. Expansive and plastic surface soils are easily
identified following dry periods by a polygon network of fissures appearing on
the ground surface; otherwise, they may be identified by their slick and
sticky texture when wet. Expansive soil often contains montmorillonite and it
is associated with high plasticity CH cohesive clay with plasticity index PI >
40 and liquid limit > 50. Lean CL soil with PI Z 15 can cause structural
damage to the foundation and superstructure if water content changes and
subsequent differential movements are sufficiently large.
236. Collapsible soil is also an undesirable foundation material. It
has a loose structure often associated with mudflows and partly saturated
windblown colluvial, cohesive silty sands found in arid and semi-arid
climates. Cohesion is often imparted by precipitation of soluble compounds
such as calcium carbonates, gypsum, or ferrous iron that dissolve when wet
leading to rapid volume decreases and substantial nonuniform settlement.
237. Topography. Topography of the site should be checked for adequate
drainage of surface water away from the site and a suitable level location for
the foundation. Cuts or excavations to level sites are undesirable,
especially in low permeable, cohesive soil because long-term rebound can cause
substantial heave. Combination cut and fill earth work to level sites
aggravate differential movement from settlement of the fill and rebound of the
205
cut. Sites requiring cuts should be overcut and a minimum depth of 2 ft of
fill placed beneath the full area of the proposed foundation.
Soil Characterization
238. Soil strength and stiffness parameters such as the allowable
bearing pressure qal elastic soil Modulus ES, and the coefficient of
subgrade reaction ksf are required for design of mats on stable
(nonexpansive) soil. Additional parameters such as the depth of the active
zone for heave Z , edge moisture variation distance em, swell pressure aa '
and maximum potential swell ym are required for design in expansive soil.
Soil parameters are evaluated from a combination of in situ and laboratory
soil tests. Results of in situ tests will be a primary source of data for
soil that cannot be easily sampled such as cohesionless sands. In situ tests
and soil sampling should be conducted on each strata down to depths of twice
the least width of the proposed foundation or to the depth of incompressible
strata, whichever comes first. A minimum of three cone penetration tests, for
example, may be conducted initially for economically significant structures to
determine a preliminary classification of the soil and to provide a basis for
judging lateral variations in soil parameters. These tests should be located
at the center, corner and middle edge of the longest dimension of the proposed
structure. Other types of field tests such as standard penetration,
pressuremeter, and dilatometer tests may also assist the reasonable estimation
of soil parameters.
239. Several disturbed and undisturbed boring samples should be
obtained from each strata at locations of potential soil weakness such as
softened, loose, expansive, or collapsible soil depending on results of field
tests. Disturbed boring samples should be used to classify the soil in each
stratum. At least one consolidometer swell test described in EM 1110-2-1906
or ASTM D 4546 should be performed on soil from each strata with plasticity
indices PI greater than 15 and Liquid Limits greater than 35 to determine the
potential swell. Soil sampling should be conducted near the end of dry
periods to provide maximum estimates of swell pressure and potential heave.
240. Strength and stiffness. Field tests illustrated in Appendix G may
be used to estimate the soil shear strength, elastic modulus, and coefficient
206
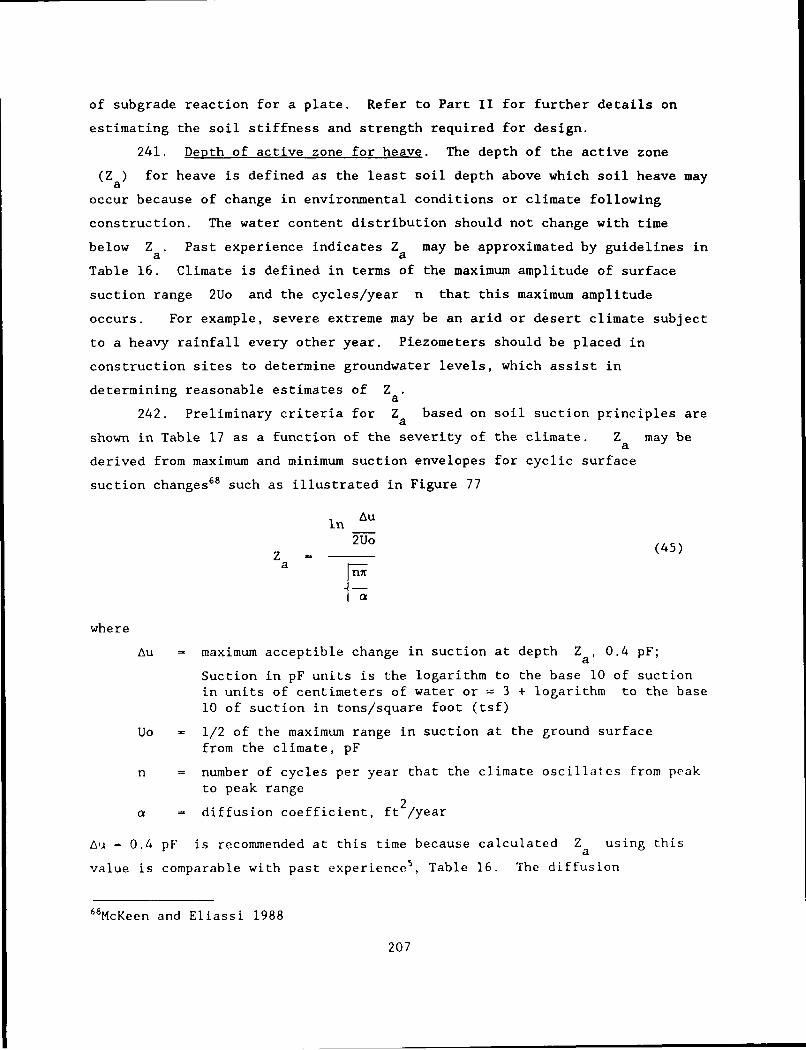
of subgrade reaction for a plate. Refer to Part II for further details on
estimating the soil stiffness and strength required for design.
241. Depth of active zone for heave. The depth of the active zone
(Z a) for heave is defined as the least soil depth above which soil heave may
occur because of change in environmental conditions or climate following
construction. The water content distribution should not change with time
below Z . Past experience indicates Z may be approximated by guidelines ina a
Table 16. Climate is defined in terms of the maximum amplitude of surface
suction range 2Uo and the cycles/year n that this maximum amplitude
occurs. For example, severe extreme may be an arid or desert climate subject
to a heavy rainfall every other year. Piezometers should be placed in
construction sites to determine groundwater levels, which assist in
determining reasonable estimates of Z a
242. Preliminary criteria for Za based on soil suction principles are
shown in Table 17 as a function of the severity of the climate. Z may bea
derived from maximum and minimum suction envelopes for cyclic surface
suction changes68 such as illustrated in Figure 77
In Au
Z 2Uo (45)a
whereAu - maximum acceptible change in suction at depth Z , 0.4 pF;
a'
Suction in pF units is the logarithm to the base 10 of suctionin units of centimeters of water or 3 + logarithm to the base10 of suction in tons/square foot (tsf)
Uo = 1/2 of the maximum range in suction at the ground surfacefrom the climate, pF
n = number of cycles per year that the climate oscillates from peakto peak range
a = diffusion coefficient, ft 2/year
Au = 0.4 pF is recommended at this time because calculated Z using thisa
value is comparable with past experience5 , Table 16. The diffusion
68McKeen and Eliassi 1988
207
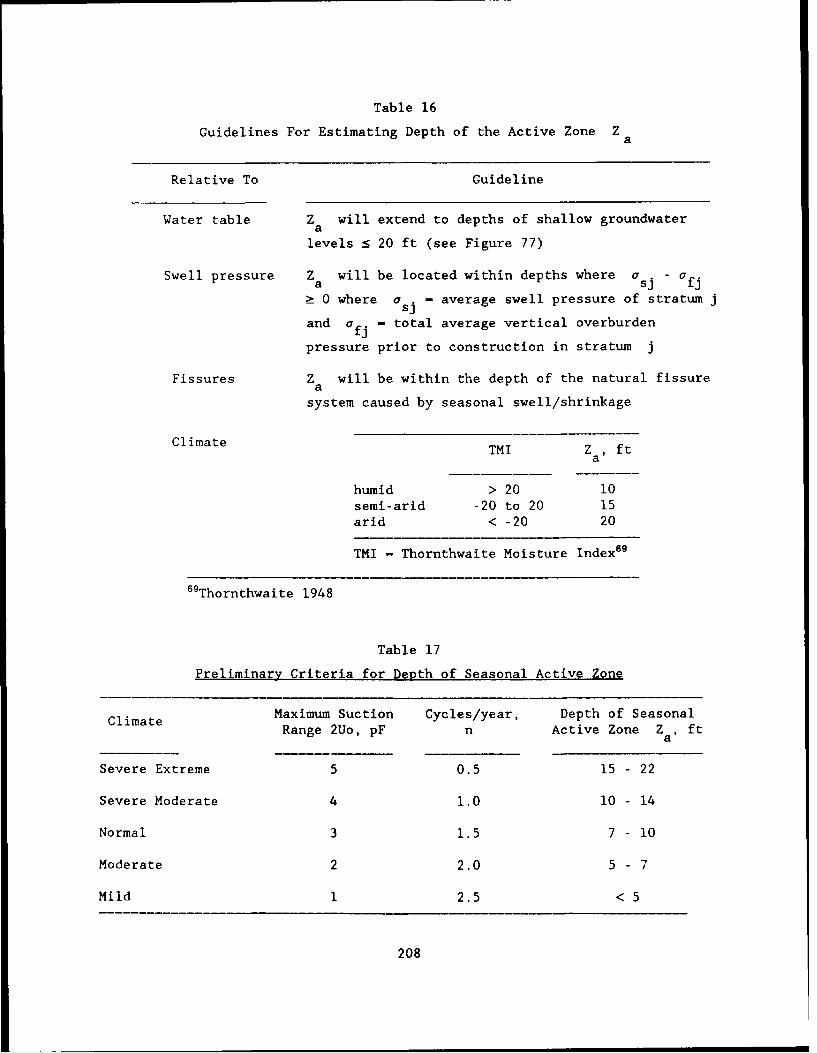
Table 16
Guidelines For Estimating Depth of the Active Zone Za
Relative To Guideline
Water table Z will extend to depths of shallow groundwatera
levels : 20 ft (see Figure 77)
Swell pressure Za will be located within depths where asj a fj
> 0 where asj - average swell pressure of stratum j
and afj - total average vertical overburden
pressure prior to construction in stratum j
Fissures Z will be within the depth of the natural fissurea
system caused by seasonal swell/shrinkage
Climate TMI Z fta'
humid > 20 10semi-arid -20 to 20 15arid < -20 20
TMI - Thornthwaite Moisture Index69
69Thornthwaite 1948
Table 17
Preliminary Criteria for Depth of Seasonal Active Zone
Climate Maximum Suction Cycles/year, Depth of SeasonalRange 2Uo, pF n Active Zone Zat ft
Severe Extreme 5 0.5 15 - 22
Severe Moderate 4 1.0 10 - 14
Normal 3 1.5 7 - 10
Moderate 2 2.0 5 - 7
Mild 1 2.5 < 5
208
FOUNDATION
WET PROFILE I METHOD 1:
Uf' 0
-- 10 - \ 0 20 FT
= DRY PROFILE
CL 2 0 !
METHOD 2:
U f y( z - Za)
30L-2 -1 0 1 2
PORE WATER PRESSURE U ,, TSF
a. SHALLOW GROUNDWATER LEVEL
FOUNDATION04
/<WET PROFILE
10/ Zo < 20 FT
28 DRY
0 PROFILE METHOD 31
U zU + Y -z ),
-2 -1 0 1 2
PORE WATER PRESSURE U., TSF
b. DEEP GROUNDWATER LEVEL
Figure 77. Anticipated equilibrium pore water pressure profiles
209
coefficient 2 ip a measure of the rate of moisture flow through soil and
related with the permeability by
au- k- (46a)
where
au - rate of change of suction head in feet with respect to 8, thefraction of volumetric water content, wG s/(100(l+e)
aO = rate of change of volumetric water contentw = water content, percent
G - specific gravitys
e = void ratio
A selected range of a from 60 to 120 2ft /year is consistent with
observation68 . The results of Table 17 are plotted in Figure 78a to show how
the seasonal active zone fluctuates with the severity of the range in suction.In situ diffusion coefficients a < 60 ft2/year will reduce Z and be above
2 a
the solid line in Figure 78a and a > 120 ft 2/year will increase Z and beabelow the dotted line. Table 17 must be confirmed from results of field
tests; this does not consider long-term wetting or drying of the soil profile.
243. Edge moisture variation distance. The edge moisture variation
distance em is the distance inside the mat from the perimeter that soil is
subject to variations in moisture. This parameter is not well known, but
experience appears to show that it may vary from 2 to 8 ft"l and become larger
with more severe climates. A more severe climate is associated with a dryer
environment thit occurs over longer periods of time before a heavy rainfall.
Larger fissures caused by greater drying (droughts) reduce the diffusion
coefficient a and increase the active zone depth Z . Parametric analysisa
of two-dimensional moisture flow beneath a ribbed mat 70 shows that the edge
moisture variation distance is a function of Z and the depth of thea
perimeter stiffening beam D, Figure 78b, and approximately
Ze - a - D (46b)
m2
Figure 78b must be confirmed from results of field tests.
70Vallabhan and Sathiyakumar
210
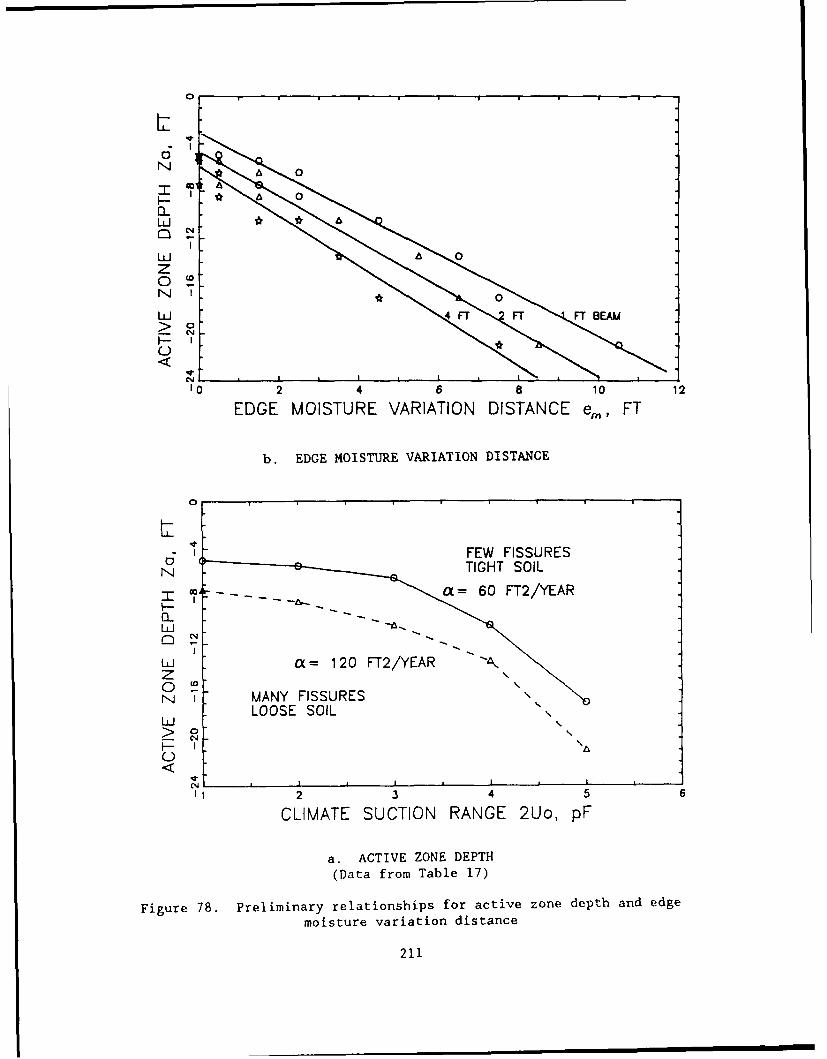
0
0
LU
LUJ
N 0
-N
F- I
N
WFE FFI"SURE U
-- n
I0 1 4 / 8 1o 12EDGE MOISTURE VARIATION DISTANCE em, FT
b. EDGE MOISTURE VARIATION DISTANCE
0
- I FEW FISSURESETIGHT SOIL
-r a-_ "60 FT2/YEAR
LU
LU O= 120 F-rYFR 4
Z
oIA MANY FISSURES R 2 ,
LOOSE SOIL N D
I- I "
(T.
('4 I * I I *
1 2 3 4 56
CLIMATE SUCTION RANGE 2Uo, pF
a. ACTIVE ZONE DEPTH(Data from Table 17)
Figure 78. Preliminary relationships for active zone depth and edge
moisture variation distance
211

244. Swell Pressure. Swell pressure a s, evaluated from results of
consolidometer swell tests71'72, should be determined down to the depth of the
active zone for heave Za
245. Potential Swell. Useful estimates of the anticipated heave m/
based on results from consolidometer swell tests can often be made. Computer
program HEAVE73 is useful for calculating potential heave beneath mat
foundations in multi-layered expansive soil. The anticipated heave is
n ef. - e h. (47a)j-1 1 + eoj 3
where
Y = maximum potential vertical heave, ft
h. = thickness of stratum j, ftJ
ef. = final void ratio of stratum j
eoj = initial void ratio of stratum j
n number of strata within the depth of heaving soil Za
The initial void ratio, which depends on a number of factors such as the
maximum past pressure, type of soil, and environmental conditions, may be
measured by standard consolidometer test procedures.
246. The final void ratio depends on changes in soil confinement
pressure and water content following construction of the structure; it may be
anticipated from reasonable estimates of the equilibrium pore water pressure
uwf, depth of active zone Z , and edge effects by rewriting Equation 47a ina'
terms of swell pressure
n C a.Ym Z sj . 1og 1 0 sj • h (47b)
j-1 1 + eoj 7fj
where
C sj - swell index of stratum Ias j - swell pressure of stratum j, tsf
7Engineer Manual 1110-2-1906, "Laboratory Soils Testing"72ASTM D4546
73 Johnson 1982
212

at. - final or equilibrium average effective vertical pressure off] stratum j, afj - Uwfj, tsf
afj - final average total vertical pressure of stratum J, tsf
Uwfj - equilibrium pore water pressure in stratum J, tsf
The swell index and swell pressure of the soil in each stratum may be
determined from results of consolidometer swell tests. Table 18 illustrates
the evaluation of the equilibrium pore water pressure. The equilibrium pore
water pressure is independent of the type of strata in the soil profile. An
application of the heave prediction method is provided in Chapter 5, EM 1110-
1-1904.
Design of Ribbed Mats
247. A useful procedure for design of stiffened ribbed mats in
expansive soil areas12 adopted in this report, Table 19, is a conservative and
simple methodology applicable to the beam on Winkler foundation concept. This
procedure inputs displacement values based on estimates of maximum
differential heave ymI and can provide useful calculations of bending
moments and shears based on reasonable input data. A computer program RIBMAT
is available from the Southwestern Division to assist analysis. The Post
Tensioning Institute method1' illustrated in Appendix F for building 333 is
recommended when conditions are satisfied, paragraph 77.
Input Parameters
248. Step 1 to determine input parameters may be accomplished using
Table 20 and results of laboratory and field soils tests with consideration of
past experience.
Foundation Plan
249. Step 2 to determine foundation plan dimensions and loads is
initially accomplished by knowledge of structural functional requirements and
minimun requirements described in Table 21. Some rules of thumb for line and
column loads described in Table 22 are based on a survey of engineering firms.
Tall multistory structures may have column loads exceeding 1000 tons. Column
spacings are often 20 to 25 ft or more. The average pressure per story of a
building often varies from 0.2 to 0.4 ksf.
213
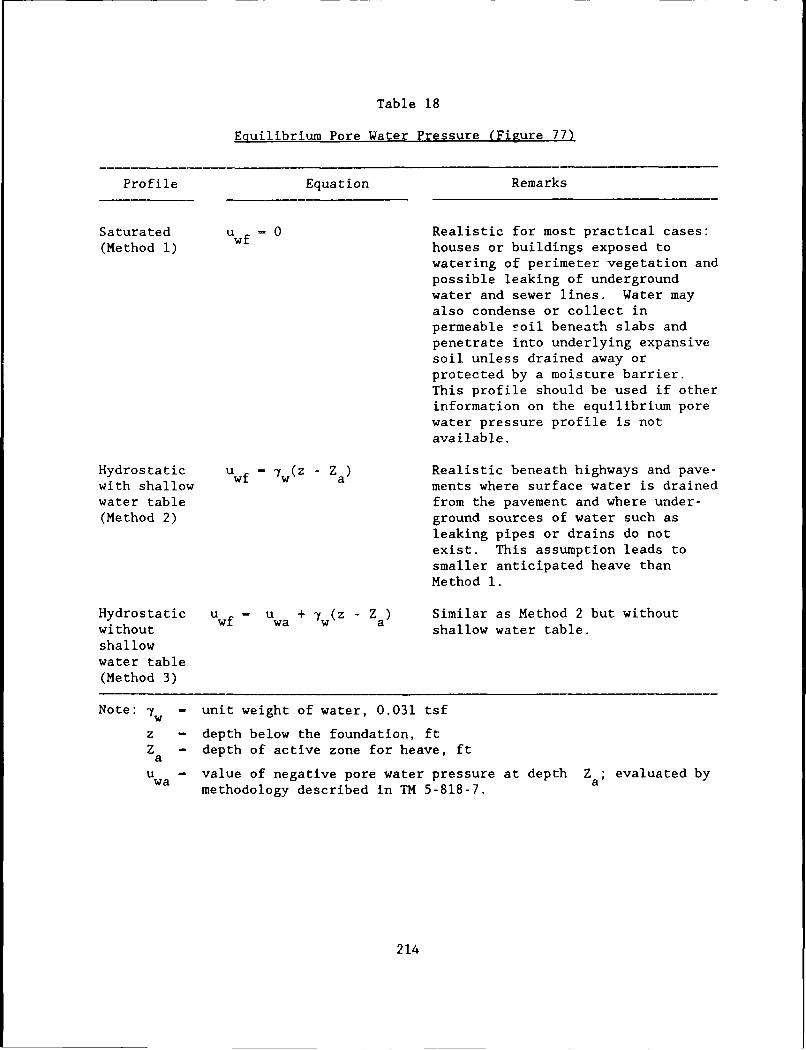
Table 18
Equilibrium Pore Water Pressure (Figure 77)
Profile Equation Remarks
Saturated u = 0 Realistic for most practical cases:(Method 1) houses or buildings exposed to
watering of perimeter vegetation andpossible leaking of undergroundwater and sewer lines. Water mayalso condense or collect inpermeable roil beneath slabs andpenetrate into underlying expansivesoil unless drained away orprotected by a moisture barrier.This profile should be used if otherinformation on the equilibrium porewater pressure profile is notavailable.
Hydrostatic uwf = -w(Z - Z ) Realistic beneath highways and pave-with shallow ments where surface water is drainedwater table from the pavement and where under-(Method 2) ground sources of water such as
leaking pipes or drains do notexist. This assumption leads tosmaller anticipated heave thanMethod 1.
Hydrostatic U wf Uwa + -w (z - Z a) Similar as Method 2 but withoutwithout shallow water table.shallowwater table(Method 3)
Note: 1w - unit weight of water, 0.031 tsf
z - depth below the foundation, ftZ - depth of active zone for heave, ft
a
Uwa - value of negative pore water pressure at depth Za; evaluated bymethodology described in TM 5-818-7.
214
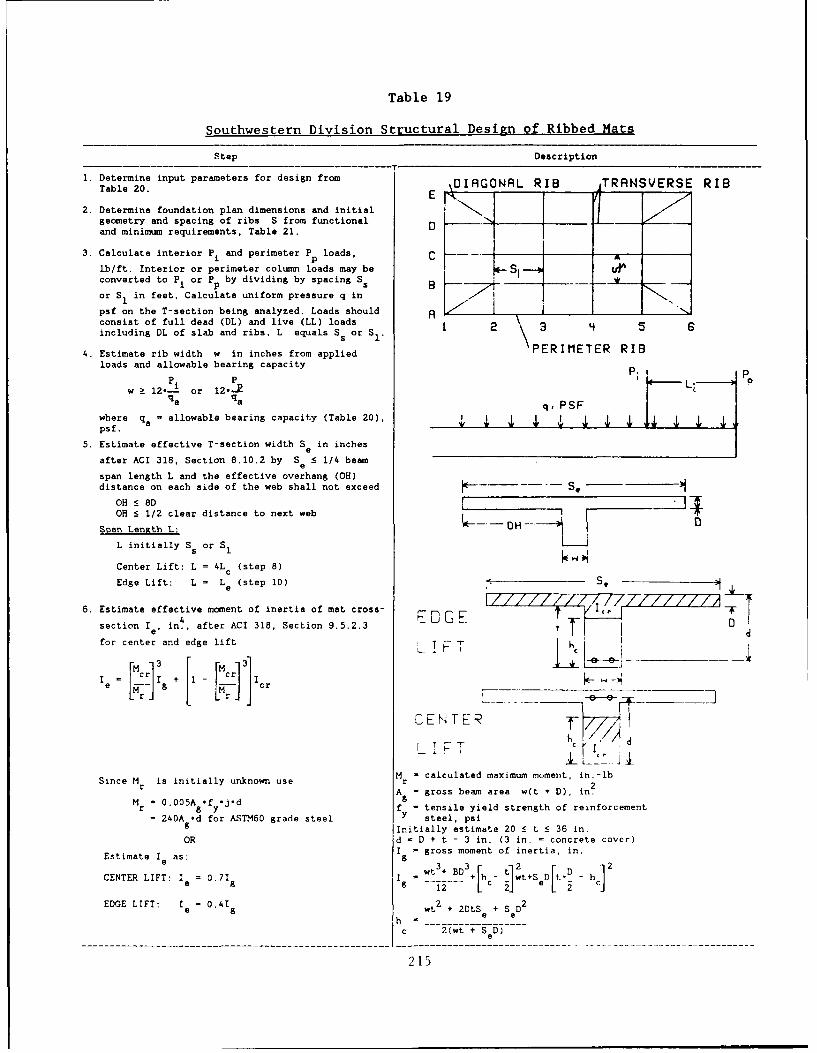
Table 19
Southwestern Division Structural Design of Ribbed Mats
Step Description
1. Determine input parameters for design fromTable 20. E OlRGONRL RIB TRRNSVERSE RIB
2. Determine foundation plan dimensions and initialgeometry and spacing of ribs S from functional _
and minimum requirements, Table 21.
3. Calculate interior P, and perimeter Pp loads, C
lb/ft. Interior or perimeter column loads may be I* - UA
converted to Pi or P by dividing by spacing S.
or SI in feet. Calculate uniform pressure q in
psf on the T-section being analyzed. Loads should Aconsist of full dead (DL) and live (LL) loads 1 2 3 '4 5 sincluding DL of slab and ribs. L equals Ss or S1 .
5
4. Estimate rib width w in inches from applied PERIMETER RIBloads and allowable bearing capacity P
w 12.- or 12"PLqa qa q PSF
where q =
allowable bearing capacity (Table 20), , , , j 4, ipsf.
5. Estimate effective T-section width S in inchese
after ACI 318, Section 8.10.2 by Se ' 1/4 beam
span length L and the effective overhang (OH)distance on each side of the web shall not exceed -. S.
OH 5 8D i-'iOH 5 1/2 clear distance to next web. DH - D
Span Length L:
L initially S or SI
Center Lift: L = 4L (step 8)c
Edge Lift: L = L e (step 10) e- e -_-- -
6. Estimate effective moment of inertia of mat cross- -0
section Ie, in., after ACI 318, Section 9.5.2.3 d
for center and edge lift TF T
L!T _]ra=[Z]g 3, 1 [Mc r]3] L. __
C E TER y 1
Since M is initially unnow use Mr = calculated maximum moment, in.-lb
r2M -A = gross beam area w(t + D), in.
r gfy f - tensile yield strength of reinforcement= 240A *d for ASTM60 grade steel y steel, psi
g Initially estimate 20 5 t 5 36 in.OR d D + t - 3 in. (3 in. = concrete cover)
Is gross moment of inertia, in.Estimate I as:g
I w t3 + BD 3 + 2 Dt2
CENTER LIFT: Ia = 0.7
1g Ig .9c- t]wt+Se D t+ - hc
EDGE LIFT: Ie 0.41 h wt2
+ 2DtS + SaD2
2(wt + Se )
215
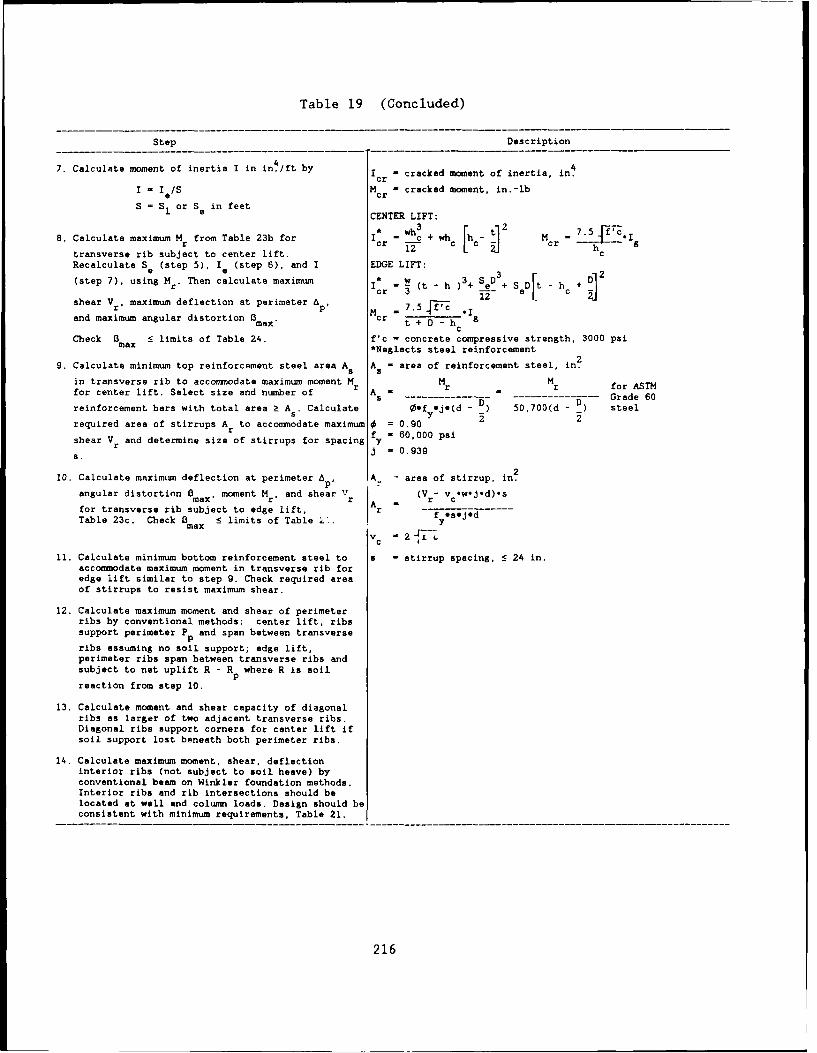
Table 19 (Concluded)
Step Description
7. Calculate moment of inertia I in in4/ft byi - cracked moment of inertia, in4Icr -cakdmmn fieta n
I - I e/S M = cracked moment, in.-lb
S -S1 or S in feete CENTER LIFT:* wh 3 2 b-5 Mrc.
8. Calculate maximum Mr from Table 23b forICr c + wh c [ M = oI
transverse rib subject to center lift. cRecalculate S (step 5), Ie (step 6), and I EDGE LIFT:
(step 7), using Mr" Then calculate maximum * W (t - h ) D3+ SIe D D h + D
hear V maximum deflection at perimeter A, M = . - 1I
and maximum angular distortion 3 max, cr t + D - hc
Check m 5 limits of Table 24. f'c concrete compressive strength, 3000 psimax *Neglects steel reinforcement
29. Calculate minimum top reinforcement steel area As A = area of reinforcement steel, in.
in transverse rib to accommodate maximum moment M M Mfor center lift. Select size and number of A - - Grade 60
reinforcement bars with total area ! As . Calculate *f yeje(d _ ) 50,700(d - _D) steel
required area of stirrups A to accommodate maximum g = 0.90r f 000 s
shear Vr and determine size of stirrups for spacing fy 60,000 psir 0.939
10. Calculate maximum deflection at perimeter Ap, A- area of stirrup, in2angular distortion max, moment Mr, and shear Vr (Vr- vc°w-j-d).s
for transverse rib subject to edge lift, Ar =Table 23c. Check Bmax 5 limits of Table '. ySOjd
v c
11. Calculate minimum bottom reinforcement steel to a " stirrup spacing, 5 24 in.accommodate maximum moment in transverse rib foredge lift similar to step 9. Check required areaof stirrups to resist maximum shear.
12. Calculate maximum moment and shear of perimeterribs by conventional methods: center lift, ribssupport perimeter Pp and span between transverse
ribs assuming no soil support; edge lift,perimeter ribs span between transverse ribs andsubject to net uplift R - R where R is soilPreaction from step 10.
13. Calculate moment and shear capacity of diagonalribs as larger of two adjacent transverse ribs.Diagonal ribs support corners for center lift ifsoil support lost beneath both perimeter ribs.
14. Calculate maximum moment, shear, deflectioninterior ribs (not subject to soil heave) byconventional beam on Winkler foundation methods.Interior ribs and rib intersections should belocated at wall and column loads. Design should beconsistent with minimum requirements, Table 21.
216

Table 20
Input Parameters For Design
Parameter Equation DescriptionT-r
Allowable See Factor of safety should be at least 3 orsoil bearing Table 7 settlement limited to less than 1 inchpressure qa,psf From Q C = average undrained shear strength of
Test: 2C u undisturbed soil sampled from base ofu rib; determined from undrained triaxial
Q test with confining pressure at ao, psf
a soil overburden pressure prior toconstruction, psf
Coefficient E E soil modulus of elasticity, psi;of subgrade s initial tangent or hyperbolic modulusreaction k , S determined from triaxial Q test withpci e confining pressure at ao .
S = equivalent width of T-section, in.,e from step 5, Table 19.
k B k - coefficient of subgrade reaction froms ps plate load test, pci (see Appendix G)1.5S e B = diameter of plate, in.
p
Clay Es, psi ks, pci Sand E, psi ks, pci
Soft 700-3500 40-90 Silty 1000-3000 90-170Medium 2000-7000 90-170 Loose 1400-3500 20-60jard 7000-14000 > 170 Medium 35-290
Densey 7000-12000 230-460
Clayey 110-290
Permissible range: 50 5 ks 5 200 pci
Edge Moisture Climate am, ft The permissible range ofVariation the edge moisture variationDistance em, Arid 8 distance is 2 to 8 ft; seeft _Semi-arid 6 Figure 78b for further
Humid 4 guidance on evaluating e
Soil swell a - a 0 -average soil swell pressure from resultspressure Psw' s 0 S of consolidometer swell test determinedpsf at the initial void ratio by ASTM D4546
on soil within the active zone Zbeneath the mat, psf a
= soil overburden pressure prior toconstruction, psf
Permissible range of P : 1000 to 8000 psfsw
Soil heave Za Ah = heave of 1 ft thickness of soil at depth
Ym' in. E Ah z beneath mat down to active depth Za,0 in.; soil subject to a prior toconstruction; Equation 47 may be used tocalculate ym; Z. may be estimated from
Table 16 and Figure 78a; refer to ASTMD4546 or EM1110-2-1906 to estimate Ahfrom results of consolidometer swelltests; assume saturated active zone(Method 1, Table 17 and Figure 77) wherelong term pore water pressure is zero;refer to MP GL-82-7 for calculation byprogram HEAVE; Ym may differ for center
and edge lift conditions; permissiblerange is 0.5 to 3.0 inches
217
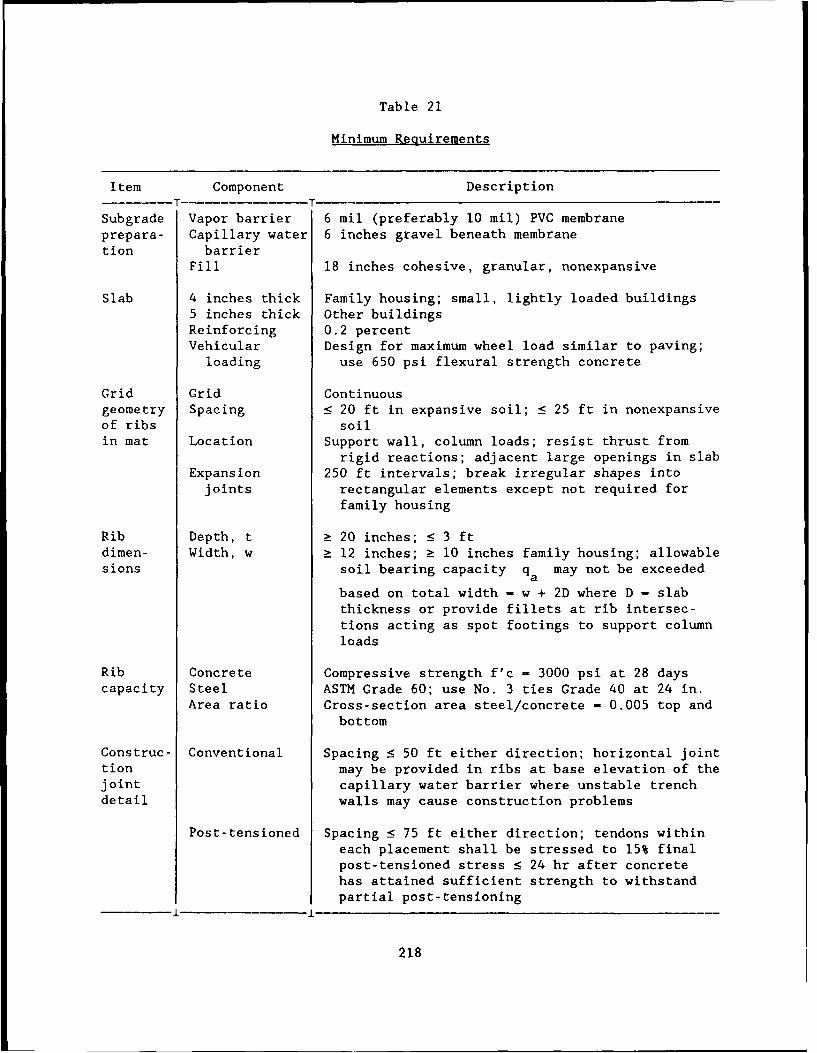
Table 21
Minimum Requirements
Item Component DescriptionT- - T -
Subgrade Vapor barrier 6 mil (preferably 10 mil) PVC membraneprepara- Capillary water 6 inches gravel beneath membranetion barrier
Fill 18 inches cohesive, granular, nonexpansive
Slab 4 inches thick Family housing; small, lightly loaded buildings5 inches thick Other buildingsReinforcing 0.2 percentVehicular Design for maximum wheel load similar to paving;
loading use 650 psi flexural strength concrete
Grid Grid Continuousgeometry Spacing S 20 ft in expansive soil; < 25 ft in nonexpansiveof ribs soilin mat Location Support wall, column loads; resist thrust from
rigid reactions; adjacent large openings in slabExpansion 250 ft intervals; break irregular shapes intojoints rectangular elements except not required for
family housing
Rib Depth, t a 20 inches; : 3 ftdimen- Width, w a 12 inches; 10 inches family housing; allowablesions soil bearing capacity q a may not be exceeded
based on total width - w + 2D where D - slab
thickness or provide fillets at rib intersec-tions acting as spot footings to support column
loads
Rib Concrete Compressive strength f'c - 3000 psi at 28 dayscapacity Steel ASTM Grade 60; use No. 3 ties Grade 40 at 24 in.
Area ratio Cross-section area steel/concrete - 0.005 top and
bottom
Construc- Conventional Spacing S 50 ft either direction; horizontal jointtion may be provided in ribs at base elevation of thejoint capillary water barrier where unstable trenchdetail walls may cause construction problems
Post-tensioned Spacing 75 ft either direction; tendons within
each placement shall be stressed to 15% final
post-tensioned stress : 24 hr after concretehas attained sufficient strength to withstand
partial post-tensioning
218

Table 22
Some Typical Loads on Foundations*
Structure Line Load, kips/ft Column Load, kips
Apartments 1 to 2 60
Individual 1 to 2 < 10housing
Warehouses 2 to 4 100
Retail Spaces 2 to 4 80
Two-story 2 to 4 80buildings
Multistory 4 to 10 200
buildings
Schools 2 to 6 100
Administration 2 to 6 100buildings
Industrial 100facilities
*Uniform total pressures are about 0.2 to 0.4 ksf/story, except housing
and apartments where pressures may be less.
219
Rib Dimensions
250. Rib dimensions are determined by steps 3 to 5 with the assistance
of Table 23. Reinforcement steel required to resist the calculated moments
and shears may be determined by steps 6 to 11. The calculated maximum
deflection should be checked to maintain angular distortions acceptable to the
functional requirements and compatible with the flexibility of the
superstructure, Table 24. Additional information on allowable deflections is
provided by ACI Committee 435 (1980). Perimeter, diagonal, and interior ribs
may be designed last, steps 12 to 14. An example application is provided in
Technical Report ITL-88-1.
Construction
251. A properly designed foundation can be expected to perform as
intended if the construction methodology avoids significant disturbance of the
foundation soil, the soil is of adequate bearing capacity, soil heave
potential is either reduced to tolerable levels or the effects are accounted
for in the structural/architectural details, and the foundation exceeds
flexural rigidity and strength requirements. The foundation soil and
groundwater characteristics should be adequately investigated to avoid
unexpected obstacles to construction such as underground streams, sinkholes,
boulders, poor site trafficability and drainage, unstable excavation slopes,
excessive heave of excavation bottoms, and loss ot ground adjacent to
excavations. Unforeseen problems caused by lack of prior subsurface
investigations of soil and groundwater conditions will increase the cost of
construction and may reduce quality of the foundation. Construction should be
located where the foundation is supported by a uniform soil of adequate
bearing capacity and resistant to differential movement on change in soil
water content. Foundation soils that are not laterally uniform aggravate
differential movement.
Minimizing Problems
252. Many problems with foundations of structures can be avoided by
using proper construction practice and adequate quality control of materials
and workmanship. Adequate field records are essential to confirm that
contract specifications are met. Specifications must be explicit and concise
220
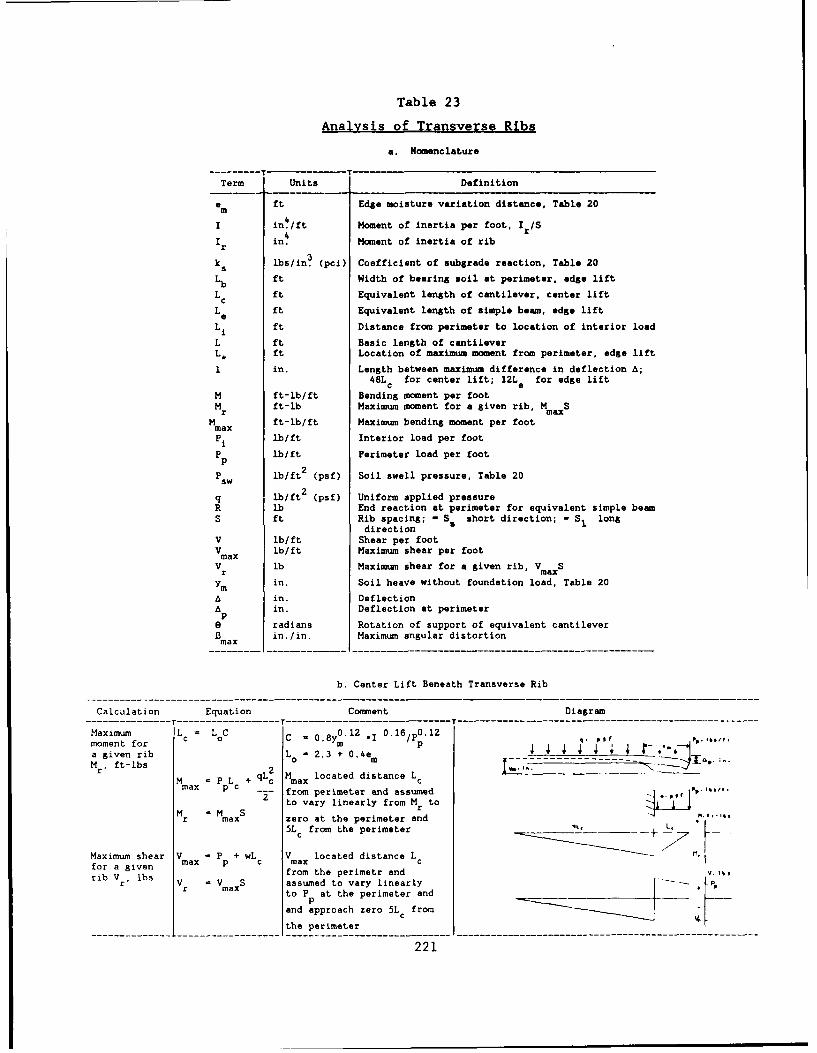
Table 23
Analysis of Transverse Ribs
a. Nomenclature
TTTerm Units Definition
• ft Edge moisture variation distance, Table 20
I in 4/ft Moment of inertia per foot, I /S
I in. Moment of inertia of rib
ks lbs/in (pci) Coefficient of subgrade reaction, Table 20
Lb ft Width of bearing soil at perimeter, edge lift
L ft Equivalent length of cantilever, center liftcL ft Equivalent length of simple beam, edge lifteLi ft Distance from perimeter to location of interior load
L ft Basic length of cantileverL. ft Location of maximum moment from perimeter, edge lift
1 in. Length between maximum difference in deflection A;48L for center lift; 12L for edge liftC a
M ft-lb/ft Bending moment per footM ft-lb Maximum moment for a given rib, M Sr max
M ft-lb/ft Maximum bending moment per footmaxPi lb/ft Interior load per foot
P lb/ft Perimeter load per footP
P lb/ft2 (psf) Soil swell pressure, Table 20
q lb/ft2 (psf) Uniform applied pressureR lb End reaction at perimeter for equivalent simple beamS ft Rib spacing; - S short direction; - SI long
directionV lb/ft Shear per footV lb/ft Maximum shear per footmaxV lb Maximum shear for a given rib, V Sr max
Ym in. Soil heave without foundation load, Table 20
A in. DeflectionA in. Deflection at perimeterP8 radians Rotation of support of equivalent cantilever3 in./in. Maximum angular distortionmax
b. Center Lift Beneath Transverse Rib
Calculation Equation Comment Diagram-------- r T----------- ----------- - ------- ----- T --- - -------- -- ------ ----- -- ------
Maximum Lc = LoC C = 0.8 0.12 .I 0 .16 /P0 12
moment for L=23m p .~a given rib 2 + 0.4eMr, ft-lbs2...T-
=PpL + q H located distance LcMm PLa Mamax P c from perimeter and assumed.j,,, 'ha,,.
to vary linearly from Mr to
M r f maxS zero at the perimeter and5Lc from the perimeter
Maximum shear Vma P + wL V located distance Lfor a given max P c maxrib V lbs from the perimetr and
rV = VmaxS assumed to vary linearlyto P at the perimeter and
and approach zero 5Lc from___1
the perimeter
221

Table 23 (Concluded)
Calculation Equation Comment DiagramT - -
Maximum Ap 0.11 + 12L 8 0.11 in. is an approximationdeflection at PC for support translation plusperimeter M1 .4 cantilever bending and 12A . in. max converts L to inches
p c9800I-k0 "5
a
Maximum 0 A /1 a s allowable angularangular max maxdistortion 1 - 4(12L ) distortion (Table 24)
amax
c. Edge Lift Beneath Transverse Rib
Calculation Equation Comment Diagram
Maximum 0.17 0.3 0.12 An iteration scheme is7.51'L i nsceesdeflection L = L p required to calculate LeAp, in. e 0.07 0.11 because A is unknown.q P* p
i Initially assume A p< Ym ---
R qL Pi(Le- Li) then calculate Le, R, _ _, _ _ _RP+ + a Lb.
p 2 Le and A . Repeat calculation Lb-e L
1.1R until last A is withinL .- R0.01 inch of previou A qpsf P, PP s/
If Pi- 0 or Li> Le , then
Ap- Ym(em - Lb)e 2 L 10.510.17 A0 .121q0.07 L -, ,, lbs/,m a P
Maximum 0 =A/L 0 allowable angular Mangular max max e 1 m ob I qdistortion distortion (see Table 24) M Imax 0;$S ;6. i
Moment calculated by
moment for M - L(R-Pp) - statics. R - P +miven rib p -2 Location Mmax, L - __P robo E-gie i ~Sheor I -IP ' ,M ,ft-lb M " M* If L < Lq VIbs
i O'S" '
M - M* - Pi(L-Li) If L ?: Li -; ...
Mmax _ (R pp)2
2q
M =M Sr max
Maximum V q(Li - Le) - P Distributed support fromshear for max soil reduces sheargiven rib V " VmS calculated near interiorVr , max support; hence, limitV as given
222
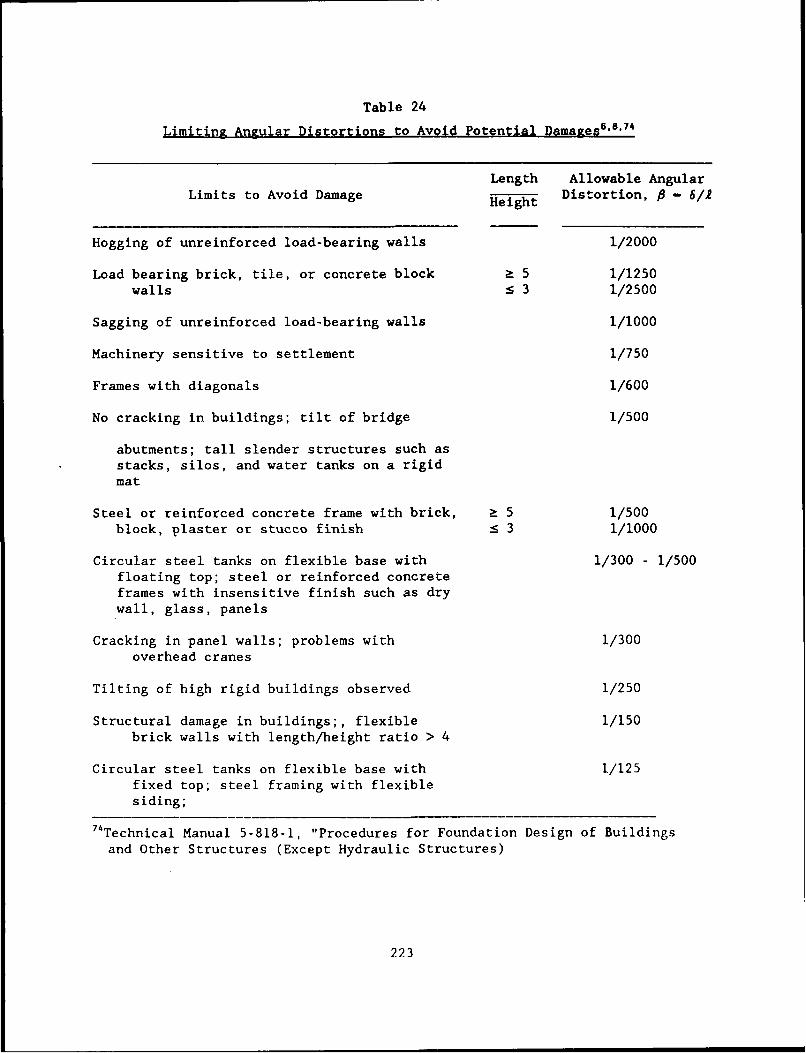
Table 24
Limiting Angular Distortions to Avoid Potential Damages56 8'74
Length Allowable Angular
Limits to Avoid Damage Height Distortion, - 1 /
Hogging of unreinforced load-bearing walls 1/2000
Load bearing brick, tile, or concrete block 2 5 1/1250walls s 3 1/2500
Sagging of unreinforced load-bearing walls 1/1000
Machinery sensitive to settlement 1/750
Frames with diagonals 1/600
No cracking in buildings; tilt of bridge 1/500
abutments; tall slender structures such asstacks, silos, and water tanks on a rigidmat
Steel or reinforced concrete frame with brick, > 5 1/500block, plaster or stucco finish : 3 1/1000
Circular steel tanks on flexible base with 1/300 - 1/500floating top; steel or reinforced concreteframes with insensitive finish such as drywall, glass, panels
Cracking in panel walls; problems with 1/300overhead cranes
Tilting of high rigid buildings observed 1/250
Structural damage in buildings;, flexible 1/150brick walls with length/height ratio > 4
Circular steel tanks on flexible base with 1/125fixed top; steel framing with flexiblesiding;
74Technical Manual 5-818-1, "Procedures for Foundation Design of Buildingsand Other Structures (Except Hydraulic Structures)
223
spelling out exactly what the contractor or construction engineer is expected
to accomplish. Records will also be an important source of factual data in
case lawsuits are filed seeking compensation for losses incurred by
contractors or by owners of the construction. Lack of explicit specifications
reduces quality and may leave the owner open to claims. Records will also be
useful if the structure becomes damaged at some future time to assist
determination of the cause of damages and appropriate remedial measures.
253. Preparation of foundation soil, engineered fill placement and mat
construction should be closely monitored by a responsible inspector,
geotechnical engineer, and/or representative of the owner/operator to confirm
that assumptions used by the designers actually occur in the field.
Parameters of the load bearing soils should be checked to be sure they are
similar to those used in the design, have sufficient bearing capacity, and
located at the expected depth. The unexpected detection of unstable soils
such as expansive, collapsible and soft materials should be brought to the
attention of the designers and owners of the project so proper adjustments may
be made to the structure. Construction materials should meet or exceed design
sp-cifications such as use of proper fill plasticity and density, reinforcing
steel of proper size and strength, and concrete of adequate strength and
workability.
254. Identification of soil. Foundation soils encountered during
construction should be identified, particularly if the soils are expansive or
collapsible, paragraphs 235 and 236. Observations of soils actually
encountered during construction will be used to confirm the assumptions made
by the designers and to check that the intent of the foundation design will be
accomplished during construction. Actual soil conditions that do not match
design assumptions will require modifications to the design to assure that the
foundation will perform adequately on the supporting soil over the projected
life of the facility. Examination of the condition and types of structures
adjacent to the construction site can provide additional information on the
foundation soils.
255. Maintenance of constant water content. Every practical procedure
should be taken to promote constant soil moisture and therefore maintain
adequate soil strength and bearing capacity. Deformation that occurs will
224
therefore be limited to the normal elastic recompression settlement. Changes
in water content can be minimized by promoting drainage, dewatering, and
construction efficiency. Adequate drainage will eliminate ponding of surface
water and reduce percolation of runoff into the foundation soil.
256. Rapid construction reduces time available for rainfall to occur
and collect in the foundation soil and reduces evaporation from prepared soil
bearing surfaces before the foundation can be placed. Construction efficiency
may be improved by having equipment and materials required for a particular
task at a convenient location adjacent to the site. All unnecessary items
should be removed from the construction site to reduce clutter and increase
mobility. Materials required for a particular construction sequence should be
ordered sufficiently in advance to be available on site prior to the time of
construction. Quality control and quality assurance must be maintained while
rapid construction is facilitated. Construction errors should be corrected as
soon as possible after they are made to reduce delay and cost. Delays can be
minimized by careful management including frequent checking for adequate
quality and frequent communication with subcontractors, construction workers,
and suppliers of equipment and material. Delays early in construction should
especially be avoided to prevent soil preparation work from "slipping" into
wet or adverse weather seasons.
Preparation for Mat Construction
257. The site should always be provided with adequate drainage to
promote runoff of rainfall and minimize change in soil moisture and subsequent
differential movement. Site drainage should provide dry working conditions on
firm soil surfaces. Trafficability should be adequate to promote mobility of
mechanized equipment. A granular fill layer up to 1 ft thick provides
temporary roads for rapid movement of equipment and materials into and out of
the site. This fill can also improve the grade to promote drainage and can
also exert a surcharge pressure on underlying foundation soil that can help
suppress swell pressures in the soil that develop on long-term wetting. Lime
and/or cement mixed into surface soil of low trafficability often increases
bearing capacity and site mobility. Site preparation work should be completed
prior to the wet season, without delay and with adequate quality control to
225
optimize performance of the foundation soil. Soil preparation work should
occur continuously until protected by the foundation of the structure to
reduce detrimental effects of rainfall and drying on the foundation soil.
258. Clearing the site. Existing trees and other vegetation removed
from the site may leave depressions. Depressions, holes, and trenches may
often be filled with the natural soil compacted at the natural water content
and density of the in situ soil to initially level the ground surface. Soil
removed in cuts should be minimized because cut areas reduce the overburden
pressure on underlying foundation soil, which also reduces the pore water
pressure in the soil. If the soil is relatively impervious such as for
cohesive materials, considerable time is required for these pore pressures to
increase to an equilibrium consistent with the surrounding area. Rebound and
a long-term time dependent heave may occur that will aggravate differential
movement over many years, particularly if the soil is expansive. A perched
water table may even develrp, if not already present, because previously
existing vegetation naav have desiccated the soil. Trees can desiccate soil to
depths exceeding 5J rc 60 ft. 75
259. Excavation. Prior to initiation of any excavation work, maps of
subsurface utilities should be investigated to determine the location and
types of utilities that will be encountered so accommodations may be made to
continue service and prevent damage to the utilities. During excavation work
unexpected as well as expected problems must be identified and dealt with such
as loss of slope stability, loss of ground, bottom heave, and groundwater.
Excavations should be completed to the design depth as rapidly as possible and
exposed soil protected from both wetting and drying. Equipment should be
selected to optimize removal of overburden soil depending on the size and
depth of the final excavation. Transportation equipment to remove overburden
to appropriate disposal areas should be selected depending on the rate of
excavation and haul distance. Table 25 provides an example of excavation
specifications.
260. The bearing soil at the design depth should be checked prior to
excavating to the design depth to be sure that this soil is satisfactory and
will support the foundation within allowable displacements. If this soil is
75Blight 1987
226
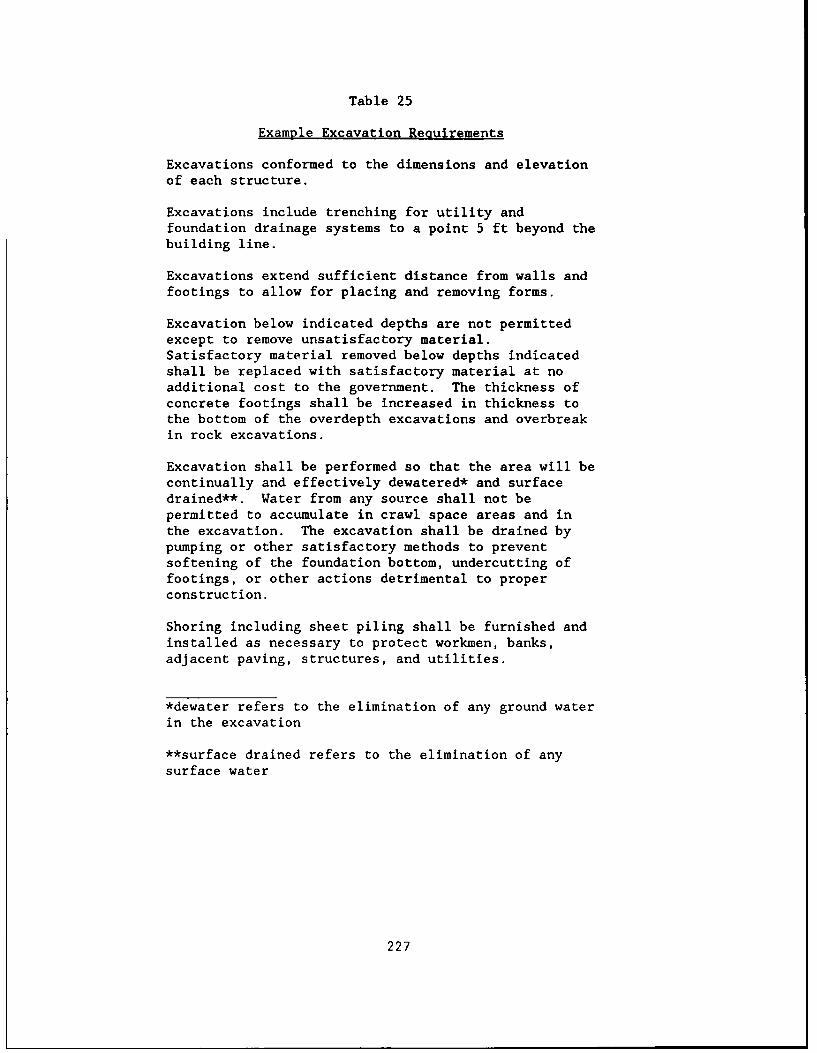
Table 25
Example Excavation Reouirements
Excavations conformed to the dimensions and elevationof each structure.
Excavations include trenching for utility andfoundation drainage systems to a point 5 ft beyond thebuilding line.
Excavations extend sufficient distance from walls andfootings to allow for placing and removing forms.
Excavation below indicated depths are not permittedexcept to remove unsatisfactory material.Satisfactory material removed below depths indicatedshall be replaced with satisfactory material at noadditional cost to the government. The thickness ofconcrete footings shall be increased in thickness tothe bottom of the overdepth excavations and overbreakin rock excavations.
Excavation shall be performed so that the area will becontinually and effectively dewatered* and surfacedrained**. Water from any source shall not bepermitted to accumulate in crawl space areas and inthe excavation. The excavation shall be drained bypumping or other satisfactory methods to preventsoftening of the foundation bottom, undercutting offootings, or other actions detrimental to properconstruction.
Shoring including sheet piling shall be furnished andinstalled as necessary to protect workmen, banks,adjacent paving, structures, and utilities.
*dewater refers to the elimination of any ground waterin the excavation
**surface drained refers to the elimination of anysurface water
227
not satisfactory, then this weak or soft soil must be excavated to a
sufficient depth beneath the proposed foundation depth and replaced with fill
compacted to a satisfactory density and bearing capacity. The depth of
overexcavation depends on the extent of unsatisfactory material and economics
of this situation. Some redesign of the foundation may be required if
unsuitable bearing soils are found and some delay and additional cost may
occur. A thorough soil investigation prior to construction should minimize
encountering this kind of problem.
261. After the final layer of soil to be excavated is removed, the
exposed surface of the load bearing soil should be immediately protected from
disturbance such as wetting or drying. This is especially critical with clays
and shales that may flake, spall, shrink, swell or otherwise deteriorate from
exposure to the atmosphere. A layer of concrete called a "mudslab" or a
permanent membrane may be placed on the exposed bottom of the excavation to
protect the soil. A chlorinated polyethylene membrane of about 10-mil
thickness may also adequately protect the soil surface. Asphalt coatings may
also be applied to protect the excavation bottom, but these may be sticky and
difficult to use.
262. The foundation and superstructure should be constructed as soon as
possible on the prepared surface of the excavation bottom to replace the loss
in pressure applied to the underlying soil from the excavated overburden.
Rapid construction and placement of the structural loads replace the original
soil weight and therefore reduce heave from rebound and subsequent settlement
and differential movement caused by recompression of the underlying soil.
263. Surface runoff from rainfall, groundwater seeping into the
excavation, and other sources of water must be drained from the site and
excavation. Ponded water must not be permitted to collect in open excavations
because this water will seep into the underlying soil and reduce its shear
strength. The soil may also expand with some or most expansion taking place
following construction of the foundation. Pumping equipment may be required
to dewater the excavation.
264. The excavation perimeter must be stable against a slope failure.
An open excavation in normally consolidated clay will stand vertically without
support for heights up to 4 times the undrained shear strength divided by the
228
wet density of the soil until drying and/or pore pressure recovery reduces the
mass strength. Loess and stiff glacial tills will stand vertically over long
periods. Moist sands and sandy gravels can stand vertically from cohesion
caused by negative pore water pressure. Dry sands and gravels will stand at
slopes equal to their angle of repose. Removal of lateral pressure, however,
may open fissures and exposure to the environment will cause deterioration and
may increase pore water pressure near the surface of the perimeter soil of the
excavation; slides may subsequently occur. Consideration should be given to
placement of a temporary impervious membrane or sprayed bituminous coating on
the exposed perimeter soil.
265. Pavements, facilities and other property near the excavation must
be protected. Property must be checked and their condition recorded prior to
any excavation. Periodic level readings of temporary benchmarks or stakes
placed around the perimeter and near existing structures and pavements should
be recorded to monitor loss of ground. Loss of ground or vertical settlement
on the ground surface outside the perimeter of an excavation exceeding 1/4
inch may indicate lateral deformation and creep of the perimeter into the
excavation, seepage of groundwater into the excavation, or heave of the
excavation bottom. Loss of ground should not exceed 1/2 inch or lateral creep
should not exceed 2 inches to avoid any damage to adjacent facilities.
266. Excavation slopes may be supported by inclined or horizontal
braces against vertical piles and sheet walls, closely-spaced cast-in-place
concrete drilled shafts, sheet pile walls with ground anchors, or reinforcing
the earth with steel rods driven through a facing material such as wood planks
or metal sheets. Excessive rebound of the excavation bottom may be reduced by
limiting the size of the excavation and constructing the foundation and
superstructure in several sections.
267. Fill placement. Cohesive, low plasticity fills compacted to a
density with adequate bearing capacity are commonly used to replace
unsatisfactory soil of low bearing capacity or soil of a swelling/collapsible
nature to depths of about 4 to 8 ft beneath the mat, raise the existing ground
surface to the final grade elevation, and place around the perimeter of
structures constructed in excavations. Materials selected for fills should be
sands and gravels containing a less than Number 40 mesh fraction of fines with
229
plasticity index less than 12 and liquid limit less than 35. Peats, organic
materials, silty sands and silts of high plasticity are not acceptable fill
materials.
268. The fill should have cohesion to allow construction of trenches
for ribs and utility lines with minimal form work. The cohesion also reduces
permeability of the fill and minimizes seepage of surface water down into the
natural stratum beneath the fill. Seepage into a pervious fill overlying a
relatively impervious natural stratum can contribute to a perched water table
in the fill and may lead to long-term differential movement if the underlying
stratum is desiccated expansive or collapsible soil. Table 26 provides an
example fill specification.
269. Sufficient laboratory classification and compaction tests should
be performed during the site and soil exploration program to identify
potential fill materials, to assure adequate quantities and to determine
compaction characteristics of the various materials available in the borrow
areas. Accurate identification by Atterberg limit and gradation tests assist
selection of appropriate fill material and water content limits required to
achieve adequate density and bearing capacity of a particular fill. The fill
should be uniform in the horizontal direction to minimize differential
movement of the mat foundation. Compaction effort normally required for
cohesive fill is at least 90 percent of optimum density determined by the
compactive effort described in ASTM D 1557. This high compactive effort is
comparable with modified AASHTO. For the low plasticity fills of plasticity
index < 12 often reconmended beneath structures compaction should be at least
92 percent of optimum density. Laboratory tests should be performed prior to
construction on the proposed fill material to be sure that the plasticity,
stiffness and strength of the compacted fill will provide optimum performance
of the foundation.
270. The first fill layer following compaction should be checked to
meet density and material specifications such as those in Table 26.
Substantial delays can and will occur if unsatisfactory compacted material
must be removed and replaced with satisfactory material. In situ density
tests such as ASTM D 1556 should be performed to check the density and used to
calibrate surface moisture nuclear gages. Numerous surface moisture gage
230
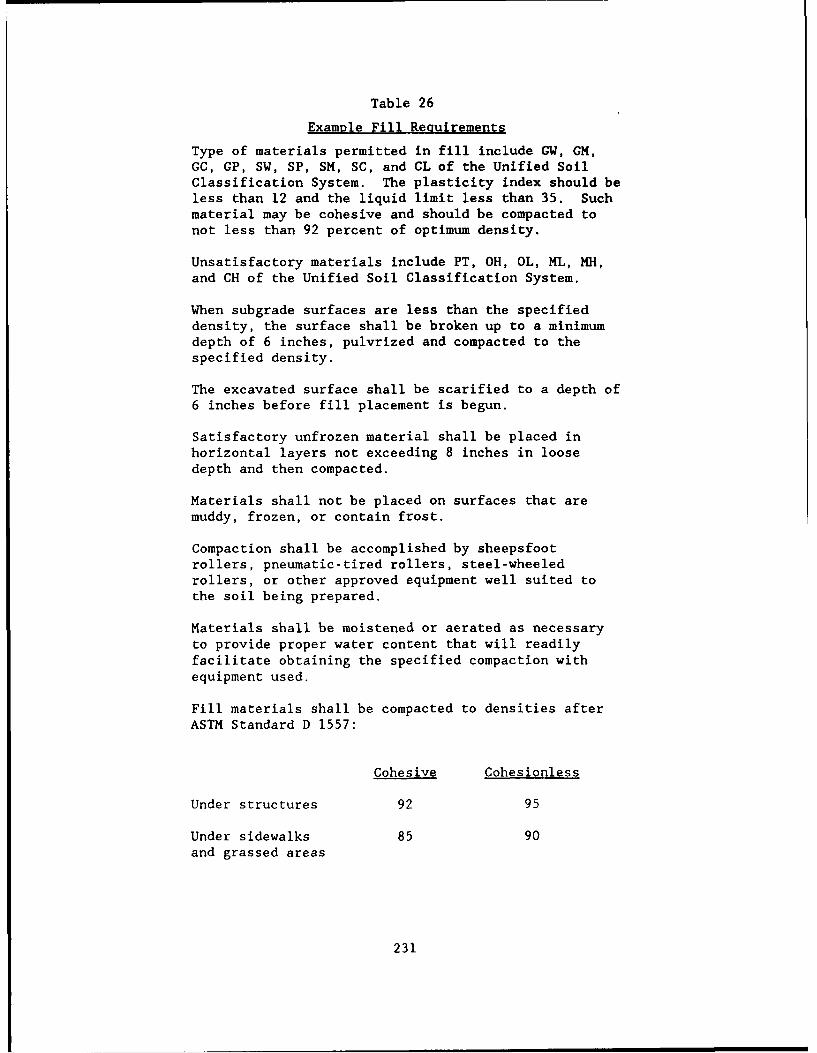
Table 26
Example Fill Reguirements
Type of materials permitted in fill include GW, GM,GC, GP, SW, SP, SM, SC, and CL of the Unified SoilClassification System. The plasticity index should beless than 12 and the liquid limit less than 35. Suchmaterial may be cohesive and should be compacted tonot less than 92 percent of optimum density.
Unsatisfactory materials include PT, OH, OL, ML, MH,and CH of the Unified Soil Classification System.
When subgrade surfaces are less than the specifieddensity, the surface shall be broken up to a minimumdepth of 6 inches, pulvrized and compacted to thespecified density.
The excavated surface shall be scarified to a depth of6 inches before fill placement is begun.
Satisfactory unfrozen material shall be placed inhorizontal layers not exceeding 8 inches in loosedepth and then compacted.
Materials shall not be placed on surfaces that aremuddy, frozen, or contain frost.
Compaction shall be accomplished by sheepsfootrollers, pneumatic-tired rollers, steel-wheeledrollers, or other approved equipment well suited tothe soil being prepared.
Materials shall be moistened or aerated as necessaryto provide proper water content that will readilyfacilitate obtaining the specified compaction withequipment used.
Fill materials shall be compacted to densities afterASTM Standard D 1557:
Cohesive Cohesionless
Under structures 92 95
Under sidewalks 85 90and grassed areas
231
readings can subsequently be made following compaction of additional layers of
fill. Nuclear gages should be periodically checked with results of ASTM D
1556 or other appropriate density measurement method performed on compacted
fill. If inclement weather stops the fill operation, then upon resuming work
the top layer of compacted fill affected by rainfall should be scarified until
the correct range of water content is achieved before recompacting and
continuing with fill placement.
271. Construction of stiffening beams. Trenches for construL Ion of
stiffening beams and utilities may be excavated in the cohesive granular fill
using a trenching machine capable of a minimum width of 12 inches and depths
up to at least 3 ft below grade. Widths of 18 inches or more are usually
required to accommodate placement of steel reinforcement in the beams.
272. Vapor barriers. Vapor barriers such as plastic films may be
placed in trenches and beneath slabs. These barriers prohibit accumulation of
moisture into the concrete with possible sweating of this moisture up through
the concrete to the surface of the floor. This is especially important where
compacted fills of relatively high permeability have been placed over
relatively impervious natural soil. Groundwater tends to accumulate in these
fills. Plastic films should be checked to be free of punctures, holes, and
other leaks before placing the concrete.
273. Plastic films also prevent loss of moisture into underlying soil
from the concrete mix; therefore, the concrete mix should not contain excess
water to minimize drying shrinkage. Drying shrinkage occurs at the surface of
the mat and may cause some upward curling at the edges or joints. Stiffening
beams at the perimeter and expansion joints of the mat foundation can
effectively reduce curling. Vapor barriers should be placed snugly against
trench walls to avoid any gaps between the trench walls and the membrane; the
concrete stiffening beams otherwise will not have the correct shape and
dimensions required to resist bending moments. Incorrectly placed vapor
barriers must be removed or corrected to allow stiffening beams to form with
the correct dimensions.
274. Reinforcement steel. Steel reinforcement should be placed in the
proper location to provide adequate concrete cover and optimum bending moment
resistance. Reinforcement steel should be ASTM Grade 60, except Grade 40 may
232
be used for ties. Refer to Chapter 4.7, ACI 302 (1980) for further details on
reinforcement steel. Steel tendons and anchors for post-tensioned concrete
must be properly supported and means provided for holding post-tensioning
anchorage assemblies in place. Concrete near anchors should be reinforced
with additional steel. The post-tensioning stress should be applied as soon
as the concrete reaches its design strength. Columns should have sufficient
freedom to move laterally when the post-tensioning stress is applied. Proper
post-tensioning requires careful control of construction under expert
supervision.
275. Concrete. Concrete should be of the correct composition to
provide the design strength, which is usually 3000 psi after 28 days. The
slump should be 4 to 6 inches and no water should be added to the mix after
leaving the batch plant. Further details on concrete for building
construction are in the literature76.
276. Excess water cannot drain out of concrete placed on impervious
membranes. Water reducing admixtures (ASTM C494) may be added to increase
workability, reduce water required to obtain the desired slump, and thereby
increase strength of the finished concrete. Concrete shrinkage may be reduced
by using cement with lower water demand such as Type I and coarse aggregates
that do not shrink when dried66 . High range water reducers or
superplasticizers are prohibited in guide specification CEGS 03300. Mats
supporting large structures are commonly constructed in sections where
concrete is placed on portions of the foundation area, while excavation and
preparation of the bearing soil surface proceeds in other areas. Concrete
should be adequately cured before removal of forms and before permitting
traffic on the mat. Refer to TM 5-818-7 for further construction details on
expansive soil.
277. Concrete for large ribbed mats may be placed in one or two stages.
If placed in two stages, the first stage is to place concrete for the
stiffening beams followed a few days later with concrete for the remaining
mat. The exposed concrete surface on the stiffening beams must be kept clean
to allow the fresh concrete to adhere to concrete placed earlier. The
76Corps of Engineers Guide Specification (CECS) 03300, ACI 302 (1980),Technical Manuals 5-809-2 and 5-809-12
233
finishing of concrete is important in obtaining sufficient levelness and
flatness of the floor to optimize operational efficiency. Guidelines for the
degree of floor flatness/levelness required to achieve adequate operational
efficiency, however, are not complete. A standard recommended for specifying
floor flatness/levelness is the F-number system77.
Site Finishing
278. Site finishing involves connection of utility lines, backfill of
open excavations, installation of drainage systems, and landscaping. Utility
connections to outside lines should be flexible and watertight. Backfill
materials should be nonexpansive with low permeability to inhibit migration of
surface moisture down to soil with potential for volume change.
279. The site should be graded to provide at least a 1 percent slope
from the perimeter of the structure for positive drainage. A 5 percent slope
should be provided for at least 10 ft from the perimeter of the structure for
foundations on potentially expansive soil to promote rapid runoff of surface
water. Fill placed to raise structures above the original ground surface
contributes to a positive grade for drainage and reduces differential
movements from volume changes in nonuniform foundation soils. The structure
should be provided with gutters and downspouts to collect rainfall. Runoff
from downspouts should be directed on to splash blocks at least 5 ft long and
sloped for positive drainage from the structure. Impervious horizontal
moisture barriers or membranes about 10 ft wide placed around the perimeter
and protected by 6 inches of fill helps to promote uniform changes beneath the
mat and moves the edge moisture variation distance out from beneath the
foundation. These should be placed at the end of the wet season. Underground
perforated drain lines adjacent to mats placed in excavations to collect
seepage should be constructed with a 1 percent slope to avoid water ponding in
the line. The drain must be connected to an outlet to drain seepage collected
around the foundation. An impervious membrane placed beneath the drain will
minimize seepage into desiccated subsoil. Underground drains, however, are
usually not recommended because they have been a source of moisture into
expansive/collapsible subsoils aggravating differential foundation movements.
77Face 1987, ASTM E 1155
234
Followup
280. The foundation and superstructure should be observed periodically
to evaluate performance of the structure. Table 27 illustrates a preliminary
systematic record system for rating performance of foundations. Table 27a
defines the type of movement, whether center mound (center heave) or center
dish (edge heave or center settlement) expected depending on the type
of observed cracks. Table 27b allows the observer to evaluate the angular
distortion I from the measured crack dimensions and to rate the distress.
Cracks, distortions, and other structural deterioration should be recorded
similar to that illustrated in Table 27c. The type of movement, £ estimate,
and level of distress may also be entered in Table 27c. A floor and wall plan
of the facility should also be attached to Table 27 to complete the damage
record. The grade around the perimeter should be checked for adequate slope
and control of erosion. The grade may become impaired with time around the
perimeter from settlement of backfill or heave of in situ expansive soil. An
expansive soil is not restrained from heave outside the perimeter and may
destroy the grade. Eventually, rainfall may be directed toward the foundation
until positive drainage is restored.
235

Table 29
Preliminary
SYSTEMATIC DAMAGE RECORD SYSTEMFor Record of Differential Movement in Foundation Soils
a. Type of Movement
Component Distress Center Mound Center Dish
Exterior Horizontal - near top (roof restraint) XWalls Cracks - wall bulging out X
- wall bulging in X
Vertical - larger near top, more XCracks frequent near top
- larger near bottom, start X
near bottom
Diagonal - up toward corner fromCracks bottom of wall X
- up toward corner fromtop of window X
- down away from window X
- up from corner X- radiate up toward interior X
Slabs Tilting up toward center of facility XTilting up toward perimeter XCracks parallel with wall, larger at
top surface X
Deep Fractured - near center of facility XFoundation Plinths - near edge of facility X
b. Damage Rating
Hand Level Readings Crack Widths
6, Width, in. Degree of DamageVertical Change Distress
Level Length < 1/8 Slight1/8 - 1/4 Minor
> 1/150 Structural damage 1/4 - 1/2 Mild> 1/250 Inconvenience to 1/2 - 3/4 Moderate
occupants > 3/4 Severe> 1/500 Cracking
236
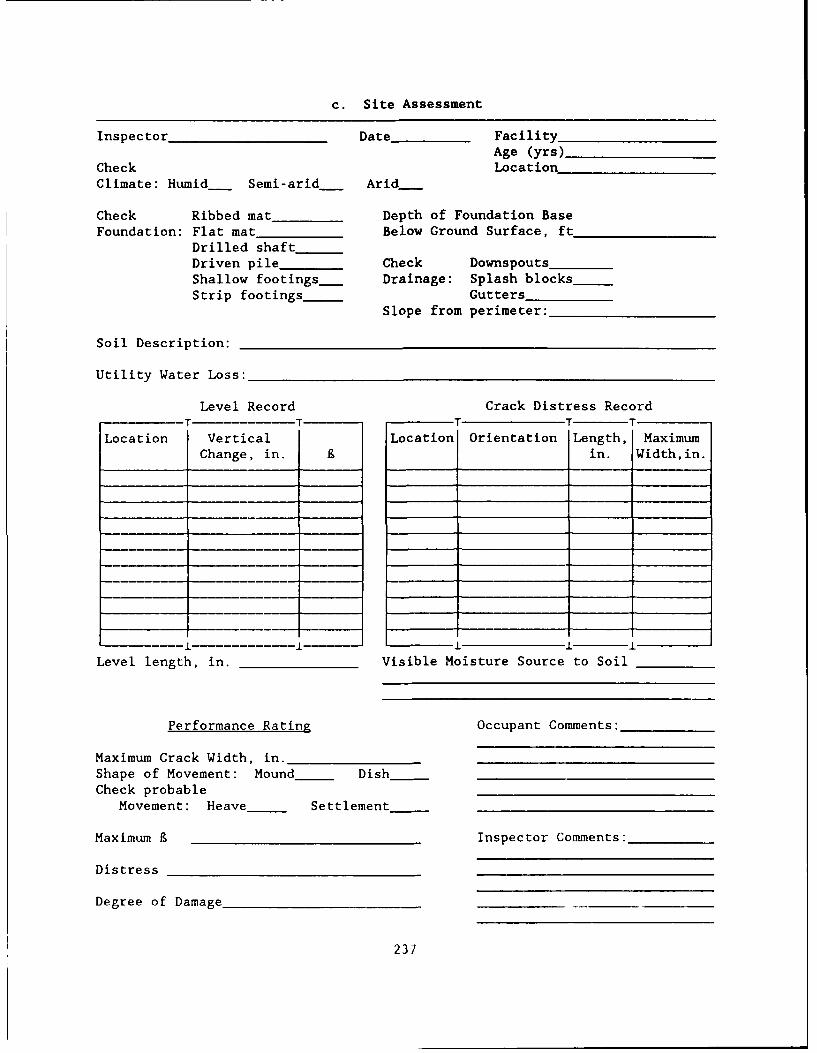
c. Site Assessment
Inspector Date FacilityAge (yrs)
Check LocationClimate: Humid Semi-arid Arid___
Check Ribbed mat Depth of Foundation BaseFoundation: Flat mat Below Ground Surface, ft
Drilled shaftDriven pile_ __ Check DownspoutsShallow footings Drainage: Splash blocksStrip footings Gutters
Slope from perimeter:
Soil Description:
Utility Water Loss:
Level Record Crack Distress RecordT T T T - T
Location Vertical Location Orientation Length, MaximumChange, in. in. Width,in.
- ±
Level length, in. Visible Moisture Source to Soil
Performance Rating Occupant Comments:
Maximum Crack Width, in.Shape of Movement: Mound DishCheck probable
Movement: Heave Settlement
Maximum 9 Inspector Comments:
Distress
Degree of Damage
237
PART VI. RECOMMENDATIONS
281. A systematic damage record system to document foundation
distortion, distress in facilities, and maintenance requirements should be
fully developed in preparation of field surveys of constructed facilities to
catalog damages to structures and therefore make possible progress in
identifying the cause of damage, requirements for repair and efficiency of
operations, particularly the impact of foundation movement on machinery and
robotic equipment. Field surveys should subsequently be performed to measure
surface displacements inside and outside of existing structures and to rate
the performance of structures using the frequency spectrum method with the
systematic performance record system. The specific floor flatness/levelness
requirements to provide optimum performance of facilities should be
determined. Guidelines may then be implemented to minimize these damages and
their effects on short and long-term structural performance and aid in
reducing repair and long-term maintenance.
282. Research is recommended to determine methods for reducing soil
movement by ground modification or soil moisture stabilization and therefore,
to reduce requirements of designing foundations to resist soil movements.
Research and development efforts are necessary to verify the effectiveness of
soil moisture stabilization, establish criteria for stabilization, establish
structural criteria for mats on moisture-stabilized soils, and develop
construction details for perimeter moisture barriers.
283. Research is recommended to investigate the problem of cracking
during construction of ribbed mats. Drying shrinkage in stiffening beams,
which may let the ribs hang in the trenches, may be a factor in cracking.
Research may be useful to recommend spacing of construction joints,
acceptability of joints between stiffening beam ribs and slabs, location of
the membrane vapor barrier, concrete strength and mix design, percent and
location of reinforcement, and curing methods.
284. Research is recommended to determine proper specifications for
preparation and compaction of low plasticity, nonexpansive, cohesive fills
commonly placed to support ribbed mats and other shallow foundation systems.
Current specifications for compaction of cohesive clays and cohesionless sands
may not be appropriate for these engineered fills.
238
285. A field survey of Corps of Engineers division and district
offices, real estate developers, contractor organizations, casualty insurance
writers, private consultants, and educational institutions is recommended to
collect a detailed list of all design/construction procedures and local
practices for ground modification and soil moisture stabilization in unstable
(expansive/collapsible,soft) soil areas. These practices should be rated to
determine their relative usefulness in providing economical and adequate
guidelines for design and construction of foundations in unstable soils.
286. Centrifuge and/or field tests should be performed with unstable
soil to confirm and improve appropriate soil input parameters for design such
as the active depth of heave, edge moisture variation distance, potential soil
heave and to obtain information on a fundamental new parameter, the maximum
acceptable change in suction at the lower boundary of the depth of soil
subject to heave. The centrifuge can simulate a full scale field test by
subjecting a small model to acceleration such that the field situation is
simulated. A sequence of events such as placement of loads and diffusion of
moisture of a full scale test can be simulated rapidly in the centrifuge so
that the distribution of volume changes and vertical displacements from
applied loads and moisture changes can be observed in just a few days rather
than months or years required in the field. Costs can be substantially
reduced by eliminating many full scale field test sections with associated
instrumentation and monitoring and analysis of data over a long period of
time. Field test sections in different climates will validate design
guidelines for general applications. These tests may be used to analyze the
effectiveness of ground modification techniques and the ability of design
methodology to predict behavior of the foundation in the soil. Guidelines for
ground modification techniques that reduce potential volume changes leading to
the design and construction of more economical foundation systems may
subsequently be developed.
287. Two- or three-dimensional soil-structure interaction models such
as the plate on elastic foundation, frequency spectrum model for mats or other
model shown to reasonably simnulate field behavior may be improved to aid the
analysis and design of mat foundations in unstable soil. Foundary elements,
which are particularly appropriate for moisture diffusion problems, as well as
the finite element method may be considered in analyses.
239
REFERENCES
ACI Committee 302. 1980. "Guide for Concrete Floor and Slab Construction",Construction Practice and Inspection Pavements, Part 2, ACI Manual of ConcretePractice, American Concrete Institute, Detroit, MI
ACI Committee 318. 1980. "Part 4-General Requirements", Use of Concrete inBuildings: Design, Specifications, and Related Topics, Part 3, ACI Manual ofConcrete Practice, American Concrete Institute, Detroit, MI
ACI Committee 336. 1987. "Suggested Design Procedures for Combined Footingsand Mats", American Concrete Institute Committee 336, American ConcreteInstitute, Detroit, MI
ACI Committee 340. 1977. "Slab Design In Accordance With ACI 318-77",Supplement To Design Handbook In Accordance With The Strength Design Method,ACI Publication SP-17 (73)(S), American Concrete Institute, Detroit, MI
ACI Committee 435. 1980. "Allowable Deflections," Use of Concrete inBuildings: Design. Specifications, and Related Topics, Part 3, ACI Manual ofConcrete Practice, American Concrete Institute, Detroit, MI
ACI Committee 436. 1966. "Suggested Design Procedures for Combined Footingsand Mats," Journal of the American Concrete Institute, Reported by S. V.DeSimone, Vol 63, Detroit, MI, pp 1041-1056
Ahlvin, R. G. and Ulery, H. H. 1962. "Tabulated Values for Determining theComplete Pattern of Stresses, Strains, and Deflections Beneath a UniformCircular Load on a Homogeneous Half Space," Stress Distribution in EarthMasses, Highway Research Board Bulletin 342, NAS-NRC, Washington, D. C., pp 1-13
Annual Book of ASTM Standards. 1988. "Chemical Admixtures For Concrete,"
ASTM Standard Specification C494-86, Concrete and Aggregates, Part 04.02,American Society for Testing and Materials, Philadelphia, PA
' 1988. "Bearing Capacity of Soil for StaticLoad on Spread Footings," ASTM Standard D1194-72, Soil and Rock BuildingStones; Geotextiles, Volume 04.08, American Society for Testing and Materials,Philadelphia, PA
1988. "Density of Soil in Place by the Sand-Cone Method," ASTM Standard Test Method D1556-82, Soil and Rock: BuildingStones: Geotextiles, Volume 04.08, American Society for Testing and Materials,Philadelphia, PA
1988. "Moisture-Density Relations of Soilsand Soil-Aggregate Mixtures Using 10-lb (4.54-kg) Rammer and 18-in. (457-mm)Drop." ASTM Standard D1557-78, Soil and Rock: Building Stones: Geotextiles,Volume 04.08, American Society for Testing and Materials, Philadelphia, PA
240
. 1988. "Penetration Test and Split-Barrel
Sampling of Soils," ASTM Standard D1586-84, Soil and Rock: Building Stones:Geotextiles, Volume 04.08, American Society for Testing and Materials,Philadelphia, PA
1988. "Deep, Quasi-Static, Cone and Friction-Cone Penetration Tests of Soil," ASTM Standard D3441-79, Soil and Rock:Building Stones: Geotextiles, Vol 04.08, American Society for Testing andMaterials, Philadelphia, PA
. 1988. "One-Dimensional Swell or Settlement
Potential of Cohesive Soils," ASTM Standard D4546-85, Soil and Rock: BuildingStones: Geotextiles, Vol 04.08, American Society for Testing Materials,Philadelphia, PA
1988. "Pressuremeter Testing -f Soils," ASTM
Standard D4719-87, Soil and Rock: Building Stones: Geotextiles, Vol 04.08,American Society for Testing Materials, Philadelphia, PA
.. 1988. "Standard Test Method for Determining
Floor Flatness and Levelness Using the F-number System", E1155-87, BuildingSeals and Sealants: Fire Standards: Building Constsructions, Vol 04.07,American Society for Testing and Materials, Philadelphia, PA
Baquelin, F., Jezaquel, J.-F., and Shields, D. H. 1978. The Pressuremeterand Foundation Engineering, Trans-Tech Publications, Rockport, MA
Bathe, K., Peterson, F., and Wilson, E. 1978. "SAP5-WES Structural AnalysisProgram," Program No. 713-F3-R0012, U. S. Army Engineer Waterways ExperimentStation, Vicksburg, MS
Blight, G. E. 1987. "Lowering of the Groundwater Table by Deep-RootedVegetation - The Geotechnical Effect of Water Table Recovery", GroundwaterEffects in Geotechnical Engineering, Proceedings Ninth European Conference onSoil Mechanics and Foundation Engineering, Dublin, pp 285-288
Bobe, R., Hertwig, G., and Seiffert, H. 1981. "Computing Foundation SlabsWith Building Rigidity," Proceedings of the 10th International Conference on
Soil Mechanics and Foundation Engineering, Vol 2, Stockholm, Sweden, pp 53-56
Boussinesq, J. 1885. Application of Potential to the Study of theEquilibrium and Movements in Elastic Soils, Gauthia-Villard, Paris
. 1976. "Mat Foundations," Analysis and Design of Building
Foundations, Chapter 8, editor H. Y. Fang, Envo Publishing Company, LehighValley, Pa, pp 209-231
. 1982. Foundation Analysis and Design, 3rd Edition, McGraw-HillBook Company, New York, NY, pp 187-188, 240-258
. 1988. Foundation Analysis and Design 4th Edition, McGraw-HillBook Company, pp 219-222, 266
241
Briaud, Jean-Louis. 1979. "The Pressuremeter: Application to PavementDesign," Ph.D. Thesis, Department of Civil Engineering, School of GraduateStudies, University of Ottawa, Ottawa, Canada, pg 184-188.
Briaud, J.-L., Tucker, L., and Coyle, H. M. 1982. "Pressuremeter, ConePenetrometer, and Foundation Design," Civil Engineering Department, Texas A&MUniversity, College Station, TX
Brooker, E. W. and Ireland, H. 0. 1965. "Earth Pressures at Rest Related toStress History", Canadian Geotechnical Journal, Vol 11, pp 1-15
Building Research Advisory Board (BRAB). 1968. "Criteria for Selection andDesign of Residential Slabs-on-Ground," Publication No. 1571, National Academyof Sciences-National Research Council, Washington, D. C.
Burland, J. B. and Davidson, W. 1976. "A Case Study of Cracking of ColumnsSupporting A Silo Due to Differential Foundation Settlement," No. CP42/76,Building Research Station, Building Research Establishment, London, England
Burland, J. B. and Wroth, C. P. 1978. "Settlement of Buildings andAssociated Damage," Foundations and Soil Technology, The Construction Press,Lancaster, England, pp 287-329
Burmister, D. M. 1963. "Prototype Load-Bearing tests for Foundations ofStructures and Pavements", Field Testing of S~ils, American Society forTesting and Materials Standard Technical PublicationNo. 322, pp 98-119,Philadelphia, PA
Buttling, S. and Wood, L. A. 1982. "A Failed Raft Foundation on Soft Clays,"Ground Engineering, Vol 15, No 5, pp 40-44
Chou, Y. T. 1981. "Structural Analysis Computer Programs for RigidMulticomponent Pavement Structures With Discontinuities - WESLIQUID andWESLAYER," Technical Report GL-81-6 (3 Reports), U. S. Army Engineer WaterwaysExperiment Station, Vicksburg, MS
Christian, J. T. and Carrier III, W. D. 1978. "Janbu, Bjerrum, andKjaernsli's Chart Reinterpreted," Canadian Geotechnical Journal, Vol 15, pp123-128
Dawkins, W. P. 1982. "User's Guide: Computer Program for Analysis of Beam-Column Structures With Nonlinear Supports (CBEAMC),' Instruction Report K-82-6, U. S. Army Engineer Waterways Experiment Station, Vicksburg, MS
Department of the Army. Corps of Engineers, Office of the Chief of Engineers,1984. "Geotechnical Investigations," Engineer Manual EM 1110-2-1804,Washington, D. C.
(To Be Published). "Settlement Analysis," EngineerManual EM 1110-1-1904, Washington, D. C.
242
1970. "Laboratory Soils Testing," Engineer Manual EM1110-2-1906, Washington, D. C.
1972. "Soil Sampling," Engineer Mar-al EM iLiO-2-
1907, Washington, D. C.
1987. "Concrete for Building Construction", Corps of
Engineers Guide Specification 03300, Washington, D. C.
Desai, C. S., Johnson, L. D., and Hargett, C. M. 1974. "Analysis of Pile-Supported Gravity Lock", Journal of the Geotechnical Engineering Division,Proceedings of the American Society of Civil Engineers, Vol 100, pp 1009-1029
DeSalvo, G. J. and Swanson, J. A. 1982. ANSYS Engineering Analysis SystemUser's Manual, Swanson Analysis System, Inc. Houston, PA
Duncan, J. M. and Chang, C. Y. 1970. "Nonlinear Analysis of Stress and Strainin Soils," Journal of the Soil Mechanics and Foundations Division, Proceedingsof the American Society of Civil LEngineers, Vol 97, pp 1629-1653
Duncan, J. M. and Clough, G. W. 1971. "Finite Element Analysis of Port AllenLock," Journal of the Soil Mechanics and Foundations Division. Proceedings ofthe American Society of Civil Engineers, Vol 97, pp 1053-1068
Editor, 1982. "Structural Foundations," Construction News, June 11, pp 18-19, 21-22
Eshbach, 0. V. 1954. Handbook of Engineering Fundamentals, 2nd Edition, JohnWiley & Sons, pp 5-64 to 5-68
Face, A. 1987. "Specifying Floor Flatness and Levelness: The F-NumberSystem", The Constrsuction Specifier, Alexandria, VA
Feld, J. 1965. "Tolerance of Structures to Settlement," Journal of the SoilMechanics and Foundations Division, American Society of Civil Engineers, Vol91, No SM3, pp 63-77
Focht, Jr., J. A., Khan, F. R., and Gemeinhardt, J. P. 1978. "Performance ofOne Shell Plaza Deep Mat Foundation," Journal of the Geotechnical EngineeringDivision, American Society of Civil Engineers, Vol 104, No GT5, pp 593-608
Fraser, R. A. 1975. "Review of Investigation on Raft Foundations for MajorBuildings on Deep Soils, Perth Area," Paper III, Proceedings of Symposium onRaft Foundations, Perth, Western Australia, pp 23-40
Fraser, R. A. and Wardle, L. J. 1975. "The Analysis of Stiffened RaftFoundations on Expansive Soils," Symposium on Recent Developments in theAnalysis of Soil Behavior and Their Application to Geotechnical Structures,Vol 2, Department of Civil Engineering Materials, University of New SouthWales,m Kensington, N.S.W., Australia, pp 89-98
243

Gibson, R. E 1967. "Some Results Concerning Displacements and Stresses in aNonhomogeneous Elastic Half-Space," Geotechnique, Vol 17, pp 58-67
Godden, W. G. 1965. Numerical Analysis of Beam and Column Structures,Prentice-Hall, Inc., Englewood Cliffs, NJ
Golubkov, V. N., Tugaenko, Y. F., Matus, Y. V., Sinyavskii, S. D., andVarenik, P. F. 1980. "Investigation of Deformations in Soil BeneathFoundation Mat of 16-Story Residential Building," Translated from Osnovaniya,Fundamenty i Mekhanika Gruntov, No. 6, Odessa Civil Engineering Institute,Russia, pp 232-235
Haliburton, T. A. 1972. "Soil Structure Interaction: Numerical Analysis ofBeams and Beam-Columns," Technical Publication No. 14, School of CivilEngineering, Iklahoma State University, Stillwater, OK
Hansen, J. B. 1961. "A General Formula For Bearing Capacity," Bulletin No.11, Danish Geotechnical Institute, Copenhagen, pp 38-46
. 1970. "A Revised and Extended Formula For Bearing Capacity,"Bulletin No. 28, Danish Geotechnical Institute, Copenhagen, pp 5-11
Hartman, J. P. and James, B. H. 1988. "Development of Design Formulas forRibbed Mat Foundations on Expansive Soils," Technical Report ITL-88-1, U. S.Army Engineer Waterways Experiment Station, Vicksburg, MS
Headquarters, Department of the Army. 1984. "Concrete Structural Design forBuildings", Technical Manual 5-809-2, Washington, D. C.
_ 1979. "Concrete Floor Slabs On GradesSubjected to Heavy Loads," Technical Manual 5-809-12, Washington, D. C.
_ 1983. "Soils and Geology Proceduresfor Foundation Design of Buildings and Other Structures (Except HydraulicStructures)", Technical Manual 5-818-1, Washington, D. C.
_ 1983. "Foundations in ExpansiveSoils," Technical Manual 5-818-7, Washington, D. C.
Hetenyi, M. 1946. Beams on Elastic Foundation, The University of MichiganPress, Ann Arbor, MI, p 46
Holland, J. E. 1979. "Behavior of Experimental Housing Slabs on ExpansiveClays," 7th Asian Regional Conference on Soil Mechanics and FoundationEngineering, Singapore
Hooper, J. A. 1978. "Foundation Interaction Analysis," Chapter 5,Developments in Soil SMechanics-l, C. R. Scott, editor, Applied SciencePublishers LTD, London, England, pp 149-211
244
Hooper, J. A. and Wood, L. A. 1977. "Comparative Behavior of Raft and PiledFoundations," Proceedings of the Ninth International Conference on SoilMechanics and Foundation Engineering, Vol 1, Tokyo, pp 545-549
Huang, H. H. 1974a. "Analysis of Symmetrically Loaded Slab on ElasticSolid," Technical Note, Journal of Transportation Engineering, AmericanSociety of Civil Engineers, Vol 100, No TE2
Huang, Y. H. 1974b. "Finite Element Analysis of Concrete Pavements WithPartial Subgrade Contact," Transportation Research Record 483, TransportationResearch Board, Washington, D. C.
Hughes, J. M. 0. 1982. "Interpretation of Pressuremeter Tests for theDetermination of Elastic Shear Modulus," Proceerdings of EngineeringFoundation Conference on Updating Subsurface Sampling of Soils and Rocks andTheir In Situ Tests, Santa Barbara, CA
Johnson, L. D. 1982. "Users Guide for Computer Program Heave", MiscellaneousPaper GL-82-7, U. S. Army Engineer Waterways Experiment Station, Vicksburg, MS
Johnson, L. D. 1988. "Proceedings of the Workshop on Design, Construction,and Research for Ribbed Mat Foundations," Miscellaneous Paper GL-88-6, U. S.Army Engineer Waterways Experiment Station, Vicksburg, MS
Kay, J. N. and Cavagnaro, R. L. 1983. "Settlement of Raft Foundations,"Journal of Geotechnical Engineering, American Society of Civil Engineers, Vol109, No 11, pp 1367-1382
Kerr, A. D. 1987. "Analysis of Footings on a Sand Base", Interim ProgressReport for Contract CE DACW39-86-M-1358, Submitted to U. S. Army EngineerWaterways Experiment Station, Vicksburg, MS
Lambe, T. W. and Whitman, R. V. 1969. Soil Mechanics, John Wiley & Sons, NewYork, NY, p 153, 202
Lytton, R. L. 1972. "Design Methods for Concrete Mats on Unstable Soils,"Proceedings of the 3rd Inter-American Conference on Materials Technology, Rio-de-Janeiro, Brazil, pp 171-177
McKeen, R. G. and Eliassi, M. 1988. "Selection of Design Parameters ForFoundations on Expansive Soils," Prepared for U. S. Army Engineer WaterwaysExperiment Station, Vicksburg, MS, under Contract DACA39-87-M-0754
McKeen, R. G. and Lytton, R. L. 1984. "Expansive Soil Pavement Design UsingCase Studies," International Conference on CAse Histories in GeotechnicalEngineering, editor Shamsher Prakash, Vol III, St. Louis, MO, pp 1421-1427
Meyerhof, G. G. 1953. "Some Recent Foundation Research and Its Applicationto Design," Structural Engineer, London, England, Vol 31, ?p 151-167
245
Milovic', D. M. 1959. "Comparison Between the Calculated and ExperimentalValues of the Ultimate Bearing Capacity," Proceedings of the 6th InternationalConference on Soil Mechanics and Foundation Engineering, Vol 2, Montreal,Canada, pp 142-144
Mitchell, J. K. and Gardner, W. S. 1975. "In Situ Measurement of VolumeChange Characteristics," SOA Report, Proceedings uf the American Society ofCivil Engineers Special Conference on the In Sitsu Measurement of SoilProperties, Raleigh, N. C.
Mitchell, P. W. 1980. "The Structural Analysis of Footings on ExpansiveSoils," Kenneth W. G. Smith & Associaters Research Report No. 1, Webb & Son,16 Fenn Place, Adelaide, Australia
Muhs, H. J. 1959. "Neuere Entwicklung der Untersuchung in Berechnung vonFlachfundationer," Schweiz. Bauzeitung, Germany, Vol 19, p 11
Peck, R. B., Hanson, W. E., and Thornburn, T. H. 1974. FoundationEngineering, 2nd Edition, John Wiley & Sons, New York, NY
Pickett, G. and Ray, G. K. 1951. "Influence Charts for Concrete Pavements,"Transactions, American Society of Civil Engineers, Vol 116, pp 49-73
Polshin, D. E. and Tokar, R. A. 1957. "Maximum Allowable Non-uniformSettlement of Structures," Proceedings of the 4th International Conference onSoil Mechanics and Foundation Engineering, Vol 1, London, England, pp 402-406
Popov, E. P. 1968. Introduction to Mechanics of Solids, Prentice-Hall, Inc.Englewood, CA, pp 378-389
Post-Tensioning Institute (PTI). 1980. Design and Construction of Post-Tensioned Slabs on Ground, 1st Edition, Post-Tensioning Institute, Phoenix, AZ
Ramasamy, G., Rao, A. S. R., and Prakash, C. 1982. "Effect of Embedment onSettlement of Footings on Sand," Indian Geotechnical Journal, Vol 12, No 2, pp112-131
Schmertmann, J. H. 1978. "Guidelines for Cone Penetration Test Performanceand Design," Report No. FHWA-TS-78-209, U. S. Department of Transportation,Federal Highway Administration, Office of Research and Development,Washington, D. C.
Schmertmann, J. H. 1986. "Dilatometer to Compute Foundation Settlement," Useof Insitu Tests in Geotechnical Engineering, Geotechnical Special PublicationNo. 6, American Society of Civil Engineers, New YOrk, NY 10017, pp 303-321
Schultze, E. and Sherif, G. 1973. "Prediction of Settlements From EvaluatedSettlement Observations for Sand," Proceedings 8th International Conference onSoil Mechanics and Foundation Engineering, Moscow, Vol 1.3, pp 225-230
Seelye, E. E. 1956. Foundations Design and Practice, John Wiley and Sons,Inc., New York, NY, pp 2-2 to 2-5
246
Sherman, W. C. 1957. "Instructions for Installation and Observations ofEngineering Measurement Devices; Port Allen Lock, Gulf Intracoastal Waterway,Plaquemine-Morgan City Route", Instruction Report 3, U. S. Army EngineerWaterways Experiment Station, Vicksburg, MS
Sherman, W. C. and Trahan, C. C. 1968. "Analysis of Data FromInstrumentation Program, Port Allen Lock", Technical Report S-68-7, U. S. ArmyEngineer Waterways Experiment Station, Vicksburg, MS
Skempton, A. W. 1951. "The Bearing Capacity of Clays," Proceedings of theBuilding Research Congress, Division I, Part III, London, England, pp 180-189
Skempton, A. W. and Bjerrum, L. 1957. "A Contribution to the SettlementAnalysis of Foundations on Clay," Geotechnique, Vol 7, No 4, pp 168-178
Skempton, A. W. and MacDonald, D. H. 1956. "Allowable Settlement ofBuildings," Proceedings of the Institute of Civil Engineers, Part III, Vol 5,pp 727-768
Sowers, G. B. and Sowers, G. F. 1972. Introductory Soil Mechanics andFoundations, 3rd Edition, The MacMillan Company, New York, NY
Stroman, W. R. 1978. "Design and Performance of a Mat Slab Foundation in
Expansive Soils," Preprint 3317, American Society of Civil EngineersConvention and Exposition, Chicago, IL
Teng, W. C. 1975. "Mat Foundations," Foundation Engineering Handbook,editors, Winterkorn and Fang, Van Nostrand-Reinhold, New York, NY, pp 528-536
Terzaghi, K. 1943. Theoretical Soil Mechanics, Chapter 8, John Wiley & Sons,New York, NY
Terzaghi, K. 1955. "Evaluation of Coefficient of Subgrade Reaction,"Geotechnique, Vol 5, pp 297-326
Thornthwaite, C. W. 1948. "An Approach Toward a Rational Classification ofClimate", Geographical Review, Vol 38, pp 55-94
Tomlinson, M. J. 1980. Foundation Design and Construction, 4th Edition,Pitman Publishing Limited, London, England
Vallabhan, C. V. and Sathiyakumar, N. 1987. "A Computer Program For Analysis
of Transient Suction Potential in Clays," Prepared for U. S. Army EngineerWaterways Experiment Station, Vicksburg, MS, under Contract DACA39-87-M-0835
Vesic, A. S. 1961. "Bending of Beams Resting on Isotropic Elastic Solid,"Journal of the Engineering Mechanics Division, American Society of CivilEngineers, Vol 87, No EM2, pp 35-51
Vesic, A. S. 1975. "Bearing Capacity of Shallow Foundations," FoundationEngineering Handbook, Chapter 3, editors, H. F. Winterkorn and H. Y. Fang, VanNostrand-Reinhold Company, New York, NY, pp 121-147
247
Vesic, A. S. and Saxena, S. K. 1968. "Analysis of Structural Behavior ofRoad Test Rigid Pavements," Soil Mechanics Series No. 13, School ofEngineering, Duke University, Durham, NC
Wahls, H. E. 1981. "Tolerable Settlement of Buildings," Journal of theGeotechnical Engineering Division, American Society of Civil Engineers, Vol107, No GTlI, pp 1489-1504
Walsh, P. F. 1978. "The Analysis of Stiffened Rafts on Expansive Clays,"
Technical Paper No. 23 (2nd Series), Division of Building Research,Commonwealth Scientific and Industrial Research Organization, Australia
Wardle, L. J. and Fraser, R. A. 1975a. "Methods for Raft Foundation DesignIncluding Soil Structure Interaction," Paper I. Proceedings of the Symposiumon Raft Foundations, Perth, Western Australia, pp 1-12
_ 1975b. "Program FOCALS-Foundation on CrossAnisotropic Layered System: User's Manual," Geomechanics Computer Program No4, Commonwealth Scientific and Industrial Research Organization, Division ofApplied Geomechanics, Australia
Westergaard, H. M. 1938. "A Problem of Elasticity Suggested by a Problem inSoil Mechanics: Soft Material Reinforced by Numerous Strong HorizontalSheets," Contributions to the Mechanics of Solids, Stephen Timoshenko 60thAnniversary Volume, The Macmillan Company, New York, NY, pp 268-277
Winkler, E. 1867. Die Lehre von Elastizitat und Festigkeit (On Elasticityand Fixity), Prague, p. 182
Winter, E. 1974. "Calculated and Measured Settlements of a Mat Foundation inArlington, Virginia, USA," Settlement of Structures, British TechnicalSociety, John Wiley & Sons, New York, NY, pp 451-459
Withiam, J. L. and Kulhawy, F. H. 1978. "Analytical Modeling of the UpliftBehavior of Drilled Shaft Foundations," Geotechnical Engineering Report 78-1,School of Civil and Environmental Engineering, Cornell University, Ithaca, NY
Woodburn, J. A. 1979. Footings and Foundations for Small Buildings in AridClimates, Institute of Engineers, Australia
Yong, R. N. Y. 1960. "A Study of Settlement Characteristics of ModelFootings on Silt," Proceedings of the 1st Pan-American Conference on SoilMechanics and Foundation Engineering, Mexico, D. F., pp 492-513
Ytterberg, R. F. 1987. "Shrinkage and Curling of Slabs on Grade, Part I-Drying Shrinkage," Concrete International Design and Construction, AmericanConcrete Institute, Vol 9, pp 22-31
248

APPENDIX A: EQUIVALENT ELASTIC SOIL MODULUS
Modulus Increasing Linearly With Depth
1. The Kay and Cavagnaro (1983) model may be used to derive an
equivalent soil modulus E* from elastic soil moduli E that increases s
linearly with depth z
E - E + kz (Al)s 0
where
E - Young's soil modulus at the ground surface, ksf0
k - constant relating E with z in units of ksf/ft.5
The influence factor I in Figure 5 may be approximated as shown in Tablec
Al. The functions of I with depth z in Table Al and Equation Al may bec
integrated to evaluate the center displacement in units of feet
Ic
PC - q T- dz (A2)s
where q is the pressure applied on the soil in units of ksf.
2. Integration of Equation A2 leads to the following settlement
function for z* - 0.0 to 4.0
q[ [l+2n 1 [l+4n]1= (a-b/n)ln(l+0.5n)+(c+d/n)inLl+-.n j + (e+f/n)l-- nJ- g (A3)
where
z*= (z - Db)/R
n kR/(E + kDb)
R = LB/ir
D = depth of mat base below ground surface, ft
If the elastic soil modulus at the ground surface E = 0, then n = R/Db. Ifo
Db - 0 for the base of the mat on the ground surface, then n = kR/E . The
constants in the above equation are given in Table A2. The solution of
Equation A3 as a function of n results in the parametric equations for C
shown in Table A3. p may therefore be given for z* = (z - Db)/R - 0.0 to
z*- 4.0 or soil of approximately infinite depth by
AI
Table Al
Variation of Influence Factor I With DepthC
Soil Poisson's Ratio, Range of Depth, z* Influence Factor
AS z* - (z-Db)/R Ic
0.0 - 0.5 0.700 + 0.300z*
0.2 0.5 - 2.0 1.050 - 0.400z*
2.0 - 4.0 0.400 - 0.075z*
0.0 - 0.5 0.500 + 0.500z*
0.3 0.5 - 2.0 0.917 - 0.333z*
2.0 - 4.0 0.400 - 0.075z*
0.0 - 0.5 0.250 + 0.900z*
0.4 0.5 - 2.0 0.850 - 0.300z*2.0 - 4.0 0.400 - 0.075z*
0.0 - 0.5 1.200z*
0.5 0.5 - 2.0 0.717 - 0.233z*
2.0 - 4.0 0.400 - 0.075z*
z - depth below ground surface, ftD b - depth of mat base below ground surface, ft
R - equivalent mat radius, LB/w, ft where L : 2BL - length of mat, ftB - width of mat, ft
Table A2
Constants for Equation A3
Poisson's Ratio ysConstant
0.2 0.3 0.4 0.5
a 0.700 0.500 0.250 0.000b 0.300 0.500 0.900 1.200c 1.050 0.917 0.850 0.717d 0.400 0.333 0.300 0.233e 0.400 0.400 0.400 0.400f 0.075 0.075 0.075 0.075g 0.600 0.400 0.150 -0.100
A2
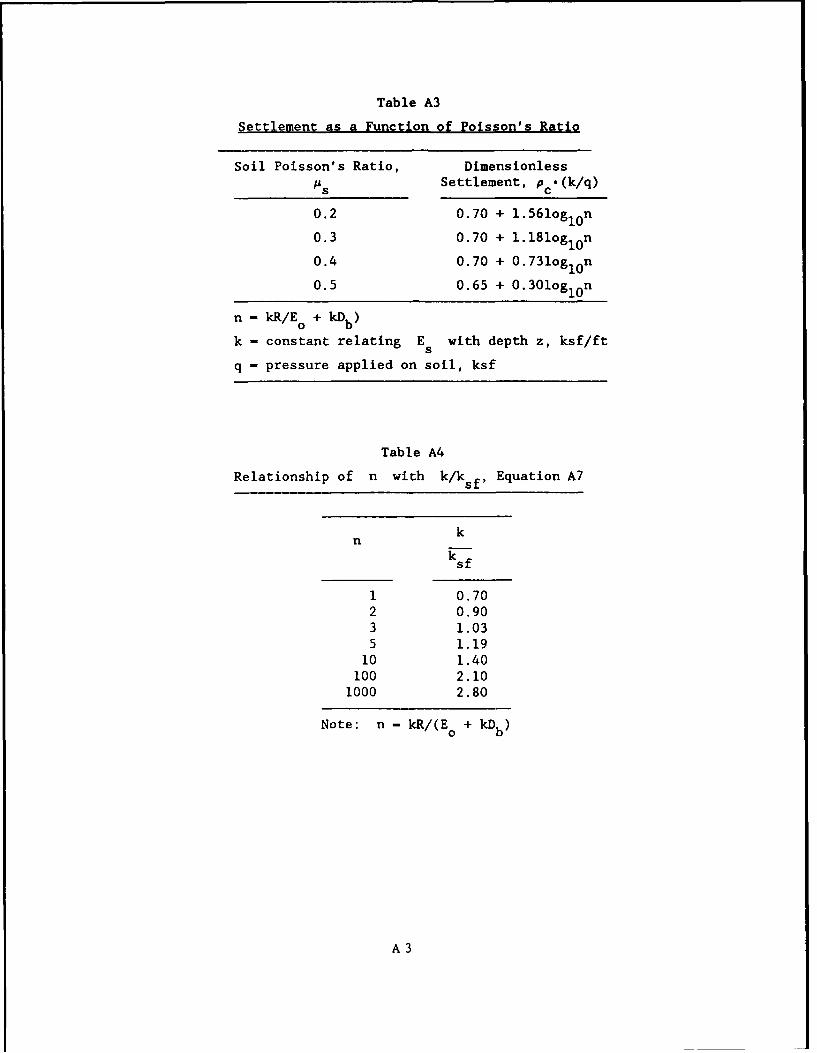
Table A3
Settlement as a Function of Poisson's Ratio
Soil Poisson's Ratio, DimensionlessAS Settlement, pc.(k/q)
0.2 0.70 + 1.561oglon
0.3 0.70 + 1.181ogiOn
0.4 0.70 + 0.731oglOn
0.5 0.65 + 0.301oglon
n - kR/E° + kDb )
k - constant relating E with depth z, ksf/fts
q - pressure applied on soil, ksf
Table A4
Relationship of n with k/k sf, Equation A7
knksf
1 0.702 0.903 1.035 1.19
10 1.40100 2.10
1000 2.80
Note: n - kR/(E + kDb)
A3
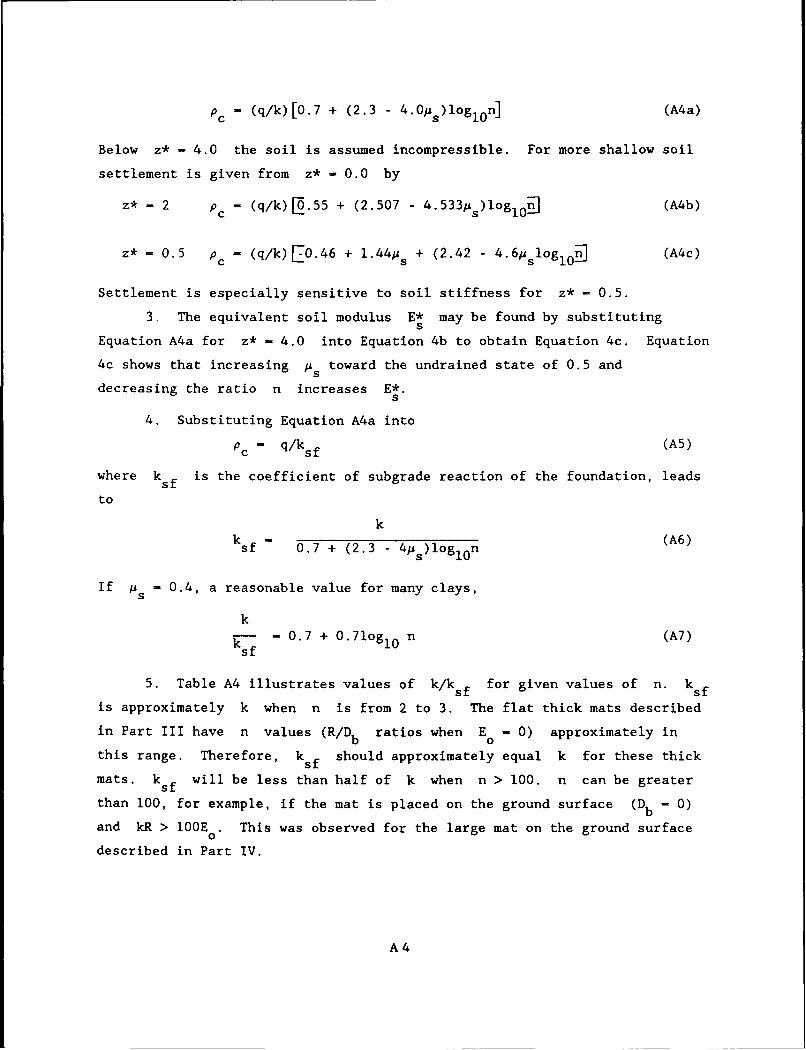
PC- (q/k)[0.7 + (2.3 - 4.0us)logl0 n] (A4a)
Below z* - 4.0 the soil is assumed incompressible. For more shallow soil
settlement is given from z* - 0.0 by
z* = 2 PC - (q/k) .55 + (2.507 - 4.533us)log1 0 n (A4b)
z* = 0.5 PC - (q/k) E0.46 + 1.44s + (2.42 - 4.6p slOg1 0n (A4c)
Settlement is especially sensitive to soil stiffness for z* - 0.5.
3. The equivalent soil modulus E* may be found by substitutingS
Equation A4a for z* - 4.0 into Equation 4b to obtain Equation 4c. Equation
4c shows that increasing ps toward the undrained state of 0.5 and
decreasing the ratio n increases E*.s
4. Substituting Equation A4a into
Pc - q/ksf (A5)
where ksf is the coefficient of subgrade reaction of the foundation, leads
to
kk sf 0.7 + (2.3 - 4 p )loglon (A6)
If 's - 0.4, a reasonable value for many clays,
k
- 0.7 + 0.7log10 n (A7)sf
5. Table A4 illustrates values of k/ksf for given values of n. ksf
is approximately k when n is from 2 to 3. The flat thick mats described
in Part III have n values (R/Db ratios when E0 - 0) approximately in
this range. Therefore, ksf should approximately equal k for these thick
mats. ksf will be less than half of k when n > 100. n can be greater
than 100, for example, if the mat is placed on the ground surface (Db - 0)
and kR > 100E . This was observed for the large mat on the ground surface0
described in Part IV.
A4
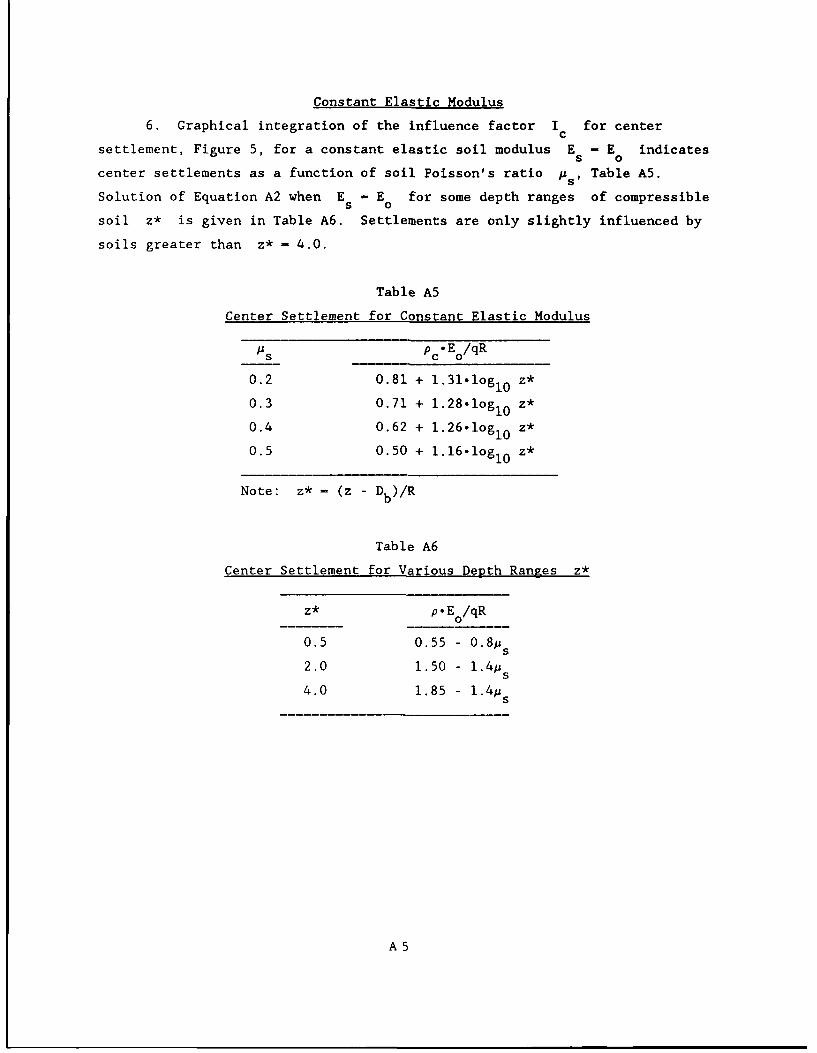
Constant Elastic Modulus
6. Graphical integration of the influence factor I for centerc
settlement, Figure 5, for a constant elastic soil modulus E - E indicates5 0
center settlements as a function of soil Poisson's ratio p Table A5.
Solution of Equation A2 when E - E for some depth ranges of compressibles 0
soil z* is given in Table A6. Settlements are only slightly influenced by
soils greater than z* - 4.0.
Table A5
Center Settlement for Constant Elastic Modulus
'US Pc' E/qR
0.2 0.81 + 1.31.1ogi 0 z*
0.3 0.71 + 1.28-iogi 0 z*
0.4 0.62 + 1.26.1ogi 0 z*
0.5 0.50 + 1.16.1og10 z*
Note: z* - (z - Db)/R
Table A6
Center Settlement for Various Depth Ranges z*
z* p.E /qR
0.5 0.55 - 0. 8 p s
2.0 1.50 - 1.4p s
4.0 1.85 - 1.4ps
A5
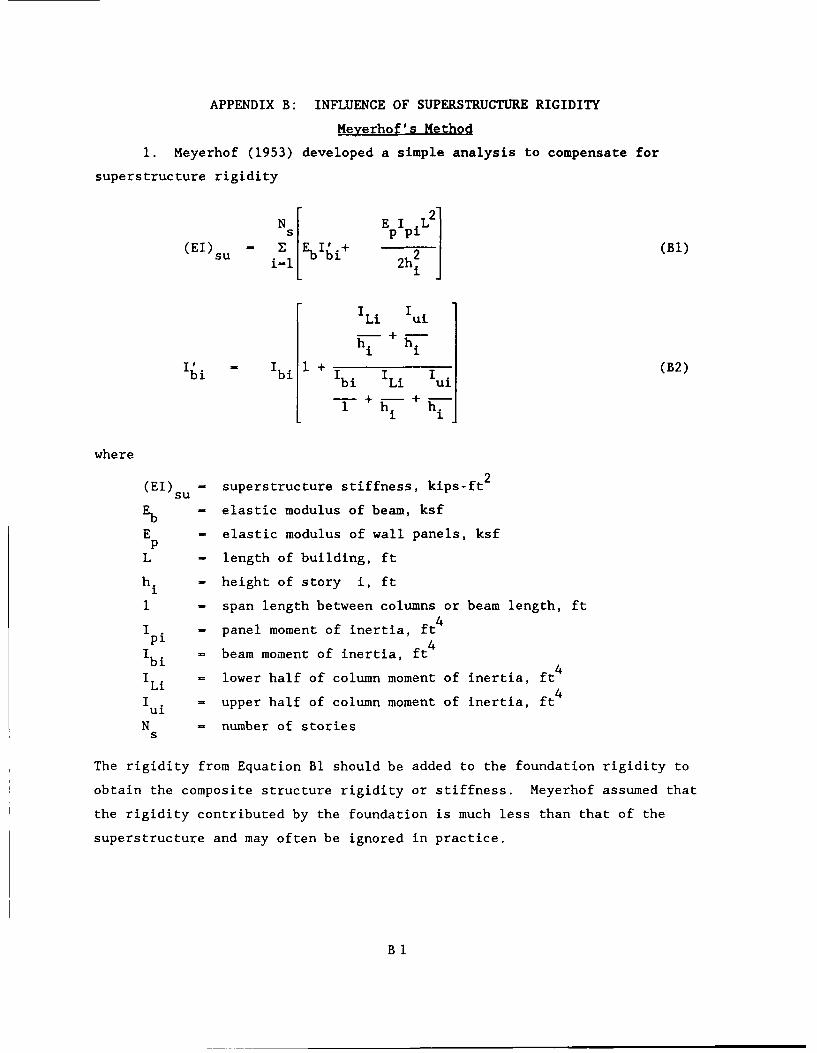
APPENDIX B: INFLUENCE OF SUPERSTRUCTURE RIGIDITY
Meyerhof's Method
1. Meyerhof (1953) developed a simple analysis to compensate for
superstructure rigidity
Ns EppiL2]
(El) z +A (Bi)(lsu -i-1Eib 2h2
ILi Iui
hi+hiI' - i 1+ (B2)
bi Ibi I I lui
+ i
where
(EI)s u - superstructure stiffness, kips-ft2
Eb - elastic modulus of beam, ksf
E - elastic modulus of wall panels, ksfP
L - length of building, ft
h. - height of story i, ft
1 - span length between columns or beam length, ft
Ipi - panel moment of inertia, ft4
Ibi = beam moment of inertia, ft4ILi - lower half of column moment of inertia, ft4
I . - upper half of column moment of inertia, ft4
N = number of storiess
The rigidity from Equation BI should be added to the foundation rigidity to
obtain the composite structure rigidity or stiffness. Meyerhof assumed that
the rigidity contributed by the foundation is much less than that of the
superstructure and may often be ignored in practice.
Bi
Proposed Method
2. The following method calculates a composite moment of inertia for
the structure that includes the effect of a simple framed building or shear
wall on the mat foundation. The moment of inertia with respect to the
centroid of a composite structure I may be given by the parallel axis00
theory 7
NI = Es (I + Aih ) (B3)
where
Ioi = moment of inertia of the axis passing through the centroid axis
of story i, ft4
A. - area of cross-section of story i, ft 21
hcci = distance between center of story i and centroid axis, ft
The centroid axis h is found fromc
Ns Aihci
h - z (B4)c il A.i-1 1
where hci is the centroid of each section or story from the bottom of the
mat.
Flat Mats
3. The centroid for a structure on a flat mat with a simple shear wall
as schematically shown in Table B1 is
ah 2N2 +2a hDN + BD2
w s w sh - (B5)c 2(BD + awhN s)
where
a - wall thickness, ftw
D - thickness of mat foundation, ft
h - height of each story, ft
N - number of storiess
B - width of foundation or spacing S, ft
Each story is assumed to be equal in height.
B2
Table Bi
Centroid and Moment of Inertia ofComposite Structure With a Flat Mat
Centroid h
If h, = h 2 . = Ns = h,
ThenNa 21-1 BD2
Z (a h,- hi ) + eD + --
c N L
BD + i awhi
1 ]i-I h2
Since E (21-1) - N 2i-I s 1-1 1
Then ah 2N2 + 2a hN D + BD2 hc haw a w a
mC
h - _h 2(BD + a whNs)
Moment of Inertia loofmD
B
BD3 [ D]2 Ns 2
I " -2+ BD hc + E (I.t Aihccl)
Ioi Aih2ci
a ah [ -[ 2
2 w2 a h 2
12 w 2 2 +
a h3 F2 [i1 1 2
w - [hLc L2
Nsawh3 IC2 2 N 5(Ns 2 _ 1 )h2 2 2 1]Sum 12 I* - awh shc Nsh hc- 2hcNsD + 12 -- + N Dh+ ND
BD3 + Nsawh [ 2
Ioofm - 2 + BD c - + I*
B3
4. The composite moment of inertia for a flat mat from Table BI is
BD3 + N a h 3 2
loofm - 12 + BD[h - + I* (B6a)
N (4N 2 _l)h 2Nsh Nshch + 12 - 2h NsD + N 2Dh +
5. A parametric analysis was performed to calculate the composite
moment of inertia Ioofm for a flat mat from Equation B6 with h evaluated
from Equation B5 and mat thickness D evaluated from Equation Ila plus 0.3
ft. The wall thickness a was evaluated as an equivalent thickness forw
columns of width a and spacing S by78
2a
a - - (B7)w S
If a is assumed to vary in proportion with the number of stories Ns i.e.,
a - 1, 2, and 4 ft for N - 3, 12, and 50 stories, respectively, then the5
composite moment of inertia is approximately
loofm - (17.3 - 0.4S).N (3.42 + 0.011S) (B8)
The height of each story h was assumed 10 ft.
6. The moment of inertia of a continuous shear wall I excluding thesw
mat foundation is
a (N sw s
sw -12 (B9a)
If h - 10 ft and a is found from Equation B7 with a varying with N asw s
above, then
27.77N4
sI - (B9b)sw S
where 3 : N S 50 stories and 15 : S : 3( t. Comparison of Equations B85
78Desai, Johnson, and Hargett 1974
B4
and B9b shows that the composite Ioofm is significantly greater than Isw
for the same number of stories without the mat, especially for fewer stories
when the mat is less thick; therefore, the mat rigidity should be included in
the overall stiffness of the structure if this analysis is a realistic
interpretation of structural stiffness.
7. The effect of superstructure rigidity on a mat foundation was
estimated for a wall spacing S - 25 ft, story height h - 10 ft, and soil
pressure qm - 0.2 ksf/story is
(4) ft it D 't 7 D I ft L (7fts oofm, oofm mat e max'
3 1.0 1.8 412 34 5.8 2512 2.0 3.3 69,663 930 32.2 9150 4.0 5.6 13,684,290 37,402 187.2 341
The mat thickness D was estimated from Equation lla plus 0.3 ft. Ioofm in
column 4 was estimated from Equation B8. The ratio of the structure moment of
inertia to that of the mat shown in column 5 is
loofm 00ofm= 12-....
(BlO)Imat BD3
Column 6 shows the equivalent mat thickness D if the stiffness of thee
entire structure is collapsed into the mat
3 12"I1f
D = - 00 (Bll)e S
D shown above, although large, may not be unreasonable because Hooper and ee
Wood (1977) calculated an equivalent thickness of at least 6 times that of the
actual mat thickness in order to calculate differential displacements in
agreement with observed displacements. The superstructure exerts a large
influence on the mat rigidity consistent with previous observations of soil-
structure interactioit nalysis7 . The concrete elastic modulus E may alsoc
be increased to give the same equivalent rigidity QL that would be
calculated using De or Ioofm substituted for I in Equation 17.
79Wardle and Fraser 1975a; Focht, et al 1978; Stroman 1978; Bobe, et al 1981
B5
8. Column 7 above illustrates the maximum mat length L such thatmax
the mat appears rigid from the criterion of Equation 17. The coefficient of
subgrade reaction ksf was calculated from Equation 6b as 27 ksf/ft assuming
S = 25 ft and k - 1000 ksf/ft, an upperbound value simulating hard clay27.sp
The PTI (1980) used ksf - 7 ksf/ft for a long-term coeffi-ient to determine
the PTI design equations, which leads to L 1.4 times those shown inmax
column 7. If k - 150 ksf/ft simulating a stiff clay, then L will besp max
twice those shown in column 7. E was assumed 432,000 ksf. A multi-storyc
structure with 11 or more stories may therefore appear rigid as had been
observed from records of uniform displacements80 . Superstructure stiffness
may be neglected for cases such as steel storage tanks or low-rise buildings
46with open floor plans and large areas
Ribbed Mats
9. The centroid for a structure on a ribbed mat with a simple shear
wall schematically shown in Table B2 is
wt2 + BD2 + 2BDt + 2a h(t+D)N + a h2N2
w S w sh - (BI2)c 2(wt + BD + Nsawh)
where
a = wall thickness, ftw
w = thickness of stiffening beam, ft
t = depth of stiffening beam, ft
B - width of foundation or spacing S, ft
D - mat thickness, ft
h - height of each story, ft
N - number of storiess
10. The composite moment of inertia is given from Table B2
oo - wt3 + BD3 + N a wt[hc 2 + BD[hc - t - + I** (Bl3a)oorm 1
8 Hooper and Wood 1977, Stroman 1978, Focht, et al 1978
B6
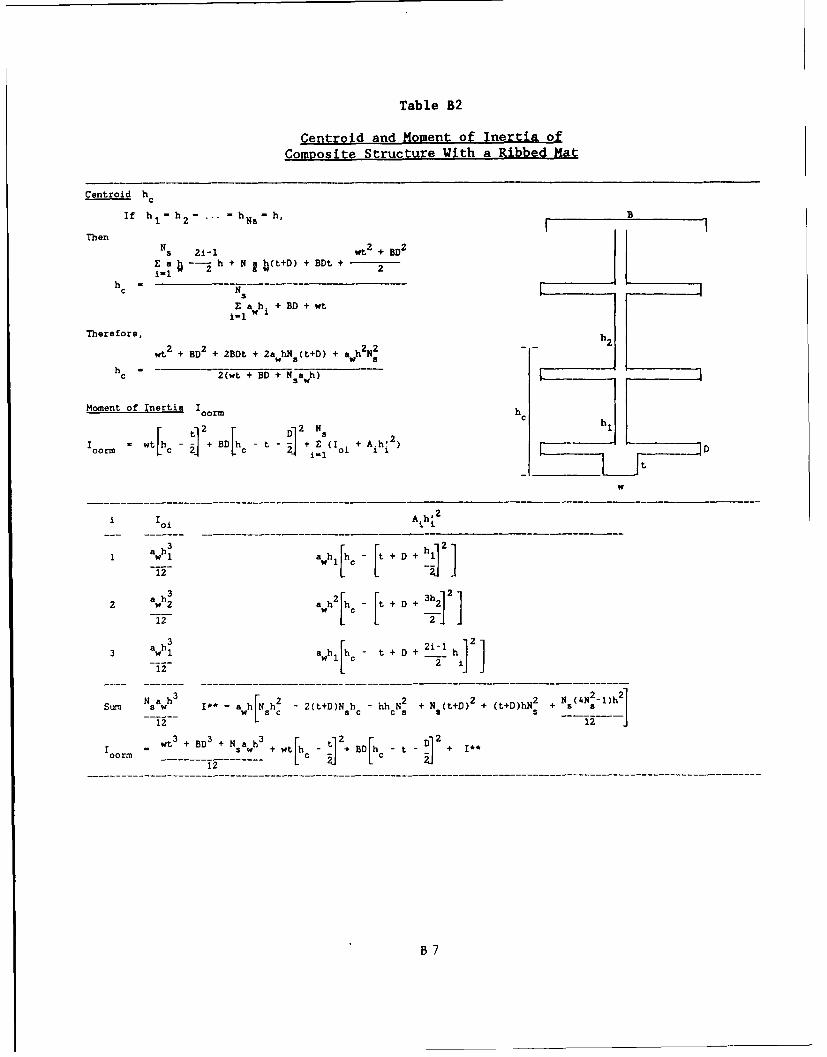
Table B2
Centroid and Moment of Inertia ofComposite Structure With a Ribbed Mat
Centroid hc
If h -. hNs- h, BThen
Ns 2i-1 wt2 + BD2
Za- -2 h+ N g (t+D) + BDt + -i-I
hc NSZ awh i + BD + wt
Therefore, h
wt2 + BD
2 + 2BDt + 2awhNs(t+D) + ah
2N2 h
c 2(wt + BD + NNawh)
Moment of Inertia I h
'oorm h ~~Io W + BD[ t + - [(I . + A h h• ID-t
w
i o i Ajhj 2
awhl[h c - t + D + 1-
12 2
3 h N2 + N (t+D)2 + (t+D)hN2 + N (4N -1)h2
Sum Nsa w h 3 1** - awhN sh 2 - 2(t+D)Nshc - hhc s +12 L12
= wt3 + BD3 + w + wth - BD[h - t + I**loorm Icc
12 7
B7
2 t D h2 2 2 N(4N -l)h 2
I** ahNh sc hhN + N(t+D) + (t+D)hN s s
12
A parametric analysis was performed to calculate I of ribbed mats from00orm
Equations B13 for column width a - 1 ft where a was found from Equationw
B7, h - 10 ft, and stiffening beam width w - I ft
Ioorm = (28 + 5t - 0.72S)N s(3 - 0.13t) (B14)
where
N - number of stories, < 35
t = thickness of stiffening beam, < 3 ft
S - column or wall spacing, ft
The mat thickness was 0.5, 0.75, and 1.0 ft for N - 1, 2, and 3 stories,s
respectively. A comparison of I from Equation B14 for a ribbed mat and00orm
Ioofm from Equation B8 for a flat mat with N - 3 stories indicates similar
moments of inertia for each case. Comparison of Ioofm from Equation B6 for
a flat mat and I from Equation B13 for a ribbed mat shows that theoorm
stiffening beam increases I about 2, 7, and 14 percent with t - 1, 2, and00
3 ft, respectively, when N - 2. I is similarly increased 6, 23, and 56
percent with t - 1, 2, and 3 ft, respectively, when N - 1. The additional
stiffness from a stiffening beam in a ribbed mat becomes increasingly
significant as the number of stories in the superstructure decreases.
Resisting Bending Moment
11. The resisting moment after the flexure formula (Popov 1968) is
M - A s f (hc - 3.0) (B15)
where
M - resisting moment of steel, lbs-in
A - area of reinforcement steel, in2s
f - steel tensile strength, psis
h - centroid of structure, in.c
If the steel is placed in the bottom of the mat with 3.0 inches of cover, the
bending moment resistance will be increased about 4 and 10 times for 3 and 5-
B8
ft thick mats, respectively, supporting 11 stories using the parameters in
paragraph 5 above. The increase in bending moment resistance from the
superstructure can be substantial.
Limitations of Model
12. Although this framed building or shear wall model appears similar
to that illustrated in Figure 3.1 of ACI 435 (1980), "Allowable Deflections",
the above model requires confirmation. For example, the effective width B
or spacing S is not known and may be less than the actual width or spacing
such that the composite moment of inertia of the structure may be less than
that calculated by this model. Moreover, only a portion of the structure may
be constructed with a shear wall further complicating selection of an
appropriate value for B. Cross-frames, struts, and other structural
components also complicates calculation of the composite moment of inertia of
the structure.
B9
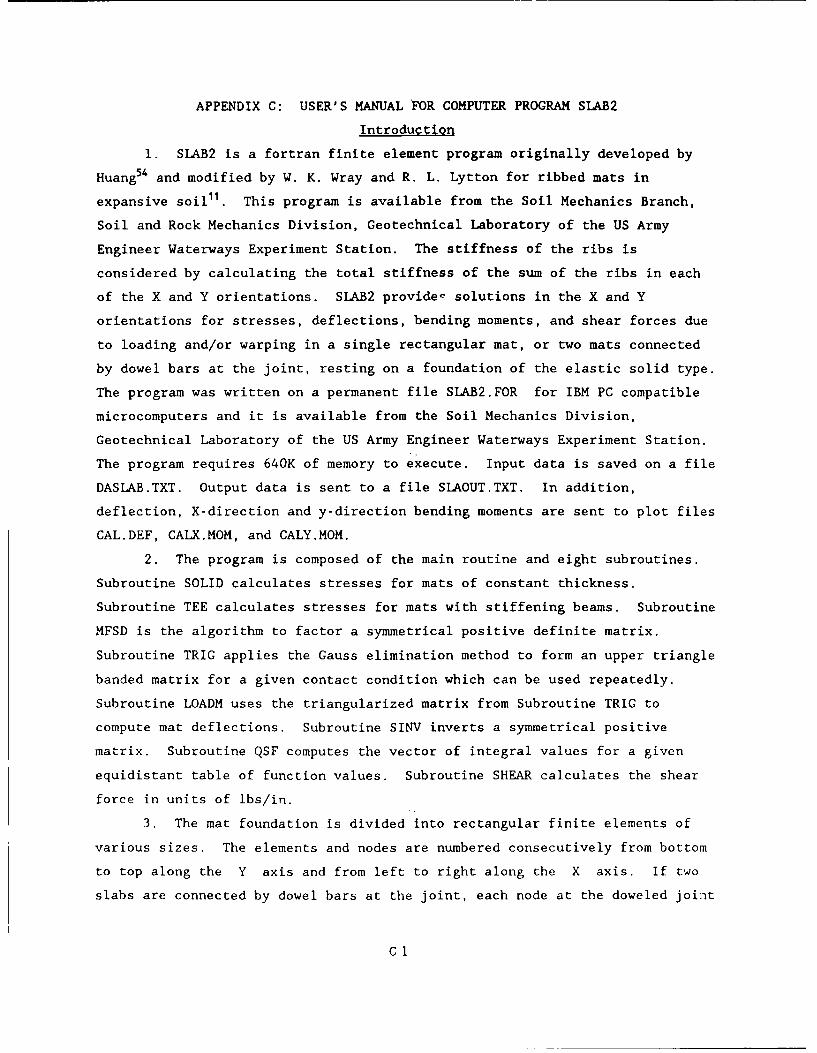
APPENDIX C: USER'S MANUAL FOR COMPUTER PROGRAM SLAB2
Introduction
1. SLAB2 is a fortran finite element program originally developed by
Huang54 and modified by W. K. Wray and R. L. Lytton for ribbed mats in
expansive soil11 . This program is available from the Soil Mechanics Branch,
Soil and Rock Mechanics Division, Geotechnical Laboratory of the US Army
Engineer Waterways Experiment Station. The stiffness of the ribs is
considered by calculating the total stiffness of the sum of the ribs in each
of the X and Y orientations. SLAB2 provide- solutions in the X and Y
orientations for stresses, deflections, bending moments, and shear forces due
to loading and/or warping in a single rectangular mat, or two mats connected
by dowel bars at the joint, resting on a foundation of the elastic solid type.
The program was written on a permanent file SLAB2.FOR for IBM PC compatible
microcomputers and it is available from the Soil Mechanics Division,
Geotechnical Laboratory of the US Army Engineer Waterways Experiment Station.
The program requires 640K of memory to execute. Input data is saved on a file
DASLAB.TXT. Output data is sent to a file SLAOUT.TXT. In addition,
deflection, X-direction and y-direction bending moments are sent to plot files
CAL.DEF, CALX.MOM, and CALY.MOM.
2. The program is composed of the main routine and eight subroutines.
Subroutine SOLID calculates stresses for mats of constant thickness.
Subroutine TEE calculates stresses for mats with stiffening beams. Subroutine
MFSD is the algorithm to factor a symmetrical positive definite matrix.
Subroutine TRIG applies the Gauss elimination method to form an upper triangle
banded matrix for a given contact condition which can be used repeatedly.
Subroutine LOADM uses the triangularized matrix from Subroutine TRIG to
compute mat deflections. Subroutine SINV inverts a symmetrical positive
matrix. Subroutine QSF computes the vector of integral values for a given
equidistant table of function values. Subroutine SHEAR calculates the shear
force in units of ]bs/in.
3. The mat foundation is divided into rectangular finite elements of
various sizes. The elements and nodes are numbered consecutively from bottom
to top along the Y axis and from left to right along the X axis. If two
slabs are connected by dowel bars at the joint, each node at the doweled joint
CI
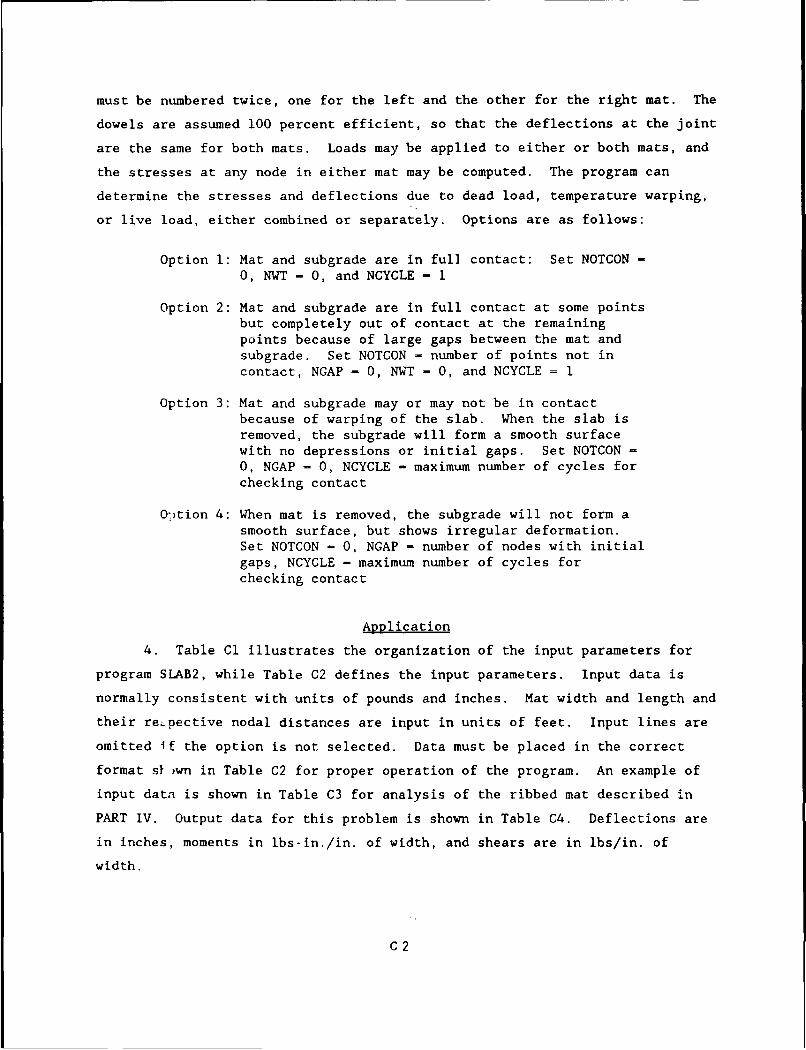
must be numbered twice, one for the left and the other for the right mat. The
dowels are assumed 100 percent efficient, so that the deflections at the joint
are the same for both mats. Loads may be applied to either or both mats, and
the stresses at any node in either mat may be computed. The program can
determine the stresses and deflections due to dead load, temperature warping,
or live load, either combined or separately. Options are as follows:
Option 1: Mat and subgrade are in ful] contact: Set NOTCON -0, NWT - 0, and NCYCLE - 1
Option 2: Mat and subgrade are in full contact at some pointsbut completely out of contact at the remainingpoints because of large gaps between the mat andsubgrade. Set NOTCON - number of points not incontact, NGAP = 0, NWT = 0, and NCYCLE = 1
Option 3: Mat and subgrade may or may not be in contactbecause of warping of the slab. When the slab isremoved, the subgrade will form a smooth surfacewith no depressions or initial gaps. Set NOTCON =
0, NGAP - 0, NCYCLE - maximum number of cycles for
checking contact
O-tion 4: When mat is removed, the subgrade will not form asmooth surface, but shows irregular deformation.Set NOTCON = 0, NGAP - number of nodes with initial
gaps, NCYCLE - maximum number of cycles forchecking contact
Application
4. Table Cl illustrates the organization of the input parameters for
program SLAB2, while Table C2 defines the input parameters. Input data is
normally consistent with units of pounds and inches. Mat width and length and
their respective nodal distances are input in units of feet. Input lines are
omitted if the option is not selected. Data must be placed in the correct
format sl wn in Table C2 for proper operation of the program. An example of
input data is shown in Table C3 for analysis of the ribbed mat described in
PART IV. Output data for this problem is shown in Table C4. Deflections are
in inches, moments in lbs-in./in. of width, and shears are in lbs/in, of
width.
C2
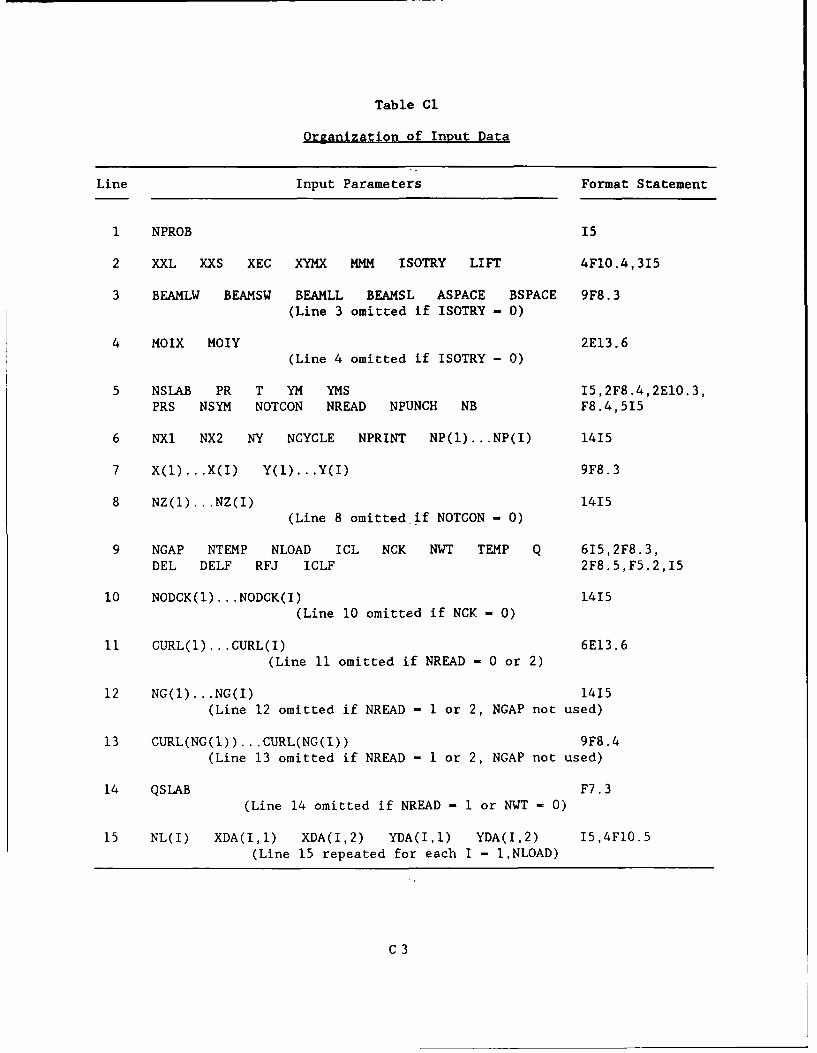
Table C1
Organization of Input Data
Line Input Parameters Format Statement
1 NPROB I5
2 XXL XXS XEC XYMX MMM ISOTRY LIFT 4FlO.4,3I5
3 BEAMLW BEAMSW BEAMLL BEAMSL ASPACE BSPACE 9F8.3(Line 3 omitted if ISOTRY - 0)
4 MOIX MOIY 2E13.6(Line 4 omitted if ISOTRY - 0)
5 NSLAB PR T YM YMS I5,2F8.4,2E10.3,PRS NSYM NOTGON NREAD NPUNCH NB F8 .4,515
6 NXl NX2 NY NCYCLE NPRINT NP(l)... .NP(I) 1415
7 X(1) .. .X(I) Y(l) .. .Y(I) 9F8.3
8 NZ(1) .. .NZ(I) 1415(Line 8 omitted if NOTCON - 0)
9 NGAP NTEMP NLOAD ICL NOK NWT TEMP Q 615,2F8.3,DEL DELF RFJ ICLF 2F8.5,F5.2,I5
10 NODCK(1) .. .NODCK(I) 1415(Line 10 omitted if NOK - 0)
11 CURL(l) .. .GURL(I) 6E13.6(Line 11 omitted if NREAD - 0 or 2)
12 NG(1) .. .NG(I) 1415(Line 12 omitted if NREAD - 1 or 2, NOAP not used)
13 CURL(NG(1)). .. .CURL(NG(l)) MA8.(Line 13 omitted if NREAD - 1 or 2, NOAP not used)
14 QSLAB F7.3(Line 14 omitted if NREAD - 1 or NWT - 0)
15 NL(I) XDA(I,1) XDA(I,2) YDA(I,l) YDA(I,2) 15,4F10.5(Line 15 repeated for each I - 1,NLOAD)
CG3
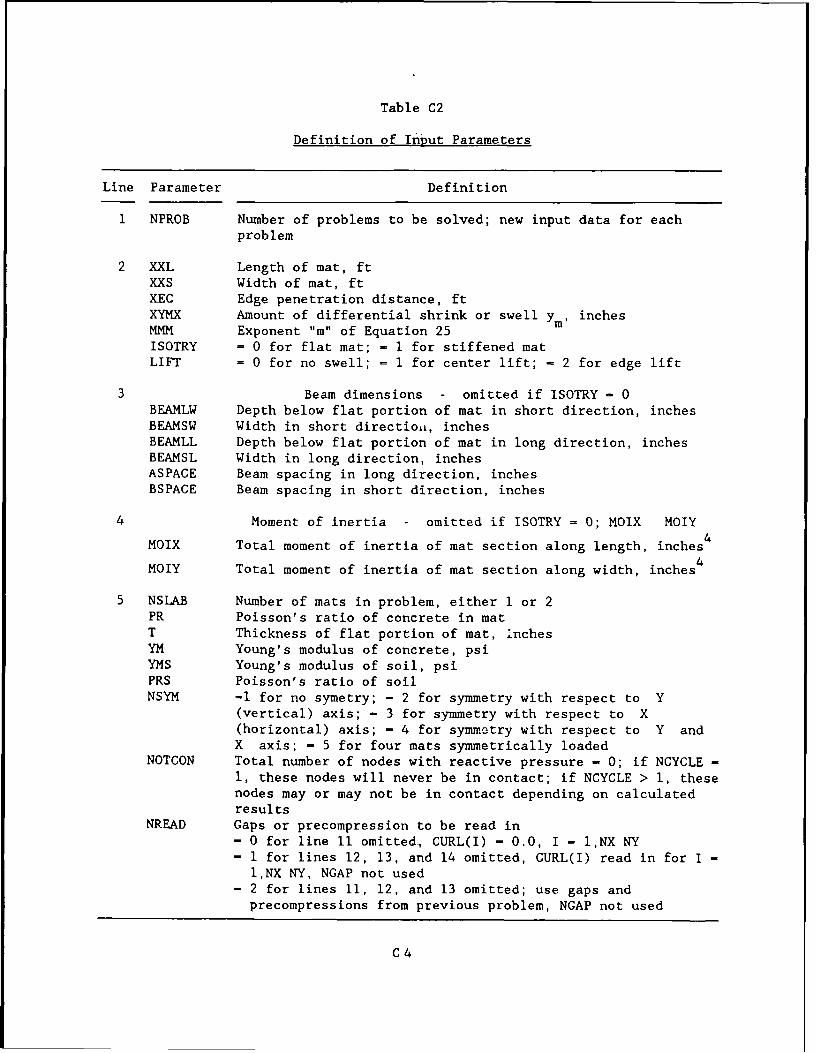
Table C2
Definition of Input Parameters
Line Parameter Definition
1 NPROB Number of problems to be solved; new input data for eachproblem
2 XXL Length of mat, ftXXS Width of mat, ftXEC Edge penetration distance, ftXYMX Amount of differential shrink or swell ym inchesMMM Exponent "m" of Equation 25ISOTRY = 0 for flat mat; - 1 for stiffened matLIFT = 0 for no swell; = 1 for center lift; - 2 for edge lift
3 Beam dimensions - omitted if ISOTRY = 0BEAMLW Depth below flat portion of mat in short direction, inchesBEAMSW Width in short directioi, inchesBEAMLL Depth below flat portion of mat in long direction, inchesBEAMSL Width in long direction, inchesASPACE Beam spacing in long direction, inchesBSPACE Beam spacing in short direction, inches
4 Moment of inertia - omitted if ISOTRY = 0; MOIX MOIY
MOIX Total moment of inertia of mat section along length, inches4
MOIY Total moment of inertia of mat section along width, inches4
5 NSLAB Number of mats in problem, either 1 or 2PR Poisson's ratio of concrete in matT Thickness of flat portion of mat, inchesYM Young's modulus of concrete, psiYMS Young's modulus of soil, psiPRS Poisson's ratio of soilNSYM -1 for no symetry; - 2 for symmetry with respect to Y
(vertical) axis; - 3 for symmetry with respect to X(horizontal) axis; - 4 for symmetry with respect to Y andX axis; - 5 for four mats symmetrically loaded
NOTCON Total number of nodes with reactive pressure - 0; if NCYCLE -
I, these nodes will never be in contact; if NCYCLE > 1, thesenodes may or may not be in contact depending on calculatedresults
NREAD Gaps or precompression to be read in
- 0 for line 11 omitted., CURL(I) - 0.0, I = I,NX NY- I for lines 12, 13, and 14 omitted, CURL(I) read in for I -
I,NX NY, NGAP not used- 2 for lines 11, 12, and 13 omitted; use gaps and
precompressions from previous problem, NGAP not used
C4
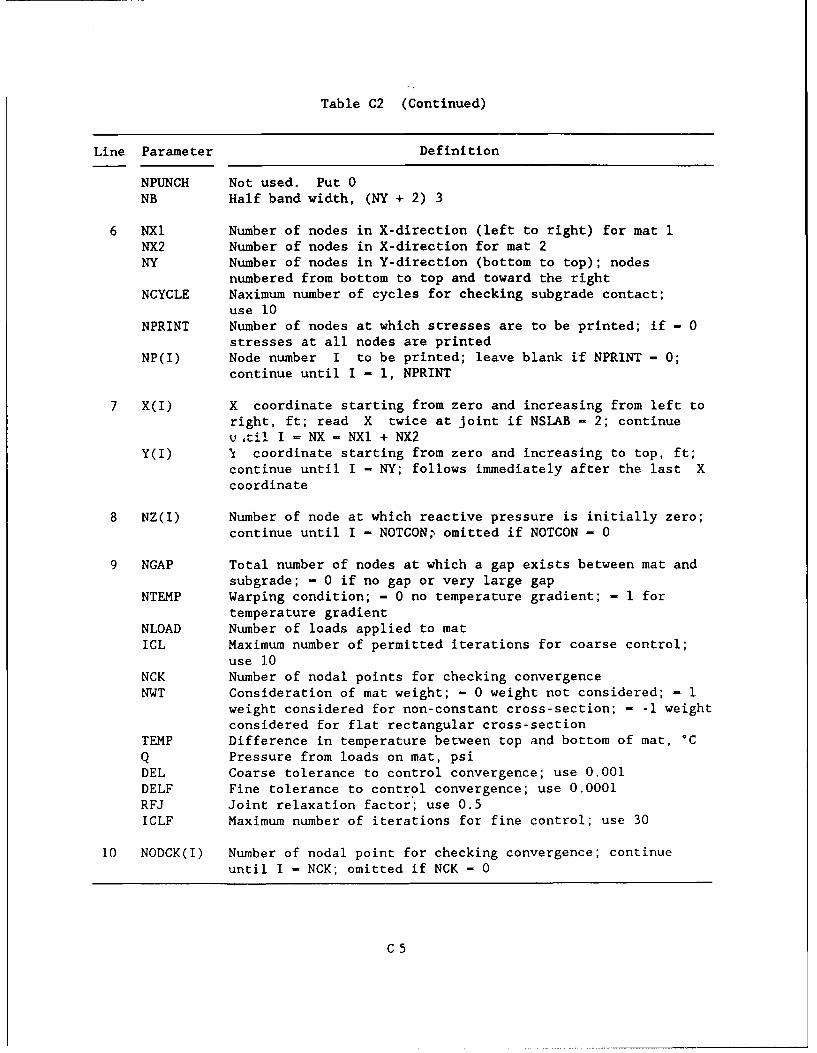
Table C2 (Continued)
Line Parameter Definition
NPUNCH Not used. Put 0NB Half band width, (NY + 2) 3
6 NXl Number of nodes in X-direction (left to right) for mat 1NX2 Number of nodes in X-direction for mat 2NY Number of nodes in Y-direction (bottom to top); nodes
numbered from bottom to top and toward the rightNCYCLE Naximum number of cycles for checking subgrade contact;
use 10NPRINT Number of nodes at which stresses are to be printed; if - 0
stresses at all nodes are printedNP(I) Node number I to be printed; leave blank if NPRINT - 0;
continue until I - 1, NPRINT
7 X(I) X coordinate starting from zero and increasing from left toright, ft; read X twice at joint if NSLAB - 2; continueu Lti! I = NX - NXI + NX2
Y(I) I coordinate starting from zero and increasing to top, ft;continue until I - NY; follows immediately after the last Xcoordinate
8 NZ(I) Number of node at which reactive pressure is initially zero;continue until I - NOTCON\ omitted if NOTCON - 0
9 NGAP Total number of nodes at which a gap exists between mat andsubgrade; - 0 if no gap or very large gap
NTEMP Warping condition; - 0 no temperature gradient; - 1 fortemperature gradient
NLOAD Number of loads applied to matICL Maximum number of permitted iterations for coarse control;
use 1.0NCK Number of nodal points for checking convergence
NWT Consideration of mat weight; - 0 weight not considered; - 1weight considered for non-constant cross-section; - -1 weightconsidered for flat rectangular cross-section
TEMP Difference in temperature between top and bottom of mat, °CQ Pressure from loads on mat, psiDEL Coarse tolerance to control convergence; use 0.001DELF Fine tolerance to control convergence; use 0.0001RFJ Joint relaxation factor; use 0.5IGLF Maximum number of iterations for fine control; use 30
10 NODCK(I) Number of nodal point for checking convergence; continueuntil I - NCK; omitted if NCK - 0
C5
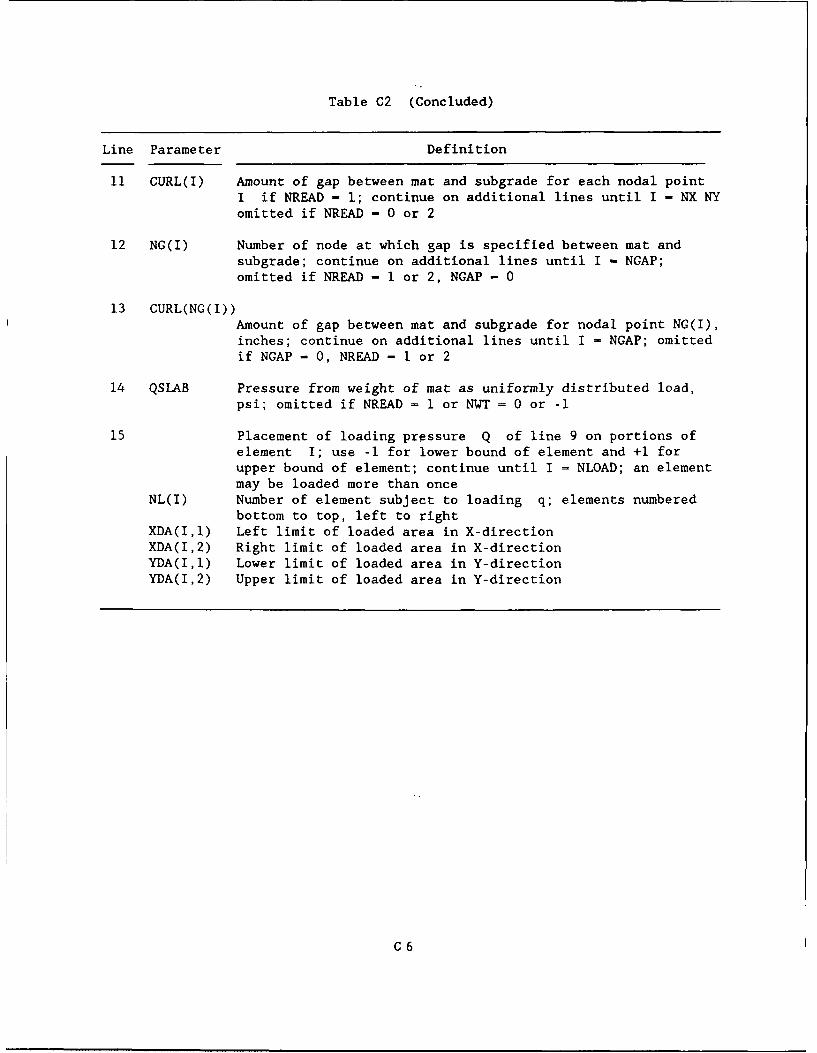
Table C2 (Concluded)
Line Parameter Definition
11 CURL(I) Amount of gap between mat and subgrade for each nodal pointI if NREAD - 1; continue on additional lines until I - NX NYomitted if NREAD - 0 or 2
12 NG(I) Number of node at which gap is specified between mat andsubgrade; continue on additional lines until I - NGAP;omitted if NREAD - I or 2, NGAP - 0
13 CURL(NG(I))Amount of gap between mat and subgrade for nodal point NG(I),inches; continue on additional lines until I - NGAP; omittedif NGAP - 0, NREAD - 1 or 2
14 QSLAB Pressure from weight of mat as uniformly distributed load,psi; omitted if NREAD - 1 or NWT = 0 or -1
15 Placement of loading pressure Q of line 9 on portions ofelement I; use -1 for lower bound of element and +1 forupper bound of element; continue until I = NLOAD; an elementmay be loaded more than once
NL(I) Number of element subject to loading q; elements numberedbottom to top, left to right
XDA(II) Left limit of loaded area in X-directionXDA(I,2) Right limit of loaded area in X-directionYDA(I,I) Lower limit of loaded area in Y-directionYDA(I,2) Upper limit of loaded area in Y-direction
C6

Table C3
Input Parameters for Ribbed Mat, PART IV
i. 3,6,67 .0 0.0 1 1 028. 13. 23. 18. 150. 150.9.251474E 06 4.185904E 06
i .15 8. 1.500E 06 3.OOOE 04 0.4 4 21 0 0 2715 0 7 10 0 0A10 12.5 37.5 62.5 87.5 112.5 137.5 162.5 187.5
2i2.5 237.5 262.5 287.J 312.5 338.9 .0 25.0 50.075 100. 0 125.0 151.8329 30 31 32 33 34 35 36 37 38 39 40 41 4243 44 45 46 47 48 4921 v 116 10 8 1 0.0 4.0 0.001 .0001 0.5 3015 27 45 56 65 75 93 10427 30 31 32 33 34 35 36 37 38 39 40 41 4243 44 45 46 47 48 49
0.5 0.5 0.5 0.0 0.0 0. 1. 1.1. i. 1. 0. 0. 0.5 0.5 0.5 0.5
1.01 - 8 1. -1. -.463 -.0i8 1. .46 I.4 -.08 1, -1. -.406 -.06 1. .442 1.-I. -.40 -1. -.467 . 1. -1. -.46
9 -1. -.46 .46 1.9 .46 1. .46 1.
i -1. -.46 -1. -. 461 .6 1. -I. -.4612 -1. -.46 .442 1.12 .16 1. .442 1.13 -1. -.46 -1. -.4613 .4 1. -1. -.4615 -1. -.46 .46 1.1 .46 1. .46 1.1 -1. -.46 -1. -. 46Ib ,. 1. -1. -.6i3 -1. -.46 .442 1.13 .,6 1. .442 1.
1? -11. -.46 -1. -.46P; .40 1. -1. -.46E1 -1. -.46 .46 1.2A .46 I. .46 1.22 -.-. 46 -1. -.4622 .46 1. -1. -.4624 -I. -.46 .442 1.24 .11 1 .442 1.25 -1. -.46 -1. -.4625 .4b 1. -1. -.462 - -.46 .46 1.27 . ±, .46 1.28 -i. -.46 -1. -.46
,i.42 .
30 o$ 1 1. .442 1.31 1I -. o -1. -31 -. -1. -. 46
C7
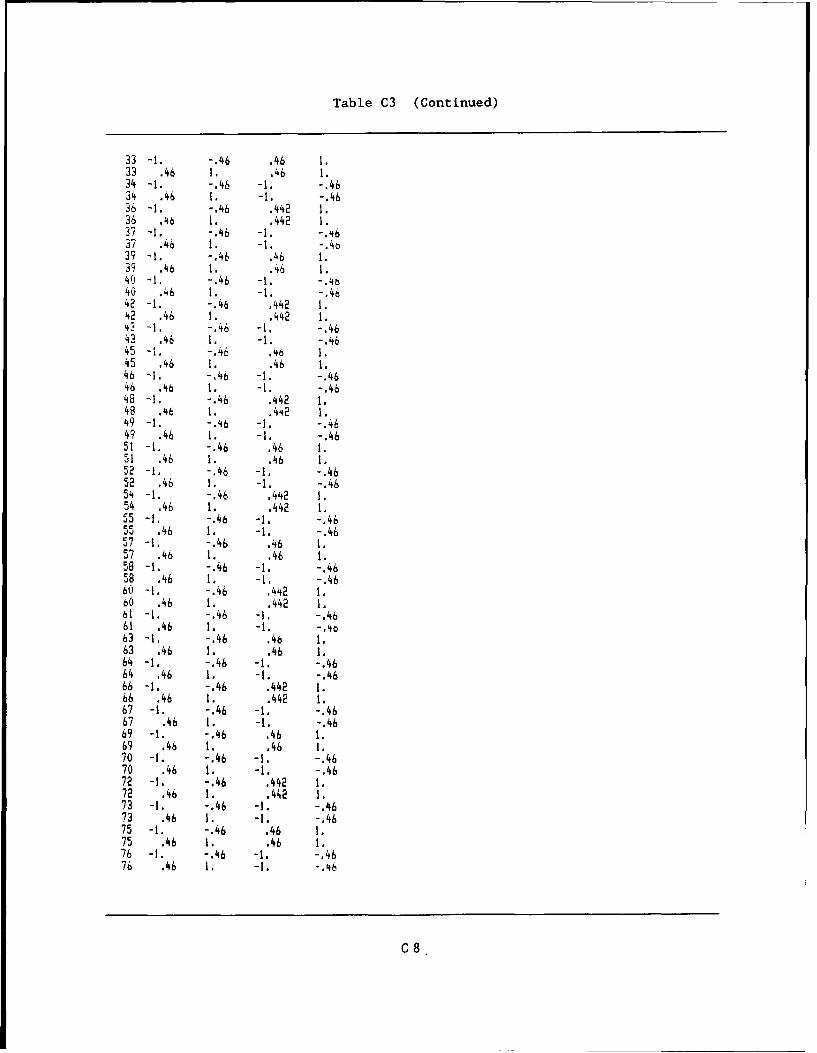
Table C3 (Continued)
33 -1. -. 46 .46 1.33 .46 1. .46 I.34 -1. -. 46 -1. -.4634 .46 1 . -1. -. 4636 -1. -.46 .442 1.36 .46 1. .442 I.37 -1. -. 46 -1. -.4637 .46 1 - .39 -1. -.46 .46 1.39 .46 1I .46 1 .40 -1. -.46 -1. -.4640 .46 1. -1. -.4642 -1. -.46 .442 1.42 .46 1. .442 1.43 -1. -.46 -1. -.4643 .46 1. -1. -.4645 -.46 .46 1.45 .46 1. .46 1.46 -1. -.46 -1. -.4646 .46 1. -1. -.4648 -1. -.46 .442 1.48 .46 1. .442 1.49 -1. -.46 -1. -.4649 .46 1. -1. -.4651 -1. -.46 .46 1.51 .46 1. .46 1.52 -1. -.46 -1. -.4652 .46 1. -1. -.4654 -1. -.46 .442 1.54 .46 1. .442 1.55 -1. -.46 -1. -.46j .46 1. -1. -.4657 -1. -.46 .46 1.57 .46 1. .46 1.58 -1. -.46 -1. -.4658 .46 1. -1. -.4660 -1. -.46 .442 1.60 .46 1. .442 1.61 -1. -.46 -1. -.4661 .46 1. -1. -.4b63 -1. -.46 .46 1.63 .46 1. .46 1.64 -1. -.46 -1. -.4664 .46 1. -1. -.4666 -1. -.46 .442 1.66 .46 1. .442 1.67 -1. -.46 -1. -.4667 .46 1. -1. -.4669 -1. -.46 .46 1.69 .46 1. .46 1.70 -1. -.46 -1. -.4670 .46 1. -1. -.4672 -1. -.46 .442 1.72 .46 I. .442 1.73 -1. -.46 -1. -.4673 .46 1. -1. -.4675 -1. -.46 .46 1.75 .46 1. .46 1.76 -I. -.46 -1. -.4676 .46 1. -1. -.46
C8.
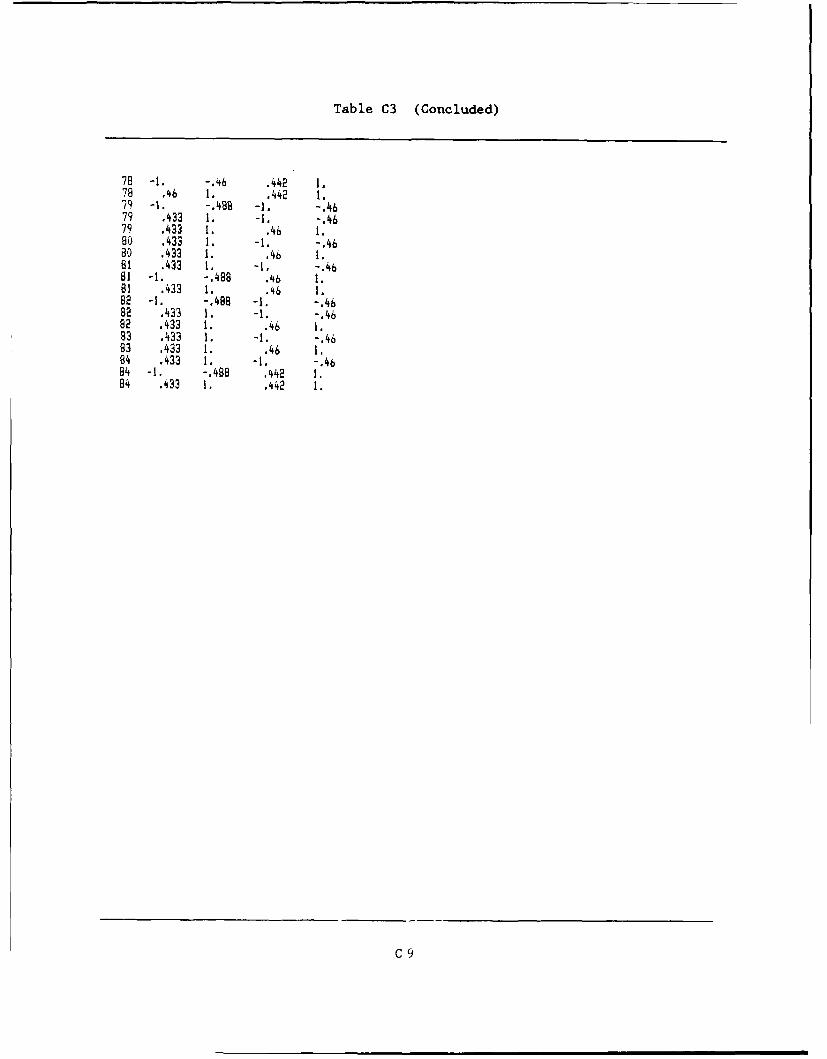
Table C3 (Concluded)
78 -1. -.46 .442 1.78 .46 1. .442 1.79 -1. -. 488 -1. -. 4679 .433 1. -1. -.4679 .433 1. .46 1.80 .433 1. -1. -.4680 .433 1 . .46 1 .81 .433 1. -1. -.4681 -1. -.488 .46 1.81 .433 1. .46 1.82 -1. -.488 -1. -.4682 .433 1. -1. -.4682 .433 1. .46 1.83 .433 1. -1. -.4683 .433 1. .46 1.B4 .433 I. -1. -.4684 -1. -.488 .442 1.84 .433 1. .442 1.
C9
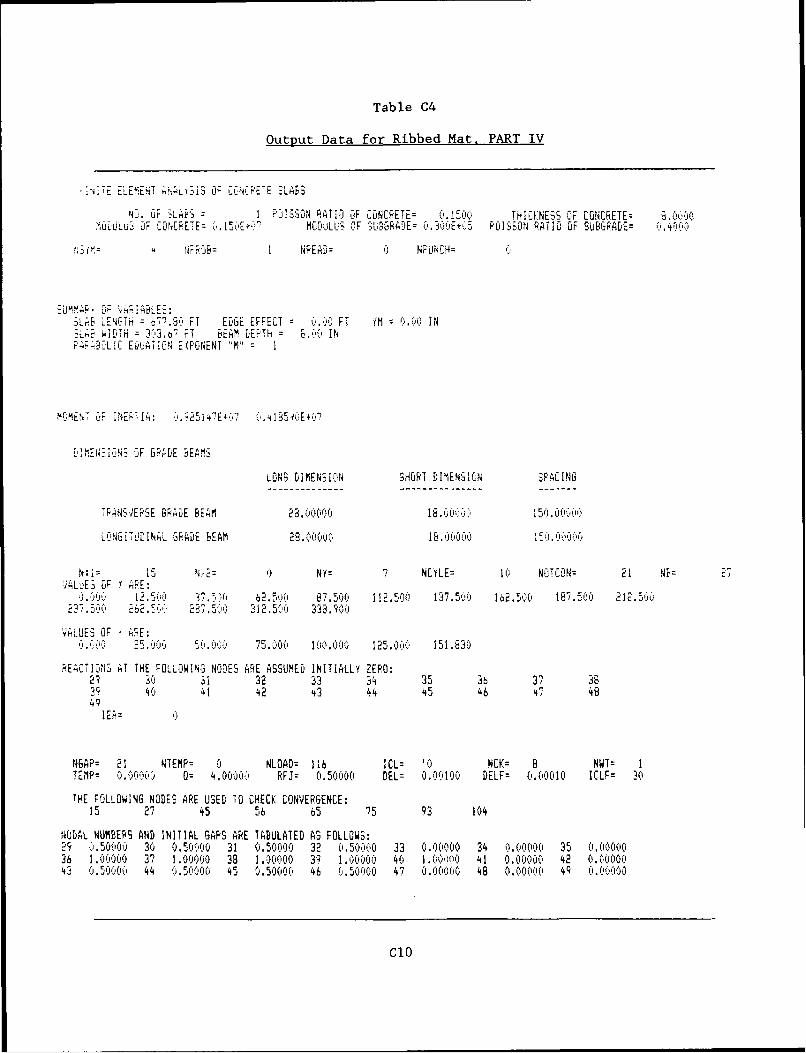
Table C4
Output Data for Ribbed Mat, PART IV
- ! ; ELEMENT INALiSiS OF CCNCRETE SLABSN:. OF SLA : F'ISSON RATIO OF CONCFETE= 0.1500 THICKNESS OF CONCRETE: .0000
i0CULu3 OF ICOREE:E jC i57Et,2 MO'LUl nF ... '"Gq -E . hE+5 POISSON RATIO OF '.000L. ...... .MODGOLUE OFO+6 SUE, SUGADE
4 NFRTB= NREAD= 0 NPUNCH=
SLAB LENLGTH = c76,8 FT ELGE EFFECT = .,)0 FT YM 0.00 INLAB WIDTH = 3,3.&" FT BEAM DEPTH = .00 IN
FAFBLiC EwUATIO!4 EXPONENT M" I
MEMENT OF iNEFfI . ).54E,{7 ,.I41S54E+
. ,,i-ON OF GRADE BE MS
LONG DIMENSION SHORT DIMENSION SPACING
TPANSVERSE GRADE BEAM 22. 00000 18. 00000 150.
LONG TUD I NAL GADE ;EAM 28. 0000 I. 0000 15. .0000
Ni= 15 NX2= NY= 7 NCYLE= 10 NOTCON= 21 NB= 2VALUES OF 1 APE:
0.0 2,500 -_ 1 12. 50 87,J00 112. 500 137.5(0 12. 187.50 212.502-5- 262.5:: 237.500 312.500 338.900
VALUES OF AE:250 5.00 5.0 75.000 160.001 125.00 151.830
REACTI,-NS AT THE FOLLOWING NODES ArE ASSUMED INITIALLY ZERO:
23 30 31 32 33 34 35 36 37 3B3 40 41 42 4+3 44 45 46 47 4849
iER= 0
NGAP= 21 NTEMP= 0 NLOAD= 116 ICL= '0 NCK: 8 NWT= ITEIP= 0.00:00 = 4.0000 RFJ= 0.50000 DEL: 0.0(100 DELF= (.000010 ICLF= 3.0
THE FOLLOWING NODES ARE USED TO CHECK CONVERGENCE:15 27 45 56 65 75 93 104
NODAL NUMBERS AND INITIAL GAPS ARE TABULATED AS FOLLOWS:29 0.50000 30 0.5(000 31 0.50000 32 0.50000 33 0.00000 34 0.00000 35 0. 0000036 1.00000 37 1.00000 38 1.00000 39 1 .00000 40 1 ..00000 41 0.00000 42 0.0000043 0. 50000 44 0,50000 45 0.50000 46 O.50000 47 0. 0:060 48 0.00000 49 0.00000
CIO
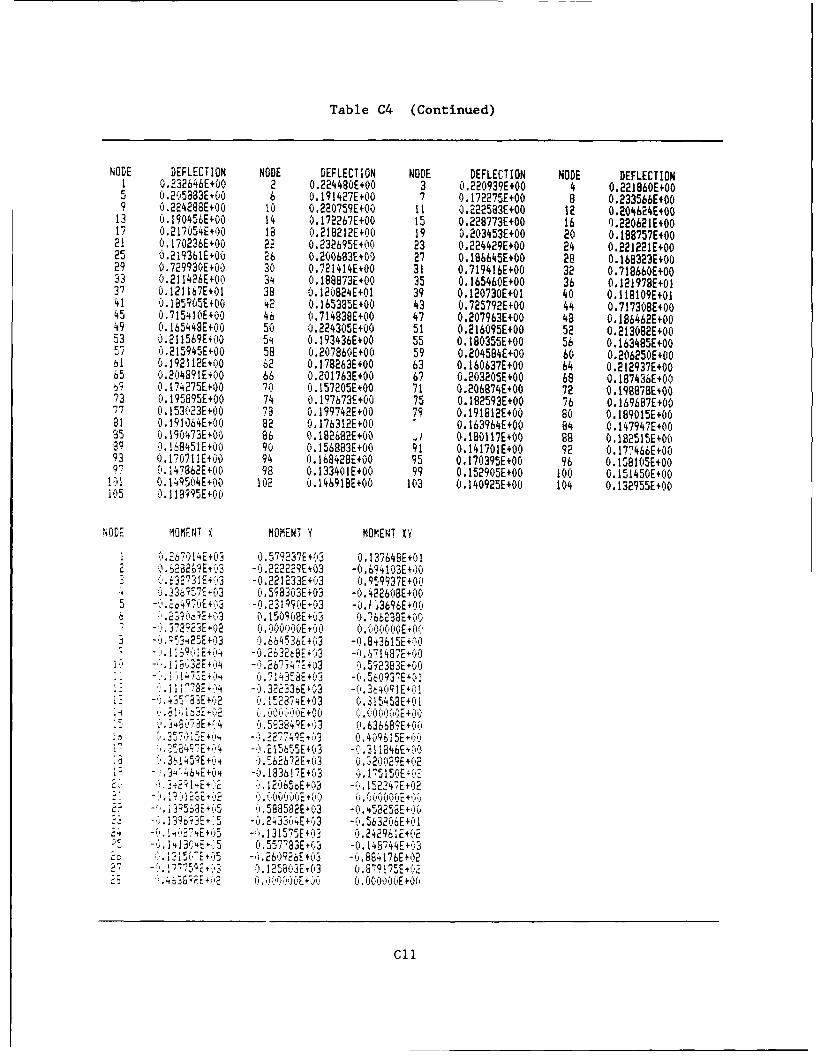
Table C4 (Continued)
NODE DEFLECTION NODE DEFLECTION NODE DEFLECTION NODE DEFLECTIONI 0.232646Et00 2 0.224480E+00 3 0.220939E+00 4 0.221860E+005 0.205883E+00 6 0.191427E+00 7 0.172275E+00 8 0.233566E+009 0.224288E+O0 10 0.220759E+00 11 0.222583E+00 12 0.204624E+00
13 0.150456E+00 14 0.172267E+00 15 0.228773E+00 16 0.220621E+0017 0.217054E+00 18 6.218212E+00 19 0.203453E+00 20 O.18757E.+0021 0.170236E+00 22 0.232695E+00 23 0.224429E+00 24 0.221221E+0025 0.219361E+00 26 0,200683E00 27 0.166645E+00 28 0.169323E+0029 0.729930E+00 30 0.721414E+00 31 0.719416E+00 32 0.718660E+0033 0.211426E+00 34 0.188873E+00 35 0.165460E+00 36 0,12197BE+037 0.121167E+01 38 0.120824E+01 39 0.120730E+01 40 0.118109E+0141 0.185905E+00 42 0.165385E+00 43 0.725792E+00 44 O.717308E+0045 0.715410E+00 46 0.714838E+00 47 0.207963E+00 48 0.186462E+0049 0.165448E+00 50 0.224305E+00 51 0.216095E+00 52 0.213082E+0053 0.211569E+00 54 0.193436E+00 55 0.180355E+00 56 0.163485E+00, 0.21545E+00 58 0.207860E+00 59 0.204584E+00 60 0.206250E+00bM 0.192112E+00 62 0.178263E+00 63 0.160637E+00 64 0.212937E+0065 0.204891E+00 66 0.201763E+00 67 0.203205E+00 68 0.187436E+009 0.174275E+00 70 0.157205E+00 71 0.206874E+00 72 0.198878E+00
73 0.195895E+00 74 0.197673E+00 75 0.182593E+00 76 0,169687E+0077 0.153023E+00 78 0.199742E+00 79 0.191912E+00 8o 0.189015E+0081 0.191064E+00 82 0.176312E+00 0.163964E+00 84 0.147947E+0085 0.190473Et00 86 0.182682E+00 .4 O,1tO7./E+00 88 O.B2515E+0089 0.168451E+00 90 0.156883E+00 91 0.141701E+00 92 0.177466E+0093 .1,?I!E+O0 94 0.168428E+00 95 0.170395E+00 96 0.1B105E+000.147862E+00 98 0.133401E+00 99 0.152905E+00 100 0.151450E+001 9. 1q9504E+00 102 v.14691BE+00 103 0.140925E+00 104 0.132955E+00105 01.119995E+00
NODE MOMNT x MOMENT Y MOMENT xi
I ).267014E+03 0.5 79237E+63 0.137648E+012 1.6282' E+03 -o. 22229E+03 -0,64103E+0
H",63-31E+03 -0.221233E+03 0.959937E+00o u.36q57E+03 0.598303E+03 -0.422608E+00
5 - 0,4qgOE+, -0.231Q90E+03 -0.Ij3696E+000.) E+ ( 1509E+,3 0.766238E+00
- 23E+ 2 ().'iOh'w00E+0 .(I00008 E,0a -0.2503 '.6645 3tr+ '3 -. 843615E+f'0
%-, , 0.+ 26 2 E - ..$ 148S E+'00Ia -. 2E+'4 A267;47+3 0.592383E+m0'1 6,I"I": =+,,.. .,, ,. . 14352E+03 -',5609d E*01
i .I i i" + 02t' -).j~ 32,3i+03 -0 4018;IE+
i2 i - r+"-2 0.152874E+03 0.3'15452E+1
,34 E :4 ,.r94847 +-'3 0. 636683E+060.5?1 5E -.:;.32?740 63 0 40%5Eti0
• .±c ,156S58.0j - .Ifl46E+-it
34cE+'5 4 0',562672E+3 v.2002QE+02-: 4 +464E+ -t. 18361 E+'3 I I7 50E+.:
1'.)65E+03 -,).152247E+022';j - I Kci -, 2 '. 0 () 6 (1E + C)0 0 )000(00E +,:!05b3+o1E'5 8.5jB958E+03 -0. 45225E+'.i.I 3%.EK 5 -0.243i4E+03 -'.i563206E+01
24 - 14I2 4E+':5 -" 131575E+0 0.2 4296iE+02-,1 E f .557"83E+63 -0.148744E+03
Lt., .+ -. 26 926E+63 -0.864176E+027 -*' T775,:.3 I.P5803E,03 0. 879175E+029 . E+,2 0.,", 0 [" .000E+(0
ll
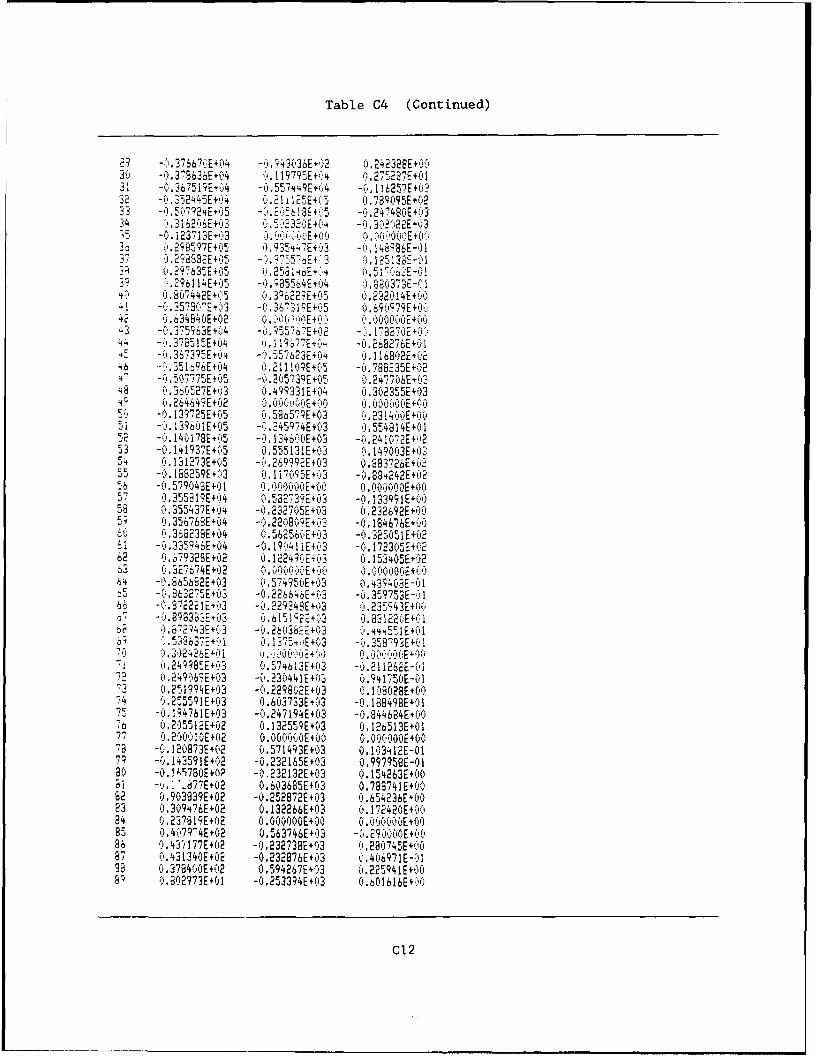
Table 4 (Continued)
29 -0,3766EM -,536E 2 0 O242328E+0030 -0.379636E+04 U 119795E+04 0.275227E+0i3 - E3675"EO4 -0.55"+49E (4 -i6257E0232 -0.35245E+04 A 2i125E+05 O.7895E+0243 -0,+,! 6!3E+ "5 -0.247480E+0334 (n M6 ME+03 0.5M M0+0 -13.0_42H4 3
1- -0, + 0 E+,"0h. i.9?E+5 0 .935447E+03 -0. 14986E-0137 .2?33E+05 -), 755AE'3 0 l 25!3;E-013; ' 0 .2976 -5E .,,5 o. 258 1.46E+,:;4+ 0.5i7062E-013? 0.290 14E+05 -. 48554E+(4 0,81037SE-0140 0i.8042E+ ;5 0. 3922E+05 .2320!4E+0041 -A.35S0MA -(. 36731,'E-05 0.,690979E+004 - 0.634940E+02 0.4 *ioi0OE+ 04 000000E+00
i3 -6.375563E+04 -0 5 E+02 -' -' . 170#4 -..373515E+04 01,i977E+i4 -0.268276E+014, -0. 67395E+ -0.552E0 E 1 A4b -0.351696E+04 0.211109E+05 -0.788235E+3247 -0. 57775E+05 --. 205739E+05 0.2477.)E+048 0.360527E+03 .499331E+04 0.302355E+034c 0o26464?E+02 0,0 0 000E+01 0.0 000iE+05;v -0. 139725E+05 6,586579+63 0,231400E+0051 -0.13?0IE+05 -' .245974E+03 051 152 -0.140178Et,5 -0.134600E+03 -,.2410'2E+0253 -0,14 1937E+05 0.55531.. n- 149003E+O,3
54 (1.131273E+05 -0.269992E+03 0.983726E+0255 188259E+03 0. 1i70'5E+03 -0,884242E+(25 -0.57043E+0I 0, 00000E+00 0.00000E+0057 0.355819E+04 0.532733E+03 -0.133991E+0058 0.355437E+04 -0.2705E+3 0. 32692E+005; 0.356763E+04 -0,22080E+0i -0.184676E+006 .... E+04 0.566*.,. -0.32505E+(261 -0 5 946E504 -0.19041iE+03 -61.72305E+0262 0.679328E+02 0.12249(E+03 0.153405E+02
S6 .3274E+02 O. E0005M +i0 "."0(E+Ot4 -0.865662E+03 0.57.95E+03 U..,5 -,.863275E+03 -0.226646E+03 -, 359. E-,.166 -0.d 3i21EI03 -i,229P49E+,3 0. 23533E+006 -0 .8d33E+03 0,0151E+03 0. YE+-1
to 0%53D03 -0,26038 +03 0.4,55E+016q 1 M..K6EOM j. 1375,fkjE+0;3 -0.358793EKfM70 0.30.M.EMOi 0,c0 ' 0 E+ 0 0.0000 0E +0(i
d0,24'5E+:3 0'.574613E+03 -0,211262E-O172 0.21906ES03 -0.230 E+0B 0, 11750E-0173 0.251994E+03 -0.229802E+03 I BO08E+0074 ,,.255591E+03 0 .60373E*03 -0.B8498E+0175 -0. ,?761E+03 -0,24719E+03 -0.844684E+u07b 0,205512E+02 0.132559E+03 0.126513E+01777 0.2,00!0E+02 0.Ol,00 EO 0 .000 000E+O078 -0. 120873E+02 0.571493E+03 0.103412E-0179 -0.13591E+02 -0.232165E+03 0.997958E-0180 -O.!A5780E+A? -0,232132E+03 0.154263E+00;I -,.. -877E+02 0.603685E+03 0.788741E+O0S2 0.903839E+02 -0.252872E+03 0.654236EPOO83 0.309476E+02 0.132266E+03 0.172420E+084 0.2378 19E+02 0.000000E+00 0.00000E+0085 0.407q4E+02 0.563746E+03 -i.29006A+f,086 0,43'i177E+02 -0.23273SE+03 0,280745E+'.087 0.431340E+02 -0.232876E+03 .,406971E-0138 0.378400E+02 0.594267E+(3 i.22541E+006 0.802973E+01 -0,253394E+03 0.01616E.)00
C12
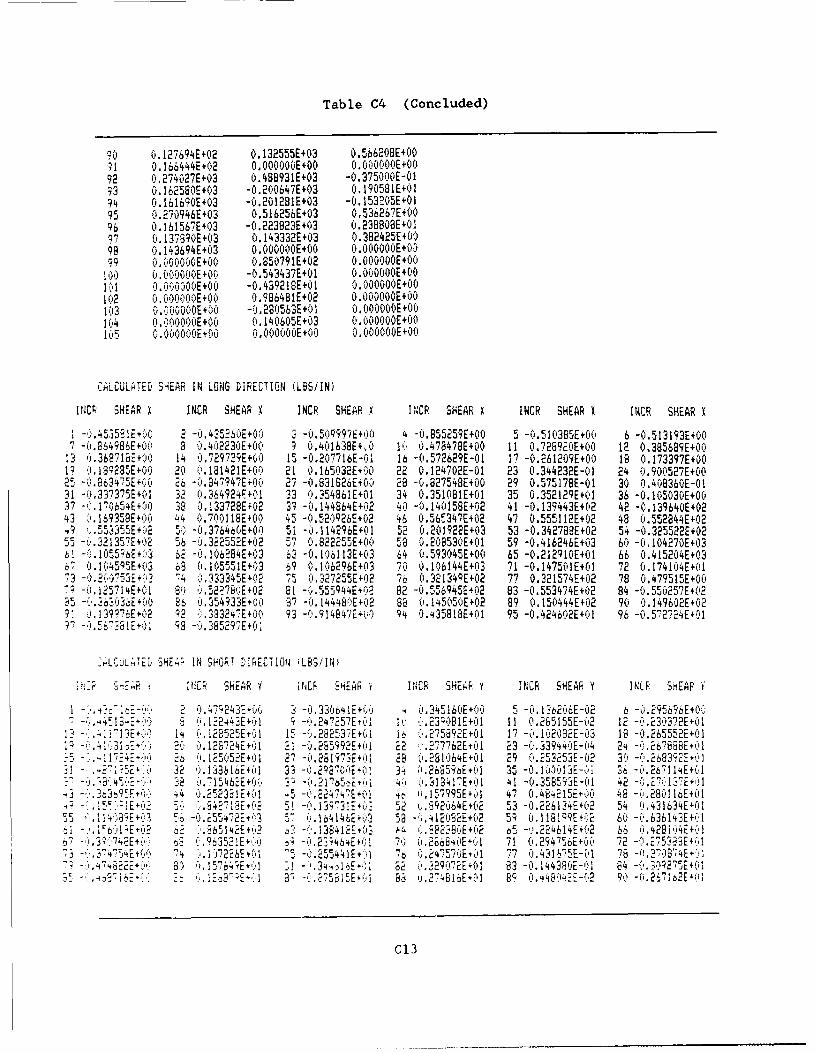
Table C4 (Concluded)
9 6.127694E+02 0.132555E+03 0.566208E+0091 0.166444E+02 O.O00000E+00 0.000000E+0092 0.274027E+03 0.498931E+03 -0.375000E-0193 0.162560E+03 -0.200647E+03 0.190581E+0194 0.161690E+03 -0.201281E+03 -0.153205E+0195 0.270946E+03 0.516256E+03 0.53626?E+0096 0.161567E+03 -0.223823E+03 0.23BBOBE+01"7 0. 137890E+03 0. 143332E+03 0.382425E+00
98 0.143694E+03 O.OOOOOOE+00 0.O00000E+0-99 O.O00000E+00 0,850791E+02 O.O00000E+00100 0.000000E+00 -0.543437E+01 O.O00000E+00I1 O0OOOE+00 -0,439218E+01 O.O00000E+00
102 0 .060000E+00 (1,986481E+02 0. (00OOOE+00103 0.O00000E+00 -0,280563E+01 0.O00000E+001(04 0.00000E+60 0.140605E+03 O.OOOOOOE+001K5 0.060000E+00 ,.O000f60E+00 O.OOOOOOE+00
CALCULATED SHEAR IN LONG DIRECTION (LBS/IN)
INCP SHEAR X INCR SHEAR X INCR SHEAR X iFCR SHEAR X INCR SHEAR X INCR SHEAR X
I -,.453551EtK0 2 -0.435260E+00 S -0.50q997?E+00 4 -0.855259E+00 5 -0.510385E+40 6 -0.513193E+004-.'C64986E+O(' 8 ,).402230E+00 9 0.401638E+,0 1K 0.478478E+00 11 0.728920E+00 12 0.385689E+00
I VV368718-+0 14 0.72972iE+0 1 5-0 .0'7IhE- i 16-0.572629E-01 17 -0.261209E+00 18 0.173397E+0019 1.'25E+O 20 (.181421E+00 21 0.165*32E+0 22 0.124702E-01 23 0.344232E-01 24 0.900527E+0025-8 ,7E+O 26 -0.847947E+60 27 -0.831826E+O0 28 -0.827548E+00 29 0.575178E-01 30 0.408360E-0131 -.337375E+01 32 6.364924r+01 33 0.354861E+01 34 0.351081E+01 35 0.352129E+01 36 -0.105030E+0037 -".4654E+'0 38 0.133728E+02 39 -0.144864E+02 40 -0.140158E+02 41 -0.139443E+02 42 -0.139640E+0243 ).16935+0 44 .01 1BE+0 45 -0.526926E+02 46 0.565347E+02 47 0.555112E+02 48 0.552844E+02
9 .,S33"E+SC 1 -0.360E+00 5i 1.142%E+01 52 0.201922E+03 53 -0.342788E+02 5f -0.325522E+0205-v.3213572+02 56 -0.322552E+02 57 0.822255E+00 58 0.208530E+01 59 -0.416246E+03 60 -0.104270E+03
1-.I5E+K3 62 -0.1062B4E+03 3 -0 106113E+03 64 0.593045E+00 65 -0.212910E+01 66 0.415204E+030 .I(595E+03 68 (.15551E+03 69 106296E+03 70 0i.106144E+03 71 -0.147501E+01 72 0.174104E+01
i3 -0 u0 5Et3 -4 0.q33345E+02 7C 0.327255E+02 76 0.321349E+02 77 0.321574E+02 78 0.479515E+00i25714E+01 8 ?G 522%0E+02 81 -M.55944E+,2 82 -. c,945E+02 83 -0.553474E+02 84 -0.55 7E2572E
-'.8'1 .354933E+00 E-O.1444BOE+02 88 0.i45C50E+02 89 0.150444E+02 90 0.149602E+02t 139,76E+(i92 3 K.383247E+1" 93 -r 914847E+O0 94 0.435818E+01 95 -0.424602E+01 96 -0 .572724E +01
? -. 581E+01 93 -O.385297E+6l
Lu', TE SHEP IN SHO;T DIRECTi0ii 'LBS/IN.
PC E SHEAR y rcp S4EAR y INCR SHEAFR y INCR SHEAR Y INLF SHEAP Y
y.+--i0(, 0.47-.243E , - + ).345160E+(0 5 -0. 1362C6E-02 6 -0.295696E+00.. "4. " .- -. ,-4..12244,E+'2 1 . 23 0BIE+01 11 0.2651"5E-'2 12 -0.230372E+01
-, E+O i4 C,. 128525EtOI 15 -. 282537E+(,i !L ' .275892E+01 17-C.I102032E-03 18 -0.26552,E+(01-'.41'3 ' .. 0(.12S?24E+,)I '.SB5992E+Ci E2 T. K7762E+0'1 23 - .339440E-04 24 -. 61888E+( I.ISE) 26 0,125(152E+01 2 -0.281973E+01 28 '.23I664E+01 29 0.253253E-02 30 -0.26832Et:I
31i- ,*4E")5EO 32 1-.I8616E+i*1 33 -.2Q87,E (I 3 ',2696E+01 35 -0.liC)i3E-O i ^0b ,2 I1E+K1-_ :5:-,-)..4 K, ' 3 .215462E+0 i 4 0.51@417EtOl 41 .O. J-.' 422 7-.3-:.3C3-95 , 4 0.25234t+, 5- 224N7E+01 i) I ,17q95E+1 47 0.484215EO" 48 -0,280116E+01
E. . . .- 50 .4 E 2,,eE +. 5 2 -. 13973-+03 2 6..92064E+02 53 -0.226134E+02 54 '.431634E-015. -0,25 2+ 5 .Ib414bE+:3 53 29E+02 5q O.11819E+Of' 64'- .63613E+iI
I. 1E +0 62 " ,6514E+,'. 3 13 8412E03 4,P2 4G3E+02 65-I.224614E+2 66 6.428i14E+ I' -i).374EE+( .K.963521E+' -";,2^-;464E+01 7' U2668'0EK'1 71 (, 29456E+ '20.2753.E+ !
73-0.375E ,' -.1)472291 2. 55441E+11 t 0, 24570E+01 17 0, 431 75E-01 8- ,27J"4E +7) -,'t.'22, - K',57592+01 " 4-,12,i -. 6 29K4?2E+1 83 -0.144386-01 84 (.3,E9275E+0:
2 E 8 1 rj-6,;E,'EI SS-K .4971- ', ,1S E+'±I d-'3,275815E+K'I 81E * 1 ?48162+1 82 'O1446- 12 90 ... 1 E,1
C13
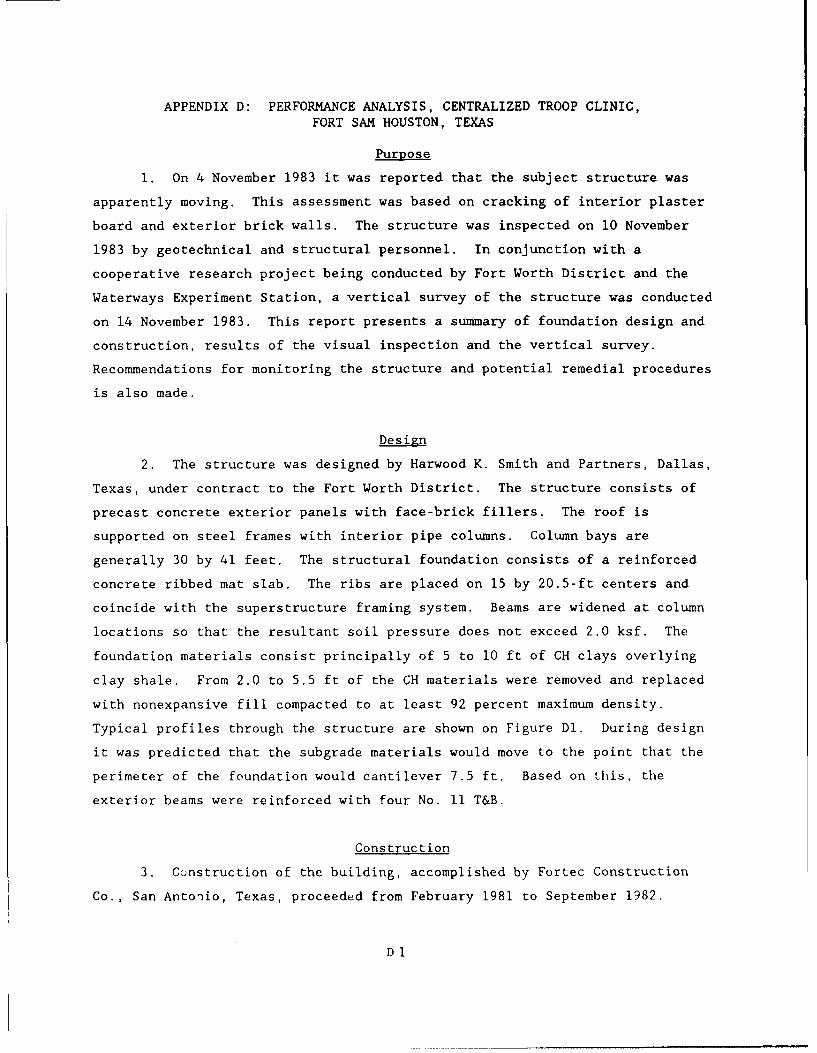
APPENDIX D: PERFORMANCE ANALYSIS, CENTRALIZED TROOP CLINIC,
FORT SAM HOUSTON, TEXAS
Purpose
1. On 4 November 1983 it was reported that the subject structure was
apparently moving. This assessment was based on cracking of interior plaster
board and exterior brick walls. The structure was inspected on 10 November
1983 by geotechnical and structural personnel. In conjunction with a
cooperative research project being conducted by Fort Worth District and the
Waterways Experiment Station, a vertical survey of the structure was conducted
on 14 November 1983. This report presents a summary of foundation design and
construction, results of the visual inspection and the vertical survey.
Recommendations for monitoring the structure and potential remedial procedures
is also made.
Design
2. The structure was designed by Harwood K. Smith and Partners, Dallas,
Texas, under contract to the Fort Worth District. The structure consists of
precast concrete exterior panels with face-brick fillers. The roof is
supported on steel frames with interior pipe columns. Column bays are
generally 30 by 41 feet. The structural foundation consists of a reinforced
concrete ribbed mat slab. The ribs are placed on 15 by 20.5-ft centers and
coincide with the superstructure framing system. Beams are widened at column
locations so that the resultant soil pressure does not exceed 2.0 ksf. The
foundation materials consist principally of 5 to 10 ft of CH clays overlying
clay shale. From 2.0 to 5.5 ft of the CH materials were removed and replaced
with nonexpansive fill compacted to at least 92 percent maximum density.
Typical profiles through the structure are shown on Figure Dl. During design
it was predicted that the subgrade materials would move to the point that the
perimeter of the foundation would cantilever 7.5 ft. Based on this, the
exterior beams were reinforced with four No. 11 T&B.
Construction
3. Cunstruction of the building, accomplished by Fortec Construction
Co., San Antonio, Texas, proceeded from February 1981 to September 1982.
Dl
V.(5
1 ,I.
-4 Na
J~1 -j
zt
° '
I' -
1 -o,,,-.-=
Figure Dl. Subsurface profiles, Troop Medical Clinic
Fort Sam Houston
D2
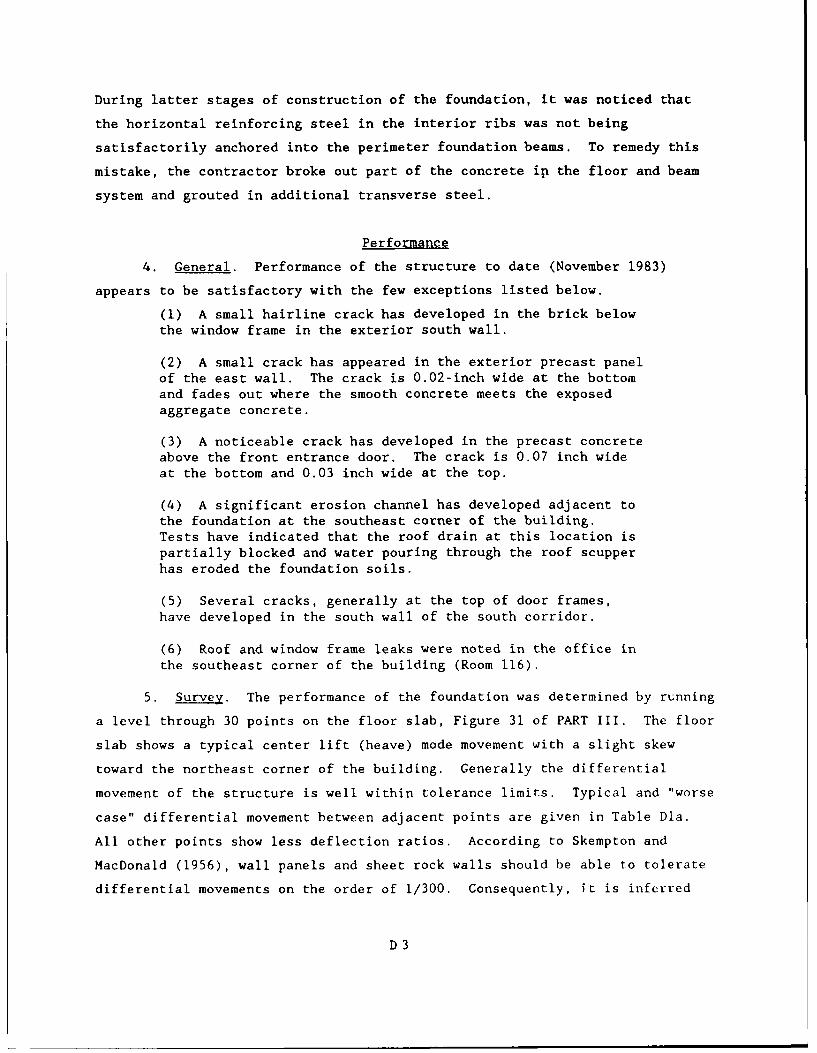
During latter stages of construction of the foundation, it was noticed that
the horizontal reinforcing steel in the interior ribs was not being
satisfactorily anchored into the perimeter foundation beams. To remedy this
mistake, the contractor broke out part of the concrete ip the floor and beam
system and grouted in additional transverse steel.
Performance
4. General. Performance of the structure to date (November 1983)
appears to be satisfactory with the few exceptions listed below.
(1) A small hairline crack has developed in the brick belowthe window frame in the exterior south wall.
(2) A small crack has appeared in the exterior precast panelof the east wall. The crack is 0.02-inch wide at the bottomand fades out where the smooth concrete meets the exposedaggregate concrete.
(3) A noticeable crack has developed in the precast concreteabove the front entrance door. The crack is 0.07 inch wideat the bottom and 0.03 inch wide at the top.
(4) A significant erosion channel has developed adjacent tothe foundation at the southeast corner of the building.Tests have indicated that the roof drain at this location ispartially blocked and water pouring through the roof scupperhas eroded the foundation soils.
(5) Several cracks, generally at the top of door frames,have developed in the south wall of the south corridor.
(6) Roof and window frame leaks were noted in the office inthe southeast corner of the building (Room 116).
5. Survey. The performance of the foundation was determined by running
a level through 30 points on the floor slab, Figure 31 of PART III. The floor
slab shows a typical center lift (heave) mode movement with a slight skew
toward the northeast corner of the building. Generally the differential
movement of the structure is well within tolerance limits. Typical and "worse
case" differential movement between adjacent points are given in Table Dla.
All other points show less deflection ratios. According to Skempton and
MacDonald (1956), wall panels and sheet rock walls should be able to tolerate
differential movements on the order of 1/300. Consequently, it is inferred
D3
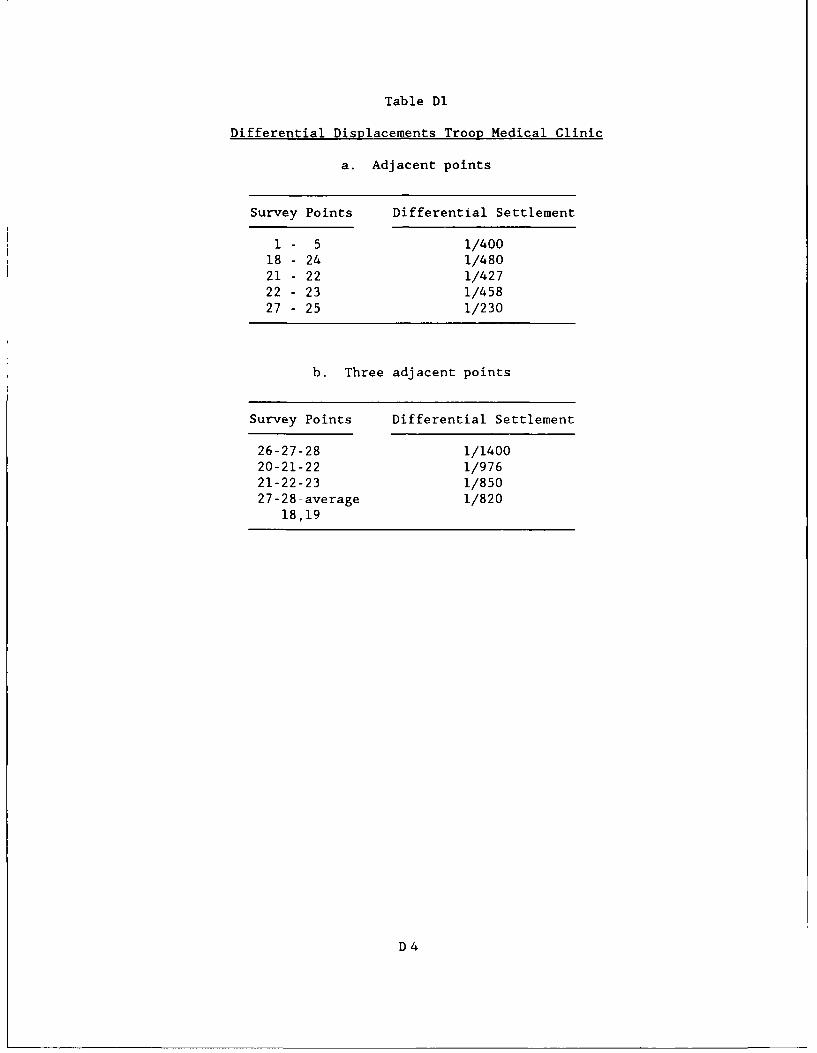
Table DI
Differential Displacements Troop Medical Clinic
a. Adjacent points
Survey Points Differential Settlement
1- 5 1/40018 - 24 1/480
21 - 22 1/427
22 - 23 1/45827 - 25 1/230
b. Three adjacent points
Survey Points Differential Settlement
26-27-28 1/140020-21-22 1/97621-22-23 1/85027-28-average 1/820
18,19
D4
that except in the area of survey points 27 - 25, the structure is performing
satisfactorily.
6. Woodburn (1979) has developed performance criteria based on the
differential movement of three adjacent points. Typical and "worse case"
deflections using three adjacent points are shown in Table Dlb. According to
Woodburn, masonry wall panels and sheet rock walls should be able to tolerate
differential movements on the order of 1/800. As shown by the above table,
the movement at the southeast corner of the building is approximating the
tolerance limit.
Recommendations
7. It is recommended that the roof drains in the southeast corner of
the building be repaired to a functional condition. Although it may be only
accidental, it is noted that the poorest foundation performance coincides with
the malfunctioning roof drain.
8. The progression of cracks in the precast concrete panels should be
monitored on a bi-weekly basis. The resident office personnel have placed
small dental plaster patches across the crack to make a quick determination of
additional movement.
9. Should movement progress to any significant extent, the foundation
should be stabilized before the building moves to the extent that the Pest
Management Facility has moved. It is considered that some form of intrusion
groutng will be used, such as was done for the Night Lighting Vault, Fort
Polk, should it become necessary to affect foundation repairs.
1,5
APPENDIX E: INFLUENCE OF SOIL MODEL ON MAT PERFORMANCE
Introduction
1. Parametric analyses were completed using plate on semi-infinite
elastic program SLAB2 and plate on Winkler foundation program WESLIQID to
determine the influence of soil behavior on mat performance. Influence of
soil type was determined by a comparison of mat performance calculated by
SLAB2 and WESLIQID. Influence of soil stiffness was determined by
calculations of bending moments using program SLAB2 for mats subject to
imposed heave.
2. Programs SLAB2 and WESLIQID were used to analyze the bending moments
and displacements of a 200-ft square, flat concrete mat with a Young's modulus
of 432,000 ksf and Poisson's ratio 0.15. The soil Poisson's ratio was
assumed 0.3. Symmetrical loads were applied so that only 1/4 of the mat need
be modeled by the finite element mesh. This mesh was divided into 100 square
elements of equal size of 10 ft on each side.
Influence of Soil Model
3. Bending moments calculated by programs SLAB2 and WESLIQID for
similar displacement patterns caused by imposed loads and heaves may be
compared to determine influence of the soil model. An analysis of the 200-ft
square mat of 12-inch thickness was performed first using SLAB2. Input
parameters included a uniform applied pressure q - 2 psi and Young's soil
modulus E - 400 ksf. Bending moments and displacements distributed from thes
center to middle edge calculated by this initial run using program SLAB2 are
shown in Figure El. The coefficient of subgrade reaction for each nodal point
of the mesh was subsequently determined by
ksf = q/p (El)
where p is the settlement calculated from SLAB2 at each nodal point.
Program WESLIQID was then applied using these ksf for the imposed load q -
2 psi. Displacements calculated by both programs SLAB2 and WESLIQID for
pressure q - 2 psi in Figure El are essentially idential as expected. The
bending moments calculated by these programs differ near the edge where
results from SLAB2 indicate larger bending moments than rest Its from WESLIQID.
El
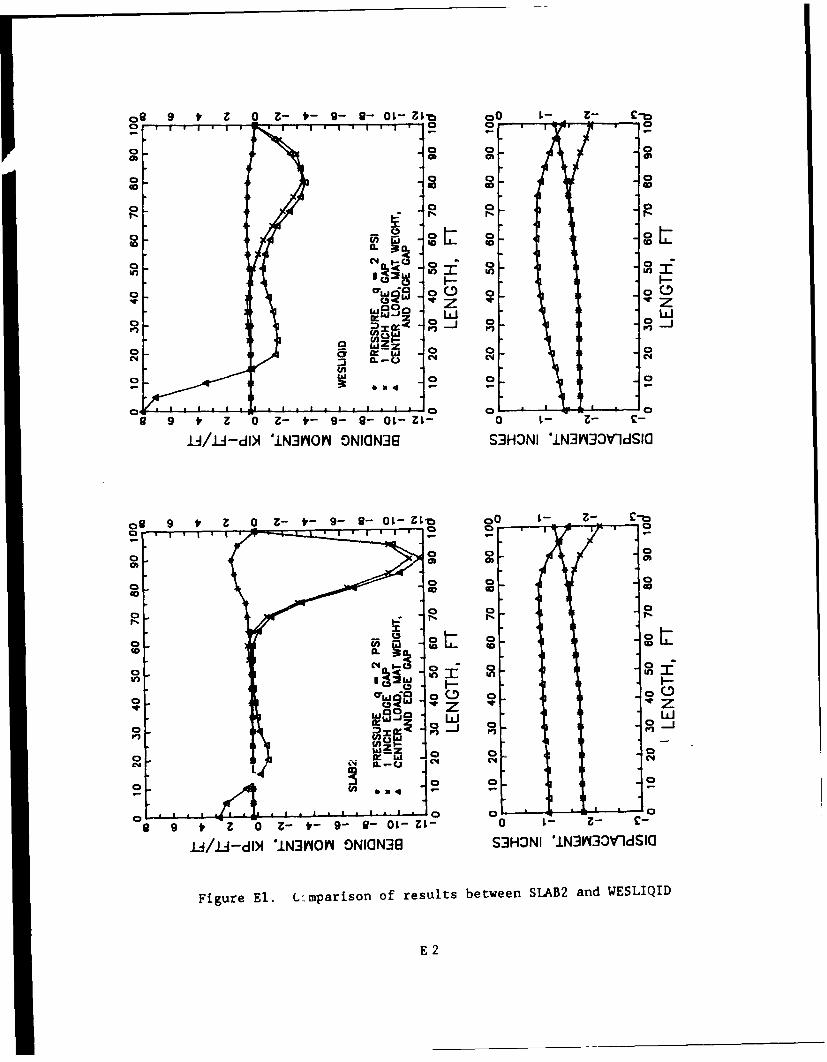
oz9 0 Z-t- 9-a- OI-~ nio I-- Z- C
cc tw a0
0W@ 0 0 00
o * 0 0 o 0
o (n
04 I-C C4 0 N
a 9 - t 9 -I-z - 0 t Z
oJi-I AVO ONON1 a3ON aI33O SO
oo go ~ 4
0~ COJa
0r9 0 0- 00
0 W z 0
0- 0 0- 0
0 (0
9~~C'~ t - 9 9 10
aE 2

4. Programs SLAB2 and WESLIQID were applied in a second analysis using
q - 2 psi and an imposed identical 1 inch edge gap around the perimeter of
the mat, Figure El. Displacements calculated from this second analysis
indicate edge-down displacements, but the mat on elastic soil appears more
flexible with greater edge down displacement than the mat on Winkler soil.
Bending moments are substantially more negative near the edge for the mat on
elastic soil of program SLAB2 than the mat on Winkler soil of program
WESLIQID.
5. A third analysis imposci a center load of 115,200 pounds on the mat,
the weight of the mat, and the same edge gap as the second analysis, Figure
El. Displacements calculated for this third analysis are less than those for
the previous two analyses because of the smaller applied loads. The
displacement pattern calculated by SLAB2 does not show as much settlement in
the center as calculated by WESLIQID. The elastic material shares the load
with adjacent soil elements, while the Winkler soil does not. The positive
bending moments calculated by WESLIQID are subsequently much larger near the
mat center than those calculated by SLAB2.
Influence of Soil Stiffness
6. Program SLAB2 was applied to determine the influence of the
stiffness of an elastic soil on the maximum bending moment. An imposed center
heave was simulated by applying a I inch gap at the mat perimeter. Edge lift
was simulated by applying a 0.4 inch gap beneath the mat center. The mat is
sufficiently flexible such that the mat is fully supported by the soil. The
m-ximum negative bending moments due to center lift, Figure E2a, occurs
approximately 10 ft from the mat perimeter and maximum positive bending moment
imposed by edge lift, Figure E2b, occurs at the center. Figure E2 shows that
increasing the soil elastic modulus causes significant increases in the
magnitude of the maximum bending moments when heave is imposed. If heave is
not imposed, an increasing elastic soil modulus tends to decrease bending
moments because of improved soil support and reduced settlement and mat
distortion.
E3
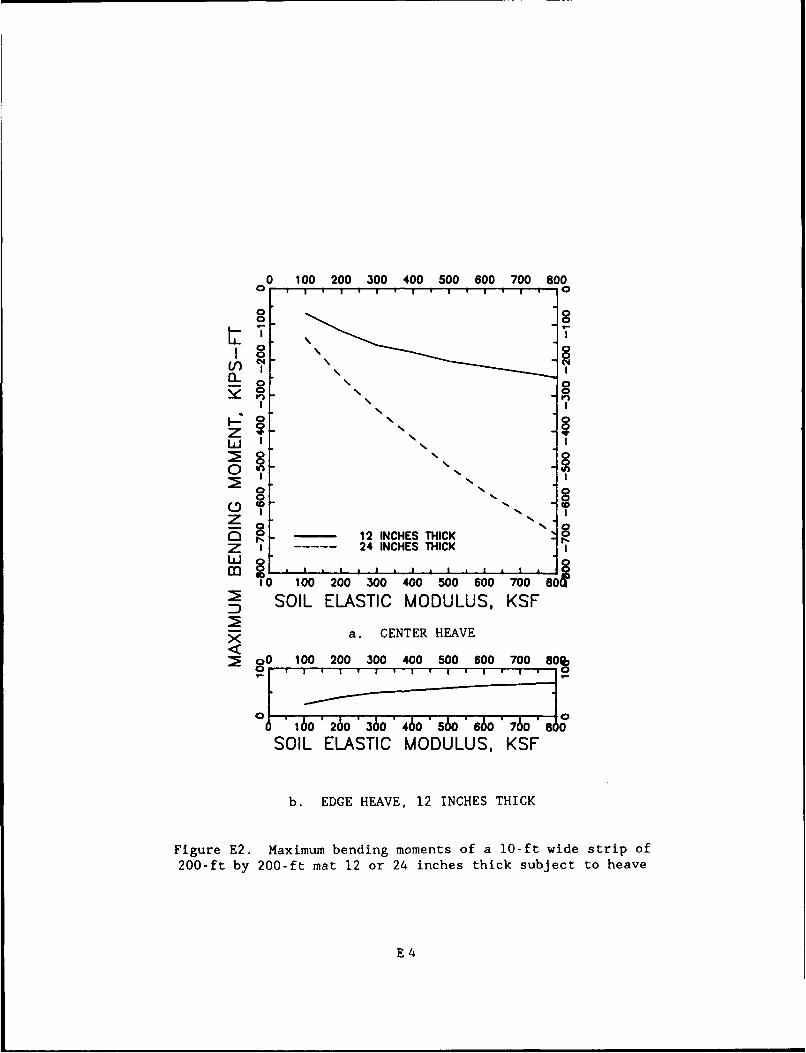
0 100 200 300 400 500 600 700 800
o 0
8 8
CL 0 0
L I I
12 INCHES THICK
Z --- 24 INCHES THICK
C'4
10 100 200 300 400 500 600 700 So
" SOIL ELASTIC MODULUS, KSF
(I)
a. CENTER HEAVE
o0 100 200 300 400 500 600 700 80%
00
11 160'260 360 460 560 60 7EoOf0SOIL ELASTIC MODULUS, KSF
b. EDGE HEAVE, 12 INCHES THICK
Figure E2. Maximum bending moments of a lO-ft wide strip of200-ft by 200-ft mat 12 or 24 inches thick subject to heave
E4
APPENDIX F
LIGHT TRACK VEHICLE FOUNDATION DESIGN
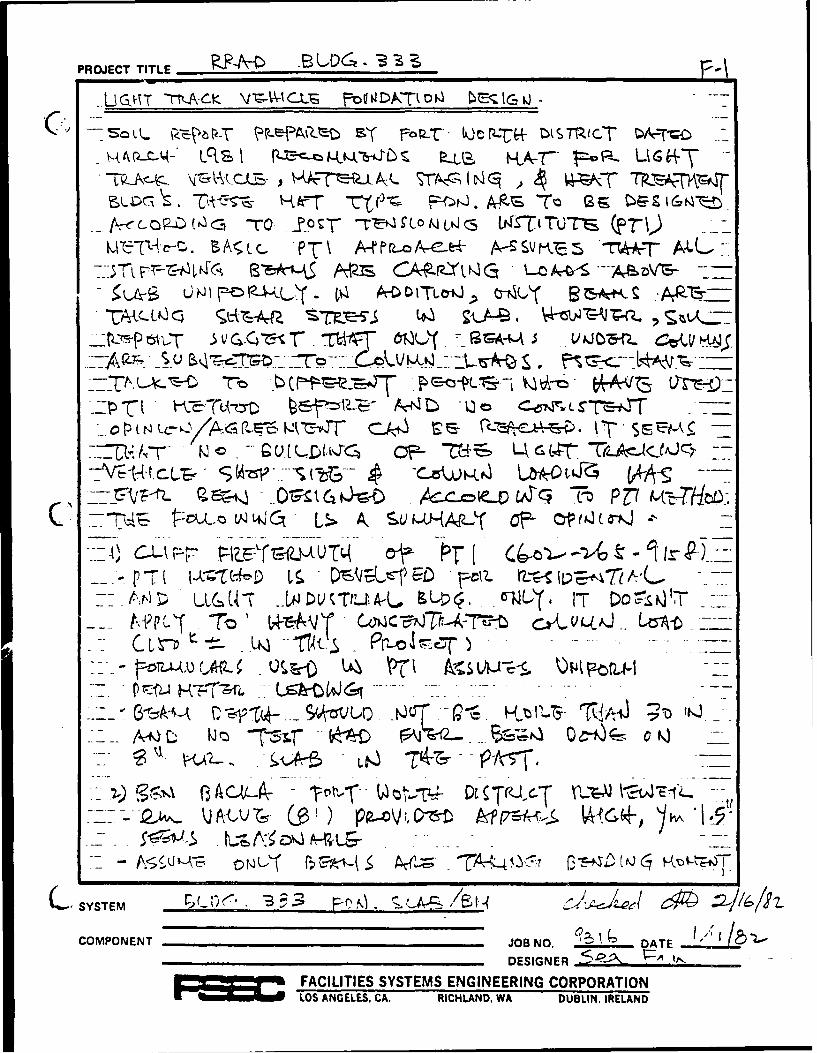
PROJECT TITLE U 6.
--AJT ThNA-CK VYf'CCLS F \ToV0 t Ak7M0
SOL~~C4 k.ASA C~~ oLC-0 ZAMC WAcP-r-
1LtL~pjq&-P b-T z~ P-Q TA A-'- r -P, cGI+
UVTt -- -Gt -gznl-i4 At C14- NG .LZ "L4T- T&AJCavs
Az4- CAu~ k-rlzUT v w'
-- - /A czuLC-W TIk.-gA-U C~ c iJ7 sT
-- 7oT PZ
IIm- LN X 3OLA-C A,~~ SUWJ-f OF-TCZJAT Q
LOS(: - 10D t AN L , A RLAND WA DBL. 'TEAN
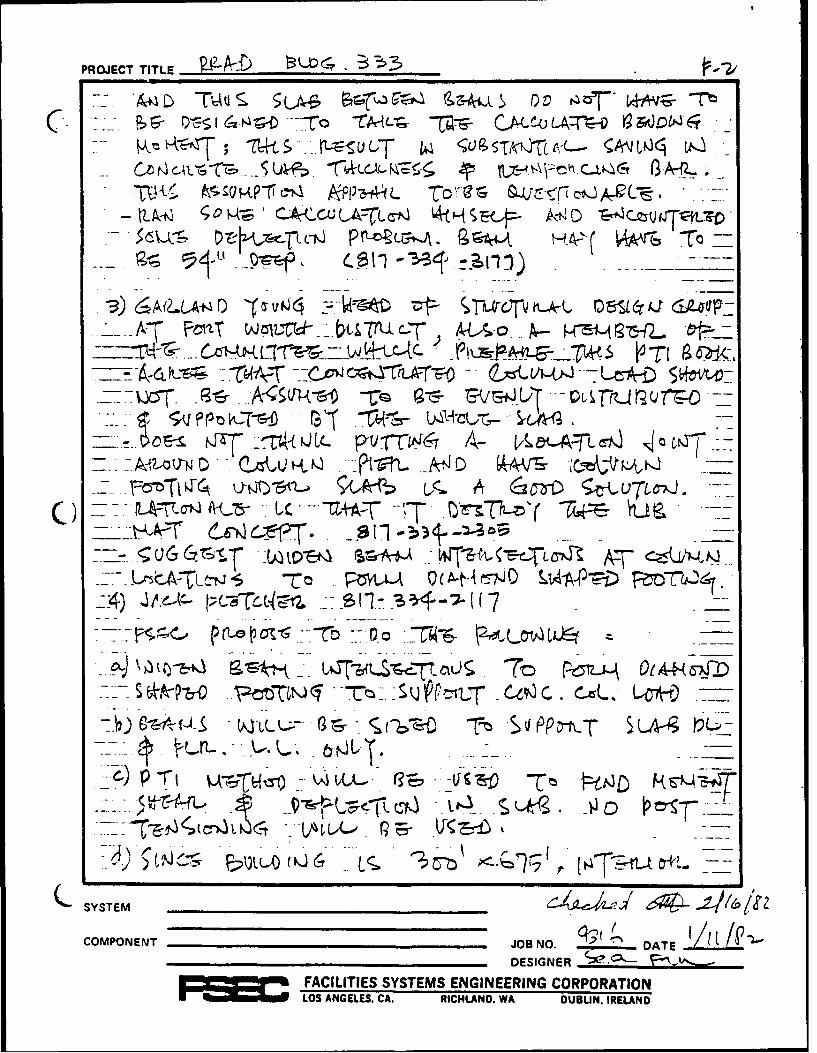
PROJECT TITLE 'iA-J Dr ,2
P- 1.4I t4o!-tr, 6r. HS cj- DT
~ P~-~c ~ ~ H 4c-{ A (rr To-
9k C5,J -$[ -Si J41ro I * -1(~ ~~
~?i~ A T 0 L "Fr N- UVJ7 u~470 O
-~~~I p pVt~ 4- V &.-TL-46N
- Ad.-U~1)OW6A%- 9A-f > AktJD0 5AV -o y _
A-L Toa -SPD-- 5v OL-tI7JQ
*- --4 -ST c ToK ~i-
SYSTEM __ _ _ _ _ _ _ _ _ _ _ _ _ kCOMPONENT ________________ ____ JOB NO. DATE
DESIGNER ~-~-U- FACILITIES SYSTEMS ENGINEERING CORPORATION
LOS ANGELES. CA. RIC LAND. WA DUBLIN. IRELAND
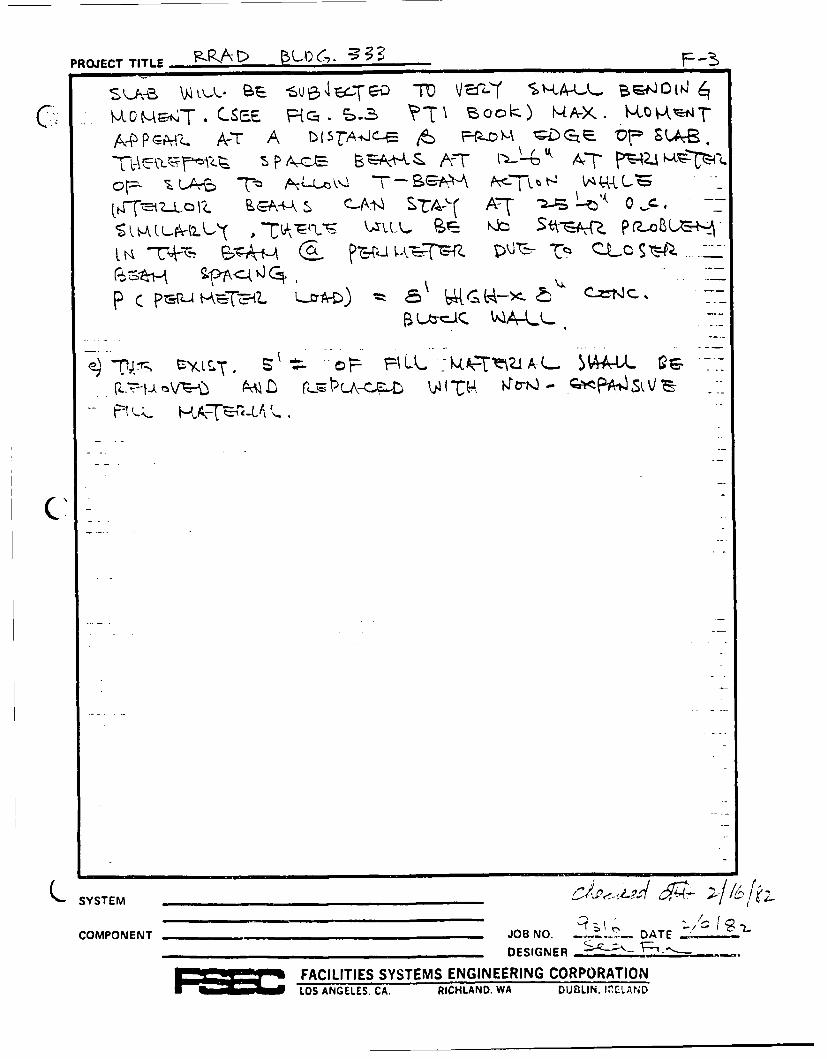
PROJECT TITLE " ' F-3
, \yL.Y B 4 .,Te TO V A,-4. -U. 0%Q 1
C. C T. isE -a ) oo ) f4A-). -krt4Ae- "PA A-T rA J- . - F-"-M [ Ar- -. vt= s -
iLi T%) SA-A S A7 --SL- S
8 , A-x- -t
Q SYSTEM _ _ _ _ _ _ _ _ _ _ _ _ _
COMPONENT JOB NO. DATE
DESIGNER
EFACILITIES SYSTEMS ENGINEERING CORPORATIONLOS ANGELES. CA. RICHLAND. WA DUBLIN, IRELAND
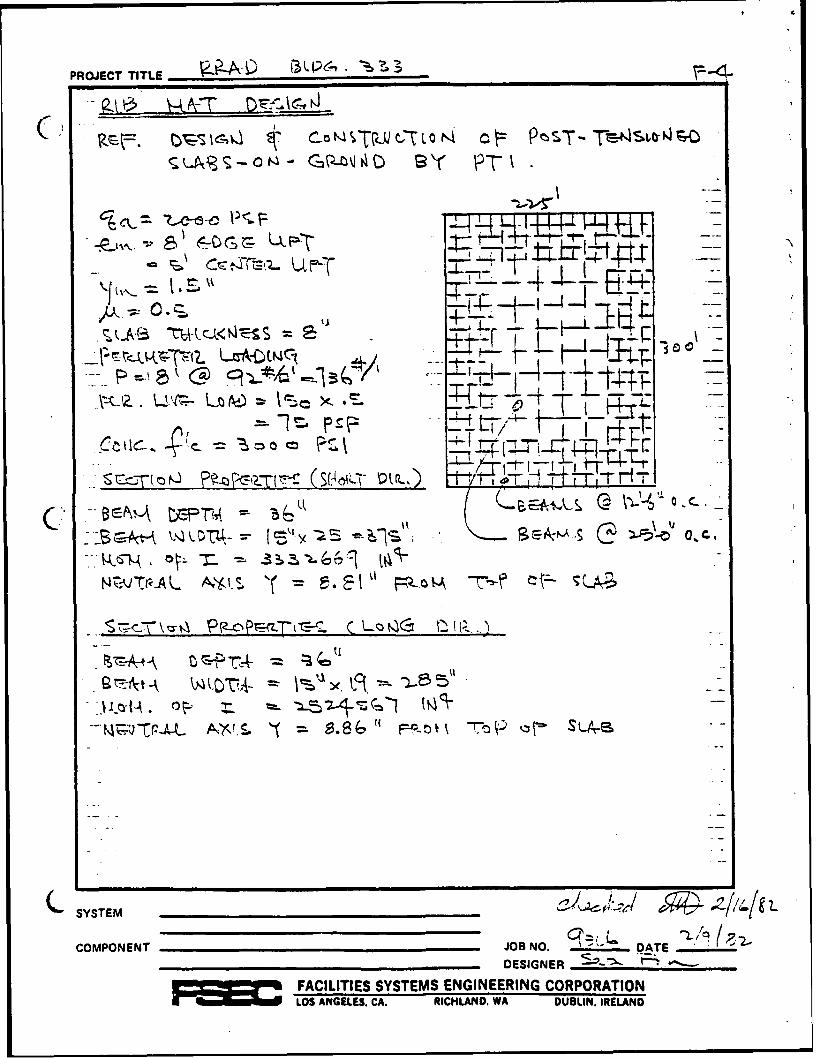
PROJECT TITLE-- A 1) 13L4. P e, 1 '3
U- C.- L Cj9d) r- - T x_ -SM -T --
-- 19'.j -1-l i 5
Wtt= ;;u -c,'.- S 13T8 'r, t~ 70:: Z- TLA-,i
C SYSTEM __ _ _ _ _ _ _ _ _ _ _ _ _ _ _ 2/ /g .
COMPONENT JOB NO. DATE -
____ ____ ____ ____ ____ ____ ____ ____ DESIGNER _ _ _ _ _ _ _ _ _ _
U-FACILITIES SYSTEMS ENGI NEERING CORPORATIONLOS ANGELES. CA. RICHLAND. WA DUBLIN. IRELAND
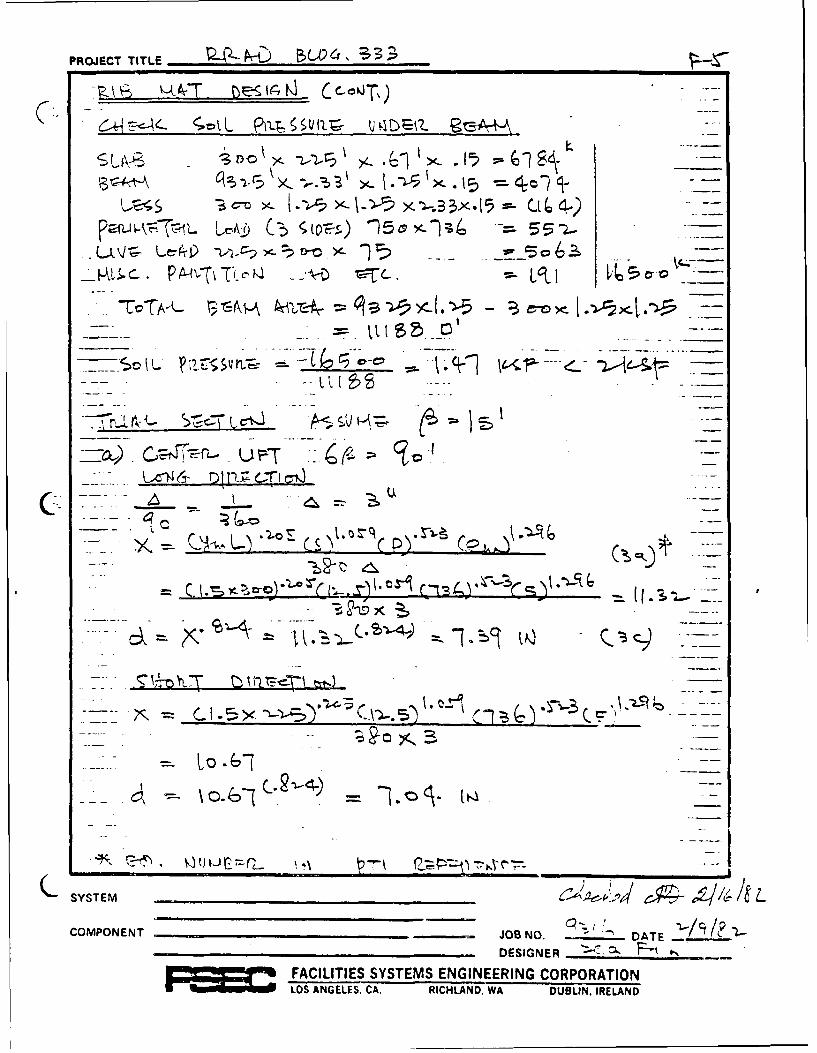
PROJECT TITLE 44) 1/~4 3-k7 IIA COJ,
T_-._ x- r .tx.\ .__-. 5 - 4
~~~~u~ r-7L~ _ __
(-7
.. - G7=- .. I. ._ __)C1 ~(
" --- C gh -- -.
SYSTEMA
._______________ = . . -- =. /, / .
COMPONENT JOB NO. ZDAT -DESIGNER__.__-_-,EFACILITIES SYSTEMS ENGINEERING CORPORATION
LOS ANGELES. CA. RICHLAND. WA DUBLIN. IRELAND
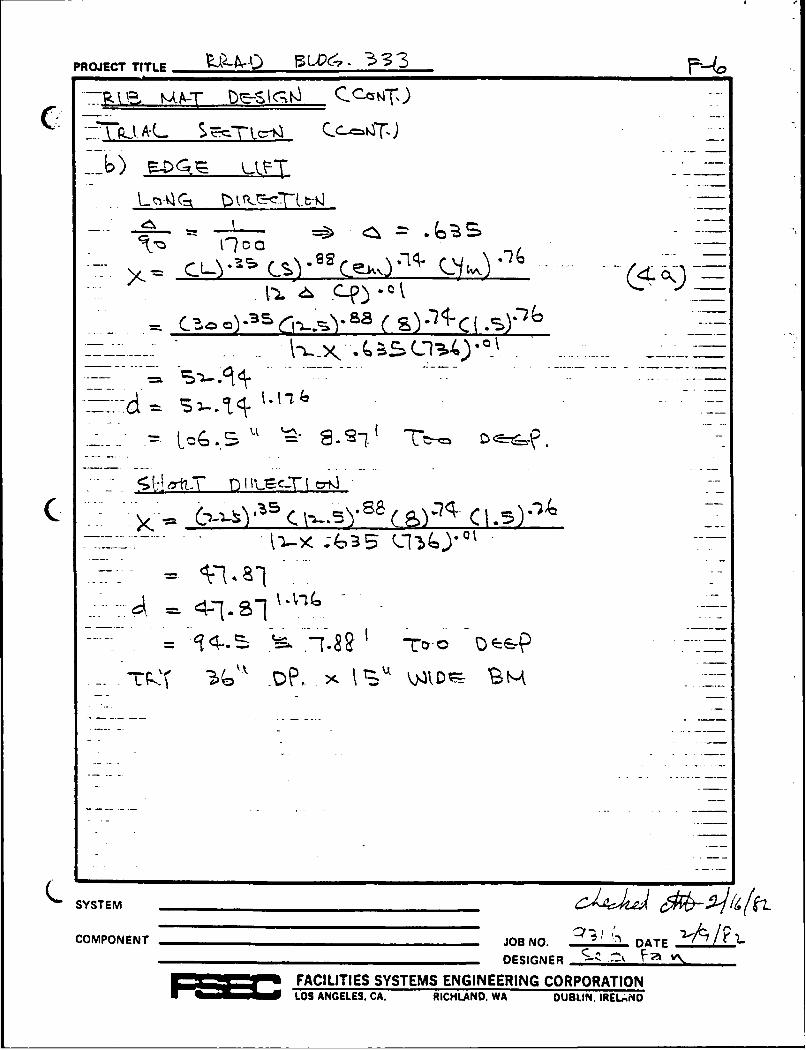
PROJECT TITLE = '- I L2 - 3 -
-i.- -- L ',- -
-- - - -L" ' . 4 ]) _ -.-
.... JOB NO.DATE .... .
(-~~ ~ACLTE SYSTEMS ENGINEERING________ CPORATIONA~kLOS.ANGELES.C. RICHLAND. WADUBLIN. A TE-
... = ACiLIIE YTMSEGNEIG-OPRTO
LOS ANGELES. CA. RICHLAND. WA DUBLIN. IRELA~ND
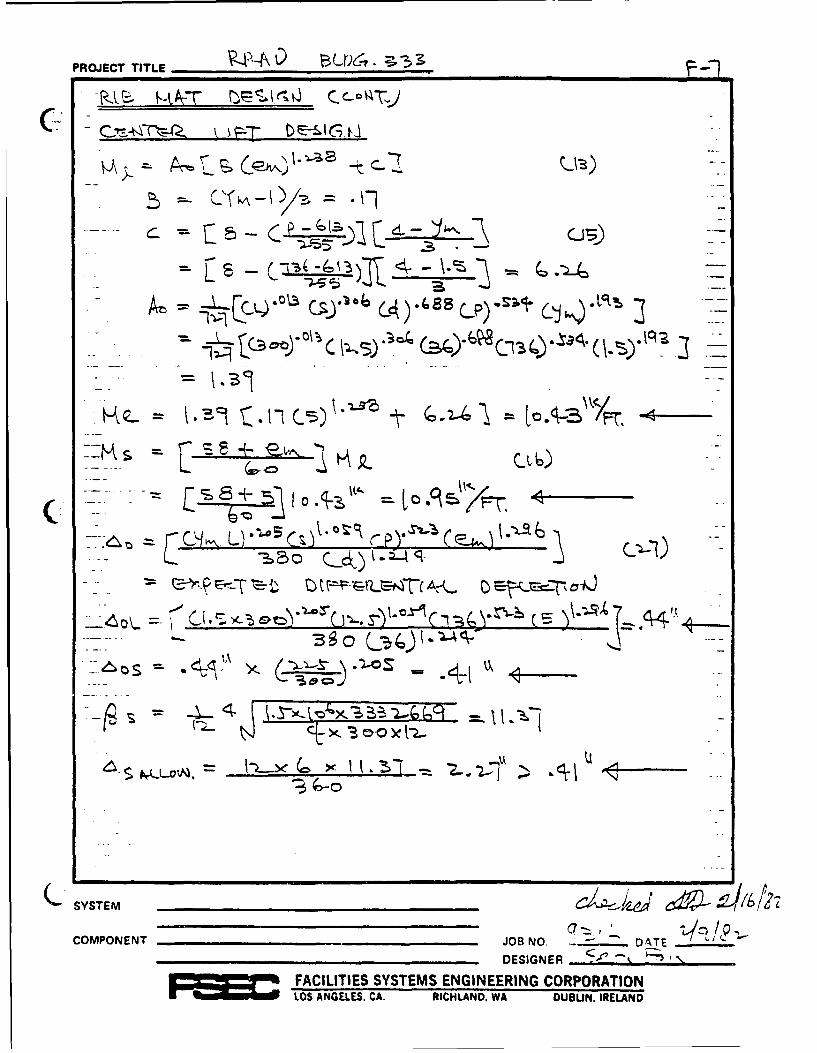
PROJECT TITLE - -'"0 B ( u, - ' - -z
D-- C -I]/ = .r---
.. . -) .- -
( -- e - o >y<.< y ,,
_(i 4C'a<:>:)''"B'' ':¢Y --)"
:-: "-C I . L) L ) - .."A -
-t c-' Ust) ~%r(4&.-
COMPONENT _____________________ JOB NO. - DATEDESIGNER <, - . 'N,
E D FACILITIES SYSTEMS ENGINEERING CORPORATIONLOS ANGELES. CA. RICHLAND. WA DUBUN. iRELAND

PROJECT TITLE __ _ _ _- 3_ _ 3_ __
-- a. -4T , - l , , , C t .)
.-- ... .. - 4
.. .¢ I *- , : .... ")e >.. S •
-. C f'c } L(--)s
ti~
~~~t I-L7~
QSYSTEM 3{a44'~./6
COMPONENT ___________________JOB NO. DATE __
DESIGNER _-_-_ "'.,.FACILITIES SYSTEMS ENGINEERING CORPORATION
LOS ANGELES. CA. RICHLAND. WA DUBLIN. IRELAND
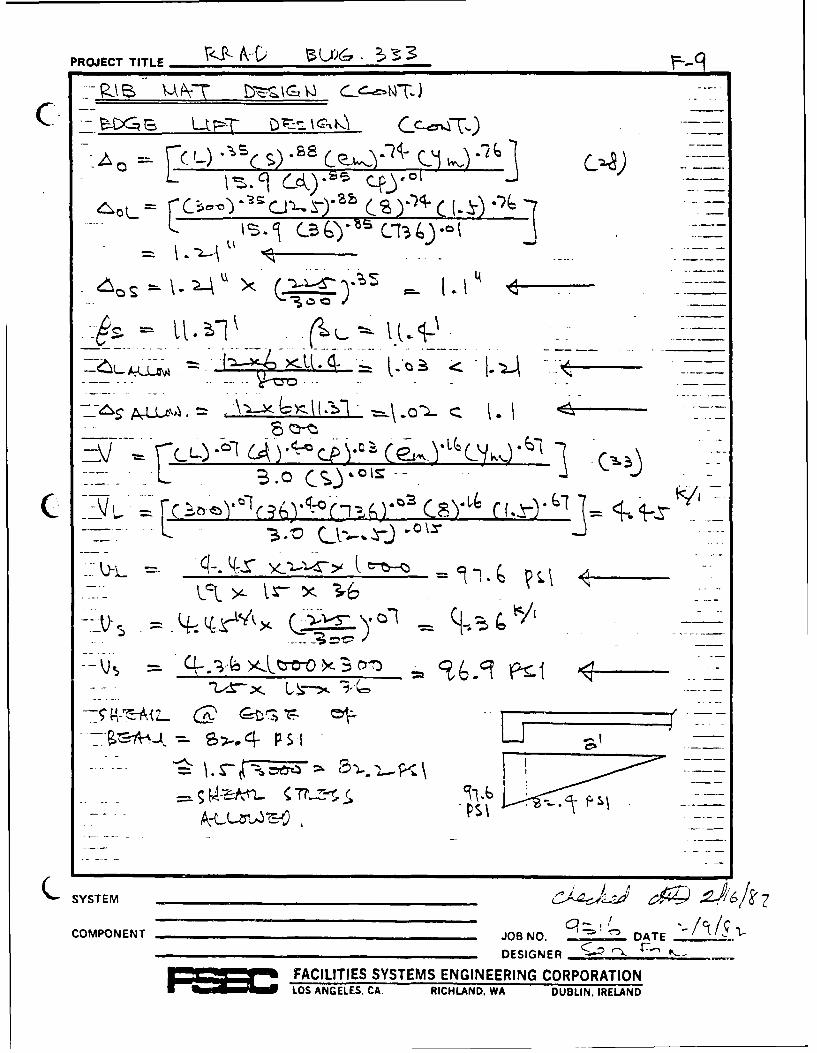
PROJECT TITLE
.Is
-:, oQ 1 7.-"'(. S)8, ' C- '' ' )"' -1
>-tt. -l (- t( . 1
.. . .. -.o C " l ..
-- - q- . .L -, = -
COMPONENT ________________ ____ JOB NO. DATEDESIGNER ' --E C FACILITIES SYSTEMS ENGINEERING CORPORATION
LOS ANGELES. CA. RICHIAND. WA DUBLIN. IRELAND
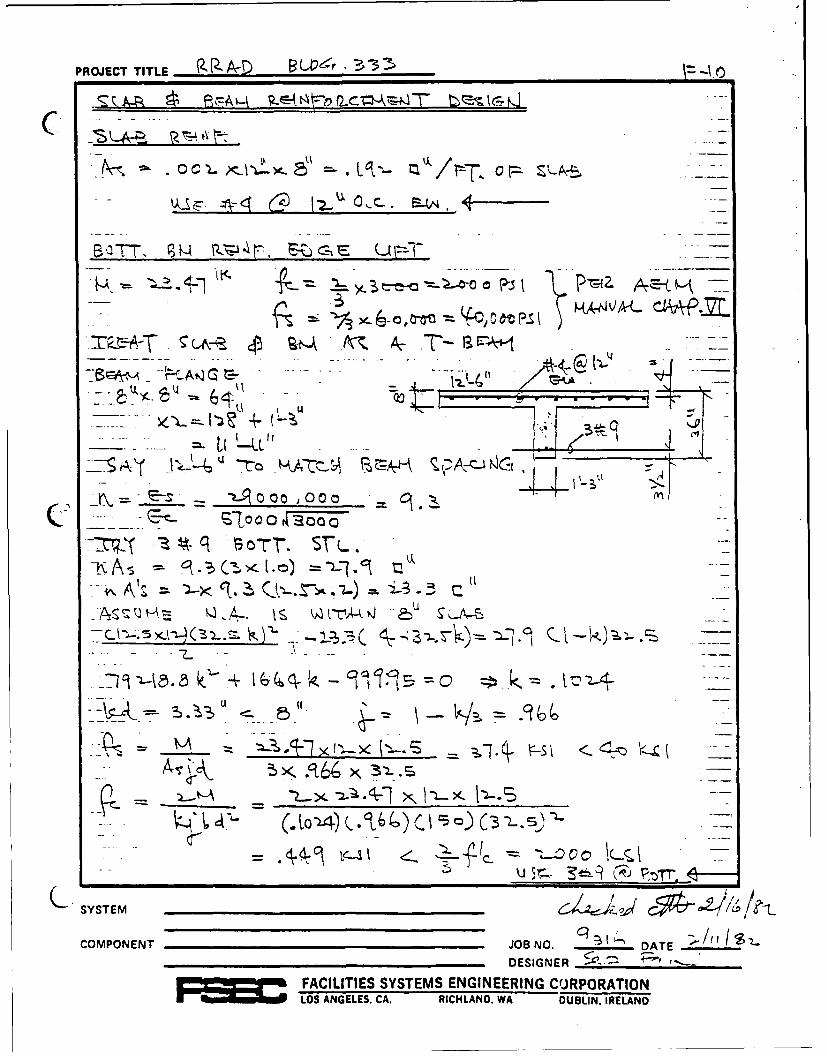
PROJECT TITLE BX 3k) .- •
- -
kk~ ~-~Aq-~ ~ ~ r"oft ps a t-~
IL 0 a .-
TIr; ST~
-~ 5rQ- 3o)
-_. ._4. - A - ... .... ....
SSYSTEM _ _ _ _ _ _ _ _ _ _ % JJc -~//-
COMPONENT ___ ",_____ ,o___ __ _ _.JOB NO. -. DATE:_"___"_'___-______,_-__DESIGNER
~EC FACILITIESSYSTEMS ENGINEERING COJRPORATION-LOS ANGELES. CA. RICH-LAND, WA DUBLIN. IRELAND

PROJECT TITLE 4r" ''"( ,>@-. 3
- --A.............~k~ .;-T~
-x.
x2!-n o k-i- + -.--1. k - 's9 .. =-o -_- . --.. J -- I ..... :- - ' -4 L.. "
. .- ... - .. . .. . ..., - .- -- _ ___ __.... ......__ ___
.. ... U e. ~. .
7- - ,- A--T J. CZ2, T _---"T SLA AS B-Ac-r-M C*'- T ;L4-&N ~o . . F -l Sc-&a {-f -
A - __-__-_"_-- .i - * - \ L-,-S :-~
SYSTEM __________._-__
COMPONENT JOB NO. . DATE -DESIGNER "' ' - "
EFACILITIES SYSTEMS ENGINEERING CORPORATIONLOS ANGELES, CA. RICHLAND. WA DUBLIN. IRELAND
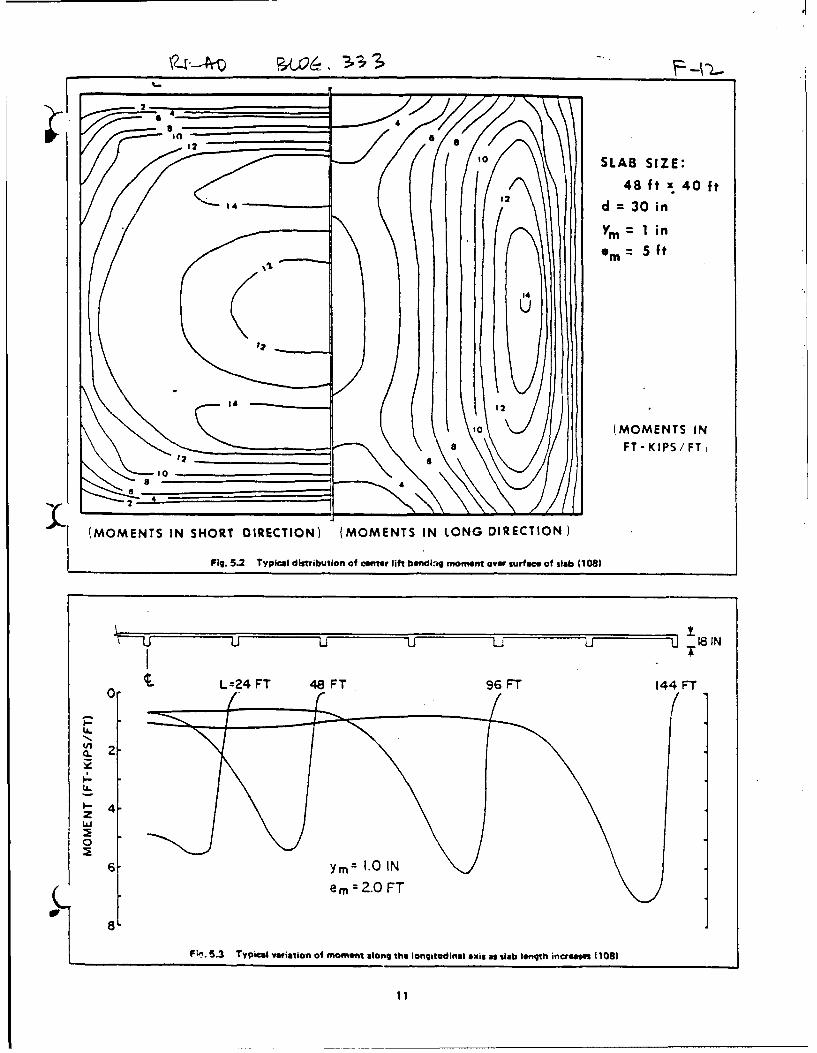
to SLAB SIZE:
48 ft x 40 ft
14 12d = 30 in
em= 5fIt
10 (MOMENTS INFT-KIPS/FTj
(MOMNTSIN HORTDIRCTIN) (OMETS N LOG DRECION
144P
--
0-
U.
2.
F;...5.3 Typical var iation of moment along the longotudinal axis as slab length incress 1108)
11

PROJECT TITLE PJ2- .3--
S -b Ti-Gc7 1 ;-CTc
_ 1. b .'c; O.-Jr-- EO z --- ZT.1 < \.J -.-
S AA".LK1 'ktO -k7 c-_u_/ g ..- t - _ e__.'T . l q t It.r t - -' (j -
us -- :41
, :? - _..
7§0k V VLr -:: -5 C-1, PMI -.
CSYSTEM ___________ h_____ 5..Jp1~~COMPONENT JO NO. .
__ DESIGNERE~ FACILITIES SYSTEMS ENGINEERING CORPORATION
_ ,- .. LOS ANGELES. CA. RICHLAND. WA DUBLIN. IRELAND
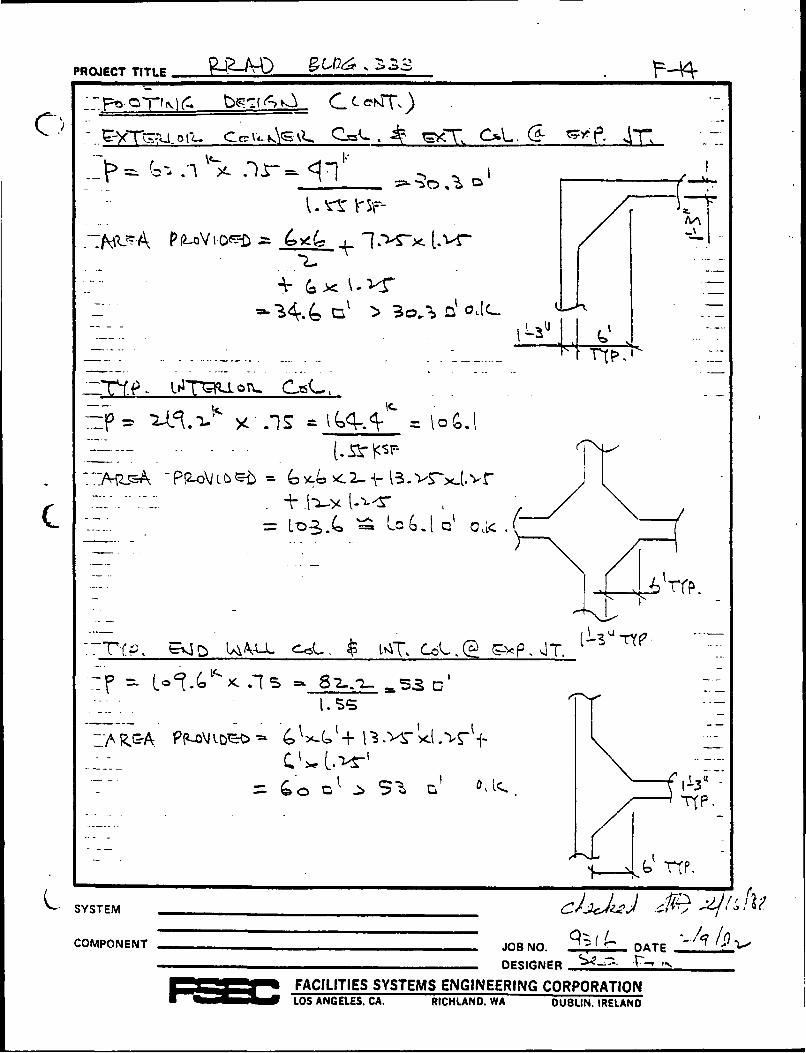
PROJECT TITLE______ ______
A- c-
.... 3o .z' d(l:]
COMPONENT JOBN .A
i=i[ it%.4 ""I" _ o~
,, --.
.... 8__._-.._ _/ -
COMPONENT ___0_____._________________ - /___ OB N . .
DESIGNER -- ' %"
UFACILITIES SYSTEMS ENGINEERING CORPORATIONLOS ANGELES. CA. RICHLAND. WA DUBLIN. IRELAND
Summary
FOUNDATION DESIGN ANALYSISRED RIVER ARMY DEPOT MAINTENANCE MODERNIZATION
The following summarizes the foundations report prepared March 1981 by
the Foundations and Materials Branch, U. S. Army Engineer District Fort Worth.
The original report and additional reference material including boring logs,
locations of boring logs and soil samples, and results of laboratory soil
tests may be obtained from this district office.
General
1. This project will provide an efficient modernized maintenance
facility for the overhaul and dieselization of the light track family of
vehicles. The project will consist of three buildings, a Light Track Vehicle
Shop (Building 333), a Material Staging and Control Facility (Building 312)
and a Heat Treating Facility (Building 328). The Light Track Vehicle Shop
Building will be approximately 197,610 square feet in area, Material Staging
and Control Facility will be approximately 125,000 square feet, and the Heat
Treating Facility will be approximately 500 square feet. At this stage of
planning, all structurcs are thought to be steel frame structures with
concrete masonry unit walls.
2. The proposed site is located on the eastern edge of the Red River
Army Depot in an area bounded by Texas Avenue on the north, Avenue K on the
east, Eigth Street on the south and Avenue G on the west. The site is
generlly level; however, some drainage ditches are in the area.
Subs'irface Investigations
3. During April and May 1979, 22 borings were drilled in the areas of
the three proposed structures. These borings were drilled to determine the
subsurface conditions and to obtain samples for testing. Samples of the
subsurface materials were obtained with an 8-inch earth auger, a 6-inch
Denlison barrel sampler and a 6-inch core barrel sampler. Samples recovered
from the borings were sealed in airtight containers and shipped to the
laboratories for testing.
4. General Geology. Red River Army Depot lies in the north central
portion of Bowie County, Texas, and is situated within the West Gulf Coastal
Plains physiographic province. This area is characterized by very gentle
topography. The region is underlain by sedimentary deposits of Tertiary Age.
F15
The primary geologic strata are assigned to the Midway and Wilcox groups and
dip to the south at a rate slightly steeper than the change in surface
elevation. The Midway group has a thickness of approximately 400 feet and
consists chiefly of clay shale. The Wilcox is predominantly sandy and silty
clay shale. These primary strata are generally masked by a thin soil stratum,
consisting of both residual and transported materials. Overburden generally
consists of silts and clays with varying amounts of sand.
5. Site Conditions. Boring logs revealed that much of the area has
been covered with earth fill materials. The fill materials range in thickness
up to approximately 8 feet, and when classified consists of medium to high
plasticity clays (CL and CH), clayey sands (SC), clayey sandy gravels (GC),
sandy silty clays (ML-CL) and silty sands (SM). Some organic materials are
contained within the fill material. In three of the borings, natural
overburden soils were encountered at ground surface. From ground surface to
depths of 2 to 3 feet below existing ground surface, the natural overburden
soils are medium to high plasticity clays (CL and CH). Underlying the top 2
to 3 feet of overburden soils and the fill materials is a medium to high
plasticity clay (CL and CH). Thickness of the fill materials and the
overburden soils range from 5.1 to 13.0 feet.
6. The primary geologic formation encountered beneath the overburden
soils consist of a clay shale tentatively identified as a portion of the
Midway group of the Tertiary system. The clay shale is soft (rock
classification) and ranges from highly weathered (altered to a clay
consistency) immediately beneath the overburden-primary contact to weathered
at depths 3 to 4 feet below the overburden-primary contact. The clay shale
extended to the total depth investigated, 30 feet below existing ground
surface.
7. All borings were allowed to stand open overnight to allow ground
water levels to stabilize. Water levels at the time of drilling ranged from
2.8 to 19.5 feet below grade. Average depth to ground water was about 9.5
feet. Based on previous experience in the general area, it is believed that
the water table is a perched water table associated with the lower overburden
soils.
F16
8. Laboratory Testing. Identification, moisture content, density,
unconfined compression, one-point triaxial compression and controlled
expansion-consolidation tests were performed on samples of subsurface
materials. The compressive strength of the subsurface materials from results
of unconfined compression tests and one-point triaxial compression tests
ranged from 2.6 to 10.4 ksf. Expansion-consolidation test results from method
C of ASTM D 4546 indicate expansive pressures from 0.50 to 2.0 ksf in excess
of the overburden pressure, with deeper materials having the larger expansive
pressures.
Discussion
9. The proposed site is in an existing level plant area with little
topographic relief (except for drainage ditches) across the site. A review of
subsurface conditions and laboratory test data revealed three distinct
potential founding strata: surface fill material, overburden clay, and primary
clay shale. The fill material consists of a conglomerate of discontinuous
layers And pockets of loosely compacted clays (CH and CL), sands (SC and SM),
and clayey gravels (GC). This stratum does not express the strength to
satisfactorily support the proposed structures. The clay overburden likewise
does not possess the strength and consolidation characteristics to
satisfactorily support the structures. The primary clay shale at a depth of
approximately 24 feet below ground surface is capable of supporting the
proposed structures. Footings bottomed at the above depth could be sized for
an allowable bearing pressure of 10 ksf considering down load only. The
disadvantage of using the clay shale as the founding medium is the potential
heave of the clay overburden and shale on the pier shaft and heave of the clay
shale beneath the footing base. It was computed that deep footings would move
upward approximately 3 inches due to swelling of the subsurface materials.
This amount of movement, either uniform or differential, is considered to be
excessive for the type structure proposed. Assuming the foundation would
experience 3 inches of differential movement, the angular distortion would be
on the order of I to 100, a limit where structural damage would occur.
10. Based on the above engineering studies, it was concluded that the
existing soils (overburden and primary) are not satisfactory founding media.
The alternatives are to improve the engineering characteristics of the
Fl7
existing soils or to remove the unsuitable existing soils to a reasonable
depth and replace with compacted nonexpansive material. Considering the
characteristics of the fill material, in place improvement is considered to be
excessively expensive. Removal of this material and replacement with
compacted fill is the best solution to the problem. Removal and replacement
with compacted fill would provide an excellent stratum on which to support a
shallow foundation and on which to support floor slabs. The foundation for
the proposed structures can then consist of a ribbed mat slab supported on the
compacted nonexpansive fill material.
11. The removal and replacement of the existing fill material does not
entirely eliminate the potential for heave at the subject site. The
nonexpansive fill, by definition, will not heave. The underlying CH
overburden and upper primary soils, however, will experience some volume
change. It was determined that the mat slab could experience 1.5 inches
vertical movement resulting from heaving of the overburden and upper primary
soils. Based on an analysis of existing moisture conditions, it is believed
that this amount of expansion could occur within an 8-foot radius.
Consequently, the foundation floor system should be stiffened to the extent
that the angular distortion of the structures does not exceed 0.0015L (L -
distance between adjacent columns).
Recommendations
12. Based on field investigations, laboratory testing and engineering
studies, it is recommended that the proposed Light Track Vehicle Shop
(Building 333), Material staging and Control Facility (Building 312) and Heat
Treating Facility (Building 328) be founded on a reinforced concrete ribbed
mat slab. The mat slabs should consist of a monolithic floor slab and beams.
The beams should bottom not less than 24 inches below outside finished grade
and should be sized in such a manner that an allowable bearing capacity value
of 2.0 ksf is not exceeded. Beams and beam intersections should be widened
and reinforced at column locations to form footings which will distribute
column loads along the beams and over an area such that the above allowable
bearing capacity is not exceeded. The load used to size the beams should
consist of full dead load plus that portion of the live load that reacts
continuously, usually 50 percent.
F18

13. To prepare the subgrade for the three proposed structures, all of
existing fill material (approximately 5 feet) should be removed. The
excavated materials should then be replaced with nonexpansive fill materials.
Nonexpansive fill materials should have a plasticity index equal to or less
than 12 and should be compacted to not less than 92 percent maximum density as
determined bvy ASTM D 1557. Any additional fill material required to bring
the floor slabs up to required grade should also be nonexpansive and compacted
to the same density. A polyethylene vapor barrier and a 6-inch capillary
water barrier should be placed beneath all floor slabs on grade. The ribbed
mat slabs should be designed in accordance with the AEIM, Chapter VI,
Structural. Using the PTI method of designing the mat slab, the following
design parameters should be used: qa - 2.0 ksf, em - 8.0 feet, ym - 1.5
inches, and ps - 0.5.
F19
APPENDIX G
FIELD TESTS

TABLE OF CONTENTS
Heading Page
I. PRESSUREMETER TESTS .... ............... . G2
II. CONE PENETRATION TESTS .... ............. . G28
III. PLATE BEARING TESTS ..... ............... . G39
IV. PIEZOMETRIC DATA ...... ................ I.G43
V. ELEVATION DATA ...... ................. . G44
VI. EARTH PRESSURE DATA ..... ............... . G47
VII. STRAIN GAGE DATA ...... ................ G47
Gi
I. PRESSUREMETER TESTS
Briaud Engineers1805 Laura Lane
College Station, Texas 77840
Purpose and Scope
1. The geotechnical investigation reported herein was undertaken as
part of a program to evaluate the settlement of a raft foundation to be
constructed at the Red River Army Depot near Texarkana, Texas. In this
report, the results of pressuremeter tests performed at the site, Figure Gl,
to a depth of 33.5 ft below the surface of the fill are presented. A total of
8 tests were performed on November 26, 1983. Also included is a method of
estimating an equivalent modulus of deformation of the soil to be used in
settlement analysis.
Authorization
2. This work was authorized by Purchase Order No. DACA39-84-M-0073,
signed by William M. Landes and Mary S. Parrette on November 7, 1983.
Soil Conditions
3. The soil profile was obtained from the cuttings taken off the hand
auger bucket and is shown in Figure G2. The location of the water table was
not recorded during the test, but from previus studies it is expected to be 10
ft below ground surface.
Tests
4. The pressuremeter used at the site was a pressuremeter model TEXAM
developed at Texas A&M University and sold commercially by Roctest, Inc.; this
is a monocell pressuremeter inflated with water which allows to perform
preboring or selfboring tests. The probe is 58 mm (2.28 in.) in diameter and
3has an initial deflated volume of 1050 cc (64.1 in.). A total of 8 tests were
performed in addition to the two calibrations (volume losses and membrane
resistance). A hand auger was used at the site and proved to provide a high
quality borehole. The first hole drilled (BH 1) was terminated at 5 ft due to
the presence of an unexpected concrete pipe. The second hole (BH 2) was
G2
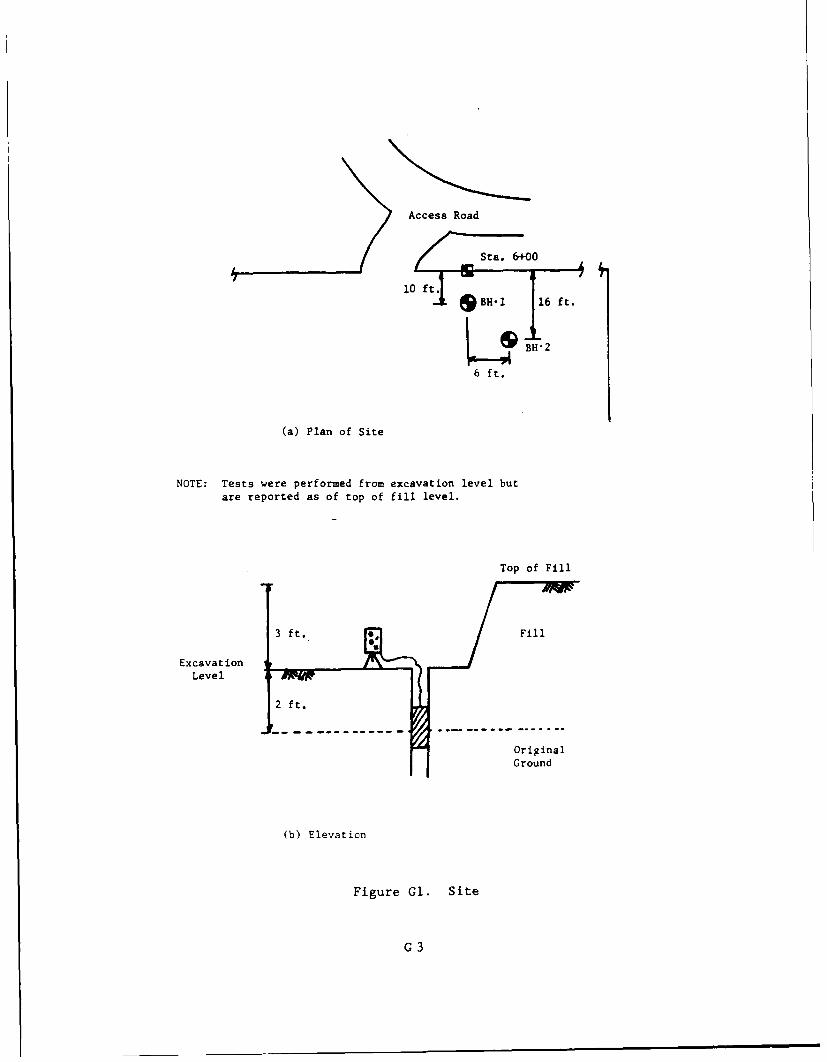
Access Road
10 t l-1 1 ft.
6 ft.
(a) Plan of Site
NOTE: Tests were performed from excavation level butare reported as of top of fill level.
Top of Fill
3 ft.. Fill
Excavation
Fill
Level
2 ft.
OriginalGround
(b) Elevation
Figure G1. Site
G3
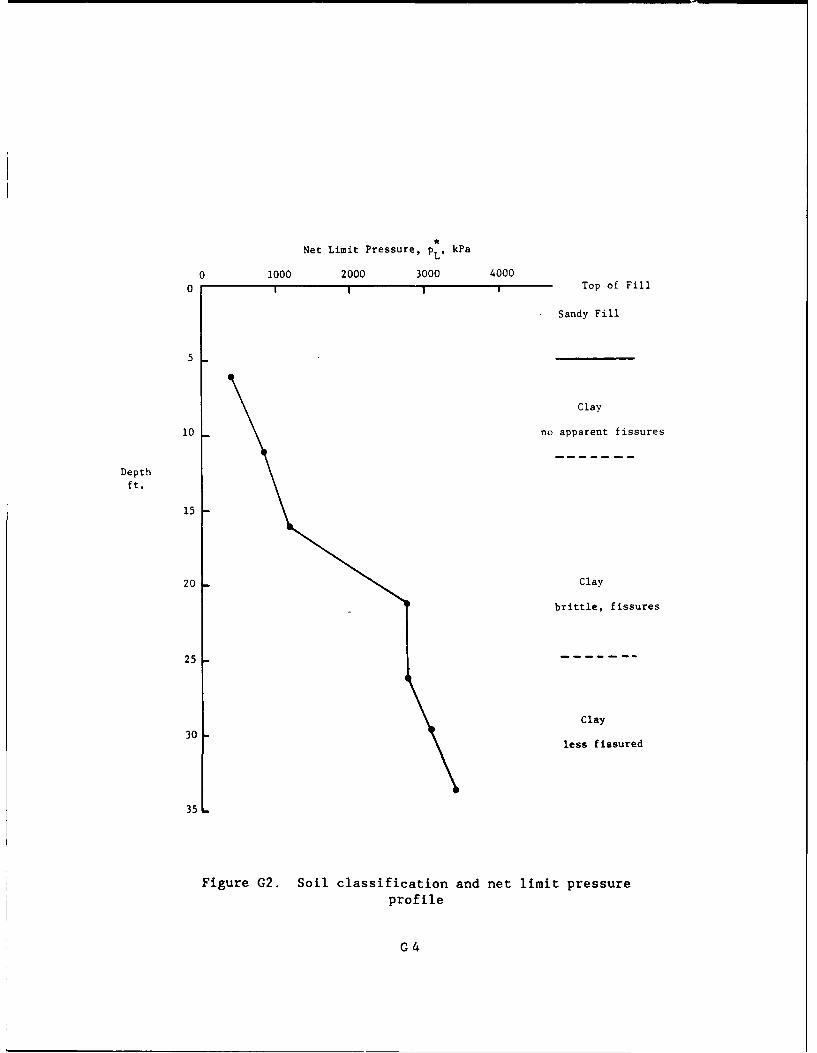
Net Limit Pressure, pL' kPa
0 1000 2000 3000 4000
0 ! 1 1 Top of Fill
Sandy Fill
5
Clay
10 no apparent fissures
Depthft.
15
20 Clay
brittle, fissures
25
Clay
30less fissured
35
Figure 02. Soil classification and net limit pressureprofile
G4
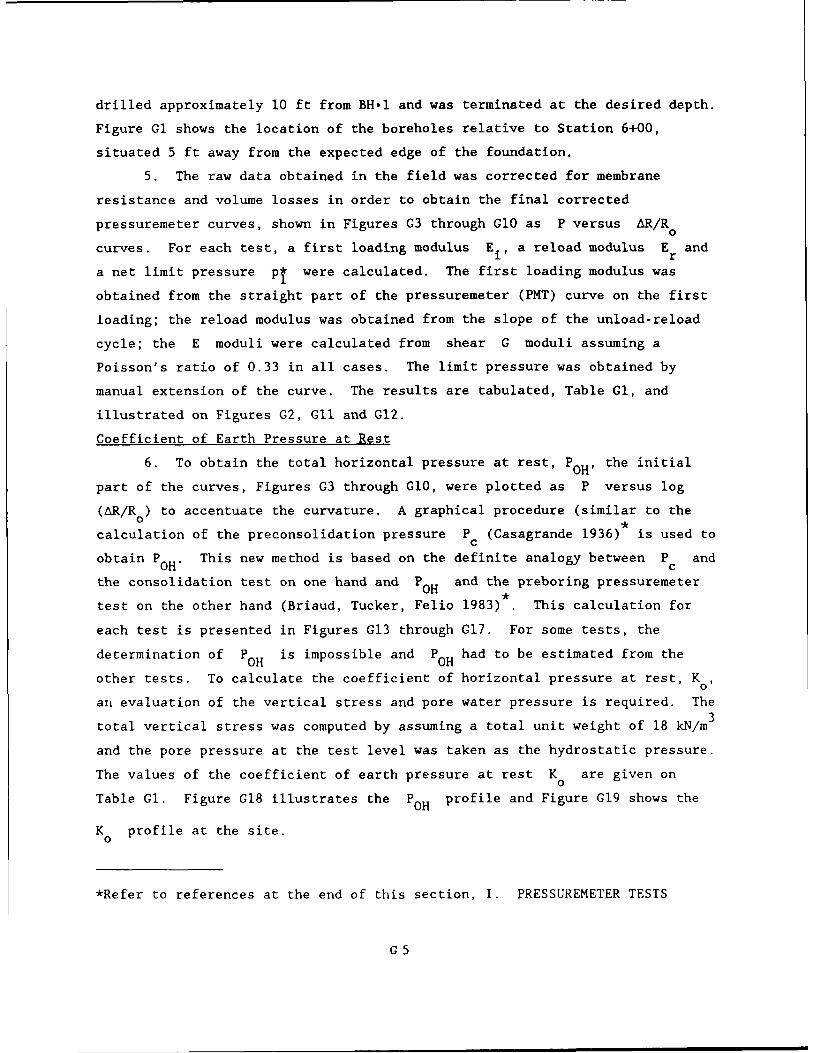
drilled approximately 10 ft from BH.l and was terminated at the desired depth.
Figure Gl shows the location of the boreholes relative to Station 6+00,
situated 5 ft away from the expected edge of the foundation.
5. The raw data obtained in the field was corrected for membrane
resistance and volume losses in order to obtain the final corrected
pressuremeter curves, shown in Figures G3 through G1O as P versus AR/R0
curves. For each test, a first loading modulus Ei, a reload modulus Er and
a net limit pressure p* were calculated. The first loading modulus was
obtained from the straight part of the pressuremeter (PMT) curve on the first
loading; the reload modulus was obtained from the slope of the unload-reload
cycle; the E moduli were calculated from shear G moduli assuming a
Poisson's ratio of 0.33 in all cases. The limit pressure was obtained by
manual extension of the curve. The results are tabulated, Table GI, and
illustrated on Figures G2, GIl and G12.
Coefficient of Earth Pressure at Rest
6. To obtain the total horizontal pressure at rest, POH' the initial
part of the curves, Figures G3 through GIO, were plotted as P versus log
(AR/R ) to accentuate the curvature. A graphical procedure (similar to the
calculation of the preconsolidation pressure P (Casagrande 1936) is used toc
obtain POH" This new method is based on the definite analogy between P and
the consolidation test on one hand and POH and the preboring pressuremeter
test on the other hand (Briaud, Tucker, Felio 1983) This calculation for
each test is presented in Figures G13 through G17. For some tests, the
determination of POH is impossible and POH had to be estimated from the
other tests. To calculate the coefficient of horizontal pressure at rest, K
an evaluation of the vertical stress and pore water pressure is required. The
total vertical stress was computed by assuming a total unit weight of 18 kN/m 3
and the pore pressure at the test level was taken as the hydrostatic pressure.
The values of the coefficient of earth pressure at rest K are given on0
Table GI. Figure G18 illustrates the POH profile and Figure G19 shows the
K profile at the site.
*Refer to references at the end of this section, I. PRESSUREMETER TESTS
G5
5 0 0 [ - r- 7 " T- '- r ' 1 -T 1 - 1 1 -f I I TI I - -7
Test 1Red River Army DepotDepth = 3.0 ft.
- BH"2
400 - -N-
Or
300 -
P-V
kPa
200- 2 . - 190 kPa
" ll6.kPa
0 5 10 15 20 25 30 35
Ro
P1 = 420 k.Pa
P 128 kPa
OHG
E = 4943 k.Pa
t.R
E = 22469 kPa
Figure G3. Pressuremeter curve for Test 1, depth - 3.0 ft,
for hole BH 2
G6
500 - - -r-- - -,----r- - - -r ---1,-
Test 8L Red River Army Depot
Depth = 3.0 ft.
BH.1
400 7
P 77 7
200-
P G3k a- 0
kSGa _ 5Ok.
7 S- 130 kPa~up
100 S 104 kPaur
0 F_-_I * I . . .. , .. .. a ....
0 5 10 15 20 25 30
0
P, . 410 kPa
P = 28 kPa
E. = 7684 kPa1
E = 38866 kPa
Figure G4. Pressuremeter curve for Test 8, depth = 3.0 ft,
for hole BH-I
G7
1000 K"TTf-T - -r-r - r- 'r t-1 r- T I . -- ¢[T T -
Test 2Red River Army Depot
00- Dept. - 8.0 ft.BH.2
Boo
700-/
P
kPa 600-/
I500 -
r fj400 ---
/ - Su 285 kPa
200 Sur SuG 219 kPa..
10 ~
0 5 10 15 29 25 38 35
R0
P - 850 kPaL
POH 40 kPa
E, - 16747 kPa
E - 106875 kPar
Figure G5. Pressuremeter curve for Test 2, depth - 8.0 ft,for hole BH 2
G8
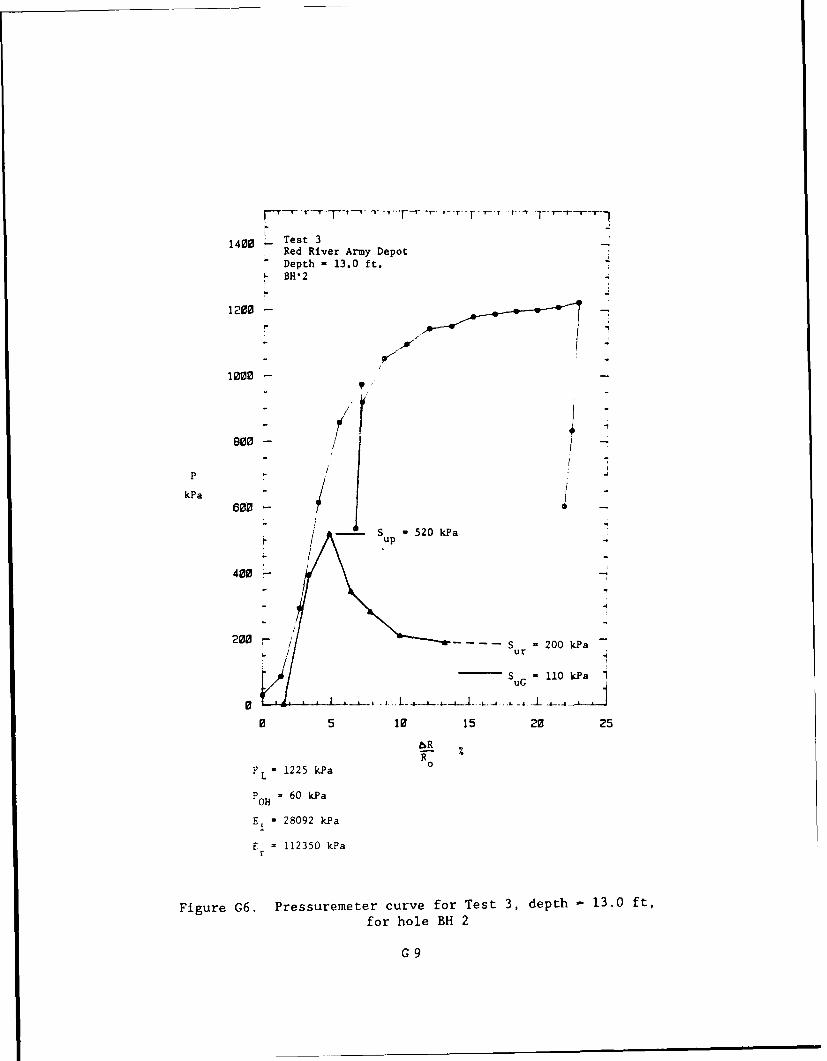
140 - Test 3Red River Army DepotDepth = 13.0 ft.
- BH'2
1200-
500
/1
ep - /1 Ikia I"I
- S u 520 kPaup1\ u
400
i.4
200 / S - 200 kPa/ ur
-SuG 110 kPa I
0 -.U L ' r .
0 5 10 15 20 25
R
P - 1225 kPa 0
POH 60 kPa
Ei . 28092 kPa
E - 112350 kPar
Figure G6. Pressuremeter curve for Test 3, depth - 13.0 ft,
for hole BH 2
G9

300 0 - - r--t- - r- --T- -,--r - VI-T- -- J-- r-- - --T-T
Test 4Red River Army Depot
" Depth = 18.0 ft.
BH.2
2500
200
p 1500
kPa
1000- S 980 kPa/ up
S- 875 kPa
S 600 kPaur
0 2 4 8 j 10 12 14
&R
0
PL - 2810 kPa
POH 110 kPa
Ei . 88381 kPa
rE = 518700 kPa
Figure G7. Pressuremeter curve for Test 4, depth - 18.0 ft,
for hole BH 2
GIO
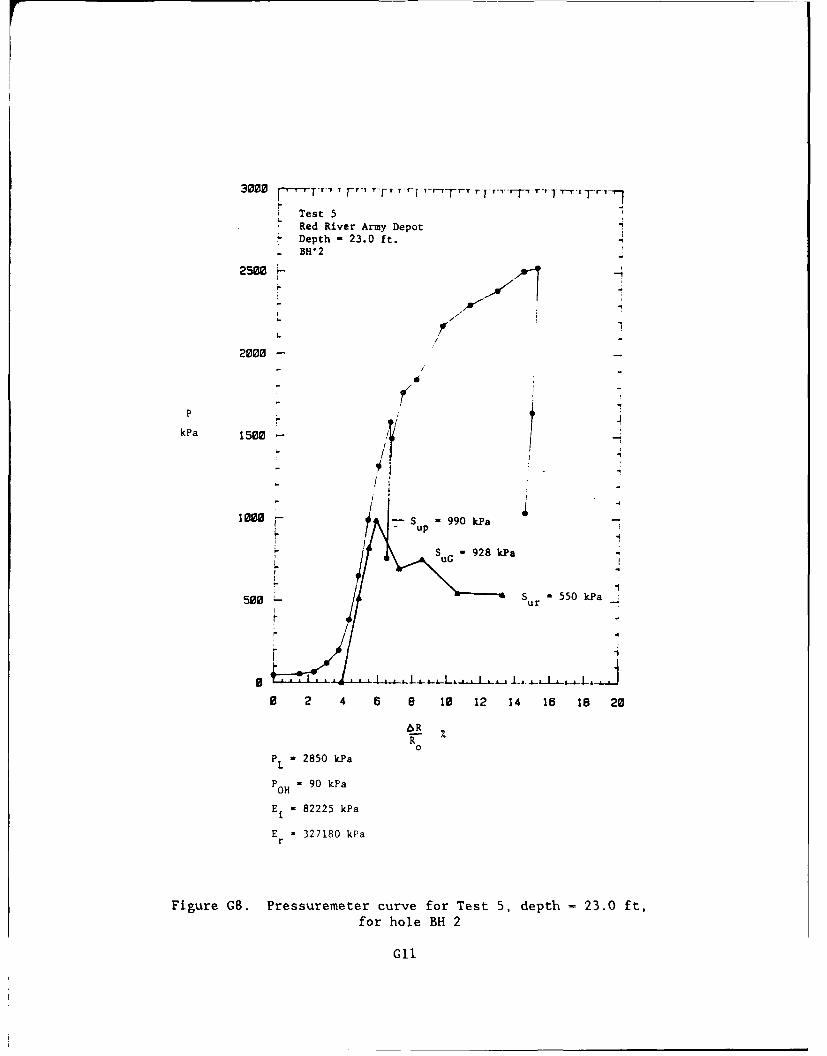
3000 r-,TT-1 , F-- TT 7'I 7--T-r r- -"r--"-r--
LTest 5Red River Army Depot
- Depth -23.0 ft.
25M8-~. H"
2000
7
1 r 9k4a
S0 ur 550 kPaur
* 2 4 6 8 10 12 14 16 18 20
6R
0PL - 2850 kPa
POH 90 kPa
E. - 82225 kPa
E = 327180 kPar
Figure G8. Pressuremeter curve for Test 5, depth - 23.0 ft,
for hole BH 2
Gil
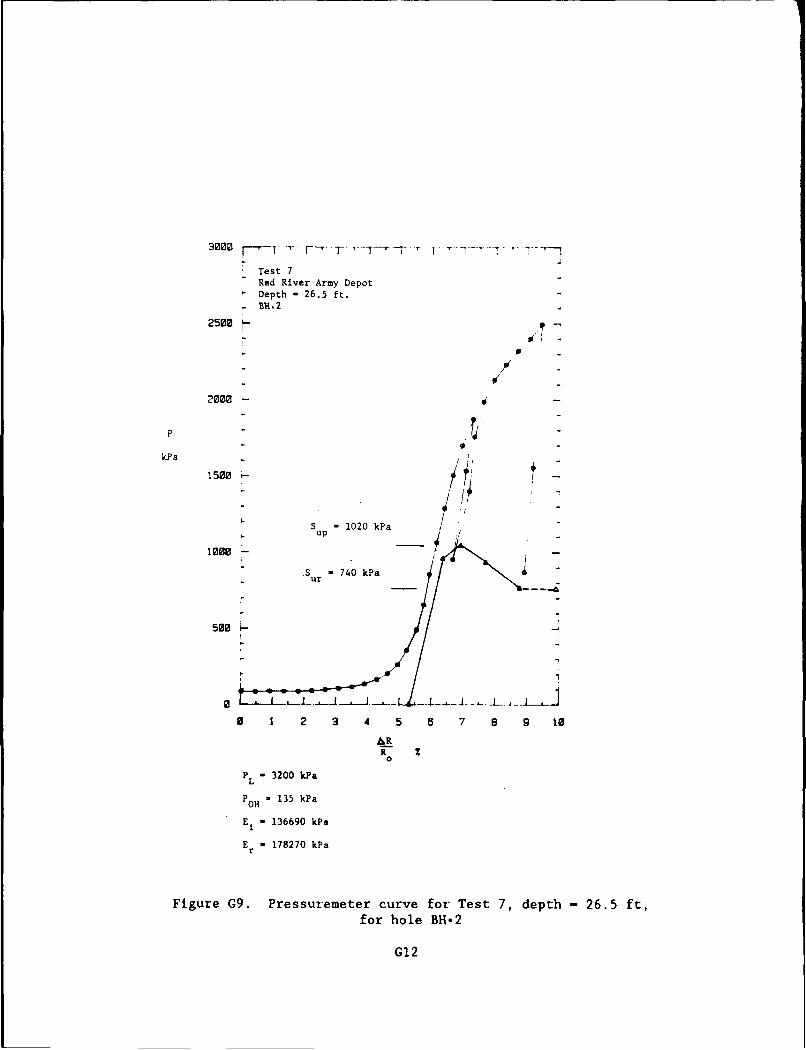
3000 r -F -- T- -,--- - --T-- 1 -1--"] - T - --
Test 7Red River Army Depot
- Depth - 26.5 ft.
2500 K -
0
'I
2000 - -
P -
p ~0kPa 15 00
S = 1020 kPaup -
1000-
S 740 kPaur
500-
* 1 2 3 4 5 6 7 8 9 10
&_RR 2
0
PL l 3200 kPa
POH =
135 kPa
Ei - 136690 kPa
E - 178270 kPar
Figure G9. Pressuremeter curve for Test 7, depth - 26.5 ft,
for hole BH.2
G12
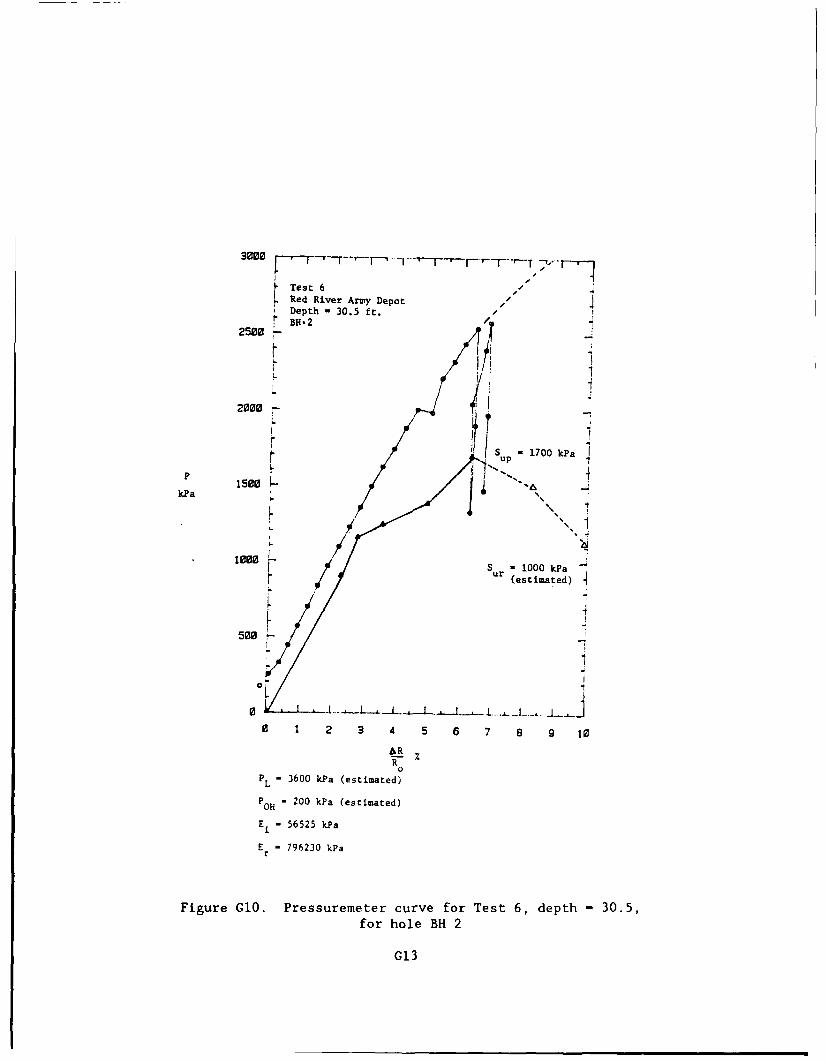
3007 r F '-~ ~ r r~ '
Test 6Red River Army Depot IDepth - 30.5 ft.BH.2/
2500
L .
2000
sup 1700 kPa
kPa .-- .
S r 1000 kPa "ur (stimated)
I. *1
50 -
01
0 1 2 3 4 5 6 7 8 9 10
AR %R
0PL - 3600 kPa (estimated)
POH - 200 kPa (estimated)
Ei = 56525 kPa
E - 796230 kPar
Figure GI0. Pressuremeter curve for Test 6, depth - 30.5,for hole BH 2
G13
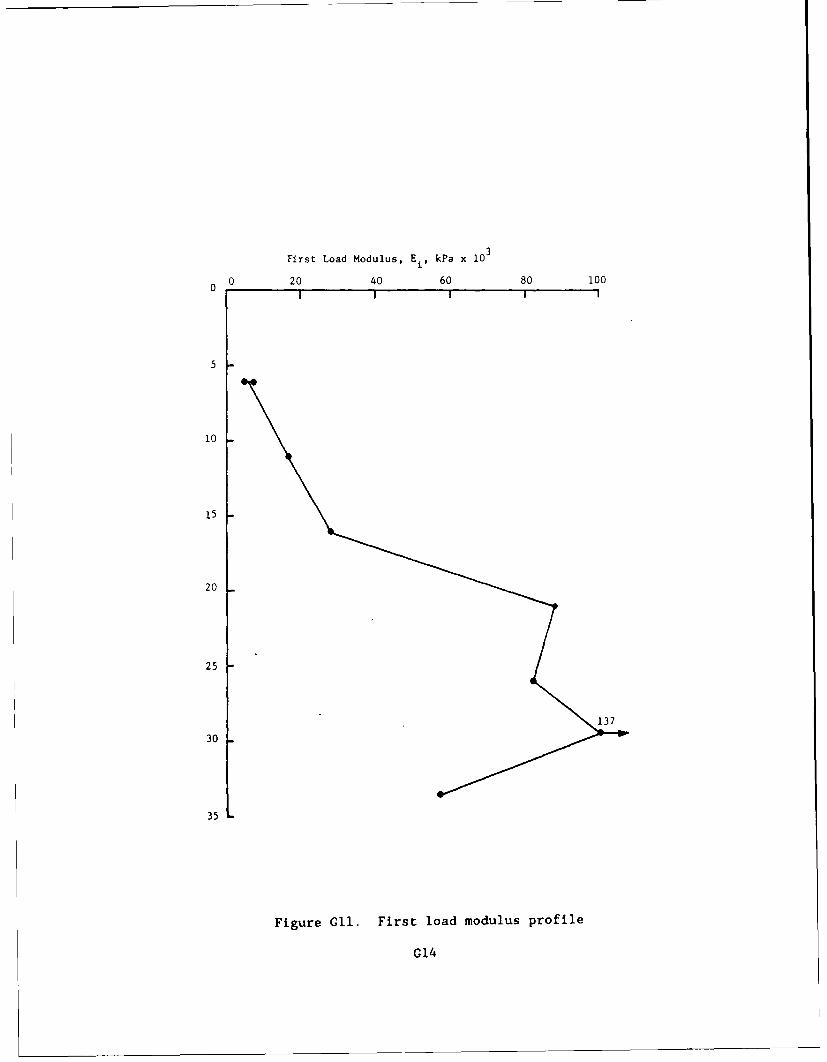
First Load Modulus, Ei. kPa x10
0 20 40 60 80 1000
5
10
15
20
25
30
35L
Figure G11. First load modulus profile
G14
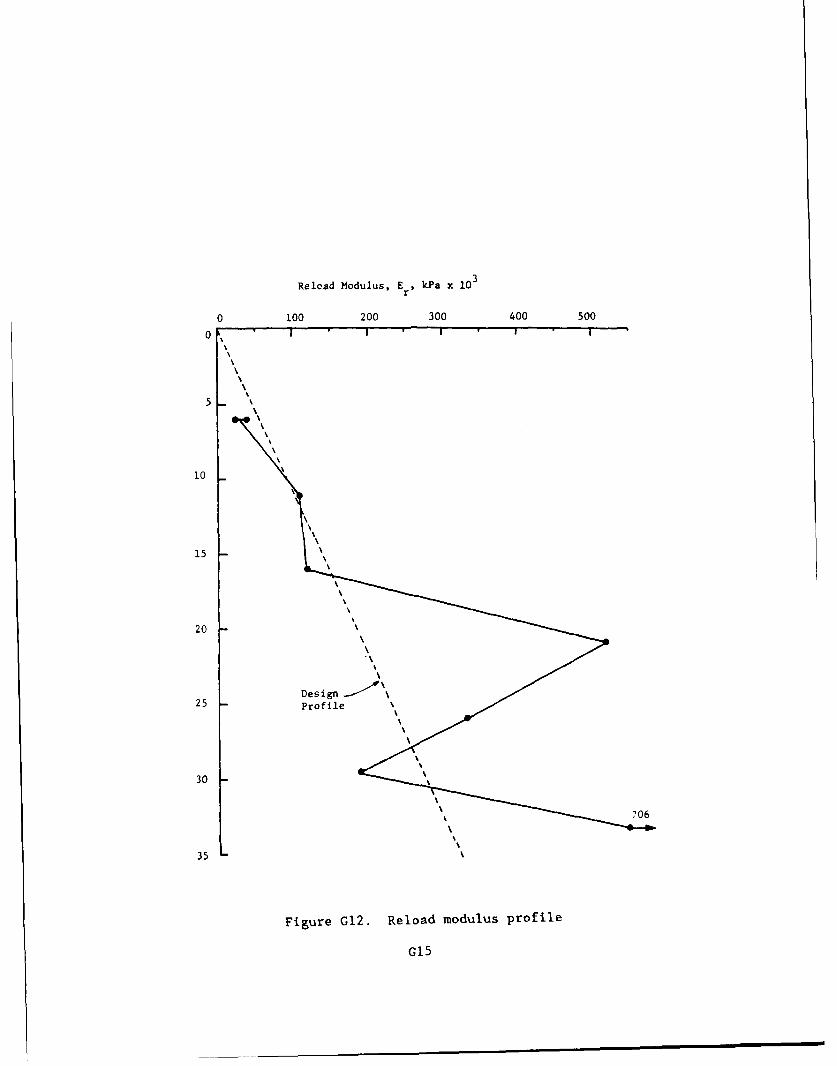
Reload Modulus, E ro kPa x 1
0 100 200 300 400 500
15
20
30
35L
Figure Gl2. Reload modulus profile
015
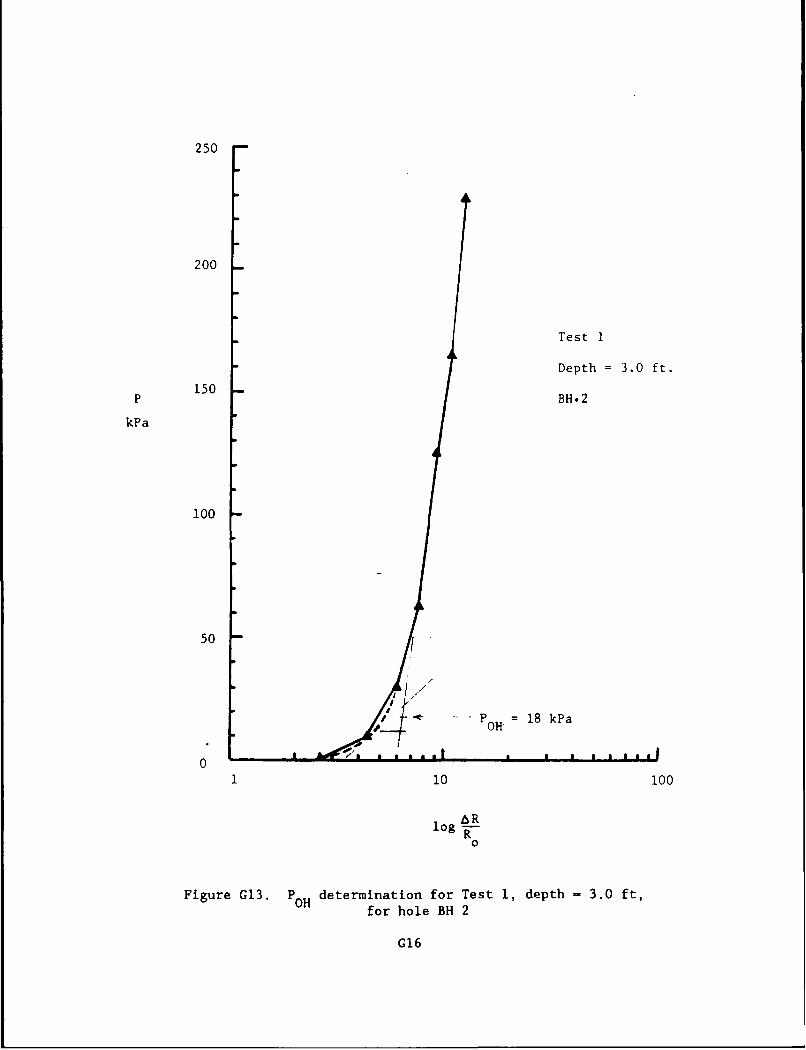
250
200
Test 1
Depth =3.0 ft.
P150 B-
kPa
100
50
P OR 18 lkPa
00
Figure G13. P OHdetermination for Test 1, depth -3.0 ft,OH for hole BH 2
G16
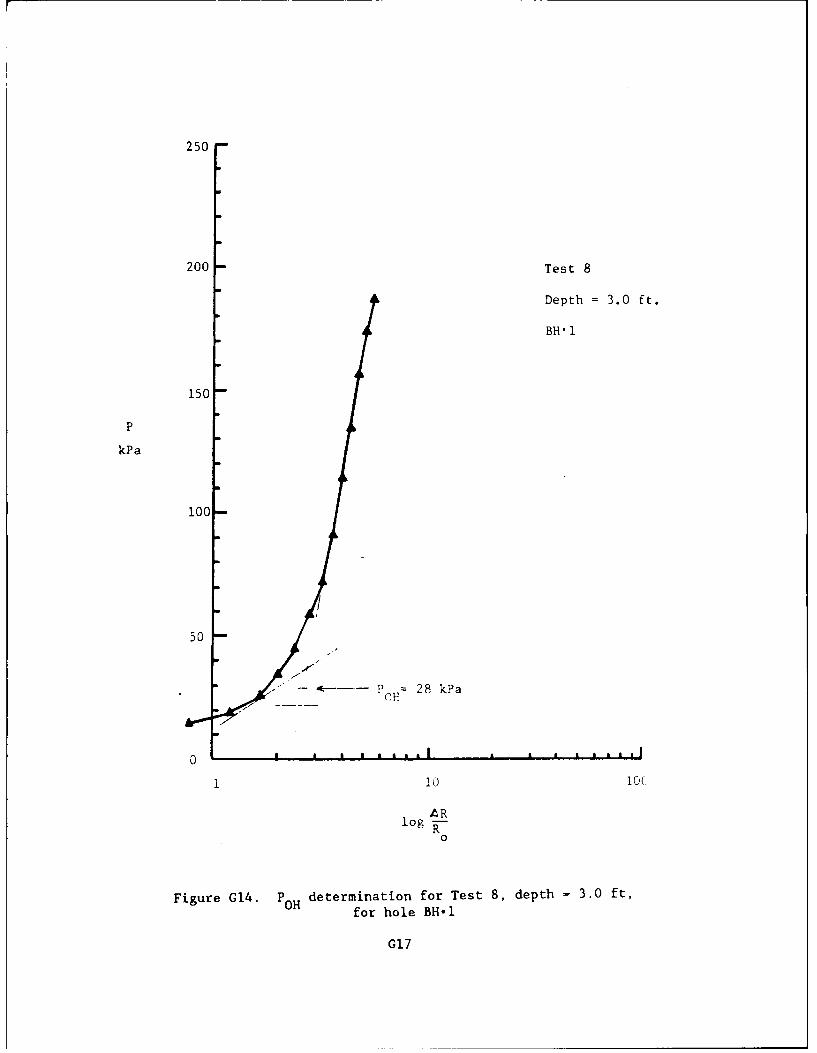
250
200 Test 8
Depth =3.0 ft.
BHI1
150
P
kP a
100
50
-~ ~ M 28 kPa
110 100
log R
0
Figure G14. P OHdetermination for Test 8, depth =3.0 ft,
OH for hole BH-l
G17
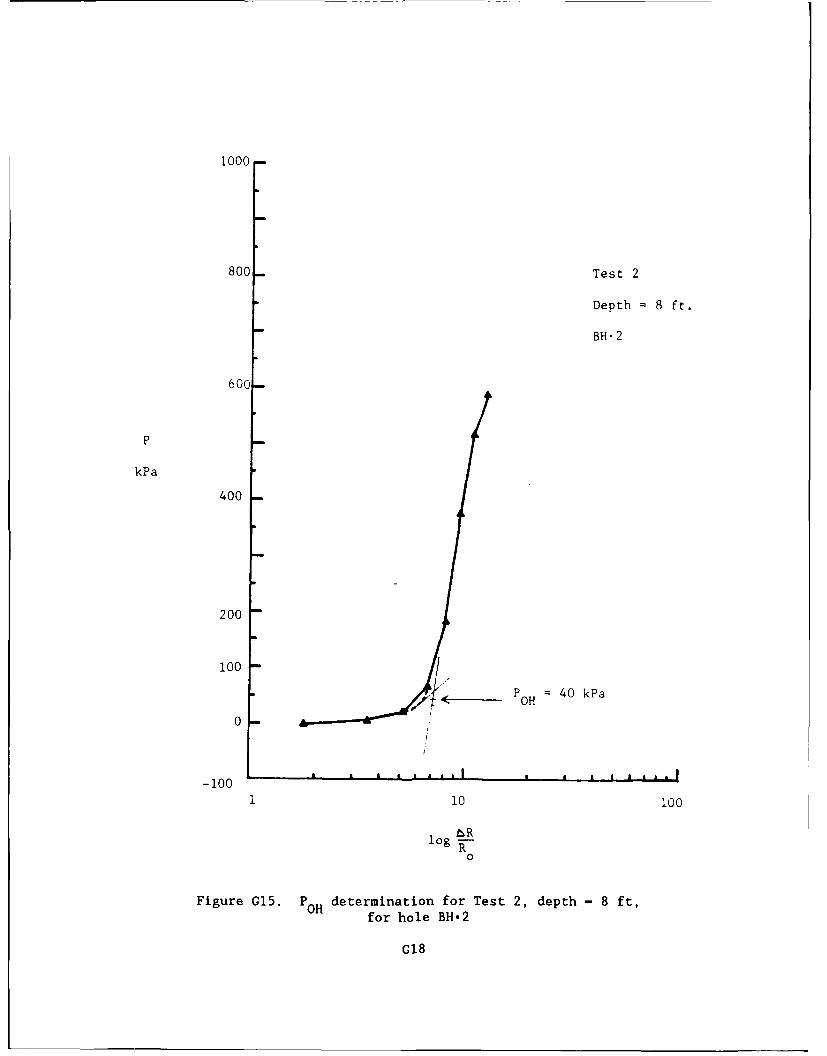
1000
800 Test 2
Depth 8 ft.
BH.2
600-
P
kPa
400
200
1001,
P OH 40kPa
0 -
-1001 10 100
mRlog R-
0
Figure 015. POH determination for Test 2, depth - 8 ft,for hole BH.2
G18
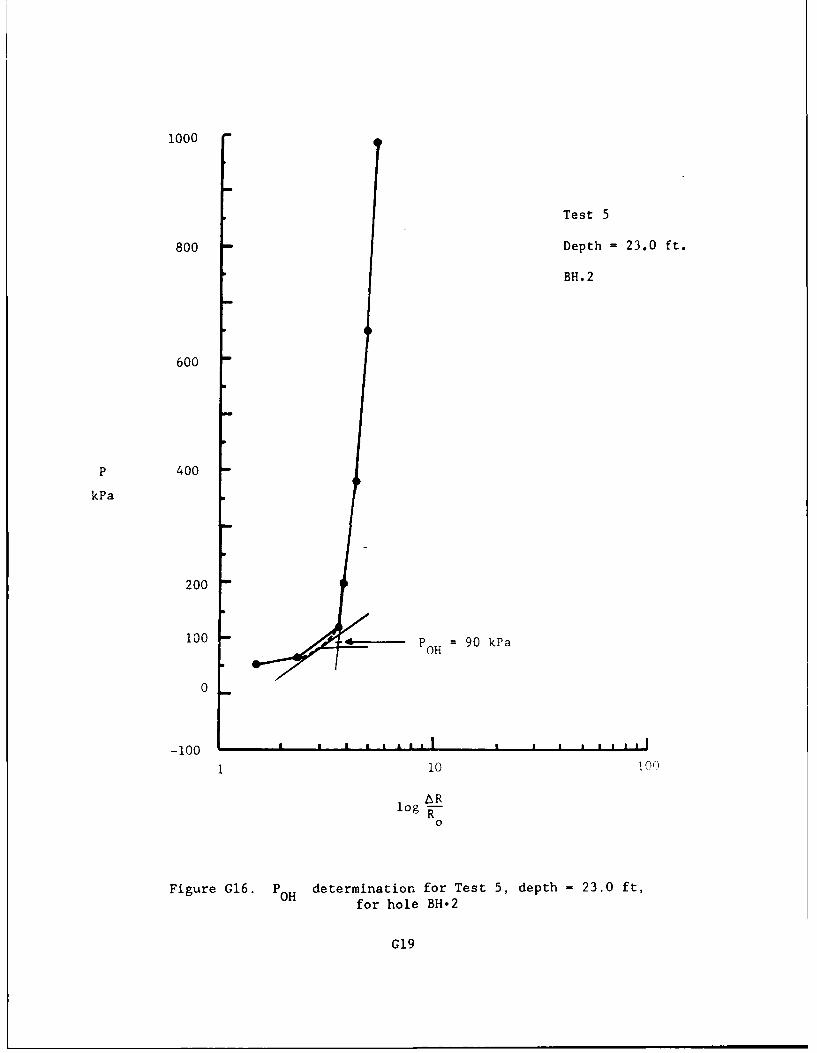
1000
Test 5
800 6-Depth =23.0 ft.
BIT.2
600
P 400
kPa
200
100 P OH =90kPa
0
-100 p j Ip111S I IIh l
3.10 1 On
0
Figure G16. P OH determination for Test 5, depth -23.0 ft,OH for hole BH.2
G19
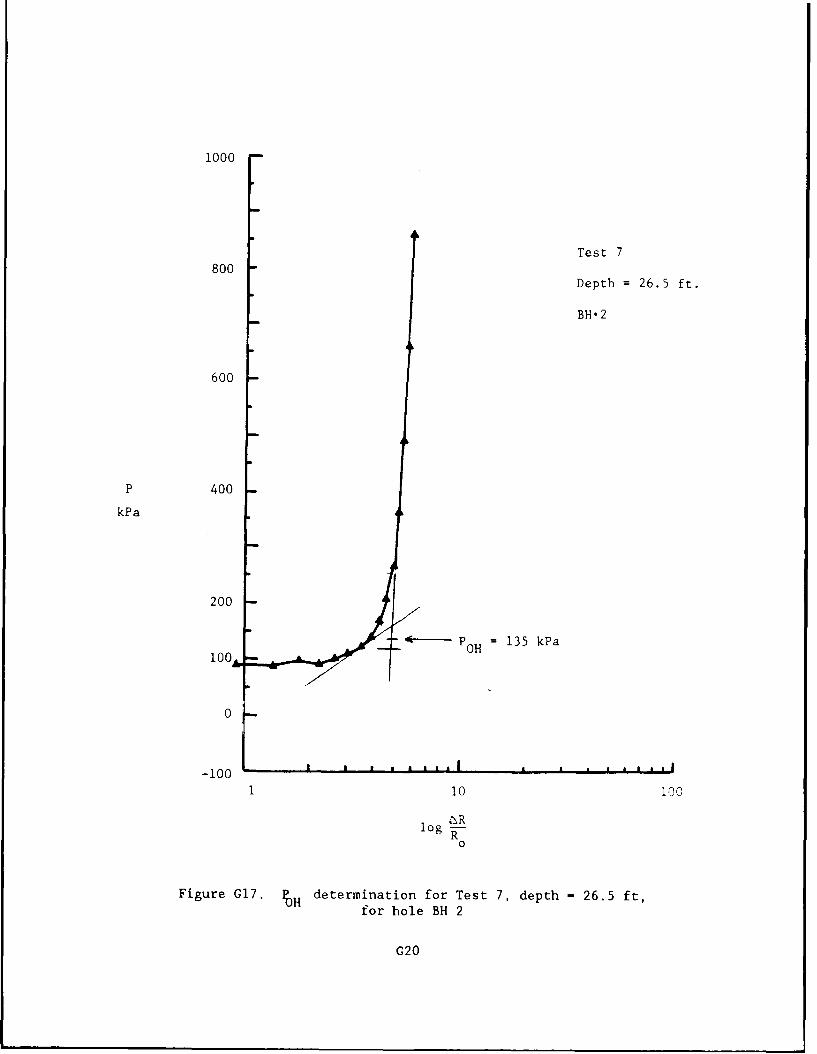
1000
Test 7
800Depth = 26.5 ft.
BH.2
600
P 400
kPa
200
0 OH= 135 kPa
0
-1001 10 i00
log L -
0
Figure G17. %H determination for Test 7, depth - 26.5 ft,for hole BH 2
G20
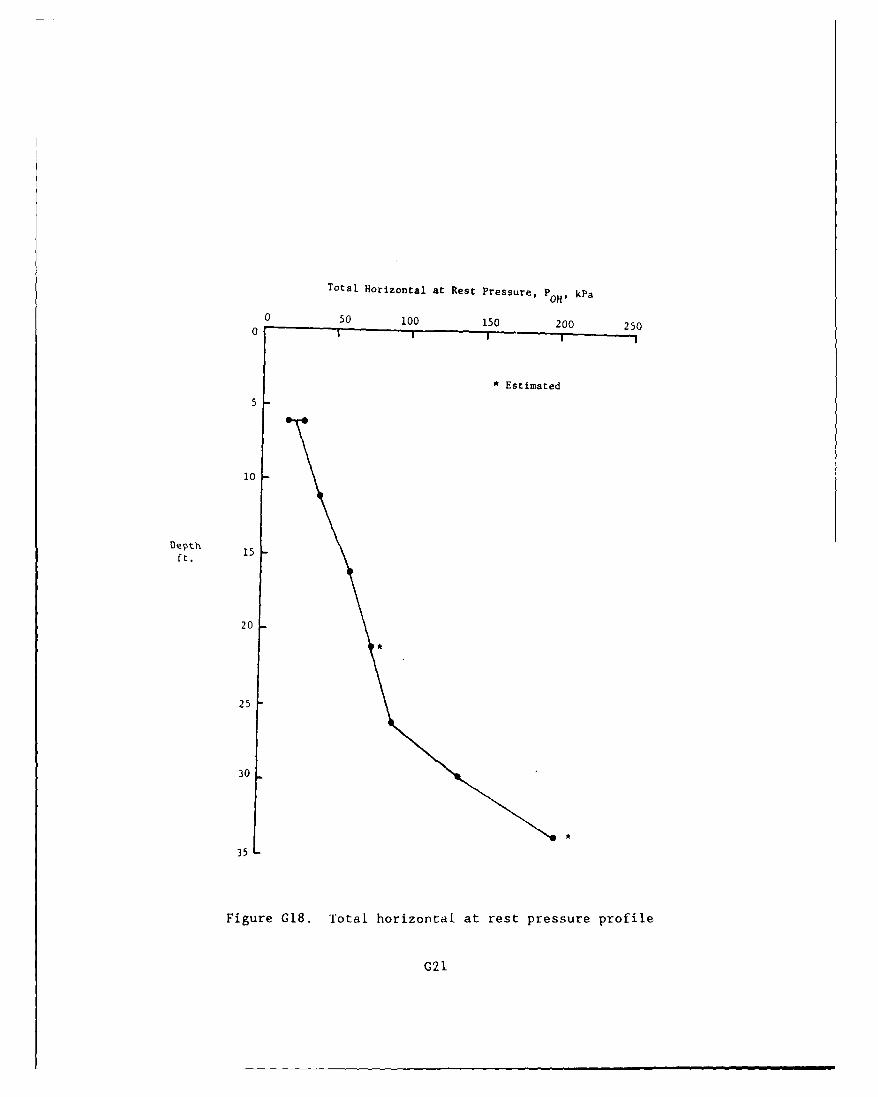
Total Horizontal at Rest Pressure, POW, kPa
0 50 100 150 200 2500
*Estimated
5
10
ft. 1
20
25
30
35L
Figure G18. Total horizontal at rest pressure profile
021
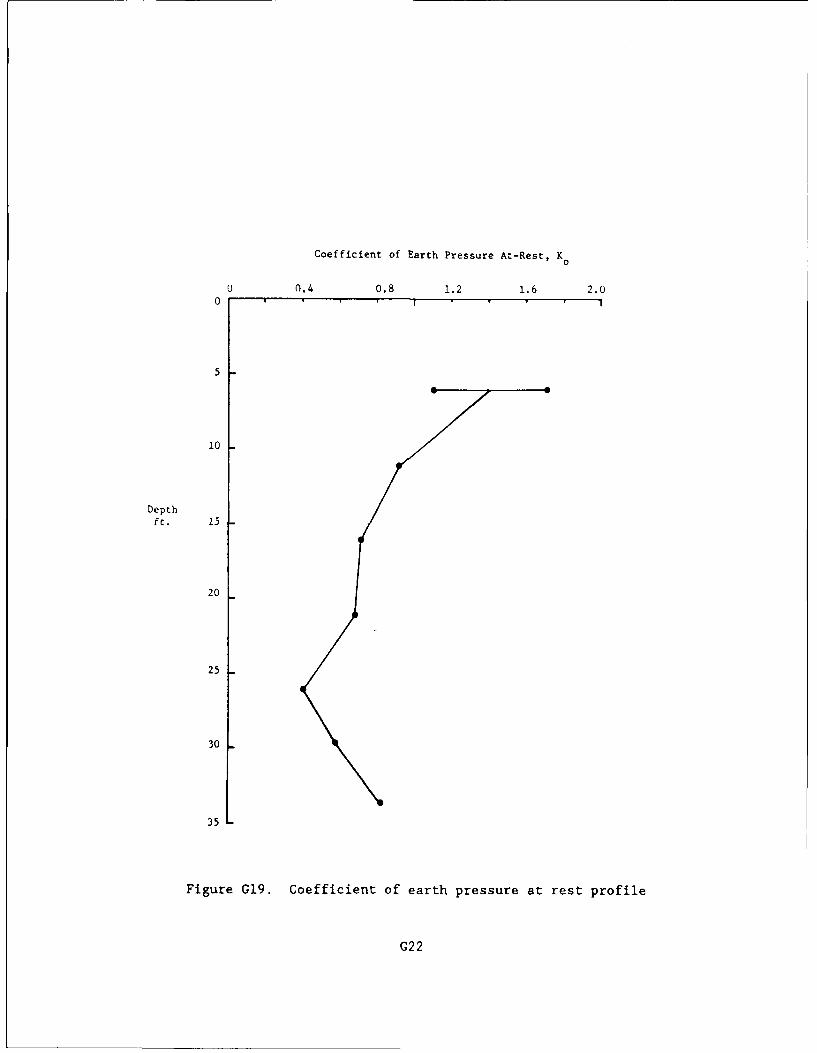
Coefficient of Earth Pressure At-Rest, K0
0 0.4 0.8 1.2 1.6 2.00
10
Depthft. 25
20
25
30
35
Figure G19. Coefficient of earth pressure at rest profile
C22

In In In
~44JN r4 Oco O
r-I , 0 Ln qw
ONI e4n OD O ON cir- N(noN cy a~(o
N-r-CD LO 0 cc~Nu-I I co cmr , N * H NN M0 HN r, 0
0 qwcoio cc a%' OD M NM0 %0 .N0 m N C~%In
49r-i N coco '0 '.OH(o c co r 4
h-lu-bO 00
- 00.r- r- D0000 0
H- .- . 0 0 0 .
(N rn 0n. In 0 0
O00O~~G~0(
W %D '.0r H 00 to in Nl
(N C4 0 ' ) 0 0 m r
(N( n c, co HIr r 0
rnHc N~ r 0444 fI
0 0oo n 0 In 0 c
NH Ln N H In 0 0 "1 4J
Kr ID ,4 co cc (N %.0
H H(N (N M
H Ho (N (n v n r D
G23
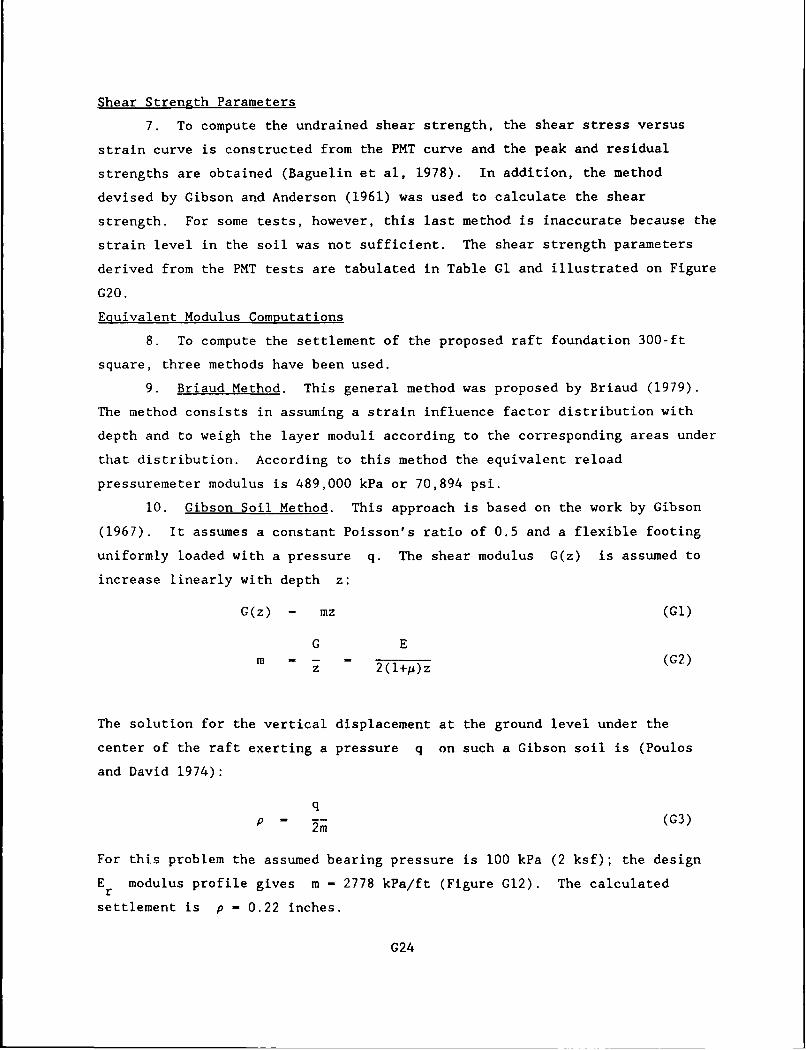
Shear Strength Parameters
7. To compute the undrained shear strength, the shear stress versus
strain curve is constructed from the PMT curve and the peak and residual
strengths are obtained (Baguelin et al, 1978). In addition, the method
devised by Gibson and Anderson (1961) was used to calculate the shear
strength. For some tests, however, this last method is inaccurate because the
strain level in the soil was not sufficient. The shear strength parameters
derived from the PMT tests are tabulated in Table Gl and illustrated on Figure
G20.
Equivalent Modulus Computations
8. To compute the settlement of the proposed raft foundation 300-ft
square, three methods have been used.
9. Briaud Method. This general method was proposed by Briaud (1979).
The method consists in assuming a strain influence factor distribution with
depth and to weigh the layer moduli according to the corresponding areas under
that distribution. According to this method the equivalent reload
pressuremeter modulus is 489,000 kPa or 70,894 psi.
10. Gibson Soil Method. This approach is based on the work by Gibson
(1967). It assumes a constant Poisson's ratio of 0.5 and a flexible footing
uniformly loaded with a pressure q. The shear modulus G(z) is assumed to
increase linearly with depth z:
G(z) - mz (G1)
G Em - - - (G2)
z 2(l+p)z
The solution for the vertical displacement at the ground level under the
center of the raft exerting a pressure q on such a Gibson soil is (Poulos
and David 1974):
qp - (G3)
For this problem the assumed bearing pressure is 100 kPa (2 ksf); the design
E modulus profile gives m - 2778 kPa/ft (Figure G12). The calculatedr
settlement is p - 0.22 inches.
G24
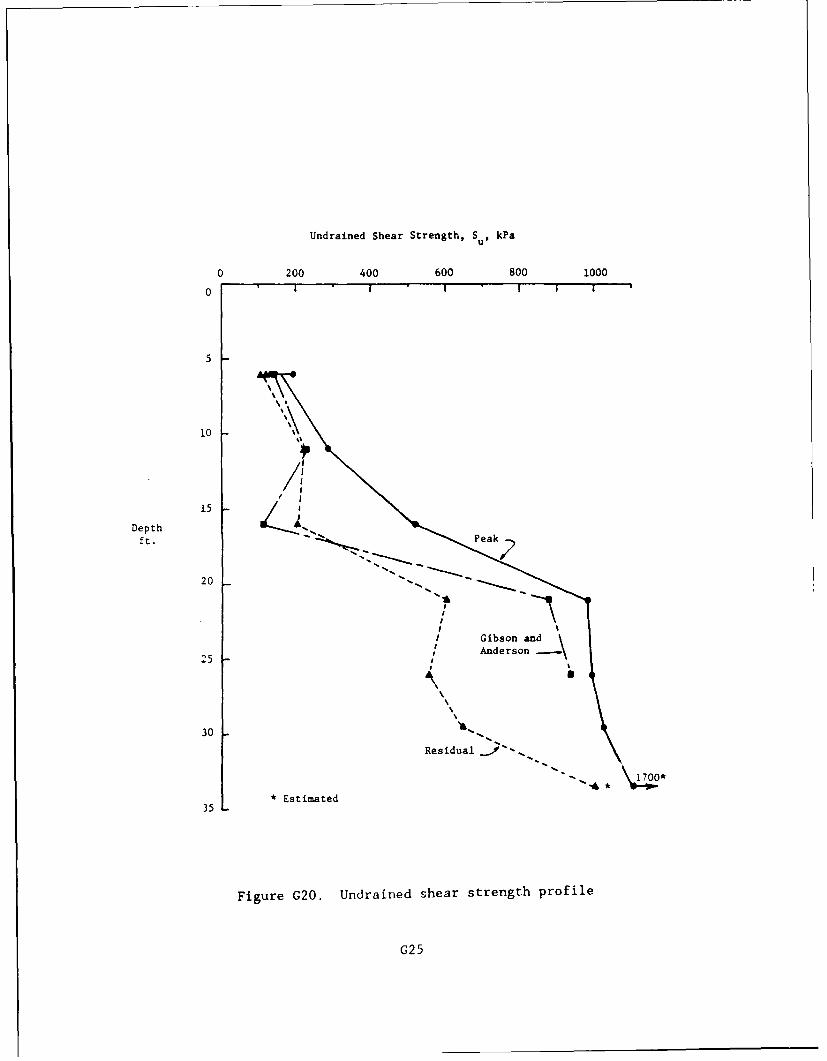
Undrained Shear Strength, Sus kPa
0 200 400 600 800 1000
0 I I l
0
5
10
/1- I
Depth 1
ft.
20
I Gibson and2 5 A n d e r s o n - -\
25
30
Residual .%-.
* Estimated35
Figure G20. Undrained shear strength profile
G25
11. The previous analysis assumes a linearly increasing modulus with
depth. In the case of a homogeneous, semi-infinite half-space, the solution
for a circular, flexible, uniformly loaded area of diameter B is
qB(l -2
P- E*s
Let p - 0.5 and equate equation G3 to G4. The equivalent homogeneous modulus
E* can be obtained for a linearly increasing modulus profiles
3qB q4E* -m (G5a)
s
or
E* = (G5b)s 2
In this case:
m - 2778 kPa/ft
B - 300 ft
So that according to this second method the equivalent reload modulus is E*s
- 1,250,000 kPa or 178,955 psi.
12. Menard Method. This method is described in detail by Briaud et al.
(1983). The settlement equation requires the computation of an equivalent
initial modulus Ei within a zone of influence 8B deep. The expression for
this equivalent modulus is
2; _ + T + 5E 1 (G6)
4 +3/4/5 2"5E6/7/8 29/16
where E p/q is the harmonic mean of the moduli of layers p to q. For
example,
3 1 1 1
E3/4/5 3 3 + E4 + E5
Using this method and a linear increase of the initial modulus with depth
given by El(z) - 500z where El(z) is in kPa and z is in ft, the
equivalent initial modulus Ed - 124,000 kPa (17,752 psi). The settlement for
G26
a bearing pressure oi 100 kPa (2 ksf) according to Menard method is p -
0.54 in. Using this settlement value and Equation G4, the equivalent modulus
is E* - 500,000 kPa (71,582 psi).s
References
Baguelin, F., Jezequel, J. F., and Shields, D. H. 1978. The Pressuremeterand Foundation Engineering, Trans Tech Publications, Clausthal, Germany
Briaud, J.-L. 1979. "The Pressuremeter: Application to Pavement Design,"PhD Dissertation, Civil Engineering Department, University of Ottawa, Canada
Briaud, J.-L., Tucker, L. M., and Felio, G. Y. 1983. "Pressuremeter, ConePenetrometer and Foundation Design," Short Course Notes, Texas A&M University,College Station, TX
Casagrande, A. 1936. "The Determination of the Preconsolidation Load and ItsPractical Significance," Proceedings, First International Conference on SoilMechanics and Foundation Engineering, Vol 3, Cambridge, MA pp A0-64
Gibson, R. E. 1967. "Some Results Concerning Displacements and Stresses in aNon-homogeneous Elastic Half-space," Geotechnique, Vol 17, pp 58-67; Also1968, Vol 18, pp 275-276; 1969, Vol 19, pp 160-161.
Poulos, H. G. and Davis, E. H. 1974. Elastic Solutions for Soil and RockMechanics, John Wiley & Sons, pp 193-194.
G27

II. CONE PENETRATION TEST
by
Recep Yilmaz1 and Rick A. Klopp
2
FUCRO INTER, INC.10165 Harwin, Suite 170
Houston, TX 77036
Authorization
13. Authorization to conduct this work was given by Contract/Purchase
Order No. DACW39-84-M-3972 dated 8 August 1984.
Location
14. The location was approximately 15 ft to the east of an existing
concrete slab and was identified in the field by a representative of the
Waterways Experiment Station.
Equipment
15. The CPT sounding was conducted using our Mobile Electronic Cone
Penetrometer System unit as described in the enclosed brochure. The system is
particularly designed for foundation design and earthwork control applications
where reliable, accurate on-site measurements of subsurface properties are
required.
16. One of the greater advantages of the cone penetrometer is the speed
of operations which permits stratigraphy and engineering properties to be
determined quickly and economically. Another important advantage is the
continuous penetration record which permits location of thin strata that could
easily be missed by conventinal drilling and sampling.
17. The entire system is mounted on a rugged, all-terrain truck which
contains 11 system components including strip-chart recorders and data
processing equipment. The sounding was conducted using an electronic friction
sleeve penetrometer tip. The tip was hydraulically pushed into the ground at
a constant rate of 2 cm/sec and a continuous record of tip bearing resistance
1Senior Staff Engineer2Supervisor, Onshore Operations
028
and side friction resistance on a sleeve located just above the tip was
obtained. Strip-chart records of tip and sleeve friction resistance were
continuously plotted and available for immediate evaluation of soil
conditions. The data was also stored on magnetic tape for computer
processing. An accurate determination of stratigraphy was possible from the
evaluation of tip resistance (q), sleeve friction resistance (f s), and
friction ratio (fr). The latter being the ratio of fs to qc, expressed as
a percentage, and determined by means of our office-based computer. It is
used as the basis for soil classification.
Tests
18. Fugro conducted a single Cone Penetration Test (CPT) sounding to a
depth of approximately 12.5 meters. Based upon the friction ratio, the
general soil conditions were determined and are presented along with the CPT
log on Figure G21. A key to soil classification and symbols used on the CPT
log is presented on Figure G22. Due to the friction buildup along the cone
rods, the 20-ton thrust capacity of the truck was exceeded at approximately
12.5 meters and the sounding was terminated. The general soil profile
consisted of a silty clay to clayey silt strata from about 3 to 12.5 meters
and was overlain by a silty fill deposit.
19. Analysis. The methods of interpretation of CPT data depends on
whether the soil responds to the cone penetration in a drained or undrained
manner. As generally accepted, most soils which classify as silty clay
respond to cone penetration in an undrained manner. The measured undrained
shear strength of clayey soils in the laboratory depends significantly on the
type of test used, the rate of strain, and the orientation of the failure
planes. When evaluating the undrained shear strength C from coneu
penetration testing, the following equation is used
C - c (8)u
U Nk
where
q = rip resistance, kg/cm2
v = total unit weight, kg/cm 3
G29
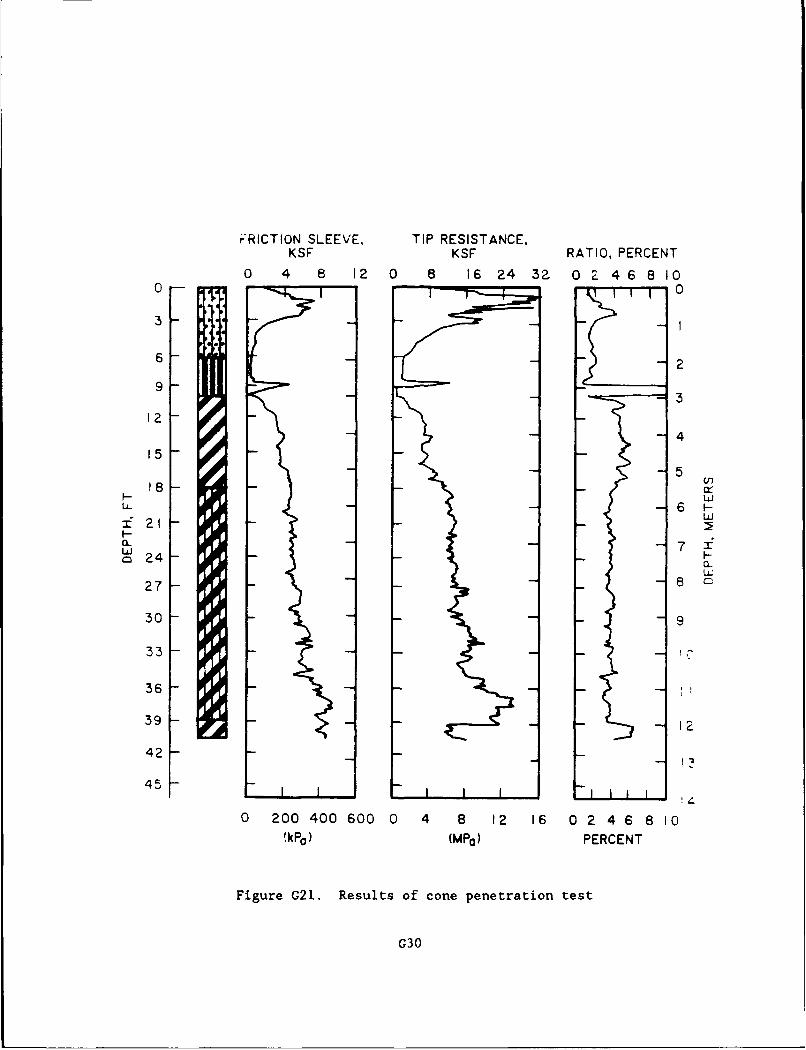
iRICTION SLEEVE, TIP RESISTANCE,KSF KSF RATIO, PERCENT
O 4 8 12 0 8 16 24 32 0 246 8100 0
31
6 2
9
415
518
z21ai- 71
o24 -a
278
30 -9
33 -
36
39 12
42 --
O 200 400 600 0 4 8 12 16 0 2 4 6810IkPO) (Mp0)) PERCENT
Figure G21. Results of cone penetration test
G30

KEY TO SOIL CLASSIFICATION AND SYMBOLSSOIL TYPE SAMPLE TYPE
( Shown in Symbol Column) (Shown In Soa/ee Co 8m)Sand Sill Clay
FILL Sandy silty Clayey Undisturbed Rock Core Split Spobn No Recovery
PredominaiV type snhown heavy
TERMS DESCRIBING CONSISTENCY OR CONDITION
COARSE GRAINED SOILS (MajorPortion Retained on No. 200 Sieve)
Includes (1) clean gravels a &and described as tine ,mndium or coarse,depereding on distribution of groin sizes 8,M) silty orclayey gravels Ek sands (3) tine grained low plasticity soils (Pt - 10) such as sandy silts. Condition is rated according torelative density, as determined by tab tests or estimated from resistance to sampler penetration.
Descriptive Term Penetration Resistance * Relative DensityLoose 0-t o0 to 400/Medium Dense 10-30 40 to 70-7Dense 30-50 T0 to 90%Very Dense Over 50 90 to tOO0%/
*B 81 /FP 140 hamrl 30 -drop
FINE GRAINED SOILS (major Portion Passing No. 200 Sieve)
Includes (I) inorganic 8 organic silts a ctays,(2) sandy, gravelly or silty clays, EM3) clayey silts. Consistency is ratedaccording to shearing streirgth,as indicated bypenetrometer reading or byimcoifined comnpression tests for Soils with P1 - 10
Descr iptive Cohesive Shear StrengthTerm Tons/Sq. Ft.
Very Soft Less Than 0.125Soft 0.125 to 0.25Firm 0.25 to 0.50Stiff 0.50 to 1 .00Very Stiff 1.00 to 2.00Hard 2.00 and Higher
ArorC- SLICKOWSIVIED AND I"ISSURCO CLAY MAY AIEv LWE(R OWCONFINEV coMPRESSIVE SrRpewltiS7,rAN SHOeW ABIOVE, BECAUSE OF PLANE S OY WEAKNESS on9 SNRINKAGE CRACKS;Coms~sremcr RArivais cof sucm soILS ARE OASEO ON KANO FeN~rRAME-rR READINGS
TERMS CHARACTERIZING SOIL STRUCTURE
Porting paper thin in size Fioccu~ated pertaining to cohesive soils thai exhibit
Seam 1/8-3"ticka loose knit or tlakey structure
Slickensided honing inclined planes at weaknes thatLayer greater tthan 3 ore slick and glossy in appearance
Fissured coailning shrinkage crackSs,frvguentl~ t illed DEGREE OF SLICKENSIDED DEVELOPMENTwith finre Sand Of silt ,isualln more or less "ertical Slightly Slichensided slickensides present at intervals at
Sensitive pertaining to cohesive soils that ore subject to 1' .2', soil does not eaisily breakappreciable loss of strength when renmolded along these planes
Ieredd composedl of alternate layers ot different Moderately Sheeneled sickensides spaced at Internals ofsotelhtyded I -2 , soil breaks easily along these
soil ypesplanes
Laminated composed ot thin layers ot varying color and texture Extremely Slickensided coitinfliO and interconnected slic " en-
Colcrnou conainng aprecbleguadties~$.des soc.:ed at internals of 4 -12Calar tu cotiigaple al uaiso calciu Soi reaks a Wqn the sliCiensides
co~buncleinto o-eces 3--6-- sizeWell Graded having wde ratuge i groin sizes and substiintiri Intensely Slscitensded sicernsies spaced at intervals of
omn'"Is of oll niermndtf pamir lS izes less than 4 .. continuous in olPbor y Graoded pimedoinotel ot one gfoin tiZe. or hoving ai range directions ;Sort breaks down aiong
)f sites with some nIermr ,,redii 5it rnfi-qn planes ~info jlas 1/4"-2"in size
FUGRO INTEFR, INC
Figure G22. Key to soil classification and symbols
G31
z - depth, cm
Nk - cone factor for tip
The Nk value equals a Terzaghi-type bearing capacity factor for the cohesive
contribution to bearing, but is applied here to the small-diameter, deep
foundation case represented by q c data.
Evaluation of Nk
20. Nk does not possess a constant value, but varies with the stress-
strain properties of the soil. In general, the more sensitive the clay, the
lower Nk value is obtained. Fugro's experience in clayey soils and data
presented by Lunne and Kleven (1981) shows that for normally consolidated
marine clays, Nk falls between 11 and 19 with an average of 15. The
estimation of the undrained shear strength in silty soils becomes more
difficult and the above equations may not accurately define the strength where
cone penetration may cause a partially drained soil response. As an example
of the difficulties in a silty soil, consider Figure G23 which shows a plot of
N k qc/Cu against undrained shear strength for a Fugro test site. The
undrained shear strengths were measured with triaxial undrained unconsolidated
(uu) and selfboring pressuremeter (SBP) tests and were representative of
normally consolidated marine silty clays.
21. In an effort to obtain an appropriate Nk factor, we have
conducted an analysis of CPT data, laboratory results of borings for various
geotechnical projects in the Texarkana area, information supplied by the
Waterways Experiment Station, and our past experience with similar soils.
22. A determination of the overconsolidation ratio (OCR) by use of the
CPT data showed the deposit to be moderately overconsolidated. Values of Nk
between 15 and 30 for overconsolidated deposits are suggested by Toolan and
Fox (1977). For the soils encountered we have used a lower bound of 25 and an
upper bound of 35 for Nk and have plotted this data on Figure G24 along with
the recommended mean.
23. From conversations between Lawrence Johnson of the Waterways
Experiment Station and Rick Klopp of Fugro, the results from laboratory
*Refer to references in this section, II. CONE PENETRATION TEST
G32

400
360
320
C4
zo240
0 .1T0
N+
00
8 20
66 46PTST 2
40 a SBP TEST. A07
4- UU TEST, A07
00 12 14 16 18 20 2
COWM FACTOR, N k
VARIATION OF CONE FACTOR WITH SHEAR STRENGTH
INTERPPETATIONJ OF CPT DATA IN SILTY S)OILS
FUGRO INTER, INC.ConSuoing E.nginferS and Geologisfti
Figure G23. Variation of cone factor with shear strength
interpretation of CP'. data in silty soils
G23
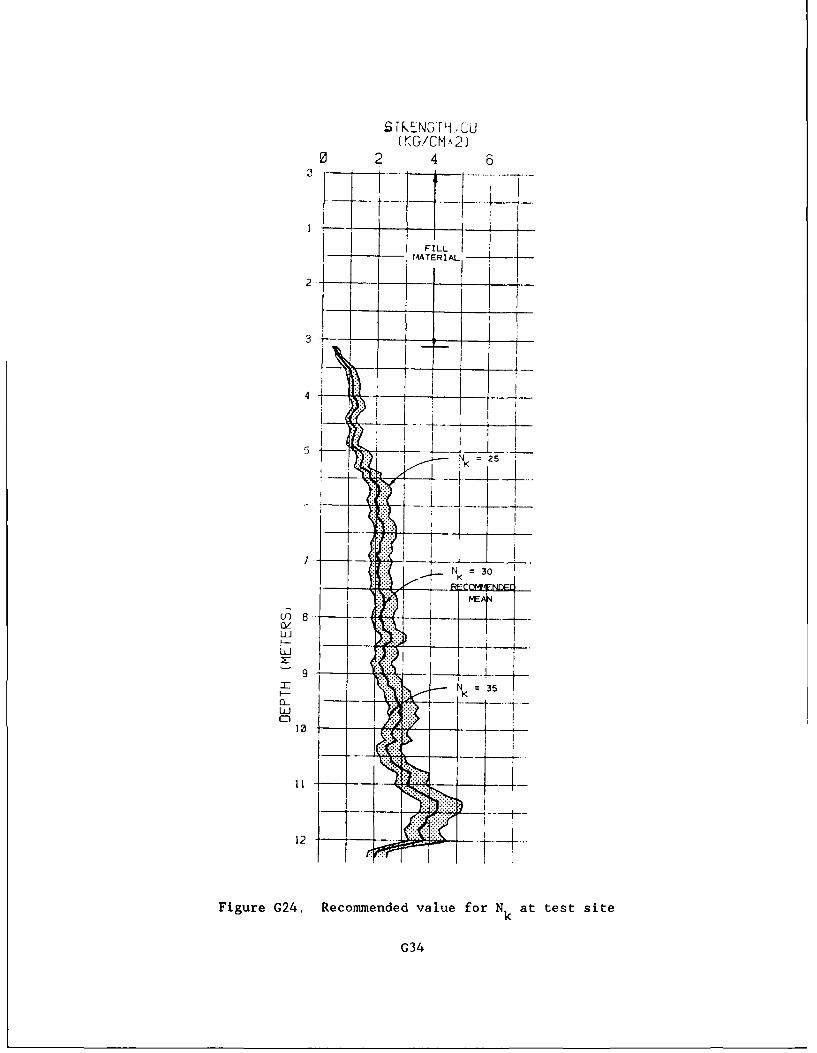
S IKENG'rH LJ(KG./CMA2)
0 2 4 6
FILL
MATERIAL
2 - _i- ..... .. ..
IK
-r 1-- -
NK = 30
K 35
--
10
Figure G24. Recommended value for Nk at test site
G34

testing of samples for determination of undrained shear strength conducted by
the Waterways Experiment Station show values somewhat lower than our
recommended mean. We believe that this may be due to sample disturbance.
Elastic Soil Modulus
24. Based on the above discussion concerning undrained shear strength,
and provided that the cone resistance relates to an undrained soil response,
the methods for determining Young's Modulus in clays should be relevant. An
estimation of undrained Young's Modulus E can be made using empiricalU
correlations with the undrained shear strength C in the formu
E - QC G9)u u
where a is a constant that depends on stress or strain level, OCR,
sensitivity, and other factors. The choice of the relevant stress or strain
level is very important due to the non-linear behavior of soil. Figure G25
presents data that shows the variation of the ratio E u/Cu with stress level
for seven different normally consolidated cohesive soils whose plasticity
index PI ranged from 15 to 75. Figure G26 shows the variation of E u/Cu
with OCR at two stress levels for the same soils presented on Figure G25.
Based on Waterways Experiment Station supplied laboratory data, soil types
numbers 3, 4, and 5 show the best correlation. Using the charts presented on
Figure G26 and the OCR of the soil, we estimate that E u/Cu approximates 200
to 400 and have presented this data with depth on Figure G27. As discussed,
the shear stress level is a factor which has great influence on E . Foru
example, low values of Eu/C u would be expected for highly plastic clays with
a high shear stress level, and higher values for lightly loaded clays of low
plasticity. The actual use of the E data also has an effect on the stressu
level that should be utilized. For example, axial loading on piles yields a
lower level of strain than lateral loading and the corresponding value of Eu
would change.
25. Silty soils present some difficulties for accurate and reliable
inerpretations for classification and for fundamental soil properties based on
conventional electric friction cone data. An important factor relates to
whether cone penetration evokes a drained or undrained soil response. It is
considered that silty soils will respond in an undrained or partially drained
G35
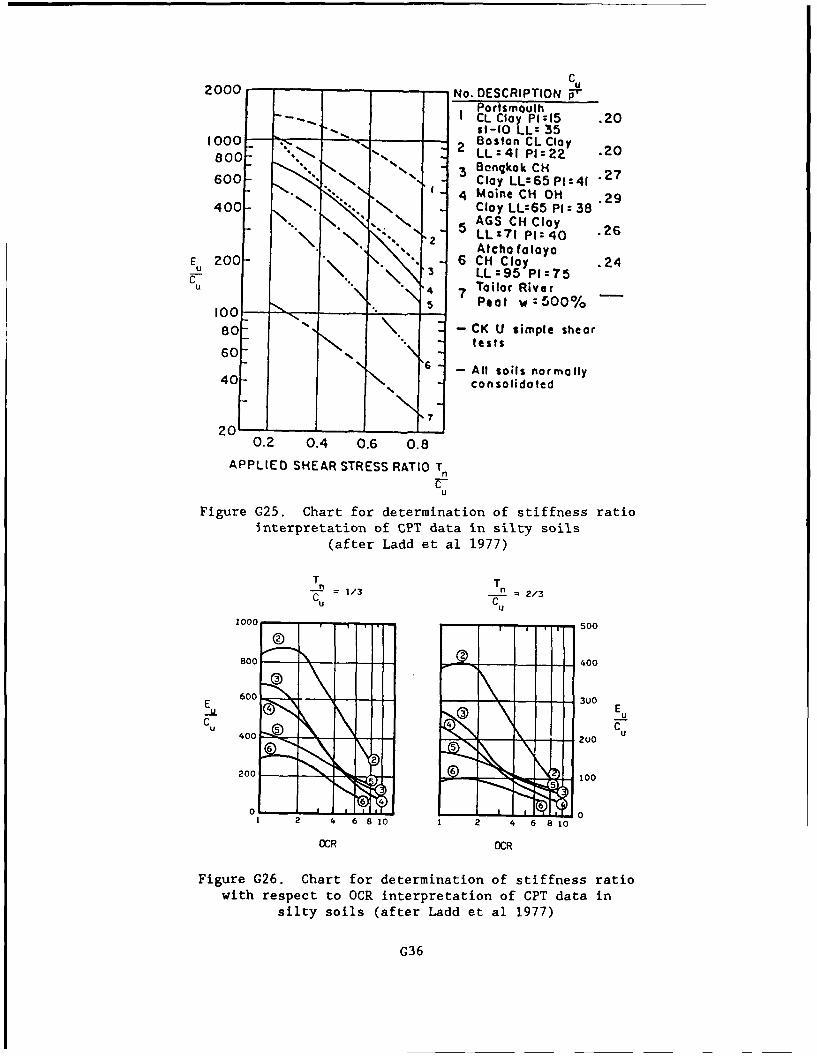
C2000 U2000 - No. DESCRIPTION "
Portsmouth- I CL Cloy P1:15 .20
St-O LL: 351000 - - Boston CL Cloy800 " LLz41 P1:22 .20
600 3 Bangkok CH60", Clay LL:65 Pi:41 '27
400 . 4 Maine CH OH 29400-* ' Cloy LL:65 PI : 38
AGS CH Cloy
2 LL:71 PI:40 .26E 200- " Atcha falaya
200 6CH Clay .24"\ 3 LL:95 P1=-75
4 Tailor River
100 - 5 Peal w 5 0 0 % -
80- " " CK U simple sheartests
60-40 6 - All soils normally
40- consolidated
7
20 --0.2 0.4 0.6 0.8
APPLIED SHEAR STRESS RATIO Tn
U
Figure G25. Chart for determination of stiffness ratiointerpretation of CPT data in silty soils
(after Ladd et al 1977)
T TC 1/3 n 2/3u C u
U
1000 1 IMv- I - 500
800 __ .400
E 600
C '4 C6
400 -- v,
2200 6 .
64 61 2 4 6 8 10 1 2 4 6 8 10
OCR OCR
Figure G26. Chart for determination of stiffness ratiowith respect to OCR interpretation of CPT data in
silty soils (after Ladd et al 1977)
G36
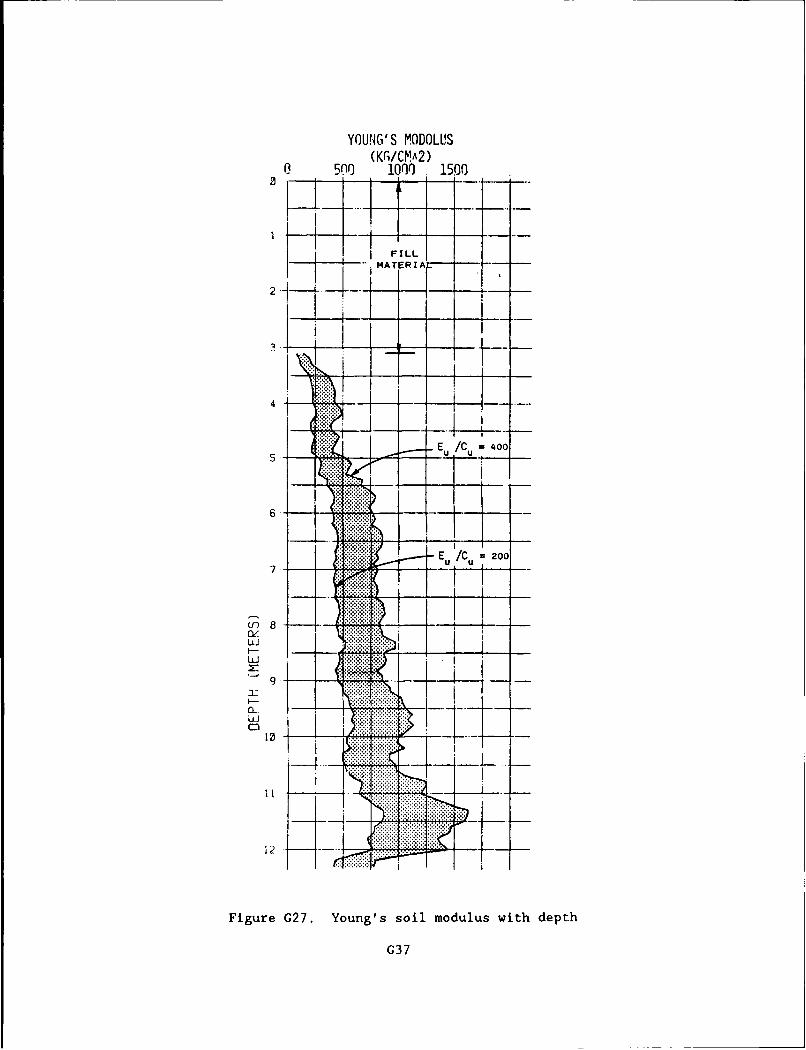
YOUNG'S MODOLL'S(KG/CMA2)
(3 500' 1000') 1500
I jI IFILLt
[IMATERIf
2 -j
X _ E~ /C 2 '0011-, -
(f) 8 ± . -
LJ I Li-i
10
12
Figure G27. Young's soil modulus with depth
G37

manner. Overconsolidation effects in silty soils also complicates
determination of geotechnical properties. Therefore a need for local
correlation with laboratory results becomes necessary. Cone penetration
testing is useful for determination of the undisturbed values of C and Eu u
although empirical correlations are required.
References
Ladd, C. C., Foott, R., Ishihara, K., Schlosser, F., and Poulos, H. G. 1977."Stress - Deformation and Strength Characteristics," Proceedings of the NinthInternational Conference on Soil Mechanics and Foundation Engineering, Tokyo,Japan, Vol II, pp 421-494
Lunne, T. and Kleven, A. 1981. "Role of CPT in North Sea FoundationEngineering," Symposium on Cone Penetration Testing and Experience,Geotechnical Engineering Division, American Society of Civil Engineers, pp 49-75
Toolan, F. E. and Fox, D. A. 1977. "Geotechnical Planning of PiledFoundations for Offshore Platforms", Proceedings of the Institute of CivilEngineers, Vol 62, Part 1, pp 221-244
G38
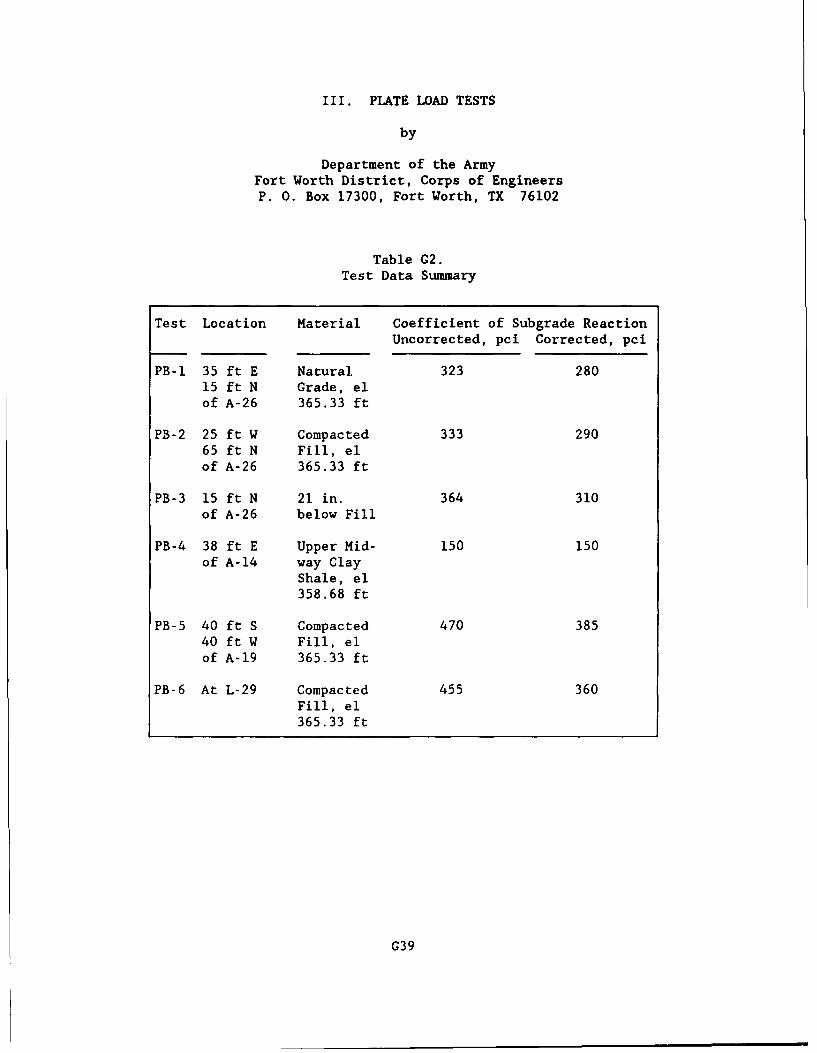
III. PLATE LOAD TESTS
by
Department of the ArmyFort Worth District, Corps of EngineersP. 0. Box 17300, Fort Worth, TX 76102
Table G2.Test Data Summary
Test Location Material Coefficient of Subgrade ReactionUncorrected, pci Corrected, pci
PB-l 35 ft E Natural. 323 28015 ft N Grade, elof A-26 365.33 ft
PB-2 25 ft W Compacted 333 29065 ft N Fill, elof A-26 365.33 ft
PB-3 15 ft N 21 in. 364 310of A-26 below Fill
PB-4 38 ft E Upper Mid- 150 150of A-14 way Clay
Shale, el
358.68 ft
PB-5 40 ft S Compacted 470 38540 ft W Fill, elof A-19 365.33 ft
PB-6 At L-29 Compacted 455 360Fill, el365.33 ft
C39
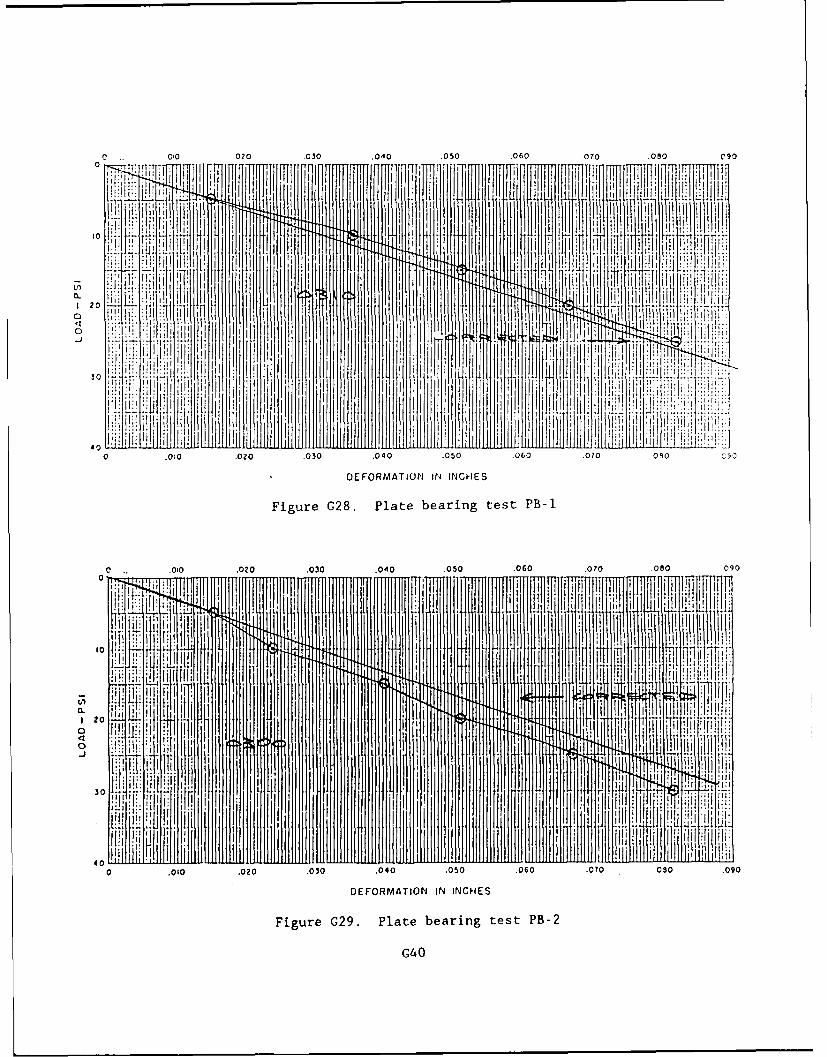
-. .010 .020 .030 .0'10 .050 .060 .070 .080 090
120 .{~%h1V KFill~j Ril qirii
0 L
LI 20 i Vt! 1~~
401 .010 .02 .0L0 .E~0 4 : .050 .060 .070 090 090
Figure G28. Plate bearing test PB-2
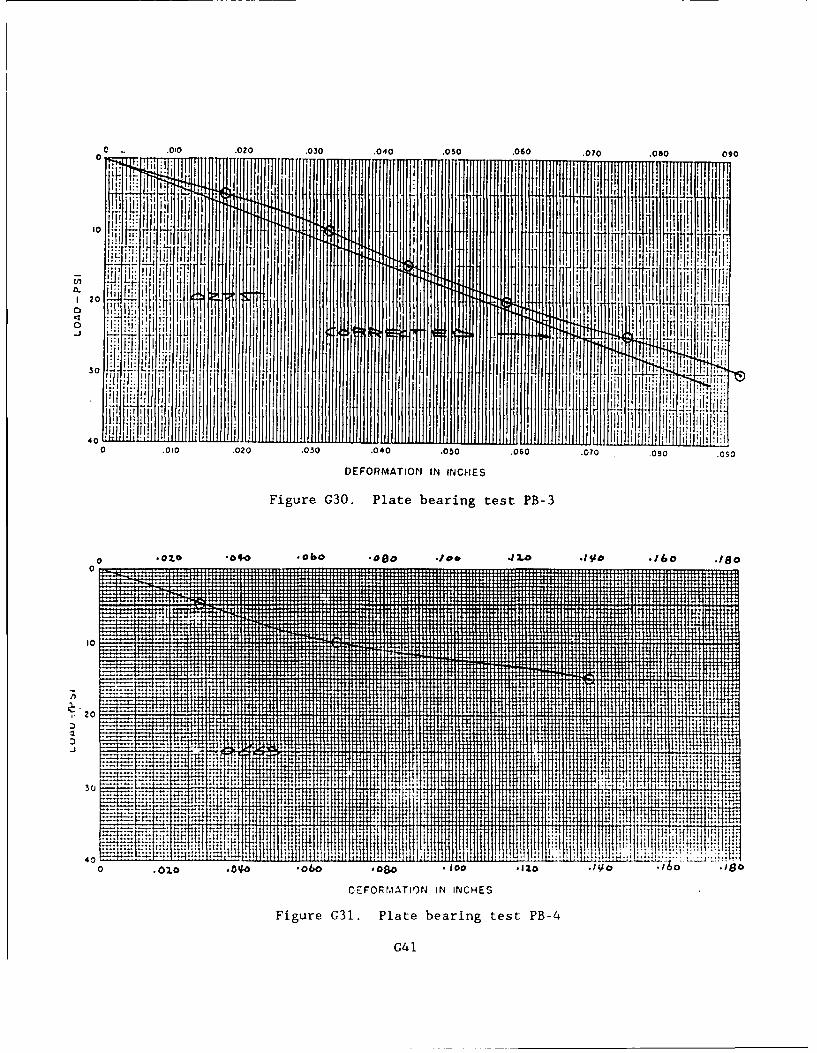
C . .010 .020 .030 .040 .050 .060 .070 .060 090
U2 V~ . ii **r t 41L I
0 ______W,_
0
7 1
4 0 .0 10. 02 0 I . 0. 4005.060 .070 .110 .090
DEFORMATION IN INCHES
Figure G30. Plate bearing test PB-4
10
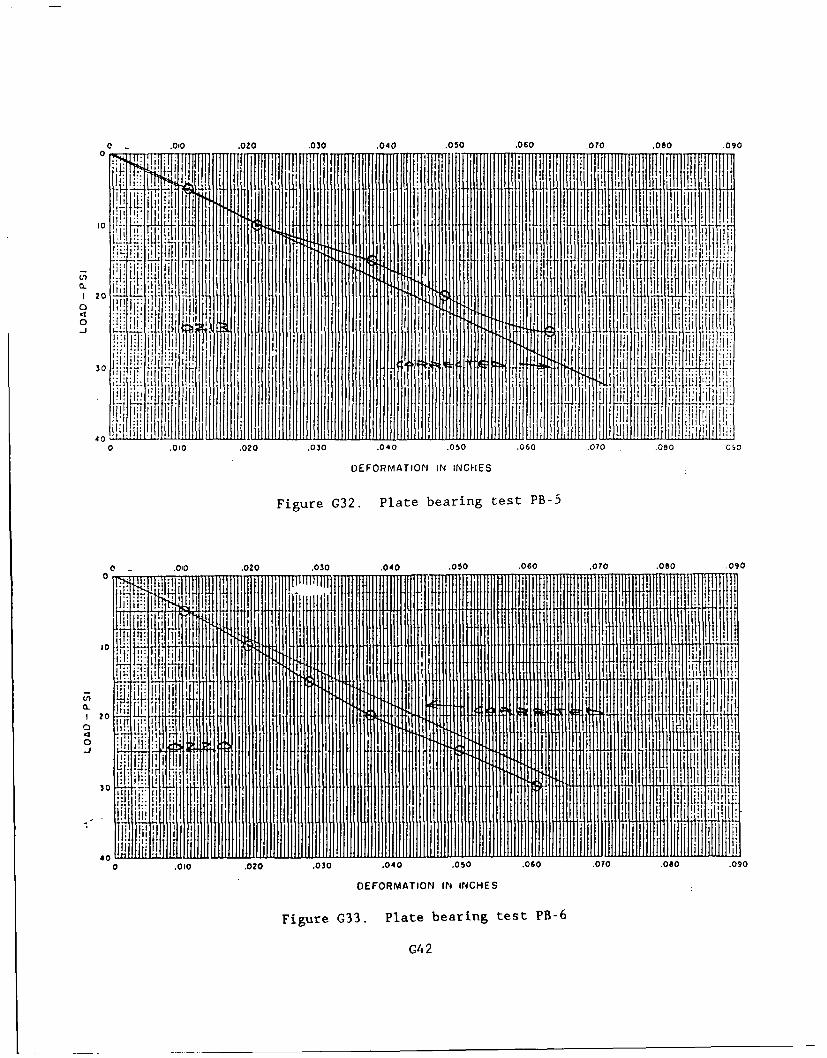
o . .010 .020 .030 .040 .050 .060 .070 .080 090
10 b0 L
40______
0 .010 .020 .050 .040 .050 .060 .070 .05003
DEFORMATION IN INCHES
Figure G32. Plate bearing test PB-5
0 .010 .020 .030 .040 .050 .060 .070 .080 .0900
20U' L!i
0 .010 .020 .030 .040 .050 .060 .070 .080 .090
DEFORMATION IN INCHES
Figure 033. Plate bearing test PB-6
G4 2
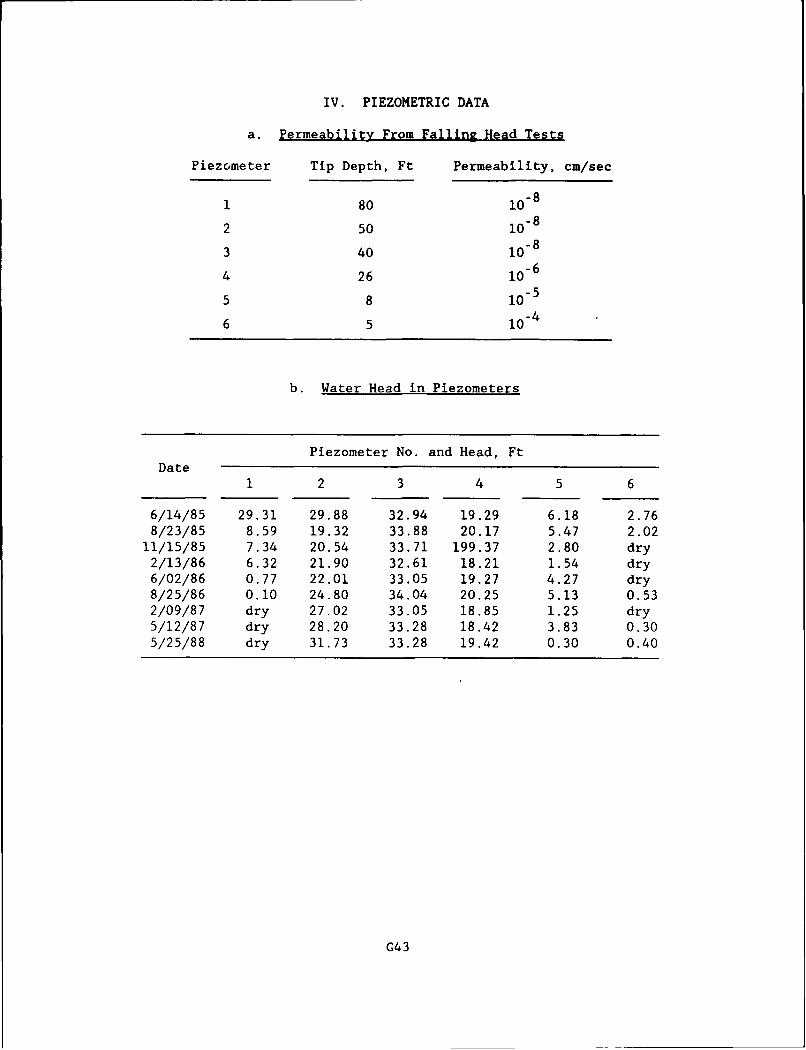
IV. PIEZOMETRIC DATA
a. Permeability From Falling Head Tests
Piezometer Tip Depth, Ft Permeability, cm/sec
1 80 1o8
2 50 10-8
3 40 Io8
4 26 i0
5 8 I05
6 5 i0
b. Water Head in Piezometers
Piezometer No. and Head, FtDate
1 2 3 4 5 6
6/14/85 29.31 29.88 32.94 19.29 6.18 2.768/23/85 8.59 19.32 33.88 20.17 5.47 2.02
11/15/85 7.34 20.54 33.71 199.37 2.80 dry2/13/86 6.32 21.90 32.61 18.21 1.54 dry6/02/86 0.77 22.01 33.05 19.27 4.27 dry8/25/86 0.10 24.80 34.04 20.25 5.13 0.532/09/87 dry 27.02 33.05 18.85 1.25 dry5/12/87 dry 28.20 33.28 18.42 3.83 0.305/25/88 dry 31.73 33.28 19.42 0.30 0.40
G43
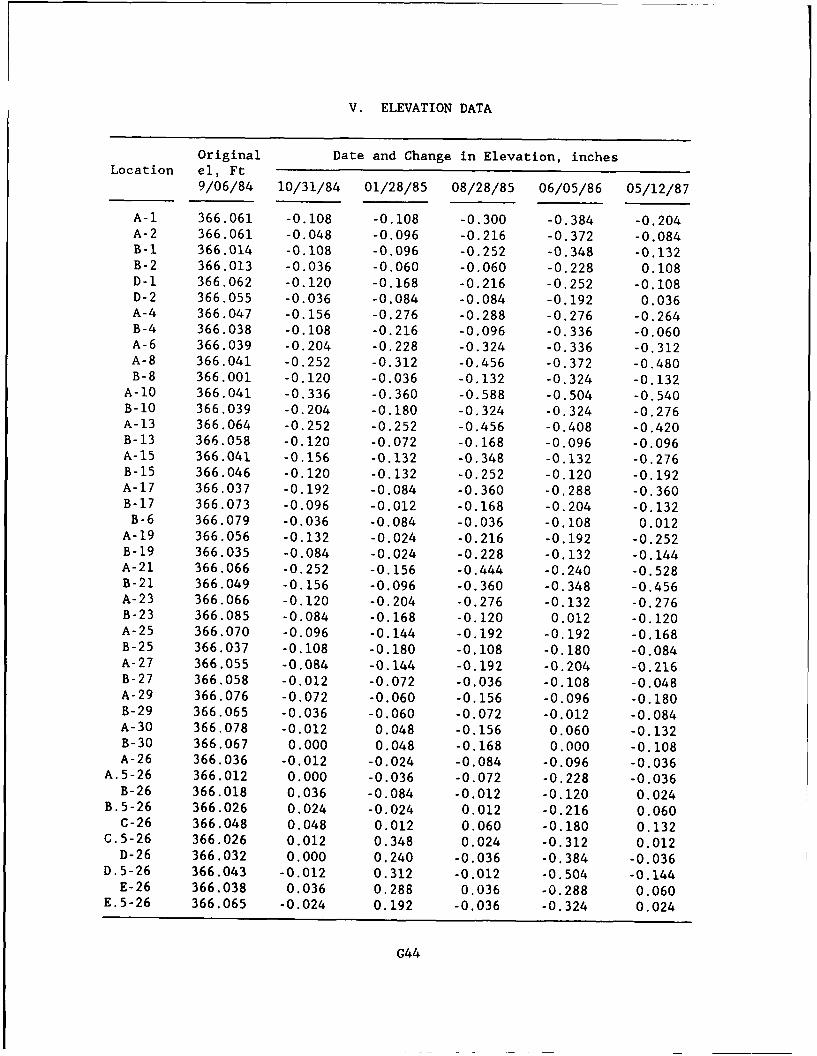
V. ELEVATION DATA
Original Date and Change in Elevation, inchesLocation el, Ft
9/06/84 10/31/84 01/28/85 08/28/85 06/05/86 05/12/87
A-i 366.061 -0.108 -0.108 -0.300 -0.384 -0.204A-2 366.061 -0.048 -0.096 -0.216 -0.372 -0.084B-1 366.014 -0.108 -0.096 -0.252 -0.348 -0.132B-2 366.013 -0.036 -0.060 -0.060 -0.228 0.108D-1 366.062 -0.120 -0.168 -0.216 -0.252 -0.108D-2 366.055 -0.036 -0.084 -0.084 -0.192 0.036A-4 366.047 -0.156 -0.276 -0.288 -0.276 -0.264B-4 366.038 -0.108 -0.216 -0.096 -0.336 -0.060A-6 366.039 -0.204 -0.228 -0.324 -0.336 -0.312A-8 366.041 -0.252 -0.312 -0.456 -0.372 -0.480B-8 366.001 -0.120 -0.036 -0.132 -0.324 -0.132
A-10 366.041 -0.336 -0.360 -0.588 -0.504 -0.540B-10 366.039 -0.204 -0.180 -0.324 -0.324 -0.276A-13 366.064 -0.252 -0.252 -0.456 -0.408 -0.420B-13 366.058 -0.120 -0.072 -0.168 -0.096 -0.096A-15 366.041 -0.156 -0.132 -0.348 -0.132 -0.276B-15 366.046 -0.120 -0.132 -0.252 -0.120 -0.192A-17 366.037 -0.192 -0.084 -0.360 -0.288 -0.360B-17 366.073 -0.096 -0.012 -0.168 -0.204 -0.132B-6 366.079 -0.036 -0.084 -0.036 -0.108 0.012
A-19 366.056 -0.132 -0.024 -0.216 -0.192 -0.252B-19 366.035 -0.084 -0.024 -0.228 -0.132 -0.144A-21 366.066 -0.252 -0.156 -0.444 -0.240 -0.528B-21 366.049 -0.156 -0.096 -0.360 -0.348 -0.456A-23 366.066 -0.120 -0.204 -0.276 -0.132 -0.276B-23 366.085 -0.084 -0.168 -0.120 0.012 -0.120A-25 366.070 -0.096 -0.144 -0.192 -0.192 -0.168B-25 366.037 -0.108 -0.180 -0.108 -0.180 -0.084A-27 366.055 -0.084 -0.144 -0.192 -0.204 -0.216B-27 366.058 -0.012 -0.072 -0.036 -0.108 -0.048A-29 366.076 -0.072 -0.060 -0.156 -0.096 -0.180B-29 366.065 -0.036 -0.060 -0.072 -0.012 -0.084A-30 366.078 -0.012 0.048 -0.156 0.060 -0.132B-30 366.067 0.000 0.048 -0.168 0.000 -0.108A-26 366.036 -0.012 -0.024 -0.084 -0.096 -0.036
A.5-26 366.012 0.000 -0.036 -0.072 -0.228 -0.036B-26 366.018 0.036 -0.084 -0.012 -0.120 0.024
B.5-26 366.026 0.024 -0.024 0.012 -0.216 0.060C-26 366.048 0.048 0.012 0.060 -0.180 0.132
C.5-26 366.026 0.012 0.348 0.024 -0.312 0.012D-26 366.032 0.000 0.240 -0.036 -0.384 -0.036
D.5-26 366.043 -0.012 0.312 -0.012 -0.504 -0.144E-26 366.038 0.036 0.288 0.036 -0.288 0.060
E.5-26 366.065 -0.024 0.192 -0.036 -0.324 0.024
G44
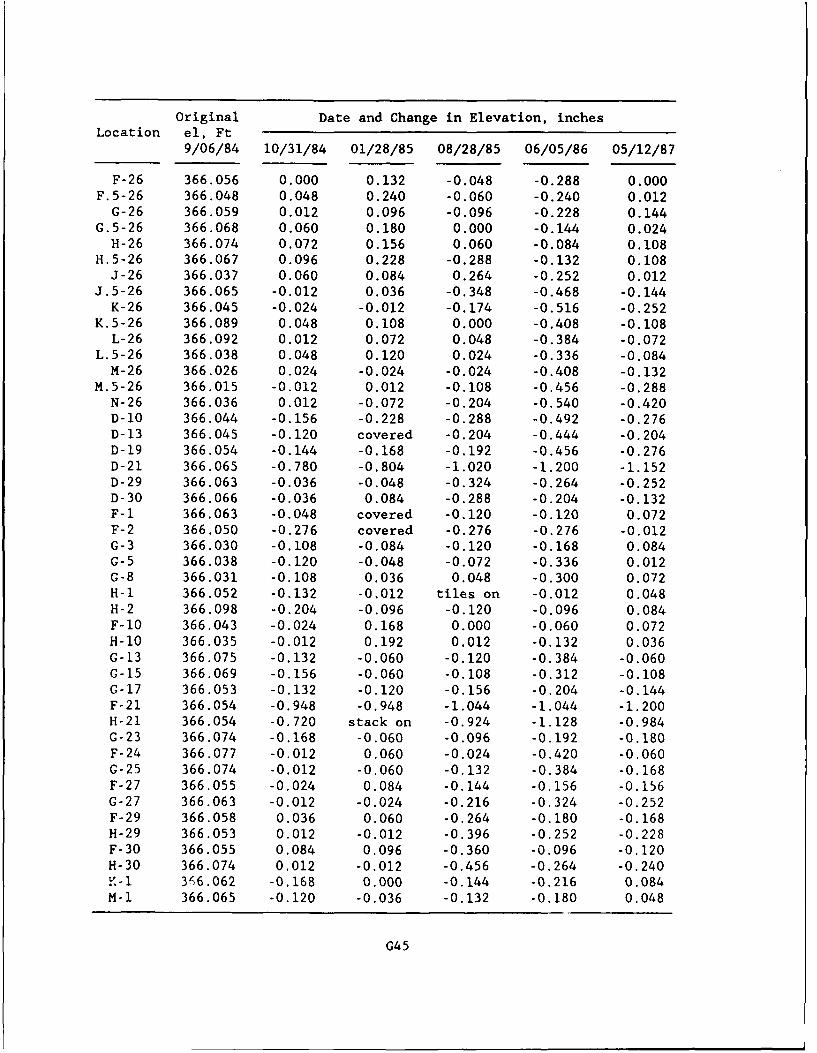
Original Date and Change in Elevation, inchesLocation el, Ft
9/06/84 10/31/84 01/28/85 08/28/85 06/05/86 05/12/87
F-26 366.056 0.000 0.132 -0.048 -0.288 0.000F.5-26 366.048 0.048 0.240 -0.060 -0.240 0.012G-26 366.059 0.012 0.096 -0.096 -0.228 0.144
G.5-26 366.068 0.060 0.180 0.000 -0.144 0.024H-26 366.074 0.072 0.156 0.060 -0.084 0.108
H.5-26 366.067 0.096 0.228 -0.288 -0.132 0.108J-26 366.037 0.060 0.084 0.264 -0.252 0.012
J.5-26 366.065 -0.012 0.036 -0.348 -0.468 -0.144K-26 366.045 -0.024 -0.012 -0.174 -0.516 -0.252
K.5-26 366.089 0.048 0.108 0.000 -0.408 -0.108L-26 366.092 0.012 0.072 0.048 -0.384 -0.072
L.5-26 366.038 0.048 0.120 0.024 -0.336 -0.084M-26 366.026 0.024 -0.024 -0.024 -0.408 -0.132
M.5-26 366.015 -0.012 0.012 -0.108 -0.456 -0.288N-26 366.036 0.012 -0.072 -0.204 -0.540 -0.420D-10 366.044 -0.156 -0.228 -0.288 -0.492 -0.276D-13 366.045 -0.120 covered -0.204 -0.444 -0.204D-19 366.054 -0.144 -0.168 -0.192 -0.456 -0.276D-21 366.065 -0.780 -0.804 -1.020 -1.200 -1.152D-29 366.063 -0.036 -0.048 -0.324 -0.264 -0.252D-30 366.066 -0.036 0.084 -0.288 -0.204 -0.132F-I 366.063 -0.048 covered -0.120 -0.120 0.072F-2 366.050 -0.276 covered -0.276 -0.276 -0.012G-3 366.030 -0.108 -0.084 -0.120 -0.168 0.084G-5 366.038 -0.120 -0.048 -0.072 -0.336 0.012G-8 366.031 -0.108 0.036 0.048 -0.300 0.072H-i 366.052 -0.132 -0.012 tiles on -0.012 0.048H-2 366.098 -0.204 -0.096 -0.120 -0.096 0.084F-10 366.043 -0.024 0.168 0.000 -0.060 0.072H-10 366.035 -0.012 0.192 0.012 -0.132 0.036G-13 366.075 -0.132 -0.060 -0.120 -0.384 -0.060G-15 366.069 -0.156 -0.060 -0.108 -0.312 -0.108G-17 366.053 -0.132 -0.120 -0.156 -0.204 -0.144F-21 366.054 -0.948 -0.948 -1.044 -1.044 -1.200H-21 366.054 -0.720 stack on -0.924 -1.128 -0.984G-23 366.074 -0.168 -0.060 -0.096 -0.192 -0.180F-24 366.077 -0.012 0.060 -0.024 -0.420 -0.060G-25 366.074 -0.012 -0.060 -0.132 -0.384 -0.168F-27 366.055 -0.024 0.084 -0.144 -0.156 -0.156G-27 366.063 -0.012 -0.024 -0.216 -0.324 -0.252F-29 366.058 0.036 0.060 -0.264 -0.180 -0.168H-29 366.053 0.012 -0.012 -0.396 -0.252 -0.228F-30 366.055 0.084 0.096 -0.360 -0.096 -0.120H-30 366.074 0.012 -0.012 -0.456 -0.264 -0.240K-I 366.062 -0.168 0.000 -0.144 -0.216 0.084M-1 366.065 -0.120 -0.036 -0.132 -0.180 0.048
G45
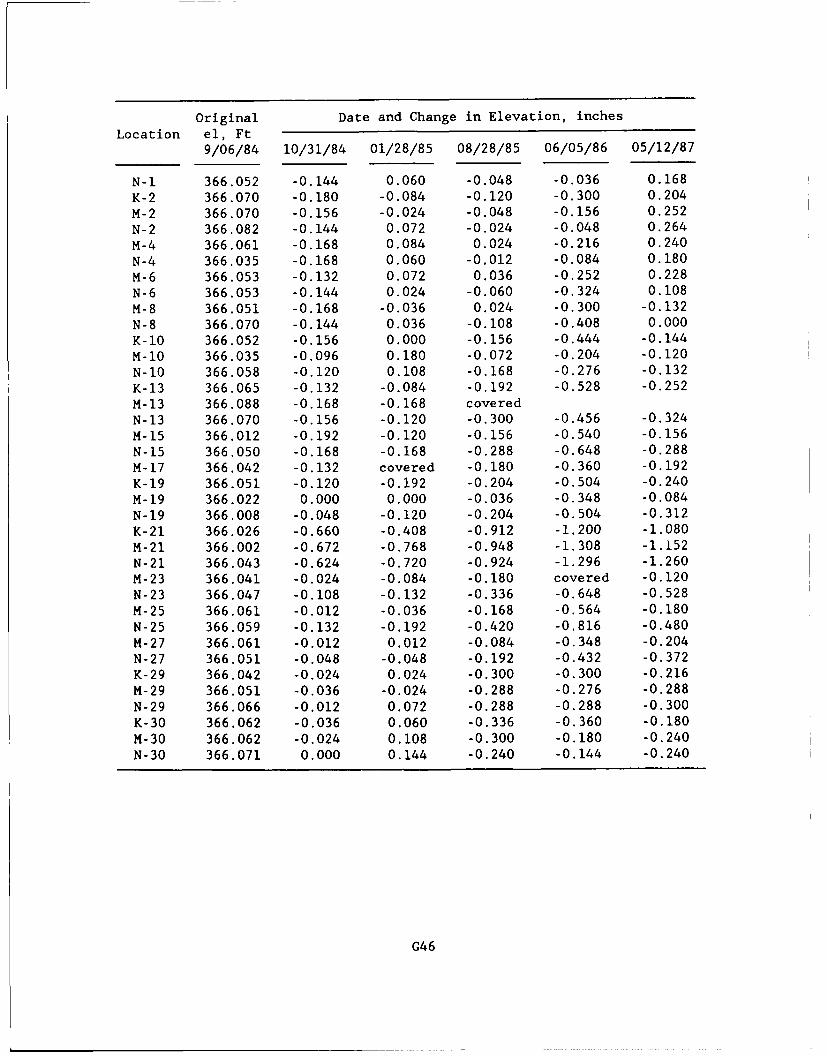
Original Date and Change in Elevation, inchesLocation el, Ft
9/06/84 10/31/84 01/28/85 08/28/85 06/05/86 05/12/87
N-I 366.052 -0.144 0.060 -0.048 -0.036 0.168
K-2 366.070 -0.180 -0.084 -0.120 -0.300 0.204
M-2 366.070 -0.156 -0.024 -0.048 -0.156 0.252
N-2 366.082 -0.144 0.072 -0.024 -0.048 0.264
M-4 366.061 -0.168 0.084 0.024 -0.216 0.240
N-4 366.035 -0.168 0.060 -0.012 -0.084 0.180
M-6 366.053 -0.132 0.072 0.036 -0.252 0.228
N-6 366.053 -0.144 0.024 -0.060 -0.324 0.108
M-8 366.051 -0.168 -0.036 0.024 -0.300 -0.132
N-8 366.070 -0.144 0.036 -0.108 -0.408 0.000
K-10 366.052 -0.156 0.000 -0.156 -0.444 -0.144
M-10 366.035 -0.096 0.180 -0.072 -0.204 -0.120
N-10 366.058 -0.120 0.108 -0.168 -0.276 -0.132K-13 366.065 -0.132 -0.084 -0.192 -0.528 -0.252M-13 366.088 -0.168 -0.168 coveredN-13 366.070 -0.156 -0.120 -0.300 -0.456 -0.324M-15 366.012 -0.192 -0.120 -0.156 -0.540 -0.156N-15 366.050 -0.168 -0.168 -0.288 -0.648 -0.288M-17 366.042 -0.132 covered -0.180 -0.360 -0.192K-19 366.051 -0.120 -0.192 -0.204 -0.504 -0.240
M-19 366.022 0.000 0.000 -0.036 -0.348 -0.084N-19 366.008 -0.048 -0.120 -0.204 -0.504 -0.312K-21 366.026 -0.660 -0.408 -0.912 -1.200 -1.080M-21 366.002 -0.672 -0,768 -0.948 -1.308 -1.152N-21 366.043 -0.624 -0.720 -0.924 -1.296 -1.260M-23 366.041 -0.024 -0.084 -0.180 covered -0.120N-23 366.047 -0.108 -0.132 -0.336 -0.648 -0.528M-25 366.061 -0.012 -0.036 -0.168 -0.564 -0.180N-25 366.059 -0.132 -0.192 -0.420 -0.816 -0.480M-27 366.061 -0.012 0.012 -0.084 -0.348 -0.204N-27 366.051 -0.048 -0.048 -0.192 -0.432 -0.372K-29 366.042 -0.024 0.024 -0.300 -0.300 -0.216M-29 366.051 -0.036 -0.024 -0.288 -0.276 -0.288
N-29 366.066 -0.012 0.072 -0.288 -0.288 -0.300K-30 366.062 -0.036 0.060 -0.336 -0.360 -0.180
M-30 366.062 -0.024 0.108 -0.300 -0.180 -0.240
N-30 366.071 0.000 0.144 -0.240 -0.144 -0.240
G46
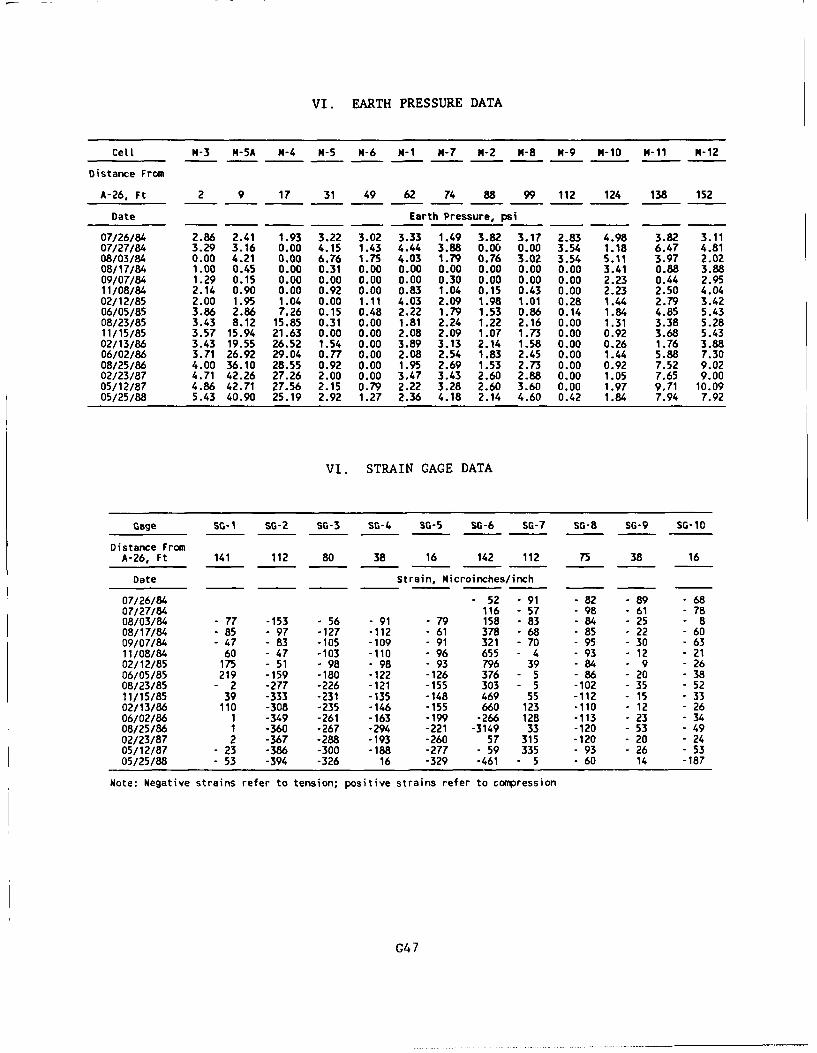
VI. EARTH PRESSURE DATA
Celt m-3 M-5A M-4 m-5 M-6 M-1 M-7 m-2 M-8 M-9 M-10 M-11 M-12
Distance From
A-26, Ft 2 9 17 31 49 62 74 88 99 112 124 138 152
Date Earth Pressure, psi
07/26/84 2.86 2.41 1.93 3.22 3.02 3.33 1.49 3.82 3.17 2.83 4.98 3.82 3.1107/27/84 3.29 3.16 0.00 4.15 1.43 4.44 3.88 0.00 0.00 3.54 1.18 6.47 4.8108/03/84 0.00 4.21 0.00 6.76 1.75 4.03 1.79 0.76 3.02 3.54 5.11 3.97 2.0208/17/84 1.00 0.45 0.00 0.31 0.00 0.00 0.00 0.00 0.00 0.00 3.41 0.88 3.8809/07/84 1.29 0.15 0.00 0.00 0.00 0.00 0.30 0.00 0.00 0.00 2.23 0.44 2.9511/08/84 2.14 0.90 0.00 0.92 0.00 0.83 1.04 0.15 0.43 0.00 2.23 2.50 4.0402/12/85 2.00 1.95 1.04 0.00 1.11 4.03 2.09 1.98 1.01 0.28 1.44 2.79 3.4206/05/85 3.86 2.86 7.26 0.15 0.48 2.22 1.79 1.53 0.86 0.14 1.84 4.85 5.4308/23/85 3.43 8.12 15.85 0.31 0.00 1.81 2.24 1.22 2.16 0.00 1.31 3.38 5.2811/15/85 3.57 15.94 21.63 0.00 0.00 2.08 2.09 1.07 1.73 0.00 0.92 3.68 5.4302/13/86 3.43 19.55 26.52 1.54 0.00 3.89 3.13 2.14 1.58 0.00 0.26 1.76 3.8806/02/86 3.71 26.92 29.04 0.77 0.00 2.08 2.54 1.83 2.45 0.00 1.44 5.88 7.3008/25/86 4.00 36.10 28.55 0.92 0.00 1.95 2.69 1.53 2.73 0.00 0.92 7.52 9.0202/23/87 4.71 42.26 27.26 2.00 0.00 3.47 3.43 2.60 2.88 0.00 1.05 7.65 9.0005/12/87 4.86 42.71 27.56 2.15 0.79 2.22 3.28 2.60 3.60 0.00 1.97 9.71 10.0905/25/88 5.43 40.90 25.19 2.92 1.27 2.36 4.18 2.14 4.60 0.42 1.84 7.94 7.92
VI. STRAIN GAGE DATA
Gage SG-1 SG-2 SG-3 SG-4 SG-5 SG-6 SG-7 SG-8 SG-9 SG-1O
Distance From
A-26, Ft 141 112 80 38 16 142 112 75 38 16
Date Strain, Microinches/inch
07/26/84 - 52 - 91 - 82 -89 -6807/27/84 116 - 57 - 98 -61 -7808/03/84 - 77 -153 - 56 - 91 - 79 158 - 83 - 84 -25 808/17/84 - 85 - 97 -127 -112 - 61 378 - 68 - 85 -22 -6009/07/84 - 47 - 83 -105 -109 - 91 321 - 70 - 95 - 30 - 6311/08/84 60 - 47 -103 -110 - 96 655 - 4 - 93 - 12 - 2102/12/85 175 - 51 - 98 - 98 - 93 796 39 - 84 9 -2606/05/85 219 -159 -180 -122 -126 376 - 5 - 86 -20 -3808/23/85 - 2 -277 -226 -121 -155 303 - 5 -102 - 35 - 5211/15/85 39 -333 -231 -135 -148 469 55 -112 - 15 3302/13/86 110 -308 -235 -146 -155 660 123 -110 - 12 - 2606/02/86 1 -349 -261 -163 -199 -266 128 -113 - 23 - 3408/25/86 1 -360 -267 -294 -221 -3149 33 -120 - 53 - 4902/23/87 2 -367 -288 -193 -260 57 315 -120 - 20 - 2405/12/87 - 23 -386 -300 -188 -277 - 59 335 - 93 - 26 - 5305/25/88 - 53 -394 -326 16 -329 -461 - 5 - 60 14 -187
Note: Negative strains refer to tension; positive strains refer to compression
G47