design and commissioning tests for waterjet self ... and commissioning tests for waterjet...
TRANSCRIPT

Third International Symposium on Marine Propulsors smp’13, Launceston, Tasmania, Australia, May 2013
Design and Commissioning Tests for Waterjet Self-Propulsion Testing
of a Medium-Speed Catamaran Ferry using a Single Demihull
Konrad Zürcher1, Neil Bose1, Jonathan R. Binns1, Giles Thomas1 and Gary Davidson2
1 Australian Maritime College, National Centre for Maritime Engineering & Hydrodynamics,
University of Tasmania, Launceston, Tasmania, Australia 2 INCAT Tasmania and Revolution Design Pty Ltd, Moonah, Tasmania, Australia
ABSTRACT A series of self-propulsion tests of a catamaran design at medium-speeds is proposed to study the influence of the hydrodynamics at medium-speeds on the waterjet propulsors. These model tests will be carried out using a load-varied self-propulsion testing technique in calm water. Due to size requirements of the model, a single demihull is to be utilised in close proximity to the side wall of the towing tank which acts as the plane of symmetry, reflecting waves generated by the demihull and therefore providing the acceptable blockage effects and wave interference for the second demihull. Keywords Waterjet, Self-Propulsion, Medium-Speed, Catamaran, Model Testing
NOMENCLATURE
Cr Residual resistant coefficient Frl Froude length number Frh Froude depth number Mass flow rate ps Total pressure at station s TG Gross thrust us Jet velocity at station s
1 INTRODUCTION A new series of highly efficient medium-speed wave piercing catamarans are under development to reduce the environmental impact of fast sea transportation. They will operate at speeds where mutual interference between waves and increased resistance produces the characteristic hump in the ship’s resistance curve. Waterjets are used for high-speed multihulls due to their high efficiency when operating at speeds beyond hump speed. However, they are generally not used for medium-speed applications due to the decrease in efficiency at lower speed. Therefore the challenge is to assess the effects of the change in operating conditions on the waterjet propulsion system. The project sponsor, Incat Tasmania, plans to expand its fleet to medium speed (25-27 knots) catamaran ferries in a
series of lengths yet to be defined. Currently the main pump types used in high-speed waterjet driven catamarans are either of a mixed-flow or axial flow type. A baseline test, using a model of the 98 m Incat catamaran ferry HSV-2 Swift (see Figure 1), will be conducted to establish a methodology for waterjet self-propulsion testing in the Australian Maritime College (AMC) towing tank, and to create a method for data reduction and extrapolation. To verify the results, a set of sea trials data is available for the baseline catamaran ferry.
In the following sections, a brief review of this approach is presented as well as the objectives, progress to date, proposed testing procedure and data extrapolation, model design, commissioning and components testing results. The waterjet reference stations pointed out in this article refer to the ITTC momentum flux reference stations as shown in Figure 2.
Figure 1 98 m Incat wave piercing catamaran HSV-2 Swift.
Figure 2 ITTC definition of momentum flux measurement stations (Terwisga 2002).
97

2 OBJECTIVES The main focus of the research is performance prediction based on waterjet self-propulsion tests and the specific ITTC guidelines considered are procedures 7.5-02-05-03.1 (ITTC 2011a), 7.5-02-05-03.2 (ITTC 2011b), and 7.5-02-05-03.3 (ITTC 2011c) which relate to waterjet system performance prediction and propulsion testing. The research questions to be answered are as follows: 1. What is the most accurate extrapolation method for a
set of self-propulsion test data obtained with a waterjet propelled ship model?
2. What methods can be used for a model waterjet self-propulsion performance prediction and what parameters need to be supplied from the model scale testing to allow for full-scale extrapolation?
3. What are the power requirements for a future waterjet propelled Incat hull form of a length between 130 and 150 m, established using self-propulsion testing with a single catamaran hull?
Additional objectives are as follows: 1. to determine suitable speeds for waterjets and the
point of thrust breakdown (drop of efficiency at low speeds); and
2. to assess at what speed would propeller propulsion be more suitable. 3 PROJECT PROGRESS TO DATE
So far the following important project milestones have been completed: 1. Model design and material selection. 2. Model construction. 3. Waterjet propulsion assembly and alignment. 4. Propulsion system testing. 5. Evaluation of pitot-static tubes and differential
pressure transducers for velocity measurements. 6. Testing of inductive proximity sensors for RPM
logging. Data of the self-propulsion testing, extrapolation to full-scale and the comparison to available full-scale sea trials powering data is expected to be available by May 2013.
4 TESTING PROCEDURE The experimental testing and data analysis approach will consist of two parts: 1. Baseline test and validation of waterjet self-
propulsion testing procedures. 2. Application of this approach to a practical problem;
in this case a self-propulsion test on a new design for a medium-speed catamaran ferry.
Experimental testing will include waterjet self-propulsion and resistance tests (the resistance tests are for CFD validation purposes only). The waterjet theory used will be based on the momentum flux method as adopted by ITTC and the sensor layout will be based on waterjet
system performance as specified by ITTC (2011b) and will include pressure and velocity measurements at the momentum flux method reference stations. The data measured during the tests will be the towing force, trim, static and total pressures, velocities in the intake/nozzle (for the waterjet propulsion), and visual inspections of the wave behaviour around the bow and in the wake. Parameters to be calculated and/or recorded based on measured data will be model velocity, model trim and heave, model towing force, pump flow rate, pump head rise, pump fluid-power, pitot measurements, flow-fields, propulsion thrust and visual recordings. The sensors to be used for the experiments will include pitot-static traversing probes, differential pressure transducers (DPT), dynamometer and accelerometers. This will be further detailed in the experimentation test plan for the baseline waterjet self-propulsion test. The results of the model baseline waterjet self-propulsion test will be validated using a set of data consisting of full-scale powering data for the 98 m Incat wave piercing catamaran (HSV-2) that was collected during shallow and deep water sea trials in the speed range of 8-40 knots and has been summarised in a report by Griggs (2005). The extrapolated waterjet data of the waterjet self-propulsion test can also be compared to pump curve data for the Lips Jet waterjet unit LJ120E used in the baseline vessel. The waterjet unit benchmark data supplied by Wärtsilä (2012) contains full-scale test data for flow and head coefficients, pump efficiencies, volume flow rates and pump heads for a single RPM. But it can be scaled to any other RPM using dimensional analysis and will be used for comparison with the extrapolated waterjet data collected in the model self-propulsion test. One proposed data comparison method is to use model thrust, extrapolated to full-scale and compared against the waterjet benchmark test results supplied by the manufacturer. A breakdown of this method consists of the following steps: 1. Measure thrust, torque and RPM of waterjet on
model scale 2. Plot thrust versus tow force 3. Calculate thrust deduction (t) 4. Calculate full-scale thrust 5. Use thrust to compute Q, n and power and compare
against waterjet benchmark data
5 MODEL SIZE SELECTION The investigated range of possible model sizes was set as between 3 and 6 m as sizes below this range would result in models too small to include a practical model waterjet propulsion system. Due to the size of the towing tank and the requirement to use a model as big as possible it was decided that the bare hull resistance tests will also be conducted with a single demihull only, using the towing tank wall (barrier) as the symmetry line.
98
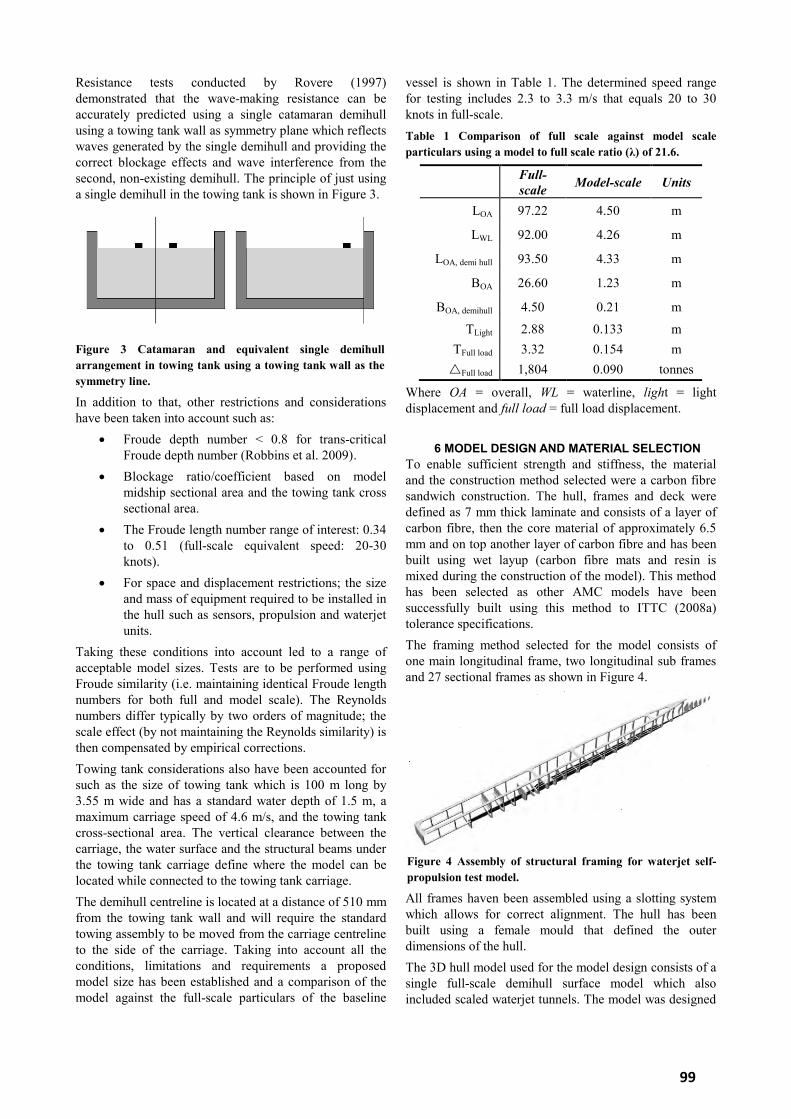
Resistance tests conducted by Rovere (1997) demonstrated that the wave-making resistance can be accurately predicted using a single catamaran demihull using a towing tank wall as symmetry plane which reflects waves generated by the single demihull and providing the correct blockage effects and wave interference from the second, non-existing demihull. The principle of just using a single demihull in the towing tank is shown in Figure 3.
In addition to that, other restrictions and considerations have been taken into account such as:
Froude depth number < 0.8 for trans-critical Froude depth number (Robbins et al. 2009).
Blockage ratio/coefficient based on model midship sectional area and the towing tank cross sectional area.
The Froude length number range of interest: 0.34 to 0.51 (full-scale equivalent speed: 20-30 knots).
For space and displacement restrictions; the size and mass of equipment required to be installed in the hull such as sensors, propulsion and waterjet units.
Taking these conditions into account led to a range of acceptable model sizes. Tests are to be performed using Froude similarity (i.e. maintaining identical Froude length numbers for both full and model scale). The Reynolds numbers differ typically by two orders of magnitude; the scale effect (by not maintaining the Reynolds similarity) is then compensated by empirical corrections. Towing tank considerations also have been accounted for such as the size of towing tank which is 100 m long by 3.55 m wide and has a standard water depth of 1.5 m, a maximum carriage speed of 4.6 m/s, and the towing tank cross-sectional area. The vertical clearance between the carriage, the water surface and the structural beams under the towing tank carriage define where the model can be located while connected to the towing tank carriage. The demihull centreline is located at a distance of 510 mm from the towing tank wall and will require the standard towing assembly to be moved from the carriage centreline to the side of the carriage. Taking into account all the conditions, limitations and requirements a proposed model size has been established and a comparison of the model against the full-scale particulars of the baseline
vessel is shown in Table 1. The determined speed range for testing includes 2.3 to 3.3 m/s that equals 20 to 30 knots in full-scale. Table 1 Comparison of full scale against model scale particulars using a model to full scale ratio (λ) of 21.6.
Full-scale Model-scale Units
LOA 97.22 4.50 m
LWL 92.00 4.26 m
LOA, demi hull 93.50 4.33 m
BOA 26.60 1.23 m
BOA, demihull 4.50 0.21 m
TLight 2.88 0.133 m TFull load 3.32 0.154 m Full load 1,804 0.090 tonnes
Where OA = overall, WL = waterline, light = light displacement and full load = full load displacement.
6 MODEL DESIGN AND MATERIAL SELECTION To enable sufficient strength and stiffness, the material and the construction method selected were a carbon fibre sandwich construction. The hull, frames and deck were defined as 7 mm thick laminate and consists of a layer of carbon fibre, then the core material of approximately 6.5 mm and on top another layer of carbon fibre and has been built using wet layup (carbon fibre mats and resin is mixed during the construction of the model). This method has been selected as other AMC models have been successfully built using this method to ITTC (2008a) tolerance specifications. The framing method selected for the model consists of one main longitudinal frame, two longitudinal sub frames and 27 sectional frames as shown in Figure 4.
All frames haven been assembled using a slotting system which allows for correct alignment. The hull has been built using a female mould that defined the outer dimensions of the hull. The 3D hull model used for the model design consists of a single full-scale demihull surface model which also included scaled waterjet tunnels. The model was designed
Figure 3 Catamaran and equivalent single demihull arrangement in towing tank using a towing tank wall as the symmetry line.
Figure 4 Assembly of structural framing for waterjet self-propulsion test model.
99

with a void in the stern where an additional component will be attached containing the waterjet tunnels which will be manufactured using selective laser sintering (SLS) rapid prototyping and the parts created using this process are shown in Figure 5.
Based on procedures outlined by Rispin (2007) and used in the towing tanks of the Naval Surface Warfare Center Carderock Division (NSWCCD), where 6 m waterjet propelled models were built by inserting rapid prototyped models of the waterjet tunnels into prepared cuts into the hull, it has been established that this form of assembly is not feasible for a small model due to space and accessibility issues. The solution to this restriction was to replace part of the stern of the carbon fibre catamaran demihull with a rapid prototyped item that includes the hull shape and the waterjet tunnels. The rapid prototype part and combined with the model waterjet drive chain is shown in Figure 6.
During the assembly of the model and the propulsion system the rapid prototype parts haven been assembled and attached to the model; the resulting completed model is shown in Figure 7.
The experience gained regarding rapid prototyping during the construction process is very helpful as it showed the selected selective laser sintering (SLS) process is unsuitable for the currently available 3D models for the stern part of the model as a redesign would be required to correct for heat related shrinkages and deformations in the cooling phase of the rapid prototyping. These shrinkages and other heat related issues led to slightly twisted parts as well as inaccurate dimensions that had to be corrected in the workshop when fitting all the rapid prototyping parts together. As a comparison two waterjet parts (impellers) have been manufactured using ABS (Acrylonitrile / Butadiene / Styrene) rapid prototyping and these resulted in more accurate and stronger parts so that for future parts ABS should be used instead of selective laser sintering.
7 RESIDUAL RESISTANCE ESTIMATE A part of the testing programme is a resistance test and as there was no resistance data available for the baseline model of the 98 m Incat wave piercing catamaran (HSV-2), a residual resistance investigation has been carried out using available resistance data from a 90 and 112 m Incat model. The available resistance data consists of data of three displacements for the 90 m and five displacements for the 112 m Incat catamarans. The main comparison parameter used for the different displacements of the 90, 98 and 112 m models was the length-displacement ratio as shown in Equation 1 by Lewis (1988).
(1)
The established resistance data for the baseline model is to be used for data analysis and the comparison of results of the baseline resistance test. The estimated model resistance date has also been put to use in the initial powering estimate for the baseline model and for sourcing the electric motors. The calculated resistance estimate for the 98 m baseline model is shown in Table 2 and includes data for a Froude length number range of 0.35 to 0.49 as there was no resistance data available outside that range for the 90 m model.
Figure 5 Model waterjet unit parts created using selective laser sintering (SLS) rapid prototyping.
Figure 6 Waterjet drive chain for baseline self-propulsion test. The main components are the electric motors, shaft connectors, flexible couplings, dynamometers, shafts, impellers, stators, nozzles and adjustable trim tab. Also shown is the location of the rapid prototyped part in relation to the model hull.
Figure 7 Assembled rapid prototype stern section attached to carbon fibre hull. The largest rapid prototyping part had to be split into two parts to fit into the rapid prototyping machine and was then assembled using a prepared slotting connection between the parts and glued together using Loctite.
100

Table 2 Estimated residual resistance results for model of 98 m Incat catamaran ferry HSV-2 Swift considering a Froude length number range of 0.35 to 0.49.
Frl 0.35 0.39 0.42 0.46 0.49 0.49
Cr 2.80 2.92 3.19 3.18 2.94 2.66
8 TOTAL ESTIMATED PRESSURES AT NOZZLE For the estimated pressure at the nozzle outlet of the waterjet an investigation has been carried out using manufacturer supplied full-scale benchmark data for the waterjet unit used for baseline testing. The supplied waterjet benchmark data consists of one full-scale dataset for a single shaft speed of 568 RPM and includes results for flow rates, pump heads, flow and head coefficients for a propulsive efficiency range of 0.65 to 0.90. This data then has been scaled to model scale assuming geometric and dynamic similitudes and a shaft speed range of 500-4,000 RPM. The model waterjet used for the baseline testing is a geometrically scaled model of the Lips Jet LJ120 waterjet unit produced by Wärtsilä Corporation used for in the 98 m Incat catamaran ferry HSV-2 Swift. Based on this data the mass f o rate and the pressure at the waterjet nozzle (p6) has been calculated and the results are shown in Figure 8.
Also established was the jet velocity (u6) which has been determined as 3.3 m/s at 1,000 RPM up to 13.1 m/s at 4,000 RPM. Gross thrust (TG), using Allison (1993), has been calculated as ranging from 9.3 N at 1,000 RPM up to 149.4 N at 4,000 RPM where the gross thrust is defined as the force experienced by the propulsor due to the momentum flux from the nozzle. Available full scale comparison data consists of a thrust curve supplied by the manufacturer of the waterjet unit which shows thrust in terms of ship speed and a maximum continuous rating (MCR) from 15% to 100%.
9 COMPONENT TESTING RESULTS The component testing includes separate tests for all the sensors to be used as well as the waterjet propulsion itself. The components tested so far include the waterjet system, pitot-static tubes and differential pressure transducers for velocity measurements and the assembly and alignment of the proximity sensors used for the logging of the shaft RPM.
9.1 Pitot-static tubes for velocity measurements Velocity measurements in the waterjet tunnel and under the vessels hull (for boundary layer velocities) are measured using PCA-8-KL pitot-static tubes supplied by United Sensor Corp. (USA). The outlets of the pitot-static tubes were connected by tubes to PX142-005D5V differential pressures transducers with a 5 VDC output, supplied by Omega Engineering Inc. The pitot-static tubes have been connected to an air foil shaped appendage, to avoid turbulence behind the pitot static tube, and mounted onto the forward carriage stock in the AMC towing tank. The calibration tests haven been carried out in water depths ranging up to 200 mm and speeds to 4.5 m/s and resulted in adjustments of the tubing connections and the arrangement of the differential pressure transducers. The initial calibration tests have been carried out using the arrangement shown in Figure 9.
9.2 Waterjet propulsion After the assembly of the waterjet unit, propulsion parts and adjusting the shaft alignment of the system the waterjet propulsion has been tested in the towing tank using a shaft speed range of 500 to 1,500 RPM. This has been done to check the propulsion system as well as to check the watertight integrity of the model. The test resulted in some necessary adjustments regarding the shaft and the dynamometer alignments.
Figure 8 Shaft speed (RPM) versus flow rate and outlet pressure estimation for baseline model waterjet unit.
Figure 9 United Sensor Corp. PCA-8-KL pitot-static tube connected to forward carriage post in the AMC towing tank.
101

9.3 Inductive proximity sensors for RPM data The revolutions of the electric motors are recorded using two analog inductive proximity sensors type AM9-10-1H supplied by AutomationDirect. The sensors are mounted vertically above the shaft connector as shown in Figure 10 with a distance of 6 mm to a steel screw added to the shaft connector. The output selected for the sensors is 0-10 VDC as this is the preferred output of the AMC towing tank data acquisition (DAQ) system.
Testing has been carried out in a speed range up to 1,500 RPM to develop analysis tools to be used in the waterjet self-propulsion testing. Tests have been conducted in 200 RPM increments for the port and starboard propulsion shaft and each test has been repeated three times to allow for a detailed uncertainty and statistical analysis. The output of the inductive proximity sensors has been analysed using three different filtering methods (Gaussian filtering, Median filtering and exponential smoothing) to allow for identification of peak values and smoothing of curves. The time difference between peak values has then been used to calculate the resulting RPM. The most accurate results were achieved using the Gaussian filtering and Median filtering which resulted in the lowest errors in the analysis of the collected test data. The resulting RPM values where within 2% of the set motor RPM and the repeatability within 1.5% and decreasing with higher RPM. Results also showed that the port propulsion was not as perfectly aligned as the starboard propulsion and this issue has been resolved.
10 FLOW RATE MEASUREMENTS ITTC Propulsion Committee recommends several methods to measure flow rates in waterjet systems and they are described in proceedings of the 23rd, 24th, 25th and 26th ITTC and are the following:
flow rate calibration test, and to relate the flow rate to a suitable measurement signal in the waterjet;
integration of the measured velocity field within the duct;
determination of flow rate from the bollard thrust;
Differential Pressure Transducers (DPTs) through nozzle using an averaging static pitot tube; and
Laser Doppler velocimetry (LDV) measurement of velocities in cross sectional plane and integration of velocities.
It was determined that the lowest overall uncertainty could be achieved using the measured bollard thrust to calculate the flow rate along with a multi-port velocity reference probe in the jet to account for changes with forward speed as shown in ITTC (2008b). Terwisga (1996) states several additional methods for flow rate measurement which are:
Measure discharged flow rate over a certain time interval, and the weight of water over this time is measured.
Measurement of jet velocity distribution through a pitot rake.
Direct measurement of the discharged momentum flux from nozzle by measurement of a reaction force.
Determination of average nozzle velocity through venturi pressure tabs in the nozzle.
Measurement of flow rate through paddle wheels or turbine flow rate transducers in the nozzle.
Flow measurement methods further have to be classified as intrusive (e.g. pitot rake, paddle wheel, turbine flow rate transducer, etc.) or non-intrusive (e.g. LDV). Non-intrusive measurements do not affect the jet flow but intrusive measurements do, as sensors have to be placed directly in the flow. Considering all available flow rate measurement methods, available test facilities and equipment it has been decided to use the measurement of discharged flow over a certain time as the preferred flow measurement method. This is due to the expected low overall uncertainty as the flow rate is measured directly. The flow rate established in this benchmark test will be related to the waterjet self-propulsion tests by using as reference measurement the pressure at the nozzle outlet (station 6) which is obtained using kiel probes to measure total pressure in the flow direction.
11 CONCLUSIONS Results for the self-propulsion testing, extrapolation to full-scale and the comparison to available full-scale sea trials powering data are not ready yet but are expected to be available by May 2013. In the meantime a few initial testing arrangements have been carried out and for those results are available. This initial testing has been carried out to establish base values which are to be used for
Figure 10 Inductive proximity sensors mounted above the shaft connectors. Also shown are the electric motors and the flexible couplings.
102

comparison and analysis purposes for the upcoming testing series. A lot of knowledge has been gained regarding rapid prototyping using SLS during the model design and manufacturing process. This includes the conclusion that the current models for the rapid prototyped stern part are either too large and would have to be taken apart into smaller pieces, or more structural members would have to be added to prevent the heat related shrinkages and deformations experienced. Another option would also be to recreate the parts using ABS, which would create more accurate parts and would simplify the assembly process as less workshop time would be required to adjust the fitting parts. Further work is required regarding sensors and the single demihull setup in the AMC towing tank and, in particular:
measure the accuracy of AMC towing tank wall used as symmetry line for the single demihull testing;
experimental work to allow the single demihull to be mounted always on the same spot on the carriage also when taken off to allow for other testing to take place.
12 ACKNOWLEDGEMENTS This research has been conducted as part of a collaborative research project between Incat Tasmania Pty Ltd, Revolution Design Pty Ltd, Wärtsilä Corporation, MARIN, and the Australian Maritime College at the University of Tasmania with support from the Australian Research Council's Linkage Project funding scheme, Project ID: LP110100080.
REFERENCES
Allison, J. (1993). ‘Marine Waterjet Propu sion’. SNAME Transactions, Vol. 101, pp. 275-335.
Bertram, V. (2000). Practical Ship Hydrodynamics. Butterworth-Heinemann, Boston, pp. 68-69.
Griggs, D. (2005). ‘HSV-2 Swift Combined Standardization and Po ering Tria s Resu ts’. Combined Standardization and Powering Trials Results, Naval Surface Warfare Center Carderock Division, West Bethesda, Maryland, pp. 1-54.
Incat, (2011). ‘Hu 061–98m HSV-2 S ift’. Datasheet, Incat, Hobart, Australia, pp. 1-4.
ITTC, (2011a). ITTC – Recommended Procedures and Guidelines, Propulsive Performance Prediction. ITTC Report 7.5-02-05-03.1.
ITTC, (2011b). ITTC – Recommended Procedures and Guidelines, Waterjet System Performance. ITTC Report 7.5-02-05-03.2.
ITTC, (2011c). ITTC – Recommended Procedures and Guidelines, Uncertainty Analysis - Example for Waterjet Propulsion Test. ITTC Report 7.5-02-05-03.3.
ITTC, (2008a). ITTC – Recommended Procedures and Guidelines, Ship Models. ITTC Report 7.5-01-01-01.
ITTC, (2008b). Final Report and Recommendations to the 25th ITTC. Proceedings of the ITTC - The Propulsion Committee, 2008, Fukuoka, Japan.
Lewis, E. V. (1988), Principles of Naval Architecture: Resistance, Propulsion and Vibration, 2nd ed., Society of Naval Architects and Marine Engineers, Jersey City, N.J, pp. 77–78.
Rispin, P. (2007). ‘Fina Report: Se f-Propulsion Model Tests for Application to a High-Speed Sealift Ship Utilizing Advanced Axial-F o Waterjets’. CCDoTT-Center for the Commercial Deployment of Transportation Technologies, Severna Park, MD, USA, pp. 1-40.
Robbins, A., Thomas, G., Renilson, M., Macfarlane, G. & Dand, I. (2009). ‘Vessel Trans-Critical Wave Wake, Divergent Wave Angle and Decay’. International Journal of Maritime Engineering, Vol. 151, Part A2, pp. 1-14.
Rovere, J. (1997). ‘Catamaran resistance from tests on a single demihull’. FAST’97 - Fourth International Conference on Fast Sea Transportation, Vol. 2, ADI Limited, Australia, pp. 737–741.
Terwisga, T. J. C. v. (2002). ‘Report of the specia ist committee on va idation of aterjet test procedures’. In 23rd ITTC, Venice, Italy.
Terwisga, T. J. C. v. (1996), Waterjet-Hull Interaction, PhD thesis, Delft University of Technology, Delft, Netherlands.
Wärtsilä, (2012). ‘F o rate and pump head benchmark data for LJ120E aterjet unit’, Wärtsilä.
103