desalination...2014 prepared by desalination experts group, originating from the water resources...
TRANSCRIPT
1
Prepared by Desalination Experts Group,
Originating from the Water Resources CommitteeSECOND EDITION
2013
The Cooperation Council for the Arab States of the Gulf (GCC)General Secretariat
D E S A L I N A T I O NIn the GCC
The History, the Present & the Future
2014

2014
Prepared by Desalination Experts Group,
Originating from the Water Resources Committee
United Arab Emirates Abulllah Mohamed Al-Mutawa
Kingdom of Bahrain Waleed Mohamed Al Murbati, Nasser Ahmed Al Ruwaili
Kingdom of Saudi Arabia PhD. Ahmed Sulaiman Al Oraifi, Abdulrahman Al Oraifi
Sultanate of Oman Abullah Al Arafati
State of Qatar Adulrahman Nasrullah
State of Kuwait Mohamed Rashid Al Bahow, Sa’ad Mohsin Al Anzi
General Secretariat of the Cooperation Council for the Arab States of the Gulf (GCC)
PhD. Mohammed Rashidi, Saud Zaid Al Moosa,

D E S A L I N A T I O NIn the GCC
The History, the Present & the Future
SECOND EDITION
2013
The Cooperation Council for the Arab States of the Gulf (GCC)General Secretariat
2014

4

Their Majesties and Highnesses, the GCC leaders, pay great attention to water issues due to water rareness in the GCC countries and the resulting negative implications in developing the sectors related thereto. This care lead to the establishment of a ministerial committee consisting of the ministers concerned with water in the GCC counties. The main objective of the committee is to develop this vital sector as a part of the Gulf mutual work. The GCC countries have taken serious steps in terms of water cooperation, through adopting a number of water policies and programs, and seeking closely to strengthen the methods, ways and steps that lead to achieving water security, which is the essential foundation within the framework of comprehensive development achievement of the GCC countries. Due to the accelerating development in the different aspects of the social, construction, industrial and agricultural infrastructure, along with the rapid increase in the demand for water, the GCC countries have made tremendous and continuous efforts to increase their water resources and introducing new resources in this regard. Due to the importance of the information and details pertaining to and specialized in the water field, the Water Resources Committee, directed by their Excellencies the ministers concerned with the water sector in the GCC countries, have formed a working group for preparing this book to be an important reference for the decision-makers, the researchers and those concerned with desalination, and to include comprehensive information on the desalination sector in the GCC countries, the details of which were submitted by the official authorities in the member countries. The GCC General Secretariat wishes from this book to be an added value for the Arab libraries, and to be considered as reference guiding the concerned authorities in the GCC countries and an assistant for the researchers and interested in desalination in the GCC countries.
5Desa l i na t ion i n the GCC . The H i s tor y, the Present & the Fu ture
PREFACE
Sincerely,
Abdullatif bin Rashid Al-ZayaniGCC Secretary General

Sincerely,
Economic AffairsElectricity and Water Department
7Desa l i na t ion i n the GCC . The H i s tor y, the Present & the Fu ture
INTRODUCITON
The GCC countries have been witnessing an accelerating development over the last three decades in terms of the social, construction, industrial and agriculture aspects, accompanied by remarkable increase in the demand for water. As a result, the GCC countries have made tremendous continues efforts to increase the utilization of their water resources and introducing new resources by building desalination stations, reusing the sewage water, building dams for reserving the surface water and increasing the utilization of underground water resources. Their Majesties and Highnesses, the GCC leaders, pay great attention to the water issue due to water rareness in the GCC countries and the resulting challenges facing the sustainable development. This interest resulted in the establishment of a ministerial committee consisting of the ministers concerned with water in the GCC counties. The committee is concerned with developing this vital sector as a part of the Gulf mutual work. The GCC countries have taken serious steps in the field of water cooperation, through adopting policies and programs, and relentless pursuit to strengthen the methods, ways and steps that ensure achieving water security, which is the essential foundation for achieving the comprehensive development of the GCC countries. This book, which includes comprehensive information on the desalination sector in the GCC countries, is an important part of the efforts made by the GCC and considered as a reference guiding the concerned authorities, researchers and those interested in the water sector in the GCC countries.

CONTENTS
9Desa l i na t ion i n the GCC . The H i s tor y, the Present & the Fu ture
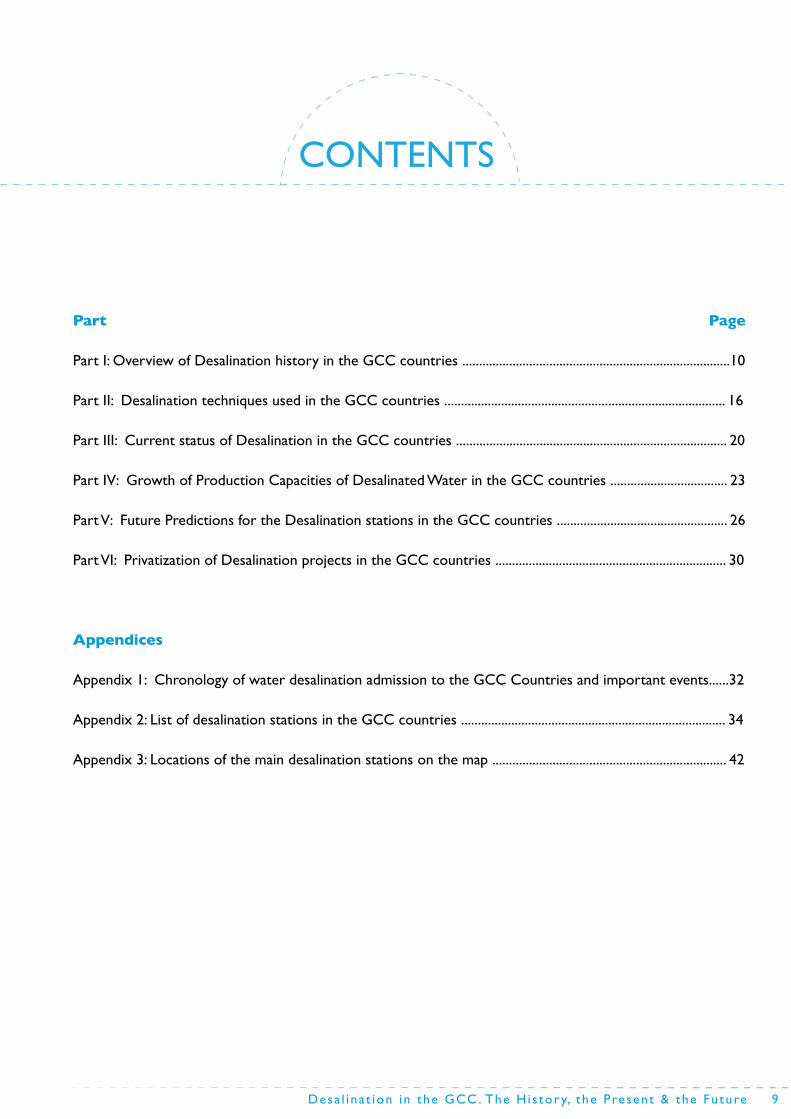
Part Page
Part I: Overview of Desalination history in the GCC countries ................................................................................10
Part II: Desalination techniques used in the GCC countries .................................................................................... 16
Part III: Current status of Desalination in the GCC countries ................................................................................. 20
Part IV: Growth of Production Capacities of Desalinated Water in the GCC countries ................................... 23
Part V: Future Predictions for the Desalination stations in the GCC countries ................................................... 26
Part VI: Privatization of Desalination projects in the GCC countries ..................................................................... 30
Appendices
Appendix 1: Chronology of water desalination admission to the GCC Countries and important events......32
Appendix 2: List of desalination stations in the GCC countries ............................................................................... 34
Appendix 3: Locations of the main desalination stations on the map ...................................................................... 42

10
Part IOverview of desalination history in the GCC Countries
The GCC countries are located in the
south west part of the Asian continent,
which is considered as an arid and semi-
arid area which suffers from scarcity of
fresh water. In this area, the individual
share of renewable water does not
exceed 500 m3 /year. The vast majority
of GCC land is made up of deserts, in
which the surface waters such as rivers
and lakes do not exist. The rainfall is
rare and irregular with an average of
100 mm/year approximately. Most of
it evaporates due to the high rates of
evaporation that could go up to more
than 3500 mm.
Under these difficult circumstances,
the GCC inhabitants’ relied on under-
ground water as the primary source of
drinking water. Therefore, it is observed
that many regions which are having easy
access to underground water, such as
the Kingdom of Bahrain, the Sultanate
of Oman, Eastern and Northern Re-
gions of the Kingdom of Saudi Arabia
(KSA) and Al Ain region of the United
Arab Emirates (UAE) witnessed a re-
markable fast population and agricul-
tural growth. In the State of Qatar, the
population used to pump underground
water from regions rich in water such Al
Mazrouaa, Er Rushaidiyah, Buthailah and
Al Thaibiyah to the city of Doha and the
.surrounding villages
The population in Sultanate of Oman
and UAE, however, used to bring
water from the mountains slopes to
the populated areas through cleaving,
however in the State of Kuwait, the
population used to bring water from
Shatt Al Arab by Dhows, in addition to
the use of underground water.
The rainfall was a limited source of
water in valley regions in UAE, KSA
and the Sultanate of Oman. With the
discovery of Oil in the middle of 20th
century, GCC countries experienced an
economical, industrial and agricultural
development along with population
growth which resulted into an evolution
in the life style, enhancement in the
living standard and easy access to
drinking water due to the construction
of water transmission pipelines and
distribution networks. Increasing
demand on underground water resulted
in depleted levels of underground water
with deteriorated quality.
Early desalination attempts in the region
The process of desalinating salt water
to produce drinking water was not new
to human societies. There are evidences
of earlier human successful attempts in
this field. In the modern era, particularly
in the 18th and 19th centuries, it was
very common to produce drinking
water through desalinating sea water
on board ships using submerged tubes
and Multi effect desalination process.
Since late 19th century, there are more
cases of producing desalinated water
on a limited scale onshore for drinking
purposes in Egypt, Aden, Chili, Florida
and others.
The first desalination use to produce
drinking water in the Arabian Gulf
countries was in 1907 in the city of
Jeddah. A Dutch company installed two
distilleries called by the local people
“Kendassa” which is apparently derived
from the English word “condenser”. In
1928, King Abdulaziz Al Saud ordered
to replace them by two new units also
known as ”Kandassa” and works using
submerged tube process and they had
a total capacity of 135 m3 /day (297001
gallon/day) installed by the Scottish
company Weir Westgarth.
فلج الخطمين بنيابة بركة الموز
Traditional Water Resources
Ein Athari in the seventies of 20th century Kingdom of Bahrain
Falaj Al Khatmayn Procuratorate Berkat Al moz - Sultanate of Oman

11Desa l i na t ion i n the GCC . The H i s tor y, the Present & the Fu ture
Figure 1. Illustration of A-1 unit of submerged tubes in Shuwaikh plant-State of Kuwait.
3rd EFFECT
1st EFFECT
2nd EFFECT
FLASHTAINK
BLOW DOWNPUMP
CONDENSER
DISCHARGE
Dist. Pump
SEA WATER
AIR EJECTOR
DIST. PRODUCT
FEED PUMPDIST. PRODUCTION: 100,000 IGPDSP. HEAT CONS. : 520 Btu/lb
1 The gallon used in this book is the imperial gallon (British) equal to 4.545 liter.
2 Performance ratio of distillate is the ratio of the produced water quantity and the quantity of steam used. (Gain Output Ratio GOR).
In 1953, the states of Qatar and Kuwait built simultaneously
a number of units that work using the submerged tubes
method which was very common at that time. In the state
of Qatar, 5 units were built and their total capacity reached
150040 gallon/day (682 m3/day) while the State of Kuwait
built 10 units with a total capacity of 1 MIGD (4545.5 m3/
day) in Shuwaikh (figure1) followed by building 10 other units
in 1955 which also have a capacity of 1 million gallon/day. The
energy consumption of Shuwaikh Plant units was between
420- 520 British thermal units (Btu/Lb) of distilled water and
its performance ratio2 reached about 2.5-3.1 which is low
compared to current values.
The low productivity and scaling problems lead to frequent
outages for cleaning and descaling as well as high steam
consumption and low performance ratio which resulted
in significant rise of operation and maintenance costs thus
reducing the dependence on this method and limiting its
spread. Nevertheless, all units installed of this type in KSA,
Qatar and Kuwait were phased out.
Shifting toward desalination
GCC countries realized the need for alternative sources
of drinking water at early stage by observing the rapid
growth in demand for drinking water and its desire to
provide prosperous life for its population by establishing
development where drinking water is its main foundation.
Accordingly, they started to think about desalination, which
fortunately coincided with important development in this
industry where the scientific foundation for new desalination
process ‘Flash Evaporation’ technique was established.
Hence, the true era of using desalination to produce drinking
water in the GCC Countries began with the emergence of
Flash Evaporation technique which was first used in the area
in the State of Kuwait. Where in 1957 an American company,
Westinghouse, built Alshuwaikh desalination plant which
consist of two units C1 & C2 with total capacity of 1MIGD
(4545.5 m3/day) and works on the concept of once though
Flash Evaporation process. In 1958, the same company built
two more units D1 & D2 with the same production capacity.
These units were the largest Flash Evaporation units for
water desalination in the world back then. Each evaporation
unit consisted of 4 stages installed one above the other in
addition to brine heater which was installed on top of all

12
Overview of desalination history in the GCC CountriesPart I
Al Kandassa-KSA
Figure 2. Illustration for the first MFS plant - Kuwait
stages which led to minimize the land
occupied by the evaporator (distiller).
Each stage is composed of a box
including evaporation chambers next to
condensation chambers as well as brine
pipelines to transfer it from one stage
to the next, as well as vapor deflection
board to direct vapor from flashing
chamber to the next condensation
chamber.
The state of Qatar built later, in 1959,
two units at Ras Abu Aboud, based on
the same techniques but with different
design, by using Long Tube, which had a
capacity of 299860 gallon/day (1363 m3/
day).
GCC is proud of being the first
to test and implement one of the
most important processes for water
desalination globally which is Multi
Stage Flash Evaporation (MSF)1. That
was in Kuwait in the year 1960 where
two units were built with a capacity of 1
MIGD (4545.5 m3/day) by The Scottish
company Weir Westgarth according to
the design innovated by the Scottish
Professor Robert Silver as shown in
figure2.
Soon after, the State of Qatar built its
first Multistage Flash evaporation plant,
in 1962 in Ras Abu Aboud located
east of the capital Doha which had a
production capacity of 1.5 MIGD (6800
m3/day). In 1968, two more units were
built with a production capacity of 1.98
3. It is commonly known that if the number of stages of a distiller is more than the double of its performance ratio, then it is called Multi Stage Flashing Distillation otherwise it is called Flash Distillation.
MIGD (9000 m3/day). Before the end of
sixties in the 20th century, particularly
in 1967, KSA had begun to build two
plants, Al Wajh and Dhaba, on the
western coast using once through MSF
process. Those units were built by the
American company Aquaquim and had
a capacity of 43560 gallon/day (198 m3/
day). Both Plants were commissioned
in 1969, and it should be noted though
that all the above mentioned units
were phased out since their designed
operational life was completed.
Owing to the success of early sea
water desalination attempts using the
Multistage Flash distillation process3, the
rest of the council countries started to
build similar plants. In 1975, the kingdom
of Bahrain built Sitra Plant then, in 1976,
Sultanate of Oman constructed Al
Ghabra and Massairah Plants followed
by construction of Al Bukhariya Plant in
Abu Dhabi, UAE, in 1977. Table 1 shows
the start date of using Multi Stage Flash
Distillation in the Council Countries
which is considered as the beginning of
modern desalination in GCC countries.
Subsequently, further desalination
projects depending on this process
were built in the areas such as Shuaiba
North and Shuaiba South in the State of
Kuwait, Jeddah, Al Khafji and Al Jubail in
the Kingdom of Saudi Arabia, Umm Al
Nar, Jabal Ali and Al Tawila in the State
of United Arab Emirates, Ras Abu Fontas
and Ras Laffan (A&B) in the state of
Qatar, Al Hidd (Phase 1) in the Kingdom
of Bahrain and Barka’a in Sultanate of
Oman. It should be noted that the unit’s
production capacity has been constantly
increasing; after it began with a capacity
of 1 MIGD (4545.5 m3/day) it reached
currently 20 MIGD (90909m3/day) for
each unit.
Brine Rec. Pump
Sea Water Pump
Dist. Pump
Air Ejectors
Dist. Production
Heat Rej. Section3 stages
Heat Gain Section 16 stages
L.P. Steam
HeatInput
SectionMake Up
BlowDown
Sea WaterDischarge

Desa l i na t ion i n the GCC . The H i s tor y, the Present & the Fu ture 13Desa l i na t ion i n the GCC . The H i s tor y, the Present & the Fu ture
Table 1 - Date of first use of modern Distillation in GCC countries
State Date Plant Name Process type Total Capacity
State of Kuwait 1960 Shuwaikh E1 & E2 MSF / Recycle 2
State of Qatar 1962 Ras Abu AboudMSF / Long
tubes1.5
KSA 1967Al WajhDhaba
MSF / Once through
0.043560.04356
Kingdom of Bahrain 1975Sitra
1A & 1BMSF / Recycle 5
Sultanate of Oman 1976Al Ghabra
MassiraMSF / Recycle
50.00331
UAE* 1977
Jazirat Abu Mousa MED 0.02
Abu Dhabi Vapor Plant
MSF / Recycle 15
Al Barbarat RO 1
*the UAE introduced three different processes in one year.
Introducing new desalination processes and technics
Researchers never stopped looking for
new desalination processes that could be
more effective, less power consumption
and have lower costs. As a result,
new techniques such as Electrodialysis
(ED) and Reverse Osmosis (RO) were
invented in the late sixties of the 20th
century. Also the old techniques such as
Multi Effect Distillation (MED) and Vapor
Compression (VC) were redeveloped
to overcome their problems and make
them more competitive with new
processes. Accordingly, desalination
industry is having many options that suit
every circumstance and need.
Due to the different conditions in GCC
countries, and the existence of small
communities in remote areas away from
sea or important islands for the States,
the invention of new techniques and
improving old processes helped the
GCC countries to supply water to those
isolated areas. The new techniques
that were introduced to the region
are: reverse osmosis (RO), Multi Effect
distillation (MED), Vapor Compression
(VC) and Electrodialysis (ED).
The first use of RO was in KSA when
three plants in Manfouha 2, Al Shumaisi
and Al Malz were constructed in the
year 1968. These Plants used to produce
desalinated water from underground
brackish water. UAE was next country
to build Al Barbarat Plant in 1977 which
had a capacity of 1 MIGD (4545.5 m3/
day). In 1982, reverse osmosis (RO)
process was introduced in Sultanate
of Oman and the state of Qatar where
Sultanate of Oman built Ras Al Had and
Madraka Plants, each had a capacity of
22000 gallon/day (100 m3/day).
On the other hand , the State of Qatar
built Abu Samra Plant with a capacity
Sitra Station for electricity and water production - Kingdom of Bahrain
of 149600 gallon/day (680 m3/day). RO
was introduced in 1984 in the Kingdom
of Bahrain when the first plant “Ras Abu
Jarjur” was built to desalinate salty well
water. The Plant had a capacity of 10
MIGD (45454.5 m3/day). In 1979, the
state of Kuwait, built Al Doha reverse
osmosis (RO) plant for the purpose of
research and development. The study of
RO process was carried out in order to
achieve the lowest production cost and
best quality of desalinated water. The
trial results concluded that RO process
could be used in Kuwait to desalinate
sea water with high efficiency and
reliability.
Since Kuwait has a natural source
of low salinity underground water,
it was decided to use this technique
to transform a part of it into drinking
water in emergency cases.
Therefore, in the year 1987 a total of
thirteen RO units were installed and
operated; each has a capacity of 250000
gallon/day (1136 m3/day) and they were
distributed on strategic locations such
as hospitals, army camps and social
care centers. Further, in the year 1993
an additional 20 similar RO units were
built to desalinate low-salinity water
and located near water reservoirs and
pumping stations.
Most of the RO units in the GCC
countries are located in UAE, KSA and
Sultanate of Oman. They have varied
production capacities and used to
desalinate underground salty water and
sea water which was found to be the
best option to provide drinking water to
small and remote villages. Whereas the
largest RO plants which have capacity
exceeding 10 MIGD are located in UAE,
kingdom of Bahrain and KSA.

14
Riffa Power & Water Station - Kingdom of Bahrain
Technique Year Plant State
MSF 1960 Shuwaikh Kuwait
RO 1968Manfouha 3, Shamissi
and AlmazKSA
MED 1977 Jazirat Abu Mousa UAE
VC 1979 Shaisah (Meeko) Sultanate of Oman
ED 1983 Lima Sultanate of Oman
Table 2 – Dates of introducing the different desalination processes to GCC
Observer of the techniques used in the
GCC notes that although RO process
reached technical maturity stage which
makes it approve technology in majority
of the world countries, along with many
successful trials to use RO technology in
most of GCC Countries, the turnout on this technology to desalinate sea
water remains limited. Nevertheless,
RO process is the second largest
process used in the GCC countries
after the Multistage Flash Evaporation
in terms of production capacity which
reached approximately 23%.
Using MED and VC process were not as
common as the other thermal processes
such as MSF. However, in 1977, UAE
was the first country to introduce
MED desalination to GCC countries in
Jazirat Abu Mousa Plant with a capacity
of 20020 gallon/day (91 m3/day). KSA
used the same technique with reheating
process in fast Amlaj Units in 1981
where two units were installed with a
total capacity of 181500 gallon/day (825
m3/day) which then were shifted to Al
Wajh city in 1986. In the state of Qatar,
Dukhan Plant was built in 1996 with a
capacity of 2 MIGD (9091 m3/day). In
2004, the kingdom of Bahrain first used
this technique in Alba Plant which has
a capacity of 7 MIGD (31818 m3/day).
It seems that the largest production
opportunity for this technique is in UAE
where there are 9 plants some of which
have a capacity of more than 50 MIGD
(227273 m3/day).
In 1979, Sultanate of Oman used the
VC process in Shaisah Plant which has
a capacity of 22000 gallon/day (100
m3/day) followed by Hawar Plant in
the kingdom of Bahrain in 1985 with a
capacity of 31680 gallon/day (144 m3/
day). Except for these two plants, no
other VC plants were built in GCC
countries. Further, since the phase out
of Shaisah Plant, the Hawar Plant remains
the only one that works according to
this technique in the GCC countries.
As for the other process related to
membrane water desalination which is
Electrodialysis (ED), the only trial was in
Sultanate of Oman in Lima Plant which
was built in 1983 and had a capacity of
22000 gallon/day (100 m3/day). Table
2 shows dates of introducing different
desalination processes in the GCC
countries. The processes used with
dates for each of the GCC counties are
shown in table 3.
If necessity was the mother of
invention, the unique circumstances in
GCC countries created the necessity
of desalinated water not like any other
part of the world. Additionally, with
the need there was also the capability
of funding the construction of a lot of
desalination units. We perceive this as a
golden opportunity that the desalination
industry has received. As a result, huge
improvements had been achieved in the
past decades in the design, operation
and maintenance of desalination plants
Overview of desalination history in the GCC CountriesPart I
Desa l i na t ion i n the GCC . The H i s tor y, the Present & the Fu ture 15Desa l i na t ion i n the GCC . The H i s tor y, the Present & the Fu ture
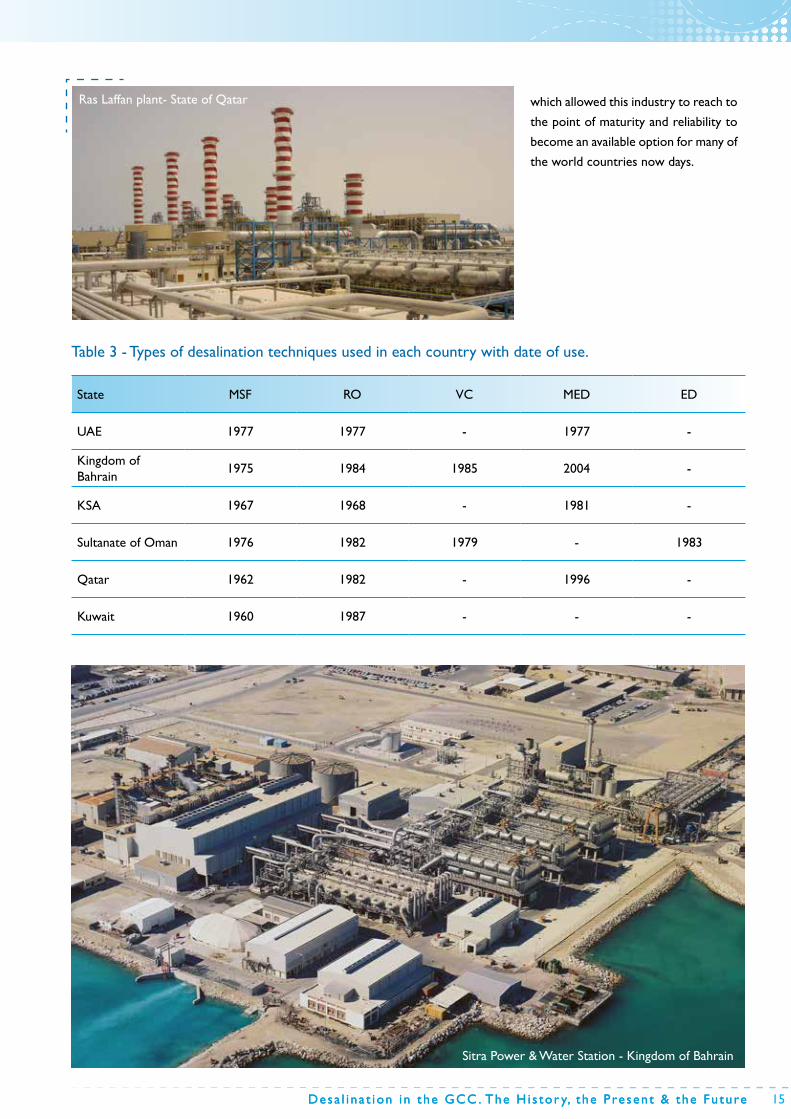
State MSF RO VC MED ED
UAE 1977 1977 - 1977 -
Kingdom of Bahrain
1975 1984 1985 2004 -
KSA 1967 1968 - 1981 -
Sultanate of Oman 1976 1982 1979 - 1983
Qatar 1962 1982 - 1996 -
Kuwait 1960 1987 - - -
Table 3 - Types of desalination techniques used in each country with date of use.
Ras Laffan plant- State of Qatar which allowed this industry to reach to
the point of maturity and reliability to
become an available option for many of
the world countries now days.
Sitra Power & Water Station - Kingdom of Bahrain

16
Figure 3 - MSF illustration
There are many water desalination processes used in GCC and
they are divided into two categories, the first category is based on
thermal processes while the second category is based on membranes
processes.
The following is an explanation on water desalination processes used
to produce desalinated water in GCC countries’ plants:
I. Thermal processes
1- Multi Stage Flashing (MSF)
MSF method is used in all the council
countries to desalinate sea water and
it is usually connected to power plants.
The process depends on heating salt
water up to a certain temperature
between 90 and 120 C in brine heaters.
Then the water is pumped to a series
of consecutive low-pressure chambers
(which are under vacuum), the water
flashes as it enters each chamber
and produce water vapor at entering
temperature of each chamber. Salt
water temperature reduces as it passes
through the different chambers and
hence the vacuum pressure keeps
reducing to ensure flash evaporation in
all the chambers. The rising water vapor
from the chambers gets condensed on
outer surface of feed water tube bundle
producing desalinated water and also
results in preheating the feed water
before entering the brine heater which
will reduce the energy required for
heating.
Steam
BrineHeater
Condensate pump Brine pump Product pump
Mist separator
Sea water pump
Vent Ejector
Suhar desalination plant - Sultanate of Oman
Part IIDesalination techniques used in the GCC Countries

17Desa l i na t ion i n the GCC . The H i s tor y, the Present & the Fu ture
Vapour from first effect Vapour from second effect
Concentrate
CondensateCondensate
Feed
Steam
Concentrate fromfirst effect
Figure 4 - MED Illustration
Similar to MSF, MED is made of multiple
stages (or effect chambers) using the
principle of reducing the vacuum in
different chambers which enables the
salt water to boil repeatedly without
adding additional heat after the first
effect chamber. It is sufficient to use
the vapor produced from the first effect
as heating source in the second effect
when the vapor condenses releasing
its latent heat and boiling sea water in
the second effect. Hence, the second
effect works as condenser for the
vapors coming from the first effect.
Accordingly, the third effect works as
condenser for the vapors produced
from the second effect and the process
continues. Therefore, each chamber
in that series is called effect. Figure 4
illustrate the main principle of Multi
Effect Desalination process which takes
place when hot steam is supplied to the
first effect tube bundle and latent heat
transfer to the thin film of salt water
falling by gravity on the outer surface of
2- Multiple Effect Distillation (MED)
the tube bundle causing it evaporate and
produce water vapor. The produced
vapor in the first effect is forced to flow
inside the tube bundle of the second
effect through demister pads and the
process continues in all effects. Water
vapor produced in the last stage gets
condensed in final condenser which is
cooled by sea water and works also as
heat reject section for the unit. Part
of the sea water at the final condenser
outlet is filtered and used as feed water
for the different effects by spraying it
equally over the tube bundles.
The Vapor compressor VC distillation
process is used in small and medium
capacity units to desalinate sea water. In
general, the capacity of desalination units
using compressed vapor process varies
between 20-2000 m3/day (4400-440000
gallon/day). This process is often used
in tourist resorts, industries and well
excavation sites. The heat required for
evaporation comes from compressing
the vapor instead of direct heat transfer
from steam produced in boilers.
3- Vapor compression (VC)
In this process, a mechanical compressor
driven by electric motor or a steam
ejector is used to create vacuum inside
evaporation chamber, which will cause
the water to evaporate at the feed water
temperature. The produced vapor is
compressed till its temperature increase
and subsequently becoming the source
of heat required to evaporate another
part of feed water. The pressurized
vapor is pumped to the shell side of
tubes containing salt water causing
the vapor to condense on the outer
surface of tubes and also heating the salt
inside the tubes producing additional
quantities of water vapor which will
be compressed again so the cycle will
continue to produce condensed water
as product water.
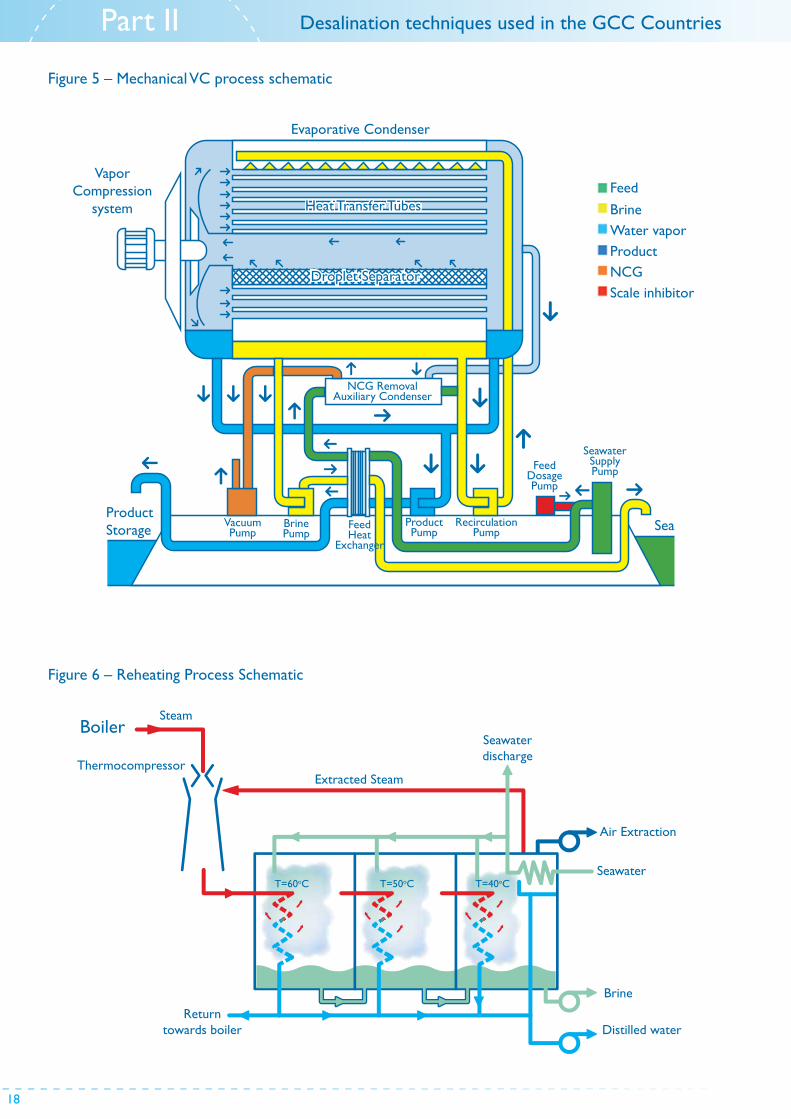
18
ProductStorage
Vacuum Pump
Brine Pump
Product Pump
NCG Removal Auxiliary Condenser
Droplet Separator
Heat Transfer Tubes
VaporCompression
system
Evaporative Condenser
Recirculation Pump
Feed Dosage Pump
Seawater Supply Pump
SeaFeed Heat
Exchanger
Feed
BrineWater vaporProductNCGScale inhibitor
Figure 5 – Mechanical VC process schematic
Figure 6 – Reheating Process Schematic
BoilerSteam
Extracted Steam
Returntowards boiler
Thermocompressor
Seawaterdischarge
T=60oC T=50oC T=40oC
Brine
Distilled water
Air Extraction
Seawater
Desalination techniques used in the GCC Countries Part II

Desa l i na t ion i n the GCC . The H i s tor y, the Present & the Fu ture 19Desa l i na t ion i n the GCC . The H i s tor y, the Present & the Fu ture
II. Membrane Processes
Pressure
Membrane
Water Flow
Figure 7 - RO illustration
Figure 8 - ED illustration
Voltage is used as driving force to
move and attract salt through a special
membrane that only allows the passage
of one type of ions to one electric pole
and thus removing the salt and getting
fresh water.
It may also be used by applying a certain
voltage on two poles one positive and
the other negative; so the feed water
2- Electrodialysis (ED) Figure 8 - Forms of ED membranes
passes between the poles. Negative and
positive ion gets attracted to positive
and negative poles respectively while
the water passes outside the unit with
reduced salinity to an acceptable limit.
ED effectively purify water with low
salinity (up to 2000 ppm).
Feed Solution
DiluteConcentrate
Cathode Anode
H2OH2O
OH- H+
RO is the process of reverse transfer of
water from a high concentration solution
to a low concentration solution through
semi porous or permeable membrane
under the effect of pressure higher than
the osmotic pressure applied in the
high concentrated solution as shown in
figure 7. The membrane made of special
polymers is called semi permeable
because it allows water molecules to
pass through and prevents the passage
of salt molecules. The required pressure
is obtained by high-pressure pumps.
Several factors control the value of
required pressure; the most important
factors are temperature and salinity of
feed water and required production.
The membranes of RO are made of
several types, but there are two widely
used types which are Spiral Wound and
Hollow Fine Fiber. These two types are
used to desalinate both brackish water
and sea water.
20
الباب الثالث
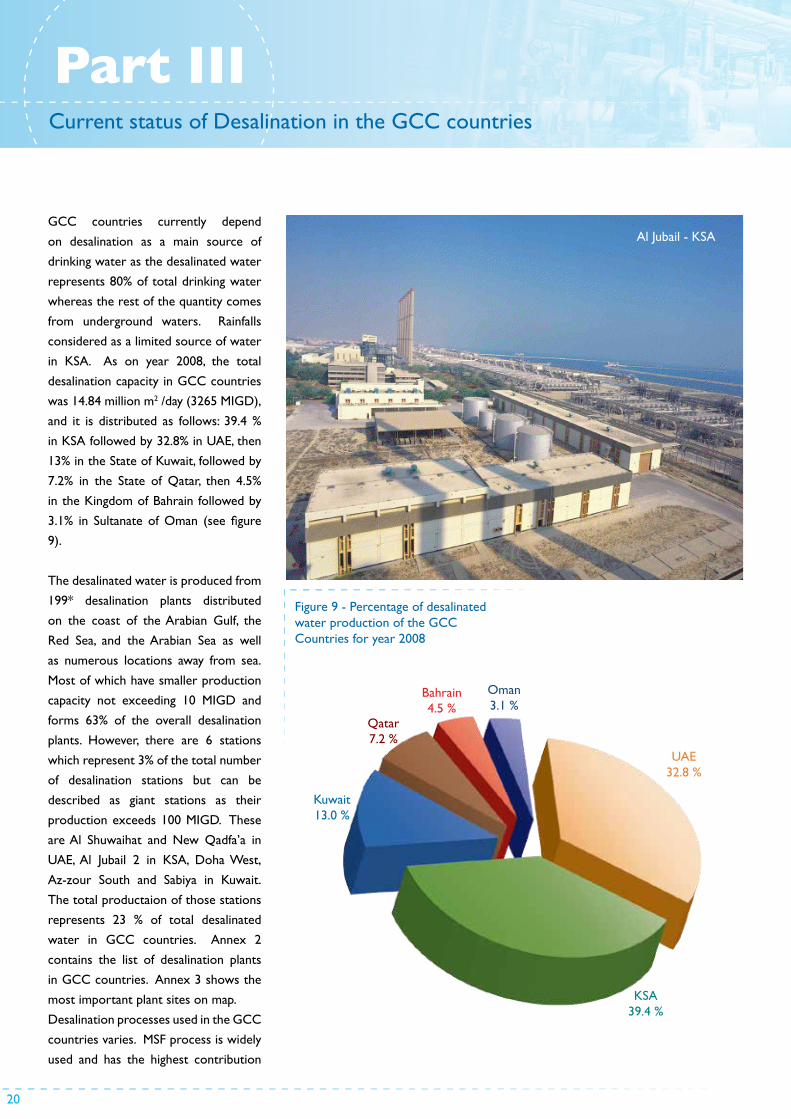
GCC countries currently depend
on desalination as a main source of
drinking water as the desalinated water
represents 80% of total drinking water
whereas the rest of the quantity comes
from underground waters. Rainfalls
considered as a limited source of water
in KSA. As on year 2008, the total
desalination capacity in GCC countries
was 14.84 million m2 /day (3265 MIGD),
and it is distributed as follows: 39.4 %
in KSA followed by 32.8% in UAE, then
13% in the State of Kuwait, followed by
7.2% in the State of Qatar, then 4.5%
in the Kingdom of Bahrain followed by
3.1% in Sultanate of Oman (see figure
9).
The desalinated water is produced from
199* desalination plants distributed
on the coast of the Arabian Gulf, the
Red Sea, and the Arabian Sea as well
as numerous locations away from sea.
Most of which have smaller production
capacity not exceeding 10 MIGD and
forms 63% of the overall desalination
plants. However, there are 6 stations
which represent 3% of the total number
of desalination stations but can be
described as giant stations as their
production exceeds 100 MIGD. These
are Al Shuwaihat and New Qadfa’a in
UAE, Al Jubail 2 in KSA, Doha West,
Az-zour South and Sabiya in Kuwait.
The total productaion of those stations
represents 23 % of total desalinated
water in GCC countries. Annex 2
contains the list of desalination plants
in GCC countries. Annex 3 shows the
most important plant sites on map.
Desalination processes used in the GCC
countries varies. MSF process is widely
used and has the highest contribution
Figure 9 - Percentage of desalinated water production of the GCC Countries for year 2008
KSA39.4 %
Kuwait13.0 %
Qatar7.2 %
Bahrain4.5 %
Oman3.1 %
UAE32.8 %
Al Jubail - KSA
Part IIICurrent status of Desalination in the GCC countries

21Desa l i na t ion i n the GCC . The H i s tor y, the Present & the Fu ture
* The number does not include all purification (desalination) plants in KSA.
Figure 10 : Percentage contribution of desalination processes used in GCC countries (2012)
21.2 %RO (ED & VC)
0.004 %
8.0 %MED
اآلخرين
الخبر 1 - المملكة العربية السعودية
Table 4. Number and types of desalination plants in the GCC countries – 2008.
Process UAE Bahrain KSA Oman Qatar Kuwait Total
MSF 20 1 18 3 5 6 53
RO 18 2 76 31 2 - 129
MED 8 1 3 - 1 - 13
VC - 1 - - - - 1
ED - - - - - - -
Mixed
1MED
+RO
1MSF+
MED
-
1ED+
RO
- - 3
Total 47 6 97 35 8 6 199
Note: The table does not include small purification (desalination) plants in KSA.
rate based on production capacity,
68.8%, among other processes used
followed by 23.2% produced by RO
process, and 8% produced by MED
process. Other processes such
as ED and VC are also used and
produce less than 0.004% as shown
in figure 10. Since year 2000, the
new projects in GCC countries
showed an increasing confidence in
RO and MED processes which may
increase their contribution rates to
the total desalinated water capacity
in the coming years. Table 4 below
shows the number of desalination
plants and its production capacity
for each process in the GCC
countries.
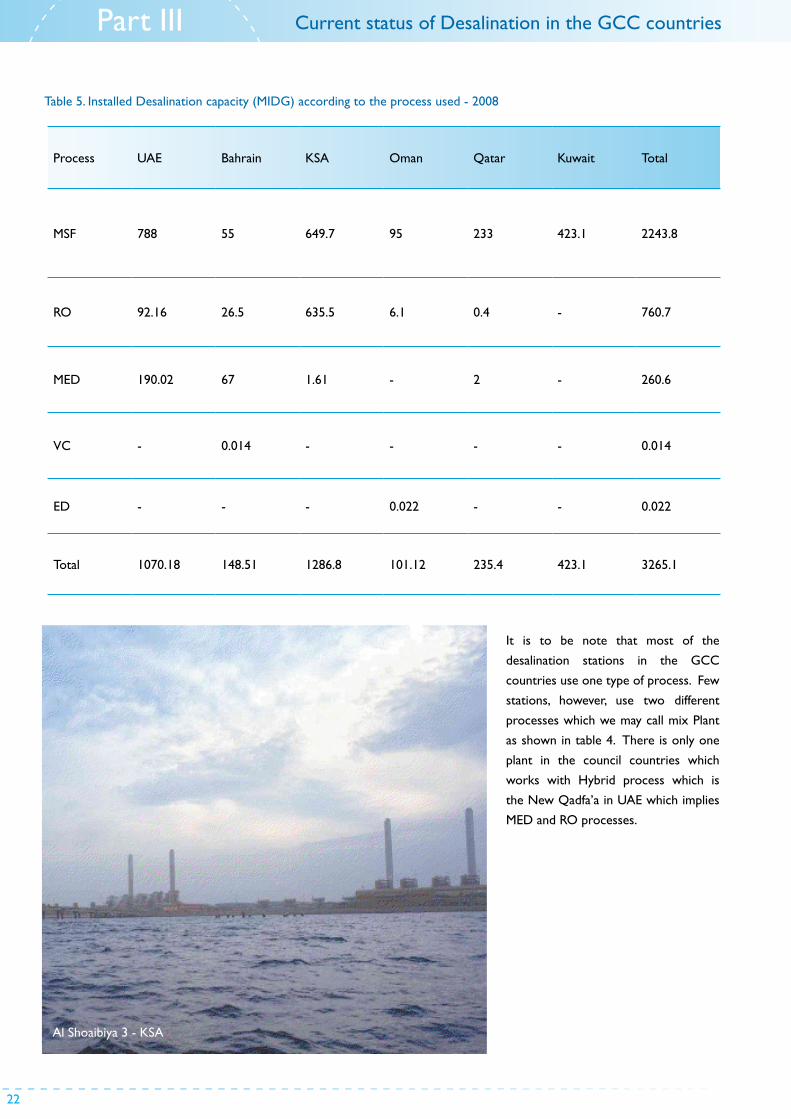
22
Process UAE Bahrain KSA Oman Qatar Kuwait Total
MSF 788 55 649.7 95 233 423.1 2243.8
RO 92.16 26.5 635.5 6.1 0.4 - 760.7
MED 190.02 67 1.61 - 2 - 260.6
VC - 0.014 - - - - 0.014
ED - - - 0.022 - - 0.022
Total 1070.18 148.51 1286.8 101.12 235.4 423.1 3265.1
Table 5. Installed Desalination capacity (MIDG) according to the process used - 2008
It is to be note that most of the
desalination stations in the GCC
countries use one type of process. Few
stations, however, use two different
processes which we may call mix Plant
as shown in table 4. There is only one
plant in the council countries which
works with Hybrid process which is
the New Qadfa’a in UAE which implies
MED and RO processes.
Al Shoaibiya 3 - KSA
Current status of Desalination in the GCC countriesPart III
23Desa l i na t ion i n the GCC . The H i s tor y, the Present & the Fu ture
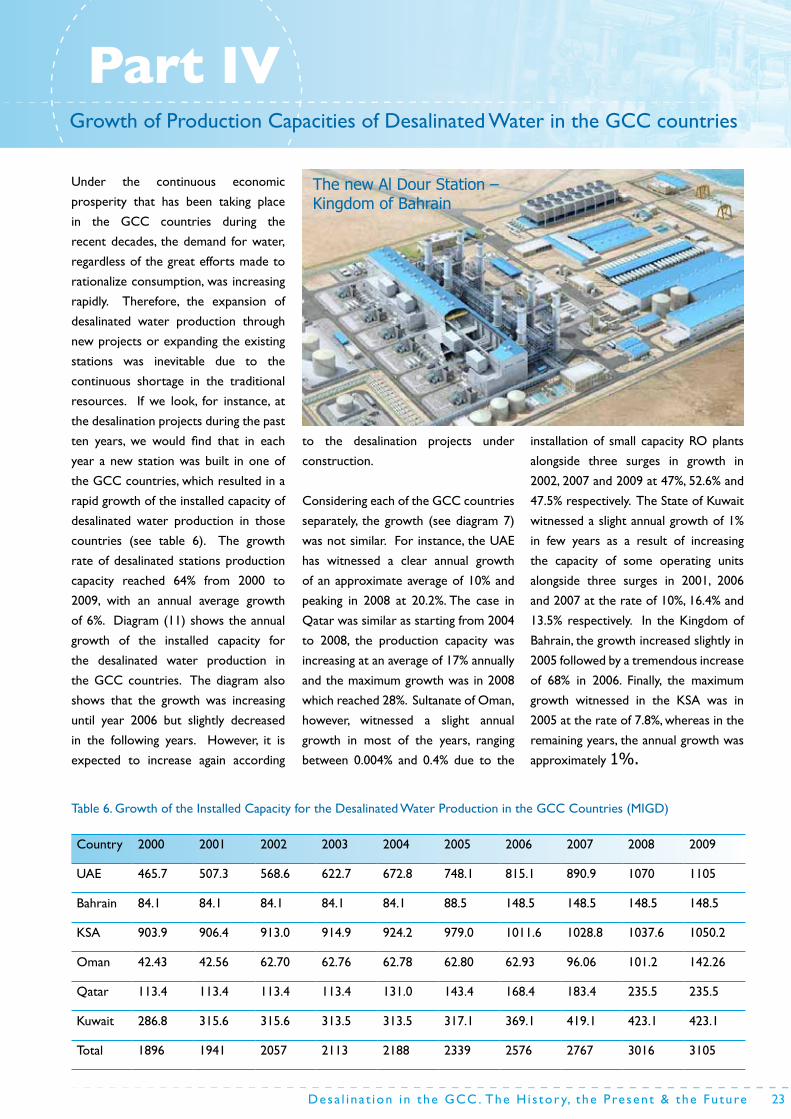
Growth of Production Capacities of Desalinated Water in the GCC countries
Under the continuous economic
prosperity that has been taking place
in the GCC countries during the
recent decades, the demand for water,
regardless of the great efforts made to
rationalize consumption, was increasing
rapidly. Therefore, the expansion of
desalinated water production through
new projects or expanding the existing
stations was inevitable due to the
continuous shortage in the traditional
resources. If we look, for instance, at
the desalination projects during the past
ten years, we would find that in each
year a new station was built in one of
the GCC countries, which resulted in a
rapid growth of the installed capacity of
desalinated water production in those
countries (see table 6). The growth
rate of desalinated stations production
capacity reached 64% from 2000 to
2009, with an annual average growth
of 6%. Diagram (11) shows the annual
growth of the installed capacity for
the desalinated water production in
the GCC countries. The diagram also
shows that the growth was increasing
until year 2006 but slightly decreased
in the following years. However, it is
expected to increase again according
to the desalination projects under
construction.
Considering each of the GCC countries
separately, the growth (see diagram 7)
was not similar. For instance, the UAE
has witnessed a clear annual growth
of an approximate average of 10% and
peaking in 2008 at 20.2%. The case in
Qatar was similar as starting from 2004
to 2008, the production capacity was
increasing at an average of 17% annually
and the maximum growth was in 2008
which reached 28%. Sultanate of Oman,
however, witnessed a slight annual
growth in most of the years, ranging
between 0.004% and 0.4% due to the
installation of small capacity RO plants
alongside three surges in growth in
2002, 2007 and 2009 at 47%, 52.6% and
47.5% respectively. The State of Kuwait
witnessed a slight annual growth of 1%
in few years as a result of increasing
the capacity of some operating units
alongside three surges in 2001, 2006
and 2007 at the rate of 10%, 16.4% and
13.5% respectively. In the Kingdom of
Bahrain, the growth increased slightly in
2005 followed by a tremendous increase
of 68% in 2006. Finally, the maximum
growth witnessed in the KSA was in
2005 at the rate of 7.8%, whereas in the
remaining years, the annual growth was
approximately 1%.
Country 2000 2001 2002 2003 2004 2005 2006 2007 2008 2009
UAE 465.7 507.3 568.6 622.7 672.8 748.1 815.1 890.9 1070 1105
Bahrain 84.1 84.1 84.1 84.1 84.1 88.5 148.5 148.5 148.5 148.5
KSA 903.9 906.4 913.0 914.9 924.2 979.0 1011.6 1028.8 1037.6 1050.2
Oman 42.43 42.56 62.70 62.76 62.78 62.80 62.93 96.06 101.2 142.26
Qatar 113.4 113.4 113.4 113.4 131.0 143.4 168.4 183.4 235.5 235.5
Kuwait 286.8 315.6 315.6 313.5 313.5 317.1 369.1 419.1 423.1 423.1
Total 1896 1941 2057 2113 2188 2339 2576 2767 3016 3105
Table 6. Growth of the Installed Capacity for the Desalinated Water Production in the GCC Countries (MIGD)
The new Al Dour Station – Kingdom of Bahrain
Part IV

24
Diagram 11 - Growth rate in the Desalinated Water Production in the GCC Countries (2000 – 2009)
Uni
ted
Ara
b Em
irat
esK
ingd
om o
f Bah
rain
Kin
gdom
of S
audi
Ara
bia
Part IV Growth of Production Capacities of Desalinated Water
% G
ROW
TH
RAT
E
Sulta
nate
of O
man
Stat
e of
Qat
arSt
ate
of K
uwai
t
الجدول رقم الحظ) دول المجلس فٌمكن مالحظةأما على نطاق كل دولة من
( أن النمو لم ٌأخذ منحى متشابها. فدولة اإلمارات العربٌة المتحدة شهدت 7
8..2وكان أقصاه فً عام %.7نمواً سنوٌاً واضحاً بلغ متوسطه حوالً
إلى عام م 5..2بدءاً من عام حٌث فً دولة قطركذا الحال و %2..2بنسبة
% سنوٌاً وكان أقصى نمو فً 77م كانت السعة اإلنتاجٌة تنمو بمتوسط 8..2
%. وفً سلطنة عمان وجد نمواً سنوٌاً بسٌطاً فً أغلب 28م بنسبة 8..2عام
وذلك بسبب إنشاء محطات تناضح %5.3و %5....األعوام تراوح بٌن
م 2..2مع حدوث ثالث طفرات فً النمو فً أعوام عكسً صغٌرة السعة
فً دولة أماعلى التوالً. %57.4و %42.6و %57م بنسب 9..2م و7..2و
فً بعض السنوات نتٌجة لزٌادة %7طفٌف بلغ وجد نمو سنوي ف الكوٌت
و 7..2سعات بعض الوحدات العاملة مع حدوث ثالث طفرات فً األعوام
2% 6%
3% 4% 7%
10% 7% 9%
3% 7% 8% 7%
0%
5%
10%
15%
20%
25%
30%
2001 2002 2003 2004 2005 2006 2007 2008 2009 2010 2011 2012
و لنم
ة اسب
ن%
السعة المركبة إلنتاج المياه المحالة في دول نسبة النمو في. 11شكل رقم (2012 - 2000)مجلس التعاون الخليجي
2000 2001 2002 2003 2004 2005 2006 2007 2008 2009 2010 2011 20120
200
400
600
800
1000
1200
1400
1600
1800
2000 2001 2002 2003 2004 2005 2006 2007 2008 2009 2010 2011 2012
0
100
200
300
400
500
2000 2001 2002 2003 2004 2005 2006 2007 2008 2009 2010 2011 20120
200
400
600
800
1000
1200
1400
1600
1800
2000 2001 2002 2003 2004 2005 2006 2007 2008 2009 2010 2011 2012
0
100
200
300
400
500
2000 2001 2002 2003 2004 2005 2006 2007 2008 2009 2010 2011 2012
0.0
200.0
400.0
600.0
800.0
1000.0
1200.0
2000 2001 2002 2003 2004 2005 2006 2007 2008 2009 2010 2011 2012
0.0020.0040.0060.0080.00
100.00120.00140.00160.00180.00
2000 2001 2002 2003 2004 2005 2006 2007 2008 2009 2010 2011 2012
0
50
100
150
200
250
300
350
400
2000 2001 2002 2003 2004 2005 2006 2007 2008 2009 2010 2011 2012
0
100
200
300
400
500
600
2001 2002 2003 2004 2005 2006 2007 2008 2009 2010 2011 20120%
10%
20%
30%
40%
50%
60%
70%
80%
BAH UAE KSA
Installed Capacity MIGD

Desa l i na t ion i n the GCC . The H i s tor y, the Present & the Fu ture 25Desa l i na t ion i n the GCC . The H i s tor y, the Present & the Fu ture
RAF-B PLANT – MSFE’S OVER VIEW.
RAF-A PLANT – MSFE’S & SEAWATER OVER VIEW
RAF-B PLANT – MSFE’S OVER VIEW.
RAF-A PLANT – MSFE’S & SEAWATER OVER VIEWRas Abu Fontas Station – State of Qatar
Growth of Production Capacities of Desalinated Water in the GCC countries
2000 2001 2002 2003 2004 2005 2006 2007 2008 2009 2010 2011 2012
0
100
200
300
400
500
600
2001 2002 2003 2004 2005 2006 2007 2008 2009 2010 2011 20120%
10%
20%
30%
40%
50%
60%
70%
80%
BAH UAE KSA
2001 2002 2003 2004 2005 2006 2007 2008 2009 2010 2011 20120%
10%
20%
30%
40%
50%
60%
70%
KUW QAT OMN
Kingdom of BahrainUnited Arab EmiratesKingdom of Saudi Arabia
State of KuwaitState of QatarSultanate of Oman
Annual Growth Rate

26
Based on the instructions of their
Majesties and Highnesses leaders of
the GCC countries and the millennium
objectives set by the UN for improving
the living standards, availability of
drinking water and its accessibility to all
citizens and residents are required for
implementing the luxury for citizens.
In addition, achieving development
demands abundance in water supply,
which is enough to ensure the trust
of the GCC countries infrastructure
and to support its economic growth.
Therefore, all of the GCC countries
currently own a slight surplus in the
production of desalinated water,
which could be sufficient for some
years compared to the demand. The
anticipations for the coming twenty
years indicate the continuous growth
of demand in all the GCC countries,
which contributed in setting the mid
and long term plans for installing more
desalination stations as one of the main
possible options alongside the other
options, such as utilizing treated sewage
and rationalizing consumption, etc.
Table (8) shows the main desalination
projects under construction in the
GCC countries as on year 2008, which
are expected to boost the production
capacity in the GCC by around 1103
MIGD (5 million m3 per day) and
percentage of 37%. According to the
table, only 12% of the new capacity will
be produced from MSF and 55% of it
will be produced from RO while the
remaining 32% will be produced from
MED which shows clearly increase
usage of RO and MED technics. Also,
it can be noted that at least 60% of the
new production capacity will be through
private projects. There are many future
projects at different stages of study and
design as shown in table (9).
WATER TREATMENT PLANT – LIME STONE FILTERS
WATER TREATMENT PLANT – EQUIPMENTS AND VALVES
WATER TREATMENT PLANT – LIME STONE FILTERS
WATER TREATMENT PLANT – EQUIPMENTS AND VALVES
Treatment plant (Limestone Filters) – Ras Abu Fontas - The State of Qatar
Equipment & valves – Ras Abu Fontas - The State of Qatar
Liya Station – UAE
Future Prediction for the Desalination Stations in the GCC countries
Part V

27Desa l i na t ion i n the GCC . The H i s tor y, the Present & the Fu ture
Table 8 - Desalination stations under construction in GCC countries.
State Station NameCapacity (MIGD)
Type of Technology
No. of Units Operator
UAE
Fujairah (the second) 100 MED + RO
Shuweihat (Phase two) 100 MED
Al-Leila – Sharjah 8 RO
Al-Leila – Sharjah 5 RO
Al-hamriya al Jadida 80 RO
Sirbonair Island 0.15 RO
Khorfakkan – Sharjah 5 RO
Kalba’a 3 RO
Abu Mousa Island 0.15 RO
Kingdome of Bahrain
Al dur 48.9 RO Private
KSA
Al-Wajh- 3 1.98 MED 2 Governmental
Amlaj- 2 1.98 MED 2 Governmental
Rabegh - 2 3.96 MED 2 Governmental
Fersan -2 1.98 MED 2 Governmental
Al-Qunfuthah 1.98 MED 2 Governmental
Al-Laith 1.98 MED 2 Governmental
Jeddah - 3 52.8 RO 16 Governmental
Al- Shaqiq for water and electricity company
46.64 RO 16 Private
Al – Shuaibah for water and energy company
193.6 MSF Private
Al – Shuaibah for water and energy company
33 RO Private
Marafeq company 176 MSF Private
Sultanate of Oman
Barka’a 2 26 RO 1 Private
Central Sour 17.6 RO 1 Private
Al-Ghabra – 2 5 RO 24 Governmental
Aldaqm 1.32 RO 1 Private
Sour 0.5 RO 1 Governmental
Tiwi 0.5 RO 1 Governmental
Quryat 1 RO 1 Governmental
Alsifa – 2 0.022 RO 1 Governmental
Adam – 3 0.099 RO 1 Governmental
Hima – 3 0.088 RO 1 Governmental
Alnajda 0.022 RO 1 Governmental
Deba -2 0.44 RO 1 Governmental
Hitam – 3 0.055 RO 1 Governmental
Al-Dhahr 0.088 RO 1 Governmental

28
Table 8 - Desalination stations under construction in GCC countries.
Tawila Station - UAESabiya Station - Kuwait
State Station Name Capacity (MIGD)Type of
TechnologyNo. of Units Operator
Sultanate of Oman
Madraqa 0.66 RO 1 Governmental
Al-khalouf 0.022 RO 1 Private
Dhalkout 0.11 RO 1 Governmental
Sadh 0.11 RO 1 Governmental
Al-mazyouniya 0.132 RO 1 Governmental
Ben nawatesh 0.44 RO 1 Governmental
Sharabthat 0.044 RO 1 Governmental
Mandar al-Dhebyan 0.0088 RO 1 Governmental
Al-mashash 0.0044 RO 1 Governmental
Maqshen 0.022 RO 1 Governmental
Mitn 0.011 RO 1 Governmental
Bithnah 0.011 RO 1 Governmental
Al-hashman 0.011 RO 1 Governmental
Dimit 0.011 RO 1 Governmental
Rabkout 0.022 RO 1 Governmental
Rakhaiwit 0.11 RO 1 Governmental
Al-Shuwaimiya 0.011 RO 1 Governmental
Barbazoum 0.011 RO 1 Governmental
Thahboun 0.033 RO 1 Governmental
QatarRas Abo Fontas A-1 45 MSF 3 Private
Ras Laffan 3 63 MED 10 Private
KuwaitShuaiba North 45 MSF Governmental
Shuwaikh 30 RO Governmental
Total 1103
*these data includes stations executed after 2008 until the issue of this book in 2010, therefore some of the stations have entered into production.
Part V Future Prediction for the Desalination Stations in the GCC countries

Desa l i na t ion i n the GCC . The H i s tor y, the Present & the Fu ture 29Desa l i na t ion i n the GCC . The H i s tor y, the Present & the Fu ture
Table 9 – Future projects in GCC countries
Country Station Capacity (MIGD) Technique Project status
UAEAl-Shuwaihat Station extension 240 (After
extension)- Under Study
Al-Hesyan 140 Under Study
Kingdome of Bahrain
Al-Dur(Phase two) 52 Under Study
KSA
Ras Al-Zour (Phase one) 225.5 MSF Under Study
Yanbua’a – Almadena (Phase three) 0.088 MSF Under Study
Jeddah RO (Phase three) 0.0528 RO Under Study
Al-Shuaibah (Phase three) 226.6 Under Construction
Al-Shaqiq (Phase two) 0.04664 Under Construction
Marafiq Company 0.176 Under Design
Haqil (Phase three) 1.98 MED Under Design
Dhaba(Phase four) 1.98 MED Under Design
Rabegh expansion (Phase two) 1.98 MED Under Design
Sultanat Ouman
Al-Ghabra 3 40 TO 30 RO Under Study
Al-Jazer - - Under Study
Al-Daqem 2 1.32 RO Under Study
Al-Daqem 2 1.32 RO Under Study
Mhout - - Under Study
Al-kahel 2 0.11 RO Under Design
Al-lakbi 2 0.11 RO Under Design
Kuhaid 0.011 RO Under Design
Al-Khuwaimah 0.066 RO Under Design
Lima 2 0.044 RO Under Design
Qarn Al Alam 0.022 RO Under Design
Al-ouwaifah 0.044 RO Under Design
Bakha 0.022 RO Under Design
Hima 4 0.044 RO Under Design
Al-sail 0.066 RO Under Design
Film 2 0.055 RO Under Design
Al-najda 2 0.044 RO Under Design
Hajj 0.308 RO Under Design
Khasab 0.066 RO Under Design
Manathef 0.11 RO Under Design
Kebout 0.044 RO Under Design
Andat 0.011 RO Under Design
Tosnat 0.011 RO Under Design
Houlouf and Meshailah 0.011 RO Under Design
Hasek 0.011 RO Under Design
Qatar Existing stations extension 60 Under Study
Kuwait
Az-zour South 30 RO Under Tendering
Az-zour North Phase one 102 MSF Contractors prequalification
Az-zour North Phase two 102 MSF Under Study
Az-zour North Phase three 25 RO Under Study

30
This part highlights privatization of
desalination projects in general in order
to put the reader to the progress of
desalination industry in GCC countries.
Due to the challenges and difficulties
imposed by the funding of water
desalination projects, the GCC
governments headed towards
involving the private sector in building
desalination stations financed and
owned completely or partially by the
privet sector. Privatization in GCC
countries started in Qatar through
establishing Qatar Electricity and Water
Company in 1990 A.D.; with its first
project of Ras Abu Fontas – B station
in the same year. In 2003, two more
stations were privatized, Ras Abu Fontas
- A and Dukhan stations. It is worth
mentioning that all desalination stations
built in Qatar after 1990 are established
by the private sector. On the other
hand, Privatization projects in the UAE
and the Sultanate of Oman, were running
in parallel with the development of the
public sectors projects. So that, although
some of the new water desalination
projects were awarded to the privet
sector, the governments, however,
continued to execute its own projects.
The first private sector project in the
UAE was in 1998 through CMC the
Emirati Company, while Barka’a in the
Sultanate of Oman was the first private
water desalination station established in
2003 by AES Company. The Kingdom
of Bahrain privatization experience,
however, falls between the experiences
of Qatar from one side and the Emirati
and Sultanate of Oman from the other
side. While the State retained the
ownership and operation of the existing
stations, construction of new stations
were assigned to the privet sector. The
first privatization experience in the
Kingdom of Bahrain started with the
transfer of ownership of Al-Had station
to the private sector in 2006 as part
of constructing the third phase in the
station with a capacity of 90 MIGD. The
construction of facility was completed in
2008 and called Al-Had power company
after privatization.
Based on the resolution number
(2/92), KSA converted in the Year 2008
(1429 H) the Saline Water Conversion
Corporation (SWCC) into a holding
joint-stock company fully owned by
the state. The purpose of this new
company is to regulate production
companies of existing and proposed
stations which will be opened for privet
sector investors and developers for not
less than 60% ownership by the privet
sector for each company.
Al Shuaibah Water and Power Company
was the first private project which is
currently constructing desalination plant
with a capacity of 226.6 MIGD. Whereas
in the state of Kuwait and according
to the law number 37 for the year
2010 concerning the organization of
privatization programs and operations,
the Ministry of Electricity and Water
presented the project of Az-zour North
(1500 MW, 100 MIGD) to the private
sector through establishing a joint stock
company. Therefore, it is considered as
the first privatization project in water
desalination field. The Ministry has
also a plan for further projects in this
field which will lead to the transfer of
ownership of the existing Power and
Water Stations to the private sector
after evaluating the capital value of each
station and selecting the suitable station
to privatize.
بعض صور محطات تحلية المياه بسلطنة عمان
محطة تحلية المياه بالغبرة -1
Al Ghabra Desalination Plant – Sultanate of Oman
Privatization of Desalination projects in the GCC countries
Part VI

31Desa l i na t ion i n the GCC . The H i s tor y, the Present & the Fu ture
بعض صور محطات تحلية المياه بسلطنة عمان
محطة تحلية المياه بالغبرة -1
32
Appendices
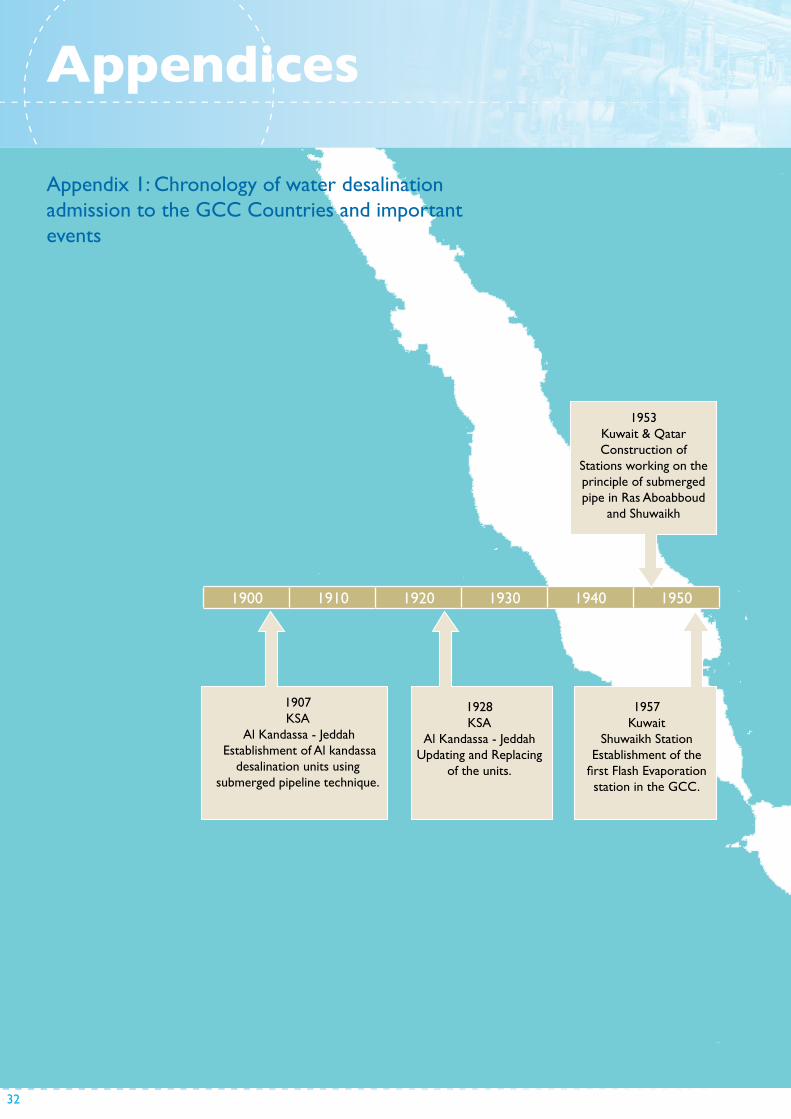
Appendix 1: Chronology of water desalination admission to the GCC Countries and important events
195019401930192019101900
1928KSA
Al Kandassa - Jeddah Updating and Replacing
of the units.
1957Kuwait
Shuwaikh StationEstablishment of the
first Flash Evaporation station in the GCC.
1907KSA
Al Kandassa - Jeddah Establishment of Al kandassa
desalination units using submerged pipeline technique.
1953Kuwait & QatarConstruction of
Stations working on the principle of submerged pipe in Ras Aboabboud
and Shuwaikh

33Desa l i na t ion i n the GCC . The H i s tor y, the Present & the Fu ture
1
1983Sultanate of Oman
Lima stationEstablishment of the first and only station operating on electro dialysis in GCC
countries.
20001990198019701960
1960Kuwait
Shuwaikh E1 & E2First experience for a Multi Stage Flash
desalination technique.
1990Qatar
Ras Abu Fontas B First private
station in the GCC countries.
1977UAE
Abu Mousa IslandEstablishment of first
station working through multi effect evaporation
technique in GCC countries.
1968KSA
Manfouha 2, Al Shumaisiand Al Milz
Establishment of first station working through RO technique in GCC
countries.
1985Kingdom of Bahrain
HiwarThe only station operating
on steaming pressure technique in GCC
countries.
1979Sultanate of Oman
ShaisaFirst station working on steaming pressure
in GCC countries (phased out).

34
Appendices
Plant Capacity Technology Units No. Commissioning year
MGPD m3/day
Abu Dhabi Steam Station 15 68182 MSF 4 1977
Abu Moussa Island 0.05 227 MED 1977
AJMAN 9 40909 MED 5 2000
AJMAN- 3.2 14545 RO 4 1994
Al Hamariah 1.15 5227 RO 1995
Al Hlyow 0.07 318 RO 3 1994
Al Layyah 63.5 288636 MSF+MED 10 1981
Al Mirfa 39 177273 MSF 3 1996
Al Saja’a 5.5 25000 RO 5 2000
Al Zawra1 6 27273 RO 2008
Al Zawra2 3 13636 RO 2012
Al Zawra3 7 31818 RO 2012
ALqoua 0.15 682 RO
ALwajan 0.35 1591 RO
Al-Zibair 0.11 500 RO 2004
Burairat 1.2 5455 RO 2 1977
Fujairah F1 102 463636 RO +MSF 2005
Fujairah F2 132 600000 MED+ RO 2010
Ghalilah 3 13636 RO 3 2005
Jebel Ali (RO) G 25 113636 RO 9 2007
Appendix 2: List of desalination stations in GCC countries (2008 AC)
Operating Stations in United Arab Emirates

35Desa l i na t ion i n the GCC . The H i s tor y, the Present & the Fu ture
2
Plant Capacity Technology Units No. Commissioning year
MGPD m3/day
Jebel Ali D 35 159091 MSF 8 1979
Jebel Ali E 25 113636 MSF 4 1989
Jebel Ali G 60 272727 MSF 9 1993
Jebel Ali K 60 272727 MSF 2000
Jebel Ali L 125 568182 MSF 2005
Jebel Ali M 140 636364 MSF 2011
Kalba plant 7.3 33182 MED+RO 3 1995
KFK plant 5 22727 RO 1 2009
NAKHEEL 16 72727 MED 6 1998
S1-SHUWEIHAT 101 459091 MSF 6 2004
S2-SHUWEIHAT 101 459091 MSF 2011
Seir BuNeir Island 0.015 68 RO 2002
Taweelah A1 85 386364 MSF +MED 2001
Taweelah A2 51 231818 MSF 4 2002
Taweelah B 1 70 318182 MSF 6 1995
Taweelah B2 23 104545 MSF 3 2000
Taweelah NEW EXTENSION 69 313636 MSF 2008
UAQ- A 2.5 11364 RO 5 1985
UAQ- B 2.5 11364 RO 5 2005
UM ALzmoul 0.25 1136 RO
Umm Al Nar 145 659091 MSF+MED 1979
Total 1539.85 6999295

36
Appendices
Plant Capacity Technology Units No. Commissioning year
MGPD m3/day
Abu Mudhabi 0.055 250 RO 2 1985-2012
Adam 0.372 1691 RO 3 1997-2009
Al Ghubrah-1 42 190909 MSF 7 1976-2001
Al Ghubrah-2 5 22727 RO 24 2010
Al Najdah-1 0.022 100 RO 1 2008
Al Najdah-2 0.044 200 FO 1 2012
Alkahal 0.017 77 RO 1 2006
AlKhalouf 0.022 100 FO 1 2010
Alkhiran 0.033 150 RO 1 2003
Alkhulouf 0.022 100 RO 1 2007
Alkhuwaiymah 0.088 400 RO 2 2001-2012
Allakbi 0.022 100 RO 1 2005
Alsa’adanat 0.033 150 RO 2 1985-2001
Alsail & Al Ramlah 0.022 100 RO 1 2004
Alsifah 0.022 100 RO 1 2003
Alzahiya 0.022 100 RO 1 2001
Bamah 0.132 600 RO 2 2002-2012
Barka ACWA 20 90909 MSF 3 2003
Barka SMN 26 118182 RO 1 2009
Dibba 0.88 4000 RO 2 2008-2012
Eshairgah 0.022 100 RO 1 1995
Operating Stations in Sultanate of Oman
Appendix 2: List of desalination stations in GCC countries (2008 AC)

37Desa l i na t ion i n the GCC . The H i s tor y, the Present & the Fu ture
2
Plant Capacity Technology Units No. Commissioning year
MGPD m3/day
Film 0.055 250 RO 1 2012
Fins 0.022 100 RO 1 2002
Haima 0.132 600 RO 1 1995-2009
Hamra’a Al dorou’ 0.264 1200 RO 1 2008
Hijj 0.396 1800 RO 2 1995-2012
Hitam 0.044 200 RO 1 2012
Khumkham 0.022 100 RO 1 1995
Kumzar 0.077 350 RO 2 1996-2012
Lima 0.066 300 RO+ED 2 1983-2008
Madraka 0.11 500 RO 2 2007-2010
Musairah 0.726 3300 RO 3 2001-2008
Qarn Alalam 0.044 200 RO 1 2001-2012
Qurayat 1.5 6818 RO 2 2010-2012
Ras Alhad 0.11 500 RO 1 2006
Sarab 0.066 300 RO 1 2012
Sheesa 0.044 200 RO 3 2008
Sohar 33 150000 MSF 4 2007
Soqrah 0.066 300 RO 2 1998-2012
Sur 16.7 75909 RO 1 2010
Zahar 0.121 550 RO 3 1985-2010
Total 148.395 674522.7

38
Appendices
Plant Capacity Technology Units No. Commissioning year
MGPD m3/day
ALJubail 1 30.30 137727 MSF 6 1982
ALJubail 2 208.536 947891 MSF 40 1983
ALJubail RO 20 90909 RO 15 2000
AL- Khobar 2 49.060 223000 MSF 10 1983
AL- Khobar 3 61.600 280000 MSF 8 2000
AL- Khafji 2 5.035 22886 MSF 2 1986
Hagl 2 0.968 4400 RO 4 1990
Duba 3 0.968 4400 RO 4 1989
AL- Wajih 3 1.980 9000 MED 2 2009
Umlujj 2 0.968 4400 RO 2 1986
Umlujj 3 1.980 9000 MED 2 2009
Rabigh 2 3.960 18000 MED 2 2009
AL- Azizia 0.990 4500 MED 3 1987
Jeddah 3 19.439 88359 MSF 4 1997
Jeddah 4 48.747 221577 MSF 10 1982
Jeddah RO1 12.496 56800 RO 1989
Jeddah RO2 12.496 56800 RO 1994
Yanbu 1 23.776 108073 MSF 5 1981
Yanbu 2 31.680 144000 MSF 4 1998
Yanbu 28.200 128182 RO 15 1998
AL- Shuaiba 1 49.060 223000 MSF 10 1989
AL- Shuaiba 2 100.000 454545 MSF 10 2001
Farasan 2 1.980 9000 MED 2 2009
AL- Qunfutha 1.980 9000 MED 2 2008
AL- Lith 1.980 9000 MED 2 2009
AL- Shuqaiq 21.343 97014 MSF 4 1989
SWCC Total 740 3361463.636
Operating Stations in KSA
Appendix 2: List of desalination stations in GCC countries (2008 AC)

39Desa l i na t ion i n the GCC . The H i s tor y, the Present & the Fu ture
2
Plant Capacity Technology Units No. Commissioning year
MGPD m3/day
Ras abufentas A 55 250000 MSF 12 (1977-1983) (1994)
Ras abufentas B 33 150000 MSF 5 1997-1998
Ras laffan A 40 181818 MSF 4 2003-2004
Ras laffan B Qatar Power 60 272727 MSF 4 2006-2008
Abu samra 0.2 909 RO 1 1982
Qaeedat alshamal 0.2 909 MSF 1 1993
Ras abufentas A1 45 204545 MSF 3 2010
Ras abufentas B2 30 136364 MSF 2 2008
Ras Qertas 63 286364 MED 10 2010-2011
Dukhan 2 9091 MED 2 1997
Total 328.4 1483636.364
Operating Stations in State of Qatar

40
Appendices
Plant Capacity Technology Units No. Commissioning year
MGPD m3/day
Shuaiba South 36 163636 MSF 6 1971-1975
Doha East 42 190909 MSF 7 1978-1979
Doha West 110.4 501818 MSF 16 1983-1985
Al showiakh 49.5 225000 MSF+RO 3 1982-2011
Shuaiba North 45 204545 MSF 3 2011
Az Zour South 115.2 523636 MSF 16 1988-2001
Sabiya 100 454545 MSF 8 2006-2007
Total 498.1 2,264,091
Appendix 2: List of desalination stations in GCC countries (2008 AC)
Operating Stations in Kuwait

41Desa l i na t ion i n the GCC . The H i s tor y, the Present & the Fu ture
2
Plant Capacity Technology Units No. Commissioning year
MGPD m3/day
Sitra 25 113636 MSF 5 1975-1985
Ras Abujarjur 16.5 75000 RO 10 1984
Addur 10 45455 RO 8 1989
Alhid 90 409091 MSF+MED 4+10 2000-2005
Alba 7 31818 MED 4 2004
Hawar 0.01368 62 VC 2 1985
Addur PWC 48 218182 RO 2011
Total 196.51 893244
Operating Stations in Kingdom of Bahrain
42
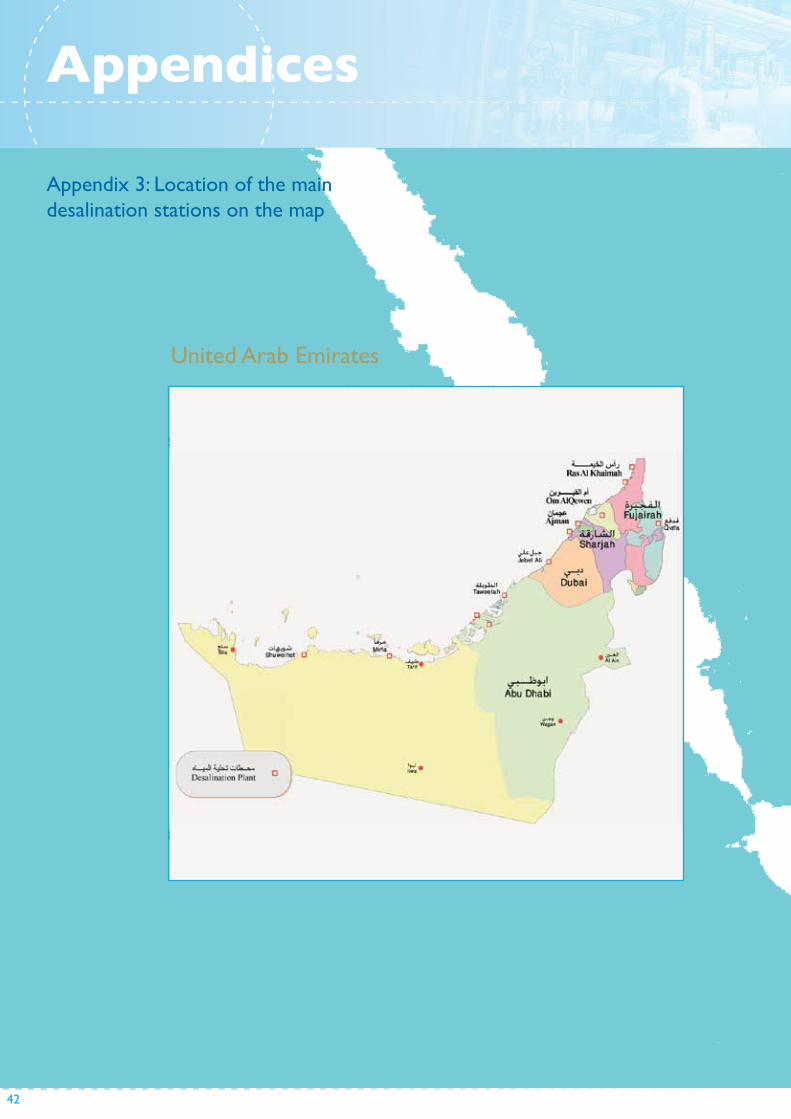
United Arab Emirates
Appendices
45
دولة اإلمارات العربية المتحدة
Appendix 3: Location of the main desalination stations on the map

43Desa l i na t ion i n the GCC . The H i s tor y, the Present & the Fu ture
3
Kingdom of Bahrain
46
مملكة البحرين
44
Appendices
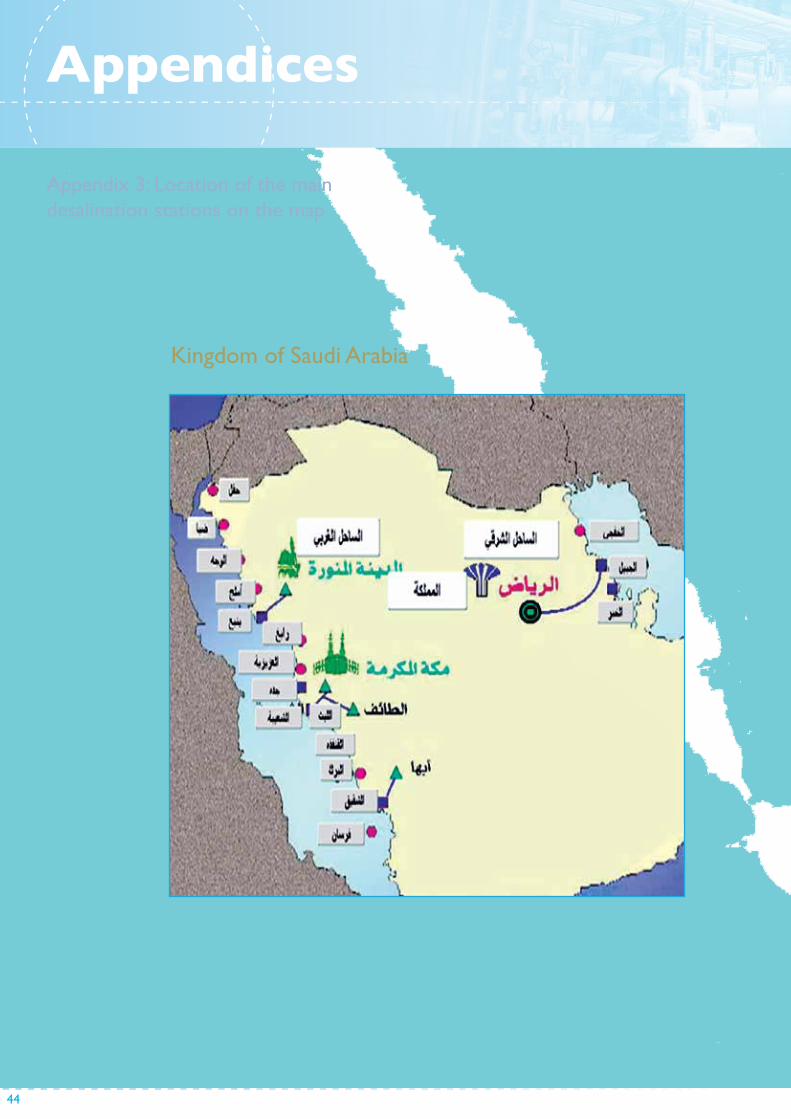
Kingdom of Saudi Arabia
Appendix 3: Location of the main desalination stations on the map

45Desa l i na t ion i n the GCC . The H i s tor y, the Present & the Fu ture
3
49
سلطنة عمان
Sultanate of Oman

46
Appendices
State of Qatar
Appendix 3: Location of the main desalination stations on the map

47Desa l i na t ion i n the GCC . The H i s tor y, the Present & the Fu ture
3
State of Kuwait