dependencies of surface condensation on the wettability
TRANSCRIPT

nanomaterials
Article
Dependencies of Surface Condensation on theWettability and Nanostructure Size Differences
Ming-Jun Liao and Li-Qiang Duan *
School of Energy, Power and Mechanical Engineering, National Thermal Power Engineering & TechnologyResearch Center Key Laboratory of Power Station Energy Transfer Conversion and System(North China Electric Power University), North China Electric Power University, Ministry of Education,Beijing 102206, China; [email protected]* Correspondence: [email protected]; Tel.: +86-1061-77-1443
Received: 26 August 2020; Accepted: 11 September 2020; Published: 14 September 2020�����������������
Abstract: When changing surface wettability and nanostructure size, condensation behavior displaysdistinct features. In this work, we investigated evaporation on a flat hydrophilic surface andcondensation on both hydrophilic and hydrophobic nanostructured surfaces at the nanoscale usingmolecular dynamics simulations. The simulation results on hydrophilic surfaces indicated that largergroove widths and heights produced more liquid argon atoms, a quicker temperature response,and slower potential energy decline. These three characteristics closely relate to condensation areasor rates, which are determined by groove width and height. For condensation heat transfer, when thegroove width was small, the change of groove height had little effect, while change of grooveheight caused a significant variation in the heat flux with a large groove width. When the coldwall was hydrophobic, the groove height became a significant impact factor, which caused no vaporatoms to condense in the groove with a larger height. The potential energy decreased with theincrease of the groove height, which demonstrates a completely opposing trend when compared withhydrophilic surfaces.
Keywords: condensation; hydrophilic surface; hydrophobic surface; nanostructure size
1. Introduction
Both evaporation and condensation are common phase-change phenomena in daily life [1].They are extensively used in various industrial fields, such as thermal management [2–6],heat pipes [7–9], cooling water harvesting [10–12], and electrical devices [13,14]. Changing the surface’swettability is important in these applications, because different applications need distinct wettabilitysurfaces. With the development of ultrafine manufacturing technology, the size of microelectronicdevices, such as the integrated circuits inside cellphones and laptops, are becoming smaller and smaller.Therefore, evaporation and condensation phenomena at the micronano scale have a large number ofapplications in many aspects, and have become a widespread concern. Studying the heat transfermechanism at the nanometer scale can help with the rapid miniaturization of electronic equipment.
Molecular dynamics (MD) as a numerical calculation method can exhibit the evolution of theinteraction between atoms in the system over time at the nanoscale. Groups have conducted studiesregarding heat transfer involving evaporation and condensation at the micronano scale. For example,Nagayama et al., [15] studied the effect of hydrophilic rectangular nanochannels on evaporationrate. They found that the presence of nanostructures reduced the surface thermal resistance andpromoted the increase of the evaporation rate of ultrathin liquid film. Gao [16] quantitatively recordedthe condensation process of water vapor on flat and pillar-structured surfaces. Further studiesregarding the effect of the wettability on condensation and the phenomenon of heat transfer are needed.
Nanomaterials 2020, 10, 1831; doi:10.3390/nano10091831 www.mdpi.com/journal/nanomaterials

Nanomaterials 2020, 10, 1831 2 of 11
Hasan [17] investigated the effects of wettability (hydrophilicity and hydrophobicity) and surfacematerials on the evaporation of thin liquids on flat plates. The results showed that the surface ofAl was the least effective in conducting heat, and Pt and Ag showed similar characteristics in bothwettability conditions. The hydrophilic surface was more conducive to heat transfer. Ou [18] simulatedthe condensation of water vapor molecules on a mica substrate. Due to the inhomogeneity of themica surface, the condensed liquid film was divided into two distinct adlayers, which illustratedthat different wettability surfaces caused significant differences in condensation. Niu [19] studiedcondensation heat transfer on flat surfaces with different wettabilities, and the results proved thatthe condensation efficiency of a hydrophilic surface was higher than that of a hydrophobic surface.Both [18,19] focused their attention on the influence of the wettability, and ignored the effect of themicrostructure. Hiratsuka [20] included three condensation modes by changing the interface wettabilityand microstructure height, i.e., drop, film, and discharge. Wang [21] demonstrated the combinedeffects of electric field strength and wettability on the condensation process. They found that thecondensation rate decreased with the increase of the electric field strength and the condensation heattransfer was enhanced when the surface was more hydrophilic. Therefore, MD simulations havereceived widespread attention, as they are regarded as a valid method to solve the problem of heattransfer at the nanoscale.
All these papers refer to studies of either only the process of evaporation, or only the processof condensation. However, many applications attempt to combine these two processes together,such as the cooling of microelectronics [22], water desalination [23], and medical therapy [24,25].Thus, triple-phase systems, which contain both evaporation and condensation, have received increasingattention. Recently, studies focused on a process with rapid boiling and condensing or evaporatingand condensing processes. Yu [26] used MD to simulate the evaporation and condensation process ofliquid argon in a cuboid composed of two platinum surfaces. Li [27] investigated evaporation andexplosive boiling on a hydrophilic surface at two temperatures (130 and 300 K). Evaporation is moreconducive to heat transfer, but explosive boiling will result in less heat for the phase change heattransfer. In addition, nanostructures promote condensation heat transfer, and the width of cuboidnanostructures will affect the condensation heat transfer. There exists a certain width to achieve the bestperformance of the condensation process. Yi [28] simulated the evaporation process of liquid argon filmon two temperature surfaces (150 and 300 K) and the condensation process after the wall temperaturedropped. They proved that the microevaporation process of the liquid film was consistent with that inthe macroprocess. Kuri [29] simulated evaporation and condensation in a confined nanospace boundby a nanostructure in three different configurations for two different wall superheats, which were setat 110 and 250 K. They compared the heat transportation from the hot wall to the cold wall at thesetwo heating temperatures with three nanostructured surfaces, and they demonstrated that the heattransportation was less in the case of explosive boiling (250 K) compared with normal evaporation(110 K). Liang [30] verified the Hertz–Knudsen Schrage equation by simulating the evaporation andcondensation of liquid argon on the surface of platinum. All these papers in this paragraph focused onthe dynamic movement of molecules and the influence of the heating temperature, and did not discussthe effect of wettability on condensation.
Despite suggestions about heat transfer that were proposed in previous articles, an indepth studyof the dynamic and thermal mechanisms regarding evaporation and condensation at the nanoscale isstill lacking. Therefore, in this paper, by performing molecular dynamic simulation, we investigatedevaporation on a flat hydrophilic surface and condensation on both hydrophilic and hydrophobicnanostructured surfaces at the nanoscale. The work is organized as follows: First, the simulationmodel and computational details are presented. Then, the effects of nanostructure size on hydrophilicand hydrophobic surfaces condensation are revealed. The results are further analyzed by snapshotsof the atom trajectories, the number of liquid atoms, temperature, potential energy, and heat flux.Finally, the findings obtained from this work are summarized.

Nanomaterials 2020, 10, 1831 3 of 11
2. Simulation Method
The molecular dynamics (MD) simulations were performed using the largescale atomic/molecularmassively parallel simulator (LAMMPS) package [31] to build a simulation system. The software ofOVITO (GmbH, Germany) was used to display the visual graphs of the system and the atomic motionand to analyze the MD simulation results. As shown in Figure 1 with perspective and front views,a solid flat plate made of copper was placed at the bottom of the system, which was the heat source.Argon as a working fluid was divided into two states of liquid and vapor and placed on the bottomplate and middle region, respectively. At the top of the system was a nanostructured plate also madeof copper, and this was the condensing wall. Face centered cubic (FCC) atoms were adopted to modelthe walls at two ends and the liquid/vapor working fluid with a lattice of 3.615, 5.744, and 36.251 Å.A periodic boundary condition was adopted in the x and y directions with sizes of 7.35 × 7.35 nm,whereas a rebound condition was applied in the z direction of 62.2 nm, which ensured that the totalenergy of the system did not change.
Nanomaterials 2020, 10, x FOR PEER REVIEW 3 of 11
2. Simulation Method
The molecular dynamics (MD) simulations were performed using the largescale atomic/molecular massively parallel simulator (LAMMPS) package [31] to build a simulation system. The software of OVITO (GmbH, Germany) was used to display the visual graphs of the system and the atomic motion and to analyze the MD simulation results. As shown in Figure 1 with perspective and front views, a solid flat plate made of copper was placed at the bottom of the system, which was the heat source. Argon as a working fluid was divided into two states of liquid and vapor and placed on the bottom plate and middle region, respectively. At the top of the system was a nanostructured plate also made of copper, and this was the condensing wall. Face centered cubic (FCC) atoms were adopted to model the walls at two ends and the liquid/vapor working fluid with a lattice of 3.615, 5.744, and 36.251 Å. A periodic boundary condition was adopted in the x and y directions with sizes of 7.35 × 7.35 nm, whereas a rebound condition was applied in the z direction of 62.2 nm, which ensured that the total energy of the system did not change.
Figure 1. Schematic diagram of the (a) perspective and (b) orthographic views of the simulation domain.
For the copper walls at the two ends of the system, the outermost two layers were defined as the fixed wall, to prevent the atoms flying away and plate deformation, and the remaining layers were treated as a thermostat with a heating temperature of 130 K and a cooling temperature of 85 K using the Nosé−Hoover thermostat [32,33]. For the liquid argon atoms, the film thickness was 3.6 nm with the number of 4739 atoms. For the dispersed vapor argons, they filled between the liquid film and the upper wall, with the number of 338 atoms. When the liquid layer was heated by the heat source, evaporation was triggered, and new vapor argons moved to the middle region to mix with the original ones. Finally, when the vapor argons arrived at the cold wall, condensation occurred. Here, the nanostructure grooves for vapor condensation had three different widths in the x-direction at 1.8, 2.4, and 3.2 nm, and for every width, three different heights of 0.8, 1.8, and 2.8 nm in the z-direction were constructed.
The interactions between Cu–Cu, Ar–Ar, and Cu–Ar are all described by Lennard-Jones 12−6 potentials with a cutoff distance of 11.9 Å, expressed as 𝑉 4𝜀 𝜎/𝑟 𝜎/𝑟 (1)
where rij is the distance between particles i and j (Å), ε is the minimum potential value (eV), and σ is the particle spacing when the potential is zero (Å). The method of adjusting ε to obtain the distinctive wettabilities is widely adopted in MD simulations [34–38]. Therefore, in this work, two kinds of wettability for the condensation were studied. When εCu-Ar is 0.0065 eV, it represents the hydrophilic
(a) (b)
condensed wall nanostructure
vapor argon
liquid argon heated wall
Figure 1. Schematic diagram of the (a) perspective and (b) orthographic views of the simulation domain.
For the copper walls at the two ends of the system, the outermost two layers were defined as thefixed wall, to prevent the atoms flying away and plate deformation, and the remaining layers weretreated as a thermostat with a heating temperature of 130 K and a cooling temperature of 85 K using theNosé−Hoover thermostat [32,33]. For the liquid argon atoms, the film thickness was 3.6 nm with thenumber of 4739 atoms. For the dispersed vapor argons, they filled between the liquid film and the upperwall, with the number of 338 atoms. When the liquid layer was heated by the heat source, evaporationwas triggered, and new vapor argons moved to the middle region to mix with the original ones. Finally,when the vapor argons arrived at the cold wall, condensation occurred. Here, the nanostructure groovesfor vapor condensation had three different widths in the x-direction at 1.8, 2.4, and 3.2 nm, and for everywidth, three different heights of 0.8, 1.8, and 2.8 nm in the z-direction were constructed.
The interactions between Cu–Cu, Ar–Ar, and Cu–Ar are all described by Lennard-Jones12−6 potentials with a cutoff distance of 11.9 Å, expressed as
Vi j = 4ε[(σ/r)12
− (σ/r)6]
(1)
where rij is the distance between particles i and j (Å), ε is the minimum potential value (eV), and σ isthe particle spacing when the potential is zero (Å). The method of adjusting ε to obtain the distinctivewettabilities is widely adopted in MD simulations [34–38]. Therefore, in this work, two kinds ofwettability for the condensation were studied. When εCu-Ar is 0.0065 eV, it represents the hydrophilicsurface, and when εCu-Ar is 0.0025 eV, it represents the hydrophobic surface. In addition, the heatedwall is hydrophilic with εCu-Ar = 0.0065 eV.

Nanomaterials 2020, 10, 1831 4 of 11
After preparation of the initial configurations and interaction force fields, three consequent stageswere performed. The first was the energy minimization, which used the conjugate gradient algorithm,with the potential energy and force stopping tolerance of 1.0 × 10⁻⁵ eV and 1.0 × 10⁻⁶ eV/Å, respectively,and the number of the steps was 10,000. Then, the system was equilibrated in a constant number ofatoms, volume, and temperature (NVT) ensemble at 85 K for 0.8 ns. At the end of this stage, the copperplate and argon atoms were all stable at the uniform temperature, and their energy maintained aconstant value. Therefore, during this stage, the system reached the steady state, preparing forevaporation and condensation in the next step. Thus, in the third stage, the temperature of the bottomcopper plate suddenly improved to 130 K to heat the liquid argon film. A constant number of atoms,volume, and energy (NVE) ensemble was applied to the liquid and vapor argon atoms to ensure thatthey only absorbed energy from the heated wall and released energy to the cold wall. The uppernanostructured plate was the same as the second stage with a constant temperature of 85 K. In the thirdstage, the system was run for 5 ns. Throughout the above three stages of simulations, the time stepwas set to the same value of 1 fs, and the velocity Verlet algorithm was used to solve the Newtonianmotion equations for each atom. The positions and velocities used in analysis in this work were storedand calculated every 1000 time steps.
3. Results and Discussion
3.1. Effect of the Nanostructure Size on Hydrophilic Surface Condensation
Figure 2 exhibits the trajectories of the atoms for the whole system, where the bottom flat plate wasset as the heat source, and the nanostructured plate with the groove width (w) of 1.8 nm and the height (h)of 0.8 and 2.8 nm was set as the cold source. As the temperature of the bottom plate improved to 130 K,the temperature difference between the copper and liquid argon atoms induced evaporation, which madenew vapor argon atoms move to the upper position. Due to the thickness of the liquid film at 3.6 nm,130 K could not reach its explosive boiling temperature. Thus, only the phenomenon of evaporation wasobserved, which was consistent with the conclusion in our previous paper [39]. The new heated vaporatoms with higher energy were more active, resulting in drastic collisions in the middle region. With theproceeding of evaporation, most liquid atoms were heated up. These active and high energy atomscontinuously transferred energy through the collision, promoting vapor atoms in the middle region tomove to the top plate. When they arrived at the nanostructured plate, they released the energy to the coldwall and finally condensed on it. Therefore, from the snapshots of Figure 2, we found that the liquid filmgradually moved from the bottom plate to the top plate. As the two plates were hydrophilic, there wasalways a layer of argon atoms on the top plate at 0 ns and bottom plate at 5 ns. The condensation wassimultaneously observed in the groove and the flat areas.
Nanomaterials 2020, 10, x FOR PEER REVIEW 4 of 11
surface, and when εCu-Ar is 0.0025 eV, it represents the hydrophobic surface. In addition, the heated wall is hydrophilic with εCu-Ar = 0.0065 eV.
After preparation of the initial configurations and interaction force fields, three consequent stages were performed. The first was the energy minimization, which used the conjugate gradient algorithm, with the potential energy and force stopping tolerance of 1.0 × 10⁻⁵ eV and 1.0 × 10⁻⁶ eV/Å, respectively, and the number of the steps was 10,000. Then, the system was equilibrated in a constant number of atoms, volume, and temperature (NVT) ensemble at 85 K for 0.8 ns. At the end of this stage, the copper plate and argon atoms were all stable at the uniform temperature, and their energy maintained a constant value. Therefore, during this stage, the system reached the steady state, preparing for evaporation and condensation in the next step. Thus, in the third stage, the temperature of the bottom copper plate suddenly improved to 130 K to heat the liquid argon film. A constant number of atoms, volume, and energy (NVE) ensemble was applied to the liquid and vapor argon atoms to ensure that they only absorbed energy from the heated wall and released energy to the cold wall. The upper nanostructured plate was the same as the second stage with a constant temperature of 85 K. In the third stage, the system was run for 5 ns. Throughout the above three stages of simulations, the time step was set to the same value of 1 fs, and the velocity Verlet algorithm was used to solve the Newtonian motion equations for each atom. The positions and velocities used in analysis in this work were stored and calculated every 1000 time steps.
3. Results and Discussion
3.1. Effect of the Nanostructure Size on Hydrophilic Surface Condensation
Figure 2 exhibits the trajectories of the atoms for the whole system, where the bottom flat plate was set as the heat source, and the nanostructured plate with the groove width (w) of 1.8 nm and the height (h) of 0.8 and 2.8 nm was set as the cold source. As the temperature of the bottom plate improved to 130 K, the temperature difference between the copper and liquid argon atoms induced evaporation, which made new vapor argon atoms move to the upper position. Due to the thickness of the liquid film at 3.6 nm, 130 K could not reach its explosive boiling temperature. Thus, only the phenomenon of evaporation was observed, which was consistent with the conclusion in our previous paper [39]. The new heated vapor atoms with higher energy were more active, resulting in drastic collisions in the middle region. With the proceeding of evaporation, most liquid atoms were heated up. These active and high energy atoms continuously transferred energy through the collision, promoting vapor atoms in the middle region to move to the top plate. When they arrived at the nanostructured plate, they released the energy to the cold wall and finally condensed on it. Therefore, from the snapshots of Figure 2, we found that the liquid film gradually moved from the bottom plate to the top plate. As the two plates were hydrophilic, there was always a layer of argon atoms on the top plate at 0 ns and bottom plate at 5 ns. The condensation was simultaneously observed in the groove and the flat areas.
(a) (b)
0 ns 1 ns 2 ns 3 ns 4 ns 5 ns 0 ns 1 ns 2 ns 3 ns 4 ns 5 ns
Figure 2. Snapshots of the atoms’ trajectories for nanostructures with a groove width of 1.8 nm andheight of (a) 0.8 nm and (b) 2.8 nm on hydrophilic surfaces.

Nanomaterials 2020, 10, 1831 5 of 11
From the snapshots of Figure 2, it was difficult to determine the effect of nanostructure size oncondensation. To quantitatively illustrate the influence of the distinctive groove heights and widths,the numbers of liquid argon atoms (N) were computed, as shown in Figure 3. For all the situations,the liquid atoms dramatically decreased before 2 ns, and then slowly increased in the remaining time.That was because, in the initial stage (<2 ns), evaporation was the dominant factor, which resulted inthe phase transition from liquid atoms contacting the heated wall, while, with the vapor atoms movingtowards the cold wall, condensation became the dominant factor in the later stage (>2 ns). Therefore,more vapor atoms condensed and even exceeded the number of vapor atoms from evaporation. On theother hand, due to the different dominant factors in these two stages, the influence of nanostructuresize in the initial stage was negligible. Thus, although the groove heights were different, the numbersof liquid atoms were nearly the same. However, for the condensation dominant part, the numberof liquid atoms had an obvious discrepancy. For these three groove widths, the number of liquidatoms with higher groove height (h = 2.8 nm) was always larger than that with a lower groove height(h = 0.8 nm). This is because a nanostructure with a higher groove height will have more condensationareas, and thus faster condensation leads to more liquid atoms. With the increase of groove width,we found that the differences between them were marginal. This indicated that width had little effect onthe number of liquid atoms compared to height. Thus, to achieve a more obvious condensation effect,adjusting the height of the nanostructure was more efficient than adjusting the width. The number ofliquid atoms affected the temperature of the argon atoms. Therefore, the effect of nanostructure size ontemperature of all the argon atoms is discussed in the next part.
By comparing both Figures 3 and 4, the trends of the curves were exactly opposite, which indicatedthat a larger number of liquid atoms induced a lower temperature, and, conversely, a smaller numberof liquid atoms caused a higher temperature. In fact, the variation of temperature was attributed tothe processes of both evaporation and condensation. When the heated source with 130 K suddenlyacted on the liquid film placed on it, the high temperature brought about the evaporation and theargon atoms were heated up immediately. Thus, the temperature dramatically increased in the initialstage. As the evaporated argon atoms moved towards to the cold wall and condensed on it, the coolingeffect came in to play, which made the temperature slightly decrease in the later stage. The reason forthese two stages having distinct rates of change was that only evaporation occurred in the first stage,while both condensation and evaporation took place in the second stage. At the final state, with mostvapor atoms finishing the condensation, the temperature was nearly equal to the initial temperature.For the influence of the groove height, a larger height brought more condensation area, which ledto faster condensation, finally inducing a significant temperature decline. From Figure 4, we foundthat a larger groove height (h = 2.8 nm) always contained the fastest decline and lowest temperature.The smaller groove height (h = 0.8 nm) exhibited the slowest decline. On the other hand, similar to thenumber of liquid atoms, the groove width difference also had little effect on the temperature (Figure 4).
Nanomaterials 2020, 10, x FOR PEER REVIEW 5 of 11
Figure 2. Snapshots of the atoms’ trajectories for nanostructures with a groove width of 1.8 nm and height of (a) 0.8 nm and (b) 2.8 nm on hydrophilic surfaces.
From the snapshots of Figure 2, it was difficult to determine the effect of nanostructure size on condensation. To quantitatively illustrate the influence of the distinctive groove heights and widths, the numbers of liquid argon atoms (N) were computed, as shown in Figure 3. For all the situations, the liquid atoms dramatically decreased before 2 ns, and then slowly increased in the remaining time. That was because, in the initial stage (<2 ns), evaporation was the dominant factor, which resulted in the phase transition from liquid atoms contacting the heated wall, while, with the vapor atoms moving towards the cold wall, condensation became the dominant factor in the later stage (>2 ns). Therefore, more vapor atoms condensed and even exceeded the number of vapor atoms from evaporation. On the other hand, due to the different dominant factors in these two stages, the influence of nanostructure size in the initial stage was negligible. Thus, although the groove heights were different, the numbers of liquid atoms were nearly the same. However, for the condensation dominant part, the number of liquid atoms had an obvious discrepancy. For these three groove widths, the number of liquid atoms with higher groove height (h = 2.8 nm) was always larger than that with a lower groove height (h = 0.8 nm). This is because a nanostructure with a higher groove height will have more condensation areas, and thus faster condensation leads to more liquid atoms. With the increase of groove width, we found that the differences between them were marginal. This indicated that width had little effect on the number of liquid atoms compared to height. Thus, to achieve a more obvious condensation effect, adjusting the height of the nanostructure was more efficient than adjusting the width. The number of liquid atoms affected the temperature of the argon atoms. Therefore, the effect of nanostructure size on temperature of all the argon atoms is discussed in the next part.
By comparing both Figures 3 and 4, the trends of the curves were exactly opposite, which indicated that a larger number of liquid atoms induced a lower temperature, and, conversely, a smaller number of liquid atoms caused a higher temperature. In fact, the variation of temperature was attributed to the processes of both evaporation and condensation. When the heated source with 130 K suddenly acted on the liquid film placed on it, the high temperature brought about the evaporation and the argon atoms were heated up immediately. Thus, the temperature dramatically increased in the initial stage. As the evaporated argon atoms moved towards to the cold wall and condensed on it, the cooling effect came in to play, which made the temperature slightly decrease in the later stage. The reason for these two stages having distinct rates of change was that only evaporation occurred in the first stage, while both condensation and evaporation took place in the second stage. At the final state, with most vapor atoms finishing the condensation, the temperature was nearly equal to the initial temperature. For the influence of the groove height, a larger height brought more condensation area, which led to faster condensation, finally inducing a significant temperature decline. From Figure 4, we found that a larger groove height (h = 2.8 nm) always contained the fastest decline and lowest temperature. The smaller groove height (h = 0.8 nm) exhibited the slowest decline. On the other hand, similar to the number of liquid atoms, the groove width difference also had little effect on the temperature (Figure 4).
Figure 3. The statistical number of liquid argon atoms with three groove heights; from left to right, the groove widths are (a) 1.8, (b) 2.4, and (c) 3.2 nm on hydrophilic surfaces.
0 1 2 3 4 5
1200
1500
1800
2100
2400
2700
t (ns)
h=0.8 nm h=1.8 nm h=2.8 nm
N
(a)
0 1 2 3 4 5
1200
1500
1800
2100
2400
2700 (b)
t (ns)
h=0.8 nm h=1.8 nm h=2.8 nm
N
0 1 2 3 4 5
1200
1500
1800
2100
2400
2700 (c) h=0.8 nm h=1.8 nm h=2.8 nm
N
t (ns)
Figure 3. The statistical number of liquid argon atoms with three groove heights; from left to right,the groove widths are (a) 1.8, (b) 2.4, and (c) 3.2 nm on hydrophilic surfaces.

Nanomaterials 2020, 10, 1831 6 of 11Nanomaterials 2020, 10, x FOR PEER REVIEW 6 of 11
Figure 4. The temperature of argon atoms with three groove heights; from left to right, the groove widths are (a) 1.8, (b) 2.4, and (c) 3.2 nm on hydrophilic surfaces.
For further investigation of the effect of nanostructures on condensation, we calculated the potential energy (E) between argon atoms and the cold wall (Figure 5). Fundamentally speaking, the vapor atoms condensed on the cold wall were determined by the attractive potential energy between the atoms and the substrate. The situation of condensation and the liquid atom numbers on nanostructured surfaces were influenced by the potential energy. Therefore, the values of the potential energy and its changes were the basic reasons for the variations of the other indicators (the number of liquid atoms, the temperature, and the heat flux). In particular, for studies on the nanoscale, the interaction between molecules becomes more significant. The specific phenomenon, processes, and results are all dominated by potential energy. Therefore, the effect of the potential energy is significant. In general, potential energy shows a trend of gradually increasing and then remaining basically unchanged over time, no matter what the geometric parameters of the nanostructure are. That is because the vapor atoms gradually arrive at a cold wall and condense on it, inducing the number of absorbed atoms to be larger. Thus, the attractive potential increases with the more liquid atoms on the cold nanostructured plate. When the groove and flat surfaces are both covered by argon atoms, the potential energy will not continue to increase as before. Even if the vapor atoms sequentially condense, because the distance between the condensed atoms and the cold wall is too large, the attractive potential is basically negligible. With the increase of the groove height, the time it takes to achieve full coverage of the surface also increases. Therefore, from the three curves in Figure 5, we found that the potential energy reached stability more slowly if the groove height was larger. Similarly, when the groove width increased, the time also increased. By comparing these three graphs, we made these conclusions.
Figure 5. The potential energy between argon atoms and the cold wall with three groove heights and widths of (a) 1.8, (b) 2.4, and (c) 3.2 nm on hydrophilic surfaces.
Figure 6 demonstrates the condensation heat transfer on distinctive nanostructured surfaces by calculating the heat flux (H) at the region near the cold wall by 1 nm. As the vapor atoms with high temperature condensed on the cold wall to release heat, the heat flux began to decrease in the initial stage. When the statistical region was covered by argon liquid atoms, this area began to absorb heat through those atoms that continued to condense on the upper part of the liquid film. Thus, the heat flux exhibited an increasing trend in the second stage. For a small groove width (Figure 6a), only if the height was large enough (2.8 nm), did the heat flux show an obvious distinction compared with other two heights. With the increase of the groove width (Figure 6a,b), the difference between larger
0 1 2 3 4 5
-150
-135
-120
-105
-90
h=0.8 nm h=1.8 nm h=2.8 nm
E (e
v)
t (ns)
(a)
0 1 2 3 4 5
-150
-135
-120
-105
-90 (b)
t (ns)
E (e
v)
h=0.8 nm h=1.8 nm h=2.8 nm
0 1 2 3 4 5
-150
-135
-120
-105
-90 (c)
t (ns)
E (e
v)
h=0.8 nm h=1.8 nm h=2.8 nm
0 1 2 3 4 5
80
90
100
110
h=0.8 nm h=1.8 nm h=2.8 nm
(c)
t (ns)
T (K
)
0 1 2 3 4 5
80
90
100
110(b)
t (ns)
T (K
)
h=0.8 nm h=1.8 nm h=2.8 nm
0 1 2 3 4 5
80
90
100
110(a)
h=0.8 nm h=1.8 nm h=2.8 nm
T (K
)
t (ns)
Figure 4. The temperature of argon atoms with three groove heights; from left to right, the groovewidths are (a) 1.8, (b) 2.4, and (c) 3.2 nm on hydrophilic surfaces.
For further investigation of the effect of nanostructures on condensation, we calculated thepotential energy (E) between argon atoms and the cold wall (Figure 5). Fundamentally speaking,the vapor atoms condensed on the cold wall were determined by the attractive potential energybetween the atoms and the substrate. The situation of condensation and the liquid atom numberson nanostructured surfaces were influenced by the potential energy. Therefore, the values of thepotential energy and its changes were the basic reasons for the variations of the other indicators(the number of liquid atoms, the temperature, and the heat flux). In particular, for studies on thenanoscale, the interaction between molecules becomes more significant. The specific phenomenon,processes, and results are all dominated by potential energy. Therefore, the effect of the potential energyis significant. In general, potential energy shows a trend of gradually increasing and then remainingbasically unchanged over time, no matter what the geometric parameters of the nanostructure are.That is because the vapor atoms gradually arrive at a cold wall and condense on it, inducing thenumber of absorbed atoms to be larger. Thus, the attractive potential increases with the more liquidatoms on the cold nanostructured plate. When the groove and flat surfaces are both covered byargon atoms, the potential energy will not continue to increase as before. Even if the vapor atomssequentially condense, because the distance between the condensed atoms and the cold wall is toolarge, the attractive potential is basically negligible. With the increase of the groove height, the timeit takes to achieve full coverage of the surface also increases. Therefore, from the three curves inFigure 5, we found that the potential energy reached stability more slowly if the groove height waslarger. Similarly, when the groove width increased, the time also increased. By comparing these threegraphs, we made these conclusions.
Nanomaterials 2020, 10, x FOR PEER REVIEW 6 of 11
Figure 4. The temperature of argon atoms with three groove heights; from left to right, the groove widths are (a) 1.8, (b) 2.4, and (c) 3.2 nm on hydrophilic surfaces.
For further investigation of the effect of nanostructures on condensation, we calculated the potential energy (E) between argon atoms and the cold wall (Figure 5). Fundamentally speaking, the vapor atoms condensed on the cold wall were determined by the attractive potential energy between the atoms and the substrate. The situation of condensation and the liquid atom numbers on nanostructured surfaces were influenced by the potential energy. Therefore, the values of the potential energy and its changes were the basic reasons for the variations of the other indicators (the number of liquid atoms, the temperature, and the heat flux). In particular, for studies on the nanoscale, the interaction between molecules becomes more significant. The specific phenomenon, processes, and results are all dominated by potential energy. Therefore, the effect of the potential energy is significant. In general, potential energy shows a trend of gradually increasing and then remaining basically unchanged over time, no matter what the geometric parameters of the nanostructure are. That is because the vapor atoms gradually arrive at a cold wall and condense on it, inducing the number of absorbed atoms to be larger. Thus, the attractive potential increases with the more liquid atoms on the cold nanostructured plate. When the groove and flat surfaces are both covered by argon atoms, the potential energy will not continue to increase as before. Even if the vapor atoms sequentially condense, because the distance between the condensed atoms and the cold wall is too large, the attractive potential is basically negligible. With the increase of the groove height, the time it takes to achieve full coverage of the surface also increases. Therefore, from the three curves in Figure 5, we found that the potential energy reached stability more slowly if the groove height was larger. Similarly, when the groove width increased, the time also increased. By comparing these three graphs, we made these conclusions.
Figure 5. The potential energy between argon atoms and the cold wall with three groove heights and widths of (a) 1.8, (b) 2.4, and (c) 3.2 nm on hydrophilic surfaces.
Figure 6 demonstrates the condensation heat transfer on distinctive nanostructured surfaces by calculating the heat flux (H) at the region near the cold wall by 1 nm. As the vapor atoms with high temperature condensed on the cold wall to release heat, the heat flux began to decrease in the initial stage. When the statistical region was covered by argon liquid atoms, this area began to absorb heat through those atoms that continued to condense on the upper part of the liquid film. Thus, the heat flux exhibited an increasing trend in the second stage. For a small groove width (Figure 6a), only if the height was large enough (2.8 nm), did the heat flux show an obvious distinction compared with other two heights. With the increase of the groove width (Figure 6a,b), the difference between larger
0 1 2 3 4 5
-150
-135
-120
-105
-90
h=0.8 nm h=1.8 nm h=2.8 nm
E (e
v)
t (ns)
(a)
0 1 2 3 4 5
-150
-135
-120
-105
-90 (b)
t (ns)
E (e
v)
h=0.8 nm h=1.8 nm h=2.8 nm
0 1 2 3 4 5
-150
-135
-120
-105
-90 (c)
t (ns)
E (e
v)
h=0.8 nm h=1.8 nm h=2.8 nm
0 1 2 3 4 5
80
90
100
110
h=0.8 nm h=1.8 nm h=2.8 nm
(c)
t (ns)
T (K
)
0 1 2 3 4 5
80
90
100
110(b)
t (ns)
T (K
)
h=0.8 nm h=1.8 nm h=2.8 nm
0 1 2 3 4 5
80
90
100
110(a)
h=0.8 nm h=1.8 nm h=2.8 nm
T (K
)
t (ns)
Figure 5. The potential energy between argon atoms and the cold wall with three groove heights andwidths of (a) 1.8, (b) 2.4, and (c) 3.2 nm on hydrophilic surfaces.
Figure 6 demonstrates the condensation heat transfer on distinctive nanostructured surfaces bycalculating the heat flux (H) at the region near the cold wall by 1 nm. As the vapor atoms with hightemperature condensed on the cold wall to release heat, the heat flux began to decrease in the initialstage. When the statistical region was covered by argon liquid atoms, this area began to absorb heatthrough those atoms that continued to condense on the upper part of the liquid film. Thus, the heatflux exhibited an increasing trend in the second stage. For a small groove width (Figure 6a), only ifthe height was large enough (2.8 nm), did the heat flux show an obvious distinction compared withother two heights. With the increase of the groove width (Figure 6a,b), the difference between larger
Nanomaterials 2020, 10, 1831 7 of 11
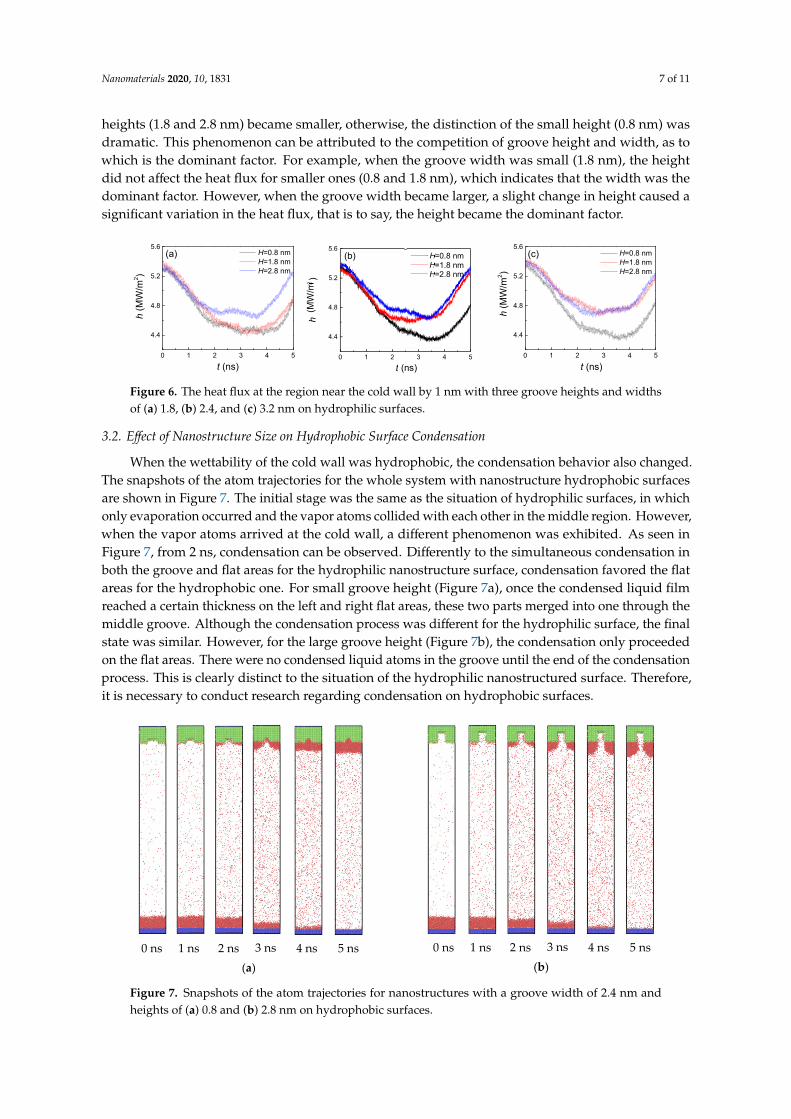
heights (1.8 and 2.8 nm) became smaller, otherwise, the distinction of the small height (0.8 nm) wasdramatic. This phenomenon can be attributed to the competition of groove height and width, as towhich is the dominant factor. For example, when the groove width was small (1.8 nm), the heightdid not affect the heat flux for smaller ones (0.8 and 1.8 nm), which indicates that the width was thedominant factor. However, when the groove width became larger, a slight change in height caused asignificant variation in the heat flux, that is to say, the height became the dominant factor.
Nanomaterials 2020, 10, x FOR PEER REVIEW 7 of 11
heights (1.8 and 2.8 nm) became smaller, otherwise, the distinction of the small height (0.8 nm) was dramatic. This phenomenon can be attributed to the competition of groove height and width, as to which is the dominant factor. For example, when the groove width was small (1.8 nm), the height did not affect the heat flux for smaller ones (0.8 and 1.8 nm), which indicates that the width was the dominant factor. However, when the groove width became larger, a slight change in height caused a significant variation in the heat flux, that is to say, the height became the dominant factor.
Figure 6. The heat flux at the region near the cold wall by 1 nm with three groove heights and widths of (a) 1.8, (b) 2.4, and (c) 3.2 nm on hydrophilic surfaces.
3.2. Effect of Nanostructure Size on Hydrophobic Surface Condensation When the wettability of the cold wall was hydrophobic, the condensation behavior also changed.
The snapshots of the atom trajectories for the whole system with nanostructure hydrophobic surfaces are shown in Figure 7. The initial stage was the same as the situation of hydrophilic surfaces, in which only evaporation occurred and the vapor atoms collided with each other in the middle region. However, when the vapor atoms arrived at the cold wall, a different phenomenon was exhibited. As seen in Figure 7, from 2 ns, condensation can be observed. Differently to the simultaneous condensation in both the groove and flat areas for the hydrophilic nanostructure surface, condensation favored the flat areas for the hydrophobic one. For small groove height (Figure 7a), once the condensed liquid film reached a certain thickness on the left and right flat areas, these two parts merged into one through the middle groove. Although the condensation process was different for the hydrophilic surface, the final state was similar. However, for the large groove height (Figure 7b), the condensation only proceeded on the flat areas. There were no condensed liquid atoms in the groove until the end of the condensation process. This is clearly distinct to the situation of the hydrophilic nanostructured surface. Therefore, it is necessary to conduct research regarding condensation on hydrophobic surfaces.
Figure 7. Snapshots of the atom trajectories for nanostructures with a groove width of 2.4 nm and heights of (a) 0.8 and (b) 2.8 nm on hydrophobic surfaces.
(b) 0 ns 1 ns 2 ns 3 ns 4 ns 5 ns
(a) 0 ns 1 ns 2 ns 3 ns 4 ns 5 ns
0 1 2 3 4 5
4.4
4.8
5.2
5.6(a)
h (M
W/m
2 )
t (ns)
H=0.8 nm H=1.8 nm H=2.8 nm
0 1 2 3 4 5
4.4
4.8
5.2
5.6(c)
t (ns)
h (M
W/m
2 )
H=0.8 nm H=1.8 nm H=2.8 nm
0 1 2 3 4 5 4.4
4.8
5.2
5.6 (b)
h (M
W/m
2 )
H =0.8 nm H=1.8 nm H=2.8 nm
t (ns)
Figure 6. The heat flux at the region near the cold wall by 1 nm with three groove heights and widthsof (a) 1.8, (b) 2.4, and (c) 3.2 nm on hydrophilic surfaces.
3.2. Effect of Nanostructure Size on Hydrophobic Surface Condensation
When the wettability of the cold wall was hydrophobic, the condensation behavior also changed.The snapshots of the atom trajectories for the whole system with nanostructure hydrophobic surfacesare shown in Figure 7. The initial stage was the same as the situation of hydrophilic surfaces, in whichonly evaporation occurred and the vapor atoms collided with each other in the middle region. However,when the vapor atoms arrived at the cold wall, a different phenomenon was exhibited. As seen inFigure 7, from 2 ns, condensation can be observed. Differently to the simultaneous condensation inboth the groove and flat areas for the hydrophilic nanostructure surface, condensation favored the flatareas for the hydrophobic one. For small groove height (Figure 7a), once the condensed liquid filmreached a certain thickness on the left and right flat areas, these two parts merged into one through themiddle groove. Although the condensation process was different for the hydrophilic surface, the finalstate was similar. However, for the large groove height (Figure 7b), the condensation only proceededon the flat areas. There were no condensed liquid atoms in the groove until the end of the condensationprocess. This is clearly distinct to the situation of the hydrophilic nanostructured surface. Therefore,it is necessary to conduct research regarding condensation on hydrophobic surfaces.
Nanomaterials 2020, 10, x FOR PEER REVIEW 7 of 11
heights (1.8 and 2.8 nm) became smaller, otherwise, the distinction of the small height (0.8 nm) was dramatic. This phenomenon can be attributed to the competition of groove height and width, as to which is the dominant factor. For example, when the groove width was small (1.8 nm), the height did not affect the heat flux for smaller ones (0.8 and 1.8 nm), which indicates that the width was the dominant factor. However, when the groove width became larger, a slight change in height caused a significant variation in the heat flux, that is to say, the height became the dominant factor.
Figure 6. The heat flux at the region near the cold wall by 1 nm with three groove heights and widths of (a) 1.8, (b) 2.4, and (c) 3.2 nm on hydrophilic surfaces.
3.2. Effect of Nanostructure Size on Hydrophobic Surface Condensation When the wettability of the cold wall was hydrophobic, the condensation behavior also changed.
The snapshots of the atom trajectories for the whole system with nanostructure hydrophobic surfaces are shown in Figure 7. The initial stage was the same as the situation of hydrophilic surfaces, in which only evaporation occurred and the vapor atoms collided with each other in the middle region. However, when the vapor atoms arrived at the cold wall, a different phenomenon was exhibited. As seen in Figure 7, from 2 ns, condensation can be observed. Differently to the simultaneous condensation in both the groove and flat areas for the hydrophilic nanostructure surface, condensation favored the flat areas for the hydrophobic one. For small groove height (Figure 7a), once the condensed liquid film reached a certain thickness on the left and right flat areas, these two parts merged into one through the middle groove. Although the condensation process was different for the hydrophilic surface, the final state was similar. However, for the large groove height (Figure 7b), the condensation only proceeded on the flat areas. There were no condensed liquid atoms in the groove until the end of the condensation process. This is clearly distinct to the situation of the hydrophilic nanostructured surface. Therefore, it is necessary to conduct research regarding condensation on hydrophobic surfaces.
Figure 7. Snapshots of the atom trajectories for nanostructures with a groove width of 2.4 nm and heights of (a) 0.8 and (b) 2.8 nm on hydrophobic surfaces.
(b) 0 ns 1 ns 2 ns 3 ns 4 ns 5 ns
(a) 0 ns 1 ns 2 ns 3 ns 4 ns 5 ns
0 1 2 3 4 5
4.4
4.8
5.2
5.6(a)
h (M
W/m
2 )
t (ns)
H=0.8 nm H=1.8 nm H=2.8 nm
0 1 2 3 4 5
4.4
4.8
5.2
5.6(a)
h (M
W/m
2 )
H=0.8 nm H=1.8 nm H=2.8 nm
t (ns)0 1 2 3 4 5
4.4
4.8
5.2
5.6(c)
t (ns)
h (M
W/m
2 )
H=0.8 nm H=1.8 nm H=2.8 nm(b)
Figure 7. Snapshots of the atom trajectories for nanostructures with a groove width of 2.4 nm andheights of (a) 0.8 and (b) 2.8 nm on hydrophobic surfaces.
Nanomaterials 2020, 10, 1831 8 of 11
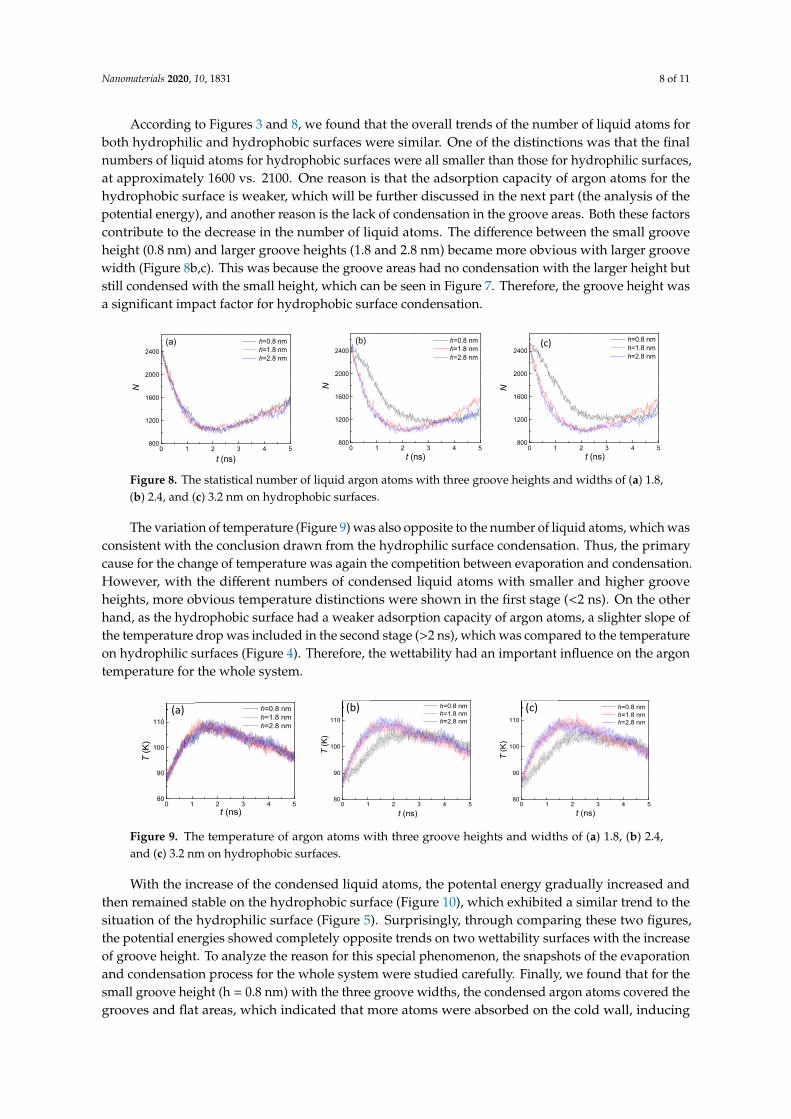
According to Figures 3 and 8, we found that the overall trends of the number of liquid atoms forboth hydrophilic and hydrophobic surfaces were similar. One of the distinctions was that the finalnumbers of liquid atoms for hydrophobic surfaces were all smaller than those for hydrophilic surfaces,at approximately 1600 vs. 2100. One reason is that the adsorption capacity of argon atoms for thehydrophobic surface is weaker, which will be further discussed in the next part (the analysis of thepotential energy), and another reason is the lack of condensation in the groove areas. Both these factorscontribute to the decrease in the number of liquid atoms. The difference between the small grooveheight (0.8 nm) and larger groove heights (1.8 and 2.8 nm) became more obvious with larger groovewidth (Figure 8b,c). This was because the groove areas had no condensation with the larger height butstill condensed with the small height, which can be seen in Figure 7. Therefore, the groove height wasa significant impact factor for hydrophobic surface condensation.
Nanomaterials 2020, 10, x FOR PEER REVIEW 8 of 11
According to Figures 3 and 8, we found that the overall trends of the number of liquid atoms for both hydrophilic and hydrophobic surfaces were similar. One of the distinctions was that the final numbers of liquid atoms for hydrophobic surfaces were all smaller than those for hydrophilic surfaces, at approximately 1600 vs. 2100. One reason is that the adsorption capacity of argon atoms for the hydrophobic surface is weaker, which will be further discussed in the next part (the analysis of the potential energy), and another reason is the lack of condensation in the groove areas. Both these factors contribute to the decrease in the number of liquid atoms. The difference between the small groove height (0.8 nm) and larger groove heights (1.8 and 2.8 nm) became more obvious with larger groove width (Figure 8b,c). This was because the groove areas had no condensation with the larger height but still condensed with the small height, which can be seen in Figure 7. Therefore, the groove height was a significant impact factor for hydrophobic surface condensation.
Figure 8. The statistical number of liquid argon atoms with three groove heights and widths of (a) 1.8, (b) 2.4, and (c) 3.2 nm on hydrophobic surfaces.
The variation of temperature (Figure 9) was also opposite to the number of liquid atoms, which was consistent with the conclusion drawn from the hydrophilic surface condensation. Thus, the primary cause for the change of temperature was again the competition between evaporation and condensation. However, with the different numbers of condensed liquid atoms with smaller and higher groove heights, more obvious temperature distinctions were shown in the first stage (<2 ns). On the other hand, as the hydrophobic surface had a weaker adsorption capacity of argon atoms, a slighter slope of the temperature drop was included in the second stage (>2 ns), which was compared to the temperature on hydrophilic surfaces (Figure 4). Therefore, the wettability had an important influence on the argon temperature for the whole system.
Figure 9. The temperature of argon atoms with three groove heights and widths of (a) 1.8, (b) 2.4, and (c) 3.2 nm on hydrophobic surfaces.
With the increase of the condensed liquid atoms, the potental energy gradually increased and then remained stable on the hydrophobic surface (Figure 10), which exhibited a similar trend to the situation of the hydrophilic surface (Figure 5). Surprisingly, through comparing these two figures, the potential energies showed completely opposite trends on two wettability surfaces with the increase of groove height. To analyze the reason for this special phenomenon, the snapshots of the evaporation and condensation process for the whole system were studied carefully. Finally, we found that for the small groove height (h = 0.8 nm) with the three groove widths, the condensed argon atoms covered the grooves and flat areas, which indicated that more atoms were absorbed on the cold wall,
0 1 2 3 4 580
90
100
110
h=0.8 nm h=1.8 nm h=2.8 nm
t (ns)
T (K
)
0 1 2 3 4 580
90
100
110
t (ns)
T (K
)
h=0.8 nm h=1.8 nm h=2.8 nm
0 1 2 3 4 580
90
100
110
t (ns)
T (K
)
h=0.8 nm h=1.8 nm h=2.8 nm
(a) (b) (c)
0 1 2 3 4 5800
1200
1600
2000
2400(a) h=0.8 nm
h=1.8 nm h=2.8 nm
N
t (ns)0 1 2 3 4 5
800
1200
1600
2000
2400(b)
h=0.8 nm h=1.8 nm h=2.8 nm
t (ns)
N
0 1 2 3 4 5800
1200
1600
2000
2400
t (ns)
h=0.8 nm h=1.8 nm h=2.8 nm
N
(c)
Figure 8. The statistical number of liquid argon atoms with three groove heights and widths of (a) 1.8,(b) 2.4, and (c) 3.2 nm on hydrophobic surfaces.
The variation of temperature (Figure 9) was also opposite to the number of liquid atoms, which wasconsistent with the conclusion drawn from the hydrophilic surface condensation. Thus, the primarycause for the change of temperature was again the competition between evaporation and condensation.However, with the different numbers of condensed liquid atoms with smaller and higher grooveheights, more obvious temperature distinctions were shown in the first stage (<2 ns). On the otherhand, as the hydrophobic surface had a weaker adsorption capacity of argon atoms, a slighter slope ofthe temperature drop was included in the second stage (>2 ns), which was compared to the temperatureon hydrophilic surfaces (Figure 4). Therefore, the wettability had an important influence on the argontemperature for the whole system.
Nanomaterials 2020, 10, x FOR PEER REVIEW 8 of 11
According to Figures 3 and 8, we found that the overall trends of the number of liquid atoms for both hydrophilic and hydrophobic surfaces were similar. One of the distinctions was that the final numbers of liquid atoms for hydrophobic surfaces were all smaller than those for hydrophilic surfaces, at approximately 1600 vs. 2100. One reason is that the adsorption capacity of argon atoms for the hydrophobic surface is weaker, which will be further discussed in the next part (the analysis of the potential energy), and another reason is the lack of condensation in the groove areas. Both these factors contribute to the decrease in the number of liquid atoms. The difference between the small groove height (0.8 nm) and larger groove heights (1.8 and 2.8 nm) became more obvious with larger groove width (Figure 8b,c). This was because the groove areas had no condensation with the larger height but still condensed with the small height, which can be seen in Figure 7. Therefore, the groove height was a significant impact factor for hydrophobic surface condensation.
Figure 8. The statistical number of liquid argon atoms with three groove heights and widths of (a) 1.8, (b) 2.4, and (c) 3.2 nm on hydrophobic surfaces.
The variation of temperature (Figure 9) was also opposite to the number of liquid atoms, which was consistent with the conclusion drawn from the hydrophilic surface condensation. Thus, the primary cause for the change of temperature was again the competition between evaporation and condensation. However, with the different numbers of condensed liquid atoms with smaller and higher groove heights, more obvious temperature distinctions were shown in the first stage (<2 ns). On the other hand, as the hydrophobic surface had a weaker adsorption capacity of argon atoms, a slighter slope of the temperature drop was included in the second stage (>2 ns), which was compared to the temperature on hydrophilic surfaces (Figure 4). Therefore, the wettability had an important influence on the argon temperature for the whole system.
Figure 9. The temperature of argon atoms with three groove heights and widths of (a) 1.8, (b) 2.4, and (c) 3.2 nm on hydrophobic surfaces.
With the increase of the condensed liquid atoms, the potental energy gradually increased and then remained stable on the hydrophobic surface (Figure 10), which exhibited a similar trend to the situation of the hydrophilic surface (Figure 5). Surprisingly, through comparing these two figures, the potential energies showed completely opposite trends on two wettability surfaces with the increase of groove height. To analyze the reason for this special phenomenon, the snapshots of the evaporation and condensation process for the whole system were studied carefully. Finally, we found that for the small groove height (h = 0.8 nm) with the three groove widths, the condensed argon atoms covered the grooves and flat areas, which indicated that more atoms were absorbed on the cold wall,
0 1 2 3 4 580
90
100
110
h=0.8 nm h=1.8 nm h=2.8 nm
t (ns)
T (K
)
0 1 2 3 4 580
90
100
110
t (ns)
T (K
)
h=0.8 nm h=1.8 nm h=2.8 nm
0 1 2 3 4 580
90
100
110
t (ns)
T (K
)
h=0.8 nm h=1.8 nm h=2.8 nm
(a) (b) (c)
0 1 2 3 4 5800
1200
1600
2000
2400(a) h=0.8 nm
h=1.8 nm h=2.8 nm
N
t (ns)0 1 2 3 4 5
800
1200
1600
2000
2400(b)
h=0.8 nm h=1.8 nm h=2.8 nm
t (ns)
N
0 1 2 3 4 5800
1200
1600
2000
2400
t (ns)
h=0.8 nm h=1.8 nm h=2.8 nm
N
(c)
Figure 9. The temperature of argon atoms with three groove heights and widths of (a) 1.8, (b) 2.4,and (c) 3.2 nm on hydrophobic surfaces.
With the increase of the condensed liquid atoms, the potental energy gradually increased andthen remained stable on the hydrophobic surface (Figure 10), which exhibited a similar trend to thesituation of the hydrophilic surface (Figure 5). Surprisingly, through comparing these two figures,the potential energies showed completely opposite trends on two wettability surfaces with the increaseof groove height. To analyze the reason for this special phenomenon, the snapshots of the evaporationand condensation process for the whole system were studied carefully. Finally, we found that for thesmall groove height (h = 0.8 nm) with the three groove widths, the condensed argon atoms covered thegrooves and flat areas, which indicated that more atoms were absorbed on the cold wall, inducing

Nanomaterials 2020, 10, 1831 9 of 11
a higher attractive potential. With the increase of the groove height, the condensed atoms in thegroove areas were decreased, and no condensation was observed for the height of 2.8 nm. Therefore,the potential energy decreased with the increase of the groove height.
Nanomaterials 2020, 10, x FOR PEER REVIEW 9 of 11
inducing a higher attractive potential. With the increase of the groove height, the condensed atoms in the groove areas were decreased, and no condensation was observed for the height of 2.8 nm. Therefore, the potential energy decreased with the increase of the groove height.
Figure 10. The potential energy between argon atoms and the cold wall with three groove heights and widths of (a) 1.8, (b) 2.4, and (c) 3.2 nm on hydrophobic surfaces.
4. Conclusions
We investigated evaporation on a flat hydrophilic surface and condensation on both hydrophilic and hydrophobic nanostructured surfaces at the nanoscale using a molecular dynamics simulation. Copper was chosen as the heat and cold source. Liquid and vapor argon atoms as the media of heat transfer were used to fill between these two walls. Eighteen types of cases (including nine on two wettability surfaces) were designed on the cold wall to study the influence of wettability and nanostructure size on condensation. The snapshots of the system, number of liquid atoms, argon temperature, potential energy, and heat flux were exhibited and analyzed.
The simulation results on hydrophilic surfaces indicated that the whole process could be divided into two stages with 2 ns as the boundary. Throughout the research period, both the evaporation and condensation processes affected the number of liquid atoms and argon temperature, and determining which process had become the dominant factor was crucial to the system. The larger groove width and height increased the condensation area, inducing more liquid atoms and a quicker temperature response. With the increase of the groove height and width, the potential energy reached stability more slowly. For the condensation heat transfer, when the groove width was small, the change of groove height had little effect, while still causing a significant variation in the heat flux with a large groove width. Compared to previous similar studies, this was the first study to combine the variation of height and width of the nanostructure to investigate the effect on condensation heat transfer. For the hydrophilic nanostructured surface, both the height and width affected the condensation heat transfer.
If the cold wall became hydrophobic, the condensation behavior also changed. One of the strongest distinctions was that the groove height became a significant impact factor, which caused no condensation with a larger height. As the adsorption capacity of argon atoms for a hydrophobic surface is weaker, this also provides new findings and conclusions. The final numbers of liquid atoms for hydrophobic surfaces were all smaller than those for hydrophilic surfaces. The difference between the small groove height and larger groove height became more obvious with a larger groove width. More clear temperature distinctions were shown in the first stage (<2 ns), and a slighter slope of temperature drop occurred in the second stage (>2 ns), when compared to the temperatures with hydrophilic surfaces. The potential energies decreased with the increase of the groove height, which showed completely opposing trends compared with those on hydrophilic surfaces. As far as we know, there are no previous studies on condensation on hydrophobic nanostructured surfaces. Therefore, this investigation has significant potential for industrial applications. To better apply this research in practice, we will expand the surface from a single groove to a series of microstructures in our future work.
(a)
0 1 2 3 4 5
-135
-120
-105
-90
t (ns)
E (e
v)
h=0.8 nm h=1.8 nm h=2.8 nm
0 1 2 3 4 5
-135
-120
-105
-90
h=0.8 nm h=1.8 nm h=2.8 nm
t (ns)
E (e
v)0 1 2 3 4 5
-135
-120
-105
-90 h=0.8 nm h=1.8 nm h=2.8 nm
t (ns)
E (e
v)
(b) (c)
Figure 10. The potential energy between argon atoms and the cold wall with three groove heights andwidths of (a) 1.8, (b) 2.4, and (c) 3.2 nm on hydrophobic surfaces.
4. Conclusions
We investigated evaporation on a flat hydrophilic surface and condensation on both hydrophilicand hydrophobic nanostructured surfaces at the nanoscale using a molecular dynamics simulation.Copper was chosen as the heat and cold source. Liquid and vapor argon atoms as the media ofheat transfer were used to fill between these two walls. Eighteen types of cases (including nine ontwo wettability surfaces) were designed on the cold wall to study the influence of wettability andnanostructure size on condensation. The snapshots of the system, number of liquid atoms, argontemperature, potential energy, and heat flux were exhibited and analyzed.
The simulation results on hydrophilic surfaces indicated that the whole process could be dividedinto two stages with 2 ns as the boundary. Throughout the research period, both the evaporation andcondensation processes affected the number of liquid atoms and argon temperature, and determiningwhich process had become the dominant factor was crucial to the system. The larger groove widthand height increased the condensation area, inducing more liquid atoms and a quicker temperatureresponse. With the increase of the groove height and width, the potential energy reached stabilitymore slowly. For the condensation heat transfer, when the groove width was small, the change ofgroove height had little effect, while still causing a significant variation in the heat flux with a largegroove width. Compared to previous similar studies, this was the first study to combine the variationof height and width of the nanostructure to investigate the effect on condensation heat transfer. For thehydrophilic nanostructured surface, both the height and width affected the condensation heat transfer.
If the cold wall became hydrophobic, the condensation behavior also changed. One of thestrongest distinctions was that the groove height became a significant impact factor, which causedno condensation with a larger height. As the adsorption capacity of argon atoms for a hydrophobicsurface is weaker, this also provides new findings and conclusions. The final numbers of liquid atomsfor hydrophobic surfaces were all smaller than those for hydrophilic surfaces. The difference betweenthe small groove height and larger groove height became more obvious with a larger groove width.More clear temperature distinctions were shown in the first stage (<2 ns), and a slighter slope oftemperature drop occurred in the second stage (>2 ns), when compared to the temperatures withhydrophilic surfaces. The potential energies decreased with the increase of the groove height, whichshowed completely opposing trends compared with those on hydrophilic surfaces. As far as we know,there are no previous studies on condensation on hydrophobic nanostructured surfaces. Therefore,this investigation has significant potential for industrial applications. To better apply this researchin practice, we will expand the surface from a single groove to a series of microstructures in ourfuture work.

Nanomaterials 2020, 10, 1831 10 of 11
Author Contributions: M.-J.L. wrote the manuscript. L.-Q.D. supervised and supported this study and criticallyrevised the manuscript. All authors have read and agreed to the published version of the manuscript.
Funding: This research was funded by the National Nature Science Foundation Project, grant number 51576062and the Science Fund for Creative Research Groups of the National Natural Science Foundation of China, grantnumber 51821004.
Conflicts of Interest: The authors declare no conflict of interest.
References
1. Zheng, Y.; Bai, H.; Huang, Z.; Tian, X.; Nie, F.Q.; Zhao, Y.; Zhai, J.; Jiang, L. Directional water collection onwetted spider silk. Nature 2010, 463, 640–643. [CrossRef]
2. Rose, J.W. Condensation heat transfer fundamentals. Chem. Eng. Res. Des. 1998, 76, 143–152. [CrossRef]3. Miljkovic, N.; Preston, D.J.; Enright, R.; Wang, E.N. Electric-field-enhanced condensation on superhydrophobic
nanostructured surfaces. ACS Nano 2013, 7, 11043–11054. [CrossRef]4. Leach, R.N.; Stevens, F.; Langford, S.C.; Dickinson, J.T. Dropwise condensation: Experiments and simulations
of nucleation and growth of water drops in a cooling system. Langmuir 2006, 22, 8864–8872. [CrossRef]5. Chen, X.; Wu, J.; Ma, R.; Hua, M.; Koratkar, N.; Yao, S.; Wang, Z. Nanograssed micropyramidal architectures
for continuous dropwise condensation. Adv. Funct. Mater. 2011, 21, 4617–4623. [CrossRef]6. Jin, H.; Lin, G.; Bai, L.; Zeiny, A.; Wen, D. Steam generation in a nanoparticle-based solar receiver. Nano Energy
2016, 28, 397–406. [CrossRef]7. Wang, S.; Chen, J.; Hu, Y.; Zhang, W. Effect of evaporation section and condensation section length on thermal
performance of flat plate heat pipe. Appl. Therm. Eng. 2011, 31, 2367–2373. [CrossRef]8. Lips, S.; Bonjour, J.; Lefèvre, F. Investigation of evaporation and condensation processes specific to grooved
flat heat pipes. Front. Heat Pipes 2010, 1, 023001.9. Liu, Z.H.; Li, Y.Y.; Bao, R. Thermal performance of inclined grooved heat pipes using nanofluids. Int. J.
Therm. Sci. 2010, 49, 1680–1687. [CrossRef]10. Luo, H.; Lu, Y.; Yin, S.; Huang, S.; Song, J.; Chen, F.; Carmalt, C.J.; Parkin, I.P. Robust platform for water
harvesting and directional transport. J. Mater. Chem. A 2018, 6, 5635–5643. [CrossRef]11. Miljkovic, N.; Enright, R.; Nam, Y.; Lopez, K.; Dou, N.; Sack, J.; Wang, E.N. Jumping-droplet-enhanced
condensation on scalable superhydrophobic nanostructured surfaces. Nano Lett. 2013, 13, 179–187. [CrossRef]12. Wen, R.F.; Xu, S.S.; Zhao, D.L.; Lee, Y.C.; Ma, X.H.; Yang, R.G. Hierarchical superhydrophobic surfaces with
micropatterned nanowire arrays for high-efficiency jumping droplet condensation. ACS Appl. Mater. Interfaces2017, 9, 44911–44921. [CrossRef] [PubMed]
13. Bian, J.C.; Li, Q.; Huang, C.; Li, J.F.; Guo, Y.; Zaw, M.; Zhang, R.Q. Thermal vapor condensation of uniformgraphitic carbon nitride films with remarkable photocurrent density for photoelectrochemical applications.Nano Energy 2015, 15, 353–361. [CrossRef]
14. Attinger, D.; Frankiewicz, C.; Betz, A.R.; Schutzius, T.M.; Ganguly, R.; Das, A.; Kim, C.J.; Megaridis, C.M.Surface engineering for phase change heat transfer: A review. MRS Energy Sustain. 2014, 15, E4. [CrossRef]
15. Nagayama, G.; Kawagoe, M.; Tokunaga, A.; Tsuruta, T. On the evaporation rate of ultra-thin liquid film atthe nanostructured surface: A molecular dynamics study. Int. J. Therm. Sci. 2010, 49, 59–66. [CrossRef]
16. Gao, S.; Liao, Q.; Liu, W.; Liu, Z.C. Effects of solid fraction on droplet wetting and vapor condensation:A molecular dynamic simulation study. Langmuir 2017, 33, 12379–12388. [CrossRef]
17. Hasan, M.N.; Shavik, S.M.; Mukut, K.M.; Rabbi, K.F.; Faisal, A.H.M. Atomistic modelling of thin film argonevaporation over different solid surfaces at different wetting conditions. Micro Nano Lett. 2018, 13, 351–356.[CrossRef]
18. Ou, X.; Wang, X.; Lin, Z.; Li, J. Heterogeneous condensation of water on the mica (001) surface: A moleculardynamics simulation work. J. Phys. Chem. C 2017, 121, 6813–6819. [CrossRef]
19. Niu, D.; Tang, G.H. The effect of surface wettability on water vapor condensation in nanoscale. Sci. Rep.2016, 6, 19192. [CrossRef]
20. Hiratsuka, M.; Emoto, M.; Konno, A.; Ito, S. Molecular dynamics simulation of the influence of nanoscalestructure on water wetting and condensation. Micromachines 2019, 10, 587. [CrossRef]
21. Wang, Q.; Xie, H.; Hu, Z.; Liu, C. The impact of the electric field on surface condensation of water vapor:Insight from molecular dynamics simulation. Nanomaterials 2019, 9, 64. [CrossRef] [PubMed]

Nanomaterials 2020, 10, 1831 11 of 11
22. Lu, Z.; Salamon, T.R.; Narayanan, S.; Bagnall, K.R.; Hanks, D.F.; Antao, D.S.; Barabadi, B.; Sircar, J.;Simon, M.E.; Wang, E.N. Design and modeling of membranebased evaporative cooling devices for thermalmanagement of high heat fluxe. IEEE Trans. Compon. Packag. Technol. 2016, 6, 1056–1065.
23. Humplik, T.; Lee, J.; O’Hern, S.; Fellman, B.; Baig, M.; Hassan, S.; Atieh, M.; Rahman, F.; Laoui, T.; Karnik, R.Nanostructured materials for water desalination. Nanotechnology 2011, 22, 292001. [CrossRef] [PubMed]
24. Sefiane, K. On the formation of regular patterns from drying droplets and their potential use for bio-medicalapplications. J. Bionic Eng. 2010, 7, S82–S93. [CrossRef]
25. Goto, E.; Matsumoto, Y.; Kamoi, M.; Endo, K.; Ishida, R.; Dogru, M.; Kaido, M.; Kojima, T.; Tsubota, K. Tearevaporation rates in Sjögren syndrome and nonSjögren dry eye patients. Am. J. Ophthalmol. 2007, 144, 81–85.[CrossRef]
26. Yu, J.; Wang, H. A molecular dynamics investigation on evaporation of thin liquid films. Int. J. HeatMass Transf. 2012, 55, 1218–1225. [CrossRef]
27. Li, L.; Ji, P.; Zhang, Y. Molecular dynamics simulation of condensation on nanostructured surface in aconfined space. Appl. Phys. A Mater. Sci. Process. 2016, 122, 496. [CrossRef]
28. Yi, P.; Poulikakos, D.; Walther, J.; Yadigaroglu, G. Molecular dynamics simulation of vaporization of anultra-thin liquid argon layer on a surface. Int. J. Heat Mass Transf. 2002, 145, 2087–2100. [CrossRef]
29. Kuri, S.K.; Rakibuzzaman, S.M.; Sabah, A.; Ahmed, J.; Hasan, M.N. Effect of nanostructured surfaceconfiguration on evaporation and condensation characteristics of thin film liquid argon in a nano-scaleconfinement. AIP Conf. Proc. 2017, 1919, 020049.
30. Liang, Z.; Biben, T.; Keblinski, P. Molecular simulation of steady-state evaporation and condensation:Validity of the Schrage relationships. Int. J. Heat Mass Transf. 2017, 114, 105–114. [CrossRef]
31. Plimpton, S. Fast Parallel Algorithms for Short-Range Molecular Dynamics. J. Comput. Phys. 1995, 117, 1–19.[CrossRef]
32. Nosé, S. Constant-temperature molecular dynamics. J. Phys.-Cond. Matter 1990, 2, 115–119. [CrossRef]33. Nosé, S.U.I. A molecular dynamics method for simulations in the canonical ensemble. Mol. Phys. 2002, 100,
191–198. [CrossRef]34. Ding, W.Y.; Han, D.; Zhang, J.Z.; Ma, Q.M.; Li, X.Y.; Zhang, J.C. Molecular dynamics study of anisotropic
behaviours of water droplet on textured surfaces with various energies. Mol. Phys. 2020. [CrossRef]35. Wang, B.B.; Wang, X.D.; Wang, T.H.; Lu, G.; Yan, W.M. Enhancement of boiling heat transfer of thin water
film on an electrified solid surface. Int. J. Heat Mass Transf. 2017, 109, 410–416. [CrossRef]36. Zhang, K.; Wang, F.; Zhao, X. The self-propelled movement of the water nanodroplet in different surface
wettability gradients: A contact angle view. Comput. Mater. Sci. 2016, 124, 190–194. [CrossRef]37. Werder, T.; Walther, J.H.; Jaffe, R.L.; Halicioglu, T.; Koumoutsakos, P. On the Water-Carbon Interaction for
Use in Molecular Dynamics Simulations of Graphite and Carbon Nanotubes. J. Phys. Chem. B 2003, 107,1345–1352. [CrossRef]
38. Wang, Y.H.; Wang, S.Y.; Lu, G.; Wang, X.D. Explosive boiling of nano-liquid argon films on high temperatureplatinum walls: Effects of surface wettability and film thickness. Int. J. Therm. Sci. 2018, 132, 610–617.[CrossRef]
39. Liao, M.J.; Duan, L.Q. Explosive boiling of liquid argon films on flat and nanostructured surfaces. Numer.Heat Tranf. A Appl. 2020, 78, 94–105. [CrossRef]
© 2020 by the authors. Licensee MDPI, Basel, Switzerland. This article is an open accessarticle distributed under the terms and conditions of the Creative Commons Attribution(CC BY) license (http://creativecommons.org/licenses/by/4.0/).