department of the army fiscal year (fy) … the depot maintenance and ordnance, customer rates are...
TRANSCRIPT

ARMY WORKING CAPITAL FUND
DEPARTMENT OF THE ARMY
FISCAL YEAR (FY) 2004/2005BIENNIAL BUDGET ESTIMATES
FEBRUARY 2003

Army Working Capital Fund Fiscal Year (FY) 2004/2005 Biennial Budget Estimates
Table of Contents
Army Overview 2 Background 3
Army Working Capital Fund Activity Groups 3 Personnel 4 Cost of Goods and Services Produced (Expenses) 5 Net and Accumulated Operating Results 5 Cash Collections, Disbursements and Net Outlays 6 Customer Rates 6
Customer Rate Changes 6 Capital Budget Program 7
Direct Appropriations 7 OPERATING BUDGET 9 Supply Management 10 Depot Maintenance 31 Ordnance 44 Information Services 57 CAPITAL BUDGET 62
Supply Management 63 Depot Maintenance 80 Ordnance 121
1

Army Working Capital Fund Fiscal Year (FY) 2004/2005 Biennial Budget Estimates
ARMY OVERVIEW
2

Army Working Capital Fund Fiscal Year (FY) 2004/2005 Biennial Budget Estimates
3
BACKGROUND The Department of the Army has historically operated a significant number of its organic commercial and industrial facilities under the revolving fund concept. This encourages these activities to function in a more efficient and cost-effective manner and to provide the additional flexibility needed to properly manage these facilities under changing workload conditions. The support services provided by Army Working Capital Fund (AWCF) activity groups are essential to the readiness and sustainability of our operating Forces and are an integral part of the total Defense team. ARMY WORKING CAPITAL FUND ACTIVITY GROUPS The Army manages four activity groups within the AWCF: Supply Management. This activity group buys and maintains assigned stocks of materiel for sale to customers, primarily Army operating units. The Army’s equipment and operational readiness and its combat capability is directly linked to the availability of materiel. The phased implementation to Single Stock Fund (SSF) provides total asset visibility of the Army’s inventory and greater flexibility to optimize management of Army-owned assets. In FY 2003, the Army will complete the capitalization of assets down to and including the Division Authorized Stockage Level. With the SSF and the Logistics Modernization Program (LMP), the Army is moving towards real time management and response to the needs of our soldiers. This activity is managed by major subordinate commands of the Army Materiel Command (AMC). Depot Maintenance. This activity group provides the Army an organic industrial capability to repair, overhaul, and upgrade weapons systems equipment and provides tenant support to Army and other DoD activities. Depot maintenance activities both compete and partner with private industry to deliver goods and services efficiently and effectively. There are five major depots: Anniston, Corpus Christi, Letterkenny, Red River, and Tobyhanna who are managed by major subordinate commands of AMC. Ordnance. This activity group provides the organic capability to produce quality munitions and large caliber weapons while performing a full range of ammunition maintenance and renovation for U.S. and allied Forces. Ordnance activities include the manufacture, renovation, storage and demilitarization of materiel. There are three arsenals, two ammunition plants, five ammunition storage depots, and three munitions centers. The arsenals and plants provide depot operations and tenant support to Army and DoD activities. This activity is managed by major subordinate elements of AMC. Information Services. This activity group provides for the development and sustainment of automated information and communications systems, and provides commercial sources for purchase of small/medium computers, hardware, software and support services. The activity group is operating on a cost reimbursable basis until it decapitalizes at the end of FY 2003.

Army Working Capital Fund Fiscal Year (FY) 2004/2005 Biennial Budget Estimates
4
PERSONNEL The AWCF personnel posture reflects a slight overall decrease during FY 2003 – 2005 as the Information Services activity group is decapitalized. Minor fluctuations in the other activity groups reflect changes required to support customer requirements: civilian and military strengths and work years (full time equivalents) depicted by activity: FY 2002 FY 2003 FY 2004 FY 2005Supply Management Civilian End Strength 2,990 2,940 3,009 2,976Civilian FTEs * 3,063 2,869 2,937 2,904Military End Strength 12 13 13 13Military Average Strength 13 13 13 13Depot Maintenance Civilian End Strength 11,102 11,112 11,194 11,321Civilian FTEs * 11,788 11,134 11,054 11,205Civilian OT Usage (% DLH) 10.0 8.9 8.3 8.1Productive Yield 1,591 1,589 1,617 1,616Military End Strength 33 31 19 19Military Average Strength 33 32 25 19Ordnance Civilian End Strength 5,580 5,543 5,583 5,415Civilian FTEs * 5,957 5,559 5,581 5,401Civilian OT Usage (% DLH) 11.9 8.4 7.4 6.1Productive Yield 1578 1606 1617 1615Military End Strength 17 18 18 18Military Average Strength 17 18 18 18Information Services Civilian End Strength 276 259 0 0Civilian FTEs * 276 266 0 0Military End Strength 7 5 0 0Military Average Strength 7 6 0 0Total Civilian End Strength 19,948 19,854 19,786 19,712Civilian FTEs * 21,084 19,828 19,572 19,510Military End Strength 69 67 50 50Military Average Strength 70 69 56 50 * FY 2002 FTEs include overtime.

Army Working Capital Fund Fiscal Year (FY) 2004/2005 Biennial Budget Estimates
5
COST OF GOODS & SERVICES PRODUCED (EXPENSES) Costs and workload have a mixed trend over the four-year period. Supply has growth as it implements Single Stock Fund. The spike in FY 2004 cost reflects Army’s effort to increase spare availability and reduce backorder levels. Sales increase over the period with cost returning to normal in FY 2005. Depot Maintenance shows growth over the period due primarily to price growth and program increases for recapitalization of legacy systems and equipment. The Ordnance reduction in FY 2003 cost includes a reduction of $ 65.5M in direct Unutilized Plant Capacity funding for mobilization contingencies as a result of section 8109 of the FY 2003 DoD Appropriations Act. The Army will attempt to reduce operating expenses to offset the loss of UPC funding. The Information Services activity is cost reimbursable and will be decapitalized at the end of FY 2003. ($ in millions) FY 2002 FY 2003 FY 2004 FY 2005Supply Management 3,720.7 5,356.6 6,532.1 5,789.6Depot Maintenance 1,733.3 1,749.6 1,814.7 1,871.1Ordnance 694.3 604.8 673.5 663.4Information Services 100.2 95.3 N/A N/A Total 6,248.5 7,806.3 9,020.3 8,324.1 NET AND ACCUMULATED OPERATING RESULTS The Army Working Capital Fund activity groups operate on a breakeven basis and set revenue rates to achieve positive or negative results in order to bring the Accumulated Operating Result (AOR) to zero over the budget cycle. An activity group's effectiveness is measured by comparing performance to the Net Operating Result (NOR) goal. ($ in millions) FY 2002 FY 2003 FY 2004 FY 2005SUPPLY MANAGEMENT Net Operating Results -317.9 238.6 -10.8 0Accumulated Operating Results -227.8 10.8 0 0Depot Maintenance Net Operating Results -98.5 -18.3 43.5 20.6 Accumulated Operating Results -45.8 -64.1 -20.6 0.0Ordnance Net Operating Results -28.2 .1 -72.4 -109.4Accumulated Operating Results 181.6 181.7 109.4 0.0Information Services Net Operating Results 3.7 0 N/A N/A Accumulated Operating Results 9.8 9.8 N/A N/A

Army Working Capital Fund Fiscal Year (FY) 2004/2005 Biennial Budget Estimates
6
Cash Collections, Disbursements and Net Outlays: Collections in FY 2003 reflect working off of $200M in advance billings from FY 2002. Included in cash collections are direct appropriations of $249M for FY 2003, $219.3M FY 2004 and $33M for FY 2005: ($ in millions) FY 2002 FY 2003 FY 2004 FY 2005Collections 6,441.9 7,908.4 8,924.6 8,253.9Disbursements 6,516.5 7,740.7 8,577.3 8,614.5Net Outlays 74.6 -167.7 -347.3 360.6
CUSTOMER RATES In the Depot Maintenance and Ordnance, customer rates are set per direct labor hour. The rates recover direct and overhead costs. All Activity’s rates are stabilized so that the customer’s buying power is protected. Customer rates for the Information Services Activity group are eliminated and customers of the two remaining software development centers will be charged on a cost reimbursement basis. The Supply Management activity adds a surcharge on sales to recoup overhead expenses. The following table shows the direct labor hour/surcharge rates by activity group: FY 2002 FY 2003 FY 2004 FY 2005Supply Management 15.1% 24.1% 21.7% 20.7%Depot Maintenance $124.57 $133.80 $144.91 $147.85 Ordnance $94.59 $69.07 $70.05 $77.15Information Services N/A N/A N/A N/A CUSTOMER RATE CHANGES In general, activity group rates are set to recover full costs and adjust for accumulated operating results. Rate changes are expressed as a percentage change from the rate charged in the previous year. Positive operating results in the Ordnance activity in FY 2001 and the decision by the Department to fully fund Unutilized Plant Capacity (UPC) in FY 2003 reduced prices to Ordnance customers in FY 2003. In Depot Maintenance, FY 2002 operating results were worse than planned due to the directed recovery of back pay resulting from an arbitration decision. The recovery of back pay award is being spread over two-year period to smooth required rate increases recouping these unplanned expenses. The FY 2003 Supply Management surcharge rate increase reverses prior year rate buy downs and restores accumulated operating results (AOR) and cash position. FY 2004 and 2005 rates reflect normal operations.

Army Working Capital Fund Fiscal Year (FY) 2004/2005 Biennial Budget Estimates
7
FY 2002 FY 2003 FY 2004 FY 2005 Supply Management -2.5% 9.2% 4.5% 1.5%Depot Maintenance 4.0% 7.4% 8.3% 2.0%Ordnance -7.9% -27.0% 1.4% 10.1%Information Services N/A N/A N/A N/A
CAPITAL BUDGET PROGRAM The AWCF activities are developing and maintaining operational capabilities through acquisition of production equipment, execution of minor construction projects, and development of software. Equipment is being acquired to replace obsolete and unserviceable equipment, modernize production and maintenance processes, and eliminate environmental hazards. Increased emphasis has been placed on Depot Maintenance and Ordnance activities to ensure production equipment is updated to allow the most cost effective and efficient means of supporting customer requirements. The funding table below depicts depot growth starting FY 2003 and Ordnance in FY 2004. Software requirements are significantly reduced starting in FY 2004 as Single Stock Fund completes deployment and the Logistics Modernization Program completes final design and initiates deployment. A more in-depth discussion is provided in each activity group chapter as well as narrative detail in the Capital Budget chapter. ($ in millions) FY 2002 FY 2003 FY 2004 FY 2005Supply Management 61.2 94.1 42.9 25.8Depot Maintenance 24.9 51.1 44.2 68.5Ordnance 10.7 15.7 58.5 42.1Information Services 0.0 0.0 0.0 0.0Total 96.8 160.9 145.6 136.4
DIRECT APPROPRIATIONS The following amounts have been received/requested as direct DWCF appropriations: ($ in millions) FY 2002 FY 2003 FY 2004 FY 2005 War Reserve Secondary Items 63.0 89.0 105.4 0Unutilized Plant Capacity 0 60.0 113.9 33.0Utilities 4.4 0 0 0Inventory Augmentation 100.0 100.0 0 0
Army Working Capital Fund Fiscal Year (FY) 2004/2005 Biennial Budget Estimates
8
The AWCF is receiving increased direct appropriation infusion to help offset cost increases and maintain rate stability.
War Reserve Secondary Items (WRSI): Funding to procure and store a war reserve inventory of secondary items.
Unutilized Plant Capacity (UPC): Unutilized Plant Capacity represents funding necessary to compensate the Ordnance and Depot Maintenance activity groups for the fixed overhead costs of maintaining plant and equipment required by the Army to meet mobilization and wartime surge capability. These funds are provided to the Army Working Capital Fund (AWCF) in a direct appropriation because they are not directly related to the cost of doing business. Funding ensures peacetime customers receive competitive stabilized rates, AWCF installations remain competitive, and the Army retains a viable industrial base. If UPC was not provided, Army Ordnance and Depot Maintenance customers would end up paying increased direct labor hour rates to fund capacity not needed to meet the peacetime mission. In FY 2003, Unutilized Plant Capacity funding moves to the Defense Working Capital Fund, Army (DWCF, A). This represents a change from the current practice of Funding UPC requirements through the Operations and Maintenance, Army appropriation. Also in FY 2003, the Defense Appropriations Act reduced the DWCF appropriation by $148.6 million, $67 million of which was taken from Depot Maintenance and Ordnance UPC funding. Beginning in FY 2004, a new standard method of computing requirements identified a significant increase in Depot Maintenance, and a decrease in Ordnance UPC requirements over FY 2003 requirements. This submission requests full funding of the FY 2004 Depot Maintenance and Ordnance UPC requirements. Although FY 2005 Depot Maintenance and Ordnance UPC funding is currently estimated at $33 million, the Department will be reviewing – refining this estimate during the next year.

Army Working Capital Fund Fiscal Year (FY) 2004/2005 Biennial Budget Estimates
9
OPERATING BUDGETS

Army Working Capital Fund Fiscal Year (FY) 2004/2005 Biennial Budget Estimates
Supply Management
FUNCTIONAL DESCRIPTION
The Supply Management Army (SMA) activity group buys and maintains assigned stocks of materiel for sale to its customers, primarily Army operating units. The Army’s equipment and operational readiness and it’s combat capability is directly linked to the availability of this materiel. The activity group is managed by the major subordinate commands of the Army Materiel Command.
ACTIVITY GROUP COMPOSITION
The SMA entities consist of the following:
NAMI Division Manager
Non Army Managed Items- Central Business Unit
U.S. Army Tank-Automotive and Armaments Command, Rock Island, IL
Type of Materiel Managed: DLA and General Services Administration (GSA) items. Includes repair parts, industrial supplies, general supplies, and ground support
supplies.
Wholesale Subdivisions Materiel Managed
AMCOM U.S. Army Aviation and Missile Command,
Huntsville, AL
Aircraft and ground support items, missile systems items
CECOM U.S. Army Communications-Electronics Command,
Fort Monmouth, NJ
Communication and electronics items
TACOM-W U.S. Army Tank-Automotive and Armaments Command,
Warren, MI
Combat, automotive, and construction items
TACOM-RI U.S. Army Tank-Automotive and Armaments Command,
Rock Island, IL
Weapons, special weapons and fire control systems
SBCCOM U.S. Army Soldier and Biological Chemical Command, Aberdeen Proving Ground, MD
Ground support items, and chemical weapons
Prepositioned War Reserves Materiel Managed AMC-MOB
Headquarters, U.S. Army Materiel Command, Alexandria, VA DLA/GSA items: repair parts, clothing, subsistence, medical supplies, industrial supplies; ground forces
supplies
BUDGET HIGHLIGHTS Implementation of the Single Stock Fund (SSF) Milestones 1 and 2 was completed in FY 2001. Milestone 3 is being implemented in FY 2003 and provides total asset visibility of the Army’s inventory, while providing greater flexibility to optimize management of Army-owned assets. The SMA will continue to manage the propositioned war reserves under Army control. A small quantity of Non-Army Managed Items (NAMI) will be retained and managed in the NAMI Central Business Unit (NAMI-CBU).
10

Army Working Capital Fund Fiscal Year (FY) 2004/2005 Biennial Budget Estimates
Supply Management Personnel: Personnel changes from FY 2002 through FY 2005 are results of realignment of personnel in support of Single Stock Fund, changes in mission responsibilities, and right-sizing of the SMA force structure.
FY 2002 FY 2003 FY 2004 FY 2005 Civilian End Strengths 2,990 2,940 3,009 2,976Civilian FTEs 3,063 2,869 2,937 2,904Military End Strength 12 13 13 13Military Average Strength 13 13 13 13
Sales: Increases in Net Sales from FY 2002 thru FY 2004 are due to increases in surcharge, decreases in credit through credit management, continuing Global War on Terror, the implementation of SSF MS 3 and the Recapitalization Program. SMA sales stabilize in FY 2005. Changes in obligations for material are in direct correlation with demand patterns and dollars provided for our spares shortfall in FY 2003 (further details provided under ‘Spares’ paragraph).
Indicator ($M) FY 2002 FY003 FY2004 FY2005 Net Sales 3,366.1 5,595.2 6,521.3 5,789.6Cost of Materiel Sold from Inventory 2,426.7 4,322.5 5,469.2 4,717.1Obligations for Materiel (includes depot-level repair for DLRs)
3,242.3 5,436.3 4,706.0 4,726.0
Credit for Returns 2,471.3 2,250.3 2,159.4 2,329.2 Operating Results: The Army Working Capital Fund activity groups operate on a break-even basis over the budget cycle. The Army sets each activity’s annual rates to achieve the results, positive or negative, required to bring accumulated operating results (AOR) to zero in the budget cycle. The table below reflects net and accumulated operating results for SMA:
Indicator ($M) FY 2002 FY 2003 FY 2004 FY 2005 Net Operating Results -317.9 238.6 -10.8 0Accumulated Operating Results -227.8 10.8 0 0
11

Army Working Capital Fund Fiscal Year (FY) 2004/2005 Biennial Budget Estimates
Supply Management Cash Collections, Disbursements and Net Outlays: Cash losses experienced in FY 2002 are a result of disbursements for obligations that occurred in FY 2001 due to long-lead time to complete acquisitions and repairs, and pricing errors in FY 2002, which were corrected in FY 2003. Significant improvement will occur in FY 2003 through FY 2005 as a result of proper pricing and improved credit management.
Indicator ($M) FY 2002 FY 2003 FY 2004 FY 2005 Collections 3,464.6 5,718.9 6,488.9 5,811.0Disbursements 3,954.1 5,212.5 6,097.9 6,061.4Net Outlays 489.5 -506.4 -391.0 -250.4
Workload and Economic Assumptions: Prices for Army-managed items were adjusted downward an average of 2.5% for FY 2002, while FY 2003 prices increased by 9.2% to adjust for FY 2002 cash losses. FY 2004 prices to customers will increase by 4.5% and by 1.5% in FY 2005 due to pricing items correctly that have been historically under-priced. The following chart shows general workload data for the Wholesale Division:
Indicator FY 2002 FY 2003 FY 2004 FY 2005 Credit Returns ($M) 2,462.5 2,236.4 2,140.6 2,310.0Surcharge Rate (Composite) 15.1% 24.1% 21.7% 20.7%Customer Price Change -2.5% 9.2% 4.5% 1.5%SMA Purchase Inflation 1.6% 1.8% 1.5% 1.5%
Unit Cost: Unit cost is used as a managerial control. It is measured by dividing gross materiel cost, which is the sum of total obligations and credit, by gross sales. The Wholesale Division unit cost is adjusted due to unexpected additional sales for GWOT and the Army’s decision to invest in needed spares to improve inventory posture for demand satisfaction. Unit Cost Goal FY 2002 FY 2003 FY 2004 FY 2005 Wholesale 1.07 1.11 .88 1.01
12

Army Working Capital Fund Fiscal Year (FY) 2004/2005 Biennial Budget Estimates
Supply Management Spares: Supplying and maintaining equipment for the Army’s soldiers remain key components of readiness. Over several years, the Army has experienced increased demands for repair parts, generally due to aging aircraft and ground equipment parts breaking more frequently, and increased stress from higher OPTEMPO. In FY 2003, the Army has taken measures to replenish depleted inventories by applying over $1 billion in cost authority, which is dedicated to improving future spares. This is a major stride toward meeting supply availability, mission capability goals (especially for the CH–47D and UH-60 airframes and M1A1 Abrams tanks), and to ensure readiness for training. The FY 2004 budget also supports the Army’s Recapitalization Rebuild Program. Supply Management Stock Availability: Stock Availability measures the percentage of SMA requisitions satisfied with initial processing in the wholesale supply system. The SMA target for Stock Availability (85% demand satisfaction) is the basis for budget requirements for FY 2002 through FY 2005. Data provided reflects FY 2002 actual performance. Even though the overall stock availability was above 85% in FY 2002, it should be noted that stock availability of critical spares was only at 78%. This trend will continue until resolved by the Army’s spares initiatives in FY 2003.
1Q–02 2Q–02 3Q–02 4Q–02 85.0% 86.3% 87.0% 86.0%
Capital Budget: SMA seeks to maintain and develop capabilities through equipment and software acquisition. The Capital Investment Program primarily funds development of software to improve managerial decision-making quality and timeliness. The SMA invests in local area networks, servers, desktop computers, high-speed printers and a variety of software products that enhance program integration at the operational sites. Growth in FY 2003 is the result of dollars identified for initial requirements supporting Exchange Pricing. The planned capital obligations are:
Category ($M) FY 2002 FY 2003 FY 2004 FY 2005 ADP 0 1.8 2.5 1.6
Software 60.2 92.3 40.4 25.6
TOTAL 60.2 94.1 42.9 27.2
13

Army Working Capital Fund Fiscal Year (FY) 2004/2005 Biennial Budget Estimates
Supply Management Direct Appropriations: ($M) FY 2002 FY 2003 FY 2004 FY 2005 Utilities 0.6 0.0 0.0 0.0War Reserve Secondary Items 63.0 89.0 105.4 0.0Inventory Augmentation 100.0 100.0 0.0 0.0Total 163.6 189.0 105.4 0.0 Utilities: As a result of rising utility costs the Supply Management Army business area received direct funding to offset cost increases in FY 2002. War Reserves Secondary Items/Inventory Augmentation: An investment in additional spares, intended to procure additional spare parts to reduce backlog and increase spares availability, was made in FY 2002 and FY 2003. The Army set aside O&M funding for war reserve secondary items each fiscal year to improve the Army’s ability to meet mission and operational readiness requirements. Funding for FY 2005 ($117.2 million) will be moved from the O&M account into the working capital fund account during the next Budget Review.
14

Army Working Capital Fund Fiscal Year (FY) 2004/2005 Biennial Budget Estimates
Supply Management
15
Revenue and Expenses
(Dollars in Millions)
FY 2002 FY 2003 FY2004 FY2005
Revenue
Gross Sales 5,837.4 7,845.5 8,680.7 8,118.8 Credit and Allowances 2,471.3 2,250.3 2,159.4 2,329.2
Net Sales 3,366.1 5,595.2 6,521.3 5,789.6 Other Income 290.7 189.0 105.4 0.0
Other Revenues & Financing Sources 127.1 0.0Inventory Augmentation 100.0 100.0 0.0War Reserve-Secondary Items 63.0 89.0 105.4Utilities 0.6
Total Income: 3,656.8 5,784.2 6,626.7 5,789.6Expenses
Cost of Material Sold from Inventory 2,427.1 4,495.9 5,579.8 4,700.6Inventory Losses/Obsolescence 433.4 73.8 71.8 73.8 Safety of Use Flight (additional loss factor) 28.4 28.5 29.1
Salaries and Wages: 309.3 247.6 226.1 197.6 Military Personnel Compensation & Benefits 1.0 1.1 1.1 1.1 Civilian Personnel Compensation & Benefits 308.3 246.6 225.0 196.5 Travel & Transportation of Personnel 6.2 3.9 4.0 4.0 Materiel & Supplies (For Internal Operations) 1.4 1.1 1.1 1.1 Equipment 1.7 0.2 0.4 0.4 Other Purchases from Revolving Funds 261.4 286.8 302.2 325.2 Transportation of Things 32.3 107.9 112.1 111.0 Depreciation - Capital 25.8 67.2 71.0 63.9 Printing and Reproduction 0.1 0.2 0.2 0.1 Advisory and Assistance Services 27.9 15.1 15.9 16.0 Rent, Communication, Utilities & Misc. Charges 0.5 0.5 0.5 0.5 Other Purchased Services 193.5 217.1 224.0 266.3
Total Expenses: 3,720.7 5,545.6 6,637.5 5,789.6
Operating Result (63.9) 238.6 (10.8) 0.0Less Capital Surcharge Reservation 0.0 0.0 0.0 0.0Other Changes Affecting NOR (Price Adjustments): 254.0 0.0 0.0 0.0
Actual Obsolescence 433.4Actual Extraordinary Losses (3.8)AOR Recovery Adjustment (175.6)
Other Changes Affecting AOR (Cash): 0.0 0.0 0.0 0.0
Net Operating Result (317.9) 238.6 (10.8) 0.0
Prior Year AOR 90.1 (227.8) 10.8 0.0
Accumulated Operating Result (227.8) 10.8 0.0 0.0

Army Working Capital Fund Fiscal Year (FY) 2004/2005 Biennial Budget Estimates
Supply Management
16
SOURCE OF REVENUE(Dollars in Millions)
FY 2002 FY 2003 FY 2004 FY 2005
1. New Ordersa. Orders from DoD Components:
Department of ArmyOperations & Maintenance, Army 4,009.8 5,298.3 6,229.0 6,045.4Operations & Maintenance, ARNG 567.2 672.3 564.5 572.0Operations & Maintenance, AR 27.8 43.6 26.7 27.7
Subtotal, O&M: 4,604.8 6,014.2 6,820.2 6,645.0Procurement Appropriations 222.4 269.8 225.8 230.0RDTE 12.4 12.3 12.8 12.9Military Personnel, Army 5.7 0.7 0.7 0.7Other 53.7 252.0 289.0 272.3
Subtotal, Department of Army: 4,899.0 6,549.0 7,348.5 7,160.9Department of Navy 102.1 129.0 130.2 127.4Department of Air Force 190.4 218.5 221.8 213.2US Marines 85.9 89.1 90.4 90.Department of Defense 53.7 38.4 36.1 36.7
Subtotal, Other DoD Services: 432.1 475.0 478.5 468.0
b. DWCF:Depot Maintenance, Army 408.3 509.5 445.8 448.0Supply Management, Army (Retail) 0.0 0.0 0.0 0.0
Subtotal DWCF: 408.3 509.5 445.8 448.0
c. Total DoD 5,739.4 7,533.5 8,272.8 8,076.9
Other Federal Agencies 104.0 6.4 10.3 8.4FMS 204.0 245.4 268.3 196.5Non Federal Agencies 0.0 0.0 0.0 0.0All Other 14.0 2.0 0.0 0.0
Total New Orders: 6,061.4 7,787.3 8,551.4 8,281.8
6

Army Working Capital Fund Fiscal Year (FY) 2004/2005 Biennial Budget Estimates
Supply Management
SOURCE OF REVENUE(Dollars in Millions)
FY 2002 FY 2003 FY 2004 FY 2005
2. Carry-in Orders 1,110.9 1,429.6 1,371.4 1,242.1
3. Total Gross Orders (New Orders plus Ba 7,172.3 9,216.9 9,922.8 9,523.9
4. Change in Backorders 318.7 (58.2) (129.3) 163.0
5. Total Gross Sales 5,742.7 7,845.5 8,680.7 8,118.8
6. Less: Returns for Credit 2,459.0 2,239.1 2,148.7 2,317.6Less: Allowances 12.3 11.2 10.7 11.6Plus: Credit Differential 0.0 0.0 0.0 0.0
7. Net Sales 3,283.7 5,606.4 6,532.0 5,801.2
17

Army Working Capital Fund Fiscal Year (FY) 2004/2005 Biennial Budget Estimates
Supply Management
DIVISION OPERATING MOB TOTAL
Non-Army Managed Items (NAMI)FY 2002 117.8 108.2 73.0 73.0FY 2003 850.7 775.5 738.3 738.3FY 2004 1,249.4 1,212.2 1,153.3 1,153.3FY 2005 1,271.8 1,233.1 1,174.8 1,174.8
WHOLESALE CONSUMABLES
TACOM-RIFY 2002 122.7 109.3 101.4 0.0 101.4FY 2003 134.7 124.1 87.0 1.0 88.0FY 2004 155.7 157.7 105.1 0.3 105.4FY 2005 154.1 139.0 105.5 0.3 105.8
AMCOM-AirFY 2002 130.3 123.7 80.4 0.9 81.3FY 2003 159.9 144.8 177.1 0.0 177.1FY 2004 147.4 159.0 161.0 0.0 161.0FY 2005 142.2 148.5 169.8 5.0 174.8
CECOMFY 2002 299.7 230.3 151.2 1.6 152.8FY 2003 270.4 260.9 287.8 0.5 288.3FY 2004 321.6 343.5 133.8 0.0 133.8FY 2005 301.2 313.5 149.3 0.0 149.3
AMCOM-MissilesFY 2002 35.8 30.1 20.0 0.1 20.1FY 2003 22.4 20.0 13.2 0.0 13.2FY 2004 25.1 23.4 14.6 0.0 14.6FY 2005 0.0 0.0 0.0 0.0 0.0
SBCCOMFY 2002 107.1 101.5 103.5 21.8 125.3FY 2003 146.1 143.4 133.3 7.3 140.6FY 2004 175.8 173.7 100.6 30.0 130.6FY 2005 147.6 146.7 96.9 30.0 126.9
TACOM-WFY 2002 118.0 114.8 86.7 0.0 86.7FY 2003 137.6 149.1 122.9 0.0 122.9FY 2004 129.4 131.6 95.7 0.0 95.7FY 2005 127.9 125.2 100.4 0.0 100.4
SUBTOTAL CONSUMABLESFY 2002 813.6 709.7 543.2 24.4 567.6FY 2003 871.1 842.3 821.3 8.8 830.1FY 2004 955.0 988.9 610.8 30.3 641.1FY 2005 873.0 872.9 621.9 35.3 657.2
NET SALES
SUMMARY BY DIVISION(Dollars in Millions)
OBLIGATION TARGETSNET CUST ORDERS
18

Army Working Capital Fund Fiscal Year (FY) 2004/2005 Biennial Budget Estimates
Supply Management
DIVISION OPERATING MOB TOTAL
WHOLESALE REPARABLES
TACOM-RIFY 2002 264.6 189.1 176.3 4.3 180.6FY 2003 242.6 260.0 189.1 6.0 195.1FY 2004 276.0 257.4 151.0 5.0 156.0FY 2005 271.2 233.5 158.4 5.0 163.4
AMCOM-AirFY 2002 1,093.4 882.7 1,174.1 10.1 1,184.2FY 2003 1,641.9 1,716.7 1,879.5 13.0 1,892.5FY 2004 1,651.1 1,803.0 1,238.0 30.0 1,268.0FY 2005 1,567.3 1,474.6 1,201.7 25.0 1,226.7
CECOMFY 2002 275.0 234.7 249.7 2.2 251.9FY 2003 257.2 291.1 387.8 4.7 392.5FY 2004 440.6 430.5 296.7 4.7 301.4FY 2005 368.9 367.1 285.2 4.7 289.9
AMCOM-MissilesFY 2002 328.6 257.4 197.5 2.9 200.4FY 2003 315.6 342.7 260.9 3.0 263.9FY 2004 298.1 359.6 256.8 3.0 259.8FY 2005 286.6 367.2 255.7 5.0 260.7
SBCCOMFY 2002 35.3 34.1 6.6 0.0 6.6FY 2003 54.3 40.0 53.2 5.0 58.2FY 2004 65.6 78.7 37.1 0.0 37.1FY 2005 51.0 52.3 36.4 0.0 36.4
TACOM-WFY 2002 748.5 942.5 816.4 9.5 825.9FY 2003 1,294.8 1,316.1 1,097.4 33.0 1,130.4FY 2004 1,449.7 1,384.5 955.8 20.0 975.8FY 2005 1,256.2 1,217.3 985.4 20.0 1,005.4
SUBTOTAL DLRFY 2002 2,745.4 2,540.5 2,620.6 29.0 2,649.6FY 2003 3,806.4 3,966.6 3,867.9 64.7 3,932.6FY 2004 4,181.1 4,313.7 2,935.4 62.7 2,998.1FY 2005 3,801.2 3,712.0 2,922.8 59.7 2,982.5
NET CUST ORDERS
NET SALES
SUMMARY BY DIVISION(Dollars in Millions)
OBLIGATION TARGETS
19

Army Working Capital Fund Fiscal Year (FY) 2004/2005 Biennial Budget Estimates
Supply Management
OTHER OPERATING MOB TOTAL
AMC MOBILIZATIONFY 2002 7.7 7.7 5.5 35.5 41.0FY 2003 8.8 8.8 8.8 31.9 40.7FY 2004 6.5 6.5 6.5 24.2 30.7FY 2005 6.5 6.5 6.5 25.2 31.7
COST OF OPERATIONSFY 2002 860.2 860.2FY 2003 864.8 864.8FY 2004 871.6 871.6FY 2005 907.3 907.3
CAPITALFY 2002 60.3 60.3FY 2003 94.1 94.1FY 2004 42.9 42.9FY 2005 27.3 27.3
COMMITMENT (Not incl in Tot OA)FY 2002 0.0 0.0FY 2003 410.8 410.8FY 2004 391.4 391.4FY 2005 404.1 404.1
FATIGUE TESTINGFY 2002 6.1 6.1FY 2003 5.8 5.8FY 2004 5.9 5.9FY 2005 6.0 6.0
ESIFY 2002 58.2 58.2FY 2003 58.2 58.2FY 2004 59.2 59.2FY 2005 60.3 60.3
MOB OA (Memo)FY 2002 89.0 89.0FY 2003 105.4 105.4FY 2004 117.2 117.2FY 2005 120.2 120.2
GRAND TOTALFY 2002 3,684.5 3,366.1 4,227.1 88.9 4,316.0FY 2003 5,537.0 5,593.2 6,870.0 105.4 6,975.4FY 2004 6,392.0 6,521.3 6,077.0 117.2 6,194.2FY 2005 5,952.5 5,824.5 6,131.0 120.2 6,251.2
NET CUST ORDERS
NET SALES
OBLIGATION TARGETS
SUMMARY BY DIVISION(Dollars in Millions)
20

Army Working Capital Fund Fiscal Year (FY) 2004/2005 Biennial Budget Estimates
Supply Management
BUDGET AUTHORITY OPERATING MOB TOTAL
WAR RESERVE MATERIELFY 2002 63.0 63.0FY 2003 89.0 89.0FY 2004 105.4 105.4FY 2005 0.0 0.0
INVENTORY AUGMENTATIONFY 2002 100.0 100.0FY 2003 100.0 100.0
UTILITIESFY 2002 0.6 0.6
TOTAL BAFY 2002 100.6 63.0 163.6FY 2003 100.0 89.0 189.0FY 2004 0.0 105.4 105.4FY 2005 0.0 0.0 0.0
(Dollars in Millions)
OBLIGATION TARGETSNET CUST ORDERS
NET SALES
SUMMARY BY DIVISION
21

Army Working Capital Fund Fiscal Year (FY) 2004/2005 Biennial Budget Estimates
Supply Management
WEAPON SYSTEM/CATEGORY FY 2002
Material Readiness Indicator FY 2003
Material Readiness Indicator
Chemical Defense Equipment 76.8 n/a 119.3 n/aOther Armament, Munitions and Chemicals 92.0 n/a 103.4 n/aAH-64 300.2 77% 578.5 75%UH-60 409.2 75% 861.0 80%OH-58D 98.7 83% 190.1 75%CH-47D 217.0 60% 657.4 75%T701C Engines 147.1 n/a 151.2 n/aAir Delivery/Aviation/Troop Equipment 172.9 n/a 121.7 n/aMSE 31.0 n/a 67.6 n/aNight Vision Equipment 45.4 n/a 103.1 n/aBatteries 49.8 n/a 70.4 n/aOther Communications/Electronics 279.0 n/a 494.9 n/aMLRS 25.0 94% 47.7 90%PATRIOT 96.9 96% 140.1 90%Other Missile Systems 89.8 96% 74.8 90%M1 Series Tank 505.4 86% 798.3 90%M88 Recovery Vehicle 87.8 84% 134.8 90%M109 Howitzer 30.8 93% 36.3 90%M198 Howitzer 5.1 96% 8.5 90%M113 FOV 58.1 92% 62.6 90%Bradley Fighting Vehicle 117.1 94% 181.1 90%HMMWV 76.4 94% 82.6 90%Tires 52.9 n/a 82.0 n/aOther Tank & Automotive 177.9 n/a 268.7 n/a
TOTAL 3,242.3 5,436.3
OPERATING REQUIREMENT BY WEAPON SYSTEM CATEGORY($ in Millions)
22

Army Working Capital Fund Fiscal Year (FY) 2004/2005 Biennial Budget Estimates
Supply Management
WEAPON SYSTEM/CATEGORY FY 2004
Material Readiness Indicator FY 2005
Material Readiness Indicator
Chemical Defense Equipment 111.9 n/a 121.3 n/aOther Armament, Munitions and Chemicals 106.2 n/a 105.1 n/aAH-64 501.3 75% 481.0 75%UH-60 662.2 80% 615.1 80%OH-58D 133.3 75% 147.2 75%CH-47D 481.2 75% 517.9 75%T701C Engines 119.4 n/a 125.9 n/aAir Delivery/Aviation/Troop Equipment 120.5 n/a 90.3 n/aMSE 44.8 n/a 27.2 n/aNight Vision Equipment 66.7 n/a 60.5 n/aBatteries 34.4 n/a 31.2 n/aOther Communications/Electronics 366.2 n/a 379.0 n/aMLRS 51.1 90% 50.9 90%PATRIOT 132.6 90% 127.3 90%Other Missile Systems 82.3 90% 93.4 90%M1 Series Tank 770.6 90% 816.1 90%M88 Recovery Vehicle 136.8 90% 131.4 90%M109 Howitzer 37.2 90% 35.0 90%M198 Howitzer 11.2 90% 10.9 90%M113 FOV 66.5 90% 70.4 90%Bradley Fighting Vehicle 208.6 90% 229.7 90%HMMWV 83.2 90% 85.9 90%Tires 69.1 n/a 71.8 n/aOther Tank & Automotive 308.8 n/a 301.4 n/a
TOTAL 4,706.0 4,726.0
OPERATING REQUIREMENT BY WEAPON SYSTEM CATEGORY(Dollars in Millions)
23

Army Working Capital Fund Fiscal Year (FY) 2004/2005 Biennial Budget Estimates
Supply Management
24
FY 2002 Total Mobilization Operating Other
1. Materiel Inventory BOP at Standard 16,654.1 2,308.7 7,233.3 7,112.0
2. Materiel Inventory BOP (revalued-memo) 8,843.4 1,874.7 5,873.5 1,095.2
3. BOP Materiel Inventory Adjustments a. Reclassification Changes 0.0 (69.2) (1,636.8) 1,706.0b. Price Changes (memo) 511.4 73.6 208.9 228.9c. Inventory Reclassified and Repriced 17,165.5 2,313.1 5,805.5 9,046.9
4. Receipts at Standard 2,020.8 32.0 1,988.8 0.0
5. Gross Sales 5,837.4 7.7 5,829.7 0.0
6. Materiel Inventory Adjustmentsa. Capitalizations + OR (-) 170.1 (2.9) 260.3 (87.3)b. Returns from Customers for Credit 3,622.9 0.0 3,506.1 116.8c. Returns from Customers without Credit 1,784.5 1.9 0.0 1,782.6d. Returns to suppliers (-) (32.7) 0.0 0 (32.7)e. Transfers to Property Disposal (-) (1,038.2) (1.2) 0.0 (1,037.0)f. Issues/Receipts w/o Reimbursement (279.2) (70.2) 0.0 (209.0)
+ OR (-)g. Other (2,550.4) (84.6) (89.6) (2,376.1)h. Total Adjustments 1,677.0 (157.1) 3,676.8 (1,842.7)
7. Materiel Inventory EOP 15,026.0 2,180.4 5,641.4 7,204.2
8. Materiel Inventory EOP (revalued-memo) 8,551.7 1,008.1 4,661.9 2,881.7 a. Economic Retention (memo) 794.7 0.0 0.0 794.7 b. Policy Retention (memo) 265.4 0.0 0.0 265.4 c. Potential Excess (memo) 45.8 0.0 0.0 45.8
9. Materiel Inventory on Order EOP (memo) 2,291.0 73.7 2,217.3 0.0
MATERIAL INVENTORY DATAFY 2002
(Dollars in Millions)

Army Working Capital Fund Fiscal Year (FY) 2004/2005 Biennial Budget Estimates
Supply Management
25
FY 2003 Total Mobilization Operating Other
1. Materiel Inventory BOP at Standard 15,026.0 2,180.4 5,641.4 7,204.22. Materiel Inventory BOP (revalued-memo) 8,551.7 1,008.1 4,661.9 2,881.7
3. BOP Materiel Inventory Adjustments
a. Reclassification Changes 0.0 88.4 1,747.5 (1,835.9)b. Price Changes (memo) 1,270.3 113.6 656.4 500.3c. Inventory Reclassified and Repriced 16,296.3 2,382.4 8,045.3 5,868.6
4. Receipts at Standard 3,603.5 75.0 3,528.5 0.0
5. Gross Sales 7,845.5 8.8 7,836.7 0.06. Materiel Inventory Adjustments
a. Capitalizations + OR (-) 303.6 (46.0) 326.8 22.8b. Returns from Customers for Credit 3,473.2 0.0 2,585.0 888.2c. Returns from Customers without Credit 1,959.6 0.0 0.0 1,959.6d. Returns to suppliers (-) 0.0 0.0 0.0 0.0e. Transfers to Property Disposal (-) (1,241.3) 0.0 0.0 (1,241.3)f. Issues/Receipts w/o Reimbursement (91.7) 0.0 0.0 (91.7)
+ OR (-)g. Other (93.1) (23.0) (50.4) (19.7)h. Total Adjustments 4,310.3 (69.0) 2,861.4 1,517.9
7. Materiel Inventory EOP 16,364.6 2,379.6 6,598.5 7,386.5
8. Materiel Inventory EOP (revalued-memo) 8,909.4 1,665.7 4,289.0 2,954.6
a. Economic Retention (memo) 2,156.9 2,156.9 b. Policy Retention (memo) 738.7 738.7 c. Potential Excess (memo) 59.1 59.1
9. Materiel Inventory on Order EOP (memo) 3,119.0 73.7 3,045.3 0.0
---- Peacetime ----
MATERIAL INVENTORY DATAFY 2003
(Dollars in Millions)

Army Working Capital Fund Fiscal Year (FY) 2004/2005 Biennial Budget Estimates
Supply Management
26
FY 2004 Total Mobilization Operating Other
1. Materiel Inventory BOP at Standard 16,364.6 2,379.6 6,598.5 7,386.5
2. Materiel Inventory BOP (revalued-memo) 8,909.4 1,665.7 4,289.0 2,954.6
3. BOP Materiel Inventory Adjustmentsa. Reclassification Changes 0.0 38.1 1,929.0 (1,967.1)b. Price Changes (memo) 197.5 30.9 66.2 100.4c. Inventory Reclassified and Repriced 16,562.1 2,448.6 8,593.7 5,519.8
4. Receipts at Standard 3,954.0 71.5 3,882.5 0.0
5. Gross Sales 8,680.7 6.5 8,674.2 0.0
6. Materiel Inventory Adjustmentsa. Capitalizations + OR (-) (46.0) (46.0) 0.0 0.0b. Returns from Customers for Credit 3,294.0 0.0 2,594.3 699.7c. Returns from Customers without Credit 2,208.0 0.0 0.0 2,208.0d. Returns to suppliers (-) 0.0 0.0 0.0 0.0e. Transfers to Property Disposal (-) (1,260.8) 0.0 0.0 (1,260.8)f. Issues/Receipts w/o Reimbursement (22.8) 0.0 0.0 (22.8)
+ OR (-)g. Other (102.5) (31.8) (49.6) (21.1)h. Total Adjustments 4,069.9 (77.8) 2,544.7 1,603.0
7. Materiel Inventory EOP 15,905.3 2,435.8 6,346.7 7,122.8
8. Materiel Inventory EOP (revalued-memo) 8,679.5 1,705.0 4,125.4 2,849.1 a. Economic Retention (memo) 2,079.9 2,079.9 b. Policy Retention (memo) 712.3 712.3 c. Potential Excess (memo) 57.0 57.0
9. Materiel Inventory on Order EOP (memo) 2,323.9 66.5 2,257.4 0.0
---- Peacetime ----
MATERIAL INVENTORY DATAFY 2004
(Dollars in Millions)

Army Working Capital Fund Fiscal Year (FY) 2004/2005 Biennial Budget Estimates
Supply Management
FY 2005 Total Mobilization Operating Other
1. Materiel Inventory BOP at Standard 15,905.3 2,435.8 6,346.7 7,122.8
2. Materiel Inventory BOP (revalued-memo) 8,679.5 1,705.0 4,125.4 2,849.1
3. BOP Materiel Inventory Adjustmentsa. Reclassification Changes 0.0 33.1 1,593.1 (1,626.2)b. Price Changes (memo) 489.0 47.5 152.7 288.8c. Inventory Reclassified and Repriced 16,394.3 2,516.4 8,092.5 5,785.4
4. Receipts at Standard 4,084.4 25.3 4,059.1 0.0
5. Gross Sales 8,118.8 6.5 8,112.3 0.0
6. Materiel Inventory Adjustmentsa. Capitalizations + OR (-) (37.2) (37.2) 0.0 0.0b. Returns from Customers for Credit 3,537.6 0.0 2,863.2 674.4c. Returns from Customers without Credit 1,929.0 0.0 0.0 1,929.0d. Returns to suppliers (-) 0.0 0.0 0.0 0.0e. Transfers to Property Disposal (-) (1,195.6) 0.0 0.0 (1,195.6)f. Issues/Receipts w/o Reimbursement (16.7) 0.0 0.0 (16.7)
+ OR (-)g. Other (136.2) (40.8) (74.2) (21.2)h. Total Adjustments 4,080.9 (78.0) 2,789.0 1,369.9
7. Materiel Inventory EOP 16,405.9 2,457.2 6,793.4 7,155.3
8. Materiel Inventory EOP (revalued-memo) 8,997.9 1,720.0 4,415.7 2,862.1 a. Economic Retention (memo) 1,936.0 1,936.0 b. Policy Retention (memo) 715.5 715.5 c. Potential Excess (memo) 210.6 210.6
9. Materiel Inventory on Order EOP (memo) 2,200.8 69.0 2,131.8 0.0
---- Peacetime ----
(Dollars in Millions)
MATERIAL INVENTORY DATAFY 2005
27

Army Working Capital Fund Fiscal Year (FY) 2004/2005 Biennial Budget Estimates
Supply Management
FY 2003 TotalWRM
ProtectedWRM Other
1. Inventory BOP (@ cost) 2,269.9 2,180.4 89.5
2. BOP Inventory Adjustments 205.8 202.0 3.8a. Price Change 117.4 113.6 3.8b. Reclassification 88.4 88.4 0.0
3. Adjusted BOP Inventory Balance (Std) 2,475.7 2,382.4 93.3
4. Inventory Changes (22.6) (2.8) (19.8)
a. Receipts @ standard 75.8 75.0 0.8(1) Purchases (+) 75.8 75.0 0.8(2) Returns from customers (-) 0.0 0.0 0.0
b. Issues @ std. (29.4) (8.8) (20.6)(1) Sales (8.8) (8.8) 0.0(2) Returns to suppliers 0.0 0.0 0.0(3) Disposals (20.6) 0.0 (20.6)
c. Adjustments @ std. (69.0) (69.0) 0.0(1) Capitalizations (46.0) (46.0) 0.0(2) Gains and Losses 0.0 0.0 0.0(3) Other (23.0) (23.0) 0.0
Inventory EOP 2,453.1 2,379.6 73.5STOCKPILE COSTS
1. Storage 0.02. Management 0.03. Maintenance/Other 0.0
Total Cost 0.0
WRM BUDGET REQUEST
1. Obligations @ costa. Additional WRM 100.7b. Replen. WRM 4.7c. Repair WRM 0.0d. Assemble/Disassemble 0.0e. Other 0.0
Total Request 105.4
WAR RESERVE MATERIAL (WRM) STOCKPILE($ in Millions)
28

Army Working Capital Fund Fiscal Year (FY) 2004/2005 Biennial Budget Estimates
Supply Management
FY 2004 TotalWRM
ProtectedWRM Other
1. Inventory BOP (@ cost) 2,453.1 2,379.6 73.5
2. BOP Inventory Adjustments 71.0 69.0 2.0a. Price Change 32.8 30.9 1.9b. Reclassification 38.2 38.1 0.1
3. Adjusted BOP Inventory Balance (Std) 2,524.1 2,448.6 75.5
4. Inventory Changes (47.2) (12.8) (34.4)
a. Receipts @ standard 77.5 71.5 6.0(1) Purchases (+) 77.5 71.5 6.0(2) Returns from customers (-) 0.0 0.0 0.0
b. Issues @ std. (40.7) (6.5) (34.2)(1) Sales (13.0) (6.5) (6.5)(2) Returns to suppliers 0.0 0.0 0.0(3) Disposals (27.7) 0.0 (27.7)
c. Adjustments @ std. (84.0) (77.8) (6.2)(1) Capitalizations (46.0) (46.0) 0.0(2) Gains and Losses (6.3) 0.0 (6.3)(3) Other (31.7) (31.8) 0.1
Inventory EOP 2,476.9 2,435.8 41.1
STOCKPILE COSTS1. Storage 0.02. Management 0.03. Maintenance/Other 0.0
Total Cost 0.0
WRM BUDGET REQUEST1. Obligations @ cost
a. Additional WRM 112.5b. Replen. WRM 4.7c. Repair WRM 0.0d. Assemble/Disassemble 0.0e. Other 0.0
Total Request 117.2
WAR RESERVE MATERIAL (WRM) STOCKPILE($ in Millions)
29

Army Working Capital Fund Fiscal Year (FY) 2004/2005 Biennial Budget Estimates
Supply Management
30
FY 2005 TotalWRM
ProtectedWRM Other
1. Inventory BOP (@ cost) 2,476.9 2,435.8 41.1
2. BOP Inventory Adjustments 82.1 80.6 1.5a. Price Change 48.9 47.5 1.4b. Reclassification 33.2 33.1 0.1
3. Adjusted BOP Inventory Balance (Std) 2,559.0 2,516.4 42.6
4. Inventory Changes (79.7) (59.2) (20.5)a. Receipts @ standard 31.3 25.3 6.0
(1) Purchases (+) 31.3 25.3 6.0(2) Returns from customers (-) 0.0 0.0 0.0
b. Issues @ std. (35.6) (6.5) (29.1)(1) Sales (13.0) (6.5) (6.5)(2) Returns to suppliers 0.0 0.0 0.0(3) Disposals (22.6) 0.0 (22.6)
c. Adjustments @ std. (75.4) (78.0) 2.6(1) Capitalizations (37.2) (37.2) 0.0(2) Gains and Losses 0.0 0.0 0(3) Other (38.2) (40.8) 2.6
Inventory EOP 2,479.3 2,457.2 22.1STOCKPILE COSTS
1. Storage 0.02. Management 0.03. Maintenance/Other 0.0
Total Cost 0.0 WRM BUDGET REQUEST
1. Obligations @ costa. Additional WRM 115.5b. Replen. WRM 4.7c. Repair WRM 0.0d. Assemble/Disassemble 0.0e. Other 0.0
Total Request 120.2
WAR RESERVE MATERIAL (WRM) STOCKPILE($ in Millions)

Army Working Capital Fund Fiscal Year (FY) 2004-2005 Biennial Budget Estimates
Depot Maintenance
Functional Description The Depot Maintenance activity group provides the Army an organic industrial capability to repair, overhaul, and upgrade weapon systems and equipment and provide tenant support to Army and other DoD activities. Depot Maintenance activities both compete and partner with private industry to deliver goods and services efficiently and effectively. Activity Group Composition The Depot Maintenance activity group is currently composed of the following depots and depot activities: Anniston Army Depot, Anniston, AL (ANAD) - maintains, overhauls, and repairs heavy tracked combat vehicles and artillery and provides base support to tenants. Corpus Christi Army Depot, Corpus Christi, TX (CCAD) - maintains, repairs, overhauls, and upgrades rotary wing aircraft, engines, and components. This depot is a tenant on a Navy installation. Letterkenny Army Depot, Chambersburg, PA (LEAD) - maintains, repairs, and overhauls tactical missile systems and provides base support to tenants. Red River Army Depot, Texarkana, TX (RRAD) - maintains and repairs light armored vehicles and select missile systems; provides base support to tenants. Tobyhanna Army Depot, Tobyhanna, PA (TYAD) - manufactures, maintains, tests, and fields communications-electronics systems and equipment and missile guidance and control systems and equipment. Provides base support to tenants. Budget Highlights Personnel: Civilian and military End Strengths and Full Time Equivalents (FTEs) follow. Civilian manpower is driven by funded workload captured in the Army Workload and Performance System (AWPS). FY 2002 FY 2003 FY 2004 FY 2005Civilian End Strength 11,102 11,112 11,194 11,321Civilian FTEs 11,788 11,134 11,054 11,205Military End strength 33 31 19 19Military Average Strength 33 32 25 19
31

Army Working Capital Fund Fiscal Year (FY) 2004-2005 Biennial Budget Estimates
Depot Maintenance
Costs, Operating Results, and Rates: Costs: The current FY 2003 “Cost of Goods and Services Produced” is $92.1 million higher than the last President’s Budget due to an increase in workload and higher material unit costs. Cost increases in FY 2004 are also attributable to workload increases and higher material costs. The workload increases primarily result from increases in Recapitalization of legacy equipment (the maintenance and systemic upgrade of fielded systems to ensure operational effectiveness and a near-zero time, zero mile system). Unit Costs: Unit costs are calculated by dividing the Cost of Goods Sold by Direct Labor Hours (DLHs). Unit costs decreased 1.62% (-$2.45) in FY 2003 from the last President’s Budget due to an increase in projected workload (DLHs). Unit Costs are expected to rise 2.44% ($3.70) in FY 2004 due to increased expenses. Operating Results and Rates: The FY 2002 Net Operating Result (NOR) of -$98.5 million exceeded the budgeted NOR of -$19.2 million. This is primarily due to a one-time payment of $92.3 million for an arbitration backpay award at Corpus Christi Army Depot (asbestos settlement). The backpay award will be recovered in the rates over a two year period. The FY 2003 NOR is now estimated to be -$18.3 million which is +$27.1 million higher than the initial projected NOR of -$45.4 million. This is due to workload increases. These revisions result in an FY 2003 AOR of -$64.1 million. This AOR will be recovered over the next two fiscal years in order to minimize year-to-year variations in the Customer Revenue Rate.
FY 2002 FY 2003 FY 2004 FY 2005Cost of Goods & Services Produced ($M) 1,733.3 1,749.6 1,814.7 1,871.1Cost of Goods & Services Sold ($M) 1,766.1 1,749.6 1,814.7 1,871.1Net Operating Results ($M) -98.5 -18.3 +43.5 +20.6Accumulated Operating Results ($M) -45.8 -64.1 -20.6 0.0Customer Revenue Rate per DLH $124.57 $133.80 $144.91 $147.85Percent Change from Prior Year 3.97% 7.41% 8.30% 2.03%Unit Costs ($/DLH) 152.35 151.79 155.49 162.78DLH (000) 11,592 11,526 11,671 11,494Percentage of Overtime 10.0% 8.9% 8.3% 8.1%
32

Army Working Capital Fund Fiscal Year (FY) 2004-2005 Biennial Budget Estimates
Depot Maintenance
Cash Collections, Disbursements and Net Outlays: FY 2002 collections include advance billings of $54 million. Collections in FY 2003 reflect the working off of the FY 2002 advance billings. Included in cash collections are direct appropriations of $5.8 million in FY 2003, $19.8 million in FY 2004, and $6.4M in FY 2005. ($ in millions) FY 2002 FY 2003 FY 2004 FY 2005Collections 1,734.6 1,625.4 1,845.0 1,887.7Disbursements 1,761.3 1,760.8 1,816.2 1,867.4Net Outlays 26.7 135.4 -28.8 -20.2 Carry-Over: The FY 2004 budget includes a new metric for measuring the target amount of workload carryover at the industrial-type activities in the Defense Working Capital Fund. Carryover is the amount of work funded but not yet performed by the end of the fiscal year at the industrial-type activities such as depots, or ordnance activities.
In FY 2001, the Congress directed the General Accounting Office (GAO) to study the carryover formula. The GAO recommended the Department of Defense determine an analytically based carryover formula to replace the “3-month, less exclusions” standard. The revised methodology provides a metric that is tailored to the workload of each business area and provides visibility into the elements of carryover so that performance can be measured and analyzed.
Specifically, to measure the expected performance for each business area, the revised methodology uses the outlay rates of the various customer appropriations to develop a unique business area target. The new methodology excludes work-in-process and some other orders, such as non-DoD customers, from the carryover amount. The new metric holds Working Capital Fund Activities to the same standard as work performed by all providers—whether private or public, and supports budget analysis rather than just performance against an arbitrary target. The Depot Maintenance FY 2002 actual New Order Carry-over exceeded the target by $36.1 million due to an increase in New Orders received during fourth quarter, FY 2002 ($21.3 million in unplanned orders at Corpus Christi Army Depot in support of Operation Enduring Freedom/Noble Eagle; $11.3 million unplanned orders at Letterkenny Army Depot for Army War Reserve missions; and $3.5 million unplanned orders at Anniston Army Depot for additional National Guard Bureau/U.S. Army Reserve orders).
33

Army Working Capital Fund Fiscal Year (FY) 2004-2005 Biennial Budget Estimates
Depot Maintenance
($ in millions) FY 2002 FY 2003 FY 2004 FY 2005 New Orders (excl. FMS, Non-DoD, & BRAC) 1,612.4 1,655.7 1,859.6 1,860.5 New Order Carry-over Target
548.2 546.4 595.1 595.4
Planned New Order Carry-over 584.3 439.4 454.9 367.1 Performance Indicators: Performance indicators for the Depot Maintenance activity are: Net Operating Result (NOR) variance from Plan (Financial); Quality Deficiency Reporting – QDR (Quality); Satisfaction/Complaint Resolution (Customer Satisfaction); Measurement of the productive Direct Labor Hours per Direct FTE (Productivity); and Capacity Utilization (Productivity). Actual FY 2002 performance resulted in a NOR of -$98.5 million (against a Plan of –$19.2 million); 98% processing of all QDRs submitted (against a plan of 95%); a 90% Customer Satisfaction rate (against a plan of 90%); a Productive Yield of 1,591 hours (against a plan of 1,582 hours); and a 79.4% utilization of total production capacity (against a plan of 75% utilization. Performance Measure/Goal FY 02 FY 03 FY 04 FY 051. NOR (Achieve PRES BUD Goal) -$98.5M -$18.3M $43.5M $20.6M2. Quality (95%) 98 98.5 98.5 98.53. Customer Satisfaction (90%) 90 92 94 964. Productive Yield (1615) 1,591 1,589 1,617 1,6165. Capacity Utilization (75%) 79.4 83.7 83.9 81.8 Direct Appropriations. This submission includes a request for direct funding in the Defense Working Capital Fund for Unutilized Plant Capacity (UPC) and Utilities (FY 2002 only).
34

Army Working Capital Fund Fiscal Year (FY) 2004-2005 Biennial Budget Estimates
Depot Maintenance
Unutilized Plant Capacity (UPC): Starting in FY 2003 UPC funding transfers to the Defense Working Capital Fund, Army (DWCF, A). This represents a change from the former practice of funding UPC requirements through the Operation and Maintenance, Army appropriation to more closely align UPC funding with the AWCF business appropriation. The last President’s Budget requested full funding of the FY 2003 UPC requirement. However, in Section 8109 of the Conference Report for the FY 2003 Defense Appropriations Act (P.L. 107-248, Title V.) the DWCF appropriation was reduced by $148.6 million. As a result, Depot Maintenance UPC funding was reduced $1.5 million. The Army is once again requesting full funding of UPC in FY 2004. In FY 2005 UPC is currently funded at $6.4 million. Utilities: As a result of rising utility costs in FY 2002, the Depot Maintenance business area received direct funding to offset cost increases. ($ in millions) DWCF, Army FY 2002 FY 2003 FY 2004 FY 2005UPC 7.8 5.8 19.8 6.4Utilities 2.3 0.0 0.0 0.0 Capital Budget: The Capital Investment Program (CIP) for Depot Maintenance consists of: Productivity-Enhancing Equipment. Requirements include: Aircraft Corrosion Control Equipment (allows for the painting/treatment of all airframes), Flight Critical Parts Inspection & Treatment Equipment (reduces processing time and operating costs), Plastic Media Blast System (reduces handling & transportation to follow on operations) at Corpus Christi Army Depot; Large Capacity Spin Blaster (reduces costs) at Anniston Army Depot; and Circuit Card Assembly Test Programs (allows for the automated testing of & troubleshooting of equipment) at Tobyhanna Army Depot. Replacement Equipment. Requirements include: Items such as the Fluidized Test Bed and Inertial Sensor Assembly Test Equipment at Red River Army Depot; Transmission Test Stand, Automated Storage Retrieval System Upgrade, 30-ton Bridge Crane, upgrade of Integrated Family of Test Equipment – Commercial Equivalent Equipment Test Stations, CNC Vertical Machining Center, and Overhaul of 10 Bridge Cranes at Anniston Army Depot; Circuit Board Test System at Tobyhanna Army Depot; Engine Disassembly and Cleaning Equipment at Corpus Christi Army Depot; and CNC Precision Laser Cutting System and Hydraulic Test Console at Letterkenny Army Depot.
35

Army Working Capital Fund Fiscal Year (FY) 2004-2005 Biennial Budget Estimates
Depot Maintenance
Environmental Equipment. Requirements include: Items such as: Dust Collection System at Letterkenny Army Depot; and Air Pollution Control Equipment at Anniston Army Depot. Minor Construction. Requirements include: A Welding Facility at Anniston Army Depot; and various Minor Construction projects at all Depots. Software. Requirements include: The cost of fielding the Army Workload and Performance System to improve management processes; system upgrades and contractor support for the Logistics Modernization Program to improve the logistics process; and SDS Data Collection/Shop Floor/AIT common technology architecture. A summary of the CIP program follows: ($ in millions) FY 2002 FY 2003 FY 2004 FY 2005Equipment 7.1 32.7 28.1 37.1ADPE & Telecommunications 0.0 0.0 0.2 0.0Minor Construction 1.1 1.8 7.3 2.5Software 16.7 16.6 8.6 28.9TOTAL 24.9 51.1 44.2 68.5
36

Army Working Capital Fund Fiscal Year (FY) 2004-2005 Biennial Budget Estimates
Depot Maintenance
Revenue and Expenses ($ in Millions)
FY 2002 FY 2003 FY 2004 FY 2005
RevenueGross Sales: 1,655.9 1,731.3 1,858.2 1,891.7
Operations 1,622.0 1,695.2 1,821.0 1,845.1Surcharges 0.8Depreciation excluding Major Construction 33.0 36.1 37.2 46.6Major Construction Depreciation
Other Income (Appropriated Capital - Utilities/CSRS/FEHB 2.3Refunds/Discounts (-)
Total Income: $1,668.4 $1,731.3 $1,858.2 $1,891.7
ExpensesSalaries and Wages: 638.0 665.8 685.6 696.6
Military Personnel Compensation & Benefits 2.0 2.2 2.2 2.3Civilian Personnel Compensation & Benefits 635.9 663.7 683.3 694.3
Travel & Transportation of Personnel 15.6 15.8 16.3 16.6Materials & Supplies (For Internal Operations) 640.9 741.4 772.6 800.0Equipment 19.0 22.2 24.1 27.4Other Purchases from Revolving Funds 74.8 63.0 57.2 57.6Transportation of Things 3.9 3.2 3.2 3.3Depreciation - Capital 33.0 36.1 37.2 46.6Printing and Reproduction 1.2 1.3 1.4 1.5Advisory and Assistance Services 16.3 18.1 18.7 18.9Rent, Communication, Utilities, & Misc. Charges 28.2 37.6 38.1 38.6Other Purchased Services 262.3 144.9 160.3 164.0
Total Expenses: $1,733.3 $1,749.6 $1,814.7 $1,871.1
Operating Result -$64.9 -$18.3 $43.5 $20.6
37

Army Working Capital Fund Fiscal Year (FY) 2004-2005 Biennial Budget Estimates
Depot Maintenance
Revenue and Expenses ($ in Millions)
FY 2002 FY 2003 FY 2004 FY 2005
Less Surcharge Reservations 0.8Cash (Current Year)Cash (Carried Over) 0.8Capital
Plus Appropriations Affecting NOR/AOROther Changes Affecting NOR: -32.7
Other Inventory AdjustmentsNet Change in Work in Process 32.7
Net Operating Result -$98.5 -$18.3 $43.5 $20.6
Prior Year Adjustments -31.6
Prior Year Recoverable Accumulated Operating Result $84.2 -$45.8 -$64.1 -$20.6
Non-Recoverable Amounts (Current Year)
Recoverable Accumulated Operating Result -$45.8 -$64.1 -$20.6 $0.0
Memo:Beginning Work in Process 32.7Ending Work in Process
Cost of Goods Sold: $1,766.1 $1,749.6 $1,814.7 $1,871.1
38

Army Working Capital Fund Fiscal Year (FY) 2004-2005 Biennial Budget Estimates
Depot Maintenance
Source of Revenue ($ in Millions)
FY 2002 FY 2003 FY 2004 FY 2005
1. New Ordersa. Orders from DoD Components:
Department of ArmyOperations & Maintenance, Army 494.3 506.9 652.4 665.7Operations & Maintenance, ARNG 60.8 38.1 86.0 62.4Operations & Maintenance, AR 31.8 35.1 43.0 45.2
Subtotal, O&M: $586.9 $580.0 $781.4 $773.3
Aircraft Procurement 9.9 10.7 4.9 9.0Missile Procurement 18.8 18.7 18.1 14.3Weapons & Tracked Combat Vehicles 44.8 35.8 34.4 28.9Procurement of Ammunition 0.0 0.0 0.0 0.0Other Procurement 43.4 39.3 30.5 29.9
Subtotal, Procurement: $116.9 $104.5 $87.9 $82.2
RDTE 4.2 3.7 3.3 3.2BRAC 0.8 0.1 0.3 0.3Family Housing 0.3 0.4 0.4 0.4Military Construction 0.0 0.0 0.0 0.0Chem Agents & Munitions Dest, Army 5.4 7.2 7.4 7.5Other 0.2 0.0 0.0 0.0
Subtotal, Department of Army: $714.7 $695.9 $880.7 $866.9
Department of Air Force O&M 8.8 18.9 21.6 21.5Department of Air Force Investment 0.0 0.0 0.0 0.0Department of Navy O&M 45.8 44.5 37.4 36.3Department of Navy Investment 0.0 0.0 0.0 0.0US Marines O&M 0.8 0.4 0.4 0.4US Marines Investment 0.0 0.0 0.0 0.0Department of Defense O&M 0.0 0.0 0.0 0.0
Subtotal, Other DoD Services: $55.4 $63.8 $59.4 $58.3
Other DoD Agencies: $54.4 $12.5 $23.0 $23.0Other DoD Agencies 54.4 12.5 23.0 23.0CAWCF 0.0 0.0 0.0 0.0
39

Army Working Capital Fund Fiscal Year (FY) 2004-2005 Biennial Budget Estimates
Depot Maintenance
Source of Revenue ($ in Millions)
FY 2002 FY 2003 FY 2004 FY 2005
b. DWCF:Depot Maintenance, Army 12.1 1.2 1.2 1.1Information Services, Army 0.0 0.0 0.0 0.0Ordnance, Army 6.5 18.4 19.7 19.9Supply Management, Army 584.3 681.9 694.3 723.4Supply Management, Air Force 108.0 93.3 92.4 92.6Supply Management, Navy 40.6 52.5 29.8 28.2Supply Management, Marine Corps 5.9 2.7 4.3 4.3DECA 0.2 0.2 0.2 0DFAS 0.9 0.9 0.9 0JLSC 0.0 0.0 0.0 0TRANSCOM 0.0 0.0 0.0 0.0IMC (UPC) 0.0 5.8 19.8 6.4Other 11.2 11.6 17.2 17.3
Subtotal, DWCF: $788.6 $883.7 $896.7 $912.7
c. Total DoD $1,613.1 $1,655.9 $1,859.9 $1,860.8
d. Other Orders: 44.7 27.1 34.3 32.6Other Federal Agencies 4.2 2.0 2.7 2.7Foreign Military Sales 38.1 22.8 29.4 27.6Trust Fund 0.0 0.0 0.0 0.0Nonappropriated 2.0 1.0 1.0 1.0Non-Federal Agencies 0.3 1.2 1.1 1.3
Total New Orders: $1,657.8 $1,683.0 $1,894.1 $1,893.5
2. Carry-in Orders $705.4 $707.3 $658.9 $693.3
3. Total Gross Orders $2,363.2 $2,390.3 $2,553.1 $2,586.8
4. Funded Carry-over $707.3 $658.9 $694.9 $695.1
5. Total Gross Sales $1,668.4 $1,731.3 $1,858.2 $1,891.7
Carry-Over Calculation FY 2002 FY 2003 FY 2004 FY 2005
New Orders (excl. FMS, Non-DoD, & BRAC) $1,612.4 $1,655.7 $1,859.6 $1,860.5New Order Carry-over Target $548.2 $546.4 $595.1 $595.4Planned Carry-over $584.3 $439.4 $454.9 $367.1
.2
.9
.0
40

Army Working Capital Fund Fiscal Year (FY) 2004-2005 Biennial Budget Estimates
Depot Maintenance
Changes in the Costs of Operations ($ in Millions)
Expenses
FY 2002 Actual Cost $1,733.3
FY 2003 Estimate in President's Budget $1,657.5
Estimated Impact in FY 2003 of Actual FY 2002 Actions $1.4
Pricing Adjustments ($1.4)Annualization of Prior Year Pay Raises (3.5)FY 2003 Pay Raise 2.6
Civilian Personnel 2.6Military Personnel
Fund Price Changes (0.6)General Purchase Inflation 0.1
Program Changes $92.1Personnel Costs 5.7Travel and Transportation of Personnel (0.9)Material and Supplies (Internal Operations) 83.9Equipment 0.9Other Purchases from Revolving Funds 15.6Transportation of Things 0.1Depreciation (19.7)Printing and Reproduction 0.6Advisory and Assistance Services 11.2Rent, Communications, Utilities and Miscellaneous Charges 3.5UPC Expense Reduction 1.5Other Purchased Services (10.4)
FY 2003 Current Estimate $1,749.6
41

Army Working Capital Fund Fiscal Year (FY) 2004-2005 Biennial Budget Estimates
Depot Maintenance
Changes in the Costs of Operations ($ in Millions)
Expenses
Pricing Adjustments $46.2Annualization of Prior Year Pay Raises 4.1FY 2004 Pay Raise 8.1
Civilian Personnel 8.0Military Personnel 0.1
Fund Price Changes 1.6General Purchase Inflation 32.4
Productivity Initiatives and Other Efficiencies
Program Changes $18.8Personnel Costs 7.5Travel and Transportation of Personnel 0.4Material and Supplies (Internal Operations) 1.6Equipment 1.5Other Purchases from Revolving Funds (6.8)Printing and Reproduction 0.1Advisory and Assistance Services 0.4Rent, Communications, Utilities and Miscellaneous Charges (0.1)Other Purchased Services 13.2
FY 2004 Estimated Cost $1,814.7
42

Army Working Capital Fund Fiscal Year (FY) 2004-2005 Biennial Budget Estimates
Depot Maintenance
43
Unutilized Plant Capacity ($ and DLH in Millions)
FY 2002 FY 2003 FY 2004 FY 2005
Anniston1. Total Capacity Index (DLHs/100 percent) 3222 3222 3222 32222. Utilized Capacity Index (DLHs/"x" percent) 2586 2891 2929 28833. Reserve Capacity Index (DLHs/"x" percent) 636 331 293 3394. Overhead Costs $26.6 $22.6 $23.4 $22.65. IMC Requirement $2.1 $1.0 $2.1 $2.46. Funded IMC ($ in Millions) $1.1 $0.8 $2.1 $0.8
Corpus Christi1. Total Capacity Index (DLHs/100 percent) 3843 3843 3843 38432. Utilized Capacity Index (DLHs/"x" percent) 3247 3243 3184 31113. Reserve Capacity Index (DLHs/"x" percent) 596 600 659 7324. Overhead Costs (as specified) $23.0 $24.0 $35.3 $37.35. IMC Requirement $4.4 $1.4 $6.1 $7.16. Funded IMC ($ in Millions) $1.1 $6.1 $2.0
Letterkenny1. Total Capacity Index (DLHs/100 percent) 1153 1153 1153 11532. Utilized Capacity Index (DLHs/"x" percent) 1048 952 984 9963. Reserve Capacity Index (DLHs/"x" percent) 105 201 169 1574. Overhead Costs (as specified) $13.8 $13.9 $13.8 $15.15. IMC Requirement $2.5 $0.7 $2.0 $2.16. Funded IMC ($ in Millions) $0.6 $2.0 $0.6
Red River1. Total Capacity Index (DLHs/100 percent) 1849 1849 1849 18492. Utilized Capacity Index (DLHs/"x" percent) 1648 1553 1659 16603. Reserve Capacity Index (DLHs/"x" percent) 201 296 190 1894. Overhead Costs (as specified) $25.7 $32.8 $35.2 $38.65. IMC Requirement $6.3 $1.5 $3.6 $3.96. Funded IMC ($ in Millions) $2.3 $1.2 $3.6 $1.1
Tobyhanna1. Total Capacity Index (DLHs/100 percent) 3765 3765 3765 37652. Utilized Capacity Index (DLHs/"x" percent) 3063 2886 2915 28443. Reserve Capacity Index (DLHs/"x" percent) 702 879 850 9214. Overhead Costs (as specified) $24.0 $26.0 $26.6 $27.95. IMC Requirement $5.9 $2.7 $6.0 $6.86. Funded IMC ($ in Millions) $2.2 $6.0 $1.9
Total IMC Requirements $21.0 $7.3 $19.8 $22.3Total Funded IMC ($ in Millions) $3.4 $5.8 $19.8 $6.4

Army Working Capital Fund Fiscal Year (FY) 2004-2005 Biennial Budget Estimates
Ordnance
44
Functional Description The Ordnance Activity Group supports production of armaments and munitions; manufacture, renovation, and demilitarization of material; and ammunition stockpile management for all services within the Department of Defense and for foreign military customers. Three Major Subordinate Commands of the Army Materiel Command manage the business area. The Tank Automotive and Armaments Command, located at Warren, MI, manages Rock Island Arsenal, Watervliet Arsenal, and Sierra Army Depot. The Soldier Biological and Chemical Command, located at Aberdeen Proving Ground, MD, manages Pine Bluff Arsenal. The remaining installations are managed by the Joint Munitions Command, located at Rock Island, IL. The Ordnance group’s facilities provide the organic industrial capability to manufacture and sell quality munitions and large caliber weapons that are critical to the Army’s capability to execute its warfighting mission. A number of these facilities also provide the full range of ammunition maintenance for modern weapons. Primary customers include the Army, the other U.S. Military Services, and Foreign Military Sales (FMS) for our allies. The activity group is also responsible for logistics management, including follow-on procurement, production, maintenance, engineering, and integrated logistics support management of ordnance for all U.S. Military Services. Additionally, seven of the eight activities provide base support for tenants on the installations they manage. Activity Group Composition Pine Bluff Arsenal (PBA) Pine Bluff, AR Primary manufacturing capabilities include conventional ammunition and Chemical and Biological Defense Items to include: white phosphorous and red phosphorous munitions fill; signaling and obscuring smokes; incendiaries; irritants; and production and rebuild of decontaminating kits, large filters, masks and defensive chemical test equipment. Provides base support to tenants. Rock Island Arsenal (RIA) Rock Island, IL Primary materiel and industrial capabilities include aircraft weapons, infantry weapons, air defense weapons and artillery; armament for tanks, artillery, personnel and cargo carriers; and special tools and tool sets. Major in-house programs include: Maintenance Truck, Heavy; spare parts for M119 and M198 Towed Howitzers; Explosive Ordnance Disposal vehicles; and 120MM Gun Mount for Abrams Main Battle Tank. Provides base support to tenants. Watervliet Arsenal (WVA) Watervliet, NY Primary materiel and industrial responsibilities include mortars, recoilless rifles, cannon for tanks and towed and self-propelled artillery, special tool sets, and training devices

Army Working Capital Fund Fiscal Year (FY) 2004-2005 Biennial Budget Estimates
Ordnance
45
and simulators. Major in-house programs include: M256 Gun Tube, M284/M109A6 Howitzer, and XM297 Howitzer. Provides base support to tenants. Crane Army Ammunition Activity (CAAA) Crane, IN Primary materiel and industrial responsibilities include manufacturing; load and assembly; supply depot operations; and renovation, maintenance, and demilitarization of conventional ammunition and ammunition-related components. CAAA is a tenant on Crane Division, Naval Surface Warfare Center. McAlester Army Ammunition Activity (McAAP) McAlester, OK Primary materiel and industrial responsibilities include rapid outload, maintenance, and demilitarization of conventional ammunition and missiles, and ammunition manufacturing. McAAP is the premier bomb loading facility for DoD. Provides base support to tenants. Sierra Army Depot (SIAD) Herlong, CA Primary materiel and industrial responsibilities include receipt, storage, repair, assembly, disassembly, and shipment of major and secondary items for operational project stocks. Provides base support to tenants. Tooele Army Depot (TEAD) Tooele, UT Primary materiel and industrial responsibilities include design and development of Ammunition Peculiar Equipment. Stores, maintains, distributes, and demilitarizes conventional ammunition. Provides base support to tenants. Blue Grass Army Depot (BGAD) Richmond, KY Primary materiel and industrial responsibilities include receipt, issue, storage, testing, and minor repair of Chemical Defense Equipment. Stores, maintains, distributes, and demilitarizes conventional ammunition. Provides base support to tenants. Red River Munitions Center (RRMC) Texarkana, TX Stores, maintains, distributes, and demilitarizes conventional ammunition. Tenant on Red River Army Depot. Letterkenny Munitions Center (LEMC) Chambersburg, PA Stores, maintains, distributes, and demilitarizes conventional ammunition. Tenant on Letterkenny Army Depot. Anniston Munitions Center (ANMC) Anniston, AL Stores, maintains, distributes, and demilitarizes conventional ammunition. Tenant on Anniston Army Depot.

Army Working Capital Fund Fiscal Year (FY) 2004-2005 Biennial Budget Estimates
Ordnance
46
Budget Highlights Personnel: Personnel estimates for full time equivalents (FTE) are based on workload projections.
FY 2002 FY 2003 FY2004 FY2005Civilian End Strength 5,580 5,543 5,583 5,415Civilian FTEs (* FY02 includes overtime) 5,957 5,559 5,581 5,401Military End strength 17 18 18 18Military Average Strength 17 18 18 18
NOTE: For FY 2002 Civilian FTEs calculated without overtime would be 5,560. Cost, Operating Results, and Rates: Costs: The current FY 2003 “Cost of Goods and Services Produced” is $104.1 million lower than in the last President’s Budget for two main reasons. First, the last budget had $32.5 million of expenses for Civil Service Retirement System/Federal Employees Health Benefits (CSRS/FEHB), which are now to be funded outside the Ordnance business area. The other reason for the lower expenses is a $65.5 million reduction in the costs to be incurred in the maintenance of unutilized plant capacity (UPC) for mobilization contingencies. Both the funding and expenses for UPC were reduced in equal measure for FY 2003 as a result of a Congressional reduction in the Defense Working Capital Fund (DWCF) appropriation. The Army will attempt to reduce operating expenses to compensate for the loss of UPC funding. To the extent that we cannot achieve this full reduction the operating loss will be recovered in FY 2005. The cost increase in FY 2004 reflects normal UPC expenses. Unit Costs: Unit costs are calculated by dividing the total Cost of Goods Sold by Direct Labor Hours (DLHs). The FY 2003 unit cost in this submission decreases by $28.19 per DLH compared to the last President’s budget mainly due to the attempt to reduce UPC expenses by $65.5 million, lower CSRS/FEHB expenses, and more DLHs to be executed. The unit cost increases again in FY 2004 compared to FY 2003 because of normal UPC expenses and fewer DLHs to be executed.

Army Working Capital Fund Fiscal Year (FY) 2004-2005 Biennial Budget Estimates
Ordnance
47
Operating Results and Rates: The FY 2002 Accumulated Operating Results (AOR) exceeded the estimate of $18.1 million in the last President’s Budget by $163.5 million. This was mainly due recovery of $163.1 million for prior-year under-funding of UPC. The FY 2003 Net Operating Result (NOR) is now estimated to be $ .1 million, which is $18.1 million higher than the initial projected NOR of -$18.0 million. This is due to higher workload and lower programmed expenses. These revisions result in an FY 2003 AOR of $181.7 million. This AOR gain will be returned to customers over the next two fiscal years in order to minimize year-to-year variations in the customer revenue rate. FY 2002 FY 2003 FY 2004 FY 2005Cost of Goods & Services Produced ($M) 694.3 604.8 673.5 663.4Cost of Goods & Services Sold ($M) 696.1 608.6 672.9 663.4Net Operating Results ($M) -28.2 .1 -72.4 -109.4Accumulated Operating Results ($M) 181.6 181.7 109.4 0.0Customer Revenue Rate per DLH $94.59 $69.07 $70.05 $77.15Percent Change from Prior Year -7.9% -27.0% 1.4% 10.1%Unit Costs ($/DLH) 155.68 130.71 146.23 156.23DLH (000) 4,471 4,656 4,602 4,246Percentage of Overtime 11.9% 8.4% 7.4% 6.1% Cash Collections, Disbursements and Net Outlays: FY 2002 collections include recovery of $163.1 million and advance billings of $147.3 million. Collections in FY 2003 reflect the working off of the FY 2002 advance billings. FY 2004 and FY 2005 outlays reflect return of positive AOR through lower rates. Included in cash collections are direct appropriations of $54.2 million in FY 2003, $ 94.2 million in FY 2004 and $26.6 million in FY 2005.
($ in millions) FY 2002 FY 2003 FY 2004 FY 2005Collections 975.8 467.4 590.7 555.2Disbursements 699.9 673.8 663.2 685.7Net Outlays -275.9 206.4 72.5 130.5
Carry-over:
The FY 2004 budget includes a new metric for measuring the target amount of workload carryover at the industrial-type activities in the Defense Working Capital Fund. Carryover is the amount of work funded but not yet performed by the end of the fiscal year at the industrial-type activities such as depots or ordnance activities.

Army Working Capital Fund Fiscal Year (FY) 2004-2005 Biennial Budget Estimates
Ordnance
48
In FY 2001, the Congress directed the General Accounting Office (GAO) to study the carryover formula. The GAO recommended the Department of Defense determine an analytically based carryover formula to replace the “3- month, less exclusions” standard. The revised methodology provides a metric that is tailored to the workload of each business area.
Specifically, to measure the expected performance for each business area, the
revised methodology uses the outlay rates of the various customer appropriations to develop a unique business area target. The new methodology excludes work-in-process and some other orders, such as non-DoD customers, from the carryover amount. The new metric holds Working Capital Fund Activities to the same standard as work performed by all providers—whether private or public, and supports budget analysis rather than just performance against an arbitrary target.
Army Ordnance
The workload carryover target for the Army Ordnance business area is $230.2 million in FY 2004, or 47 percent. This amount and percentage is the same or lower than general fund outlay rates. After exclusions, the budgeted carryover is $102.0 million, or 21 percent. The table below shows the target and amount of funding that is budgeted for workload carryover. The FY 2002 actual New Order Carry-over exceeded the target by $3.9 million because of unplanned end-of-year bomb orders at McAlester Army Ammunition Plant, which were in support of Operation Noble Eagle/Enduring Freedom. ($ in millions) FY 2002 FY 2003 FY 2004 FY 2005 New Orders (excl. FMS, Non-DoD, & BRAC) 709.6 492.2 489.7 457.6 New Order Carry-over Target
326.4 236.3 230.2 219.6
Planned New Order Carry-over 330.3 127.0 102.0 136.8 Performance Indicators: Performance Indicators include Net Operating Results (financial), Schedule Conformance (timeliness), Scrap/ Rework/ Repair Costs, Quality Deficiency Reports (QDRs) and Customer Satisfaction (quality) and Productive Yield (productivity). FY 2002 actual results and goals for FY 2003 through FY 2005 are shown in the table below. In FY 2002, NOR was $20.4 million better than the FY 2003 PRESBUD goal of -$48.6 million. This was largely due to higher than planned revenue at McAlester Army
Army Working Capital Fund Fiscal Year (FY) 2004-2005 Biennial Budget Estimates
Ordnance
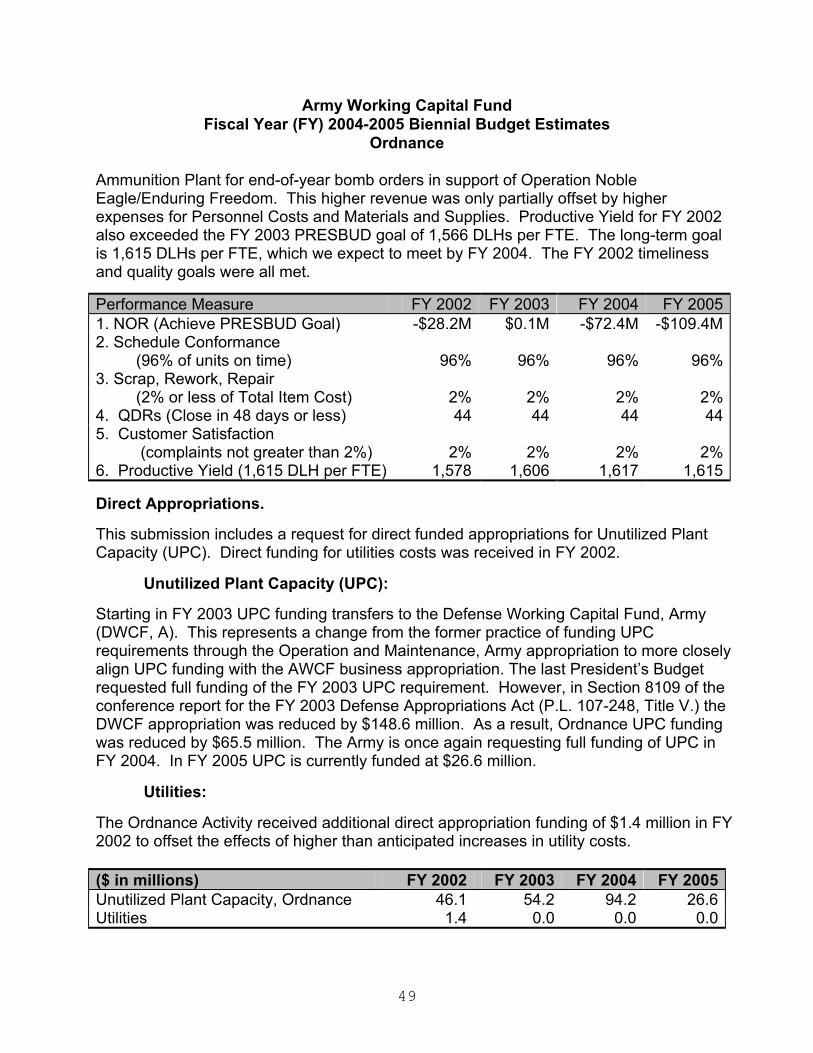
49
Ammunition Plant for end-of-year bomb orders in support of Operation Noble Eagle/Enduring Freedom. This higher revenue was only partially offset by higher expenses for Personnel Costs and Materials and Supplies. Productive Yield for FY 2002 also exceeded the FY 2003 PRESBUD goal of 1,566 DLHs per FTE. The long-term goal is 1,615 DLHs per FTE, which we expect to meet by FY 2004. The FY 2002 timeliness and quality goals were all met.
Performance Measure FY 2002 FY 2003 FY 2004 FY 20051. NOR (Achieve PRESBUD Goal) -$28.2M $0.1M -$72.4M -$109.4M2. Schedule Conformance (96% of units on time) 96% 96% 96% 96%3. Scrap, Rework, Repair (2% or less of Total Item Cost) 2% 2% 2% 2%4. QDRs (Close in 48 days or less) 44 44 44 445. Customer Satisfaction (complaints not greater than 2%) 2% 2% 2% 2%6. Productive Yield (1,615 DLH per FTE) 1,578 1,606 1,617 1,615 Direct Appropriations. This submission includes a request for direct funded appropriations for Unutilized Plant Capacity (UPC). Direct funding for utilities costs was received in FY 2002.
Unutilized Plant Capacity (UPC): Starting in FY 2003 UPC funding transfers to the Defense Working Capital Fund, Army (DWCF, A). This represents a change from the former practice of funding UPC requirements through the Operation and Maintenance, Army appropriation to more closely align UPC funding with the AWCF business appropriation. The last President’s Budget requested full funding of the FY 2003 UPC requirement. However, in Section 8109 of the conference report for the FY 2003 Defense Appropriations Act (P.L. 107-248, Title V.) the DWCF appropriation was reduced by $148.6 million. As a result, Ordnance UPC funding was reduced by $65.5 million. The Army is once again requesting full funding of UPC in FY 2004. In FY 2005 UPC is currently funded at $26.6 million. Utilities: The Ordnance Activity received additional direct appropriation funding of $1.4 million in FY 2002 to offset the effects of higher than anticipated increases in utility costs. ($ in millions) FY 2002 FY 2003 FY 2004 FY 2005Unutilized Plant Capacity, Ordnance 46.1 54.2 94.2 26.6Utilities 1.4 0.0 0.0 0.0

Army Working Capital Fund Fiscal Year (FY) 2004-2005 Biennial Budget Estimates
Ordnance
50
Capital Budget: The Ordnance Capital Investment Program (CIP) is comprised of four project categories: Equipment: In FY 2003, Rock Island Arsenal will purchase a new 4-axis CNC Horizontal Milling machine and Crane Army Ammunition Activity will purchase Resource Recovery and Recycling equipment to preclude reliance on open burn and open detonation disposal techniques. In FY 2004, $24.3 million will be expended for the White Phosphorus Facility Upgrade at Pine Bluff Arsenal to automate manual operations and reduce health and safety hazards for operators. Various minor capital equipment projects will be purchased in FY 2003 and FY 2004 to improve efficiency, reduce maintenance costs, increase capacity, replace unsafe or unusable assets, and allow compliance with regulatory agency mandates. Minor Construction: Minor construction projects in FY 2003 and FY 2004 will be undertaken to replace or upgrade installation facilities that cause poor working conditions or health hazards, reduce productivity, lack energy conservation features, compromise security, or fail to comply with fire and safety codes. Automated Data Processing Equipment (ADPE): ADPE projects in FY 2004 will be undertaken to replace obsolete and unrepairable equipment with state-of-the-art equipment. The Network Enterprise Management System at Rock Island Arsenal will enable network managers to implement software upgrades and diagnose and fix user problems from a central point. Software: Funding continues in FY 2003 and FY 2004 for the Army Workload and Performance System (AWPS), a congressionally mandated project that employs state-of-the-art software technology to better manage complex workload and personnel strategies for depot maintenance, ammunition, base operations, logistics and manufacturing workload. In FY 2004, the Industrial Base Modernization projects will modernize the logistics chain processes at Watervliet and Pine Bluff Arsenals and integrate the numerous legacy systems within the standard Enterprise Resource Planning (ERP) solution of the Logistics Modernization Program. ($ in millions) FY 2002 FY 2003 FY 2004 FY 2005Equipment 3.1 9.2 35.1 26.8ADPE & Telecommunications 1.9 0.0 2.6 3.6Minor Construction 1.0 1.8 8.5 8.5Software 4.7 4.7 12.3 3.1
TOTAL Capital Investment Program 10.7 15.7 58.5 42.1

Army Working Capital Fund Fiscal Year (FY) 2004-2005 Biennial Budget Estimates
Ordnance
51
Revenue and Expenses
($ in Millions) FY 2002 FY 2003 FY 2004 FY 2005
RevenueGross Sales: 668.4 609.0 600.5 554.0
Operations 649.1 590.1 581.0 534.2Surcharges 1.9 0.3Depreciation excluding Major Construction 17.4 18.6 19.5 19.7Major Construction Depreciation
Other Income (Appropriated Capital - Utilities 1.4
Total Income: 669.8 609.0 600.5 554.0
ExpensesSalaries and Wages: 356.9 356.8 354.3 346.1
Military Personnel Compensation & Benefits 0.6 1.6 1.4 1.4Civilian Personnel Compensation & Benefits 356.2 355.2 352.9 344.7
Travel & Transportation of Personnel 4.0 5.5 5.6 5.7Materials & Supplies (For Internal Operations) 112.7 88.0 88.3 82.3Equipment 7.6 7.5 7.2 7.3Other Purchases from Revolving Funds 48.8 47.0 45.7 46.6Transportation of Things 5.1 4.2 4.2 4.3Depreciation - Capital 17.4 18.6 19.5 19.7Printing and Reproduction 0.8 0.8 0.8 0.8Advisory and Assistance Services 2.1 0.6 0.5 0.5Rent, Communication, Utilities, & Misc. Charges 21.1 22.1 22.4 22.6Other Purchased Services 117.9 53.7 124.7 127.5
Total Expenses: 694.3 604.8 673.5 663.4
Operating Result -24.5 4.2 -73.0 -109.4
Less Surcharge Reservations 1.9 0.3Cash (Carried Over) 1.9 0.3
Other Changes Affecting NOR: -1.8 -3.8 0.6 0.0Net Change in Work in Process 1.8 3.8 -0.6 0.0
Net Operating Result -28.2 0.1 -72.4 -109.4
Prior Year Adjustments (Current Year) 158.2Cash Infusion 163.1Other Accounting Adjustments -4.9
Non-Recoverable Amounts (Current Year)Current Year Recoverable Prior Year Adjustments 158.2Prior Year Recoverable Accumulated Operating Result 51.6 181.6 181.7 109.4
Recoverable Accumulated Operating Result 181.6 181.7 109.4 0.0Memo:
Beginning Work in Process 6.6 4.8 1.0 1.6Ending Work in Process 4.8 1.0 1.6 1.7
Cost of Goods Sold: 696.1 608.6 672.9 663.4

Army Working Capital Fund Fiscal Year (FY) 2004-2005 Biennial Budget Estimates
Ordnance
52
Source of Revenue ($ in Millions)
FY 2002 FY 2003 FY 2004 FY 2005
1. New Ordersa. Orders from DoD Components:
Department of ArmyOperations & Maintenance, Army 310.7 196.9 192.0 186.9Operations & Maintenance, ARNG 0.1 0.4 0.4 0.4Operations & Maintenance, AR 0.1
Subtotal, O&M: 310.9 197.3 192.4 187.3
Aircraft Procurement 8.5 3.3 4.1 5.0Missile Procurement 4.7 1.6 2.6 3.0W eapons & Tracked Combat Vehicles 39.5 13.5 14.4 21.0Procurement of Ammunition 145.1 55.9 42.3 30.9Other Procurement 32.8 31.9 20.6 35.8
Subtotal, Procurement: 230.6 106.3 84.0 95.8
RDTE 9.1 6.2 6.3 7.2BRAC 1.0 0.7 0.8 0.8Family Housing 1.5 1.4 1.2 1.3Military Construction 5.8Chem Agents & Munitions Dest, Army 2.7 5.5 3.6 3.7Other 2.0 2.3 1.0 1.7
Subtotal, Department of Army: 563.6 319.7 289.3 297.7
Department of Air Force O&M 4.2 3.1 3.1 1.3Department of Air Force Investment 17.1 6.2 14.9Department of Navy O&M 1.4 4.4 4.5 5.1Department of Navy Investment 12.5 5.7 4.9US Marines O&M 2.3 5.2 3.3 3.5US Marines Investment 5.6 13.9 26.0Department of Defense O&M 1.9 0.2 0.2 0.2Department of Defense Investment
Subtotal, Other DoD Services: 9.7 48.1 37.0 55.9
Other DoD Agencies: 35.5 10.0 11.8 12.6Other DoD Agencies 35.4 10.0 11.8 12.6CAW CF 0.0

Army Working Capital Fund Fiscal Year (FY) 2004-2005 Biennial Budget Estimates
Ordnance
53
Source of Revenue ($ in Millions)
FY 2002 FY 2003 FY 2004 FY 2005b. DWCF:
Depot Maintenance, Army 3.8 5.9 5.3 6.2Information Services, ArmyOrdnance, Army 4.7 2.4 2.5 2.5Supply Management, Army 69.1 35.5 36.3 42.7Supply Management, Air Force 3.8 2.2 2.4 1.7Supply Management, Navy 3.0 0.5 0.5 0.6Supply Management, Marine Corps 0.0DECA 0.1 0.1 0.1 0.1DFAS 1.8 2.1 2.3 2.4DISA 1.0 1.0 1.1 1.1DLA 0.8 0.7 0.8 0.7JLSCTRANSCOMIMC (UPC) 54.2 94.2 26.6Other 13.6 10.6 7.0 7.5
Subtotal, DWCF: 101.8 115.2 152.4 92.2
c. Total DoD 710.6 493.0 490.5 458.4
d. Other Orders: 46.5 23.5 30.0 27.9Other Federal Agencies 11.9 4.4 5.5 5.7Foreign Military Sales 25.7 5.3 18.5 17.0Trust FundNonappropriated 3.2 0.7 3.1 1.2Non-Federal Agencies 5.6 13.0 2.8 4.0
Total New Orders: 757.1 516.4 520.5 486.2
Carry-over Calculation FY2002 FY2003 FY2004 FY2005
New Orders (excluding FMS, Non-Dod, and BRAC) 709.6 492.2 489.7 457.6New Order Carry-over Target 326.4 236.3 230.2 219.6Planned Carry-over 330.3 127.0 102.0 136.8

Army Working Capital Fund Fiscal Year (FY) 2004-2005 Biennial Budget Estimates
Ordnance
54
Changes in Costs of Operation ($ in Millions)
ExpensesFY 2002 Actual Cost 694.3
FY 2003 Estimate in President's Budget 708.9
Pricing Adjustments 1.5FY 2003 Pay Raise
Civilian Personnel 1.5Military Personnel 0.0
Program Changes -105.6Personnel Costs (other than A-76) -23.4Travel and Transportation of Personnel -2.4Material and Supplies (Internal Operations) -5.4Equipment -3.4Other Purchases from Revolving Funds -1.1Transportation of Things 2.0Depreciation -3.4Printing and Reproduction 0.0Advisory and Assistance Services -1.5Rent, Communications, Utilities and Miscellaneous Charges -1.5UPC Expense Reduction -65.5
FY 2003 Current Estimate 604.8
Pricing Adjustments 9.6Annualization of Prior Year Pay Raises 2.2FY 2004 Pay Raise 4.3
Civilian Personnel 4.3Military Personnel 0.0
Fund Price Changes 0.5General Purchase Inflation 2.6
Program Changes 59.1Personnel Costs (other than A-76) -9.0Travel and Transportation of Personnel 0.1Material and Supplies (Internal Operations) -0.7Equipment -0.4Other Purchases from Revolving Funds -1.9Transportation of Things 0.0Depreciation 0.9Printing and Reproduction 0.0Advisory and Assistance Services -0.1Rent, Communications, Utilities and Miscellaneous Charges 0.0UPC Full Funding 70.3
FY 2004 Estimated Cost 673.5

Army Working Capital Fund Fiscal Year (FY) 2004-2005 Biennial Budget Estimates
Ordnance
55
Unutilized Plant Capacity ($ and DLHs in Millions)
FY 2002 FY 2003 FY 2004 FY 2005
Pine Bluff Arsenal1. Total Capacity Index (DLHs) 2.512 2.512 2.288 2.2882. Utilized Capacity Index (DLHs) 0.673 0.725 0.704 0.7043. Reserve Capacity Index (DLHs) 1.839 1.787 1.584 1.5844. Overhead Costs (as specified) 29.674 30.3285. IMC Requirement 24.665 20.544 20.9966. Funded IMC ($s) 12.132 11.165 20.544 5.885
Rock Island Arsenal1. Total Capacity Index (DLHs) 1.808 1.797 1.833 1.5852. Utilized Capacity Index (DLHs) 0.578 0.618 0.625 0.5853. Reserve Capacity Index (DLHs) 1.230 1.179 1.208 1.0004. Overhead Costs (as specified) 19.847 20.0955. IMC Requirement 14.808 12.907 12.2386. Funded IMC ($s) 7.655 6.703 12.907 3.430
W atervliet Arsenal1. Total Capacity Index (DLHs) 0.773 0.728 0.697 0.6532. Utilized Capacity Index (DLHs) 0.230 0.163 0.162 0.1183. Reserve Capacity Index (DLHs) 0.543 0.565 0.535 0.5354. Overhead Costs (as specified) 18.523 18.7715. IMC Requirement 25.224 14.226 15.3736. Funded IMC ($s) 7.977 11.418 14.226 4.308
Crane Ammo Activity1. Total Capacity Index (DLHs) 2.601 2.715 3.482 3.4252. Utilized Capacity Index (DLHs) 0.794 0.786 0.754 0.6863. Reserve Capacity Index (DLHs) 1.807 1.929 2.728 2.7394. Overhead Costs (as specified) 22.762 23.5205. IMC Requirement 15.941 20.113 21.2536. Funded IMC ($s) 6.314 7.216 20.113 5.956
McAlester Army Ammo Plant1. Total Capacity Index (DLHs) 3.635 3.678 6.919 6.7632. Utilized Capacity Index (DLHs) 1.036 1.069 1.120 0.9523. Reserve Capacity Index (DLHs) 2.599 2.609 5.799 5.8114. Overhead Costs (as specified) 21.006 19.9925. IMC Requirement 20.723 17.842 16.2316. Funded IMC ($s) 8.801 9.381 17.842 4.549

Army Working Capital Fund Fiscal Year (FY) 2004-2005 Biennial Budget Estimates
Ordnance
56
Unutilized Plant Capacity ($ and DLHs in Millions)
FY 2002 FY 2003 FY 2004 FY 2005
Blue Grass army Depot1. Total Capacity Index (DLHs) 0.873 0.833 1.840 1.7812. Utilized Capacity Index (DLHs) 0.569 0.553 0.548 0.4893. Reserve Capacity Index (DLHs) 0.304 0.280 1.292 1.2924. Overhead Costs (as specified) 7.140 7.5495. IMC Requirement 4.164 4.560 4.8106. Funded IMC ($s) 1.670 1.885 4.560 1.348
Sierra Army Depot1. Total Capacity Index (DLHs) 0.534 0.599 0.511 0.4982. Utilized Capacity Index (DLHs) 0.254 0.395 0.342 0.3293. Reserve Capacity Index (DLHs) 0.280 0.204 0.169 0.1694. Overhead Costs (as specified) 2.560 2.5605. IMC Requirement 12.723 2.253 2.2536. Funded IMC ($s) 0.935 5.759 2.253 0.631
Tooele Army Depot1. Total Capacity Index (DLHs) 0.684 0.716 0.541 0.5772. Utilized Capacity Index (DLHs) 0.337 0.347 0.346 0.3833. Reserve Capacity Index (DLHs) 0.347 0.369 0.195 0.1944. Overhead Costs (as specified) 2.089 2.1395. IMC Requirement 1.425 1.717 1.7586. Funded IMC ($s) 0.599 0.645 1.717 0.493
Total IMC Requirement 119.673 94.162 94.912Total IMC Funding 46.083 54.173 94.162 26.600

Army Working Capital Fund Fiscal Year (FY) 2004/2005 Biennial Budget Estimates
Information Services
57
Functional Description The Information Services Activity Group has two major missions. The first mission is to provide for the development and sustainment of automated information and communications systems. This activity provides a multitude of services including requirements analysis and definition, system design, development testing, integration, implementation support, and documentation of services in support of the Department of Defense and Foreign Military Sales customers. The second mission is to provide commercial sources for purchase of small/medium computers, hardware, software, and support services. Effective FY 2002 and continuing into FY 2003, stabilized rates in this activity group are eliminated and all customers will pay for services through direct reimbursement. Information Services will be decapitilized from the Army Working Capital Fund at the end of FY 2003. Activity Group Composition This activity group consists of the following activities: 1. Software Engineering Centers provide support for Personnel and Retail Logistics Systems. They include:
a. Software Engineering Center-Washington (SEC- Meade), Fort Meade, MD. b. Software Engineering Center-Lee (SEC-Lee), Fort. Lee, VA.
2. Logistics Support Office (LSO), Chambersburg, PA, and St. Louis, MO. 3. Army Small Computer Program (SCP), Fort Monmouth, N.J. Budget Highlights Personnel: Overall, the Civilian End Strength decreased by 29 positions from FY 2002 to FY 2003. This is commensurate with the projected workload.
FY 2002 FY 2003 Civilian End Strength 276 259 Civilian FTEs 276 266 Military End Strength 7 5 Military Average Strength 7 6

Army Working Capital Fund Fiscal Year (FY) 2004/2005 Biennial Budget Estimates
Information Services
58
Costs and Operating Results: The budget reflects business operations on a cost reimbursable basis during FY 2002 and FY 2003 and is workload driven. FY 2003 costs decrease due to the continued migration of customer workload from this revolving fund activity to contracts executed directly by the customers seeking products and services. With the decapitilization at the end of FY 2003, any Recoverable AOR will be transferred to the Supply Management Activity. ($ in millions) FY 2002 FY 2003 Cost of Goods ands Services Sold 100.2 95.3 Net Operating Result 3.7 0.0 Recoverable Accumulated Operating Results 9.8 9.8 DLH (000) 268.0 201.0 Cash Collections, Disbursements and Net Outlays: ($ in millions) FY 2002 FY 2003 Collections 101.0 96.7 Disbursements 102.6 96.8 Net Outlays 1.6 .1
Performance Indicators: Net Operating Result is the primary performance indicator for Information services. The Information Services budget reflects operation on a cost reimbursable basis in FY 2002 and FY 2003 rather than a stabilized billing rate. Direct Appropriations. This submission includes direct funding in the Defense Working Capital Fund for Utilities costs. ($ in Millions) FY 2002 FY 2003 Utilities 0.1 0.0
Capital Budget: There are no capital projects required for the Information Services Working Capital Fund.

Army Working Capital Fund Fiscal Year (FY) 2004/2005 Biennial Budget Estimates
Information Services
59
Revenue and Expenses ($ in Millions)
FY 2002 FY 2003
RevenueGross Sales: 103.7 95.2
Operations 103.6 95.2SurchargesDepreciation excluding Major Construction 0.1 0.1Major Construction Depreciation
Other Income 0.1 0.0Refunds/Discounts (-)
Total Income: 103.8 95.3
ExpensesSalaries and Wages: 25.8 23.5
Military Personnel Compensation & Benefits 0.3 0.3Civilian Personnel Compensation & Benefits 25.5 23.2
Travel & Transportation of Personnel 1.1 1.0Materials & Supplies (For Internal Operations) 0.4 0.4Equipment 0.8 0.7Other Purchases from Revolving Funds 1.2 1.2Transportation of Things 0.0 0.0Depreciation - Capital 0.1 0.1Printing and Reproduction 0.0 0.0Advisory and Assistance Services 1.7 1.8Rent, Communication, Utilities, & Misc. Charges 0.7 0.6Other Purchased Services 68.3 65.9
Total Expenses: 100.2 95.3
Operating Result 3.7 0.0
Less Surcharge ReservationsCashCapital
Plus Appropriations Affecting NOR/AOROther Changes Affecting NOR:
Other Inventory AdjustmentsNet Change in Work in Process
Net Operating Result 3.7 0.0
Prior Year Adjustments 6.5 0.0
Prior Year Recoverable Accumulated Operating Result (0.4) 9.8
Non-Recoverable Amounts (Current Year)
Recoverable Accumulated Operating Result 9.8 9.8

Army Working Capital Fund Fiscal Year (FY) 2004/2005 Biennial Budget Estimates
Information Services
60
Source of Revenue ($ in Millions)
FY 2002 FY 2003
1. New Ordersa. Orders from DoD Components:
Department of ArmyOperations & Maintenance, Army 35.1 29.5Operations & Maintenance, ARNG 0.0 0.0Operations & Maintenance, AR 0.0 0.2
Subtotal, O&M: 35.1 29.6
Other Procurement 0.0 0.5Subtotal, Procurement: 0.0 0.5
RDTE 3.9 0.1Family Housing 3.2 3.4Other 0.0 0.2
Subtotal, Department of Army: 42.2 33.8
Department of Air Force O&M 0.0 0.0Department of Navy O&M 0.1 0.6Department of Defense O&M 0.0 0.0
Subtotal, Other DoD Services: 0.1 0.6
Other DoD Agencies: 2.8 2.0Other DoD Agencies 2.8 1.6CAW CF 0.0 0.4
b. DW CF:Depot Maintenance, Army 11.0 0.0Information Services, Army 0.2 11.2Supply Management, Army 40.9 35.2DECA 1.5 1.6DISA 0.0 0.2Other 0.0 0.0
Subtotal, DW CF: 53.5 48.2
c. Total DoD 98.6 84.6
d. Other Orders: (0.2) 0.4Other Federal Agencies (0.2) 0.2Foreign Military Sales 0.0 0.0Trust Fund 0.0 0.0Nonappropriated 0.0 0.0Non-Federal Agencies 0.0 0.2
Total New Orders: 98.4 85.0

Army Working Capital Fund Fiscal Year (FY) 2004/2005 Biennial Budget Estimates
Information Services
61
Change in the Costs of Operations ($ in Millions)
Expenses
FY 2002 Actual Cost 100.2
FY 2003 Estimate in President's Budget 96.6
Estimated Impact in FY 2003 of Actual FY 2002 Actions
Pricing Adjustments
Program Changes -1.3Military Personnel Compensation -0.3Civilian Personnel Compensation -3.6Travel Costs 0.2Supplies
Equipment Purchases 0.4
Advisory and Assistance Services -1.1Utilities -0.1Miscellaneous/Other Purchased Services 3.2
FY 2003 Current Estimate 95.3

Army Working Capital Fund Fiscal Year (FY) 2004/2005 Biennial Budget Estimates
CAPITAL BUDGET
62

Activity Group Capital Investment SummarySupply Management, Army
($ in Millions)FY 02 FY03 FY 04 FY 05
Line No. Description Quantity Total Cost Quantity Total Cost Quantity Total Cost Quantity Total Cost
AUTOMATED DATA PROCESSING03-1 Acquisition System 7 1.78004-1 Secondary Item Infrastructure Server 16 1.578 16 1.60704-3 Terminal Servers 1 0.894
ADP TOTAL 7 1.780 16 2.471 16 1.607
SOFTWARE97-6 Single Stock Fund (SSF) 3 32.599 3 31.797 3 7.710 3 2.38899-4 Commercial Asset Visibility II ( CAV II) 27 1.937 27 1.728 25 1.397 00-2 Logistics Modernization Program (LMP) 1 21.743 1 30.293 3 28.050 2 21.52998-14 Common Operating Environment (COE) 1 4.900 1 7.081 1 2.066 1 1.30004-8 Electronic Data Interchange (EDI) 1 1.235 1 0.43704-7 Exchange Pricing 3 20.90004-9 Future Logistics Enterprise (FLE)/Transformation 2 0.520
SOFTWARE TOTAL 32 61.179 32 92.319 32 40.458 6 25.654
Activity TOTAL 32 61.179 39 94.099 48 42.929 22 27.261
Total Capital Outlays 71.118 32.143 40.375 47.437Total Depreciation Expense 48.600 67.200 71.000 63.100
63 Exhibit Fund-9a Activity Group Capital Investment Summary

ACTIVITY GROUP CAPITAL INVESTMENT JUSTIFICATION A. Budget SubmissionAUTOMATED DATA PROCESSING FY 2004-2005
($ in Thousands) OSD/OMB Submission
B. Component, Activity Group, Date C. Line No Item Description D. Activity IdentificationSupply Management, Army Feb 03 03-1 Acquisition System AMCOM
FY02 FY03Element of Cost Quantity Unit Cost Total Cost Quantity Unit Cost Total Cost Quantity Unit Cost Total Cost Quantity Unit Cost Total CostLAN Servers, Compaq 8500 6 270.000 1,620.000Hardware Upgrade 1 160.000 160.000
TOTAL 7 1,780.000Narrative Justification:
ECONOMIC INDICATORS:Total Cost of the Project $1,780 Net Present Value of Benefits: $5.249 Benefit to Investment Ratio: 2.83 Payback Period: 1.91
FY04 FY05
a. CAPABILITY OF EXISTING EQUIPMENT AND SHORTCOMINGS: The efficiency of the U.S. Army Aviation and Missile Command Acquisition Center depends on the current servers, which have reached full capacity. The Acquisition Center also has 500 obsolete Pentium II personal computers which need to be upgraded at least to Pentium III for better service. The current system also lacks sufficient disk space and memory.
b. ANTICIPATED BENEFITS: The upgrade to more efficient servers will provide additional memory and more efficient processing. The new personal computers will replace obsolete ones and support new missions. Greater efficiency is required by the growing electronic commerce environment. The hardware upgrade will provide additional memory and allow the receipt of electronic proposals.
c. IMPACT WITHOUT PROPOSED CAPITAL INVESTMENT: Aviation and Missile Command (AMCOM) will not be able to meet the requirements of electronic commerce or new missions. The efficiency of acquisition personnel will be encumbered by the inability to receive electronic proposals. The slow response time and lack of memory will continue to encumber personnel in an open system environment.
d. ECONOMIC ANALYSIS PERFORMED? Yes
64 Exhibit Fund-9b Activity Group Capital Investment Justification

ACTIVITY GROUP CAPITAL INVESTMENT JUSTIFICATION A. Budget SubmissionAUTOMATED DATA PROCESSING FY 2004-2005
($ in Thousands) OSD/OMB Submission
B. Component, Activity Group, Date C. Line No Item Description D. Activity IdentificationSupply Management, Army Feb 03 04-1 Secondary Item Infrastructure Server AMCOM
FY 02 FY03Element of Cost Quantity Unit Cost Total Cost Quantity Unit Cost Total Cost Quantity Unit Cost Total Cost Quantity Unit Cost Total CostServer 2 104.718 209.436 2 107.701 215.402CPUs 10 110.474 1,104.740 10 112.546 1,125.460Network Hardware 2 23.366 46.732 2 23.807 47.614Backup Recovery Hardware 2 108.309 216.618 2 109.311 218.622
TOTAL 16 1,577.526 16 1,607.098Narrative Justification:
ECONOMIC INDICATORS:Total Cost of the Project $3,185 Net Present Value of Benefits: $2,353 Benefit to Investment Ratio: N/A Payback Period: 2.7
FY 04 FY 05
a. CAPABILITY OF EXISTING EQUIPMENT AND SHORTCOMINGS: Our current enterprise architecture consist of many small to medium size computers that are nearing or past their projected life cycle usefulness. Most of our Hewlett Packard (HP) computers will no longer be supported by HP by second quarter 2002. These servers are required to enable AMCOM to remain at a high degree of Logistical readiness to meet mandated requirements that all AMCOM applications be web enabled. The proliferation of SIPRNET requirements in support of AMCOM emergency operations along with ever increasing taskings, require AMCOM to upgrade its enterprise servers.
b. ANTICIPATED BENEFITS: Our primary enterprise software is licensed by the processor and the majority of our computers have multiple processors. One license often costs much more than small and medium size computers, resulting in a non-cost effective model. Server consolidation will result in lower labor and maintenance cost and also help standardize our mid-tier infrastructure. These servers are critical to support the Logistics and Acquisition missions during the transition phase from modernization of Commodity Command Standard System (CCSS) to the Logistics Modernization Program (LMP). This upgrade of our total computing capacity supports Secondary Items.
c. IMPACT WITHOUT PROPOSED CAPITAL INVESTMENT: Managing many small and medium size computers is complex and requires a manpower intensive effort. As these computers and their system software age beyond life cycle usefulness, parts are no longer supported by the manufacturer resulting in increased maintenance/repair costs.
d. ECONOMIC ANALYSIS PERFORMED? Yes
65 Exhibit Fund-9b Activity Group Capital Investment Justification

ACTIVITY GROUP CAPITAL INVESTMENT JUSTIFICATION A. Budget SubmissionAUTOMATED DATA PROCESSING FY 2004-2005
($ in Thousands) OSD/OMB Submission
B. Component, Activity Group, Date C. Line No Item Description D. Activity IdentificationSupply Management, Army Feb 03 04-3 Terminal Servers CECOM
FY 02 FY03Element of Cost Quantity Unit Cost Total Cost Quantity Unit Cost Total Cost Quantity Unit Cost Total Cost Quantity Unit Cost Total CostHardware/Software 1 893.500 893.500
TOTAL 1 893.500Narrative Justification:
ECONOMIC INDICATORS:Total Cost of the Project $894 Net Present Value of Benefits: $1,490 Benefit to Investment Ratio: 2.7 Payback Period: N/A
FY 04 FY 05
a. CAPABILITY OF EXISTING EQUIPMENT AND SHORTCOMINGS: Currently, the Acquisition Center has stand alone desktops, which require tremendous administrative support to maintain, upgrade, provide security, and load software. This limits the amount of resources available for other hardware/software projects that individuals could be involved in. In addition, stand alone desktops are susceptible to destructive viruses.
b. ANTICIPATED BENEFITS: By going to a terminal server environment, this will decrease the number of support personnel needed for administrative purposes. Thus, allowing them to work in other areas of computer support. We will also have the ability to monitor the type of information downloaded on the individual machines which will enhance security and virus protection. Workload productivity will increase due to quicker access to necessary software programs.
c. IMPACT WITHOUT PROPOSED CAPITAL INVESTMENT: Communications-Electronics Command (CECOM) Acquisition center will continue to function and support the mission inefficiently using outdated "dummy" terminal.
d. ECONOMIC ANALYSIS PERFORMED? Yes.
66 Exhibit Fund-9b Activity Group Capital Investment Justification

ACTIVITY GROUP CAPITAL INVESTMENT JUSTIFICATION A. Budget SubmissionSOFTWARE FY 2004-2005
($ in Thousands) OSD/OMB Submission
B. Component, Activity Group, Date C. Line No Item Description D. Activity IdentificationSupply Management, Army Feb 03 97-6 Single Stock Fund (SSF) Army Materiel Command
FY 02 FY03Element of Cost Quantity Unit Cost Total Cost Quantity Unit Cost Total Cost Quantity Unit Cost Total Cost Quantity Unit Cost Total CostTRAVEL 1 300.000 300.000 1 250.000 250.000 1 20.000 20.000 1 10.000 10.000CONTRACTS 1 28,153.000 28,153.000 1 27,507.000 27,507.000 1 4,760.000 4,760.000 1OTH GOV'T AGENCIES 1 4,146.000 4,146.000 1 4,040.000 4,040.000 1 2,930.000 2,930.000 1 2,378.000 2,378.000
TOTAL 3 32,599.000 3 31,797.000 3 7,710.000 3 2,388.000Narrative Justification:
ECONOMIC INDICATORS:Total Cost of the Project $142,404 Net Present Value of Benefits: $446,671 Benefit to Investment Ratio: 4.19 Payback Period: 4.45
FY 04 FY 05
a. CAPABILITY OF EXISTING EQUIPMENT AND SHORTCOMINGS: The Army Stock Fund formerly had a horizontal management structure with two points of sale. Supply and financial operations were decentralized to the Army Materiel Command (AMC) for the wholesale level and to other Major Commands (MACOMs) for the retail level. The MACOMs further decentralized retail operations to their installations. Decentralized stock record accounting generated redundant supply inventories and allowed retail managers to order supplies the Army didn't need. The streamlining of operations has eliminated numerous inefficiencies, including multiple points of sale and multiple credit ledgers/billing accounts, and duplicative automated systems managing thsame inventory. b. ANTICIPATED BENEFITS: SSF milestones 1&2, implemented in FY01, have effectively integrated retail and wholesale inventory management and financial accounting functions to produce business process improvements and inventory efficiencies. SSF has eliminated one point of sale for Army managed items— between AMC and the Installation Area Support Groups (ASG). The ASG stocks, formerly in the retail stock fund, are now owned and controlled by the National managers, eliminating duplication of logistical and financial processing and supports velocity management through reduction of order-ship-time and greater visibility of excess assets for redistribution and procurement offsets. Global asset visibility and central ownership of installation inventories will prevent buying what the Army already owns and disposing of what it still needs, thereby increasing readiness. It will also enable central managers to respond more rapidly than the installation could to high priority Non-Mission Capable Supply (NMCS) requisitions. SSF is a re-engineering of Army logistical and financial processes in a legacy system environment. TheArmy’s information technology modernization initiatives, such as the Logistics Modernization Program (LMP) and the Global Combat Support System-Army (GCSS-A), will incorporate these reengineered processes. MS 1&2 capitalized installation/ASG inventories; MS3 (FY02-03) will capitalize tactical authorized stockage level (ASLs) stocks.
CONTINUED ON NEXT PAGE
67 Exhibit Fund-9b Activity Group Capital Investment Justification

ACTIVITY GROUP CAPITAL INVESTMENT JUSTIFICATION A. Budget SubmissionSOFTWARE FY 2004-2005
($ in Thousands) OSD/OMB Submission
B. Component, Activity Group, Date C. Line No Item Description D. Activity IdentificationSupply Management, Army Feb 03 97-6 Single Stock Fund (SSF) Army Materiel Command
FY 02 FY03Element of Cost Quantity Unit Cost Total Cost Quantity Unit Cost Total Cost Quantity Unit Cost Total Cost Quantity Unit Cost Total Cost
TOTALNarrative Justification:
ECONOMIC INDICATORS:Total Cost of the Project Net Present Value of Benefits: Benefit to Investment Ratio: Payback Period:
FY 04 FY 05
CONTINUED FROM PRECEDING PAGE.
c. IMPACT WITHOUT PROPOSED CAPITAL INVESTMENT: The business rule changes developed for SSF are part of the foundation for the development of the LMP objective system and of the GCSS-A. If funding is not approved SSF, milestone 3 (MS3) will be jeopardized. Funding is required to complete system changes (FY01 & FY02) and systems integration testing (FY02) critical to MS3. A Verification of Initial Operational Capability (VIOC) is to be conducted at Fort Hood, Texas (FY02). Training must also be conducted prior to implementation (FY02-03). As downsizing minimizes funding and resources, the redundancies of processing wholesale and retail systems must be minimized. Also, efficiencies must be gained in the redistribution of assets. Milestone 3 was delayed by 12 months because of decisions to add a VIOC and reinstate requisition processing by “Requisition Order Number/Document Order Number” (RON/DON). In addition, thedecision to exclude “Direct Support/Repair Exchange” (DS/RX) will require significant systems changes to Standard Army Retail Standard System (SARSS), Commodity Command Standard System (CCSS) and SSF middleware. Without the requested funding for FY03 the ability to meet the CSA directive to implement this program will be at risk. d. ECONOMIC ANALYSIS PERFORMED? Yes. The initial Economic Analysis was performed in FY1995. A subsequent Cost Benefit analysis (CBA) was performed in 1997. Another CBA was performed in 1999 and validated by CEAC and AAA. The SSF was directed under Defense Management Report Directives (DMRD) 901 and 927J, November 1989. There have been no significant changes to the SSF program since the 1999 CBA.
68 Exhibit Fund-9b Activity Group Capital Investment Justification

ACTIVITY GROUP CAPITAL INVESTMENT JUSTIFICATION A. Budget SubmissionSOFTWARE FY 2004-2005
($ in Thousands) OSD/OMB Submission
B. Component, Activity Group, Date C. Line No Item Description D. Activity IdentificationSupply Management, Army Feb 03 99-4 Commercial Asset Visibility II ( CAV II) Army Materiel Command
FY 02 FY03Element of Cost Quantity Unit Cost Total Cost Quantity Unit Cost Total Cost Quantity Unit Cost Total Cost Quantity Unit Cost Total CostLABOR 1 460.000 460.000 1 492.000 492.000 1 522.000 522.000TRAVEL 1 160.000 160.000 1 169.000 169.000 1 195.000 195.000CONTRACT AWARDS 24 20.500 492.000 24 20.500 492.000 22 15.000 330.000CSS/NAVY TECH SPT 1 825.000 825.000 1 575.000 575.000 1 350.000 350.000
TOTAL 27 1,937.000 27 1,728.000 25 1,397.000Narrative Justification:
ECONOMIC INDICATORS:Total Cost of the Project $8,342 Net Present Value of Benefits: $355,600 Benefit to Investment Ratio: 28.40 Payback Period: 1.8
FY 04 FY 05
a. CAPABILITY OF EXISTING EQUIPMENT AND SHORTCOMINGS: Under the current asset management system the Inventory Control Points (ICPs) have limited visibility over assets being repaired at commercial contractor sites. There is no automated link to Commodity Command Standard System (CCSS) for accountability reporting and shipment notification and no automated method of reconciling ICP and contractor records to correct imbalances. Physical inventories done at 41 contractor sites showed major inaccuracies in both government and contractor records. CCSS had an accuracy rate of only 42.4%. Assets totaling $350M were not on the CCSS inventory records and assets totaling $12M were not on the contractor records. An additional $31M of assets on the CCSS records were not physically present at the contractor sites.
b. ANTICIPATED BENEFITS: CAV II provides better asset visibility at contractor maintenance sites by facilitating the reporting to CCSS of receipts, inductions, completions, shipments, disposals, and other asset transactions. CAV II improves shipping procedures, measures repair turn-around time and monitors contractor performance. Continued deployments will correct financial and inventory inaccuracies in CCSS and contractor accountable records. Accurate databases will reduce unnecessary procurements at ICPs and optimize stock availability. CAV II will also interface with the Logistics Modernization Program (LMP) after the LMP team tracks CAV II through the solutions demonstration processes. The FY02 funds were used to support CAVII in CCSS to increase visibility, improved shipping procedures, measures repair turn-around and monitors contractor performance and to deploy the system at additional sites.
c. IMPACT WITHOUT PROPOSED CAPITAL INVESTMENT: Financial and inventory inaccuracies in CCSS and the contractors' records will continue to escalate. Accurate visibility of components repaired under National Maintenance Contracts will not be attained. DA direction to expedite the correction of this material weakness will not be implemented.
d. ECONOMIC ANALYSIS PERFORMED? Yes.
69 Exhibit Fund-9b Activity Group Capital Investment Justification

ACTIVITY GROUP CAPITAL INVESTMENT JUSTIFICATION A. Budget SubmissionSOFTWARE FY 2004-2005
($ in Thousands) OSD/OMB Submission
B. Component, Activity Group, Date C. Line No Item Description D. Activity IdentificationSupply Management, Army Feb 03 00-2 Logistics Modernization Program (LMP) CECOM
FY 02 FY03Element of Cost Quantity Unit Cost Total Cost Quantity Unit Cost Total Cost Quantity Unit Cost Total Cost Quantity Unit Cost Total Cost
Contractor Support 1 21,743.000 21,743.000 1 30,293.000 30,293.000 1 18,450.000 18,450.000 1 19,929.000 19,929.000Travel 1 1,600.000 1,600.000 1 1,600.000 1,600.000Labor 1 8,000.000 8,000.000
TOTAL 1 21,743.000 1 30,293.000 3 28,050.000 2 21,529.000Narrative Justification:
ECONOMIC INDICATORS:Total Cost of the Project $127,182 Net Present Value of Benefits: N/A Benefit to Investment Ratio: N/A Payback Period:
FY 04 FY 05
a. CAPABILITY OF EXISTING EQUIPMENT AND SHORTCOMINGS: The current Army standard logistics systems are based on 25-year-old computer technology and depend on large layered inventory levels to support a forward deployed force against the Cold War enemy. Today's process is characterized by a lack of flexibility and suffers from long shipping times and limited visibility of the supply pipe-line. The Army must re-engineer its logistics processes to provide the flexibility to support today’s CONUS-based power projection scenarios and utilize modern information technology enablers that will provide real time visibility of the entire logistics supply chain and support the Revolution in Military Logistics.
b. ANTICIPATED BENEFITS: The Logistics Modernization Program is a ten-year project to correct the noted deficiencies. It will enable the Army to take advantage of commercial expertise, experience, and investments in process improvement and information technology. The Army Materiel Command (AMC) will be able to perform business process re-engineering (BPR), adopt market-driven business practices, and provide significantly improved services. The new process will help us achieve synchronization with Global Combat Support System - Army (GCSSA). The Army will retain Intellectual Property Rights to all documentation with regard to BPR reports and system description and implementation plans. The Supply Management portion of the ten-year investment will total $215 M, part of a $400M program, which also includes the Depot Maintenance Activity Group. This project was formerly known as Wholesale Logistics Modernization Program (WLMP)
c. IMPACT WITHOUT PROPOSED CAPITAL INVESTMENT: AMC will be forced to maintain inefficient and unduly expensive logistics processes due to the limitations of the current automated system, the Commodity Command Standard System (CCSS). The CCSS contains processes that are outdated, expensive to maintain, and technically vulnerable. The COBOL 74 compiler supporting the system is no longer supported by the manufacturer. These deficiencies will preclude the Army from providing an agile logistics support capability as required.
d. ECONOMIC ANALYSIS PERFORMED? Yes.
70 Exhibit Fund-9b Activity Group Capital Investment Justification

ACTIVITY GROUP CAPITAL INVESTMENT JUSTIFICATION A. Budget SubmissionSOFTWARE FY 2004-2005
($ in Thousands) OSD/OMB Submission
B. Component, Activity Group, Date C. Line No Item Description D. Activity IdentificationSupply Management Army Feb 03 98-14 Common Operating Environment (COE) Army Materiel Command
FY02 FY03Element of Cost Quantity Unit Cost Total Cost Quantity Unit Cost Total Cost Quantity Unit Cost Total Cost Quantity Unit Cost Total CostSoftware 1 4,900.000 4,900.000 1 7,081.000 7,081.000 1 2,066.000 2,066.000 1 1,300.000 1,300.000
TOTAL 1 4,900.000 1 7,081.000 1 2,066.000 1 1,300.000Narrative Justification:
ECONOMIC INDICATORS:Total Cost of the Project $36,402 Net Present Value of Benefits: N/A Benefit to Investment Ratio: N/A Payback Period: N/A
FY04 FY05
a. CAPABILITY OF EXISTING EQUIPMENT AND SHORTCOMINGS: There are currently about 8,940 disparate non-standard and bridge systems at the various Major Subordinate Commands (MSC) and Separate Reporting Activities (SRA) of AMC, of which approximately 60% support supply management activities. The obsolete design characteristics of these systems impede technology insertions and limit user access. They also hamper efforts to introduce business process improvements and cause logistics costs to rise with each system change. This combination of archaic structure, lack of documentation, and outdated technology makes it extremely difficult to respond to rapidly changing business requirements which demand modern technology.
b. ANTICIPATED BENEFITS: This effort will provide a Windows-based common technology architecture for the various wholesale logistics processes, designed around a client-server model. The COE will allow the users of logistics systems to perform all business functions from a single workstation. Using a Graphical User Interface (GUI) they will be able to integrate data from the various separate logistics systems, thus reducing the time and effort of analyzing the currently fragmented data, which resides on numerous non-standard applications. It will allow the users an interface with the modernized Logistics Modernization Program (LMP) system, when it is developed.
c. IMPACT WITHOUT PROPOSED CAPITAL INVESTMENT: The Army's wholesale supply systems will remain inefficient and costly, even with significant upgrades, such as the LMP. This effort will compliment LMP by providing a common technology architecture to all wholesale logistics processes and by reducing support costs and infrastructure needs.
d. ECONOMIC ANALYSIS PERFORMED? No. Directed by DoD in Joint Vision 2010 (Joint Chiefs of Staff Implementation Policy, CJCSI 3010.01), the Defense Planning Guidance (DPG) for FY 1999-2003, and the Quadrennial Defense Review (QDR) of May 1997.
71 Exhibit Fund-9b Activity Group Capital Investment Justification

SUPPLY MANAGEMENT CAPITAL INVESTMENT JUSTIFICATION A. Budget SubmissionSOFTWARE FY 2004-2005
($ in Thousands) OSD/OMB Submission
B. Component, Activity Group, Date C. Line No Item Description D. Activity Identification USAMCSupply Management, Army Feb 03 04-8 Electronic Data Interchange (EDI) LOGSA FY02 FY03Element of Cost Quantity Unit Cost Total Cost Quantity Unit Cost Total Cost Quantity Unit Cost Total Cost Quantity Unit Cost Total CostPersonnel/Software 1 1,235.000 1,235.000 1 437.200 437.200
TOTAL 1 1,235.000 1 437.200Narrative Justification:
ECONOMIC INDICATORS:Total Cost of the Project $1,672 Net Present Value of Benefits: N/A Benefit to Investment Ratio: N/A Payback Period: N/A
FY04 FY05
a. CAPABILITY OF EXISTING EQUIPMENT AND SHORTCOMINGS: The Logistics Integrated Database (LIDB) is a key AMC system supporting the management of Army secondary items. LIDB supports DA, AMC and Army MACOM activities by integrating retail and wholesale Army logistics information and providing decision making information in the areas of procurement, stockage, distribution, intransit visibility and consumption rates. LIDB is responsible for Army savings of over $50 million during the last 5 years in secondary item pipeline inventory by providing information to Army task forces, process improvement teams, Army Audit Agency and, AMC and DA staffs which identified and corrected deficiencies in all aspects of secondary item management. As part of transformation, the Army’s automated systems are being redesigned. Concurrent with the implementation of new automated systems, the method of collection of secondary item data is changing. DOD has mandated the use of Electronic Data Interchange (EDI) which requires new software and automated programs. Army is also in the forefront for the development of Automated Information Technology (AIT) data collection to manage both the maintenance and distribution of secondary items. This CIP Submission adapts LIDB to these changes. This effort ensures that the LIDB remains capable to support AMC, DA and field army secondary item programs and that savings accrued to date will continue.
b. ANTICIPATED BENEFITS: Continued reduced Army secondary item costs. The quality, timeliness and completeness of secondary item information routed to LIDB by DOD and Army automated logistics systems will be enhanced. Information from secondary item business areas which report information only in EDI or AIT formats can be collected, processed and incorporated in decision making tools which allow for increased performance and reductions in cost. c. IMPACT WITHOUT PROPOSED CAPITAL INVESTMENT: Secondary item management costs will increase as visibility of key business processes is lost. Problems associated with secondary item procurement levels, stockage, distribution and usage will not be readily resolved. Additionally, LIDB and AMC will not be in compliance with DOD directives which mandates that logistics automated systems be EDI capable. LOGSA will not be able to support HQ AMC EDI development efforts in support of secondary item management.
d. ECONOMIC ANALYSIS PERFORMED: Initial cost comparison was provided.
72 Exhibit Fund-9b Activity Group Capital Investment Justification

ACTIVITY GROUP CAPITAL INVESTMENT JUSTIFICATION A. Budget SubmissionSOFTWARE FY 2004-2005
($ in Thousands) OSD/OMB Submission
B. Component, Activity Group, Date C. Line No Item Description D. Activity IdentificationSupply Management, Army Feb 03 04-7 Exchange Pricing HQDA
FY02 FY03 FY04 FY05Element of Cost Quantity Unit Cost Total Cost Quantity Unit Cost Total Cost Quantity Unit Cost Total Cost Quantity Unit Cost Total CostTravel 1 75.000 75.000Contracts 1 20,575.000 20,575.000Other Gvt. Agencies 1 250.000 250.000
TOTAL 3 20,900.000Narrative Justification:
ECONOMIC INDICATORS:Total Cost of the Project $20,900 Net Present Value of Benefits: N/A Benefit to Investment Ratio: N/A Payback Period: Years N/A
a. CAPABILITY OF EXISTING EQUIPMENT AND SHORTCOMINGS: The IT/automation capability and infrastructure in legacy logistical/financial systems to effect Exchange Pricing does not exist. However, objective/emerging systems in the FY04/05 and out timeframe; i.e., Logistics Modernization (LMP), Enterprise Resource Planning (ERP), Commercial Supply Chain Management - Army (CSCM-A) are expected to contain some, if not all, requisite functionality to support exchange pricing. Functionality "blue printing" will be required to ensure Exchange Pricing requirements are accurately reflected in the modernized systems. In addition, until these objective systems are fielded, a dual operating environment will be required with some of the essential capabilities as follows: Document Identifier Code (DIC) “trigger” appropriate logistics/financial transactions, and Carcass Tracking/Matching - - the purpose is to tie requisitions and carcass turn-ins together and link unmatched returns to the financial billing process.
b. ANTICIPATED BENEFITS: Implementation of SSF in FY04 marks the completion of integrating retail and wholesale inventory and completely reengineering the underlying logistical and financial processes to produce business process improvement and inventory efficiencies. For example, eliminating multiple points of sale ended duplication in logistical and financial processing and supports Velocity Management by reducing Customer Wait Time (CWT) while providing greater excess asset visibility for redistribution and procurement offsets. SSF constituted a fundamental change in asset management; and is an enhanced logistics/financial operating capability - - a transformation enabler. An essential component of extending the impact of SSF is Exchange Pricing, which is a process that applies to pricing reparable secondary items of supply. It moves the Army towards a restructured price and credit policy, and reparable program for unserviceable Class IX items for FY05. The challenge is to implement operating procedures and a supporting IT architecture that bridges legacy and emerging systems while simultaneously optimizing the use of Army resources. A vertical integrated SSF and a seamless, integrated supply and maintenance system are essential to this effort. The end-state process must be designed to achieve the following: Support the capitalization of "Direct Support/Repair Exchange" (DS/RX)assets transitioning into the AWCF, de-link credit from OPTEMPO funding, enable a multiple price/exchange price structure, track carcass returns and through DICs “triggers” appropriate logistical/financial transactions, Reduced number of logistical/financial transactions, discourages the return of many other items outside the reparable exchange program, and thus positively impact the AWCF-SMA cash balance.
CONTINUED ON NEXT PAGE
73 Exhibit Fund-9b Activity Group Capital Investment Justification

ACTIVITY GROUP CAPITAL INVESTMENT JUSTIFICATION A. Budget SubmissionSOFTWARE FY 2004-2005
($ in Thousands) OSD/OMB Submission
B. Component, Activity Group, Date C. Line No Item Description D. Activity IdentificationSupply Management, Army Feb 03 04- Exchange Pricing HQDA
FY02 FY03 FY04 FY05Element of Cost Quantity Unit Cost Total Cost Quantity Unit Cost Total Cost Quantity Unit Cost Total Cost Quantity Unit Cost Total CostTravel ContractsOther Gvt. Agencies
TOTALNarrative Justification:
ECONOMIC INDICATORS:Total Cost of the Project Net Present Value of Benefits: N/A Benefit to Investment Ratio: N/A Payback Period: Years N/A
c. IMPACT WITHOUT PROPOSED CAPITAL INVESTMENT: In the FY03 budget build (PBD cycle), OSD Program Budget Decision 422, dated 12 December 2001, questioned Army credit procedures and suggested implementing Exchange Pricing accelerated in FY03. The ASA (FM&C) on 19 January 2001, had already directed that beginning FY04, Army will move toward Exchange Pricing. Anticipated benefits include recouping credit from use in pricing and cost factor development. The Exchange Pricing will be based on the sale of a used item finances the repair, washouts/attrition rates (percentage of items that cannot be repaired), and surcharges. This accomplishes the same net price as with credit, but will potentially reduce transactions and eliminate concerns with credit. Without funding the Army will not be able to comply with OSD (PBD 422) and ASA (FM&C) directions to implement an Exchange Pricing structure. Army will not realized the benefits of potential workload reduction associated with the reduced number of logistical/financial transactions and eliminate the concerns with credit and continuance of price and credit structure that may affect AWCF solvency because turn-ins exceed sales.
d. ECONOMIC ANALYSIS PERFORMED? No. Implementation of the Exchange Pricing directed by OSD.
74 Exhibit Fund-9b Activity Group Capital Investment Justification

ACTIVITY GROUP CAPITAL INVESTMENT JUSTIFICATION A. Budget SubmissionSOFTWARE FY 2004-2005
($ in Thousands) OSD/OMB Submission
B. Component, Activity Group, Date C. Line No Item Description D. Activity IdentificationSupply Management, Army Feb 03 04-9 Future Logistics Enterprise (FLE)/Transformation HQAMC
FY 02 FY 03 FY 04 FY 05Element of Cost Quantity Unit Cost Total Cost Quantity Unit Cost Total Cost Quantity Unit Cost Total Cost Quantity Unit Cost Total CostContractor Support 1 484.000 484.000 1TDY 1 36.000 36.000 1
TOTAL 2 520.000 2Narrative Justification:
ECONOMIC INDICATORS:Total Cost of the Project $520 Net Present Value of Benefits: N/A Benefit to Investment Ratio: N/A Payback Period: N/A
a. CAPABILITY OF EXISTING EQUIPMENT AND SHORTCOMINGS: The Future Logistics Enterprise (FLE)/Transformation effort involves the design and implementation of a logistics framework that inherently meets the operational requirements of the National Military Strategy and the early 21st Century warfighter. It's tenets include end-to-end distribution, total life cycle systems management, and an integrated knowledge environment. The FLE/Transformation will ensure that strategic logistics requirements and capabilities are directly tied to the warfighting CINC and tactical requirements.
b. ANTICIPATED BENEFITS: Implementation of a Future Logistics Enterprise/Transformation will provide for an environment which support exchange of data that is intelligent and provides for a means to have interactivity between multiple ERPs in a collaborative fashion. Data will be able to be received and transmitted with minimal use of a middleware or other conversion media. Synergy will be realized by linking the multiple developmental efforts of services and defense agencies together. Information exchange in support of secondary items will also be improved with linkage to industry partners in the FLE. Achievement of focused logistics needed to support Army transformation and management of secondary items as part of recapitalization will be achieved. Inefficiencies and process disconnects in areas such as reimbursable and interservice work will also be eliminated. These estimates are preliminary and will require adjustment after an interoperability study is performed in FY03. Any hardware, software, and communications costs that may be required by the FLE are not included in these costs. Navy efforts pose additional complexity due to the aggregate of ERPs they are currently using. Funding beyond FY05 will be needed for test, evaluation, and implementation. As Air Force, Marine Corps, and industry plans materialize in the FLE, the Army program will require adjustment to provide additional integration. (5% ORD, 35% DM, and 60% SMA)
c. IMPACT WITHOUT PROPOSED CAPITAL INVESTMENT: AMC and Army will not realize the synergy of achieving more efficient processes of having a collaborative environment through a co-evolution process achievement of information superiority and support to such effort as condition based maintenance will not be achieved. Reduced numbers of logistical and financial transactions will also not be realized.
d. ECONOMIC ANALYSIS PERFORMED? DoD Directed Initiative. Initial Cost Comparison was provided.
75 Exhibit Fund-9b Activity Group Capital Investment Justification
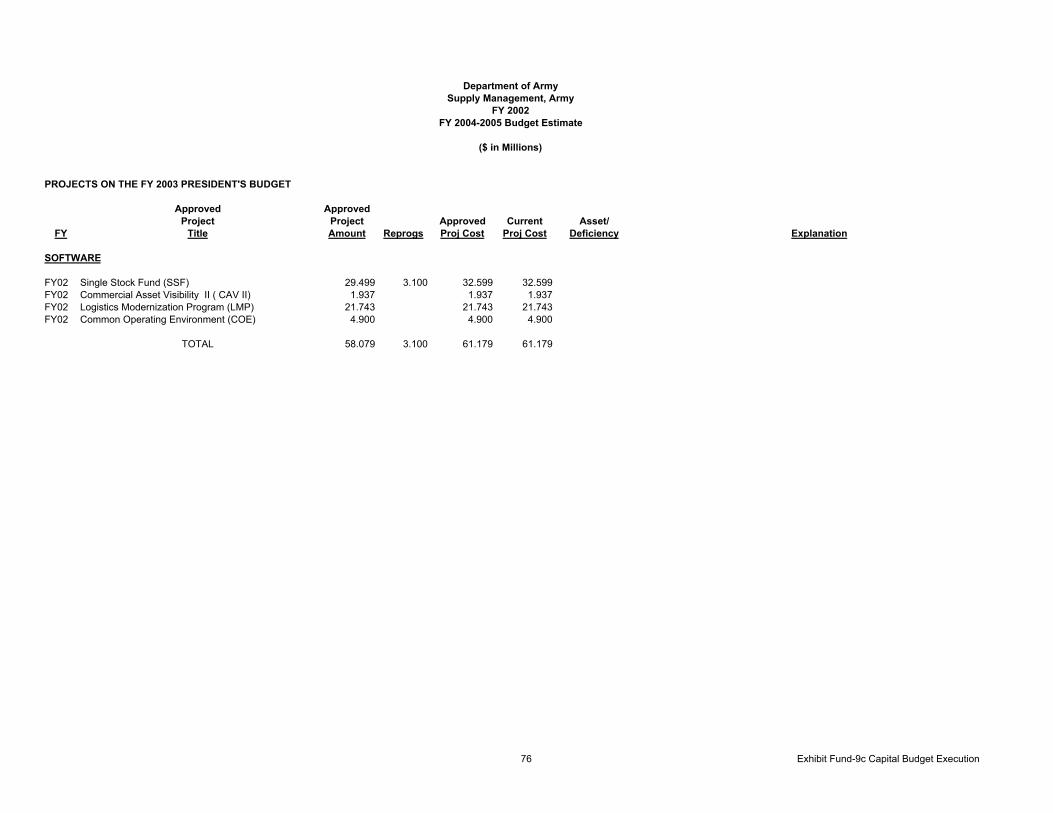
Department of Army
Supply Management, ArmyFY 2002
FY 2004-2005 Budget Estimate
($ in Millions)
PROJECTS ON THE FY 2003 PRESIDENT'S BUDGET
Approved ApprovedProject Project Approved Current Asset/
FY Title Amount Reprogs Proj Cost Proj Cost Deficiency Explanation
SOFTWARE
FY02 Single Stock Fund (SSF) 29.499 3.100 32.599 32.599 FY02 Commercial Asset Visibility II ( CAV II) 1.937 1.937 1.937 FY02 Logistics Modernization Program (LMP) 21.743 21.743 21.743 FY02 Common Operating Environment (COE) 4.900 4.900 4.900
TOTAL 58.079 3.100 61.179 61.179
76 Exhibit Fund-9c Capital Budget Execution

Department of ArmySupply Management, Army
FY 2003FY 2004-2005 Budget Estimate
($ in Millions)
PROJECTS ON THE FY 2003 PRESIDENT'S BUDGET
Approved ApprovedProject Project Approved Current Asset/
FY Title Amount Reprogs Proj Cost Proj Cost Deficiency Explanation
AUTOMATED DATA PROCESSING
FY03 Acquisition System 1.780 1.780 1.780
SOFTWARE
FY03 Single Stock Fund (SSF) 26.497 26.497 31.797 (5.300) Restore $5.3M decremented by PBD 704FY03 Commercial Asset Visibility II ( CAV II) 1.728 1.728 1.728 FY03 Logistics Modernization Program (LMP) 21.393 21.393 30.293 (8.900) Increased to support LMP cost growthFY03 Common Operating Environment (COE) 6.001 6.001 7.081 (1.080) Increased to support COE cost growth FY03 Exchange Pricing 20.900 (20.900) No Prior Submission/Approval of Project/OSD DirectedFY03 Future Logistics Enterprise (FLE)/Transformation 0.520 (0.520) No Prior Submission/Approval of Project/OSD Directed
TOTAL 57.399 57.399 94.099 (36.700)
77 Exhibit Fund-9c Capital Budget Execution

Department of ArmySupply Management, Army
FY 2004FY 2004-2005 Budget Estimate
($ in Millions)
PROJECTS ON THE FY 2003 PRESIDENT'S BUDGET
Approved ApprovedProject Project Approved Current Asset/
FY Title Amount Reprogs Proj Cost Proj Cost Deficiency Explanation
AUTOMATED DATA PROCESSING
FY04 Secondary Item Infrastructure Server 1.578 (1.578) No Prior Submission/Approval of ProjectFY04 Terminal Servers 0.894 (0.894) No Prior Submission/Approval of Project
SOFTWARE
FY04 Single Stock Fund (SSF) 7.710 (7.710) No Prior Submission/Approval of ProjectFY04 Commercial Asset Visibility II ( CAV II) 1.397 (1.397) No Prior Submission/Approval of ProjectFY04 Logistics Modernization Program (LMP) 28.050 (28.050) No Prior Submission/Approval of ProjectFY04 Common Operating Environment (COE) 2.066 (2.066) No Prior Submission/Approval of ProjectFY04 Electronic Data Interchange (EDI) 1.235 (1.235) No Prior Submission/Approval of Project
TOTAL 42.929 (42.929)
78 Exhibit Fund-9c Capital Budget Execution

Department of ArmySupply Management, Army
FY 2005PROJECTS ON THE FY 2003 PRESIDENT'S BUDGET
($ in Millions)
PROJECTS ON THE FY 2003 PRESIDENT'S BUDGET
Approved ApprovedProject Project Approved Current Asset/
FY Title Amount Reprogs Proj Cost Proj Cost Deficiency Explanation
AUTOMATED DATA PROCESSING
FY05 Secondary Item Infrastructure Server 1.607 (1.607) No Prior Submission/Approval of Project
SOFTWARE
FY05 Single Stock Fund (SSF) 2.388 (2.388) FY05 Logistics Modernization Program (LMP) 21.529 (21.529) No Prior Submission/Approval of ProjectFY05 Common Operating Environment (COE) 1.300 (1.300) No Prior Submission/Approval of ProjectFY05 Electronic Data Interchange (EDI) 0.437 (0.437) No Prior Submission/Approval of Project
TOTAL 27.261 (27.261)
79 Exhibit Fund-9c Capital Budget Execution

Activity Group Capital Investment SummaryDepot Maintenance
($ in Millions)FY02 FY03 FY 04 FY 05
Line No. Description Quantity Total Cost Quantity Total Cost Quantity Total Cost Quantity Total Cost
EQUIPMENT-Replacement03-01 Various Capital Equipment(< 500K) 9 2.614 9 2.736 13 4.387 12 3.63202-02 Electron Beam Welder 1 0.999 03-02 Fluidized Bed 1 6.795 03-03 X1100-3B Transmission Test Stand 1 2.000 03-04 Inertial Sensor Assembly Test Equip 1 1.256 03-05 M1 / M60 Servo Valve Test Stand 1 0.790 03-06 Painting Line 1 0.600 03-07 HP3070 Circuit Board Test System Replacement 1 0.838 03-08 Engine Disassembly and Cleaning Equipment 1 12.206 04-01 CNC Precision Laser Cutting System 1 0.61204-02 HP3070 Circuit Board Test System 2 0.83904-03 ASRS Mini-Load System 1 0.60504-04 ASRS System Upgrade 1 4.40004-05 Bridge Crane 30- ton Bldg 170 2 1.31104-06 Upgrade of IFTE-CEE Test Stations 2 2.76804-07 Generator Load Bank 1 0.60004-08 XT-1410 Transmission Test Stand 1 0.60004-09 CNC Vertical Machining Center 4 1.02504-10 Boring Mill 1 0.98405-01 Tumble Blast (Rotary) 2 0.68905-02 Overhaul 10 each Bridge Cranes 10 4.36905-03 Hydro-Mechanical Test Stand 1 0.69705-04 Sciaky Resistance Welder 2 0.79405-05 Cylindrical Grinder Replacement 4 2.62805-06 Abrasive Waterjet Cutting Machine 1 0.76705-07 Hydraulic Test Console 1 0.579
SUBTOTAL 10 3.613 16 27.221 29 18.131 33 14.155EQUIPMENT- Productivity
03-09 Various Capital Equipment(< 500K) 2 0.434 7 2.258 10 3.953 6 1.74802-03 Engine Test Cell Capacity Upgrade 1 3.100 03-09 HP3070 TPS Development Phase V 1 0.501 03-10 Control Consoles and Wiring Speed Drive 1 2.034 04-11 Plastic Media Blast System 1 2.08205-08 Aircraft Corrosion Control Equipment 1 0.600 1 10.00005-09 Flight Critical Parts Inspection & Treatment Eqpt 1 0.490 1 8.50505-10 Large Capacity Spin Blaster 1 2.724 SUBTOTAL 3 3.534 9 4.793 13 7.125 9 22.977
80 Exhibit Fund-9a Activity Group Capital Investment Summary

Activity Group Capital Investment SummaryDepot Maintenance
($ in Millions)FY02 FY03 FY 04 FY 05
Line No. Description Quantity Total Cost Quantity Total Cost Quantity Total Cost Quantity Total Cost
EQUIPMENT- Environmental04-12 Various Capital Equipment(< 500K) 3 0.80103-11 Dust Collection System 1 0.669 04-13 Air Pollution Control Equipment 3 2.000
SUBTOTAL 1 0.669 6 2.801
EQUIPMENT TOTAL 13 7.148 26 32.683 48 28.057 42 37.131
ADPE04-14 CAD/CAM/DNC Network Upgrade 1 0.157
ADPE TOTAL 1 0.157
MINOR CONSTRUCTION02-01 Various Minor Construction <$750K 4 1.093 5 1.806 15 6.375 6 2.48404-15 Welding Facility 1 0.963
MINOR CONSTRUCTION TOTAL 4 1.093 5 1.806 16 7.338 6 2.484
SOFTWARE99-08 Army Workload & Performance System (AWPS) 2.943 2.943 2.265 1 1.39700-06 Logistics Modernization Program (LMP) 7.417 7.367 6.350 1 6.35099-10 SDS Data Collection/Shop Floor/AIT 6.300 6.300 04-16 ERP/Industrial Base Modernizaiton (IBM) 1 17.70604-17 Future Logistics Enterprise (FLE)/Transformation 3.399
SOFTWARE TOTAL 16.660 16.610 8.615 3 28.852
Activity TOTAL 17 24.901 31 51.099 65 44.167 51 68.467
Total Capital Outlays 11.546 21.859 29.918 48.701Total Depreciation Expense 33.04 36.124 37.183 46.615
81 Exhibit Fund-9a Activity Group Capital Investment Summary

ACTIVITY GROUP CAPITAL INVESTMENT PROGRAM A. Budget SubmissionEQUIPMENT- Replacement FY 2004-2005
($ in Thousands) OSD/OMB Budget Submission
B. Component, Activity Group, Date C. Line No Item Description D. Activity IdentificationArmy, Depot Maintenance Feb 03 03-01 Various Capital Equipment(< 500K) All Depots
FY02 FY03Element of Cost Quantity Unit Cost Total Cost Quantity Unit Cost Total Cost Quantity Unit Cost Total Cost Quantity Unit Cost Total CostVarious Other Equip (<$500K) 9 290.453 2,614.077 9 304.000 2,736.000 13 337.462 4,387.006 12 302.666 3,631.992
TOTAL 9 2,614.077 9 2,736.000 13 4,387.006 12 3,631.992Narrative Justification:
ECONOMIC INDICATORS:Total Cost of the Project $13,369 Net Present Value of Benefits: N/A Benefit to Investment Ratio: N/A Payback Period: N/A
FY 04 FY 05
a. CAPABILITY OF EXISTING EQUIPMENT AND SHORTCOMINGS: Various depot equipment items have outlived their useful lives, became uneconomical to repair, or become unsafe to operate. Additionally, other equipment is technologically obsolete and its continued use reduces productivity. Some equipment investments are needed to meet environmental requirements.
b. ANTICIPATED BENEFITS: Acquisition of equipment improves productivity, reduces operating costs, and increases capacity which cannot be met with current equipment. The equipment will replace unsafe or inoperable/unusable assets, and/or provide for meeting environmental hazardous waste reduction or regulatory agency mandated requirements. The new equipmentwill increase reliability and productivity, thus enabling the depot to reduce existing backlog and improve responsiveness to customer needs.
c. IMPACT WITHOUT PROPOSED CAPITAL INVESTMENT: Depot Maintenance equipment will not adequately support the depots' mission, needed capabilities will be deferred, the ability to handle the present and future workloads will be compromised, man-hour expenditures, including overtime, will increase due to the excessive downtime of current equipment, and the accuracy and dependability of the output products will be diminished.
d. ECONOMIC ANALYSIS PERFORMED? Yes.
82 Exhibit Fund-9b Activity Group Capital Investment Justification

ACTIVITY GROUP CAPITAL INVESTMENT PROGRAM A. Budget SubmissionEQUIPMENT- Replacement FY 2004-2005
($ in Thousands) OSD/OMB Budget Submission
B. Component, Activity Group, Date C. Line No Item Description D. Activity IdentificationArmy, Depot Maintenance Feb 03 02-02 Electron Beam Welder ANAD
FY02 FY03Element of Cost Quantity Unit Cost Total Cost Quantity Unit Cost Total Cost Quantity Unit Cost Total Cost Quantity Unit Cost Total Cost
1 999.000 999.000
TOTAL 1 999.000Narrative Justification:
ECONOMIC INDICATORS:Total Cost of the Project $999 Net Present Value of Benefits: $3,140 Benefit to Investment Ratio: 2.28 Payback Period: 4.44
FY 04 FY 05
a. CAPABILITY OF EXISTING EQUIPMENT AND SHORTCOMINGS: The Electron Beam Welder is used to reclaim critical parts for the Advanced Gas Turbine (AGT) 1500 Turbine Engine, including the boltless rotor, the collector, the number 6 seal, and the number 5 diaphragm assembly. It also supports all other maintenance programs that require electron beam welding for the fabrication of parts. It is the only process by which these parts can be fabricated or reclaimed and ANAD is the only known source for one critical part, the number 5 diaphragm. The existing Electron Beam Welder is 15 years old and parts are difficult to obtain to keep it operational. During the last 12 months the machine has had 504 hours of downtime. Using the existing welder, the depot can only reclaim 50% of the diaphragm assemblies and 75% of the boltless rotors, which are potentially reclaimable with a more state-of-the-art welder.
b. ANTICIPATED BENEFITS: The new electron beam welder will enhance ANAD's ability to increase reclaimable parts for the AGT 1500 Turbine Engine. The new welder will also extend the range of reclaimable parts for the engine, because of its ability to weld larger parts and parts requiring a filler metal addition. The reclaimed parts will be produced efficiently , of higher quality and of lower cost. The Army's extreme vulnerability to the turbine engine parts supply system would be significantly diminished and ANAD's ability to respond to national emergencies would be enhanced.
c. IMPACT WITHOUT PROPOSED CAPITAL INVESTMENT: If the electron beam welder is not acquired, ANAD will lose the capability to repair components of the AGT 1500 Turbine Engineand will be forced to stop AGT 1500 engine production if the existing welder goes down for an extended period. Without the electron beam welder, ANAD cannot perform the in-house weldingtasks that are required for the AGT 1500 Turbine Engine Program as well as other modifications, repairs, and overhaul programs. Major Weapons systems supported: M1 Tank Family of Vehicles (FOV).
d. ECONOMIC ANALYSIS PERFORMED? Yes.
83 Exhibit Fund-9b Activity Group Capital Investment Justification

ACTIVITY GROUP CAPITAL INVESTMENT PROGRAM A. Budget SubmissionEQUIPMENT- Replacement FY 2004-2005
($ in Thousands) OSD/OMB Budget Submission
B. Component, Activity Group, Date C. Line No Item Description D. Activity IdentificationArmy, Depot Maintenance Feb 03 03-02 Fluidized Bed RRAD
FY02 FY03Element of Cost Quantity Unit Cost Total Cost Quantity Unit Cost Total Cost Quantity Unit Cost Total Cost Quantity Unit Cost Total CostFluidized Bed 1 6,795.000 6,795.000
TOTAL 1 6,795.000Narrative Justification:
ECONOMIC INDICATORS:Total Cost of the Project 6,795$ Net Present Value of Benefits: 2,551$ Benefit to Investment Ratio: 0.60 Payback Period: N/A
FY 04 FY 05
a. CAPABILITY OF EXISTING EQUIPMENT AND SHORTCOMINGS: The fluidized bed is used for removing rubber from roadwheels and track shoes prior to remanufacture. This concept has received national recognition as a cost-effective, environmentally friendly means of performing a task that traditionally has been slow, dirty, and harmful to the environment. The existing 10-year old fluidized bed has reached the end of its life expectancy and requires frequent and expensive maintenance and repair. The high operating temperature (over 1,620 F) has caused deterioration in the protective ceramic insulation, resulting in oxidation, erosion and fatigue in the metal components. On several ocassions structural members have required replacement and warped and eroded covers have become welded. Maintenance down time is currently estimated at about 9 percent and is expected to increase. The existing programmable logic controllercard, used to control servo-valves, is obsolete. About 30 cards per year on average must be sent to a contractor for test and repair. b. ANTICIPATED BENEFITS: Red River Army Depot and DoD will not have to live with the uncertainty of aging equipment that may fail without notice. Operating and maintenance costs will be reduced by an estimated $582K per year with a new fluidized bed.
c. IMPACT WITHOUT PROPOSED CAPITAL INVESTMENT: If the current equipment is not replaced, the deterioration of the system beyond our ability to repair it is probable within the next few years. RRAD is the only track and roadwheel facility for the Department of Defense, and the fluidized bed is an integral part of that operation. The loss of this system could directly impact the Army's readiness. In any event increasingly lengthy and costly repairs and higher operating costs will resuilt. The only alternatives to this process are either extremely labor-intensive or have become environmentally suspect, if not illegal.
d. ECONOMIC ANALYSIS PERFORMED? Yes.
84 Exhibit Fund-9b Activity Group Capital Investment Justification

ACTIVITY GROUP CAPITAL INVESTMENT JUSTIFICATION A. Budget SubmissionEQUIPMENT- Replacement FY 2004-2005
($ in Thousands) OSD/OMB Budget Submission
B. Component, Activity Group, Date C. Line No Item Description D. Activity IdentificationArmy, Depot Maintenance Feb 03 03-03 X1100-3B Transmission Test Stand ANAD
FY02 FY03Element of Cost Quantity Unit Cost Total Cost Quantity Unit Cost Total Cost Quantity Unit Cost Total Cost Quantity Unit Cost Total Cost
1 2,000.000 2,000.000
TOTAL 1 2,000.000Narrative Justification:
ECONOMIC INDICATORS:Total Cost of the Project $2,000 Net Present Value of Benefits: $9,635 Benefit to Investment Ratio: N/A Payback Period: N/A
FY 04 FY 05
a. CAPABILITY OF EXISTING EQUIPMENT AND SHORTCOMINGS: ANAD presently has one test stand capable of testing the X1100-3B transmission, which is used in the M1 Abrams Tank Family of Vehicles (FOV). This is a complete Automated Test Equipment system that allows dynamic testing of both new and rebuilt X1100-3B and CD-850 cross-drive transmissions. The stand is necessary for final acceptance testing of these transmissions, when they come out of the depot overhaul program. The current test stand was manufactured in 1983. The depot has only been able to keep it operational by cannibalizing parts from an identical test stand, which was acquired after a BRAC closure. Repair parts that cannot be obtained from cannibalization are not available from any source. On two occasions, ANAD had to contract with the Naval Surface Warfare Center to reverse engineer and manufacture a part in order to keep the test stand in operation. The X1100-3B transmission testing program started 18 years ago and is expected to continue for the next 10 years.
b. ANTICIPATED BENEFITS: This new Test Stand will be more reliable and easier repaired than the existing test stand, since repair parts will be available off-the-shelf. The down time for maintenance and repair will be reduced, overtime for maintaining production schedules will be reduced, and the annual throughput of overhauled transmissions will be increased. Electrical power consumption will also decrease by 25%.
c. IMPACT WITHOUT PROPOSED CAPITAL INVESTMENT: Testing the X1100 transmission is a CORE workload requirement at ANAD. If the new test stand is not acquired, ANAD will probably lose it's ability to support the M1 Abrams Tank Fleet, a CORE Weapon System. The transmission overhaul program would stop and stocks would eventually be depleted. Major Weapons System Supported: M1 Abrams Tank Family of Vehicles (FOV); M60 FOV.
d. ECONOMIC ANALYSIS PERFORMED? Yes. Since the status quo is not an option, no Benefit to Investment Ration (BIR) or payback period was calculated.
85 Exhibit Fund-9b Activity Group Capital Investment Justification

ACTIVITY GROUP CAPITAL INVESTMENT PROGRAM A. Budget SubmissionEQUIPMENT- Replacement FY 2004-2005
($ in Thousands) OSD/OMB Budget Submission
B. Component, Activity Group, Date C. Line No Item Description D. Activity IdentificationArmy, Depot Maintenance Feb 03 03-04 Inertial Sensor Assembly Test Equip RRAD
FY02 FY03Element of Cost Quantity Unit Cost Total Cost Quantity Unit Cost Total Cost Quantity Unit Cost Total Cost Quantity Unit Cost Total CostInertial Sensor Assbly Test Eq 1 1,256.000 1,256.000
TOTAL 1 1,256.000Narrative Justification:
ECONOMIC INDICATORS:Total Cost of the Project $1,256 Net Present Value of Benefits: $4.25 Benefit to Investment Ratio: 3.40 Payback Period: 3.6
FY 04 FY 05
a. CAPABILITY OF EXISTING EQUIPMENT AND SHORTCOMINGS: The existing Inertial Sensor Assembly (ISA) test set is 27 years old, compared to a normal life expectancy of 10 years. The equipment takes about five times as long to calibrate as when it was new and seven times as long as a new system would take. Downtime has averaged about 10 percent and many repair parts are obsolete and no longer supported by the manufacturer. In addition the existing test set has no surge capacity. A surge capacity of 250 percent is needed in case of a crisis.
b. ANTICIPATED BENEFITS: A new state-of-the-art ISA test set would provide faster test times. RRAD's ISA test workload has increased four-fold since 1998. Until then RRAD only tested suspect ISAs; now all ISAs are tested. The new equipment would have ample surge capacity in time of crisis.
c. IMPACT WITHOUT PROPOSED CAPITAL INVESTMENT: Patriot Theater Readiness could be affected and mission failure could result, if the depot were unable to meet a crisis surge requirement. The unavailability of obsolete components will lead to extended downtime and inability to perform even the normal mission. Serious gaps in the Patriot mission requirements couldresult.
d. ECONOMIC ANALYSIS PERFORMED? Yes.
86 Exhibit Fund-9b Activity Group Capital Investment Justification

ACTIVITY GROUP CAPITAL INVESTMENT PROGRAM A. Budget SubmissionEQUIPMENT- Replacement FY 2004-2005
($ in Thousands) OSD/OMB Budget Submission
B. Component, Activity Group, Date C. Line No Item Description D. Activity IdentificationArmy, Depot Maintenance Feb 03 03-05 M1 / M60 Servo Valve Test Stand ANAD
FY02 FY03Element of Cost Quantity Unit Cost Total Cost Quantity Unit Cost Total Cost Quantity Unit Cost Total Cost Quantity Unit Cost Total CostM1 / M60 Servo Valve Test Stand 1 790.000 790.000
TOTAL 1 790.000Narrative Justification:
ECONOMIC INDICATORS:Total Cost of the Project $790 Net Present Value of Benefits: $2.0 Benefit to Investment Ratio: 4.00 Payback Period: 2.3
FY 04 FY 05
a. CAPABILITY OF EXISTING EQUIPMENT AND SHORTCOMINGS: The M1/M60 Servomechanism Valve Test Stand is utilized primarily by the Hydraulics System Division to test the Quality Assurance of remanufactured/overhauled tank hydraulic servo valves and servomechanisms. This test stand is crucial to maintaining CORE capabilities and in supporting ANAD's partnering initiatives with industry. The existing test stand is a 15-year-old semi-automatic machine capable of functionally testing the Traverse and Elevation Servomechanism assemblies to the required U.S. Army Product Function Specification. Parts of this old test stand have been discontinued by the manufacturer and reached the end of their support life. This results in costly downtime that cannot be tolerated with the heavy workload scheduled for this test stand. Since the test stand and its associated ADP hardware have exceeded their economic life, it is imperative that this test stand be replaced in order for ANAD to support the ground combat vehicle needs of Army forces.
b. ANTICIPATED BENEFITS: Replacement of the old test stand would reduce test time from 5.62 hours to 2 hours for each servomechanism. Fully automatic testing would require minimal operator intervention. The computer would make pass/fail decisions, instead of the operator. ANAD would be able to continue providing the only organic support that the Foreign Military Sales (FMS) of M60 series tanks is receiving.
c. IMPACT WITHOUT PROPOSED CAPITAL INVESTMENT: ANAD will not be capable of testing the M1/M60 combat servo valves. Loss of this capability will cause delays in production of the M1/M60 tanks and return to stock programs for the servo valves. Major Weapons supported: M1 FOV, M60 FOV, and Return to Stock M1/M60 Servo Valves.
d. ECONOMIC ANALYSIS PERFORMED? Yes.
87 Exhibit Fund-9b Activity Group Capital Investment Justification

ACTIVITY GROUP CAPITAL INVESTMENT PROGRAM A. Budget SubmissionEQUIPMENT- Replacement FY 2004-2005
($ in Thousands) OSD/OMB Budget Submission
B. Component, Activity Group, Date C. Line No Item Description D. Activity IdentificationArmy, Depot Maintenance Feb 03 03-06 Painting Line ANAD
FY02 FY03Element of Cost Quantity Unit Cost Total Cost Quantity Unit Cost Total Cost Quantity Unit Cost Total Cost Quantity Unit Cost Total CostPainting Line 1 600.000 600.000
TOTAL 1 600.000Narrative Justification:
ECONOMIC INDICATORS:Total Cost of the Project $600 Net Present Value of Benefits: $1.08 Benefit to Investment Ratio: 3.00 Payback Period: N/A
FY 04 FY 05
a. CAPABILITY OF EXISTING EQUIPMENT AND SHORTCOMINGS: Since there is currently no painting line located in the reciprocating engine rebuild facility, disassembled components of engines and final drives must be moved by forklift to other buildings for cleaning and painting and later moved back. This is time consuming, adds cost to the product and risks damaging the components through transport accidents and exposure to the elements.
b. ANTICIPATED BENEFITS: The new Painting Line, which will be located in the engine rebuild facility, will consist of a paint booth, a monorail conveyor and a drying oven. The safety of the operation will be greatly increased, because the parts will be moved by hoists and conveyors instead of forklifts driving through work bays. Work stoppages caused by the lack of parts will be reduced. The current workload is expected to increase over the life of this project.
c. IMPACT WITHOUT PROPOSED CAPITAL INVESTMENT: The maintenance and operating cost for the use of forklifts will increase at a rate of 2% per year for the life of the project. The transporting of components by forklift to other buildings will continue to add cost to the product and risk damaging the components and injuring personnel. Major Weapons Systems supported: M1 Tank Family of Vehicles (FOV), M60 Tank FOV, M551, M88, M113 Self Propelled Artillery FOV, M48 and M9 Armored Combat Earthmover (ACE).
d. ECONOMIC ANALYSIS PERFORMED? Yes.
88 Exhibit Fund-9b Activity Group Capital Investment Justification

ACTIVITY GROUP CAPITAL INVESTMENT PROGRAM A. Budget SubmissionEQUIPMENT- Replacement FY 2004-2005
($ in Thousands) OSD/OMB Budget Submission
B. Component, Activity Group, Date C. Line No Item Description D. Activity IdentificationArmy, Depot Maintenance Feb 03 03-07 HP3070 Circuit Board Test System Replacement TYAD
FY02 FY03Element of Cost Quantity Unit Cost Total Cost Quantity Unit Cost Total Cost Quantity Unit Cost Total Cost Quantity Unit Cost Total CostHP3070 Circuit Board Test System Replacement 1 838.000 838.000IP01003/IP0410004
TOTAL 1 838.000Narrative Justification:
ECONOMIC INDICATORS:Total Cost of the Project $838 Net Present Value of Benefits: $596 Benefit to Investment Ratio: 1.78 Payback Period: 4.57
FY 04 FY 05
a. CAPABILITY OF EXISTING EQUIPMENT AND SHORTCOMINGS: TYAD currently develops Test Program Sets (TPSs) to test circuit card/boards using Automatic Test Equipment (ATE). The TPSs consist of software programs, documentation, cabling and interconnecting devices. The depot has eight HP3070 ATE Series I board test systems. These systems have 1970s technology and their capability to test newer circuit cards and boards is questionable. The manufacturer is currently planning to phase out the manufacture and stocking of replacement parts for the HP3070s. No other manufacturer can provide suitable upgrades, software support or replacement parts. The manufacturer has already discontinued the manufacture of pin circuit cards for our existing version I.
b. ANTICIPATED BENEFITS: The purchase of two new Agilent 3070 Series III systems will increase the speed at which in-circuit test programs are produced and increase the speed at which testing is accomplished. TYAD develops approximately 88 TPSs per year. The Agilent 3070 Series III enables the programmers to produce a TPS in 40 hours less than the HP3070 Series I. This ATE will enable TYAD to handle new and emerging electronic technologies while improving our productivity for developing current TPSs.
c. IMPACT WITHOUT PROPOSED CAPITAL INVESTMENT: TYAD's capability to test and repair circuit cards and boards will decrease and labor costs will increase. The depot will continue to have declining productivity due to obsolete equipment.
d. ECONOMIC ANALYSIS PERFORMED? Yes.
89 Exhibit Fund-9b Activity Group Capital Investment Justification

ACTIVITY GROUP CAPITAL INVESTMENT PROGRAM A. Budget SubmissionEQUIPMENT- Replacement FY 2004-2005
($ in Thousands) OSD/OMB Budget Submission
B. Component, Activity Group, Date C. Line No Item Description D. Activity IdentificationArmy, Depot Maintenance Feb 03 03-08 Engine Disassembly and Cleaning Equipment CCAD
FY 02 FY03Element of Cost Quantity Unit Cost Total Cost Quantity Unit Cost Total Cost Quantity Unit Cost Total Cost Quantity Unit Cost Total CostEngine Disassembly and 1 12,206.134 12,206.134Cleaning Equipment
TOTAL 1 12,206.134 - - Narrative Justification:
ECONOMIC INDICATORS:Total Cost of the Project $12,206 Net Present Value of Benefits: $29,703 Benefit to Investment Ratio: 2.90 Payback Period: 1.00
FY 04 FY 05
a. CAPABILITY OF EXISTING EQUIPMENT AND SHORTCOMINGS: The current 30 year old engine dissassembly and cleaning equipment is outdated and cannot accommodate the newer mission requirements for the larger Blackhawk and Apache helicopters. Originally, the cleaning equipment was designed to support a light workload associated with the smaller Huey helicopter. The present equipment cannot be optimized to handle the current and projected workload. The existing chemical tank ventilation does not meet standard requirements and the current process tanks, with small capacities supporting larger parts, results in slow processes and inconsistency. It does not have air scrubbers, chemical pretreatment, recovery and recycling, secondary containment for process tanks, and deionized water. The existing equipment is not equipped to dispose/recycle hazardous waste which could lead to a future violation of the Clean Air Act of 1990, violation of the Clean Water Act, and future violations of OSHA safety regulations.
b. ANTICIPATED BENEFITS: The modern Engine Cleaning equipment will reduce operating time/cost, CCAD will be compliant with environmental standards, and the new engine cleaning equipment will accommodate the new mission requirements for the larger Blackhawk and Apache which contain titanium based components. The cost of purchasing new titanium based parts are extremely high and the availability of these parts are limited. This project is associated with the Engine Disassembly and Cleaning Facility, MCA Project Form #56514.
c. IMPACT WITHOUT PROPOSED CAPITAL INVESTMENT: If funding is not received, CCAD will not be able to adequately support the mission requirements for the larger Blackhawk and Apache helicopters, will not be compliant with environmental regulations.
d. ECONOMIC ANALYSIS PERFORMED? Yes
90 Exhibit Fund-9b Activity Group Capital Investment Justification

ACTIVITY GROUP CAPITAL INVESTMENT PROGRAM A. Budget SubmissionEQUIPMENT- Replacement FY 2004-2005
($ in Thousands) OSD/OMB Budget Submission
B. Component, Activity Group, Date C. Line No Item Description D. Activity IdentificationArmy, Depot Maintenance Feb 03 04-01 CNC Precision Laser Cutting System LEAD
FY 02 FY03Element of Cost Quantity Unit Cost Total Cost Quantity Unit Cost Total Cost Quantity Unit Cost Total Cost Quantity Unit Cost Total CostCNC Precision Laser Cutting 1 612.000 612.000 System
TOTAL - - - - 1 612.000Narrative Justification:
ECONOMIC INDICATORS:Total Cost of the Project $612 Net Present Value of Benefits: $1,817,897 Benefit to Investment Ratio: 4.12 Payback Period: 2.21
FY 04 FY 05
a. CAPABILITY OF EXISTING EQUIPMENT AND SHORTCOMINGS: The present machine is 18 years old and is used to perform cutting and punching operations on various metal parts in support of missions at LEAD which include Patriot Recap, Hawk, and Multiple Launch Rocket System (MLRS). The current machine is experiencing frequent down time due to exceeding requirements because of recent events with Enduring Freedom. Recent breakdowns have resulted in the need for LEAD to contract out work to private industry to meet production deadlines. The machine is well beyond its service life and repair parts are difficult to obtain. This is the only machine with both Plasma Cutting and Punching capabilities at LEAD.
b. ANTICIPATED BENEFITS: The purchase of a new machine equipped with laser technology is 2.5 times faster than the status quo equipment and will increase efficiency and meet production in support of PATRIOT Recap and other missions at LEAD. This will also result in maintenance/repair cost avoidance. LEAD has already expended $132K for maintenance/repair since the old machine was purchased in 1991.
c. IMPACT WITHOUT PROPOSED CAPITAL INVESTMENT: The maintenance and operating cost for the use of the old equipment will increase due to its obsolescence and increased production workloads. LEAD will not be able to meet production deadlines in support of Patriot Recap, Hawk, and MLRS mission requirements.
d. ECONOMIC ANALYSIS PERFORMED? Yes.
91 Exhibit Fund-9b Activity Group Capital Investment Justification

ACTIVITY GROUP CAPITAL INVESTMENT PROGRAM A. Budget SubmissionEQUIPMENT- Replacement FY 2004-2005
($ in Thousands) OSD/OMB Budget Submission
B. Component, Activity Group, Date C. Line No Item Description D. Activity IdentificationArmy, Depot Maintenance Feb 03 04-02 HP3070 Circuit Board Test System TYAD
FY 02 FY03Element of Cost Quantity Unit Cost Total Cost Quantity Unit Cost Total Cost Quantity Unit Cost Total Cost Quantity Unit Cost Total CostIP01012circuit Board Test 2 419.422 838.844System
TOTAL 2 838.844Narrative Justification:
ECONOMIC INDICATORS:Total Cost of the Project $839 Net Present Value of Benefits: Benefit to Investment Ratio: Payback Period:
FY 04 FY 05
a. CAPABILITY OF EXISTING EQUIPMENT AND SHORTCOMINGS: Efforts are currently underway in the Test Program Development Division to move high volume Test Program Sets (TPS) from existing Genrad 1796 testers to HP3070 test units. TYAD presently has three operational Genrad 1796 testers that support much of the BRAC workload. A four-year production plan has been developed that includes purchasing at least two updated 3070 Series III testers each year. This cost will rise with each successive out year as repair parts and experienced personnel become harder to find. TYAD currently develops Test Program Sets (TPSs) to test circuit card/boards using Automatic Test Equipment (ATE). The TPSs consist of software programs, documentation, cabling and interconnecting devices. The 20 year old Genrad 1796 are no longer manufactured and are only supported by third party vendors at premium rates. No other manufacturer can provide suitable upgrades, software support or replacement parts.
b. ANTICIPATED BENEFITS: The sophisticated and accurate HP3070 tester units can reduce the testing process time by two thirds (2/3) and eliminate current need for multiple test runs through each Circuit Card Assemblies (CCA) to pinpoint faults. Quicker test execution times are expected to yield substantial savings due to elimination of multiple test passes on high volumeworkloads. Additional intangible benefits include a test system that is up-to-date technology and completely supportable and sustainable. This ATE will enable TYAD to handle new and emerging electronic technologies while improving our productivity for developing current TPSs.
c. IMPACT WITHOUT PROPOSED CAPITAL INVESTMENT: TYAD's capability to test and repair circuit cards and boards will decrease and labor costs will increase. The depot will continue to have declining productivity due to obsolete equipment.
d. ECONOMIC ANALYSIS PERFORMED? Yes.
92 Exhibit Fund-9b Activity Group Capital Investment Justification

ACTIVITY GROUP CAPITAL INVESTMENT PROGRAM A. Budget SubmissionEQUIPMENT- Replacement FY 2004-2005
($ in Thousands) OSD/OMB Budget Submission
B. Component, Activity Group, Date C. Line No Item Description D. Activity IdentificationArmy, Depot Maintenance Feb 03 04-03 ASRS Mini-Load System TYAD
FY 02 FY03Element of Cost Quantity Unit Cost Total Cost Quantity Unit Cost Total Cost Quantity Unit Cost Total Cost Quantity Unit Cost Total CostEquipment 1 605.000 605.000IP01009/IP0210004
TOTAL 1 605.000Narrative Justification:
ECONOMIC INDICATORS:Total Cost of the Project $605 Net Present Value of Benefits: $1,049 Benefit to Investment Ratio: 2.8 Payback Period: 2.9
FY 04 FY 05
a. CAPABILITY OF EXISTING EQUIPMENT AND SHORTCOMINGS: This project was originally approved/funded in FY02 and pulled back due to higher priorities to support mission requirements. The project is still a valid requirement for TYAD. The depot's Automated Storage and Retrieval System (ASRS) stores all parts and assemblies in metal bins located in high rack assemblies, which are separated by long narrow aisles. Six unmanned mini-load vehicles navigate the aisles to perform the physical storage and retrieval actions. The system's automated positioning system uses photo-optic and bar code technology for navigation and position identification. Vehicle positioning errors cause the system to be shut down while the errorsare rectified. These errors occur at an average rate of seven per day and take from 15 minutes to 3 hours to correct. System shutdowns due to positioning errors cause lost productivity in the maintenance shops. The positioning system is 15 yrs old and repair parts are increasingly difficult to obtain.
b. ANTICIPATED BENEFITS: Replacing the current photo-optic/bar code positioning system with laser technology would make the system more accurate and eliminate the shutdowns that cause lost productivity. The vehicle controls would also have to be replaced, since the existing controls would be incompatible with the new positioning technology. New optical modems wouldimprove the communications between the vehicles and the ASRS main computer control system. A reliable storage and retreival system would maintain the flow of stock to the production shops.
c. IMPACT WITHOUT PROPOSED CAPITAL INVESTMENT: The existing system fails nearly seven times daily. The system supports the entire production workload with its material delivery system. When the vehicles fail and needed mission stock is not promptly delivered to the shops, the production personnel are forced to shift to other jobs, which have available bench stock on hand. Based on an analysis of lost productivity caused by delays in parts delivery, it was determined that the system shutdowns were causing a 0.3% productivity loss, which cost $195,561 per year in lost direct labor productivity.
d. ECONOMIC ANALYSIS PERFORMED? Yes.
93 Exhibit Fund-9b Activity Group Capital Investment Justification

ACTIVITY GROUP CAPITAL INVESTMENT PROGRAM A. Budget SubmissionEQUIPMENT- Replacement FY 2004-2005
($ in Thousands) OSD/OMB Budget Submission
B. Component, Activity Group, Date C. Line No Item Description D. Activity IdentificationArmy, Depot Maintenance Feb 03 04-04 ASRS System Upgrade ANAD
FY 02 FY03Element of Cost Quantity Unit Cost Total Cost Quantity Unit Cost Total Cost Quantity Unit Cost Total Cost Quantity Unit Cost Total CostASRS System Upgrade 1 4,400.00 4,400.00
TOTAL 1 4,400.00 Narrative Justification:
ECONOMIC INDICATORS:Total Cost of the Project $4,400 Net Present Value of Benefits: $3,477 Benefit to Investment Ratio: 1.858 Payback Period: 5.181
FY 04 FY 05
a. CAPABILITY OF EXISTING EQUIPMENT AND SHORTCOMINGS: The ASRS system provides storage, retrieval, and kitting of parts needed for the overhaul/repair of all maintenance programs performed at ANAD. Currently, the ASRS system contains 9 cranes (3 mini-load and 6 unit-load cranes) which store parts in vertical bins, a Programmable Logic Controller (PLC) controlled conveyor system, and a Personal Computer (PC) manifest system. There are also 9 Automatic Guided Vehicles (AGVs) which carry the loads from the cranes out to personnel responsible for pulling parts. All components are at least 11 years old and many parts are discontinued, making repairs difficult if not impossible. The repair results in significant delays in providing parts/kits to the production shops. In FY01, costs for parts/labor for repairs the ASRS by ANAD personnel was $232,440. Life cycle maintenance cost has been $713,488, not including the cost of service contracts. The average yearly electrical utility cost for ASRS is $394,548.b. ANTICIPATED BENEFITS: Improved Depot overhaul/repair program support through less downtime on cranes due to mechanical/electrical failure; less AGV downtime due to power supply issues and communications circuit board failure. The computer system modernization will provide a more user friendly interface with early warning maintenance and alarm features for key system components, and enable proper hardware/software updates. The conveyor PLC system will use modern parts that are currently available at local distributors for off-the-shelf repair if needed. Delays in providing critical combat vehicle parts to production shops will be minimized. Further, yearly utility costs will be reduced by 10% ($355K approx.) yearly. Maintenance costs will be reduced to an average of $65.3K per year. Contractor maintenance will remain at $50K per year.c. IMPACT WITHOUT PROPOSED CAPITAL INVESTMENT: Maintenance/repair costs would increase, repair parts and service would not be readily available, most importantly ASRS would not be capable of providing dependable parts storage and retrieval to support mission maintenance requirements. (Overhaul and repair programs on M1 Abrams tank Family of Vehicles (FOV), M88 Recovery Vehicle, M60 tank FOV, M551 Reconnaissance Vehicle, M113 FOV, M198 Towed Howitzer, M9 Armored Combat Earthmover (ACE) Vehicle, and the M109Paladin).
d. ECONOMIC ANALYSIS PERFORMED? Yes.
94 Exhibit Fund-9b Activity Group Capital Investment Justification

ACTIVITY GROUP CAPITAL INVESTMENT PROGRAM A. Budget SubmissionEQUIPMENT- Replacement FY 2004-2005
($ in Thousands) OSD/OMB Budget Submission
B. Component, Activity Group, Date C. Line No Item Description D. Activity IdentificationArmy, Depot Maintenance Feb 03 04-05 Bridge Crane 30- ton Bldg 170 ANAD
FY 02 FY03Element of Cost Quantity Unit Cost Total Cost Quantity Unit Cost Total Cost Quantity Unit Cost Total Cost Quantity Unit Cost Total CostBridge Crane 30-Ton 2 655.500 1,311.000
TOTAL 2 1,311.000 Narrative Justification:
ECONOMIC INDICATORS:Total Cost of the Project $1,311 Net Present Value of Benefits: $4,319 Benefit to Investment Ratio: 4.618 Payback Period: N/A
FY 04 FY 05
a. CAPABILITY OF EXISTING EQUIPMENT AND SHORTCOMINGS: Currently in building 170, there is not an existing crane to use on any type of equipment disassembly of any significant weight. Building 170 is 65 feet wide and 200 feet long and has a roof height of 50 feet. The existing crane in building 143 is a 1955 vintage crane with a capacity of only 10-tons. The existing crane in building 143 does not meet current OSHA and Crane Manufacturers Association of American (CMAA) standards. The 10-ton capacity limits the type of work that can be accomplished.
b. ANTICIPATED BENEFITS: Bring 1955 10-ton crane system up to current OSHA and Crane Manufacturers Association of America (CMAA) requirements and increase its' lift capacity to 30 tons. The 30-ton capacity will increase support to the M1 AIM 21, Paladin programs, and allow other bridge work being performed in other buildings be moved to building 170. The capacity of the building 170 crane will be sufficient for lifting 51,000 pounds, which is the approximate weight of a 30-ton bridge. This will maximize utilization of the storage area. The crane systems will facilitate the overhaul and maintenance of the M1, M88, M109, M113 vehicles and all towed artillery. The vehicle workload per year is: FY04-624, FY05-654, FY06-726, FY07-681.
c. IMPACT WITHOUT PROPOSED CAPITAL INVESTMENT: ANAD personnel will have to continue to work under an unsafe and outdated crane system in building 143. The work in 400 will have to be placed in a stop and go procedure. While a bay is being utilized for one program there will be another program that cannot be accomplished until that bay is cleared and retooled. Delays and cost overruns will be unavoidable due to work being done in a bay and other work waiting for the space to accomplished the work. All work requires crane assistance therefore floor space under a crane is a requirement.
d. ECONOMIC ANALYSIS PERFORMED? Yes.
95 Exhibit Fund-9b Activity Group Capital Investment Justification

ACTIVITY GROUP CAPITAL INVESTMENT PROGRAM A. Budget SubmissionEQUIPMENT- Replacement FY 2004-2005
($ in Thousands) OSD/OMB Budget Submission
B. Component, Activity Group, Date C. Line No Item Description D. Activity IdentificationArmy, Depot Maintenance Feb 03 04-06 Upgrade of IFTE-CEE Test Stations Anniston Army Depot (ANAD)
FY 02 FY03Element of Cost Quantity Unit Cost Total Cost Quantity Unit Cost Total Cost Quantity Unit Cost Total Cost Quantity Unit Cost Total CostUpgrade of IFTE-CEE Test Stations 2 1,384.000 2,768.000
TOTAL 2 2,768.000 Narrative Justification:
ECONOMIC INDICATORS:Total Cost of the Project $2,768 Net Present Value of Benefits: $50,839 Benefit to Investment Ratio: 20.853 Payback Period: 5.200
FY 04 FY 05
a. CAPABILITY OF EXISTING EQUIPMENT AND SHORTCOMINGS: All tracked combat vehicles, except for the Bradley Fighting Vehicle, are repaired at ANAD. Many of these vehicles including the M1A1 and M1A2 Abrams Tanks and the M109A6 Paladin Self-propelled Howitzer, contain complex electronic assemblies that must be tested for proper operation and repair as needed. The IFTE-CEE (Integrated Family of Test Equipment - Commercial Equivalent Equipment) is the U.S. Army's standardized test equipment for automated testing of electronic components and assemblies of weapon systems at the depot level. Currently, ANAD utilizes 2 IFTE-CEE test stations, manufactured in 1980s, to test advanced electronic systems of the M1A1 and M1A2 Abrams Tanks and the M109A6 Paladin Self-Propelled Howitzer. Due to technological advances, many of the components and instrumentation in the current IFTE-CEE configuration are obsolete. b. ANTICIPATED BENEFITS: The planned modernization of the IFTE-CEE test stations will replace obsolete instrumentation with new, state-of-the-art instrumentation. The automated electronic testing capabilities will be enhanced and the test station configuration will be readily maintainable well into the future. ANAD's electronic testing capabilities will be ensured for support of all current and projected future workload.
c. IMPACT WITHOUT PROPOSED CAPITAL INVESTMENT: If the IFTE-CEE test stations are not modernized ANAD will lose its electronic testing capabilities when the test stations become obsolete and unrepairable after year 2005. Without the new IFTE-CEE test stations, ANAD will not have the capabilities to test and repair electronic components of the Army's weapon systems (M1 Abrams Family of Vehicles and the M109A6 Paladin Self-Propelled Howitzer). Additionally, ANAD will not be capable of executing any potential new future workloadrequiring electronic component testing and repair.
d. ECONOMIC ANALYSIS PERFORMED? Yes
96 Exhibit Fund-9b Activity Group Capital Investment Justification

ACTIVITY GROUP CAPITAL INVESTMENT PROGRAM A. Budget SubmissionEQUIPMENT- Replacement FY 2004-2005
($ in Thousands) OSD/OMB Budget Submission
B. Component, Activity Group, Date C. Line No Item Description D. Activity IdentificationArmy, Depot Maintenance Feb 03 04-07 Generator Load Bank ANAD
FY 02 FY03Element of Cost Quantity Unit Cost Total Cost Quantity Unit Cost Total Cost Quantity Unit Cost Total Cost Quantity Unit Cost Total CostGenerator Load Bank 1 600.000 600.000
TOTAL 1 600.000 Narrative Justification:
ECONOMIC INDICATORS:Total Cost of the Project $600 Net Present Value of Benefits: N/A Benefit to Investment Ratio: N/A Payback Period: N/A
FY 04 FY 05
a. CAPABILITY OF EXISTING EQUIPMENT AND SHORTCOMINGS: The existing load bank is only capable of testing a 5 megawatt generator. This load bank was pieced together in the 1970s from excess parts. It is unsafe to operate thereby posing a high probability of potential serious injury or death caused by electricalmishap. There has been a fire caused by this system in the past year that caused several thousands of dollars in damages to equipment stored nearby. This equipment is not capable of testing a 7.5 megawatt load bank.
b. ANTICIPATED BENEFITS: The new equipment will provide a safe compact unit that can test all generators, thus increasing capacity to support mission requirements and will result in fewer downtime problems.
c. IMPACT WITHOUT PROPOSED CAPITAL INVESTMENT: If funding is not received, will continue to test only 5 megawatt generator, using an unsafe, and outdated equipment. There is a high degree of probability that a very serious accident will happen with the operation of the existing load bank.
d. ECONOMIC ANALYSIS PERFORMED? Yes.
97 Exhibit Fund-9b Activity Group Capital Investment Justification

ACTIVITY GROUP CAPITAL INVESTMENT PROGRAM A. Budget SubmissionEQUIPMENT- Replacement FY 2004-2005
($ in Thousands) OSD/OMB Budget Submission
B. Component, Activity Group, Date C. Line No Item Description D. Activity IdentificationArmy, Depot Maintenance Feb 03 04-08 XT-1410 Transmission Test Stand ANAD
FY 02 FY03Element of Cost Quantity Unit Cost Total Cost Quantity Unit Cost Total Cost Quantity Unit Cost Total Cost Quantity Unit Cost Total CostXT 1410 Transmission Test Stand 1 600.000 600.000
TOTAL 1 600.000 Narrative Justification:
ECONOMIC INDICATORS:Total Cost of the Project $600 Net Present Value of Benefits: $2,796 Benefit to Investment Ratio: 6.121 ` 2.455
FY 04 FY 05
a. CAPABILITY OF EXISTING EQUIPMENT AND SHORTCOMINGS: Anniston has one transmission test stand for testing the XT-1410 series transmission that is used in the M88A1 and A2 recovery vehicles. This test stand was manufactured in 1968 and the components and instrumentation are obsolete and no longer supported by the manufacturer. The oil system is contaminated and no longer used, therefore the operator is forced to manually fill and drain the transmission for each test, and discard the oil upon completion. There is no heating system and the test stand cannot fully stall the transmission, which is a method for heating the transmission, therefore, the warm up period is very long. Shifting and steering is done manually and requires the operator to walk from the control room to the test piece each time. The test stand is down 5% of the time because components and instrumentation are obsolete.During the periods of down time, the transmissions that support the vehicle programs must be purchased from stock in order to keep the assembly line moving. The time required to test a transmission is 7.6 hours. It is estimated that this time can be reduced to 4.6 hours with a new test stand. The workload for return to stock transmissions is 100/year for the life of the project, and 55/year for vehicle programs for the life of the project. The current reject rate is 6%.
b. ANTICIPATED BENEFITS: A new test stand will provide ANAD with a more reliable and accurate piece of equipment, reduced downtime, and transmissions would no longer be purchased out of stock. The test time would be reduced by 3 hours per transmission, and the oil would no longer be discarded and would be reused.
c. IMPACT WITHOUT PROPOSED CAPITAL INVESTMENT: If the old test stand is not replaced it will result in more delays in the assembly lines impacting ANAD's ability to support theM88 and continue to test transmission in 7.6 hours.
d. ECONOMIC ANALYSIS PERFORMED? Yes
98 Exhibit Fund-9b Activity Group Capital Investment Justification

ACTIVITY GROUP CAPITAL INVESTMENT PROGRAM A. Budget SubmissionEQUIPMENT- Replacement FY 2004-2005
($ in Thousands) OSD/OMB Budget Submission
B. Component, Activity Group, Date C. Line No Item Description D. Activity IdentificationArmy, Depot Maintenance Feb 03 04-09 CNC Vertical Machining Center ANAD
FY 02 FY03Element of Cost Quantity Unit Cost Total Cost Quantity Unit Cost Total Cost Quantity Unit Cost Total Cost Quantity Unit Cost Total CostCNC Vertical Machining Ctr 4 256.230 1,024.920
TOTAL 4 1,024.920Narrative Justification:
ECONOMIC INDICATORS:Total Cost of the Project $1,025 Net Present Value of Benefits: $4,938 Benefit to Investment Ratio: 6.648 Payback Period: 2.287
FY 04 FY 05
a. CAPABILITY OF EXISTING EQUIPMENT AND SHORTCOMINGS: The existing four machines procured in 1992 support all tracked vehicle, bridge, and small arms programs at ANAD. These programs include the M1 FOV, M88 FOV, M9 ACE, M113 FOV and the AVLB. The machines have operated for two shifts during their service life, and in the last two years have experienced significant down time and incurred significant maintenance costs. Current and future workload requires all four machines to operate two shifts per day, 16,000 hours per year. During FY 00 the machines were down a total of 2,172 hours, 13.6% of the available time, and it is estimated this will increase 5% per year for the remainder of their life. Total maintenance costs in FY01 were $ 48,027.29 for the four machines. It is estimated that this cost will increase 5% per year for the remainder of their life. The current a+A15nd future production rate for the four machines is the only rate that is relevant for this analysis. The machines are loaded for 16,000 hours/ year. When the machines are not operational, all programs are impacted, and production schedules are not met.
b. ANTICIPATED BENEFITS: The machines are fully work loaded for two shifts each year. When a machine goes down, the work must be moved to a conventional machine, and is estimated to take four times as long to accomplish the same task. The machines were down a total of 2,172 hours in FY 00, and are estimated to be down 2,640 hours in 2004. This equates toapproximately $ 626 K additional labor cost in one year to do the same work using the old machines. The estimated maintenance cost for FY 05 is approximately $ 58,000 for the 4 machines, compared to zero maintenance costs in FY 05 for 4 new machines. Other work centers within the maintenance area depend on the Machining Branch to produce components on time in order for them to produce on time. New, more dependable machines would alleviate delays, which cost other shops dollars and cause delays in production schedules.
c. IMPACT WITHOUT PROPOSED CAPITAL INVESTMENT: With down time at 16.5% in FY 04 and increasing at a rate of 5% per year, the cost to produce weapon systems for the Army will be much higher for the Machining Branch, and will eventually render them incapable of performing their mission.
d. ECONOMIC ANALYSIS PERFORMED? Yes
99 Exhibit Fund-9b Activity Group Capital Investment Justification

ACTIVITY GROUP CAPITAL INVESTMENT PROGRAM A. Budget SubmissionEQUIPMENT- Replacement FY 2004-2005
($ in Thousands) OSD/OMB Budget Submission
B. Component, Activity Group, Date C. Line No Item Description D. Activity IdentificationArmy, Depot Maintenance Feb 03 04-10 Boring Mill ANAD
FY 02 FY03Element of Cost Quantity Unit Cost Total Cost Quantity Unit Cost Total Cost Quantity Unit Cost Total Cost Quantity Unit Cost Total CostBoring Mill 1 984.000 984.000
TOTAL 1 984.000Narrative Justification:
ECONOMIC INDICATORS:Total Cost of the Project $984 Net Present Value of Benefits: $2,221 Benefit to Investment Ratio: 3.399 Payback Period: 0.999
FY 04 FY 05
a. CAPABILITY OF EXISTING EQUIPMENT AND SHORTCOMINGS: The existing four machines procured in 1992 support all tracked vehicle, bridge, and small arms programs at ANAD. These programs include the M1 FOV, M88 FOV, M9 ACE, M113 FOV and the AVLB. These machines have operated for two shifts during their service life, and in the last two years have experienced significant down time and incurred significant maintenance costs. Current and future workload requires all four machines to operate two shifts per day, 16,000 hours per year. In FY00 the machines were down a total of 2,172 hours or 13.6% of the available time. Total maintenance costs in FY01 were $ 48,027.29 for the four machines. It is estimated that these costs/downtime will increase 5% per year for the remainder of their life.
b. ANTICIPATED BENEFITS: The estimated maintenance cost for FY05 is approximately $ 58,000 for the 4 machines, compared to zero maintenance costs in FY05 for 4 new machines. The other work centers within the maintenance area depend on the Machining Branch to produce components on time in order for them to meet production deadline. The new and more dependable machines would alleviate delays, which cost other shops dollars and cause delays in production schedules.
c. IMPACT WITHOUT PROPOSED CAPITAL INVESTMENT: If funding is not received, downtime and maintenance repair costs estimated at 5% per year will increased and the old machine eventually will be incapable to support the mission.
d. ECONOMIC ANALYSIS PERFORMED? Yes
100 Exhibit Fund-9b Activity Group Capital Investment Justification

ACTIVITY GROUP CAPITAL INVESTMENT JUSTIFICATION A. Budget SubmissionEQUIPMENT- Productivity FY 2004-2005
($ in Thousands) OSD/OMB Budget Submission
B. Component, Activity Group, Date C. Line No Item Description D. Activity IdentificationArmy, Depot Maintenance Feb 03 03-09 Various Capital Equipment(< 500K) All Depots
FY02 FY03Element of Cost Quantity Unit Cost Total Cost Quantity Unit Cost Total Cost Quantity Unit Cost Total Cost Quantity Unit Cost Total CostVarious Eqpt <$500K 7 322.572 2,258.004 10 395.301 3,953.010 6 291.335 1,748.010IP01008/IP0210003 1 162.726 162.726IP03000/IP0310002 1 271.744 271.744
TOTAL 2 434.470 7 2,258.004 10 3,953.010 6 1,748.010Narrative Justification:
ECONOMIC INDICATORS:Total Cost of the Project $8,393 Net Present Value of Benefits: N/A Benefit to Investment Ratio: N/A Payback Period: N/A
FY 05FY 04
a. CAPABILITY OF EXISTING EQUIPMENT AND SHORTCOMINGS: This project represents various modernization equipment costing <$500K which will improve depot productivity and efficiency, increase the utilization of Automated Test Equipment (ATE) for troubleshooting and testing of electronic gear during the overhaul process. Equipment supports organic maintenance, modification, and repair programs. In addition, various depot equipment items have outlived their useful lives, become uneconomical to repair, or become unsafe to operate. Other equipment is technologically obsolete and its continued use reduces productivity. Examples are the Small CNC Horizontal Turning Lathe and Universal Cylindrical Grinding machine at CCAD. Additionally, some equipment investments are needed to meet environmental requirements. b. ANTICIPATED BENEFITS: Acquisition of equipment improves productivity, reduces operating costs, and increases capacity which cannot be met with current equipment. The equipment will replace unsafe or inoperable/unusable assets, and includes environmental hazardous waste reduction or regulatory agency mandated requirements. The new equipment increases reliability, and productivity, thus enabling the depot to reduce existing backlog and improve responsiveness to customer needs. c. IMPACT WITHOUT PROPOSED CAPITAL INVESTMENT: Failure to obtain equipment would continue costly manual troubleshooting procedures. Production workers would have to continue to troubleshoot and test circuit cards in hours rather than minutes. If not acquired, equipment support capability would not provide for mission needs and would result in reduced mission capability, failure to meet present and future workload requirements, will not meet production schedules, lead to excessive downtime, and decrease accuracy and dependability. Depot Maintenance equipment will not adequately support the depots' mission, needed capabilities will be deferred, the ability to handle the present and future workloads will be compromised, man-hour expenditures including overtime will be increased due to the excessive downtime of current equipment, and the accuracy and dependability of the output products will be diminished. d. ECONOMIC ANALYSIS PERFORMED? Yes.
101 Exhibit Fund-9b Activity Group Capital Investment Justification

ACTIVITY GROUP CAPITAL INVESTMENT JUSTIFICATION A. Budget SubmissionEQUIPMENT - Productivity FY 2004-2005
($ in Thousands) OSD/OMB Budget Submission
B. Component, Activity Group, Date C. Line No Item Description D. Activity IdentificationArmy, Depot Maintenance Feb 03 02-03 Engine Test Cell Capacity Upgrade CCAD
FY02 FY03Element of Cost Quantity Unit Cost Total Cost Quantity Unit Cost Total Cost Quantity Unit Cost Total Cost Quantity Unit Cost Total CostEngine Test Cell Capacity 1 3,100.000 3,100.000 Upgrade
TOTAL 1 3,100.000
Narrative Justification:
ECONOMIC INDICATORS:Total Cost of the Project $3,100 Net Present Value of Benefits: $6,006 Benefit to Investment Ratio: 2.40 Payback Period: 5.33
FY 05FY 04
a. CAPABILITY OF EXISTING EQUIPMENT AND SHORTCOMINGS: CCAD currently has 10 test cells for testing production engines for the CH47 and Apache/Blackhawk helicopters. This includes four cells for testing the CH47 engine, four for the Apache/Blackhawk engine, and two for the aft section only of the Apache/Blackhawk engine. The test cells are very old and experience frequent and lengthy downtime for maintenance and calibration, which limits the throughput production rate. The number of annual engine tests performed is currently under 1000 and the cells, as currently configured, are barely capable of meeting this workload. Because of the Re-Capitalization programs, the workload is projected to increase to 2,610 in FY02 and 3,281 in FY03 with further increases until FY15. The current system has gone through refurbishment in 1973 and some parts were upgraded in 1990 to keep it operational.
b. ANTICIPATED BENEFITS: The depot plans to upgrade one of the CH47 engine test cells to make it capable of testing any engine or engine component configuration. The upgraded cell would also include new technology to make it more efficient and increase its throughput. It would provide fast data sampling, fast configuration conversion and faster, more robust data display to assure the operator that the test item wasn't being damaged and that the final product was of high quality. It would also provide automatic data recording and analysis and significantly reduce the risk of transcription errors. The upgraded cell would provide back-up testing capability for all the other cells and could be dedicated to a particul;ar engine in case of a safety-of-flight related production increase or other surge.
c. IMPACT WITHOUT PROPOSED CAPITAL INVESTMENT: If funding is not approved, engine testing at projected production levels for the next 15 years will have to be contracted out. This will increase cost to the overall cost of overhauling engines and would cause serious delays in turn around time.
d. ECONOMIC ANALYSIS PERFORMED? Yes.
102 Exhibit Fund-9b Activity Group Capital Investment Justification

ACTIVITY GROUP CAPITAL INVESTMENT JUSTIFICATION A. Budget SubmissionEQUIPMENT- Productivity FY 2004-2005
($ in Thousands) OSD/OMB Budget Submission
B. Component, Activity Group, Date C. Line No Item Description D. Activity IdentificationArmy, Depot Maintenance Feb 03 03-09 HP3070 TPS Development Phase V TYAD
FY02 FY03Element of Cost Quantity Unit Cost Total Cost Quantity Unit Cost Total Cost Quantity Unit Cost Total Cost Quantity Unit Cost Total CostHP3070 TPS Development Phase V 1 501.000 501.000IP02006/IP031001
TOTAL 1 501.000Narrative Justification:
ECONOMIC INDICATORS:Total Cost of the Project $501 Net Present Value of Benefits: $4,619 Benefit to Investment Ratio:11.0 11.00 Payback Period:1.7 1.70
FY 05FY 04
a. CAPABILITY OF EXISTING EQUIPMENT AND SHORTCOMINGS: The depot's Circuit Card Assembly Test System, the Hewlett Packard (HP) 3070 currently does not have Test Programs (TPS) for two important items of equipment, the AN/VPQ-1, a Range Threat System, and the Atomic Frequency Time Reference (AFTR) System. As a result, depot employees have to manually test and troubleshoot the circuit card assemblies (CCAs) in this equipment using outdated test equipment. The AN/VPQ-1 has twenty two CCAs and the AFTR system has thirteen. Manual testing and fault isolation for each CCA takes between 160 to 240 minutes depending upon the complexity of the particular CCA. The depot currently repairs an average of 705 CCAs per month for these two systems.
b. ANTICIPATED BENEFITS: Test Programs (TPS) are comprised of software programs written for the systems to be tested, written test procedures, and for any necessary test hardware, such as connection devices and cabling. The HP 3070 typically reduces the testing and troubleshooting time to about 4 minutes per CCA for the equipment for which it has TPS's developed. Testing and troubleshooting these CCAs with the HP3070 would save an estimated 23,220 direct labor hours per year and provide estimated annual cost savings of $638,829.
c. IMPACT WITHOUT PROPOSED CAPITAL INVESTMENT: The depot would continue to test and troubleshoot CCAs for the AN/VPQ-1 and the AFTR system manually and would not obtain the productivity gains of using Automated Test Equipment. Production workers would continue to require hours, rather than minutes to test and troubleshoot circuit card assemblies.
d. ECONOMIC ANALYSIS PERFORMED? Yes.
103 Exhibit Fund-9b Activity Group Capital Investment Justification

ACTIVITY GROUP CAPITAL INVESTMENT JUSTIFICATION A. Budget SubmissionEQUIPMENT- Productivity FY 2004-2005
($ in Thousands) OSD/OMB Budget Submission
B. Component, Activity Group, Date C. Line No Item Description D. Activity IdentificationArmy, Depot Maintenance Feb 03 03-10 Control Consoles and Wiring Speed Drive CCAD
FY02 FY03Element of Cost Quantity Unit Cost Total Cost Quantity Unit Cost Total Cost Quantity Unit Cost Total Cost Quantity Unit Cost Total CostControl Consoles and Wiring 1 2,034.000 2,034.000 Speed Drive
TOTAL 1 2,034.000Narrative Justification:
ECONOMIC INDICATORS:Total Cost of the Project $2,034 Net Present Value of Benefits: $817 Benefit to Investment Ratio: 1.44 Payback Period: 6.30
FY 05FY 04
a. CAPABILITY OF EXISTING EQUIPMENT AND SHORTCOMINGS: The control consoles and variable speed drives of several pieces of specialized electrical and electronic controllers and signal conditioners were manufactured in 1982. Major components within the consoles are obsolete and no longer supported by their manufacturers. The existing variable speed drive is unsupportable. The existing wiring is in poor condition and a major maintenance repair cost generator. Estimated cost to contract out the lost testing capacity testing $2,700 annually.
b. ANTICIPATED BENEFITS: The depot will realize a cost savings of $2,700 the annual estimated cost for contracting out lost testing capacity. Replacing the old equipment will increase productivity for the UH60 transmissions and gearboxes and increase the size of the overhaul program which will benefit the depot.
c. IMPACT WITHOUT PROPOSED CAPITAL INVESTMENT: If funding is not received, CCAD will not be able to maintain testing capacity for UH60 transmissions and gearboxes. CCAD will lose 1/2 of its H60 transmission and gearbox test capability and will have to reduce the size of the overhaul program or contract out the testing portion of the overhaul. Estimated number of assets involved is 131 annually. Estimated cost to contract out testing of these units is $2,700 annually.
d. ECONOMIC ANALYSIS PERFORMED? Yes.
104 Exhibit Fund-9b Activity Group Capital Investment Justification

ACTIVITY GROUP CAPITAL INVESTMENT JUSTIFICATION A. Budget SubmissionEQUIPMENT- Productivity FY 2004-2005
($ in Thousands) OSD/OMB Budget Submission
B. Component, Activity Group, Date C. Line No Item Description D. Activity IdentificationArmy, Depot Maintenance Feb 03 04-11 Plastic Media Blast System CCAD
FY 02 FY03Element of Cost Quantity Unit Cost Total Cost Quantity Unit Cost Total Cost Quantity Unit Cost Total Cost Quantity Unit Cost Total CostPlastic Media Blast System 1 2,082.363 2,082.363
TOTAL 1 2,082.363 Narrative Justification:
ECONOMIC INDICATORS:Total Cost of the Project $2,082 Net Present Value of Benefits: $1,079 Benefit to Investment Ratio: 1.56 Payback Period: 6.71
FY 05FY 04
a. CAPABILITY OF EXISTING EQUIPMENT AND SHORTCOMINGS: The equipment was designed to remove paint from small rotary wing airframes, like the UH-1 Huey and AH-1 Cobras. The integrated blast booth does not provide enough space for operator fall protection, safety stands and/or man-lifts when removing paint from large rotary wing airframes, like the UH-60 Black Hawk and CH-47 Chinooks. The location of the equipment requires transporting the large airframes through main thoroughfares to reach follow on operations like cleaning. The operators use hoses with nozzles that cause repetitive motion and are awkward.
b. ANTICIPATED BENEFITS: The new equipment will have adequate space for removing paint from large airframes, fall protection and integrated work platforms for safely reaching all areas of the airframe, ergonomic improvements to reduce worker fatigue and repetitive motion, and an integrated airframe lift system compatible with all airframes. The purchase of new equipment will have better media delivery, dust filtration system and reduced handling and transportation to follow on operations. The estimated production will increase by 15% increase.
c. IMPACT WITHOUT PROPOSED CAPITAL INVESTMENT: If the project is not funded, it could lead to potential for worker injury and Occupational Safety and Health Administration citations. CCAD will not be able to meet surge requirements because of a 100% increase in on-condition maintenance, recapitalization and cross service maintenance workload and delay in returning aircraft to the field.
d. ECONOMIC ANALYSIS PERFORMED? Yes.
105 Exhibit Fund-9b Activity Group Capital Investment Justification

ACTIVITY GROUP CAPITAL INVESTMENT JUSTIFICATION A. Budget SubmissionEQUIPMENT- Productivity FY 2004-2005
($ in Thousands) OSD/OMB Budget Submission
B. Component, Activity Group, Date C. Line No Item Description D. Activity IdentificationArmy, Depot Maintenance Feb 03 05-08 Aircraft Corrosion Control Equipment CCAD
FY 02 FY03Element of Cost Quantity Unit Cost Total Cost Quantity Unit Cost Total Cost Quantity Unit Cost Total Cost Quantity Unit Cost Total CostDesign 1 600.000 600.000Equipment Acquisition 1 10,000.000 10,000.000
TOTAL - - 1 600.000 1 10,000.000 Narrative Justification:
ECONOMIC INDICATORS:Total Cost of the Project $10,600 Net Present Value of Benefits: $23,859 Benefit to Investment Ratio: 2.00 Payback Period: 9.61
FY 05FY 04
a. CAPABILITY OF EXISTING EQUIPMENT AND SHORTCOMINGS: Currently, CCAD is using 31 year old process equipment to paint airframes for UH-60 Black Hawk, CH-47D Chinook and AH-64 Apache rotary wing aircraft. Three (3) of the four (4) paint booths are too small to safely paint UH-60 Black Hawks and CH-47 Chinooks airframes. The paint booths do not meet Occupational Safety and Health Administration (OSHA) requirements for ventilation velocity and fall protection or Environmental Protection Agency (EPA) requirements for Volatile Organic Compound (VOC) scrubbing and monitoring. An EPA exemption for VOC emissions expires in 2002. The new permits will restrict VOC emission and may require a reduction in painting, which will result in decreased production output. U.S. Army Aviation and Missile Command is evaluating water reducible primers and paints, but they are not compatible with current operations.
b. ANTICIPATED BENEFITS: Capital equipment for Aircraft Corrosion Control Facility, MCA Project Form #55460. The purchase of this equipment will increase production through-put, decrease aircraft travel time by including all preparation and painting processes in one (1) facility, the ergonomic design will result in more space for processing any size airframe, and will result in maximum attainable emission control technologies for solvent containment to meet forecasted Federal and State requirements. This will also enhance safety process/procedures due to ergonomic design of equipment, integrated fall protection over the entire airframe and integrated airframe lift system adaptable for any airframe.
c. IMPACT WITHOUT PROPOSED CAPITAL INVESTMENT: If funding is not received, CCAD will have an empty facility unusable for intended purpose. CCAD will not be able to fully meet production requirements for Recapitalization of UH-60 BlackHawk, CH-47D Chinook and AH-64 Apache rotary wing aircraft as well as on-condition maintenance for cross service aircraft. If water reducible primers and paints are approved, the EPA will require immediate implementation.
d. ECONOMIC ANALYSIS PERFORMED? Yes
106 Exhibit Fund-9b Activity Group Capital Investment Justification

ACTIVITY GROUP CAPITAL INVESTMENT JUSTIFICATION A. Budget SubmissionEQUIPMENT- Productivity FY 2004-2005
($ in Thousands) OSD/OMB Budget Submission
B. Component, Activity Group, Date C. Line No Item Description D. Activity IdentificationArmy, Depot Maintenance Feb 03 05-09 Flight Critical Parts Inspection & Treatment Eqpt CCAD
FY 02 FY03Element of Cost Quantity Unit Cost Total Cost Quantity Unit Cost Total Cost Quantity Unit Cost Total Cost Quantity Unit Cost Total CostDesign 1 490.000 490.000Equipment Acquisition 1 8,504.745 8,504.745
TOTAL 1 490.000 1 8,504.745 8,504.745 Narrative Justification:
ECONOMIC INDICATORS:Total Cost of the Project $8,995 Net Present Value of Benefits: $16,583 Benefit to Investment Ratio: 1.95 Payback Period: 10.17
FY 05FY 04
a. CAPABILITY OF EXISTING EQUIPMENT AND SHORTCOMINGS: The Non-Destructive Inspections (NDT) shop, Materials Lab, Shot Peen shop, and Paint shop are required to support newer aircraft such as the Blackhawk and Apache helicopters. The NDT shop lacks the proper processes and integrated material handling system to provide timely support for the newer workload. The magnetic particle inspection unit breaks down and/or overheats which result in dangerous evaporating combustible fumes resulting in safety citation. The machines used in these shops are old and obsolete which causes increased manual operation, lost productivity, and process in variance from quality standards. These impacts the Flight of Safety parts for each piece of equipment. In addition, the equipment at the Paint Shop is not environmentally compliant, there's no exhaust system to remove paint and particulate laden air, there's no humidity controlled paint booths, and lacks adequate ventilation system.
b. ANTICIPATED BENEFITS: The new equipment will reduce processing time, operating cost, enhance safety, and compliant with environmental regulations. The new equipment will be ergonomically designed to meet requirements of the new MCA building (MCA Project Form #55449). The new equipment will have advanced technologies for automated and non-automated eddy current, ultrasonic and x-ray/computed tomography to support RECAP missions.
c. IMPACT WITHOUT PROPOSED CAPITAL INVESTMENT: If the project is not funded, CCAD will have an empty facility unusable for intended purpose. CCAD will not be able to meet all production requirements for Recapitalization of UH-BlackHawk, CH-47D Chinook and AH-64 Apache rotary wing aircraft as well as on-condition maintenance for cross service aircraft. Process equipment will not be adequately upgraded to provide the optimum, most cost effective, and best dollar value overhaul processes for DOD. Without the new equipment, it could lead to violation of the Clean Air Act of 1990 and violation of OSHA Safety Regulations.
d. ECONOMIC ANALYSIS PERFORMED? Yes.
107 Exhibit Fund-9b Activity Group Capital Investment Justification

ACTIVITY GROUP CAPITAL INVESTMENT JUSTIFICATION A. Budget SubmissionEQUIPMENT- Environmental FY 2004-2005
($ in Thousands) OSD/OMB Budget Submission
B. Component, Activity Group, Date C. Line No Item Description D. Activity IdentificationArmy, Depot Maintenance Feb 03 04-12 Various Capital Equipment(< 500K) All Depots
FY02 FY03Element of Cost Quantity Unit Cost Total Cost Quantity Unit Cost Total Cost Quantity Unit Cost Total Cost Quantity Unit Cost Total CostVarious Eqpt <$500K 3 267.000 801.000
TOTAL 3 801.000Narrative Justification:
ECONOMIC INDICATORS:Total Cost of the Project $801 Net Present Value of Benefits: N/A Benefit to Investment Ratio: N/A Payback Period: N/A
FY 04 FY 05
a. CAPABILITY OF EXISTING EQUIPMENT AND SHORTCOMINGS: This project represents various modernization equipment costing <$500K which will improve depot productivity and efficiency, equipment supports organic maintenance, modification, and repair programs. In addition, various depot equipment items have outlived their useful lives, become uneconomical to repair, or become unsafe to operate. Other equipment is technologically obsolete and its continued use reduces productivity. Examples are VOC Absorbers/Concentrators, Blast Cleaning Booth upgrade (LEAD) and Sewer Jet Rodding equipment (ANAD). These equipment investments are needed to meet environmental requirements.
b. ANTICIPATED BENEFITS: Acquisition of equipment improves productivity, reduces operating costs, and increases capacity which cannot be met with current equipment. The equipment will replace unsafe or inoperable/unusable assets, and includes environmental hazardous waste reduction or regulatory agency mandated requirements. The new equipment increases reliability, and productivity, thus enabling the depot to reduce existing backlog and improve responsiveness to customer needs.
c. IMPACT WITHOUT PROPOSED CAPITAL INVESTMENT: Failure to obtain equipment would result in non compliance with regulatory requirements and equipment support capability would not provide for mission needs, cause inability to meet production schedules and lead to excessive downtime.
d. ECONOMIC ANALYSIS PERFORMED? Yes
108 Exhibit Fund-9b Activity Group Capital Investment Justification

ACTIVITY GROUP CAPITAL INVESTMENT JUSTIFICATION A. Budget SubmissionEQUIPMENT- Environmental FY 2004-2005
($ in Thousands) OSD/OMB Budget Submission
B. Component, Activity Group, Date C. Line No Item Description D. Activity IdentificationArmy, Depot Maintenance Feb 03 03-11 Dust Collection System LEAD
FY02 FY03Element of Cost Quantity Unit Cost Total Cost Quantity Unit Cost Total Cost Quantity Unit Cost Total Cost Quantity Unit Cost Total CostDust Collection System 1 669.185 669.185
TOTAL 1 669.185Narrative Justification:
ECONOMIC INDICATORS:Total Cost of the Project $669 Net Present Value of Benefits: N/A Benefit to Investment Ratio: N/A Payback Period: N/A
FY 04 FY 05
a. CAPABILITY OF EXISTING EQUIPMENT AND SHORTCOMINGS: A safety and environmental problem exists in the dust collection system in Bldg. 350. The method of replacing the filter bags continually exposes the performing workers to the blast residue, which contains hazardous material. In addition, the current system doesn't adequately filter the air that is recycled back into the shop and allows cadmium, chromium and other contaminants to escape. The purpose of this project is to take proactive action to correct these problems before they lead to a Notice of Violation from State and Federal regulatory entities. The current system is seventeen years old.
b. ANTICIPATED BENEFITS: The new system would provide clean, well filtered return air to the building. It would eliminate the time consuming manual emptying of the collection hoppers and the spillage, which normally occurs and endangers the health of the workers . It would ensure a safer work environment and compliance with all EPA air quality regulations.
c. IMPACT WITHOUT PROPOSED CAPITAL INVESTMENT: Failure to fund and execute this project could result in Notice of Violation against LEAD from Federal and/or State regulatory entities.
d. ECONOMIC ANALYSIS PERFORMED? Yes.
109 Exhibit Fund-9b Activity Group Capital Investment Justification

ACTIVITY GROUP CAPITAL INVESTMENT JUSTIFICATION A. Budget SubmissionEQUIPMENT- Environmental FY 2004-2005
($ in Thousands) OSD/OMB Budget Submission
B. Component, Activity Group, Date C. Line No Item Description D. Activity IdentificationArmy, Depot Maintenance Feb 03 04-13 Air Pollution Control Equipment ANAD
FY 02 FY03Element of Cost Quantity Unit Cost Total Cost Quantity Unit Cost Total Cost Quantity Unit Cost Total Cost Quantity Unit Cost Total CostAir Pollution Control Equip. 3 666.700 2,000.100
TOTAL 3 2,000.100Narrative Justification:
ECONOMIC INDICATORS:Total Cost of the Project $2,000 Net Present Value of Benefits: N/A Benefit to Investment Ratio: N/A Payback Period: N/A
FY 04 FY 05
a. CAPABILITY OF EXISTING EQUIPMENT AND SHORTCOMINGS: The paint booths covered by this project do not have pollution controls. They are located in bldg 409 at Anniston Army Depot and support all vehicle and return to stock programs at ANAD. Vehicle Workload: FY02: 633; FY03: 549; FY04: 624; FY05: 654; FY06: 726; FY07: 681Major Return to Stock Programs (engines, transmission, final drives): FY02: 4240; FY03: 2858; FY04: 2836; FY05: 2647; FY06: 2536; FY07: 2540
b. ANTICIPATED BENEFITS: The Environmental Protection Agency (EPA) cites 40CFR63 and 42 USC 7401 as the authority to issue the Miscellaneous Metal Parts and Products National Emission Standard for Hazardous Air Pollutants (NESHAP). DOD and the Army are working with EPA on the details of this NESHAP. Depot-wide compliance with the NESHAP is expected to require some pollutant destruction. These high-volume paint booths will control most of the pollutants emitted at ANAD.
c. IMPACT WITHOUT PROPOSED CAPITAL INVESTMENT: Non-Compliance with the NESHAP and severe limitations on ANAD painting operations.
d. ECONOMIC ANALYSIS PERFORMED? Yes.
110 Exhibit Fund-9b Activity Group Capital Investment Justification

ACTIVITY GROUP CAPITAL INVESTMENT JUSTIFICATION A. Budget SubmissionAUTOMATED DATA PROCESSING FY 2004-2005
($ in Thousands) OSD/OMB Budget Submission
B. Component, Activity Group, Date C. Line No Item Description D. Activity IdentificationArmy, Depot Maintenance Feb 03 04-14 CAD/CAM/DNC Network Upgrade LEAD
FY 02 FY03 FY 04 FY 05Element of Cost Quantity Unit Cost Total Cost Quantity Unit Cost Total Cost Quantity Unit Cost Total Cost Quantity Unit Cost Total CostCAD/CAM/DNC Upgrade 1 157.000 157.000
TOTAL - - 1 157.000 - Narrative Justification:
ECONOMIC INDICATORS:Total Cost of the Project $157 Net Present Value of Benefits: $5,501 Benefit to Investment Ratio: 1.04 Payback Period: N/A
a. CAPABILITY OF EXISTING EQUIPMENT AND SHORTCOMINGS: The existing equipment is 10 years old and heavily utilized. The Machine Interface Units (MIUs) are IBM industrial PS2 Machines. The SND application software was custom written for LEAD by a company which ceased to exist in 1994. Maintenance contract vendor states that replacement parts are becoming impossible to find when a component fails, especially for PS2 units. Attempts to run PS2 application on newer PCs and newer DOS versions have resulted in failure (incompatibility).
b. ANTICIPATED BENEFITS: Upgrade will bring DNC system to modern standards and reduce dependence on outdated, unsupportable software and equipment. Machine Shop operations continue to support major item work loads such as PATRIOT Recap ground support, HAWK, and overall depot maintenance mission.
c. IMPACT WITHOUT PROPOSED CAPITAL INVESTMENT: The existing system is 10 years old and supports CNC programming for the PATRIOT Recap ground support and overall depot maintenance mission. Failure to approve and fund this project will result in the use of manual programming methods which will adversely impact production efficiency and pose a risk for the PATRIOT Recap schedule and cost.
d. ECONOMIC ANALYSIS PERFORMED? Yes.
111

ACTIVITY GROUP CAPITAL INVESTMENT PROGRAM A. Budget SubmissionMinor Construction FY 2004-2005
($ in Thousands) OSD/OMB Budget Submission
B. Component, Activity Group, Date C. Line No Item Description D. Activity IdentificationArmy, Depot Maintenance Feb 03 02-01 Various Minor Construction <$750K All Depots
FY02 FY03Element of Cost Quantity Unit Cost Total Cost Quantity Unit Cost Total Cost Quantity Unit Cost Total Cost Quantity Unit Cost Total Cost
4 273.250 1,093.000 5 361.200 1,806.000 15 425.000 6,375.000 6 414.000 2,484.000
TOTAL 4 1,093.000 5 1,806.000 15 6,375.000 6 2,484.000Narrative Justification:
ECONOMIC INDICATORS:Total Cost of the Project $11,758 Net Present Value of Benefits: NA Benefit to Investment Ratio: NA Payback Period: NA
FY 04 FY 05
a. CAPABILITY OF EXISTING EQUIPMENT AND SHORTCOMINGS: The requested funds are required to correct various workload and production shortcomings and health, safety, environmental, and security conditions. Examples of projects that correct workload/production deficiencies are the Production Staging Area, Material Management Staging Area, and the Combat Vehicle Support Facility, at ANAD. Examples of projects required to correct health, safety, environmental and security concerns are the STP Equalization Pond, and the Hydraulic Fluid Containment, at ANAD and the IOF Dust Collector Building at TYAD.
b. ANTICIPATED BENEFITS: These projects will permit compliance with safety and environmental standards by providing ample workspace that is environmentally safe, shielding production areas from contaminants, providing secure, organized storage for tools and fixtures, reducing shop congestion and improving material handling capabilities. These projects support mission requirements by providing environmentally controlled space for testing the M1 Tank transmissions and staging areas for parts during various cleaning operations. They increase employee productivity and reduce operating costs by protecting metal stocks and in-process components from the weather and reducing the cost of receiving parts from vendors. Major weapons supported: M1, M113 FOV, M60, AVLB, M109 and M48 combat vehicles.
c. IMPACT WITHOUT PROPOSED CAPITAL INVESTMENT: Without these projects, the installations will not comply with health, safety, and environmental requirements. The Army will not benefit from the improved efficiencies and reduced costs, which would result from these projects. The ability of the installations to accomplish present and future workload requirements could be affected.
d. ECONOMIC ANALYSIS PERFORMED? Yes.
112 Exhibit Fund-9b Activity Group Capital Investment Justification

ACTIVITY GROUP CAPITAL INVESTMENT JUSTIFICATION A. Budget SubmissionMINOR CONSTRUCTION FY 2004-2005
($ in Thousands) Budget Estimate Submission
B. Component, Activity Group, Date C. Line No Item Description D. Activity IdentificationArmy, Depot Maintenance Feb 03 04-15 Welding Facility ANAD
FY 02 FY03Element of Cost Quantity Unit Cost Total Cost Quantity Unit Cost Total Cost Quantity Unit Cost Total Cost Quantity Unit Cost Total CostWelding Facility 1 963.000 963.000
TOTAL 1 963.000Narrative Justification:
ECONOMIC INDICATORS:Total Cost of the Project $963 Net Present Value of Benefits: N/A Benefit to Investment Ratio: N/A Payback Period: N/A
FY 04 FY 05
a. CAPABILITY OF EXISTING EQUIPMENT AND SHORTCOMINGS: Currently, the welding operations are being performed in buildings 117 and 184 and supporting sheet metal cutting operations in the south side of building 413. These buildings are substandard and not designed for welding operations. The buildings are poorly ventilated and potentially exposes workers to airborne cadmium above the OSHA allowable exposure limits . These functions are being done to support the fabrication of vital parts for the M1 and M113 vehicles as well as the turbine engine for the M1 tank. The heat from these welding operations produces cadmium fumes, which migrates into the work areas occupied by non-welding personnel. b. ANTICIPATED BENEFITS: The consolidation of these operations into a separate facility will provide an OSHA compliant work area for the welding personnel, will provide ample ventilation, improved working conditions, enhanced operational efficiencies, and increase safety by minimizing exposure of non-welding personnel to the hazardous cadmium fumes. Current OSHA requirements mandate employers protect employees from cadmium/toxic materials present in work areas, ref. OSHA Toxic Substances requirements and 29 CFR Section 1910.1027. c. IMPACT WITHOUT PROPOSED CAPITAL INVESTMENT: If this project is not approved, the installations will not comply with health, safety, environmental, and security requirements. This could lead to OSHA citations in addition to potential for increased workman's compensations due to the poor ventilation and working conditions. This could increase costs and delay production schedules for the M1 and M113 repair operations. The Army will not benefit from the improved efficiencies and reduced costs, which would result from this project. The ability of the installations to accomplish present and future workload requirements could be affected.
d. ECONOMIC ANALYSIS PERFORMED? This proposal is exempt from the requirement of a formal Economic Analysis IAW the Department of The Army Economic Analysis Manual, July 1995, pg. 3, paragraph 2-2, c(2). An exemption is applicable for this project based on OSHA Compliance Standards, 29 CFR 1910.
113 Exhibit Fund-9b Activity Group Capital Investment Justification

DEPOT MAINTENANCE CAPITAL INVESTMENT JUSTIFICATION A. Budget SubmissionSOFTWARE FY 2004-2005
($ in Thousands) OSD/OMB Budget Submission
B. Component, Activity Group, Date C. Line No Item Description D. Activity IdentificationArmy, Depot Maintenance Feb 03 99-08 Army Workload & Performance System (AWPS) Various Installations
FY02 FY03Element of Cost Quantity Unit Cost Total Cost Quantity Unit Cost Total Cost Quantity Unit Cost Total Cost Quantity Unit Cost Total CostAWPS 1 2,943.00 2,943.000 1 2,943.000 2,943.000 1 2,265.000 2,265.000 1 1,397.000 1,397.000
TOTAL 1 2,943.000 1 2,943.000 1 2,265.000 1 1,397.000Narrative Justification:
ECONOMIC INDICATORS:Total Cost of the Project $9,548 Net Present Value of Benefits: N/A Benefit to Investment Ratio: N/A Payback Period: N/A
FY 04 FY 05
a. CAPABILITY OF EXISTING EQUIPMENT AND SHORTCOMINGS: The General Accounting Office concluded in February 1997 that the Army cannot identify and prioritize its institutional workload. The material weakness stated that "...managers at all levels do not have the information needed to improve work performance, improve organizational efficiency, and determine support staffing needs, manpower budgets, and personnel reduction." The Army's plan to correct this material weakness includes the fielding of AWPS.
b. ANTICIPATED BENEFITS: The AWPS will assist the Tank, Automotive and Armament Command (TACOM), Communications and Electronics Command (CECOM) and Aviation and Missile Command (AMCOM) in managing complex workload and employment strategies. AWPS is a personal computer based, networked software solution designed to integrate existing production and financial data into a single graphic program. Production and resource managers can isolate key scheduling and cost problems at the product level, and project workforce needed to accomplish various levels of workload.
c. IMPACT WITHOUT PROPOSED CAPITAL INVESTMENT: AWPS is at the stage where the Depot Maintenance and Ammunition modules have been certified. However, to remain operational, these modules require system changes to keep them abreast of the changing business rules and the operating environment. Funding shortfalls will also jeopardize enhancements and upgrades including the Budget, Material, Net Operating Result (NOR), Performance Measurement, Control Next Generation, Base Operations, Manufacturing and other modules. The system, as currently developed, only partially corrects the noted material weakness. Support of the Logistics Modernization Program (LMP) will also be affected.
d. ECONOMIC ANALYSIS PERFORMED? No. Exempt , mandated by Congress.
114 Exhibit Fund-9b Activity Group Capital Investment Justification

DEPOT MAINTENANCE CAPITAL INVESTMENT JUSTIFICATION A. Budget SubmissionSOFTWARE FY 2004-2005
($ in Thousands) OSD/OMB Budget Submission
B. Component, Activity Group, Date C. Line No Item Description D. Activity IdentificationArmy, Depot Maintenance Feb 03 00-06 Logistics Modernization Program (LMP) CECOM
FY02 FY03Element of Cost Quantity Unit Cost Total Cost Quantity Unit Cost Total Cost Quantity Unit Cost Total Cost Quantity Unit Cost Total CostContractor Support 1 7,417.000 7,417.000 1 7,367.000 7,367.000 1 6,350.000 6,350.000 1 6,350.000 6,350.000
TOTAL 1 7,417.000 1 7,367.000 1 6,350.000 1 6,350.000Narrative Justification:
ECONOMIC INDICATORS:Total Cost of the Project $34,397 Net Present Value of Benefits: N/A Benefit to Investment Ratio: N/A Payback Period: N/A
FY 04 FY 05
a. CAPABILITY OF EXISTING EQUIPMENT AND SHORTCOMINGS: The current Army standard logistics systems are based on 25 year old computer technology and depend on large layered inventory levels to support a forward deployed force against the Cold War enemy. The current process is characterized by a lack of flexibility and suffers from long shipping times and limited visibility of the supply pipe-line. The Army must reengineer its logistics processes to provide the flexibility to support today’s CONUS-based power projection scenarios. Also, the Army must utilize modern information technology enablers that will provide real time visibility of logistics processes and support the Revolution in Military Logistics. b. ANTICIPATED BENEFITS: The Logistics Modernization Program is a ten-year project to correct the noted deficiencies. It will enable the Army to take advantage of commercial expertise, experience, and investments in process improvement and information technology. The Army Materiel Command (AMC) will be able to perform business process reengineering (BPR), adopt market-driven business practices, and provide significantly improved services. The new process will help us achieve synchronization with Global Combat Support System - Army. The Army will retain Intellectual Property Rights to all documentation with regard to BPR report system descriptions and implementation plans. The Depot Maintenance portion of the ten-year investment will total about $42 M, part of a $171 M program, which also includes the Supply Management, Army activity group. This project was formerly known as Wholesale Logistics Modernization Program (WLMP).c. IMPACT WITHOUT PROPOSED CAPITAL INVESTMENT: AMC will be forced to maintain inefficient and unduly expensive wholesale logistics processes due to the limitations of the current automated system, the Standard Depot System. The system contains processes that are outdated, expensive to maintain, and technically vulnerable. The COBOL 74 compiler supporting the system is no longer supported by the manufacturer. These deficiencies will preclude the Army from providing an agile logistics support capability as required by the Revolution in Military Logistics.d. ECONOMIC ANALYSIS PERFORMED? A comparative analysis was performed in lieu of an economic analysis as status quo was not an option. The comparative analysis was completed by the Cost Analysis Division, Directorate for Resource Management, CECOM, Ft. Monmouth, New Jersey.
115 Exhibit Fund-9b Activity Group Capital Investment Justification

ACTIVITY GROUP CAPITAL INVESTMENT JUSTIFICATION A. Budget SubmissionSOFTWARE FY 2004-2005
($ in Thousands) OSD/OMB Budget Submission
B. Component, Activity Group, Date C. Line No Item Description D. Activity IdentificationArmy, Depot Maintenance Feb 03 99-10 SDS Data Collection/Shop Floor/AIT Various Activities
FY02 FY03Element of Cost Quantity Unit Cost Total Cost Quantity Unit Cost Total Cost Quantity Unit Cost Total Cost Quantity Unit Cost Total CostLabor 1 6,280.000 6,280.000 1 6,280.000 6,280.000Travel 1 20.000 20.000 1 20.000 20.000
TOTAL 2 6,300.000 2 6,300.000Narrative Justification:
ECONOMIC INDICATORS:Total Cost of the Project $29,047 Net Present Value of Benefits: N/A N/A Payback Period: N/A
FY 04 FY 05
a. CAPABILITY OF EXISTING EQUIPMENT AND SHORTCOMINGS: There are currently about 8,940 disparate non-standard and bridge systems at the various Major Subordinate Commands (MSC) and Separate Reporting Activities (SRA) of AMC. The obsolete design characteristics of these systems impede technology insertions and limit user access. They also hamper efforts to introduce business process improvements and cause logistics costs to rise with each system change. This combination of archaic structure, lack of documentation, and outdated technology makes it extremely difficult to respond to rapidly changing business requirements which demand modern technology.
b. ANTICIPATED BENEFITS: This effort will provide a Windows-based common technology architecture for the various wholesale logistics processes, designed around a client-server model. The COE will allow the users of logistics systems to perform all business functions from a single workstation. By using a Graphical User Interface (GUI) users will be able to integrate data from the various separate logistics systems, thus reducing the time and effort of analyzing the currently fragmented data, which resides on numerous non-standard applications. It will give the users an interface with the modernized Logistics Modernization Program (LMP) system, when it is developed. This project was formerly called SDS Common Operating Environment (COE).
c. IMPACT WITHOUT PROPOSED CAPITAL INVESTMENT: The Army's wholesale Depot Maintenance System will remain inefficient and costly, even with significant upgrades, such as the WLMP. This effort will compliment WLMP by providing a common technology architecture to all wholesale logistics processes and by reducing support costs and infrastructure needs.
d. ECONOMIC ANALYSIS PERFORMED? No. Directed by DoD in Joint Vision 2010 (Joint Chiefs of Staff Implementation Policy, CJCSI 3010.01), the Defense Planning Guidance (DPG) for FY 1999-2003, and the Quadrennial Defense Review (QDR) of May 1997. Economic Analyses will be completed, where cost savings are quantifiable, for individual efforts within this initiative.
116 Exhibit Fund-9b Activity Group Capital Investment Justification

Department of ArmyDepot Maintenance
FY 2002FY 2004-2005 Budget Estimate
($ in Millions)
PROJECTS ON THE FY 2003 PRESIDENT'S BUDGET
Approved ApprovedProject Project Approved Current Asset/
FY Title Amount Reprogs Proj Cost Proj Cost Deficiency Explanation
EQUIPMENTEQUIPMENT-Replacement
FY 02 Various Capital Equipment(< 500K) 2.387 0.227 2.614 2.614 $53K reprogrammed to SMA SSF; $70K Reprogrammed from MC to Spin TrackFY 02 ASRS Mini-Load Vehicle Positioning System 0.605 (0.605) $210K reprogrammed to HVAC Modificiation Missile
Clean Room; $350K MC Building 1C; $45K to SMA SSF FY 02 Electron Beam Welder 2.631 (1.632) 0.999 0.999 $1.632M reprogrammed to SMA SSF
EQUIPMENT-Productivity
FY 02 Various Capital Equipment(< 500K) 0.434 0.434 0.434 FY 02 Engine Test Cell Capacity Upgrade 3.100 3.100 3.100
MINOR CONSTRUCTION
FY 02 Various Minor Construction <$750K 0.813 0.280 1.093 1.093
SOFTWARE
FY 02 Army Workload & Performance System (AWPS) 2.943 2.943 2.943 FY 02 Logistics Modernization Program (LMP) 7.417 7.417 7.417 FY 02 SDS Data Collection/Shop Floor/AIT 6.300 6.300 6.300
TOTAL 26.630 (1.730) 24.900 24.900
117 Exhibit Fund-9c Capital Budget Execution

Department of ArmyDepot Maintenance
FY 2003FY 2004-2005 Budget Estimate
($ in Millions)
PROJECTS ON THE FY 2003 PRESIDENT'S BUDGET
Approved ApprovedProject Project Approved Current Asset/
FY Title Amount Reprogs Proj Cost Proj Cost Deficiency Explanation
EQUIPMENTEQUIPMENT-Replacement
FY 03 Various Capital Equipment(< 500K) 2.736 2.736 2.736 FY 03 Fluidized Bed 6.795 6.795 6.795 FY 03 X1100-3B Transmission Test Stand 2.000 2.000 2.000 FY 03 Inertial Sensor Assembly Test Equip 1.256 1.256 1.256 FY 03 M1 / M60 Servo Valve Test Stand 0.790 0.790 0.790 FY 03 Painting Line 0.600 0.600 0.600 FY 03 HP3070 Circuit Board Test System Replacement 0.838 0.838 0.838 FY 03 Engine Disassembly and Cleaning Equipment 12.206 (12.206) No prior Submission/Approval of project/MCA Project #56514
EQUIPMENT-Productivity
FY 03 Various Capital Equipment(< 500K) 0.358 0.358 2.258 (1.900) No prior Submission/Approval of projectFY 03 HP3070 TPS Development Phase V 0.501 0.501 0.501 FY 03 Control Consoles and Wiring Speed Drive 2.034 2.034 2.034
EQUIPMENT-Environmental
FY 03 Dust Collection System 0.669 0.669 0.669
MINOR CONSTRUCTION
FY 03 Various Minor Construction <$750K 1.806 1.806 1.806
SOFTWARE
FY 03 Army Workload & Performance System (AWPS) 2.943 2.943 2.943 FY 03 Logistics Modernization Program (LMP) 7.367 7.367 7.367 FY 03 SDS Data Collection/Shop Floor/AIT 6.300 6.300 6.300
- TOTAL 36.993 36.993 51.099 (14.106)
118 Exhibit Fund-9c Capital Budget Execution

Department of ArmyDepot Maintenance
FY 2004FY 2004-2005 Budget Estimate
($ in Millions)
PROJECTS ON THE FY 2003 PRESIDENT'S BUDGET
Approved ApprovedProject Project Approved Current Asset/
FY Title Amount Reprogs Proj Cost Proj Cost Deficiency Explanation
EQUIPMENTEQUIPMENT-Replacement
FY 04 Various Capital Equipment(< 500K) 4.387 (4.387) No prior Submission/Approval of projectFY 04 CNC Precision Laser Cutting System 0.612 (0.612) No prior Submission/Approval of projectFY 04 HP3070 Circuit Board Test System 0.839 (0.839) No prior Submission/Approval of projectFY 04 ASRS Mini-Load System 0.605 (0.605) No prior Submission/Approval of projectFY 04 ASRS System Upgrade 4.400 (4.400) No prior Submission/Approval of projectFY 04 Bridge Crane 30- ton Bldg 170 1.311 (1.311) No prior Submission/Approval of projectFY 04 Upgrade of IFTE-CEE Test Stations 2.768 (2.768) No prior Submission/Approval of projectFY 04 Generator Load Bank 0.600 (0.600) No prior Submission/Approval of projectFY 04 XT-1410 Transmission Test Stand 0.600 (0.600) No prior Submission/Approval of projectFY 04 CNC Vertical Machining Center 1.025 (1.025) No prior Submission/Approval of projectFY 04 Boring Mill 0.984 (0.984) No prior Submission/Approval of project
EQUIPMENT-Productivity
FY 04 Various Capital Equipment(< 500K) 3.953 (3.953) No prior Submission/Approval of projectFY 04 Plastic Media Blast System 2.082 (2.082) No prior Submission/Approval of projectFY 04 Aircraft Corrosion Control Equipment 0.600 (0.600) No prior Submission/Approval of projectFY 04 Flight Critical Parts Inspection & Treatment Eqpt 0.490 (0.490) No prior Submission/Approval of project
EQUIPMENT-Environmental
FY 04 Various Capital Equipment(< 500K) 0.801 (0.801) No prior Submission/Approval of projectFY 04 Air Pollution Control Equipment 2.000 (2.000) No prior Submission/Approval of project
ADPEFY 04 CAD/CAM/DNC Network Upgrade 0.157 (0.157) No prior Submission/Approval of project
MINOR CONSTRUCTION
FY 04 Various Minor Construction <$750K 6.375 (6.375) No prior Submission/Approval of projectFY 04 Welding Facility 0.963 (0.963) No prior Submission/Approval of project
SOFTWARE
FY 04 Army Workload & Performance System (AWPS) 2.265 (2.265) No prior Submission/Approval of projectFY 04 Logistics Modernization Program (LMP) 6.350 (6.350) No prior Submission/Approval of project
TOTAL 44.167 (44.167)
119 Exhibit Fund-9c Capital Budget Execution

Department of ArmyDepot Maintenance
FY 2005FY 2004-2005 Budget Estimate
($ in Millions)
PROJECTS ON THE FY 2003 PRESIDENT'S BUDGET
Approved ApprovedProject Project Approved Current Asset/
FY Title Amount Reprogs Proj Cost Proj Cost Deficiency Explanation
EQUIPMENTEQUIPMENT-Replacement
FY 05 Various Capital Equipment(< 500K) 3.632 (3.632) No prior Submission/Approval of projectFY 05 Tumble Blast (Rotary) 0.689 (0.689) No prior Submission/Approval of projectFY 05 Overhaul 10 each Bridge Cranes 4.369 (4.369) No prior Submission/Approval of projectFY 05 Hydro-Mechanical Test Stand 0.697 (0.697) No prior Submission/Approval of projectFY 05 Sciaky Resistance Welder 0.794 (0.794) No prior Submission/Approval of projectFY 05 Cylindrical Grinder Replacement 2.628 (2.628) No prior Submission/Approval of projectFY 05 Abrasive Waterjet Cutting Machine 0.767 (0.767) No prior Submission/Approval of projectFY 05 Hydraulic Test Console 0.579 (0.579) No prior Submission/Approval of project
EQUIPMENT-Productivity
FY 05 Various Capital Equipment(< 500K) 1.748 (1.748) No prior Submission/Approval of projectFY 05 Aircraft Corrosion Control Equipment 10.000 (10.000) No prior Submission/Approval of projectFY 05 Flight Critical Parts Inspection & Treatment Eqpt 8.505 (8.505) No prior Submission/Approval of projectFY 05 Large Capacity Spin Blaster 2.724 (2.724) No prior Submission/Approval of project
MINOR CONSTRUCTION
FY 05 Various Minor Construction <$750K 2.484 (2.484) No prior Submission/Approval of project
SOFTWARE
FY 05 Army Workload & Performance System (AWPS) 1.397 (1.397) No prior Submission/Approval of projectFY 05 Logistics Modernization Program (LMP) 6.350 (6.350) No prior Submission/Approval of projectFY 05 SDS Data Collection/Shop Floor/AIT - No prior Submission/Approval of projectFY 05 ERP/Industrial Base Modernizaiton (IBM) 17.706 (17.706) No prior Submission/Approval of projectFY 05 Future Logistics Enterprise (FLE)/Transformation 3.399 (3.399) No prior Submission/Approval of project
TOTAL 68.467 (68.467)
120 Exhibit Fund-9c Capital Budget Execution

FY02 FY03 FY04 FY05Line No. Description Quantity Total Cost Quantity Total Cost Quantity Total Cost Quantity Total Cost
EQUIPMENT-Replacement03-1 Various Capital Equipment <$500k 8 2.137 29 7.403 24 5.817 24 5.56302-1 Laser Punch 1 0.942 03-2 4 Axis CNC Horizontal Mill 1 0.809 04-1 Bar and Chucking Lathe, CNC 4 1/2" 1 0.50204-2 120" CNC Bed Type Lathe 1 0.59904-4 CNC Milling Machine 1 0.81805-1 Replace Alarm System, Phase II 1 2.38305-2 Chillers, 150 Ton f/Building 126 3 0.64605-3 Machining Center 1 0.83405-4 Vertical Heat Treat System 1 2.68305-5 Upgrade 81mm Mortar RP Line 1 0.58005-6 White Phosphorus (WP) Facility Upgrade 2 24.339 2 7.474
SUBTOTAL 9 3.079 30 8.212 29 32.075 33 20.163
EQUIPMENT- Productivity04-5 Automated M295 Line 1 2.98505-7 Electric Generator (Diesel/Natural Gas) 1 1.36705-8 Automated SDS Fill System, B 63-220 1 0.88405-9 Sorbent Powder Prod Line, B. 63-220 1 4.430
SUBTOTAL 1 2.985 3.000 6.681
EQUIPMENT- Environmental03-3 Resource Recovery & Recycling Equipment 1 1.000
SUBTOTAL 1 1.000
EQUIPMENT TOTAL 9 3.079 31 9.212 30 35.060 36 26.844
AUTOMATED DATA PROCESSING97-A9 Miscellaneous ADPE < $500K 5 1.945 6 2.121 10 3.63404-6 Network Enterprise Management Sys 1 0.516
ADP TOTAL 5 1.945 7 2.637 10 3.634
MINOR CONSTRUCTION98-A6 Minor Construction < $750K 3 1.011 4 1.784 21 8.478 18 7.57405-10 Environmental Remediation f/ ABG 1 0.930
MINOR CONSTRUCTION TOTAL 3 1.011 4 1.784 21 8.478 19 8.504
SOFTWAREM98-03 Army Workload & Performance System (AWPS) 4.674 4.674 3.695 1 2.60304-7 ERP/Industrial Base Modernization (IBM) 4.328 04-8 ERP/Industrial Base Modernization (IBM) 4.310 04-9 Future Logistics Enterprise (FLE)/Transformation 2 0.486
SOFTWARE TOTAL 4.674 4.674 12.333 3 3.089
Activity TOTAL 17 10.709 35 15.670 58 58.508 68 42.071
Total Capital Outlays 26.071 14.488 24.294 41.122Total Depreciation Expense 17.364 18.634 19.534 19.746
Activity Group Capital Investment SummaryOrdnance
($ in Millions)
121 Exhibit Fund-9a Activity Group Capital Investment Summary

ORDNANCE CAPITAL INVESTMENT JUSTIFICATION A. Budget SubmissionEQUIPMENT- Replacement FY 2004-2005
($ in Thousands) OSD/OMB Submission
B. Component, Activity Group, Date C. Line No Item Description D. Activity IdentificationArmy, Ordnance Feb 03 03-1 Various Capital Equipment <$500k Various Installations
FY02 FY03Element of Cost Quantity Unit Cost Total Cost Quantity Unit Cost Total Cost Quantity Unit Cost Total Cost Quantity Unit Cost Total CostReplacement 4 275.000 1,100.000 17 267.647 4,549.999 14 249.429 3,492.006 21 216.143 4,539.003Productivity 2 269.500 539.000 10 207.100 2,071.000 10 232.500 2,325.000 2 417.500 835.000Environmental 2 249.000 498.000 1 323.000 323.000New Mission 1 459.000 459.000 1 189.000 189.000
TOTAL 8 2,137.000 29 7,402.999 24 5,817.006 24 5,563.003Narrative Justification:
ECONOMIC INDICATORS:Total Cost of the Project $20,920 Net Present Value of Benefits: N/A Benefit to Investment Ratio: N/A Payback Period: N/A
FY04 FY05
a. CAPABILITY OF EXISTING EQUIPMENT AND SHORTCOMINGS: This category of projects replaces various equipment items which have outlived their useful lives, become uneconomical to repair, or become unsafe to operate. Examples include Grinding Machine CNC, Replace/Control Drives on SIP Grinder, Replace Turrets on 2 RD&D Lathes and the 155MM Gun Tube Inspection Station.
b. ANTICIPATED BENEFITS: Acquisition of this equipment will improve efficiency, reduce maintenance costs, increase capacity, replace unsafe or unusable assets, and allow compliance with regulatory agency (state, local or Federal) mandates.
c. IMPACT WITHOUT PROPOSED CAPITAL INVESTMENT: If funding is not approved, equipment support capability would not be provided for mission needs and this can cause reduction in mission capacity, failure to meet expected deliveries, increased man-hour expenditure and downtime, inability to obtain repair parts, tolerance inaccuracies leading to rework, and violation of Occupational Safety and Health Administration (OSHA), Environmental Protection Agency (EPA), National Discharge Elimination System (NPDES) compliance and state laws. Replacement of obsolete, worn or unrepairable equipment is essential if the Army is to continue to provide in-house support capabilities in a timely and cost effective manner, and provide safe and environmentally compliant work places. Failure to perform proper surveillance of chemical and materials could result in insufficient stocks of filter for protective masks. Failure to replace the other production equipment will result in continued downtime and increased maintenance costs.
d. ECONOMIC ANALYSIS PERFORMED? Yes. Separate economic analyses were done for the individual projects.
122 Exhibit Fund-9b Activity Group Capital Investment Justification

ORDNANCE CAPITAL INVESTMENT JUSTIFICATION A. Budget SubmissionEQUIPMENT- Replacement FY 2004-2005
($ in Thousands) OSD/OMB Submission
B. Component, Activity Group, Date C. Line No Item Description D. Activity IdentificationArmy, Ordnance Feb 03 02-1 Laser Punch RIA
FY02 FY03Element of Cost Quantity Unit Cost Total Cost Quantity Unit Cost Total Cost Quantity Unit Cost Total Cost Quantity Unit Cost Total CostEquipment 1 942.000 942.000
TOTAL 1 942.000Narrative Justification:
ECONOMIC INDICATORS:Total Cost of the Project $942 Net Present Value of Benefits: $843 Benefit to Investment Ratio: 1.947 Payback Period: N/A
FY04 FY05
a. CAPABILITY OF EXISTING EQUIPMENT AND SHORTCOMINGS: The present laser punch machine has been utilized intensely over the past 12 years to produce irregularly shaped, complex parts of exotic materials to precise tolerances. The laser punch is the best method for cutting exotic materials, such as titanium, alloy, and high carbon steel, because it can easily be adjusted to their physical properties, unlike conventional cutting tools. The current machine has become uneconomical to operate. Frequent and extended down time creates production delays of critical spare parts that support combat-essential weapon systems. Rebuilding the machine would not be feasible, because the technology is obsolete.
b. ANTICIPATED BENEFITS: The new laser punch machine will provide advanced, state-of-the-art laser technology. Down time will be eliminated and maintenance costs will be greatly reduced. The manufacture of critical parts supporting Contact Maintenance Truck Heavy (CMTH), Forward Repair System and the BMP-3 (Soviet Bronevaya Maschina Piekhota) Surrogate Ground Target Tank, will be more cost-effective and machine operation will be safer. The state of readiness for combat-essential weapon systems will be improved, because the arsenal will be able to promptly manufacture critical spare parts.
c. IMPACT WITHOUT PROPOSED CAPITAL INVESTMENT: The excessive down time of the current machine will continue causing abnormally high maintenance costs. Delivery delays of critical spare parts to the field will continue, thus jeopardizing weapon system readiness. Unit readiness for deployment could be jeopardized by training and equipment deficiencies that are caused by the lack of critical repair parts.
d. ECONOMIC ANALYSIS PERFORMED? Yes.
123 Exhibit Fund-9b Activity Group Capital Investment Justification

ORDNANCE CAPITAL INVESTMENT JUSTIFICATION A. Budget SubmissionEQUIPMENT- Replacement FY 2004-2005
($ in Thousands) OSD/OMB Submission
B. Component, Activity Group, Date C. Line No Item Description D. Activity IdentificationArmy, Ordnance Feb 03 03-2 4 Axis CNC Horizontal Mill RIA
FY02 FY03Element of Cost Quantity Unit Cost Total Cost Quantity Unit Cost Total Cost Quantity Unit Cost Total Cost Quantity Unit Cost Total CostEquipment 1 808.775 808.775
TOTAL 1 808.775Narrative Justification:
ECONOMIC INDICATORS:Total Cost of the Project $809 Net Present Value of Benefits: $105 Benefit to Investment Ratio: 1.14 Payback Period: N/A
FY04 FY05
a. CAPABILITY OF EXISTING EQUIPMENT AND SHORTCOMINGS: RIA currently uses three 4-Axis Computer Numerical Controlled (CNC) Horizontal Milling machines to manufacture small, lightweight, high precision parts for howitzers. The three machines are all 15 years old, which is more than twice the normal 7-year working life for comparable machines in private industry. In order to meet workload requirements, RIA has to operate for two or three shifts, the machines' unreliability, constant down time and high maintenance costs are becoming matters of increasing concern. The machines can not be economically rebuilt and must be replaced. This present situation will adversely impact cost and scheduled deliveries of current and future critical spare parts that are required to support field readiness of Howitzer Systems.
b. ANTICIPATED BENEFITS: The new 4-Axis CNC Horizontal Mill would replace the three old, worn-out machines that are currently in operation. The arsenal's horizontal milling capability would then be 60% faster, safer, more reliable, and more technologically advanced.
c. IMPACT WITHOUT PROPOSED CAPITAL INVESTMENT: RIA would be forced to cannibalize the three old machines in a round-robin fashion to maintain a partial horizontal machining capability in operation. The arsenal might not be able to produce sufficient parts to meet the manufacturing cost and schedule goals for such critical weapons systems as the M119 and M198 Howitzers and the M182 Gun Mount for the M109 Paladin Self Propelled Howitzer. The readiness of the Army and Marine Corps Divisions to deploy might be degraded, because of the unavailability of these primary indirect fire support systems.
d. ECONOMIC ANALYSIS PERFORMED? Yes.
124 Exhibit Fund-9b Activity Group Capital Investment Justification
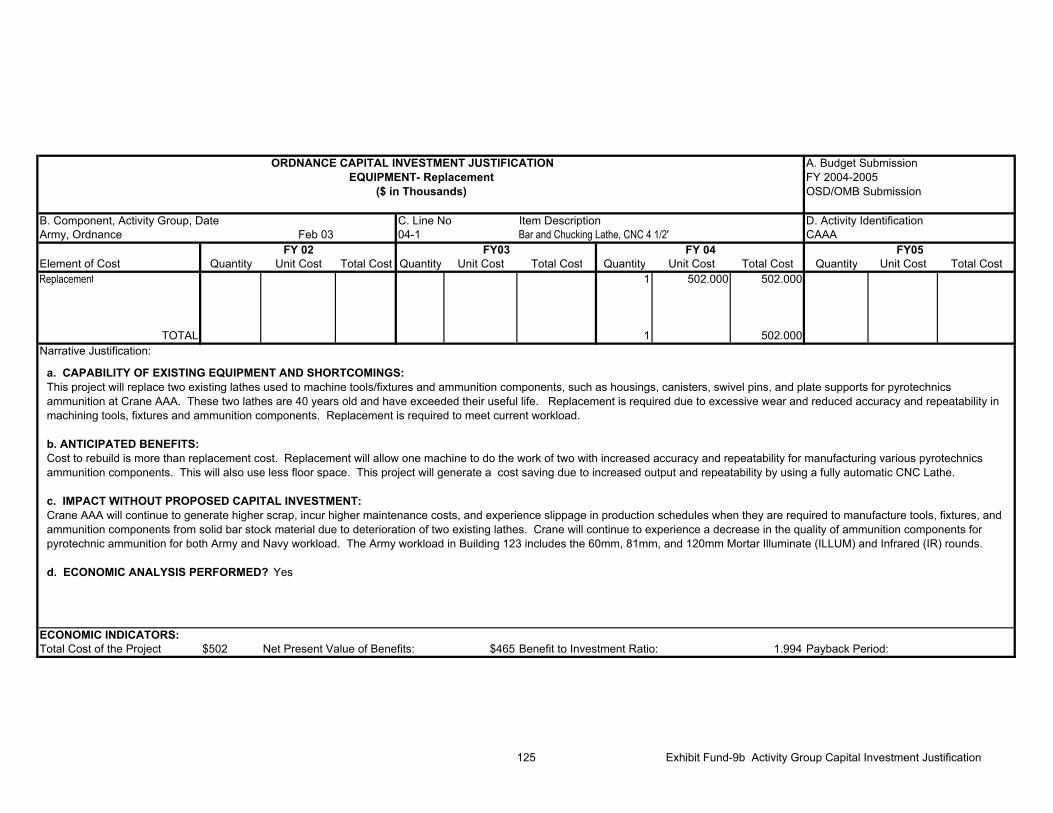
ORDNANCE CAPITAL INVESTMENT JUSTIFICATION A. Budget SubmissionEQUIPMENT- Replacement FY 2004-2005
($ in Thousands) OSD/OMB Submission
B. Component, Activity Group, Date C. Line No Item Description D. Activity IdentificationArmy, Ordnance Feb 03 04-1 Bar and Chucking Lathe, CNC 4 1/2" CAAA
FY 02 FY03Element of Cost Quantity Unit Cost Total Cost Quantity Unit Cost Total Cost Quantity Unit Cost Total Cost Quantity Unit Cost Total CostReplacement 1 502.000 502.000
TOTAL 1 502.000Narrative Justification:
ECONOMIC INDICATORS:Total Cost of the Project $502 Net Present Value of Benefits: $465 Benefit to Investment Ratio: 1.994 Payback Period:
FY 04 FY05
a. CAPABILITY OF EXISTING EQUIPMENT AND SHORTCOMINGS: This project will replace two existing lathes used to machine tools/fixtures and ammunition components, such as housings, canisters, swivel pins, and plate supports for pyrotechnics ammunition at Crane AAA. These two lathes are 40 years old and have exceeded their useful life. Replacement is required due to excessive wear and reduced accuracy and repeatability in machining tools, fixtures and ammunition components. Replacement is required to meet current workload.
b. ANTICIPATED BENEFITS: Cost to rebuild is more than replacement cost. Replacement will allow one machine to do the work of two with increased accuracy and repeatability for manufacturing various pyrotechnics ammunition components. This will also use less floor space. This project will generate a cost saving due to increased output and repeatability by using a fully automatic CNC Lathe.
c. IMPACT WITHOUT PROPOSED CAPITAL INVESTMENT:Crane AAA will continue to generate higher scrap, incur higher maintenance costs, and experience slippage in production schedules when they are required to manufacture tools, fixtures, and ammunition components from solid bar stock material due to deterioration of two existing lathes. Crane will continue to experience a decrease in the quality of ammunition components for pyrotechnic ammunition for both Army and Navy workload. The Army workload in Building 123 includes the 60mm, 81mm, and 120mm Mortar Illuminate (ILLUM) and Infrared (IR) rounds.
d. ECONOMIC ANALYSIS PERFORMED? Yes
125 Exhibit Fund-9b Activity Group Capital Investment Justification

ORDNANCE CAPITAL INVESTMENT JUSTIFICATION A. Budget SubmissionEQUIPMENT- Replacement FY 2004-2005
($ in Thousands) OSD/OMB Submission
B. Component, Activity Group, Date C. Line No Item Description D. Activity IdentificationArmy, Ordnance Feb 03 04-2 120" CNC Bed Type Lathe RIA
FY 02 FY03Element of Cost Quantity Unit Cost Total Cost Quantity Unit Cost Total Cost Quantity Unit Cost Total Cost Quantity Unit Cost Total Cost
1 599.000 599.000
TOTAL 1 599.000Narrative Justification:
ECONOMIC INDICATORS:Total Cost of the Project $599 Net Present Value of Benefits: ($54) Benefit to Investment Ratio: 0.903 Payback Period: N/A
FY 04 FY05
a. CAPABILITY OF EXISTING EQUIPMENT AND SHORTCOMINGS: The present machine is 22 years old. The normal working life for this type of Computer Numerically Controlled (CNC) machine in private industry is 7 to 10 years and then the machine is usually replaced. The parts are no longer supported by the manufacturer making them difficult to replace during repair. This machine turns large diameter and long length parts such as the cradle and piston for the M1A2. It is also used for rotational parts by the M198 and M119 weapons systems. Maintenance technicians are constantly required to assist in keeping the machine running and often have to develop work arounds in the control cabinet to keep the machine running.
b. ANTICIPATED BENEFITS: This machine is critical for producing large diameter, long length parts requiring tight tolerances as close as plus or minus one thousandths of an inch. The new machine will enhance safety, increase efficiencies, and parts will be readily available. c. IMPACT WITHOUT PROPOSED CAPITAL INVESTMENT: Failure to fund this project will limit RIA's ability to meet cost and scheduling of future manufacturing workload of cradle and pistons for the M1A2 Tank and recoil mechanism cylinder assemblies for the M198 howitzer. Maintenance costs will escalate as the machine continues to deteriorate. Repair parts will become more and more scarce and expensive.
d. ECONOMIC ANALYSIS PERFORMED? Yes
126 Exhibit Fund-9b Activity Group Capital Investment Justification

ORDNANCE CAPITAL INVESTMENT JUSTIFICATION A. Budget SubmissionEQUIPMENT- Replacement FY 2004-2005
($ in Thousands) OSD/OMB Submission
B. Component, Activity Group, Date C. Line No Item Description D. Activity IdentificationArmy, Ordnance Feb 03 04-4 CNC Milling Machine RIA
FY 02 FY03Element of Cost Quantity Unit Cost Total Cost Quantity Unit Cost Total Cost Quantity Unit Cost Total Cost Quantity Unit Cost Total CostEquipment 1 818.000 818.000
TOTAL 1 818.000Narrative Justification:
ECONOMIC INDICATORS:Total Cost of the Project $818 Net Present Value of Benefits: $94 Benefit to Investment Ratio: 1.123 Payback Period: N/A
FY 04 FY05
a. CAPABILITY OF EXISTING EQUIPMENT AND SHORTCOMINGS: The current machine is 17 years old and cannot be economically rebuilt and must be replaced. It can no longer maintain the level of precision that is required by manufacturing drawings; therefore, the machine can only be used on a limited bases for roughing operations. For the last 14 years, in order to meet workload requirements, the machine has been used extensively in multiple shifts. Machine reliability and extension maintenance are now an economic issue. The present machine is required to manufacture critical parts for the 19/M198 Howitzers and the M182 Gun Mount for the M109 A6 Paladin.
b. ANTICIPATED BENEFITS: This machine is required for the manufacture of lightweight small dimensional parts. The acquisition of this new machine would mean faster machining time, less scrap, more safety features to meet Occupational Safety and Health Administration (OSHA) requirements, and newer state of the art technology that allows shop floor machine control programming, and additional tool change stations.
c. IMPACT WITHOUT PROPOSED CAPITAL INVESTMENT: Failure to fund this project will impact cost and scheduling of current and future armament products at the Arsenal. The manufacture of critical spare parts supporting fielded M119/M198 Howitzers and M182 Gun Mounts will be delayed due to machine downtime. In addition, the new machine will meet the required OSHA standards to protect the operator from exposure to moving parts and debris.
d. ECONOMIC ANALYSIS PERFORMED? Yes
127 Exhibit Fund-9b Activity Group Capital Investment Justification

ORDNANCE CAPITAL INVESTMENT JUSTIFICATION A. Budget SubmissionEQUIPMENT- Replacement FY 2004-2005
($ in Thousands) OSD/OMB Submission
B. Component, Activity Group, Date C. Line No Item Description D. Activity IdentificationArmy, Ordnance Feb 03 05-1 Replace Alarm System, Phase II CAAA
FY 02 FY03 FY 04 FY 05Element of Cost Quantity Unit Cost Total Cost Quantity Unit Cost Total Cost Quantity Unit Cost Total Cost Quantity Unit Cost Total CostEquipment 1 2,383.000 2,383.000
TOTAL 1 2,383.000 Narrative Justification:
ECONOMIC INDICATORS:Total Cost of the Project $2,383 Net Present Value of Benefits: N/A Benefit to Investment Ratio: N/A Payback Period: N/A
a. CAPABILITY OF EXISTING EQUIPMENT AND SHORTCOMINGS: Crane Army Ammunition Activity (CAAA) is a Tier I activity with an important war and peacetime mission. Alarms are required to provide adequate protection for security risk category I and II materiel. Currently, the security alarm system on 75 security risk category II ammunition and explosive storage structures in zone 10 are 30 years old and failing. These ammunition and explosive storage structures contain security risk category II items, such as explosives, Demolition Charges, High Explosive Grenades, and Smoke Grenades.
b. ANTICIPATED BENEFITS: This project is the last phase of a $4.2 million request to replace and install alarm equipment for 129 security risk Category I and II materiel at Crane AAA. The first phase was funded in the FY 01 Capital Investment Program (Replace Alarm System for $1,970,567) that replaced 53 alarm systems in zone 9 and replaced the alarm system in building 136.
c. IMPACT WITHOUT PROPOSED CAPITAL INVESTMENT: In the event the current systems fail completely, approximately 149 additional man-years would be required to provide continuous guards to man gates and roving patrols to protect zone 10. Zone 10 contains 75 category II ammunition and explosive storage structures that must be kept secure IAW AR 190-11.
d. ECONOMIC ANALYSIS PERFORMED? Yes
128 Exhibit Fund-9b Activity Group Capital Investment Justification

ORDNANCE CAPITAL INVESTMENT JUSTIFICATION A. Budget SubmissionEQUIPMENT- Replacement FY 2004-2005
($ in Thousands) OSD/OMB Submission
B. Component, Activity Group, Date C. Line No Item Description D. Activity IdentificationArmy, Ordnance Feb 03 05-6 White Phosphorus (WP) Facility Upgrade PBA FY02 FY03Element of Cost Quantity Unit Cost Total Cost Quantity Unit Cost Total Cost Quantity Unit Cost Total Cost Quantity Unit Cost Total CostWP Equip Ph I 1 22,843.500 22,843.500 WP Equip Ph 2 1 6,195.200 6,195.200WP Construction Ph 1 1 1,495.000 1,495.000WP Construction Ph 2 1 748.900 748.900WP Construction Ph 3 1 530.300 530.300WP Construction Ph 4
TOTAL 2 24,338.500 3 7,474.400Narrative Justification:
ECONOMIC INDICATORS:Total Cost of the Project $31,813 Net Present Value of Benefits: ($21,531) Benefit to Investment Ratio: 0.3 Payback Period:
FY04 FY05
a. CAPABILITY OF EXISTING EQUIPMENT AND SHORTCOMINGS: The existing WP Filling Plant was constructed/equipped in the WWII era. Some of the equipment is no longer serviceable. The serviceable equipment is between 20 and 40 years old. Process piping and equipment are prone to mechanical failure due to age and aggressive service conditions. The system as a whole has reached the end of its useful life. Extensive and costly maintenance is required prior to each run to achieve relatively safe and reliable operation. Recent Independent safety reviews document a systematic degradation of this facility. Both the age (condition) and design (based upon 50s and 60s technology) of the system constitute safety risk to the operators. Failure of a valve in the piping system resulted in a critical safety incident in January 2000, in which a worker was severely burned. A near miss was recorded in January 2002; in which a valve failure caused a spill of WP. The subsequent investigation listed the excessive complexity of the transfer system as one of the contributing factors to the increased severity of the incident. Measures have been taken to eliminate this critical hazard, but because of its overly complex design, operation of the system still has the potential of exposing workers to significant hazards during routine operation. Although current mitigation measures have strengthened the operational safety posture of the system, the mechanical integrity and process safety cannot be guaranteed. b. ANTICIPATED BENEFITS: This alternative is a total replacement of the existing WP storage, handling, filling equipment, leak test ovens, and pollution abatement equipment. The proposed new facility features an overall downsizing of the WP storage as well as improved fill line design. The existing tank farm is 300 feet from the point of use. An extensive piping system, over 3,100 linear feet must be heated to 110oF to melt the WP. This new system will downsize the tank farm, relocate it to a site adjacent to the fill building, and simplify delivery piping. Reducing the points where leakage can occur will reduce maintenance and significantly reduce steam usage. The improved design of the new filling system will reduce health and safety hazards for operators, and provide the needed flexibility to accommodate a wide variety of WP filled end items that support Army Transformation. The new facility will automate manual operations reducing potential for exposure to WP, and WP fumes, and eliminating the requirement to manually lift and transfer filled rounds.
129 Exhibit Fund-9b Activity Group Capital Investment Justification

ORDNANCE CAPITAL INVESTMENT JUSTIFICATION A. Budget SubmissionEQUIPMENT- Replacement FY 2004-2005
($ in Thousands) OSD/OMB Submission
B. Component, Activity Group, Date C. Line No Item Description D. Activity IdentificationArmy, Ordnance Pg 2 of 2 Feb 03 05-6a White Phosphorus (WP) Facility Upgrade PBA
FY 02 FY03Element of Cost Quantity Unit Cost Total Cost Quantity Unit Cost Total Cost Quantity Unit Cost Total Cost Quantity Unit Cost Total CostWP Equip Ph IWP Equip Ph 2WP Construction Ph 1WP Construction Ph 2WP Construction Ph 3WP Construction Ph 4
TOTALNarrative Justification:
ECONOMIC INDICATORS:Total Cost of the Project Net Present Value of Benefits: Benefit to Investment Ratio: Payback Period:
FY 04 FY05
c. IMPACT WITHOUT PROPOSED CAPITAL INVESTMENT: This project is required due to the high probability that the existing facility will become inoperable within the next 1 to 3 years. Pine Bluff is the only supplier of WP filled munitions to the United States Armed Forces. The WP mining and purification industry has been contacted and have shown no interest in filling WP munitions, due to residual liabilities associated with environmental, security, and safety requirements, and the negative impact to corporate image. Existing manufacturers would require massive capital investment to set up a munitions filling plant. This re-facilitization effort will ensure that the Army continues to have a source of WP munitions, and the needed flexibility to accommodate a wide variety of end items to support Army Transformation.
d. ECONOMIC ANALYSIS PERFORMED: Yes.
130 Exhibit Fund-9b Activity Group Capital Investment Justification

ACTIVITY GROUP CAPITAL INVESTMENT JUSTIFICATION A. Budget SubmissionEQUIPMENT- Productivity FY 2004-2005
($ in Thousands) OSD/OMB Submission
B. Component, Activity Group, Date C. Line No Item Description D. Activity IdentificationArmy, Ordnance Feb 03 04-5 Automated M295 Line PBA
FY 02 FY03Element of Cost Quantity Unit Cost Total Cost Quantity Unit Cost Total Cost Quantity Unit Cost Total Cost Quantity Unit Cost Total CostAutomated M295 Line 1 2,985.000 2,985.000
TOTAL - - 1 2,985.000 Narrative Justification:
ECONOMIC INDICATORS:Total Cost of the Project $2,985 Net Present Value of Benefits: $3,141 Benefit to Investment Ratio: 2.123 Payback Period: N/A
FY 04 FY05
a. CAPABILITY OF EXISTING EQUIPMENT AND SHORTCOMINGS: The current production line for the M295 Individual Equipment Decontamination Kit (chemical agent removal) can achieve no more than 45 boxes on average per shift (10 hours). This rate can be maintained as long as proper machine adjustments are maintained. Several operations are performed manually. Fourteen personnel are required to operate the line.
b. ANTICIPATED BENEFITS: The new, automated line is designed to produce 80 boxes per day. Labor costs will be cut in half. (Less than ten personnel will be required to operate this new, automated line.) Repair and maintenance costs will be reduced by 50% and 33% respectively. This would result in a significant reduction in the cost per kit. Equally important, PBA will have the ability to double its production thereby rapidly responding to warfighters' needs. This project decreases the chance that our warfighters will be on the front-line without protection. There is no planned replacement for the M295 kit that is scheduled to be in production through 2010.
c. IMPACT WITHOUT PROPOSED CAPITAL INVESTMENT: Production will have less ability to respond to warfighter needs resulting from exposure to chemical agents. Costs for the kits will be remain the same. The backlog orders for these equipment decontamination kits has existed for years and will continue if not funded. These kits are used by all the services: Army, Air Force, Navy, and Marines.
d. ECONOMIC ANALYSIS PERFORMED? Yes.
131

ORDNANCE CAPITAL INVESTMENT JUSTIFICATION A. Budget SubmissionEQUIPMENT- Environmental FY 2004-2005
($ in Thousands) OSD/OMB Submission
B. Component, Activity Group, Date C. Line No Item Description D. Activity IdentificationArmy, Ordnance Feb 03 03-3 Resource Recovery & Recycling Equipment CAAA
FY02 FY03Element of Cost Quantity Unit Cost Total Cost Quantity Unit Cost Total Cost Quantity Unit Cost Total CostEquipment 1 1,000.000 1,000.000
TOTAL 1 1,000.000Narrative Justification:
ECONOMIC INDICATORS:Total Cost of the Project $1,000 Net Present Value of Benefits: N/A Benefit to Investment Ratio: N/A Payback Period: N/A
FY04
a. CAPABILITY OF EXISTING EQUIPMENT AND SHORTCOMINGS: Crane Army Ammunition Activity (CAAA) currently relies on open burn/open detonation (OB/OD) grounds to demilitarize numerous types and quantities of ammunition and components. These processes release pollutants into the air, such as carbon monoxide and sulfur dioxide. This method also releases hazardous metals and other substances into the ground, such as chromium, nickel, lead, antimony, benzene, and naphthalene. In addition, the noise of open detonation of explosives causes a disturbance for neighbors.
b. ANTICIPATED BENEFITS: This project will provide an economical and environmentally acceptable alternative for disposal of hazardous material in full compliance with federal and state regulations and standards. At present CAAA is operating on a negotiated waiver renewed annually by the environmental regulatory agencies. This project will eliminate the need for this waiver, which is predicated on the fact that the activity is searching for a solution. The new equipment will operate in a new building by controlled chemical reaction, rather than open burning or detonation, and the resulting by-product will be a useful fertilizer supplement.
c. IMPACT WITHOUT PROPOSED CAPITAL INVESTMENT: CAAA must comply with federal and state air quality standards. Without this project CAAA will continue the open burn/open detonation of explosives and continue to emit pollutants. The ability of CAAA to operate the OB/OD area is predicated on the fact that they are searching for a solution. Should the regulatory agencies refuse to continue the waiver, the OB/OD area would have to shut down and CAAA wouldn't be able to perform its mission of demilitarizing ammunitions and components.
d. ECONOMIC ANALYSIS PERFORMED? No. The project is exempt, because it is needed to comply with regulatory mandates regarding environmental protection and hazardous waste reduction. These mandates by federal, state, and local regulatory agencies preclude choice or trade-off among alternatives. FMR 7000.14r, Vol 2b, Chapter 9, Page 9-7, Paragraph 9.c.1.
132 Exhibit Fund-9b Activity Group Capital Investment Justification

ORDNANCE CAPITAL INVESTMENT JUSTIFICATION A. Budget SubmissionAUTOMATED DATA PROCESSING FY 2004-2005
($ in Thousands) OSD/OMB Submission
B. Component, Activity Group, Date C. Line No Item Description D. Activity IdentificationArmy, Ordnance Feb 03 97-A9 Miscellaneous ADPE < $500K Various Ordnance Installations
FY02 FY03Element of Cost Quantity Unit Cost Total Cost Quantity Unit Cost Total Cost Quantity Unit Cost Total Cost Quantity Unit Cost Total CostHardware 5 389.00 1,945.000 6 353.500 2,121.000 10 363.400 3,634.000
TOTAL 5 1,945.000 6 2,121.000 10 3,634.000Narrative Justification:
ECONOMIC INDICATORS:Total Cost of the Project $7,700 Net Present Value of Benefits: N/A Benefit to Investment Ratio: N/A Payback Period: N/A
FY04 FY05
a. CAPABILITY OF EXISTING EQUIPMENT AND SHORTCOMINGS: These miscellaneous information management projects replace old/obsolete and unrepairable equipment with state-of-the-art equipment. Examples include the RIA Network Infrastructure upgrade and Electronic Data Storage at Rock Island Arsenal and the Server replacement at Watervliet Arsenal.
b. ANTICIPATED BENEFITS: Replacement of obsolete equipment will improve processing speeds, increase productivity, and reduce maintenance costs at Rock Island and Watervliet Arsenals. Projects will allow sites to conform to Army standards and improve communications with other Army sites. New technology will improve security and lessen the threat of access by unauthorized sources.
c. IMPACT WITHOUT PROPOSED CAPITAL INVESTMENT: Systems and equipment will continue to be unreliable, downtime will increase and administrative costs will rise. Users will be unable to communicate with higher headquarters, other installations, and customers via electronic means. Data will be at risk for release to unauthorized users.
d. ECONOMIC ANALYSIS PERFORMED? Yes.
133 Exhibit Fund-9b Activity Group Capital Investment Justification

ACTIVITY GROUP CAPITAL INVESTMENT JUSTIFICATION A. Budget SubmissionAUTOMATED DATA PROCESSING FY 2004-2005
($ in Thousands) OSD/OMB Submission
B. Component, Activity Group, Date C. Line No Item Description D. Activity IdentificationArmy, Ordnance Feb 03 04-6 Network Enterprise Management Sys RIA
FY 02 FY03Element of Cost Quantity Unit Cost Total Cost Quantity Unit Cost Total Cost Quantity Unit Cost Total Cost Quantity Unit Cost Total Cost
1 516.000 516.000
TOTAL 1 516.000Narrative Justification:
ECONOMIC INDICATORS:Total Cost of the Project $516 Net Present Value of Benefits: $652 Benefit to Investment Ratio: 2.356 Payback Period: N/A
FY 04 FY05
a. CAPABILITY OF EXISTING EQUIPMENT AND SHORTCOMINGS: Currently, technicians do not have the capability to fix computer problems without leaving their work site. Network management at Rock Island Arsenal consists of putting out fires, and doing very little managing of the networks. The need for a centralized, fully integrated network management system is necessary to the operations of RIA. Under the current system, technicians must be dispatched to the user site in order to work on the users computer. This involves travel time to from the destination site.
b. ANTICIPATED BENEFITS: This tool allows computer network, application owners, system administrators and technicians to be proactive instead of reactionary in the event of pending computer related failures. The tool can be used as a warning device to allow technicians to take steps to reduce errors to keep systems up and running. Other functions of the tool are used to rapidly "push" computer Operating System and security related patches to multiple users in a short amount of time, thus saving time and money. An additional benefit will be realized from labor savings. Technicians will have the ability to diagnose problems, and fix these problems without leaving their work site.
c. IMPACT WITHOUT PROPOSED CAPITAL INVESTMENT: Without this project, RIA will not be able to assist in avoiding computer desktop failure and to respond rapidly in the event of required security concerns. Status quo would mean RIA would continue to operate with the lack of network management. This is both costly and dangerous. With more and more personnel leaving, the inability to fix computer problems in a timely manner will continue and add delays to personnel support.
d. ECONOMIC ANALYSIS PERFORMED? Yes
134 Exhibit Fund-9b Activity Group Capital Investment Justification

ORDNANCE CAPITAL INVESTMENT JUSTIFICATION A. Budget SubmissionMINOR CONSTRUCTION FY 2004-2005
($ in Thousands) OSD/OMB Submission
B. Component, Activity Group, Date C. Line No Item Description D. Activity IdentificationArmy, Ordnance Feb 03 98-A6 Minor Construction < $750K Various Ordnance Installations
FY02 FY03Element of Cost Quantity Unit Cost Total Cost Quantity Unit Cost Total Cost Quantity Unit Cost Total Cost Quantity Unit Cost Total CostMinor Construction 3 337.000 1,011.000 4 446.000 1,784.000 21 403.715 8,478.015 18 420.780 7,574.040
TOTAL 3 1,011.000 4 1,784.000 21 8,478.015 18 7,574.040Narrative Justification:
ECONOMIC INDICATORS:Total Cost of the Project $18,847 Net Present Value of Benefits: N/A Benefit to Investment Ratio: N/A Payback Period: N/A
FY04 FY05
a. CAPABILITY OF EXISTING EQUIPMENT AND SHORTCOMINGS: Various Ordnance installations have facilities that cause poor working conditions, reduce productivity, lack energy conservation features, compromise security, fail to comply with fire and safety codes, and expose employees' health to hazards.
b. ANTICIPATED BENEFITS: This program will upgrade some of the facilities, which have the shortcomings described in paragraph a. The "Construct Restroom/Lunch Facility" project at SIAD will provide a clean area a for a breakroom and a safe area to eat. The "Insall Fire Sprinkers" at SIAD will correct fire and safety codes. The "Upgrade Building 133" at CAAA and the "Administration Building" at MCAAP will bring the installation into compliance with all environmental, safety, and hygiene regulations and mandates.
c. IMPACT WITHOUT PROPOSED CAPITAL INVESTMENT: Without this program, some installations will not comply with security, safety, environmental, and health requirements. Without the funding for the refurbish living quarters Fire HQ, women who may join the fire force will not have separate living quarters.
d. ECONOMIC ANALYSIS PERFORMED? Yes. Separate economic analyses were done for the individual projects.
135 Exhibit Fund-9b Activity Group Capital Investment Justification

ORDNANCE CAPITAL INVESTMENT JUSTIFICATION A. Budget SubmissionSOFTWARE FY 2004-2005
($ in Thousands) OSD/OMB Submission
B. Component, Activity Group, Date C. Line No Item Description D. Activity IdentificationArmy, Ordnance Feb 03 M98-03 Army Workload & Performance System (AWPS) Various Installations
FY02 FY03Element of Cost Quantity Unit Cost Total Cost Quantity Unit Cost Total Cost Quantity Unit Cost Total Cost Quantity Unit Cost Total CostAWPS 1 4,674.000 4,674.000 1 4,674.00 4,674.000 1 3,695.000 3,695.000 1 2,603.000 2,603.000
TOTAL 1 4,674.000 1 4,674.000 1 3,695.000 1 2,603.000Narrative Justification:
ECONOMIC INDICATORS:Total Cost of the Project $23,640 Net Present Value of Benefits: N/A Benefit to Investment Ratio: N/A Payback Period: N/A
FY04 FY05
a. CAPABILITY OF EXISTING EQUIPMENT AND SHORTCOMINGS: The General Accounting Office concluded in February 1997 that the Army cannot identify and prioritize its institutional workload. The material weakness stated that "...managers at all levels do not have the information needed to improve work performance, improve organizational efficiency, and determine support staffing needs, manpower budgets, and personnel reductions." The Army's plan to correct this material weakness includes the fielding of AWPS.
b. ANTICIPATED BENEFITS: The AWPS will assist the Army Materiel Command (AMC) and MSC's in managing complex workload and employment strategies. AWPS is a personal computerbase network software solution designed to integrate existing production and financial data into a single graphic program. Production and resource managers can isolate key scheduling and costproblems at the product level and project workforce needed to accomplish various levels of workload.
c. IMPACT WITHOUT PROPOSED CAPITAL INVESTMENT: AWPS is at the stage where depot maintenance and ammunition modules have been certified. Without additional expenditures, the refinements needed to win certification of Manufacturing/Arsenal modules will not be implemented. Funding shortfalls will also jeopardize enhancements and upgrades to the basic system, including the Performance Measurement and Control Next Generation, Base Operations, Net Operating Result (NOR) and Manufacturing modules. The system, as is, only partially corrects noted material weakness and future fielding is needed to include the Manufacturing mission function at the AMC Arsenals.
d. ECONOMIC ANALYSIS PERFORMED? No. Exempt. Congressional Mandate.
136 Exhibit Fund-9b Activity Group Capital Investment Justification

ACTIVITY GROUP CAPITAL INVESTMENT JUSTIFICATION A. Budget SubmissionSOFTWARE FY 2004-2005
($ in Thousands) OSD/OMB Submission
B. Component, Activity Group, Date C. Line No Item Description D. Activity IdentificationArmy, Ordnance Feb 03 04-7 ERP/Industrial Base Modernization (IBM) WVA
FY 02 FY03Element of Cost Quantity Unit Cost Total Cost Quantity Unit Cost Total Cost Quantity Unit Cost Total Cost Quantity Unit Cost Total CostIBM 1 4,328.000 4,328.000
TOTAL 1 4,328.000Narrative Justification:
ECONOMIC INDICATORS:Total Cost of the Project $4,328 Net Present Value of Benefits: $3,622 Benefit to Investment Ratio: 1.897 Payback Period: N/A
FY 04 FY05
a. CAPABILITY OF EXISTING EQUIPMENT AND SHORTCOMINGS: The Army is in the process of replacing its antiquated Standard Depot System (SDS) with an Enterprise Resource Planning (ERP) system. This effort is part of the Army's Logistics Modernization Program (LMP). The need exists to modernize the logistic chain processes within the depots and arsenals to increase operational efficiencies and to decrease overall costs. Existing local unique legacy systems are nearing the end of their productive life cycle and would be expensive to bridge to the Logistics Modernization Program (LMP) software. These local unique systems perform functions such as facility management, tool management shop floor control, data collection, Computer Integrated Manufacturing System (CIMS), etc. The thrust of this project is to develop an industrial base modernized system that fully integrates the requirements performed by the numerous legacy systems within the standard ERP solution.
b. ANTICIPATED BENEFITS: A fully integrated ERP will increase arsenal operational efficiency and reduce costs. Maintaining one fully integrated ERP system rather than an ERP system with numerous unique legacy system interfaces will reduce automation sustainment costs, software fees and system infrastructure requirements at each arsenal and will also ensure a common ERP environment exists throughout the AMC depot/arsenal base. This project will assess WVA's business processes to determine what additional ERP functionality is required, beyond that which is to be provided by the base LMP contract, to ensure optimal integration of automated business management systems. Following identification of the additional functionality, this project will provide a means for necessary reengineering of business processes, configuration of the ERP software, and other elements as part of an implementation project.
c. IMPACT WITHOUT PROPOSED CAPITAL INVESTMENT: The status quo will result in an onerous financial burden on the arsenals to maintain the numerous unique legacy systems. Additionally, the efficiency of the arsenal will be severely degraded without implementation of this project.
d. ECONOMIC ANALYSIS PERFORMED? Yes
137 Exhibit Fund-9b Activity Group Capital Investment Justification

ORDNANCE CAPITAL INVESTMENT JUSTIFICATION A. Budget SubmissionSOFTWARE FY 2004-2005
($ in Thousands) OSD/OMB Submission
B. Component, Activity Group, Date C. Line No Item Description D. Activity IdentificationArmy, Ordnance Feb 03 04-8 ERP/Industrial Base Modernization (IBM) PBA
FY02 FY03Element of Cost Quantity Unit Cost Total Cost Quantity Unit Cost Total Cost Quantity Unit Cost Total Cost Quantity Unit Cost Total CostIBM 1 4,310.000 4,310.000
TOTAL 1 4,310.000Narrative Justification:
ECONOMIC INDICATORS:Total Cost of the Project $4,310 Net Present Value of Benefits: $1.272 Benefit to Investment Ratio: 5.240 Payback Period: N/A
FY04 FY05
a. CAPABILITY OF EXISTING EQUIPMENT AND SHORTCOMINGS: The existing Manufacturing Resource Planning (MRP) legacy systems are nearing the end of their productive life cycle and be expensive to bridge with the Systems Application Products (SAP) System. The SAP is the Enterprise Resource Planning (ERP) package chosen by the Logistics Modernization Program (LMP)and approved by AMC to be deployed across the AMC industrial base. The thrust of this project is the development of an Industrial Base Modernization (IBM) system with full integration of the requirements performed by numerous legacy systems within the standard ERP solution. The utilization of the existing MRP System and other non-integrated systems will increase costs and decrease operational efficiency.
b. ANTICIPATED BENEFITS: This project will assess PBA's business processes to determine what additional Enterprise Resource Planning (ERP) functionality is required, beyond that which is tobe provided by the base LMP Contract, to ensure optimal integration of automated business management systems. Following identification of the additional functionality, this project will provide a means for reengineering of business processes as necessary, configuration of the ERP software, and other elements as part of an implementation project. By replacing existing legacy systems, the ultimate goal of reducing operational costs will be achieved.
c. IMPACT WITHOUT PROPOSED CAPITAL INVESTMENT: It funding is not received, with the implementation of LMP, for PBA to maintain their existing Manufacturing Resource Planning (MRP) legacy systems and build expensive networking bridges to interface with the Systems Application Products (SAP) system. Without this project, PBA will retain the current MRP system and other non-integrated systems with increased costs and degradation of service. This would result in downtime, loss of functionality, indirect labor expenses and increased overhead to support these systems. The bridging of information would be technically and financially inefficient.
d. ECONOMIC ANALYSIS PERFORMED? Yes
138 Exhibit Fund-9b Activity Group Capital Investment Justification

ACTIVITY GROUP CAPITAL INVESTMENT JUSTIFICATION A. Budget SubmissionSOFTWARE FY 2004-2005
($ in Thousands) OSD/OMB Submission
B. Component, Activity Group, Date C. Line No Item Description D. Activity IdentificationArmy, Ordnance Feb 03 04-9 Future Logistics Enterprise (FLE)/Transformation HQAMC
FY 02 FY 03 FY 04 FY 05Element of Cost Quantity Unit Cost Total Cost Quantity Unit Cost Total Cost Quantity Unit Cost Total Cost Quantity Unit Cost Total CostContractor Support 1 40.000 40.000 1 377.000 377.000 1 476.000 476.000TDY 1 3.000 3.000 1 8.000 8.000 1 10.000 10.000
TOTAL 2 43.000 2 385.000 2 486.000Narrative Justification:
ECONOMIC INDICATORS:Total Cost of the Project $914 Net Present Value of Benefits: N/A Benefit to Investment Ratio: N/A Payback Period: N/A
a. CAPABILITY OF EXISTING EQUIPMENT AND SHORTCOMINGS: The Future Logistics Enterprise (FLE)/Transformation effort involves the design and implementation of a logistics framework that inherently meets the operational requirements of the National Military Strategy and the early 21st Century warfighter. It's tenets include end-to-end distribution, total life cycle systems management, and an integrated knowledge environment. The FLE/Transformation will ensure that strategic logistics requirements and capabilities are directly tied to the warfighting CINC and tactical requirements.
b. ANTICIPATED BENEFITS: Implementation of a Future Logistics Enterprise/Transformation will provide for an environment which support exchange of data that is intelligent and provides for a means to have interactivity between multiple ERPs in a collaborative fashion. Data will be able to be received and transmitted with minimal use of a middleware or other conversion media. Synergy will be realized by linking the multiple developmental efforts of services and defense agencies together. Information exchange in support of secondary items will also be improved with linkage to industry partners in the FLE. Achievement of focused logistics needed to support Army transformation and management of secondary items as part of recapitalization will be achieved. Inefficiencies and process disconnects in areas such as reimbursable and interservice work will also be eliminated. These estimates are preliminary and will require adjustment after an interoperability study is performed in FY03. Any hardware, software, and communications costs that may be required by the FLE are not included in these costs. Navy efforts pose additional complexity due to the aggregate of ERPs they are currently using. Funding beyond FY05 will be needed for test, evaluation, and implementation. As Air Force, Marine Corps, and industry plans materialize in the FLE, the Army program will require adjustment to provide additional integration. (5% ORD, 35% DM, and 60% SMA)
c. IMPACT WITHOUT PROPOSED CAPITAL INVESTMENT: AMC and Army will not realize the synergy of achieving more efficient processes of having a collaborative environment through a co-evolution process achievement of information superiority and support to such effort as condition based maintenance will not be achieved. Reduced numbers of logistical and financial transactions will also not be realized.
d. ECONOMIC ANALYSIS PERFORMED? DoD Directed Initiative. Initial cost comparison was provided.
139 Exhibit Fund-9b Activity Group Capital Investment Justification

PROJECTS ON THE FY 2003 PRESIDENT'S BUDGET
Approved ApprovedProject Project Approved Current Asset/
FY Title Amount Reprogs Proj Cost Proj Cost Deficiency Explanation
EQUIPMENTEQUIPMENT-Replacement
FY 02 Various Capital Equipment <$500k 2.137 2.137 2.137 2.137FY 02 Laser Punch 0.942 0.942 0.942 0.942
AUTOMATED DATA PROCESSING
FY 02 Miscellaneous ADPE < $500K 1.945 1.945 1.945 1.945
MINOR CONSTRUCTION
FY 02 Minor Construction < $750K 1.011 1.011 1.011 1.011
SOFTWARE
FY 02 Army Workload & Performance System (AWPS) 4.674 4.674 4.674 4.674
TOTAL 10.709 10.709 10.709 10.709
($ in Millions)
Department of ArmyORDNANCE
FY 2002FY 2004-2005 Budget Estimate
140 Exhibit Fund-9c Capital Budget Execution

PROJECTS ON THE FY 2003 PRESIDENT'S BUDGET
Approved ApprovedFY Project Project Approved Current Asset/
Title Amount Reprogs Proj Cost Proj Cost Deficiency ExplanationEQUIPMENT
EQUIPMENT-Replacement
FY 03 Various Capital Equipment <$500k 5.703 5.703 7.403 (1.700) No Prior Submission/Approval of ProjectFY 03 4 Axis CNC Horizontal Mill 0.809 0.809 0.809
EQUIPMENT-Environmental
FY 03 Resource Recovery & Recycling Equipment 1.000 1.000 1.000
MINOR CONSTRUCTION
FY 03 Minor Construction < $750K 1.784 1.784 1.784
SOFTWARE
FY 03 Army Workload & Performance System (AWPS) 4.674 4.674 4.674
TOTAL 13.970 13.970 15.670 (1.700)
FY 2004-2005 Budget Estimate
($ in Millions)
Department of ArmyORDNANCE
FY 2003
141 Exhibit Fund-9c Capital Budget Execution

Department of ArmyORDNANCE
FY 2004FY 2004-2005 Budget Estimate
($ in Millions)
PROJECTS ON THE FY 2003 PRESIDENT'S BUDGET
Approved ApprovedFY Project Project Approved Current Asset/
Title Amount Reprogs Proj Cost Proj Cost Deficiency ExplanationEQUIPMENT
EQUIPMENT-Replacement
FY 04 Various Capital Equipment <$500k 5.817 (5.817) No Prior Submission/Approval of ProjectFY 04 Bar and Chucking Lathe, CNC 4 1/2" 0.502 (0.502) No Prior Submission/Approval of ProjectFY 04 120" CNC Bed Type Lathe 0.599 (0.599) No Prior Submission/Approval of ProjectFY 04 CNC Milling Machine 0.818 (0.818) No Prior Submission/Approval of ProjectFY 04 White Phosphorus (WP) Facility Upgrade 24.339 (24.339) No Prior Submission/Approval of Project
EQUIPMENT-ProductivityFY 04 Automated M295 Line 2.985 (2.985) No Prior Submission/Approval of Project
ADPEFY 04 Miscellaneous ADPE < $500K 2.121 (2.121) No Prior Submission/Approval of ProjectFY 04 Network Enterprise Management Sys 0.516 (0.516) No Prior Submission/Approval of Project
MINOR CONSTRUCTION
FY 04 Minor Construction < $750K 8.478 (8.478) No Prior Submission/Approval of Project SOFTWARE
FY 04 Army Workload & Performance System (AWPS) 3.695 (3.695) No Prior Submission/Approval of ProjectFY 04 ERP/Industrial Base Modernization (IBM) 4.328 (4.328) No Prior Submission/Approval of ProjectFY 04 ERP/Industrial Base Modernization (IBM) 4.310 (4.310) No Prior Submission/Approval of Project
TOTAL 58.508 (58.508)
142 Exhibit Fund-9c Capital Budget Execution

Department of ArmyORDNANCE
FY 2005FY 2004-2005 Budget Estimate
($ in Millions)
PROJECTS ON THE FY 2003 PRESIDENT'S BUDGET
Approved ApprovedFY Project Project Approved Current Asset/
Title Amount Reprogs Proj Cost Proj Cost Deficiency ExplanationEQUIPMENT
EQUIPMENT-Replacement
FY 05 Various Capital Equipment <$500k 5.563 (5.563) No Prior Submission/Approval of ProjectFY 05 Replace Alarm System, Phase II 2.383 (2.383) No Prior Submission/Approval of ProjectFY 05 Chillers, 150 Ton f/Building 126 0.646 (0.646) No Prior Submission/Approval of ProjectFY 05 Machining Center 0.834 (0.834) No Prior Submission/Approval of ProjectFY 05 Vertical Heat Treat System 2.683 (2.683) No Prior Submission/Approval of ProjectFY 05 Upgrade 81mm Mortar RP Line 0.580 (0.580) No Prior Submission/Approval of ProjectFY 05 White Phosphorus (WP) Facility Upgrade 7.474 (7.474) No Prior Submission/Approval of Project
EQUIPMENT-ProductivityFY 05 Electric Generator (Diesel/Natural Gas) 1.367 (1.367) No Prior Submission/Approval of ProjectFY 05 Automated SDS Fill System, B 63-220 0.884 (0.884) No Prior Submission/Approval of ProjectFY 05 Sorbent Powder Prod Line, B. 63-220 4.430 (4.430) No Prior Submission/Approval of Project
ADPEFY 05 Miscellaneous ADPE < $500K 3.634 (3.634) No Prior Submission/Approval of Project
MINOR CONSTRUCTION
FY 05 Minor Construction < $750K 7.574 (7.574) No Prior Submission/Approval of ProjectFY 05 Environmental Remediation f/ ABG 0.930 (0.930) No Prior Submission/Approval of Project SOFTWARE
FY 05 Army Workload & Performance System (AWPS) 2.603 (2.603) No Prior Submission/Approval of ProjectFY 05 Future Logistics Enterprise (FLE)/Transformation 0.486 (0.486) No Prior Submission/Approval of Project
TOTAL 42.071 (42.071)
143 Exhibit Fund-9c Capital Budget Execution