department of nuclear energy planning and economic studies ... · nuclear cogeneration costs &...
TRANSCRIPT
Nuclear Cogeneration
Costs & Benefits
Department of Nuclear EnergyDivision of Planning, Information and Knowledge ManagementPlanning and Economic Studies Section
12 December 2018
Saied Dardour
IAEA.org
(+43-1) 2600-25154
2
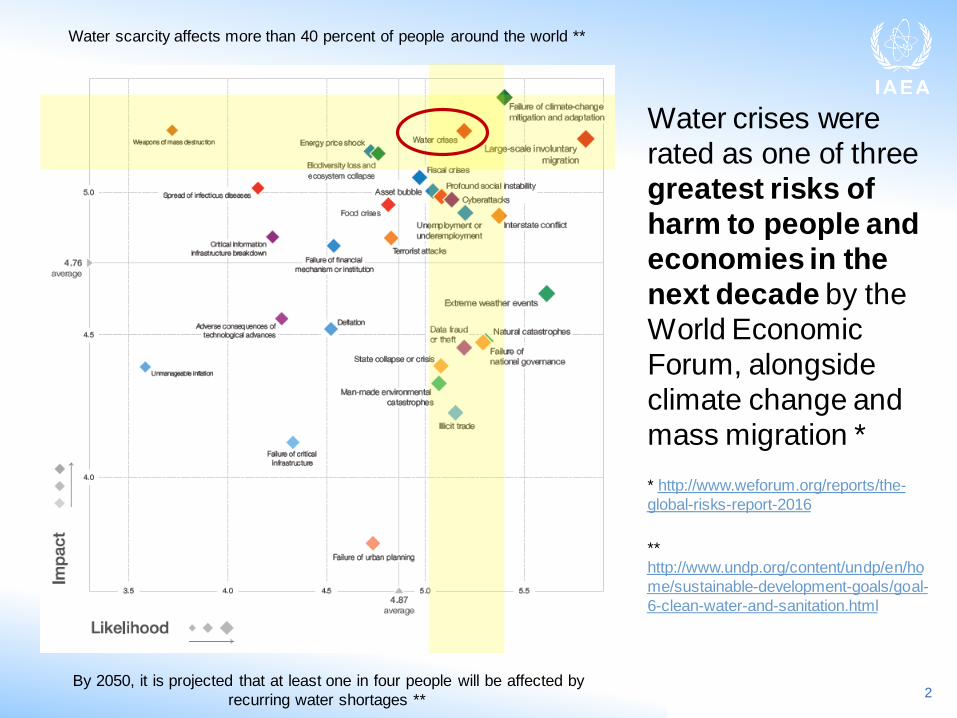
Water crises were
rated as one of three
greatest risks of
harm to people and
economies in the
next decade by the
World Economic
Forum, alongside
climate change and
mass migration *
* http://www.weforum.org/reports/the-
global-risks-report-2016
**
http://www.undp.org/content/undp/en/ho
me/sustainable-development-goals/goal-
6-clean-water-and-sanitation.html
Water scarcity affects more than 40 percent of people around the world **
By 2050, it is projected that at least one in four people will be affected by
recurring water shortages **

• Desalination has become an important source of water for drinking and agriculture in many regions:
– Middle East and North Africa
– Some of the Caribbean Islands
– China, India, the US and Australia
• 18 000 desalination plants in operation worldwide (1)
• 92 million m3 per day of global cumulative contracted capacity (1)
• Growth rate: 10% per year (2)
• About two third of the worldwide installed capacity is produced by Reverse Osmosis (RO)
• The remaining one third is produced mainly using thermal desalination technologies – Multi-Effect Distillation (MED) and Multi-Stage Flash (MSF) – mostly in the Middle East
3
(1) Source: GWI, IDA Desalination Yearbook 2015-2016.
(2) Global Clean Water Desalination Alliance - H20 minus CO2:
http://www.diplomatie.gouv.fr/fr/IMG/pdf/global_water_desalination_alliance_1dec2015_cle8d61cb.pdf
Barcelona Sea Water Desalination Plant, SpainRO, 200 000 m3/day - Largest RO plant in Europe
4
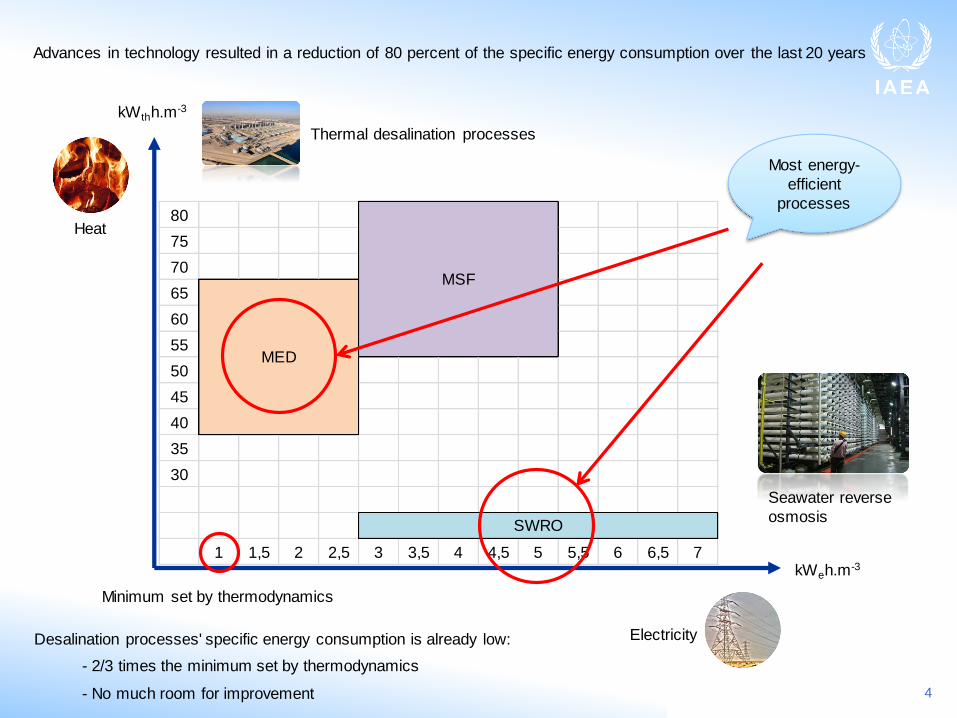
kWthh.m-3
kWeh.m-3
Thermal desalination processes
Seawater reverse
osmosis
80
75
70
65
60
55
50
45
40
35
30
1 1,5 2 2,5 3 3,5 4 4,5 5 5,5 6 6,5 7
MED
MSF
SWRO
Electricity
Heat
Most energy-
efficient
processes
Minimum set by thermodynamics
Advances in technology resulted in a reduction of 80 percent of the specific energy consumption over the last 20 years
Desalination processes' specific energy consumption is already low:
- 2/3 times the minimum set by thermodynamics
- No much room for improvement

5
Evaluating the heat cost
on the basis of missed
electricity production
leads to higher energy
costs for MED compared
to SWRO.
A rigorous techno-
economic approach, duly
considering
cogeneration, results in
comparable equivalent
electric power
consumptions between
MED and SWRO.
S. Dardour and H. Safa: EPJ Nuclear Sci.
Technol. 3, 1 (2017)
https://www.epj-
n.org/articles/epjn/pdf/2017/01/epjn160011.pdf
6
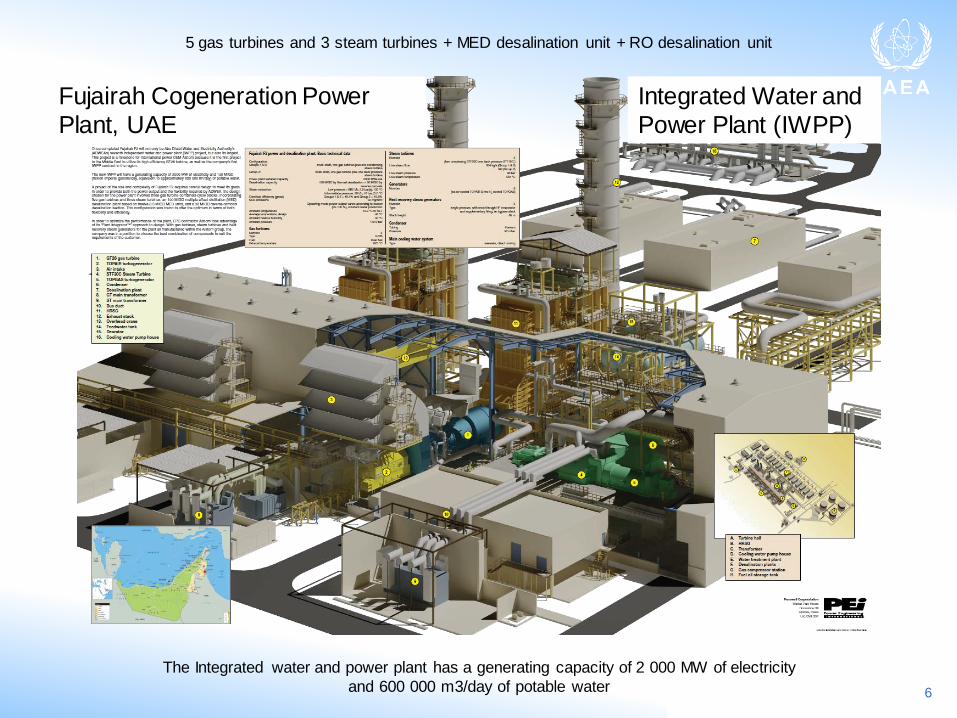
Fujairah Cogeneration Power
Plant, UAE
The Integrated water and power plant has a generating capacity of 2 000 MW of electricity
and 600 000 m3/day of potable water
5 gas turbines and 3 steam turbines + MED desalination unit + RO desalination unit
Integrated Water and
Power Plant (IWPP)

• Energy is the largest contributor to the desalted water cost, varying from one-third to more than one-half of the cost of produced water.
• The high energy requirements of seawater desalination raise several concerns, including sensitivity to energy price variability.
• Fuel represents a tiny fraction of the cost of nuclear electricity → reduced exposure to energy price variability.
7
Natural gas price volatility:
http://marketrealist.com/2014/12/e
nergy-price-volatility-concern-
spectra-energy/
8
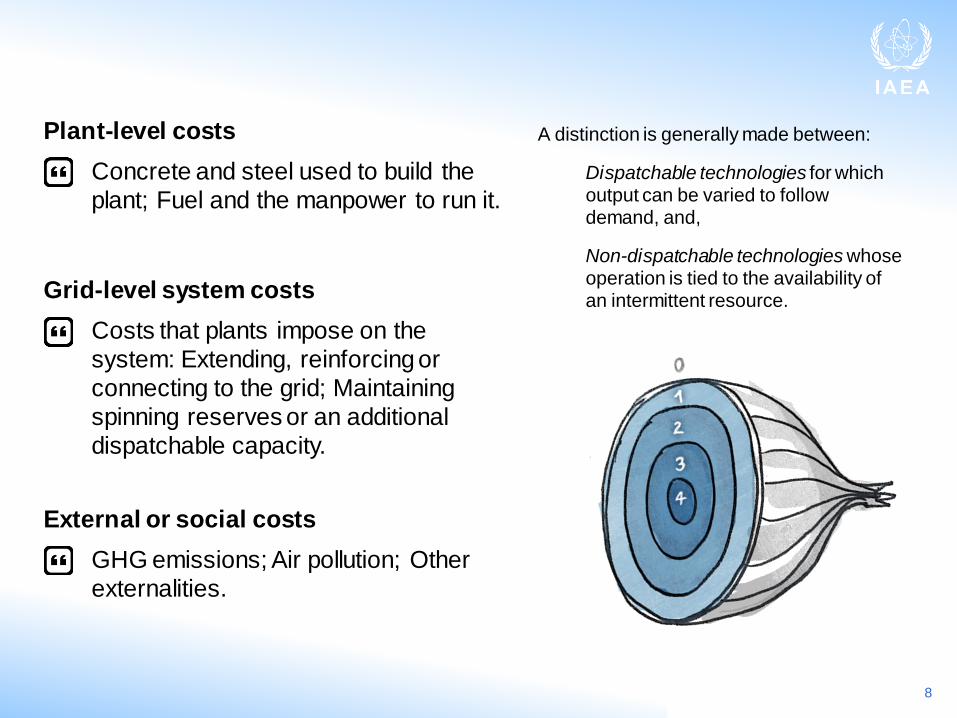
Grid-level system costs
Costs that plants impose on the
system: Extending, reinforcing or
connecting to the grid; Maintaining
spinning reserves or an additional
dispatchable capacity.
Plant-level costs
Concrete and steel used to build the
plant; Fuel and the manpower to run it.
External or social costs
GHG emissions; Air pollution; Other
externalities.
A distinction is generally made between:
Dispatchable technologies for which output can be varied to follow demand, and,
Non-dispatchable technologies whose operation is tied to the availability of an intermittent resource.

Plant-level costs
9
Busbar Metric = LCOE (levelized cost of electricity)
✓ Simple, transparent, easy to calculate
X Do not capture system and external costs
(beyond CO2 emissions)
X Not fit for deregulated electricity systems
Nuclear LCOE is largely driven by capital expenditure and the discount rate.
At 7%, nuclear
is still cheaper
than natural
gas and
comparable
with coal.
At 3% nuclear
is cheaper than
other
dispatchable
technologies
Source: IEA/NEA, 2015.
Dispatchable
technologies
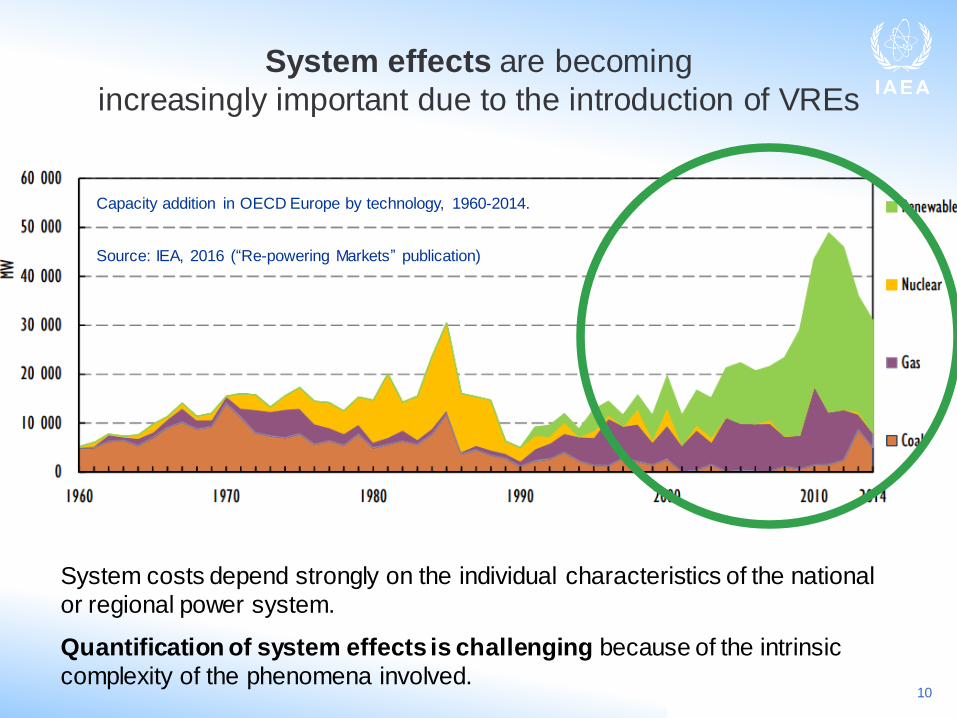
System effects are becoming
increasingly important due to the introduction of VREs
10
System costs depend strongly on the individual characteristics of the national
or regional power system.
Quantification of system effects is challenging because of the intrinsic
complexity of the phenomena involved.
Capacity addition in OECD Europe by technology, 1960-2014.
Source: IEA, 2016 (“Re-powering Markets” publication)
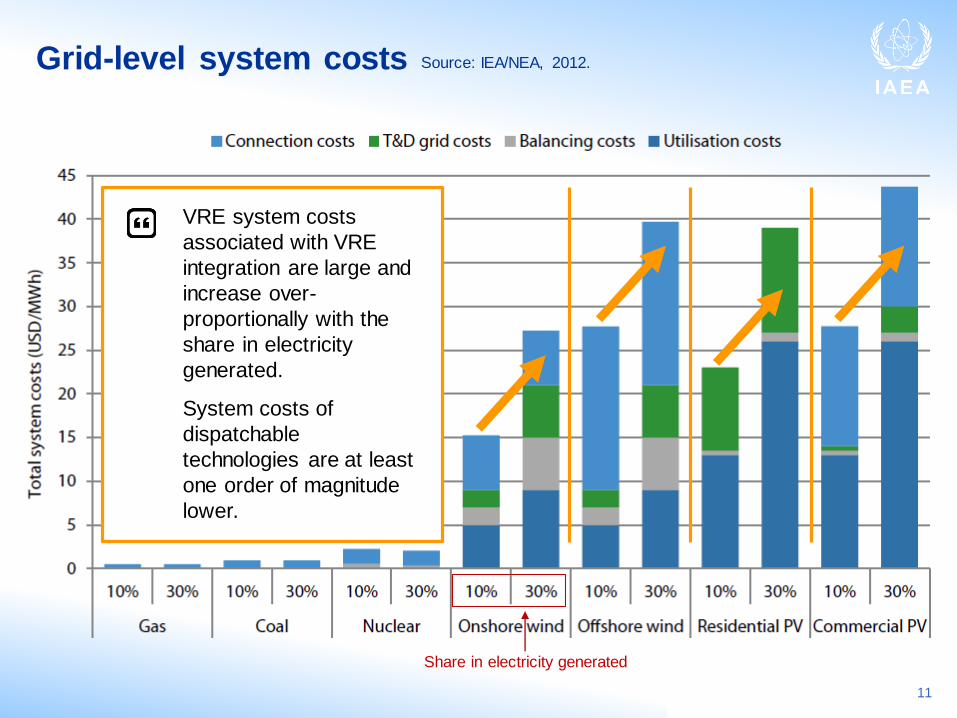
Grid-level system costs
11
Source: IEA/NEA, 2012.
VRE system costs
associated with VRE
integration are large and
increase over-
proportionally with the
share in electricity
generated.
System costs of
dispatchable
technologies are at least
one order of magnitude
lower.
Share in electricity generated
12
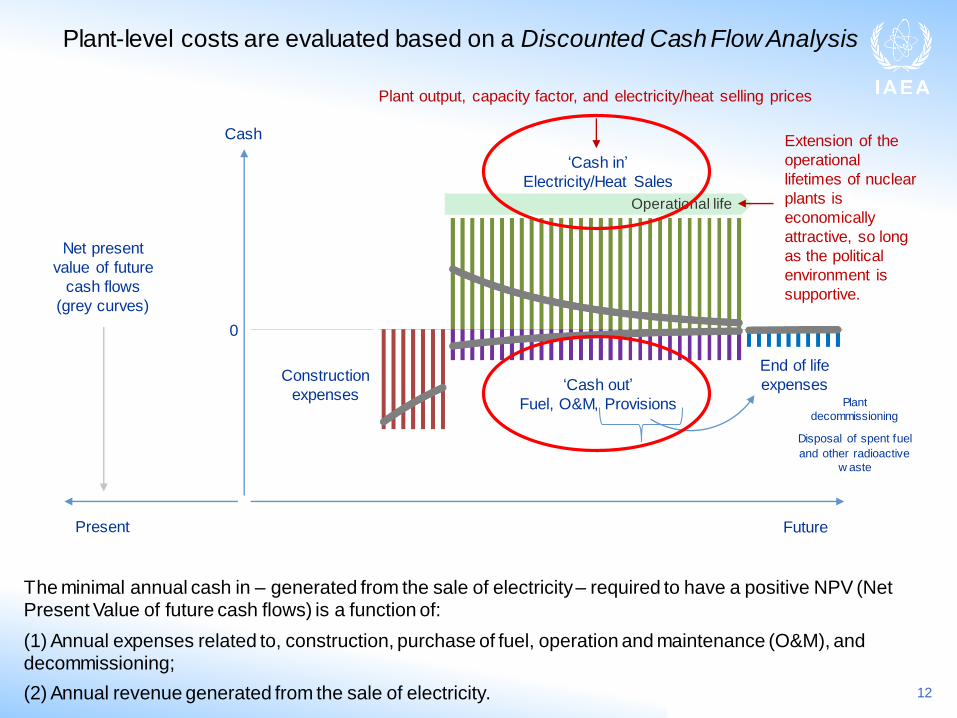
Construction
expenses‘Cash out’
Fuel, O&M, Provisions
‘Cash in’
Electricity/Heat Sales
End of life
expenses
Net present
value of future
cash flows
(grey curves)
FuturePresent
Operational life
Cash
0
Plant
decommissioning
Disposal of spent fuel
and other radioactive
w aste
Plant output, capacity factor, and electricity/heat selling prices
Extension of the
operational
lifetimes of nuclear
plants is
economically
attractive, so long
as the political
environment is
supportive.
Plant-level costs are evaluated based on a Discounted Cash Flow Analysis
The minimal annual cash in – generated from the sale of electricity – required to have a positive NPV (Net Present Value of future cash flows) is a function of:
(1) Annual expenses related to, construction, purchase of fuel, operation and maintenance (O&M), and decommissioning;
(2) Annual revenue generated from the sale of electricity.
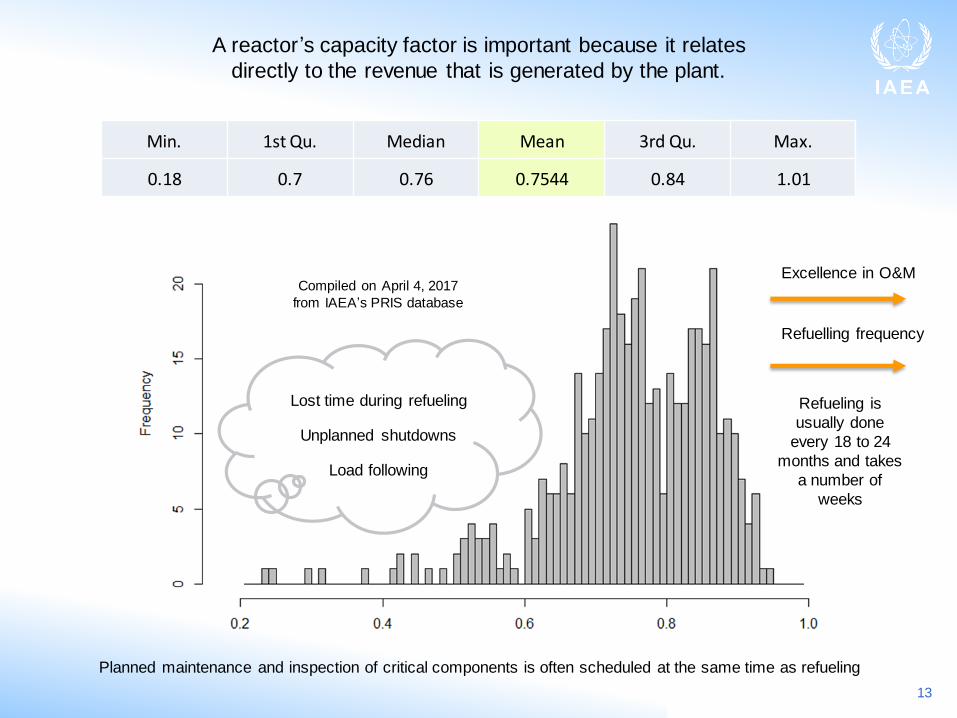
Load factor (0-1)Min. 1st Qu. Median Mean 3rd Qu. Max.
0.18 0.7 0.76 0.7544 0.84 1.01
Compiled on April 4, 2017
from IAEA’s PRIS database
Excellence in O&M
Refuelling frequency
A reactor’s capacity factor is important because it relates
directly to the revenue that is generated by the plant.
Lost time during refueling
Unplanned shutdowns
Load following
Refueling is
usually done
every 18 to 24
months and takes
a number of
weeks
Planned maintenance and inspection of critical components is often scheduled at the same time as refueling
13
14
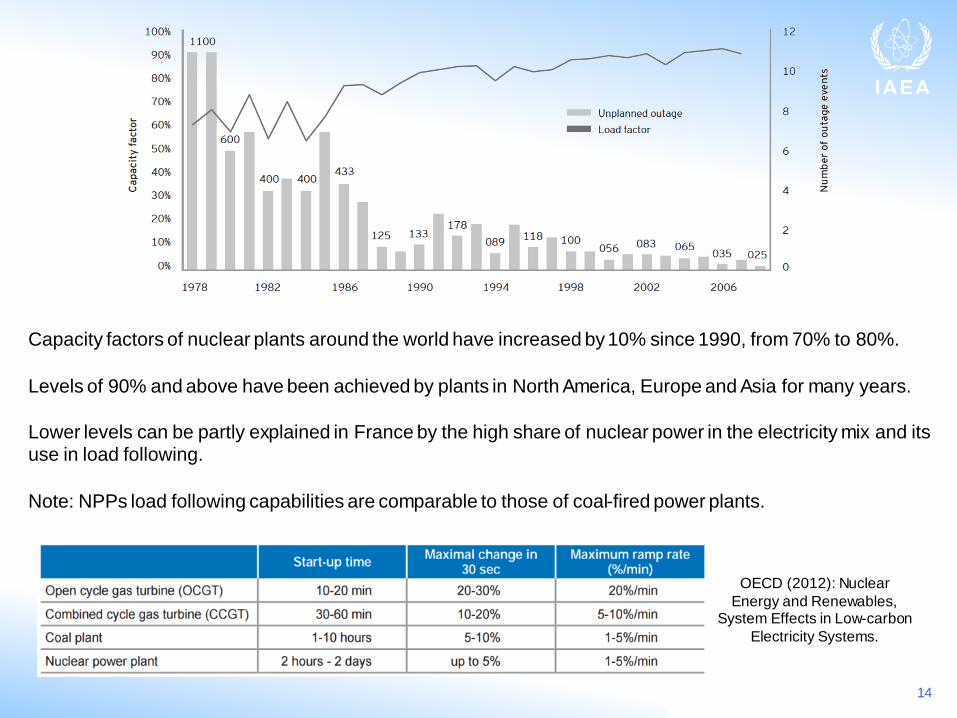
Capacity factors of nuclear plants around the world have increased by 10% since 1990, from 70% to 80%.
Levels of 90% and above have been achieved by plants in North America, Europe and Asia for many years.
Lower levels can be partly explained in France by the high share of nuclear power in the electricity mix and its use in load following.
Note: NPPs load following capabilities are comparable to those of coal-fired power plants.
OECD (2012): Nuclear
Energy and Renewables, System Effects in Low-carbon
Electricity Systems.

PRIS data shows a
clear correlation
between reactor size
and construction
schedule
Construction schedule
can be reduced by
smaller plant size and
an increase in the level
of standardization,
modularization and
other advanced
construction methods.
There is potential for SMRs to achieve a three- to four-year schedule (after the FOAK, which is
expected to take around a year longer) - Rothwell and Ganda (2014) and Abdullah (2013)
Schedule length is often heavily influenced by regulation
15
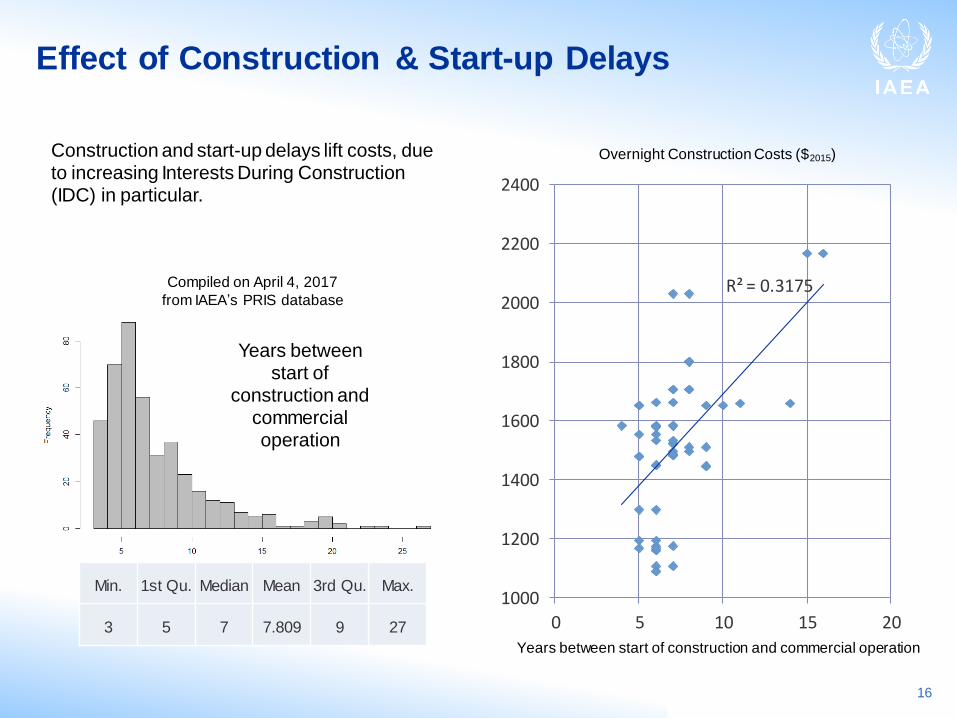
Effect of Construction & Start-up Delays
R² = 0.3175
1000
1200
1400
1600
1800
2000
2200
2400
0 5 10 15 20
Min. 1st Qu. Median Mean 3rd Qu. Max.
3 5 7 7.809 9 27
Overnight Construction Costs ($2015)
Years between start of construction and commercial operation
Construction and start-up delays lift costs, due to increasing Interests During Construction (IDC) in particular.
Years between start of
construction and commercial operation
Compiled on April 4, 2017
from IAEA’s PRIS database
16
17
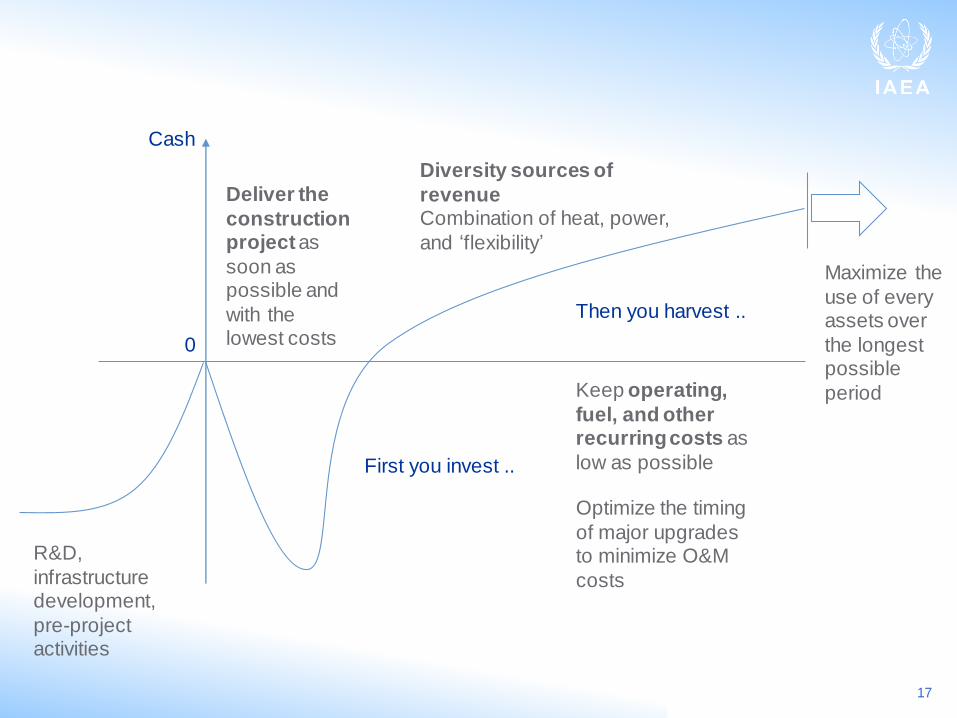
Cash
0
First you invest ..
Then you harvest ..
Diversity sources of
revenueCombination of heat, power,
and ‘flexibility’
Maximize the
use of every assets over
the longest possible
period
Deliver the
construction project as
soon as possible and
with the lowest costs
Keep operating,
fuel, and other recurring costs as
low as possible
Optimize the timing
of major upgrades to minimize O&M
costs
R&D,
infrastructure development,
pre-project activities

Nuclear Cost Basis (NCB)
https://nucleus.iaea.org/sites/NCB
Cost breakdown structures
Gantt charts
Multi-dimensional data
Technico-Economic Information Database
Provides indicative * cost and schedule data in a transparent w ay –
each data point is provided along w ith information on the original source
of data and the method used for processing –.
* Costs / durations are provided as percentages of a project’s total cost /
duration
The Nuclear Cost Basis provides guidelines and
resources for developing consistent cost estimates and
analyses covering, basically, all areas of a country’s
nuclear power programme.
Project’s outputs include an NE Series Publication
and a Technico-Economic Information Database.
These resources are developed primarily through
Consultancies, Technical Meetings and Coordinated
Research Activities.
NE Series Publication
Chapters covering
specif ic areas of interest
to IAEA Member States,
for e.g. “options and
technologies for spent
nuclear fuel storage”.
Methodological chapter.
Suggests generic costing
approaches applicable
across different phases of
a country’s nuclear
program.
18
19
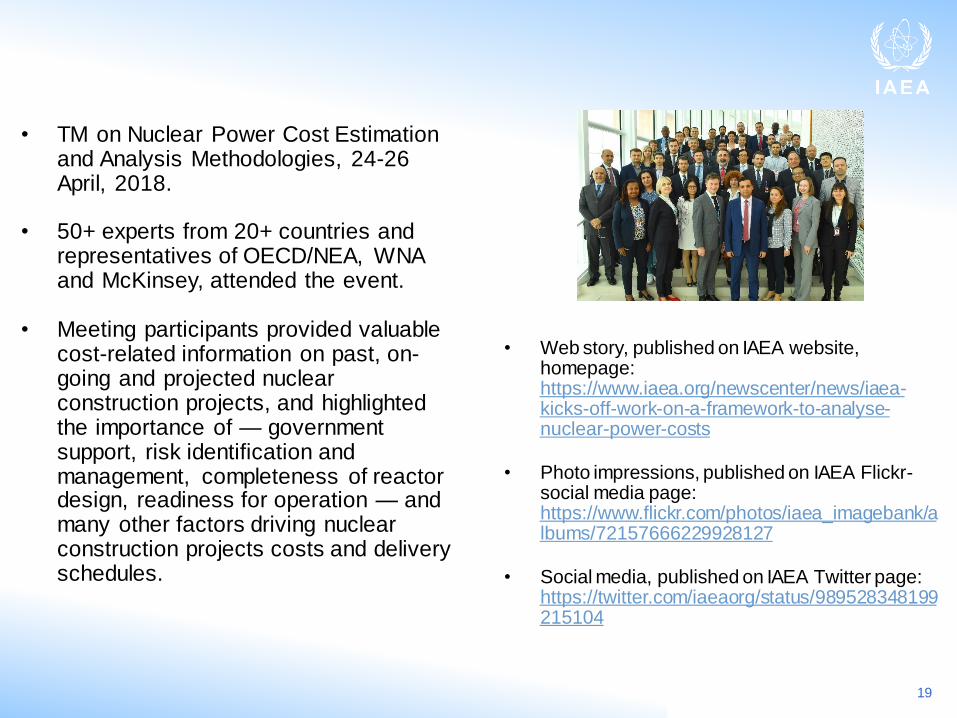
• TM on Nuclear Power Cost Estimation and Analysis Methodologies, 24-26 April, 2018.
• 50+ experts from 20+ countries and representatives of OECD/NEA, WNA and McKinsey, attended the event.
• Meeting participants provided valuable cost-related information on past, on-going and projected nuclear construction projects, and highlighted the importance of — government support, risk identification and management, completeness of reactor design, readiness for operation — and many other factors driving nuclear construction projects costs and delivery schedules.
• Web story, published on IAEA website, homepage: https://www.iaea.org/newscenter/news/iaea-kicks-off-work-on-a-framework-to-analyse-nuclear-power-costs
• Photo impressions, published on IAEA Flickr-social media page: https://www.flickr.com/photos/iaea_imagebank/albums/72157666229928127
• Social media, published on IAEA Twitter page: https://twitter.com/iaeaorg/status/989528348199215104
20
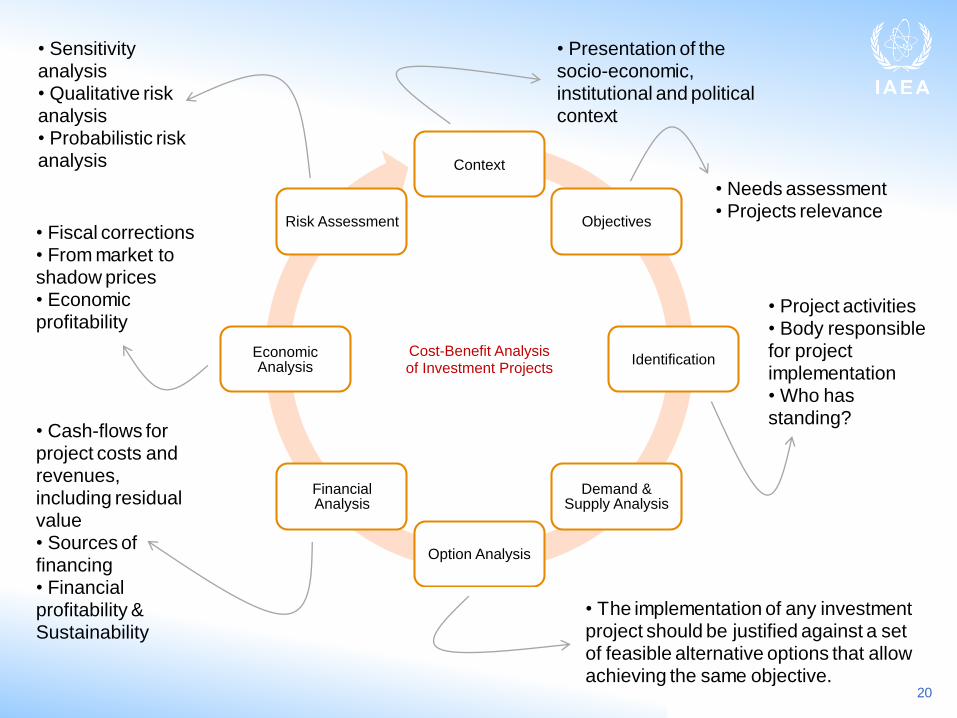
• Cash-flows for project costs and revenues, including residual value• Sources of financing• Financial profitability & Sustainability
• Fiscal corrections• From market to shadow prices• Economic profitability
• Sensitivity analysis• Qualitative risk analysis• Probabilistic risk analysis
• Project activities• Body responsible for project implementation• Who has standing?
• Needs assessment• Projects relevance
• Presentation of the socio-economic,institutional and political context
• The implementation of any investment project should be justified against a set of feasible alternative options that allow achieving the same objective.
Context
Objectives
Identification
Demand & Supply Analysis
Option Analysis
Financial Analysis
EconomicAnalysis
Risk Assessment
Cost-Benefit Analysisof Investment Projects
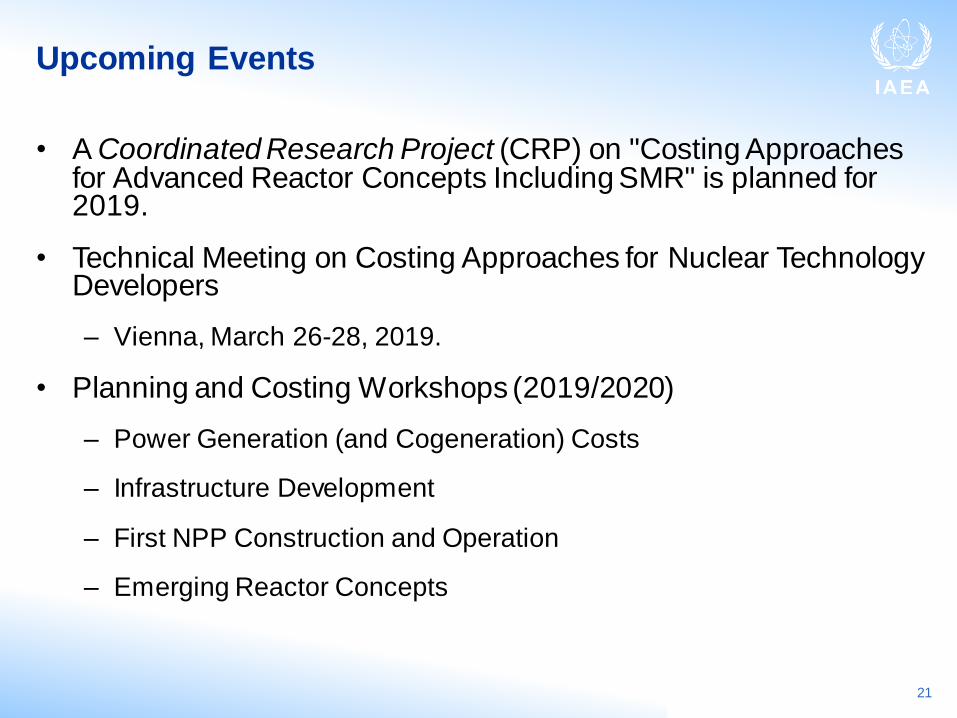
Upcoming Events
• A Coordinated Research Project (CRP) on "Costing Approaches for Advanced Reactor Concepts Including SMR" is planned for 2019.
• Technical Meeting on Costing Approaches for Nuclear Technology Developers
– Vienna, March 26-28, 2019.
• Planning and Costing Workshops (2019/2020)
– Power Generation (and Cogeneration) Costs
– Infrastructure Development
– First NPP Construction and Operation
– Emerging Reactor Concepts
21
Department of Nuclear Energy
Division of Planning, Information and Knowledge Management
Planning and Economic Studies Section
Saied Dardour
IAEA.org
(+43-1) 2600-25154