department of housing preservation and...
TRANSCRIPT

THE COUNCIL OF THE CITY OF NEW YORK
Hon. Melissa Mark-Viverito
Speaker of the Council
Hon. Julissa Ferreras-Copeland Chair, Finance Committee
Council Member Jumaane D. Williams
Chair, Committee on Housing and Buildings
Report to the Committee on Finance and the Committee on Housing and Buildings on the Fiscal 2018 Executive Budget for
Department of Housing Preservation and Development
May 11, 2017
Finance Division Latonia McKinney, Director Paul Scimone, Deputy Director Regina Poreda Ryan, Deputy Director Sarah Gastelum, Senior Financial Analyst Nathan Toth, Deputy Director Chima Obichere, Unit Head

Finance Division Briefing Paper Department of Housing Preservation and Development
-2-
Executive Budget Summary
Expense Budget Overview. The Department of Housing Preservation and Development’s (HPD or the Department) Executive Budget for Fiscal 2018 provides for operating expenses of $1.1 billion. The Department’s Executive Budget reflects a decrease of $140 million compared to the Fiscal 2017 Adopted Budget of $1.3 billion.
Funding Sources. At about $130.8 million, or 14 percent, only a small portion of HPD’s Fiscal 2018 budget is comprised of City tax-levy funds. About $1.2 billion, or 86 percent of the Department’s expense budget, is supported by federal and state assistance programs.
Headcount. The budgeted headcount of 2,452 positions is funded at $169 million. The Executive Budget provides $9.6 million in funding for 25 additional positions over the Fiscal 2018 Preliminary Budget for HPD. Some notable increases in staffing include:
o The addition of 15 positions to support technology functions within the Office of Technology and Strategic Development (TSD), including four product managers, four project managers, three quality assurance specialists, two solutions architects, and two information modelers. The annualized cost of these 15 positions is $1.5 million, which is baselined beginning in Fiscal 2018.
o The addition of six positions to support the NYC15 Rental Assistance Initiative in connection with the Mayor’s Supportive Housing Plan, which will create 15,000 units of supportive housing over the next 15 years. This funding enables the creation of a unit within the Division of Tenant Resources to support application processing and program participation. The Executive Budget includes $247,457 in Fiscal 2018 to support these positions. This funding grows to $454,074 by Fiscal 2021 as the program scales up.
Executive Budget Changes. The Fiscal 2018 Executive Budget includes $9.6 million for new needs in Fiscal 2018 and a net increase of $219.3 million in other adjustments. These changes include:
o $7.5 million in new needs in Fiscal 2018 for costs related to shelter, maintenance, and repair costs for temporary housing sites under the Three-Quarter House Taskforce;
o $2.1 million in new staffing needs for 25 positions;
o $219.3 million in other adjustments; and
o $540,000 in savings in Fiscal 2018 and in the outyears by swapping seven City tax-levy funded positions with federal Community Development Block Grant (CDBG) funding.
Capital Budget. The Fiscal 2018 Executive Capital Commitment Plan includes $5.4 billion in Fiscal 2017-2021 for HPD (including $5.2 billion in City funds and $177.8 million in Non-City funds). The Department’s Executive Commitment Plan for Fiscal 2017-2021 is $1.4 billion greater than the $3.8 billion scheduled in the Preliminary Capital Commitment Plan to provide deeper affordability within the Housing New York plan. These additional funds will support the development of 10,000 additional housing units affordable to households with annual incomes of less than $40,000 of which, 5,000 will be dedicated to seniors and 500 to veterans.

Finance Division Briefing Paper Department of Housing Preservation and Development
-3-
HPD Overview
This report provides a review of HPD’s Fiscal 2018 Executive Budget. In the first section, the highlights of the $1.13 billion Fiscal 2018 Expense Budget are presented, followed by a financial summary of HPD’s budget. Major issues related to the Department’s budget and relevant changes introduced in the Fiscal 2018 Executive Budget are discussed. The report then provides analysis and highlights of the Ten-Year Capital Strategy and the Fiscal 2017-2021 Executive Capital Budget. Appendix 1 reports the changes made to the Fiscal 2017 and Fiscal 2018 Budgets since Adoption of the Fiscal 2017 Budget. For additional information on the Department’s budget and its various programs, please refer to the Fiscal 2018 Preliminary Budget Report for HPD at: http://council.nyc.gov/budget/wp-content/uploads/sites/54/2017/03/806-HPD.pdf
HPD Financial Summary
2015 2016 2017 Executive Plan *Difference
Dollars in Thousands Actual Actual Adopted 2017 2018 2017 - 2018
Spending Personal Services $141,640 $149,373 $168,689 $171,659 $177,963 $9,274 Other Than Personal Services 576,764 700,659 1,103,259 1,167,945 954,002 (149,257)
TOTAL $718,403 $850,032 $1,271,948 $1,339,604 $1,131,965 ($139,983)
Budget by Program Area Administration $33,592 $40,023 $45,351 $53,610 $47,751 $2,401 Administration Program 22,791 19,542 116,858 124,003 125,989 9,131 Development 53,624 159,534 445,469 469,640 283,049 (162,420) Housing Operations - Section 8 Programs 460,243 474,494 479,177 491,446 494,057 14,880 Housing Operations- Emergency Housing 20,241 29,771 34,203 37,549 37,939 3,736 Housing Operations- Mgmt & Disposition 27,473 23,657 25,904 32,595 30,443 4,539 Preservation - Anti-Abandonment 6,970 7,935 9,573 8,547 4,589 (4,984) Preservation - Code Enforcement 32,240 31,807 39,183 40,214 36,986 (2,197) Preservation - Emergency Repair 21,681 21,634 29,325 32,547 30,591 1,266 Preservation - Lead Paint 14,460 13,100 14,131 16,629 14,363 232 Preservation - Other Agency Services 25,090 28,534 32,775 32,824 26,209 (6,566)
TOTAL $718,403 $850,032 $1,271,948 $1,339,604 $1,131,965 ($139,983)
Funding City Funds $70,622 $83,502 $186,655 $183,728 $130,760 ($55,895) Other Categorical 8,522 6,144 1,711 21,704 1,932 221 Capital- IFA 15,756 17,550 23,356 20,156 23,448 92 State 699 15,164 2,416 21,922 1,075 (1,341) Federal - Community Development 149,661 232,272 563,857 578,859 469,127 (94,730) Federal - Other 470,752 491,615 491,887 509,194 503,619 11,732 Intra City 2,391 3,783 2,067 4,040 2,004 (63)
TOTAL $718,403 $850,032 $1,271,948 $1,339,604 $1,131,965 ($139,983)
Budgeted Headcount Full-Time Positions - Civilian 2,100 2,218 2,452 2,498 2,515 63
TOTAL 2,100 2,218 2,452 2,498 2,515 63
*The difference of Fiscal 2017 Adopted Budget compared to Fiscal 2018 Executive Budget.
The City’s Fiscal 2018 Executive Budget totals $84.9 billion, $2.8 billion more than the Fiscal 2017 Adopted Budget of $82.1 billion. City funds (City tax-levy and non-tax revenues) total $61.1 billion when compared to the Fiscal 2017 Adopted Budget amount of $59.3 billion. In comparison, HPD’s Fiscal 2018 Executive Budget of $1.13 billion represents a 12 percent decrease over its Fiscal 2017 Adopted Budget of $1.27 billion and approximately one percent of the City’s total budget. This decrease is primarily due to the budget realignment of Other Than Personal Services (OTPS) expenses that are not yet baselined. The vast majority (about $976 million or 86 percent) of the Department’s expense budget is supported by federal and state assistance programs; HPD receives only about 14 percent of its total funding from City dollars,

Finance Division Briefing Paper Department of Housing Preservation and Development
-4-
including tax-levy and inter-fund agreement. Because the City’s fiscal year and the state and federal fiscal years do not coincide, HPD reports only baseline funding and grants that it anticipates from federal and state assistance programs at the beginning of each year and makes adjustments as additional funds are received. Therefore, program areas that are primarily funded through non-City sources might align with the Fiscal 2017 Adopted Budget once the agency can confirm these allocations. The proposed budget is about $229 million more than HPD’s Fiscal 2018 Preliminary Budget.
Since the Fiscal 2017 Adopted Budget, several initiatives have impacted the Department’s budget and headcount for Fiscal 2017 and Fiscal 2018. For Fiscal 2017 these include $3.4 million in new needs, $64.3 million in other adjustments, and a headcount increase of eight positions. For Fiscal 2018 these include $10.3 million in new needs, $244.7 million in other adjustments, and a headcount increase of 25 positions. Combined, the above actions reconcile the Department to its current budget of $1.34 billion for Fiscal 2017 and $1.13 billion for Fiscal 2018. (See Appendix 1 for a list of all budget actions since adoption).
New in the Executive Budget
HPD’s Fiscal 2018 Executive Budget introduced several new initiatives and actions intended to enhance core services that include: the development of quality affordable housing; management of affordable housing assets; expansion of opportunities for M/WBE developers; and support for costs related to shelter maintenance and repairs in connection with the Three-Quarter Housing Taskforce. The key actions in the Executive Budget for the Department include:
Three-Quarter Housing-Temporary Shelter Costs. A total of $7.5 million is added in Fiscal 2018 and $8.5 million in Fiscal 2019 and Fiscal 2020 to support OTPS costs for the continued inspection, maintenance and repairs, and relocation of individuals impacted from the three-quarter housing initiative. Three-quarter houses are unlicensed, privately operated for-profit residences, some of which falsely operate as treatment facilities or programs that accept the public assistance shelter allowance or a portion of other benefits as rent. In recent years, three-quarter houses have gone largely unregulated, but are considered illegal because they violate building codes on overcrowding. In May 2015, Mayor de Blasio appointed a multi-agency taskforce to conduct emergency inspections of three-quarter houses and allocated $5 million to taskforce efforts, greatly expanding HPD’s role in the effort. As such, HPD works with other City agencies to identify and address problems in the City’s homeless shelters and promote the long-term sustainability of emergency shelter housing. This funding also supports about 300 residents that have moved out of three-quarter housing due to overcrowding, with relocation services, including temporary housing and rental assistance payments averaging $125 per room per night.
Office of Technology and Strategic Development Consultant Swap. The Fiscal 2018 Executive Budget includes baseline funding of $1.5 million beginning in Fiscal 2018 for 15 additional positions to support HPD technology functions within the Office of Technology and Strategic Development (TSD) by in-sourcing TSD consultants to make more efficient use of capital funding. Currently, these positions are contracted using the Information Technology Consulting Services (ITCS) contract. This funding supports four product managers, two information modelers, four project managers, three quality assurance specialists, and two solutions architects.

Finance Division Briefing Paper Department of Housing Preservation and Development
-5-
NYC15 Rental Assistance Initiative. City funds of $247,457 are added in Fiscal 2018 for the hiring of six full-time employees, including three case managers, one team leader, one coordinator, and one project manager to support application processing and program participation in connection with the Mayor’s supportive housing commitment of 15,000 new units over the next 15 years. This funding enables the creation of a unit dedicated to processing rental assistance applications, program participation, and other administrative support areas within HPD’s Division of Tenant Resources (DTR). Funding for these employees is baselined in future years at a total cost of $454,074 per year. Additional resources are expected as the rental assistance initiative is phased in and scaled up.
M/WBE Program Expansion. The Fiscal 2018 Executive Plan includes baseline funding of $171,800 in Fiscal 2018 for two additional positions to manage M/WBE vendor contracts in connection with HPD’s M/WBE Build Up program, including one deputy director and one compliance analyst. The initiative seeks to build the capacity of M/WBE developers through professional development, networking, and mentoring programs, and enhance their ability to compete for and execute HPD and other affordable housing real estate development projects. Participation in the program is required for all sponsors receiving at least $2 million in city resources per HPD-financed project. In addition, projects must spend at least a quarter of costs on certified M/WBEs over the course of design and construction. This action brings the total headcount for the M/WBE Business Services unit at HPD to three, at a total cost of $275,200 per year.
PS Staffing. The Fiscal 2018 Executive Budget for the HPD includes $171,800 in City funds in Fiscal 2018 and in the outyears for two additional positions to support communications and staffing management functions within the Division of Communications and the Division of Human Resources.
Citywide Savings Program. Along with the Fiscal 2018 Executive Plan, the Office of Management and Budget (OMB) released a Citywide Savings Program that outlines plans to reduce City spending by $330 million in Fiscal 2017 and $370 million in Fiscal 2018. To develop the program, OMB asked all agencies to identify efficiencies, alternative funding sources and programmatic changes that would yield budgetary savings without reducing service levels. HPD has proposed savings totaling $1.3 million in Fiscal 2017 and $1.6 million in Fiscal 2018. HPD’s savings in the Executive plan include:
o Personal Service (PS) Funding Swap. HPD anticipates savings of $540,000 in Fiscal 2018 and in the outyears from swapping seven City tax-levy funded positions with CDBG funds.
Fiscal 2018 Funding Sources
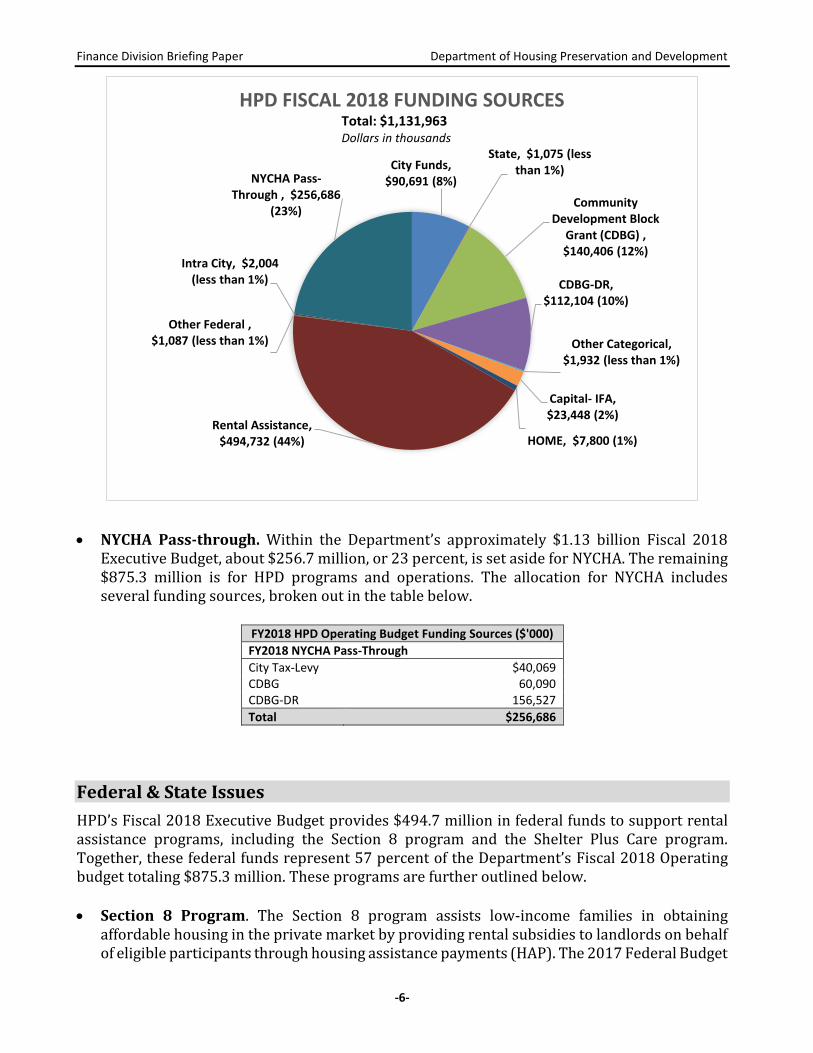
The vast majority (about $976 million or 86 percent) of the Department’s expense budget is supported by federal and state assistance programs. As shown in the chart below, approximately $494.7 million or 44 percent of HPD’s Fiscal 2018 expense budget is federal Rental Assistance Programs funding. Federal CDBG funds are the second highest source of operating support for the Department, and will comprise of over $469 million of HPD’s total expense budget in Fiscal 2018; this includes $256.7 million that HPD administers on behalf of the New York City Housing Authority (NYCHA). When accounting for the pass-through of these funds, only about $90.7 million, or eight percent, of HPD’s Fiscal 2018 budget is comprised of City tax-levy funds.
Finance Division Briefing Paper Department of Housing Preservation and Development
-6-
NYCHA Pass-through. Within the Department’s approximately $1.13 billion Fiscal 2018 Executive Budget, about $256.7 million, or 23 percent, is set aside for NYCHA. The remaining $875.3 million is for HPD programs and operations. The allocation for NYCHA includes several funding sources, broken out in the table below.
Federal & State Issues
HPD’s Fiscal 2018 Executive Budget provides $494.7 million in federal funds to support rental assistance programs, including the Section 8 program and the Shelter Plus Care program. Together, these federal funds represent 57 percent of the Department’s Fiscal 2018 Operating budget totaling $875.3 million. These programs are further outlined below.
Section 8 Program. The Section 8 program assists low-income families in obtaining affordable housing in the private market by providing rental subsidies to landlords on behalf of eligible participants through housing assistance payments (HAP). The 2017 Federal Budget
City Funds, $90,691 (8%)
State, $1,075 (less than 1%)
Community Development Block
Grant (CDBG) , $140,406 (12%)
CDBG-DR, $112,104 (10%)
Other Categorical, $1,932 (less than 1%)
Capital- IFA, $23,448 (2%)
HOME, $7,800 (1%)Rental Assistance,
$494,732 (44%)
Other Federal , $1,087 (less than 1%)
Intra City, $2,004 (less than 1%)
NYCHA Pass-Through , $256,686
(23%)
HPD FISCAL 2018 FUNDING SOURCESTotal: $1,131,963Dollars in thousands
FY2018 HPD Operating Budget Funding Sources ($'000)
FY2018 NYCHA Pass-Through
City Tax-Levy $40,069 CDBG 60,090 CDBG-DR 156,527
Total $256,686

Finance Division Briefing Paper Department of Housing Preservation and Development
-7-
provides $20.9 billion for the Section 8 program, $1.2 billion more than the Fiscal 2016 enacted budget. In New York City, HPD administers approximately 39,395 Section 8 vouchers. HPD reserves its Section 8 vouchers for homeless individuals referred by the New York City Department of Homeless Services (DHS) and the New York City Human Resources Administration (HRA) and for families in buildings developed or renovated under certain HPD programs. For the federal 2018 fiscal year, HPD is seeking full funding to assist all families currently under lease in 2017. Based on estimated 2016 HAP expenditures of about $455 million, HPD has budgeted HAP renewal funding of $456.9 million in 2017 at 99.58 percent proration. Though future federal funding levels remain uncertain, in March 2017, HPD was notified of a tentative 95 percent proration rate for Section 8 and a tentative 77 percent proration rate for Section 8 Administrative Fees. For HPD, this suggests a HAP subsidy funding level of $20 million below eligibility in 2017. The potential loss in Section 8 funding would severely restrict HPD’s ability to administer the program and the number of families it can serve.
FY2018 HPD Operating Budget Funding Sources ($'000)
Rental Assistance Funding Sources
Section 8 $456,862 Shelter Plus Care 37,871
Total $494,732
Shelter Plus Care. The Fiscal 2018 Executive Budget provides $37.8 million for the Shelter Plus Care program, which provides rental assistance, in combination with supportive services from other sources, to assist hard-to-serve homeless persons with disabilities. The program targets households with serious mental illness, chronic problems with alcohol and/or drugs, and HIV/AIDS or related diseases. As of December 2016, HPD provides rental assistance vouchers to an estimated 2,800 households participating in the Shelter Plus Care program.
Statewide Affordable Housing Plan. The 2017 State Executive Budget introduced a $20 billion investment in affordable and supportive housing throughout New York State. This investment will create or preserve 100,000 units of affordable housing and 6,000 units of supportive housing statewide. Funding includes $3.5 billion in capital resources, $8.6 billion in state and federal tax credits and other allocations, and $8 billion to support the operation of shelters and supportive housing units and to provide rental subsidies. Of the total $20 billion investment, $2.7 billion was appropriated in the 2017-2018 State Budget. However, at the time of this writing, it is unclear how this funding will impact HPD’s budget, and therefore no changes associated with these funds are reflected in the Fiscal 2018 Executive Budget.
New Program to Replace 421(a) – "Affordable New York.” The 2017-2018 State Budget includes legislation to expand the tax incentive program “Affordable New York,” which will replace the 421(a) real estate tax abatement that has been suspended since January 2016. Under the new version of the program, developers of new residential projects with 300 units or more in certain areas of Manhattan, Brooklyn and Queens would be eligible for a full property tax abatement for 35 years (up from 25 years) if the project creates a specific number of affordable rental units and meets minimum construction wage requirements. For all other affordable developments in the City, the period of affordability and abatement eligibility would be tied to the number of affordable units. Affordable New York is expected to create about 2,500 new units of affordable housing per year and 9,000 units total.

Finance Division Briefing Paper Department of Housing Preservation and Development
-8-
Other Issues
Housing New York: A Five Borough, Ten-Year Plan. Housing New York is the Mayor’s long-term strategy to address the City’s affordable housing crisis. The plan, which was created through the coordination of 13 City agencies and with input from over 200 individual stakeholders, outlines more than 50 initiatives to support HPD’s goal of developing 80,000 new housing units and preserving 120,000 units to meet the needs of more than 500,000 City residents. As of December 31, 2016, HPD has financed the creation and preservation of 62,506 affordable housing units citywide, including 20,854 newly constructed units and the preservation of 41,652 units. About 79 percent of the units financed to date were for extremely low, very low, and low-income families, affordable to households with annual incomes of $62,250 and below. A further 12,728 units were financed for moderate and middle-income households. For more information regarding the units constructed and preserved, see the table below.
Income Band Percentage of AMIMonthly Rent Required to
Prevent Rent-Burden
Income Range (3-
person household)
Number of
Units YTD
Percentage
of total units
Extremely Low Income 0-30% Up to $629 < $24,500 8,877 14%
Very Low Income 31-50% $630 - $1,049 $24,501 - $40,800 8,369 13%
Low Income 51-80% $1,050 - $1,678 $40,801 - $65,250 32,229 52%
Moderate Income 81-120% $1,679 - $2,517 $65,251 - $97,920 3,755 6%
Middle Income 121-165% $2,158 - $3,461 $97,921 - $134,640 8,973 14%
Other (Super) 303 0%
62,506 100%
Housing New York- Units Preserved and Constructed to Date (1/1/14 to 12/31/16)
TOTAL
New Housing Benchmark for Extremely Low-Income households. As part of the Mayor’s commitment to increase the number of units produced for extremely low-income households, it was recently announced that the number of housing units constructed under Housing New York serving households earning less than $40,000 will increase by 10,000 from 40,000 units to 50,000 units. Under the new benchmark, of the 10,000 units, 5,000 will be dedicated to seniors and 500 units will house veterans. HPD’s Ten-Year Capital strategy includes $1.9 billion in new funding to provide deeper affordability in connection with this new benchmark. The programs that reflect the increased funding under the adjusted benchmark are the Extremely Low & Low-Income Affordability Program (ELLA) and the Senior Affordable Rental Apartments Program (SARA), among others.
HPD Capital Strategy and Plan
The Department of Housing Preservation and Development (HPD) preserves, upgrades, and assists in the expansion of the City’s affordable housing stock. To achieve its goals, HPD strives to spur the preservation and development of affordable housing through direct investment and the provision of loans to maximize neighborhood ownership and management of housing by generating local participation in disposition and development programs in addition to enforcing compliance with housing quality standards. HPD’s long-term capital spending goals are reflected in the Ten-Year Capital Strategy, which include preservation, new housing construction, and supportive housing, while plans for projects funded in the Capital Budget are included in the Capital Commitment Plan, which aligns with the priorities set forth by the Ten-Year Capital

Finance Division Briefing Paper Department of Housing Preservation and Development
-9-
Strategy structured to meet the goals of “Housing New York: A Five-Borough, Ten Year Plan” (HNY), with a goal of creating and preserving a total of 200,000 units Citywide from 2014-2024.
Ten-Year Capital Strategy
The City’s Ten-Year Capital Strategy totals $95.8 billion (all funds), an increase of $6.2 billion, or seven percent, from the Preliminary Ten-Year Capital Strategy total of $89.6 billion. The Ten-Year Capital Strategy demonstrates the agency’s long-term capital spending goals, and the Capital Commitment Plan outlines plans for projects funded in the capital budget. For HPD, the Ten-Year Capital Strategy provides $9.5 billion (including $9.2 billion in City funds and $327 in Non-City funds) in support of its capital program goals from Fiscal 2018 to 2027.
The Ten-Year Capital strategy includes $1.9 billion in new funding between Fiscal 2018-2024 to deepen affordability within the Housing New York plan. The Department’s Ten-Year Capital strategy is divided into five categories, as provided by the table below.
Dollars in Thousands 2018 2019 2020 2021 2022 2023 2024 2025 2026 2027 Total
Preservation 407,865$ 355,646$ 390,119$ 416,123$ 425,046$ 434,148$ 428,774$ 295,500$ 289,621$ 298,599$ 3,741,441$
New Hous ing Construction 516,605 386,634 316,771 290,923 293,869 295,931 299,410 214,658 231,133 238,299 3,084,233
Specia l Needs Hous ing 143,680 239,368 231,401 208,836 184,774 171,000 170,000 222,542 228,449 234,539 2,034,589
Occupied In Rem Rehabi l i tation 28,631 36,754 52,325 35,462 36,172 36,895 37,633 38,386 54,616 56,309 413,183
Other Hous ing Support Investment 37,036 12,350 15,451 17,193 19,066 20,979 22,929 33,045 24,336 25,178 227,563
Total $1,133,817 $1,030,752 $1,006,067 $968,537 $958,927 $958,953 $958,746 $804,131 $828,155 $852,924 9,501,009$
Source: Office of Management and Budget (OMB) Executive Ten-Year Capital Strategy Fiscal Years 2018-2027
HPD Fiscal 2018-2027 Ten-Year Capital Strategy
Preservation. The Ten-Year Capital Strategy provides $3.7 billion for preservation projects. This represents a $1 billion increase compared to the Preliminary Ten-Year Capital Strategy. Funding will support activities to preserve existing affordable housing stock, while securing long-term affordability.
New Housing Construction,
$3,084,233 (33%)
Occupied In Rem Rehabilitation, $227,563 (2%)
Other Housing Support
Investment, $413,183 (4%)
Preservation, $3,741,441 (39%)
Special Needs Housing,
$2,034,589 (22%)
HPD 2018-2027 TEN-YEAR CAPITAL STRATEGY
Total: $9,501,009Dollars in thousands

Finance Division Briefing Paper Department of Housing Preservation and Development
-10-
New Housing Construction. The Ten-Year Capital Strategy provides $3.1 billion to finance new construction projects. This represents a $700 million increase compared to the Preliminary Ten-Year Capital Strategy. Funding will support the construction of new units serving low, moderate, and middle income residents.
Special Needs Housing. The Ten-Year Capital Strategy provides $2 billion for the construction and preservation of housing for vulnerable populations, including seniors, persons with disabilities, and formally homeless households.
Occupied In Rem Rehabilitation. The Ten-Year Capital Strategy provides $413.2 million for the rehabilitation and disposition of city-owned housing units, which will be rehabilitated and then sold or rented to low, moderate and middle income households.
Other Housing Support Investment. The Ten-Year Capital Strategy provides $227.6 million for Other Housing Support to fund a variety of HPD initiatives, which include the demolition of unsafe buildings, costs associated with development in urban renewal areas, computer-based productivity initiatives, and other infrastructure support.
Capital Commitment Plan
The Fiscal 2018 Executive Capital Commitment Plan totals $5.39 billion in Fiscal 2017-2021 for HPD (including $5.2 billion in City funds and $177.8 million in Non-City funds). This represents approximately 6.7 percent of the City’s total $78.1 billion Executive Plan for Fiscal 2017-2021. The Department’s Executive Commitment Plan for Fiscal 2017-2021 is $1.35 billion greater than the $3.86 billion scheduled in the Preliminary Capital Commitment Plan. HPD will use its City capital resources to leverage State and federal funds, as well as substantial private equity (that does not flow through the City’s capital budget) as part of the Department’s commitment to create and preserve 200,000 units of affordable housing under Housing New York. The table below reflects City capital commitments over the Fiscal 2017-2021 period.
Since the Office of Management and Budget (OMB) typically frontloads budgets for capital projects, which usually span multiple fiscal years, agencies often roll unspent capital funds into future fiscal years. In Fiscal 2016, HPD committed $866.1 million or 80 percent of its annual capital plan. Therefore, it is assumed that a significant portion of the agency’s Fiscal 2017 Capital Plan will be rolled into Fiscal 2018.
HPD 2017-2021 Capital Commitment Plan Dollars in Thousands
2017 2018 2019 2020 2021 Total
Executive Plan $1,207,523 $1,094,901 $998,752 $974,067 $936,537 $5,211,780
Preliminary Plan 867,669 823,265 736,831 729,957 704,489 3,862,211
Change 339,854 271,636 261,921 244,110 232,048 1,349,569
Percentage Change 39% 33% 36% 33% 33% 35%
Source: OMB Fiscal 2018 Executive Capital Commitment Plan
The Fiscal 2018-2021 Four-Year Plan totals $4.1 billion (including $4 billion in City funds and $135 million in Non-City funds). Under the Fiscal 2018-2021 Four-Year Capital Plan, the City will invest in more than 20,000 units of affordable housing annually. HPD’s four-year Capital Commitment Plan is divided into five program areas. Each of these programs and their budgets are discussed below.

Finance Division Briefing Paper Department of Housing Preservation and Development
-11-
By Category Dollars in Thousands
2018 2019 2020 2021 Total
Preservation $407,865 $355,646 $390,119 $416,123 $1,569,753 New Construction 516,605 386,634 316,771 290,923 1,510,933 Special Needs 104,764 207,368 199,401 176,836 688,369 Disposition 28,631 36,754 52,325 35,462 153,172 Other Housing Support 37,036 12,350 15,451 17,193 82,030
TOTAL $1,094,901 $998,752 $974,067 $936,537 $4,004,257
Source: OMB Fiscal 2018 Message of the Mayor
Preservation. The Fiscal 2018-2021 Four-Year Plan includes $1.6 billion to support financing programs that preserve the existing affordable housing stock and provide long-term affordability. Various loan programs administered by HPD provide financing for the moderate to substantial rehabilitation of rental projects affordable to households earning between 60 percent and 130 percent AMI. Utilizing a variety of these programs, an estimated 24,000 units of affordable housing will be preserved over the four-year period. The Fiscal 2018-2021 Capital Commitment of $1.6 billion for preservation activities includes funding for the following financing programs:
o $480.6 million for the Low Income Housing Tax Credit (LIHTC) Projects- LIHTC Year 15 Preservation Program;
o $452.7 million for the Participation Loan Program (PLP); and
o $230.8 million for the Multi-Family Preservation program.
New Housing Construction. The Fiscal 2018-2021 Four-Year Plan includes $1.5 billion to support construction of new units serving low, moderate, and middle income households throughout the five boroughs. Utilizing various financing programs, including large-scale developments, as well as funding for rental and homeownership programs, HPD will produce an estimated 22,000 units over the four-year plan. The Fiscal 2018-2021 Capital Commitment of $1.5 billion for new construction includes funding for the following financing programs:
o $742.2 million for the Extremely Low & Low Income Affordability (ELLA) Program; and
o $680.3 million for the Mixed Income Program- Mix and Match.
Supportive Housing. The Fiscal 2018-2021 Four-Year Plan includes $688.4 million to support the development and preservation of housing for seniors, persons with disabilities, and formerly homeless households throughout the five boroughs. Utilizing federal HOME funds and various Special Needs housing loan programs, HPD will create or preserve approximately 7,000 housing units over the four-year plan. Supportive housing units under this program area will be affordable to households making up to 60 percent AMI. The Plan includes funding for the following financing programs:
o $226.6 million for HUD Section 202 Housing.
Disposition - Occupied In Rem Rehabilitation. The Fiscal 2018-2021 Four-Year Plan includes $153.2 million for disposition programs that support the rehabilitation and disposition of city-owned housing. Over the Fiscal 2018 -2021 period, HPD will convey approximately 2,000 housing units to responsible private ownership; these units will be affordable to households earning up to 150 percent AMI. The Fiscal 2018-2021 Capital Commitment of $153.2 million includes funding for the following financing programs:

Finance Division Briefing Paper Department of Housing Preservation and Development
-12-
o $247 million for the Multifamily Disposition and Finance Programs (TPT and MPLP); and
o $174 million for the Affordable Neighborhood Cooperative Program (ANCP).
Other Housing Support. The Fiscal 2018-2021 Four-Year Plan includes $82 million to support a variety of HPD initiatives, including the demolition of unsafe buildings, subsidies to offset the costs associated with development in urban renewal areas, computer-based productivity initiatives, and other infrastructure support.

Finance Division Briefing Paper Department of Housing Preservation and Development
-13-
Appendix 1: Fiscal 2018 Budget Actions since Fiscal 2017 Adoption
Dollars in Thousands
FY 2017 FY 2018
City Non-City Total City Non-City Total
HPD Budget as of the Adopted 2017 Plan $186,656 $1,085,293 $1,271,949 $116,166 $760,767 $876,933
New Needs - Prelim. 2018
Demolition Funding $3,000 $0 $3,000 $0 $0 $0
421a Enforcement Staffing 201 0 201 402 0 402
421a Temporary Staffing 149 0 149 299 0 299
Subtotal, New Needs $3,350 $0 $3,350 $701 $0 $701
Other Adjustments - Prelim. 2018
AfR Sept Funding $0 $10,000 $10,000 $0 $0 $0
BPCA HTF Stuy Mews 0 3,000 3,000 0 0 0
BPCA HTF Stuy Mews Addition 0 376 376 0 0 0
Bring up Federal Funds 0 2,764 2,764 0 0 0
Bring up Funds 0 3,120 3,120 0 0 0
Bring Up funds admin and plan 0 998 998 0 0 0
Bring up funds for AfR 0 10,259 10,259 0 0 0
Bring up funds for HANS 0 485 485 0 0 0
Bring up Funds for MF HDC 0 24,784 24,784 0 0 0
Bring up funds for MF HPD 0 58,653 58,653 0 0 0
Bring up funds for MF LISC 0 5,339 5,339 0 0 0
Bring up funds for SF 0 4,254 4,254 0 0 0
Bring up funds for TDAP 0 2,073 2,073 0 0 0
Code Enforcement CDBG Increase 0 526 526 0 0 0
Collective Bargaiing Increases 1 11 12 5 48 53
Collective Bargaining- LL180 Administrative Managers 0 2 2 0 10 10
CPC MF Balance CDBG-DR 0 (6,337) (6,337) 0 0 0
Fus Buckingham House 7823 0 140 140 0 140 140
Hanac SARA 0 1,000 1,000 0 0 0
Home First Buyers 0 3,400 3,400 0 0 0
Home First Takedown 0 (3,000) (3,000) 0 0 0
HPD MF Balance CDBG-DR 0 (90,326) (90,326) 0 0 0
IC w/ HPD Housing Vacancy Survey 0 19 19 0 0 0
Increase funds and HC for DR 0 85 85 0 0 0
Lead Demo 2012 Grant 0 1,438 1,438 0 0 0
Lead Demo 2015 Grant 0 909 909 0 0 0
LISC MF Balance CDBG-DR 0 (2,887) (2,887) 0 0 0
MAP II 0 72 72 0 0 0
Member Item Reallocation (35) 0 (35) 0 0 0
MOCJ- HPD DANY Funding 0 19,507 19,507 0 0 0
Neighborhood Restore Savings (400) 0 (400) (400) 0 (400)
NYCHA AE Rollover 0 (22,950) (22,950) 0 22,950 22,950
NYCHA Ark Systems Rollover 0 (22,950) (22,950) 0 22,950 22,950
NYCHA Astoria OTPS Fy17 0 31,839 31,839 0 (17,333) (17,333)
NYCHA CM Reduction 0 (6,554) (6,554) 0 0 0
NYCHA CM Takedown 0 (16,396) (16,396) 0 (17,333) (17,333)
NYCHA Meric & Meco Rollover 0 (22,950) (22,950) 0 22,950 22,950
NYCHA Smith OTPS FY17 0 28,383 28,383 0 (17,333) (17,333)
NYCHA: Coney Island 1B Realloc 0 (29,556) (29,556) 0 0 0
Project Open House 0 91 91 0 0 0
PS Savings (384) 0 (384) (384) 0 (384)
Put up PS funds CDBG-DR 0 527 527 0 0 0
Reallocate funds Archer St Pl 0 452 452 0 0 0
Reallocate funds Willets Pt 0 1,177 1,177 0 0 0
Roll Fy16 AG Settlement Funds to 17 0 8,461 8,461 0 0 0
Service Provider Wage Adjustment 9 0 9 59 0 59
SF Rebuild August Needs 0 26,700 26,700 0 0 0

Finance Division Briefing Paper Department of Housing Preservation and Development
-14-
Dollars in Thousands
FY 2017 FY 2018
City Non-City Total City Non-City Total
SF Rebuild July Budget Needs $0 $11,100 $11,100 $0 $0 $0
Temps B/C: 7924 0 73 73 0 0 0
To allocate funds for DTR 0 148 148 0 0 0
To bring up funds for MF CPC 0 4,413 4,413 0 0 0
To bring up Funds for SNAP B/C 0 714 714 0 714 714
To Schedule funds for Demo '15 0 143 143 0 0 0
To schedule funds for FSS prog 0 362 362 0 362 362
To Schedule lead grant 15 0 190 190 0 251 251
URA for CDBG-DR 0 2,600 2,600 0 0 0
Add Funding previously in 098 0 981 981 0 1,330 1,330
AEP PS & OTPS Efficiency (250) 0 (250) (317) 0 (317)
AfR Increase CDBG-DR 0 4,000 4,000 0 0 0
Bring Up Fund for Project Open House 0 259 259 0 0 0
Bring Up Funds for Section 8 0 338 338 0 0 0
Bring Up Section 8 Funds for PostA 0 332 332 0 0 0
Bring Up Section 8 Funds for 3 TEM 0 80 80 0 0 0
CDBG-DR B/C Consolidation Comp 0 (22,448) (22,448) 0 0 0
CDBG-DR MF Journal Needs 0 22,448 22,448 0 0 0
CDBG-DR PS Alignment 0 270 270 0 0 0
DTR PCs & Monitors Purchase 0 18 18 0 0 0
DTR Rent Increases 0 1 1 0 0 0
DTR Scanner Purchase 0 7 7 0 0 0
FY17 TL City Council Member Item Reallocation (40) 0 (40) 0 0 0
FY17 TL PS Accrual (300) 0 (300) 0 0 0
FY18 Departmental Estimate- S8 0 4,555 4,555 0 4,555 4,555
LINC Apartment Inspections 0 831 831 0 0 0
OER Jumpstart- One Flushing 0 250 250 0 0 0
Ps Adjustment 0 0 0 250 0 250
SNH Purchase Spider Phone 0 1 1 0 0 0
Studio City Stardom Hall 0 2,000 2,000 0 0 0
Take Down Funds from 7929 0 (80) (80) 0 0 0
Temps for Sect 8 0 80 80 0 0 0
The Brandon 0 2,500 2,500 0 0 0
To Bring Up Funds for B/C 7834 0 1,044 1,044 0 1,790 1,790
To Fund NTFP FSS Code 600 0 582 582 0 0 0
To Schedule Zombie Funds 0 49 49 0 146 146
Subtotal, Other Adjustments ($1,399) $64,779 $63,380 ($787) $26,195 $25,408
TOTAL, All Changes Prelim. 2018 $1,952 $64,779 $66,731 ($86) $26,195 $26,109
HPD Budget as of the Preliminary 2018 Plan $188,608 $1,150,072 $1,338,680 $116,080 $786,962 $903,042
New Needs - Exec. 2017
FY18 MWBE Program Expansion New Need $0 $0 $0 $172 $0 $172
NYC15 Rental Assistance Program New Need 0 0 0 247 0 247
PS Staffing New Need 0 0 0 172 0 172
Three-Quarter Housing New Need 0 0 0 7,463 0 7,463
TSD Consultant Swap 0 0 0 1,531 0 1,531
Underwriting Training 0 0 0 40 0 40
Subtotal, New Needs $0 $0 $0 $9,625 $0 $9,625
Other Adjustments - Exec. 2018
1R Chairs DTR $0 $13 13 $0 $0 0
AOTPS Adjustment 27 0 27 34 0 34
Bring Up Funds in Out Years 0 0 0 0 1,649 1,649
Bring Up Funds CDBG Roll 0 2,021 2,021 0 0 0
Bring Up Funds for HANS 0 470 470 0 0 0
Bring Up Funds for Zombie 0 3 3 0 55 55
CAMBA 7948 0 23 23 0 23 23
Demolition CD Funding 0 0 0 0 3,500 3,500

Finance Division Briefing Paper Department of Housing Preservation and Development
-15-
Dollars in Thousands
FY 2017 FY 2018
City Non-City Total City Non-City Total
DTR Chairs Purchase $0 $15 $15 $0 $0 $0
DTR Move 0 11 11 0 0 0
DTR yearly Leasing of Printers 0 33 33 0 0 0
EDC Reallocation (648) 0 (648) 648 0 648
Emergency Shelters-CD Funding 0 0 0 0 1,800 1,800
Fleet Optimization Savings 0 0 0 (55) 0 (55)
Fordham University Fellowship 0 20 20 0 20 20
Foreclosure Prevention Program Reallocation (100) 0 (100) 100 0 100
FSS Program 0 492 492 0 0 0
FUND B/C 7870-7874 0 3,281 3,281 0 3,281 3,281
FY17 IC Mod with HPD for SRS 0 456 456 0 0 0
FY17 IFA Surplus Adjustment 0 (3,200) (3,200) 0 0 0
FY17 Tl City Council Member Item Reallocation 70 0 70 0 0 0
FY17 Demolition Reallocation (1,000) 0 (1,000) 1,000 0 1,000
FY17 Three Quarter Housing Reallocation (1,000) 0 (1,000) 1,000 0 1,000
HDC & CPC Advance from 18 0 1,356 1,356 0 (1,356) (1,356)
Heat, Light and Power (51) 0 (51) 10 0 10
HPD 4H4 File Sharing 0 13 13 0 0 0
HPD WEP I/C Takedown 0 (60) (60) 0 (80) (80)
HRO Reallocation 0 24,442 24,442 0 21,631 21,631
IC W/ HPD RBA 0 125 125 0 0 0
Lease Adjustment 0 0 0 473 0 473
Lease Adjustment 0 0 0 0 (710) (710)
MAP II 0 48 48 0 0 0
NYCHA Budget Realignment 0 (47,216) (47,216) 0 34,347 34,347
NYCHA Façade Reallocation (2,277) 0 (2,277) 2,277 0 2,277
NYCHA Facades- CD Funded 0 0 0 0 59,415 59,415
PC & Monitors 0 45 45 0 0 0
PS Funding Swap 0 0 0 (540) 0 (540)
Roll Funds for CPC CDBG-DR 0 (6,747) (6,747) 0 6,747 6,747
Roll Funds for HDC CDBG-DR 0 36,437 36,437 0 3,563 3,563
Roll Funds for LISC CDBG-DR 0 (5,652) (5,652) 0 5,652 5,652
Schedule Funds for HSGP 0 22 22 0 100 100
Sect 8 B/C 7868-7951 0 40 40 0 40 40
Sect 8 Site Office Lease 0 186 186 0 0 0
Section 8 7824 0 0 0 0 55 55
Section 8 7924 0 0 0 0 1,984 1,984
Section 8 B/C 7826-7968 0 580 580 0 580 580
Section 8 DTR 7877-7974 0 1,297 1,297 0 1,297 1,297
Section 8 Temps 0 147 147 0 0 0
SPC Edith MacGuire Residence 0 185 185 0 185 185
Take Down Lead Demo 10 0 (323) (323) 0 (323) (323)
Take Down Fund in Out Years 0 0 0 0 (894) (894)
Take Down B/C 7870-7874 0 (3,111) (3,111) 0 (3,111) (3,111)
Take Down Funds in Out Years 0 0 0 0 (755) (755)
TBRA Apartment Inspections 0 350 350 0 0 0
To put funds for HPD MF 0 0 0 0 75,547 75,547
Uniform Relocation Act 100 0 100 0 0 0
Wage Adjustment 0 0 0 108 0 108
Subtotal, Other Adjustments ($4,879) $5,804 $925 $5,056 $214,243 $219,298
TOTAL, All Changes - Exec. 2018 ($4,879) $5,804 $925 $14,680 $214,243 $228,923
HPD Budget as of the Fiscal 2018 Executive Plan $183,729 $1,155,876 $1,339,604 $130,760 $1,001,205 $1,131,965
*Continuation from previous page