department of health november 2016 - national audit office · departmental overview 2015-16...
TRANSCRIPT

Departmental Overview 2015-16
Department of Health November 2016
The National Audit Office (NAO) scrutinises public spending for Parliament and is independent of government. The Comptroller and Auditor General (C&AG), Sir Amyas Morse KCB, is an Officer of the House of Commons and leads the NAO. The C&AG certifies the accounts of all government departments and many other public sector bodies. He has statutory authority to examine and report to Parliament on whether departments and the bodies they fund have used their resources efficiently, effectively, and with economy. Our studies evaluate the value for money of public spending, nationally and locally. Our recommendations and reports on good practice help government improve public services, and our work led to audited savings of £1.21 billion in 2015.
Design & Production by NAO External Relations DP Ref: 11236-001
© National Audit Office 2016
If you would like to know more about the National Audit Office’s work on the Department of Health, please contact:
Jenny George Value for Money Director, Department of Health
[email protected] 020 7798 7819
Mike Newbury Financial Audit Director, Department of Health
[email protected] 020 7798 5468
If you are interested in the NAO’s work and support for Parliament more widely, please contact:
[email protected] 020 7798 7665

2 Departmental Overview: Department of Health | © National Audit Office 2016 | DP Ref: 11236-001
Part One | Part Two | Part Three | Appendices |
Executive summary
This Departmental Overview looks at the Department of Health (the Department) and summarises its performance during the year ended March 2016, together with our recent reports on it. The content of the report has been shared with the Department to ensure that the evidence presented is factually accurate.
Part One – The Department: Structure, funding and performance
• The Department acts as steward to the health system, which has a complex delivery and accountability structure.
• There was no major change to the Department in 2015-16, but after 2015-16 it will be implementing a new operating model, which aims to reduce administrative spend of the core Department by about one-third during this Parliament.
• In 2015-16 the total Departmental budget was £149.5 billion. Of this, £118 billion was DEL spending (broadly, spending that the government argues can be controlled rather than driven by demand), the vast majority of which is incurred by healthcare commissioners and providers.
• The NHS received increased funding in the 2015 spending review to deliver its Five Year Forward View, which sets out a new direction for the service. The settlement assumes that the NHS will deliver £22 billion of efficiency savings.
• Demand for services and activity continued to grow in 2015-16, while performance against service standards came under strain.
Part Two – Findings: Financial audit and value-for-money work
• The Comptroller and Auditor General (C&AG) certified the Department accounts with an unqualified audit opinion.
• In the light of the financial and performance challenges facing the Department, he took the unusual step of producing a report on accounts. The report highlighted the specific steps the Department took to ensure it stayed within its voted budget and drew attention to the potential impact of the Department’s continued transfer of capital to revenue funding.
• Many of our value-for-money reports focus on financial and service sustainability, highlighting the challenges that central and local bodies have to meet. Governance and accountability mechanisms must also evolve to meet new developments in the sector. Our reports also cover users’ experiences of services, including the progress towards more integrated health and social care services.
Part Three – Looking ahead
• The Department continues to work towards implementing the Five Year Forward View, but achieving the level of efficiency savings it has promised to make will be difficult. There is a new planning approach for providers to deliver the Forward View, alongside increasing central intervention to secure financial and operational performance. Increasing devolution will change accountability and funding structures across health and social care.
• The vote to leave the European Union may also have implications for the health and social care sector, in the areas of staffing; access and charging for treatment; and regulations in areas such as working time or procurement and competition law.
Departmental Overview 2015-16 Department of Health

3 Departmental Overview: Department of Health | © National Audit Office 2016 | DP Ref: 11236-001
Part One | Part Two | Part Three | Appendices |About the Department and where it spends its money
The Department will be changing its operating model and reducing administrative spend by one-third by 2020
There was no major change to the Department in 2015-16, but since the end of 2015-16 there have been a number of changes:
• In May 2016 Chris Wormald (formerly Permanent Secretary at the Department for Education) took over from Dame Una O’Brien as Permanent Secretary.
• The Department is implementing a new operating model through its change programme (DH2020). The Department has completed its organisational design work, reducing administrative spend by around one-third over the course of the Parliament, and is currently implementing its new structures and ways of working.
• As part of DH2020, the Department announced a new, more streamlined senior structure (from 1 July 2016), amalgamating responsibilities and reducing the seven previous directorates to four.
Other major changes in the health sector in the same period included:
• Monitor, the NHS Trust Development Authority and a number of smaller bodies became a jointly led organisation, NHS Improvement, on 1 April 2016. NHS Improvement is responsible for overseeing foundation trusts and NHS trusts, as well as independent providers that provide NHS-funded care, and providing support and interventions where necessary.
• Most clinical commissioning groups (CCGs) took on greater responsibility for commissioning GP services as part of the co-commissioning agenda (previously NHS England commissioned such services nationally). This is part of plans to move towards better, joined-up health commissioning and more integrated care for patients.
• The Health and Social Care Information Centre, which provides information, data and IT systems across health and social care, changed its trading name to NHS Digital in April 2016.
Structure
Zoom In+
The Department of Health organisational structure
Permanent Secretary
Public Health and International Health
Felicity Harvey CBE
Global and Public Health
Clara Swinson
Community Care
Tamara Finkelstein
Acute Care and Workforce
Lee McDonough
Finance and Group Operations
David Williams
Chief Scientific Adviser
Chris Whitty
Social Care, Local Government & Care Partnerships
Jon Rouse
Innovation, Growth & Technology
Will Cavendish
External Relations (including workforce policy)
Charlie Massey
Group Operations
Tamara Finkelstein, Chief Operating Officer
Finance, Commercial & NHS
David Williams
Research & Development
Chris Whitty
Chief Scientific Adviser
Chris Whitty
Chief Medical Officer
Professor Dame Sally Davies DBE
Dame Una O’Brien(until April 2016)
Chris Wormald(from 4 May 2016)
As of 2015-16
As of November 2016
Structure Funding and accountability Performance indicatorsSpending Review 2015

4 Departmental Overview: Department of Health | © National Audit Office 2016 | DP Ref: 11236-001
Part One | Part Two | Part Three | Appendices |About the Department and where it spends its money
Funding and accountability
There is a complex accountability structure across the health sector
The diagram below outlines the Department’s main funding and accountability flows. It focuses substantially on funding flows directly to and from the Department and, therefore, does not reflect all intra-body funding. Local authorities, which are responsible for assessing care needs and commissioning or providing social care services, are also accountable to their local electorates.
Zoom In+
Parliament
NHS Digital
Gathers and analyses data and information
National Institute for Health and Care Excellence
Provides national guidance and advice to improve healthcare
Health Education England
Provides leadership and oversight of workforce planning, education and training
NHS Improvement
Supports and oversees NHS Trusts and NHS Foundation Trusts. Sector regulator for health services and responsible, with NHS England, for the payment system
Education providers
Local Healthwatch
NHS Trusts Non-NHS bodies
NHS Foundation Trusts
Primary care services
comprises GP services, dental practices, community pharmacies and high street optometrists.
Local education and training boards
Part of Health Education England. Responsible for the training and education of NHS staff within their region
Public Health England
Provides advice, research and public health campaigns
Care Quality Commission
Regulates health and social care providers
Healthwatch England
Promotes health users’ needs and concerns
Clinical commissioning groups
Plan and commission healthcare. Held to account by NHS England
Local authorities
Assess needs and commission social care / direct provision of some services
Department of Health
Overall funding/Accountable to Parliament for health and adult social care
Department for Communities and Local Government
Funding for local government, including social care. Accountable to Parliament for overall funding to local authorities
NHS England
Accountable to the Department for the outcomes achieved by the NHS
Responsible for the proper functioning of the commissioning system
Commissions specialised health services and primary care (jointly with clinical commissioning groups)
Health and wellbeing boards
Accountability
Funding
Structure Funding and accountability Performance indicatorsSpending Review 2015

5 Departmental Overview: Department of Health | © National Audit Office 2016 | DP Ref: 11236-001
Part One | Part Two | Part Three | Appendices |About the Department and where it spends its money
Funding and accountability continued
Structure Funding and accountability Performance indicatorsSpending Review 2015
The vast majority of Department funding is incurred by healthcare commissioners and providers
The Department is accountable to Parliament for the proper stewardship of the resources allocated to it. This includes ensuring that all the expenditure of the Department, its arm’s-length bodies and the NHS (including NHS Trusts and NHS Foundation Trusts) is contained within the overall budget. It must also provide assurance that the individual organisations within the system are performing effectively and have the necessary governance and controls to ensure regularity, propriety and value for money. The Department does not directly spend the vast majority of its funding, but instead provides funding to its arm’s-length bodies; those bodies are then responsible for the allocation of these resources as they determine how healthcare is provided. Most of NHS England’s funding is provided to CCGs, who are responsible for planning and implementing healthcare services for their individual local areas.
Note
1 Total budget in 2015-16 = £149.5 billion, of which £118 billion was Departmental Expenditure Limit (DEL) spending (see Report on Accounts on page 10 for more details about DEL).
Source: Data from Department of Health and NHS England annual report and accounts 2015-16
Other costs £1bn Prescribing and pharma
£2.6bn
Dental and opthalmic £3.8bn
GPs £5.3bn
Non-NHS bodies £1.1bn
NHS Trusts £5.2bn
£29bn£3.2bn
£19bn
£11bn
NHS Foundation Trusts £10.3bn
Other bodies (eg Monitor, Care Quality Commission) £8.2bnLocal authorities
£3.1bn
Public Health England £3.9bn
Health Education England £4.9bn
NHS Foundation Trusts
NHS Trusts
Non-NHS bodiesOther costs £2.1bn
Primary care services £2.5bn
Prescribing £8.6bn
Department of Health £118bn1
NHS England £101bn
CCGs £72bn
Specialised services are provided to patients who have rare conditions or who need a specialised team working together at a centre. There are currently 146 specialised services covering a diverse range of conditions including renal (kidney), specific mental health problems and rare cancers.
Primary care services comprise GP services, dental practices, community pharmacies and high street optometrists
Hospitals, mental health and community health services

6 Departmental Overview: Department of Health | © National Audit Office 2016 | DP Ref: 11236-001
Part One | Part Two | Part Three | Appendices |About the Department and where it spends its money
Spending Review 2015
Structure Funding and accountability Performance indicatorsSpending Review 2015
The NHS received increased funding to deliver its Five Year Forward View, but needs to deliver £22 billion of efficiency savings to achieve its goals.
As in the 2010 and 2013 spending reviews, health spending has been protected compared with most other areas of government spending. The 2015 Spending Review increased NHS funding (which makes up the vast majority of Department funding) by £19 billion from £101 billion in 2015-16 to £120bn by 2020-21 (see figure). The increase is front-loaded, with proportionately more
occurring at the start of the period. The government intends the Spending Review settlement to provide the basis for delivering the Five Year Forward View, including seven-day services, as well as other priorities such as new clinical strategies for cancer and mental health. The settlement assumes that NHS England will deliver £22 billion of efficiencies (see Future challenges on page 17 for more details).
The provision of health and social care services is closely linked and the Spending Review sets out ambitions for integrating health and social care across the country by 2020. The Better Care Fund, which provides funds for integrated services, will continue and, from 2017, includes specific funding for local government, rising to £1.5 billion by 2019-20. Local authorities can now set an additional 2% precept on council tax bills to raise new funding for adult social care. Commentators, such as the Association of Directors of Adult Social Services, have raised concerns about whether this level of funding is sufficient to cover current commitments, given policies such as the introduction of the new National Living Wage, continuing reductions in central government support to local authorities and that some funding does not start until 2017.
Zoom In+
Total Departmental Expenditure Limits for NHS
Proposed NHS funding (£bn)
Source: 2015 Spending Review
2014-15 2015-16 2016-17 2017-1880
85
90
95
100
130
105
110
115
120
125
2018-19 2019-20 2020-21
98
101
107
110
113
116
120
Proposed NHS TDEL fundingActual NHS TDEL funding
NHS Five Year Forward View
In October 2014, the NHS published its Five Year Forward View, which sets out a new direction for the service. Its three priorities are: an upgrade in prevention and public health; greater control for patients over their own care; and removing barriers in how health and social care is provided. The Five Year Forward View envisages a range of different care models, with local areas encouraged to choose from a small number of new approaches to providing care. These new models focus on integrating services and moving care out of hospital where appropriate.

7 Departmental Overview: Department of Health | © National Audit Office 2016 | DP Ref: 11236-001
Part One | Part Two | Part Three | Appendices |About the Department and where it spends its money
Performance indicators
Structure Funding and accountability Performance indicatorsSpending Review 2015
Service standards came under strain in 2015-16 as demand for services rose.
In 2015-16 demand for services and levels of activity continued to rise. Performance on a wide range of service indicators – including some highlighted below, cancer referral to treatment times and ambulance response times – fell below national standards. In addition, the Department and NHS England introduced new access and waiting time standards for mental health services from April 2015.
Patients in England waiting more than four hours in A&E, 2011-12 to 2015-16
The national performance for A&E waiting times in 2015-16 fell short of the 95% standard in every quarter.
Avoidable mortality in England, 2004 to 2014
The number of deaths per 100,000 from causes considered avoidable has fallen since 2004, with levels steady since 2012.
Patients waiting to start consultant-led treatment for non-urgent conditions within 18 weeks of referral (RTT), April 2012 to August 2016
In every month between March and August 2016, NHS England missed its standard that 92% of patients waiting to start treatment should have waited no more than 18 weeks, reflecting the declining trend in performance since 2013.
Bed days lost in England from delayed transfers of care from acute settings, 2011-12 to 2015-16
There has been a steady increase in bed days lost while people are waiting to be transferred from hospital to other care settings.
Zoom In+
Avoidable mortality in England, 2004 to 2014
Avoidable deaths per 100,000 people
Source: Data from NHS England, NHS Digital and Office for National Statistics
2004 2005 2006 2007 2008 2009 2010 2011 2012 2013 20140
50
100
150
200
250
300
282 274264 255 252
241234
225 218 219 219
Zoom In+
Percentage of A&E patients treated, discharged or admitted within 4 hours of arrival and total attendances
Patients treated (%) Total attendances (m)
Source: Data from NHS England, NHS Digital and Office for National Statistics
80
85
90
95
100 6.0
5.6
5.4
5.2
5.0
5.8
1 2
2012-13 2013-14 2014-15 2015-16
3 4 1 2 3 4 1 2 3 4 1 2 3 4
Standard
Percentage of patients treated Total attendances
Zoom In+
Percentage of patients waiting to start consultant-led treatment for non-urgent conditions waiting less than 18 weeks for treatment from date of referral
Patients (%)
Source: Data from NHS England, NHS Digital and Office for National Statistics
88
92
91
90
89
93
94
95
96
Apr 2012
Jun 2012
Aug 2012
Oct 2012
Oct 2013
Dec 2013
Dec 2012
Apr 2014
Jun 2014
Aug 2014
Oct 2014
Dec 2014
Feb 2013
Feb 2014
Apr 2015
Jun 2015
Aug 2015
Oct 2015
Dec 2015
Feb 2015
Apr 2016
Jun 2016
Aug 2016
Feb 2016
Apr 2013
Jun 2013
Aug 2013
Standard
Zoom In+
Bed days lost in England from delayed transfers of care from acute settings, 2011-12 to 2015-16
Bed days (000)
Source: Data from NHS England, NHS Digital and Office for National Statistics
2011-12 2012-13 2013-14 2014-150
200
400
600
800
1,200
1,000
2015-16
766833
887
1,075
1,181

8 Departmental Overview: Department of Health | © National Audit Office 2016 | DP Ref: 11236-001
Part One | Part Two | Part Three | Appendices |Findings from our work on the Department
Our audit of the Department’s 2015-16 annual report and accounts
The C&AG gave an unqualified opinion on the accounts, but highlighted a number of issues for attention.
The C&AG certified the Department of Health’s Accounts on 12 July 2016, with an unqualified opinion (that is, the financial statements give a true and fair view, in all material respects, in accordance with the identified financial reporting framework). The accounts cover the Department’s arm’s-length bodies (including NHS England and its CCGs), NHS providers and other delivery partners and health bodies (see Appendix One).1
Emphasis of matter
As in previous accounts, the C&AG wrote an Emphasis of Matter paragraph to highlight the uncertainties over the value of the liability recorded for the Clinical Negligence Scheme for Trusts, particularly for incidents incurred but not yet reported. He also drew attention to the fact that significant changes could occur to the value of this liability if assumptions about factors which affect the value of this liability – for example, the HM Treasury discount rate used in the valuation or the severity and frequency of legal claims – do not hold.
Report on accounts
2015-16 has been a challenging year financially for the Department, with a large number of trusts reporting a deficit. Given the scale of the financial and performance challenges facing the Department, the C&AG took the unusual step of producing a report on the accounts. The report provides more details of the Department’s financial situation, and the specific steps it took to ensure it stayed within its voted budget. The following pages summarise the report.
The accounts highlighted a number of key governance issues:
Financial risk and sustainability – NHS providers continued to face significant financial challenges and the Department led a number of actions to tackle these – see links for more details.
Fraud – the Department is leading work to coordinate the development and delivery of anti-fraud work across the Health Group. It is still developing a sector-wide view on the level of fraud throughout the health system. The forthcoming 2016 to 2020 Health Group Anti-Fraud Strategic Plan will determine the priorities for counter-fraud work from April 2016.
Data issues – There were two issues in 2015-16. First, NHS Shared Business Service, who provided primary care support services to NHS England in several areas, reported a large backlog of unprocessed correspondence relating to patients. A national incident team is managing the incident to ensure that all correspondence and patient-related issues are dealt with. NHS England will carry out an internal review.
Second, the Medicines and Healthcare products Regulatory Agency coordinated an investigation into an error in an online tool used by GPs to assess the potential risk of cardiovascular disease in patients. The Department received clinical advice that indicated that the population-level risk to patients is small; it asked GPs to contact individual patients to determine if any further action is necessary.
Core performance standards – performance against all operational standards was challenging, with a number of targets missed – see more detail here.
1 With the exception of the Medicines and Healthcare products Regulatory Agency, and NHS Blood and Transplant, which are designated as outside the Departmental Group under the Office for National Statistics categorisation.
Our audit of the Department’s 2015-16 Annual report and accounts Report on accounts Findings from our value-for-money work

9 Departmental Overview: Department of Health | © National Audit Office 2016 | DP Ref: 11236-001
Part One | Part Two | Part Three | Appendices |Findings from our work on the Department
Report on accounts
The Department and its partners are still some way from implementing a plan to put the NHS’s finances on a sustainable footing.
In 2015-16 the Department exceeded its total budget by £207 million, but kept within the voted budgets set by Parliament for revenue (RDEL) and capital (CDEL) – see below for an explanation. For RDEL, the Department kept within its budget by £210 million, out of a total budget of £114.7 billion. For CDEL, the Department kept within budget by £58 million, out of a total budget of £3.6 billion. The margins by which the Department met its budgets were greater than last year when RDEL was achieved by some £1.2 million, but these margins nevertheless remain wafer-thin in the context of overall health spending in England.
The Department received an extra £417 million of receipts from the National Insurance Fund, more than originally anticipated. The Department did not notify HM Treasury of these extra receipts that it received from HM Revenue & Customs. Therefore, neither HM Treasury nor Parliament had the opportunity to consider whether to reduce any voted funding for the Department by an equal and opposite amount. Without these extra receipts, the Department would have exceeded its voted RDEL.
The failure to follow well-established practice in relation to these National Insurance receipts has been ascribed by the Department to an administrative error. HM Treasury has chosen not to impose fines on the Department due to this overspend against its budgetary controls.
Trends in RDEL: saving or excess in spending against budget
£ billion
2011-12
Saving
Excess
2012-13 2013-14 2014-15 2015-16-1.0
-0.5
0
0.5
1.0
2.0
3.0
3.5
2.5
1.5
RDEL voted RDEL non-voted
0.9
2.9
0.3 0.2
-0.4-0.03
Source: National Audit Office analysis of Department of Health annual accounts data
Explaining RDEL and CDEL
The Departmental Expenditure Limit, or DEL, is the budget allocated to a department: spending that the government argues can be controlled rather than driven by demand (the latter is covered by Annually Managed Expenditure). DEL funding is made up of RDEL – resource spending on day-to-day resources and administration costs, and CDEL – capital spending on investment. The Department’s RDEL budget comprises both voted and non-voted amounts: Parliament votes on around 80% of this. The non-voted remainder comprises income from the National Insurance fund. If the Department exceeds its voted amount, the C&AG must qualify his opinion on the accounts due to an ‘excess vote’. A breach of the non-voted amount does not result in a qualified opinion – but does still have implications for how the Department is managing its budget.
Our audit of the Department’s 2015-16 Annual report and accounts Report on accounts Findings from our value-for-money work

10 Departmental Overview: Department of Health | © National Audit Office 2016 | DP Ref: 11236-001
Part One | Part Two | Part Three | Appendices |Findings from our work on the Department
Report on accounts continued
Our audit of the Department’s 2015-16 Annual report and accounts Report on accounts Findings from our value-for-money work
The Department took a range of actions, including making non-recurring savings, to stay within budget
• The Department took a range of actions to manage its position in 2015-16 and address the growing deficit in NHS providers. While these are technically justifiable, they would not be at the core of a credible plan to secure the financial sustainability of the NHS in England. Some of these measures could have long-term consequences. The switching of £950 million from capital to revenue budgets means that long-term investment plans have been set aside for the short-term goal of meeting day-to-day spending.
• Local NHS trusts ended the year with a combined deficit of £2.45 billion (NHS Foundation Trusts with £1.1 billion and NHS Trusts with £1.35 billion). All types of provider are experiencing growing demand coupled with rising costs.
• NHS England recorded an underspend of £599 million, which contributed significantly to the Department’s overall position. However, the major factors in NHS England’s underspend were non-recurrent. Opportunities for underspends in 2016-17 are further limited by NHS England having to maximise the funding available for front-line services and primary care transformation in what is expected to be a year of exceptional challenge for the NHS.

11 Departmental Overview: Department of Health | © National Audit Office 2016 | DP Ref: 11236-001
Part One | Part Two | Part Three | Appendices |Findings from our work on the Department
Zoom In+
Findings from our value-for-money work
Our audit of the Department’s 2015-16 Annual report and accounts Report on accounts Findings from our value-for-money work
We consider the main challenges for the Department and other health sector bodies to be about securing financial and service sustainability, and about how well the accountability and regulation mechanisms work in a complex, devolved system.
Many of our reports focus on financial and service sustainability, highlighting the challenges that central and local bodies have to meet.
Sustainability and financial performance of acute hospital trusts (December 2015)
Acute trusts’ financial performance has deteriorated sharply and is forecast to worsen. These trends are not sustainable. Measures taken by the Department, NHS England, Monitor and the NHS Trust Development Authority to help improve financial performance have been undermined by a turbulent planning period. Effective oversight will become harder if the number of trusts in financial distress rises further.
Running a deficit seems to be becoming normal practice for acute trusts with the risk that poor financial performance is not taken as seriously as poor healthcare provision. While increased funding for the NHS could help to achieve financial balance, there needs to be a more holistic, coordinated approach to tackling trusts’ persistent financial problems beyond quick fixes to cut trusts’ spending.
Surplus/deficit of NHS Trusts and NHS Foundation Trusts, 2010-11to 2015-16, and forecast for 2016-17
£ million
Notes
1 The 2016-17 forecast figure is taken from NHS Improvement, Quarter 1 sector performance report, May 2016.
2 The 2014-15 balance is different from that reported in our December 2015 report Sustainability and financial performance of acute hospital trusts. Doncaster and Bassetlaw Hospitals NHS Foundation Trust restated its 2014-15 position during 2015-16 (see paragraph 7, Appendix Three).
Source: National Audit Office analysis of trusts' financial data, and 2016-17 forecast data from NHS Improvement
Actual
Forecast
513 483592
-91
-859
-2,447
-644
-3,000
-2,500
-2,000
-1,500
-1,000
-500
0
500
1,000
2010-11 2011-12 2012-13 2013-14 2014-15 2015-16 2016-17(forecast)
12 Departmental Overview: Department of Health | © National Audit Office 2016 | DP Ref: 11236-001
Part One | Part Two | Part Three | Appendices |Findings from our work on the Department
Findings from our value-for-money work continued
Our audit of the Department’s 2015-16 Annual report and accounts Report on accounts Findings from our value-for-money work
Many of our reports focus on financial and service sustainability, highlighting the challenges that central and local bodies have to meet.
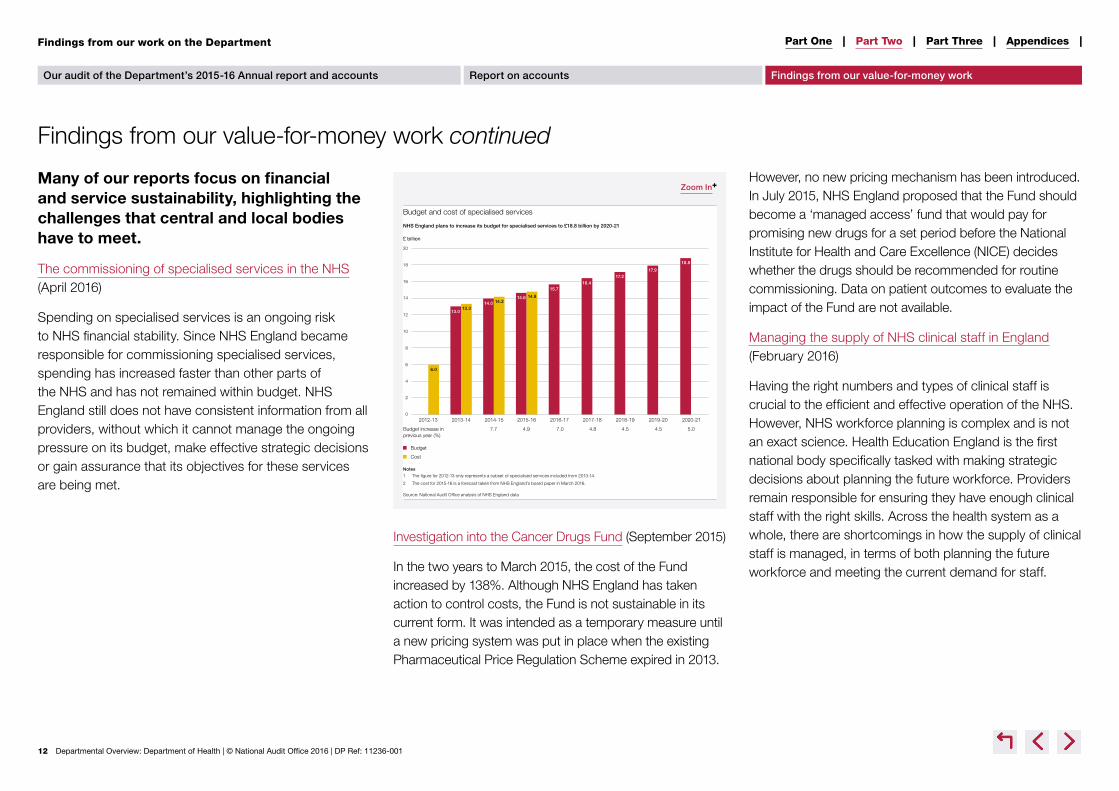
The commissioning of specialised services in the NHS (April 2016)
Spending on specialised services is an ongoing risk to NHS financial stability. Since NHS England became responsible for commissioning specialised services, spending has increased faster than other parts of the NHS and has not remained within budget. NHS England still does not have consistent information from all providers, without which it cannot manage the ongoing pressure on its budget, make effective strategic decisions or gain assurance that its objectives for these services are being met.
Investigation into the Cancer Drugs Fund (September 2015)
In the two years to March 2015, the cost of the Fund increased by 138%. Although NHS England has taken action to control costs, the Fund is not sustainable in its current form. It was intended as a temporary measure until a new pricing system was put in place when the existing Pharmaceutical Price Regulation Scheme expired in 2013.
However, no new pricing mechanism has been introduced. In July 2015, NHS England proposed that the Fund should become a ‘managed access’ fund that would pay for promising new drugs for a set period before the National Institute for Health and Care Excellence (NICE) decides whether the drugs should be recommended for routine commissioning. Data on patient outcomes to evaluate the impact of the Fund are not available.
Managing the supply of NHS clinical staff in England (February 2016)
Having the right numbers and types of clinical staff is crucial to the efficient and effective operation of the NHS. However, NHS workforce planning is complex and is not an exact science. Health Education England is the first national body specifically tasked with making strategic decisions about planning the future workforce. Providers remain responsible for ensuring they have enough clinical staff with the right skills. Across the health system as a whole, there are shortcomings in how the supply of clinical staff is managed, in terms of both planning the future workforce and meeting the current demand for staff.
Zoom In+
Budget and cost of specialised services
£ billion
NHS England plans to increase its budget for specialised services to £18.8 billion by 2020-21
Notes
1 The figure for 2012-13 only represents a subset of specialised services included from 2013-14.
2 The cost for 2015-16 is a forecast taken from NHS England’s board paper in March 2016.
Source: National Audit Office analysis of NHS England data
Budget
Cost
0
2
4
6
8
10
12
14
16
18
20
2012-13 2013-14 2014-15 2015-16 2016-17 2017-18 2018-19 2019-20 2020-21
Budget increase in 7.7 4.9 7.0 4.8 4.5 4.5 5.0previous year (%)
18.8
17.917.2
16.415.7
14.6 14.814.214.0
13.313.0
6.0

13 Departmental Overview: Department of Health | © National Audit Office 2016 | DP Ref: 11236-001
Part One | Part Two | Part Three | Appendices |Findings from our work on the Department
Findings from our value-for-money work continued
Our audit of the Department’s 2015-16 Annual report and accounts Report on accounts Findings from our value-for-money work
Governance and accountability mechanisms must evolve to meet new developments in the health sector
Care Quality Commission (CQC) – Capacity and capability to regulate the quality and safety of health and adult social care (July 2015)
The CQC has made substantial progress to change its regulatory model. It is developing a more intelligence-driven approach to regulation and has designed a model that sets out in principle the connections between resources, activities, outputs and outcomes. It is better able to estimate how much inspections and other regulatory activities cost. However, it has much more limited information for assessing efficiency or effectiveness, or measuring its overall impact on the quality of care.
The CQC has a substantial challenge to recruit and train all the staff it needs and to give them the confidence, as well as the skills, to apply the regulatory model. It also needs more complete data about regulated bodies, particularly in the adult social care sector, and better quantified indicators of its own performance. Managing public expectations about how far and fast it can achieve this, at the same time as it takes on new responsibilities, is a substantial demand.
but ultimately an unsuccessful venture, which failed for financial reasons which could, and should, have been foreseen. It had the strong potential to join together all bodies in the local health economy and to deliver better patient care. However, limited oversight and a lack of commercial expertise led to problems that quickly became insurmountable.
Managing conflicts of interest in NHS clinical commissioning groups (September 2015)
The Department recognised the potential for conflicts of interest in the new system for NHS commissioning, and the need for public confidence that conflicts are dealt with appropriately. It took a proportionate response to the high potential risk. Our limited evidence suggests that in 2014-15 CCGs generally had arrangements for managing conflicts of interest. NHS England has so far, however, collected little data centrally on how effectively CCGs are managing conflicts. It has relied instead on an exception-based assurance process, and on Monitor as the system regulator. Developments in the health service, in particular new arrangements for co-commissioning primary care services, are likely to significantly increase the number and scale of conflicts of interest.
Investigation into the collapse of the UnitingCare Partnership contract (July 2016)
In December 2015 a five-year contract, worth around £800 million, between UnitingCare Partnership and Cambridgeshire and Peterborough CCG collapsed after only eight months because it ran into financial difficulties. The contract was innovative and ambitious
Zoom In+
Oversight and regulatory landscape for UnitingCare Partnership
Cambridge University Hospitals NHS Foundation Trust
Member of UnitingCare Partnership’s consortium, and provider of UnitingCare Partnership services
Cambridgeshire and Peterborough NHS Foundation Trust
Member of UnitingCare Partnership’s consortium, and provider of UnitingCare Partnership services
Department of Health NHS England
UnitingCare Partnership must abide by the Limited Liability Partnerships Act 2000, and Companies Act 2006
Cambridgeshire and Peterborough clinical commissioning group
UnitingCare Partnership LLP
Note
1 Since 1 April 2016, Monitor has been part of NHS Improvement.
Source: National Audit Offi ce
NHS Improvement
(from April 2016)
NHS Trust Development Authority
NHS Trust regulator
Monitor
NHS Foundation Trust regulator
Regulatory/oversight role
Limited liability partnership agreement
Oversight of local commissioners
Older people’s and adult community services contract
Provider regulation and risk assessment

14 Departmental Overview: Department of Health | © National Audit Office 2016 | DP Ref: 11236-001
Part One | Part Two | Part Three | Appendices |Findings from our work on the Department
Findings from our value-for-money work continued
Our audit of the Department’s 2015-16 Annual report and accounts Report on accounts Findings from our value-for-money work
Our reports also cover users’ experiences of services, including progress towards more integrated health and social care services
Services for people with neurological conditions: progress review (July 2015)
Overall, progress against the Committee’s six recommendations has been mixed. Considerable further work is therefore needed to implement the recommendations in full and achieve the better services and outcomes for people with neurological conditions. For example, recent survey evidence indicates that only a small proportion of people with a long-term neurological problem have a written care plan. In the GP patient survey published in January 2015, 65% of people with a neurological problem said they definitely, or to some extent, had enough support from local services. This was less positive than for people with long-term conditions more broadly.
Discharging older patients from hospital (May 2016)
Making sure older patients stay in hospital no longer than necessary requires a coordinated response across health and social care organisations. Unnecessary stays in hospital result in worse health outcomes for patients and waste NHS hospital resources. The number of delayed transfers is increasing at an alarming rate but does not
capture the full extent of older people who should not be in hospital. While there is a clear awareness of the need to discharge older people from hospital sooner, there are far too many older people in hospitals who do not need to be there, at an estimated cost to the NHS of around £820 million. Without radical action to improve local practice and remove national barriers, this problem will get worse.
Personalised commissioning in adult social care (March 2016)
Local authorities across England report a wide range in the proportion of users taking up personal budgets, including direct payments. Recent evidence suggests
that personal budgets benefit most, but not all, users and that the way a personal budget is implemented is key to whether users benefit from it. Some local authorities are constrained in how, and the extent to which, they can personalise care by the need to reduce overall spending. It is not clear whether local authorities will achieve the spending reductions they have forecast without putting user outcomes at risk. Some local authorities are struggling to manage and support their local care markets as well as we would expect of a well-functioning public service market. Authorities are taking different approaches to implementing personal budgets; some are struggling to find workable approaches.
Stocktake of access to general practice in England (November 2015)
While people’s experience of accessing general practice remains positive, patient satisfaction with access has declined gradually. There is considerable variation in patient experience. If patients cannot access general practice they are more likely to suffer poorer health outcomes, or to use other, more expensive, NHS services such as A&E departments.
The Department and NHS England are working to improve access but do not fully understand the demand for services or the capacity of the current system and need better data to make well-informed decisions about how to use limited resources to best effect.
Zoom In+
0
20
40
60
80
100
120
140
160
200
180
Trends in delayed transfers of care statistics: bed days delayed
Source: National Audit Office analysis of delayed transfers of care statistics published by NHS England
Delayed days (000)
Aug Nov Feb May Aug Nov Feb May Aug Nov Feb May Aug Nov Feb May Aug Nov Feb May Aug May AugNov Feb
2010 2011 2012 2013 2014 2015 2016
Total: number of people delayed
Total: 12-month moving average
Acute only: number of delayed days
Acute only: 12-month moving average
15 Departmental Overview: Department of Health | © National Audit Office 2016 | DP Ref: 11236-001
Part One | Part Two | Part Three | Appendices |Findings from our work on the Department
Findings from our value-for-money work continued
Our audit of the Department’s 2015-16 Annual report and accounts Report on accounts Findings from our value-for-money work
Our reports also cover users’ experiences of services, including progress towards more integrated health and social care services
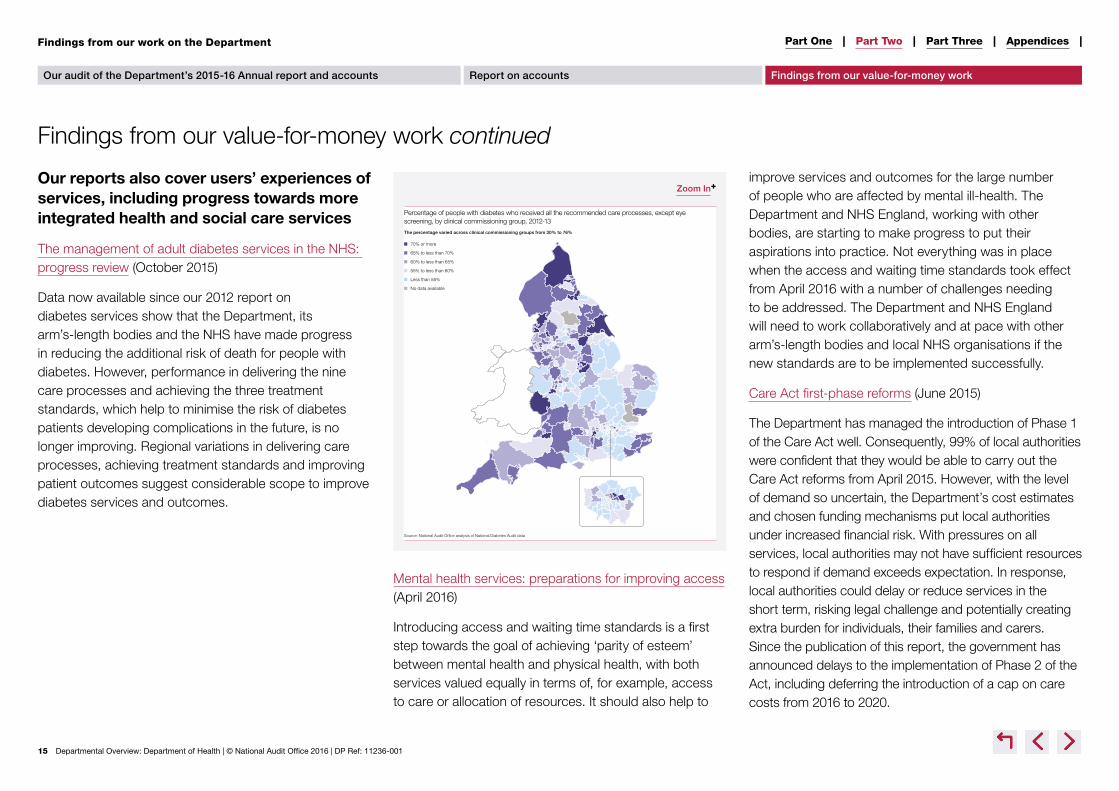
The management of adult diabetes services in the NHS: progress review (October 2015)
Data now available since our 2012 report on diabetes services show that the Department, its arm’s-length bodies and the NHS have made progress in reducing the additional risk of death for people with diabetes. However, performance in delivering the nine care processes and achieving the three treatment standards, which help to minimise the risk of diabetes patients developing complications in the future, is no longer improving. Regional variations in delivering care processes, achieving treatment standards and improving patient outcomes suggest considerable scope to improve diabetes services and outcomes.
Mental health services: preparations for improving access (April 2016)
Introducing access and waiting time standards is a first step towards the goal of achieving ‘parity of esteem’ between mental health and physical health, with both services valued equally in terms of, for example, access to care or allocation of resources. It should also help to
improve services and outcomes for the large number of people who are affected by mental ill-health. The Department and NHS England, working with other bodies, are starting to make progress to put their aspirations into practice. Not everything was in place when the access and waiting time standards took effect from April 2016 with a number of challenges needing to be addressed. The Department and NHS England will need to work collaboratively and at pace with other arm’s-length bodies and local NHS organisations if the new standards are to be implemented successfully.
Care Act first-phase reforms (June 2015)
The Department has managed the introduction of Phase 1 of the Care Act well. Consequently, 99% of local authorities were confident that they would be able to carry out the Care Act reforms from April 2015. However, with the level of demand so uncertain, the Department’s cost estimates and chosen funding mechanisms put local authorities under increased financial risk. With pressures on all services, local authorities may not have sufficient resources to respond if demand exceeds expectation. In response, local authorities could delay or reduce services in the short term, risking legal challenge and potentially creating extra burden for individuals, their families and carers. Since the publication of this report, the government has announced delays to the implementation of Phase 2 of the Act, including deferring the introduction of a cap on care costs from 2016 to 2020.
Zoom In+
Percentage of people with diabetes who received all the recommended care processes, except eye screening, by clinical commissioning group, 2012-13
The percentage varied across clinical commissioning groups from 30% to 76%
Source: National Audit Offi ce analysis of National Diabetes Audit data
70% or more
65% to less than 70%
60% to less than 65%
55% to less than 60%
Less than 55%
No data available

16 Departmental Overview: Department of Health | © National Audit Office 2016 | DP Ref: 11236-001
Part One | Part Two | Part Three | Appendices |Analysis of the Department’s major developments for the year ahead
Demand for health and care services, driven by demographic trends and rising quality expectations, is increasing. The financial climate remains extremely challenging, with ongoing pressures on maintaining service standards. The fragility of the social care market, a concern in itself, may also impact more on wider health services. There is the need for radical transformation in how services are delivered, such as greater integration of services.
Future challenges
The Shared Delivery Plan sets out the priorities for the Department and its arm’s-length bodies for 2015–2020.
There is a new local planning approach to deliver the Five Year Forward View.
Out-of-hospital care (including primary care, mental health services and funding for social care)
Safety and quality of services (including roll-out of ‘seven-day’ services, inspection and ratings)
Maintaining and improving financial and operational performance (including Sustainability and Transformation Plans and implementing recommendations from Lord Carter’s Review)
Efficiency and productivity (including controls on agency spending; recovery of income from overseas visitors)
Clinical research and innovation (including use of cost-effective medicines)
Workforce (including planning, staffing levels and deployment)
Delivering central efficiencies (including DH2020)
Public health (including obesity; long-term and treatable conditions; diabetes prevention; dementia care)
Patient and community engagement (including access to information and services; design of services; feedback)
Digital technology, information and transparency
Sustainability and transformation plans (STPs)
• In December 2015, NHS England outlined a new approach to planning, in order to deliver the Five Year Forward View.
• Every health and care system in England must produce a five-year STP, setting out how local services will develop and become sustainable.
• There are 44 STP ‘footprints’, representing groups of local authorities and healthcare providers, each of which will develop plans tailored according to local needs (see figure).
• The original deadline of June 2016 for submitting plans was delayed to October 2016.
• The planning round has altered to support the implementation of STPs. The 2017–19 guidance covers a two-year period, rather than a one-year period. It reiterates the achievement of STP milestones as one of nine priority areas for providers.
Future challenges
Zoom In+

17 Departmental Overview: Department of Health | © National Audit Office 2016 | DP Ref: 11236-001
Part One | Part Two | Part Three | Appendices |Analysis of the Department’s major developments for the year ahead
Future challenges continued
Bridging the funding gap will be challenging
The NHS has set out that, alongside addressing demand and efficiency savings, it would need additional funding to sustain services. It calculated that a combination of growing demand and flat real-terms funding would leave a funding gap of nearly £30 billion by 2020-21 if no more efficiencies were made. The 2015 Spending Review, which increased real-terms funding for the NHS, assumed it could achieve efficiency savings of £22 billion between 2014-15 and 2020-21.
Of the £22 billion, the NHS expects £14.9 billion of savings to come from local providers (see figure). This includes £8.6 billion of savings from productivity improvements, equating to a 2% improvement each year across hospitals, community health and mental health services. This will be challenging given that long-run gains are around 0.8% per year.
NHS England set out five tests it would use to assess the Spending Review settlement, in terms of implementing the Forward View. It concluded the settlement broadly met three of these, including a front-loaded increase, but it did not fully meet its tests for an improvement in preventative health and increased funding for social care.
There is increasing central intervention to secure financial and operational performance
In July 2016, NHS England and NHS Improvement published a joint plan to ‘reset’ the financial position of providers and commissioners. This follows other interventions by these bodies, such as caps on agency spending. The plan extends many interventions to CCGs for the first time.
The plan includes additional funding of £1.8 billion to trusts, with the aim that the overall financial position of providers is in balance at the start of 2017-18. It also includes:
• agreed financial control totals for 2016-17, representing minimum levels of financial performance, and for which individual trusts and CCGs are directly accountable;
• a new system of incentives linked to agreed performance improvement trajectories, replacing national fines, which are set individually for each trust;
• new special measures regimes for trusts and CCGs not meeting their financial commitments; and
• published performance ratings for CCGs.
Zoom In+
Breakdown of Department’s £22 billion efficiency programme as at May 2016
Source: NHS England, NHS Five Year Forward View Recap Briefing for the Health Select Committee
Local − productivity improvements £8.6bn
National savings − including pay restraint £6.7bn
Local − interventions to address growth in activity £4.3bn
Local − savings already secured £1bn
Local − other efficiencies £1bn
Zoom In+
The ‘reset’ plan includes headline assessments of CCGs against five elements: leadership, planning, finance, performance and delegated functions
Source: NHS England and NHS Improvement, Strengthening Financial Performance & Accountability in 2016-17, 21 July 2016
Requiresimprovement 91
Good 82
Inadequate 26
Outstanding 10
Future challenges

18 Departmental Overview: Department of Health | © National Audit Office 2016 | DP Ref: 11236-001
Part One | Part Two | Part Three | Appendices |Analysis of the Department’s major developments for the year ahead
Future challenges continued
Future challenges
Increasing devolution will change accountability and funding structures across health and social care
Most NHS, public health and social care commissioning is already devolved to local organisations. Recent reforms have meant that NHS England, CCGs and local authorities are responsible for local budgets.
Devolution of powers and funds from central government to local government has emerged as one of this government’s flagship policies. To date, 10 devolution deals have been secured in England. Greater Manchester is one example of devolution of health and social care.
The Cities and Local Government Devolution Act received Royal Assent in January 2016. It is a broad piece of enabling legislation designed to be applied across a wide range of public service functions.
Devolution could provide further opportunities to integrate services linking with initiatives including: the Better Care Fund; Integration Pioneers; Five Year Forward View New Models of Care / Vanguards; and co-commissioning of primary medical care.
Brexit may have implications for the health and social care sectors
There are a number of issues that the Department and NHS England may need to plan for as Brexit negotiations move forward. Three key areas are:
Staffing: The NAO report on workforce planning (February 2016) showed the significant shortfall in staff across the NHS, the largest (7.2%) in the nursing, midwifery
and health visiting staff group. Recruitment from countries within the European Economic Area (EEA) has been an increasingly important source of clinical staff for the NHS. Estimates indicate that approximately 4% of NHS staff and 6% of adult social care staff come from other EU countries.
Recovering the cost of NHS treatment for overseas visitors: Our report (October 2016) noted that the UK leaving the European Union (EU) will potentially have implications for the nature and scope of future charging arrangements, including any changes to legislation that has operated within an EU legal framework. At present, the UK’s membership of the EEA, by virtue of being part of the EU, means visitors from the EEA who are insured by their country of residence’s state healthcare system are not charged directly for treatment they receive in the UK, and vice versa.
Regulations: A number of EU regulations have a significant impact on the NHS and social care sectors including: the working time directive; procurement and competition law; and regulation of medicines and medical devices.
Greater Manchester
HM Treasury agreed a landmark deal in November 2014 with Greater Manchester Combined Authority (GMCA) and Greater Manchester CCGs invited to develop a business plan for the integration of health and social care. In July 2015 the agreement was expanded with NHS England and Greater Manchester signing an agreement to bring together £6 billion of NHS and social care budgets to jointly plan these services. The deal covers 2.8 million residents and includes 12 CCGs. The region took formal control on 1 April 2016.

19 Departmental Overview: Department of Health | © National Audit Office 2016 | DP Ref: 11236-001
Part One | Part Two | Part Three | Appendices |
Department of Health agencies and arm’s-length bodies
Executive agencies
• Public Health England
• Medicines and Healthcare products Regulatory Agency
Executive non-departmental public bodies
• NHS England
• Monitor1
• Care Quality Commission
• National Institute for Health and Care Excellence
• Health and Social Care Information Centre2
• Human Fertlisation and Embryology Authority
• Human Tissue Authority
• Health Research Authority
• Health Education England
Special health authorities
• NHS Trust Development Authority1
• NHS Business Services Authority
• NHS Litigation Authority
Other bodies
• NHS Property Services
• NHS Blood and Transplant
• Genomics England
• The Skipton Fund
• Community Health Partnerships
Note
1 Monitor, the NHS Trust Development Authority and a number of smaller bodies became a jointly led organisation, NHS Improvement, on 1 April 2016.
2 The Health and Social Care Information Centre changed its trading name to NHS Digital in April 2016.
Appendix One