financial ombudsman service efficient handling of ... · the national audit office scrutinises...
TRANSCRIPT

Financial Ombudsman Service
Efficient handling of financial services complaints
REPORT BY THE COMPTROLLER AND AUDITOR GENERAL
12 JANUARY 2012

The National Audit Office scrutinises public spending on behalf
of Parliament. The Comptroller and Auditor General, Amyas Morse,
is an Officer of the House of Commons. He is the head of the NAO,
which employs some 880 staff. He and the NAO are totally independent
of government. He certifies the accounts of all government departments
and a wide range of other public sector bodies; and he has statutory
authority to report to Parliament on the economy, efficiency and
effectiveness with which departments and other bodies have used their
resources. Our work led to savings and other efficiency gains worth
more than £1 billion in 2010-11.
Our vision is to help the nation spend wisely.
We apply the unique perspective of public audit to help Parliament and government drive lasting improvement in public services.

Financial Ombudsman Service
Efficient handling of financial services complaints

© National Audit Office 2012
The text of this document may be reproduced free of charge in any format or medium providing that it is reproduced accurately and not in a misleading context.
The material must be acknowledged as National Audit Office copyright and the document title specified. Where third party material has been identified, permission from the respective copyright holder must be sought.
Contents
Key facts 4
Scope of this review 5
Part One The changing nature of financial services complaints 11
Part TwoIdentifying, monitoring, and understanding efficiency challenges 20
Part ThreeManaging the change programme to improve efficiency 30
Part FourPreparing for future efficiency challenges 35
Appendix OneMethodology 41
Appendix TwoChange Programme Assessment Framework 43
Appendix ThreeProcess Management Maturity Assessment 44
The National Audit Office study team consisted of:
Stephanie Bryant, Elena Cozzi, Charlie Gluckman, Kirsty McColl and Mark Wynniatt under the direction of Alex Scharaschkin
This report can be found on the National Audit Office website at www.nao.org.uk
For further information about the National Audit Office please contact:
National Audit Office Press Office 157-197 Buckingham Palace Road Victoria London SW1W 9SP
Tel: 020 7798 7400
Email: [email protected]
Website: www.nao.org.uk
Twitter: @NAOorguk

4 Key facts Efficient handling of financial services complaints
Key facts
One million the number of enquiries taken by the Financial Ombudsman Service in 2010-11
206,121 the number of cases taken on for investigation by the Service in 2010-11
376 per cent the growth in cases converted since 2001-02
214 per cent the rise in operating costs, in real terms, over the same timescale
£500 the flat-rate case fee charged to firms by the Financial Ombudsman Service on all cases (regardless of the outcome) after the first three cases
£77 million the total case fee charged to industry in 2010-11
£20 million the normal levy charged to industry in 2010-11, an additional charge to the case fee
£25 million an additional charge made to industry in 2010 to increase the Financial Ombudsman Service’s reserves, due to the delay in receiving case fee income while the payment protection insurance cases were on hold, pending the result of a judicial review
1menquiries a year
1,178staff employed
£106.8mannual operating costs
Efficient handling of financial services complaints Scope of this review 5
Scope of this review
1 The Financial Ombudsman Service (‘the Service’) provides a dispute resolution service that is an alternative to the courts, to address complaints from consumers about businesses providing financial services. It was established by Parliament in 2001 as an amalgamation of ombudsman schemes in different parts of the financial services sector, and provides a free service to consumers.
2 It deals with complaints covering a wide range of financial products. The Service normally classifies complaints into three broad product families – banking, insurance and investment – which are in turn divided into 18 product types (so, for example, mortgage cases are in the banking product family). When mass claims arise in relation to a particular product they are analysed separately. So, currently, payment protection insurance cases are analysed separately from other insurance. Previously, mortgage endowments were analysed separately from other investments.
3 In 2010-11, the Service dealt with over one million enquiries split equally between phone and post. Many of these were complaints against businesses that are covered under the Service’s remit. If such complaints cannot be resolved between the business and the consumer, the Service will take them on as cases. Cases are initially subject to an informal adjudication between the consumer and the business, managed by the Service.
4 If a case cannot be settled through adjudication it can progress to consideration by an Ombudsman for a final decision. There are currently 71 ombudsmen in the Service, acting as impartial decision-makers fulfilling an equivalent role to a judge or court. Consumers can accept the Ombudsman’s decision, or take their case to court. If a consumer accepts the Ombudsman’s decision, it becomes legally binding on the consumer and financial business.
5 The independent public-interest board of the Service has voluntarily adopted a policy of periodic independent reviews of aspects of its operations. In 2011, the board invited the National Audit Office, acting on behalf of the Comptroller and Auditor General, to conduct a review of the efficiency of its operations. The Comptroller and Auditor General has been independently responsible for setting the scope and methodology of the work and concluding on the Service’s efficiency. The National Audit Office carried out the work on his behalf as if we were investigating the efficiency aspects of a value-for-money study under section 6 of the National Audit Act. This report sets out the findings of our review.
6 Scope of this review Efficient handling of financial services complaints
6 The review has taken place at a time when the Service is implementing a major change programme to transform and modernise all aspects of its business in the light of recent rapid growth in demand for its services. It is therefore essentially prospective, rather than retrospective, in nature, and has focused on whether the change programme is being delivered in a way that will address the key efficiency challenges facing the Service. Figure 1 sets out the challenges the review uncovered. In particular, we have examined whether the change programme:
• will effectively address the key challenges the Service faces in maintaining and enhancing its efficiency;
• will enable the Service to respond to the challenge of volatile demand; and
• follows best practice with regard to project and programme management.
7 We should like to record our thanks to the board, senior executive team, and staff at the Financial Ombudsman Service for offering us full cooperation as we carried out our fieldwork, for their openness and responsiveness to our requests for information, and for their participation in meetings and discussions throughout.
Key findings
On the efficiency challenges facing the Service
8 There has been rapid growth in demand for the Service. In the ten years since it was established, the Service has changed considerably. The Service took on 206,121 cases in 2010-11: an increase of 376 per cent from its 2001-02 caseload. The organisation grew to meet this demand with its operational costs rising by 214 per cent in real terms, from £27.2 million in 2001-02 to over £100 million in 2010-11, and staff numbers increasing from 461 to 1,178 over the same period. As the Service has grown, it has become possible, and necessary, to realise efficiencies of scale.
9 Volatile demand and mass claims represent significant efficiency challenges for the Service. Demand for the Service is driven by public awareness and by the conduct of firms in the financial services sector. Complaints within the sector have grown steadily since 2006, but types of complaints have varied considerably, making demand volatile and difficult to predict. The increase in mass claims about the mis-selling of particular types of products in recent years, notably mortgage endowment cases from 2004, and payment protection insurance (PPI) from 2009, has led to large surges in demand presenting significant operational challenges.
10 Unit costs of processing cases have risen over time. This increase is due in part to the more complex cases that the Service receives, but it has not quantified the effect of changes in case complexity on unit costs. The Service has recently begun to collect more detailed information on resource productivity, and there is scope for it to use this to develop a more nuanced understanding of the drivers of its costs.

Efficient handling of financial services complaints Scope of this review 7
Figure 1Key effi ciency challenges for the Service’s change programme to address
Key efficiency challenge
Description
Coping with volatile demand
This is the most significant challenge the Service faces. Bound by the FSA’s Dispute Resolution rules, the Service takes on the cases that it receives. It therefore cannot influence demand which is driven by the nature of complaints in the constantly changing financial services sector.
Firm behaviour The behaviour of firms can adversely affect the inflow of cases and the efficiency of case handling. Firms may choose to withhold or not be forthcoming with information, leading to delays and increased processing times. The Service has little power against firms when this happens.
Processing and waiting times
The time that a case spends in the process is not only a function of the number of resources available. We found that delays are caused by other factors some of which are outside the control of the Service, such as waiting for additional information requests. Other factors include existing backlogs and time taken to allocate cases which also affect processing time.
Communication with businesses
Challenges here include ensuring that requests for information are channelled as quickly as possible to the appropriate point within firms, and that systems for exchanging information operate efficiently and consistently with each other.
Communication with consumers
A key challenge is eliciting as expeditiously as possible the underlying issue that the complaint is about, from consumers who are naturally not experts in financial services. Some consumers are not kept sufficiently up to date on the progress of their cases. Some consumers frequently request updates and staff have to react to these requests. Some letters and forms are not as accessible as possible so consumers send in unclear forms or need to make contact with the Service to gain clarification.
Use of paper files Paper files, currently relied upon for incoming mail and evidence are not formatted in a standard way. This makes case files difficult to navigate and determine what the case is about and what the supporting evidence is. There is no index kept so when documents go missing in transit there is no way to spot what is missing.
Quality checking and case re-working
The current average rate of re-work is four per cent. Cases can be returned for re-work when adjudicators send files back to the Customer Contact Division and when ombudsmen send files back to adjudicators. Reasons for re-work are usually due to incomplete files or insufficient evidence. This creates delays and necessitates additional information requests to consumers and businesses.
Source: National Audit Offi ce

8 Scope of this review Efficient handling of financial services complaints
11 Median case processing times is currently 3.5 months for non-PPI cases, by comparison with a target of 3 months. The Service is on track to meet its target of closing all cases older than 18 months by the end of the year. The time it takes to close a case depends both on the Service’s own process efficiency and the efficiency with which businesses and consumers respond to requests for information. The Service has developed a planning tool which allows it to examine the impact of different resource allocations on the median case processing time (the time within which half of its cases are closed), and hence to make operational decisions aimed at meeting its target of achieving a median time of three months. The Service has not yet integrated its analysis of how long staff spend waiting for information flows or their capacity to handle more than one case at a time into its demand and capacity planning tool.
12 The Service measures performance based on input and output metrics but is yet to develop measures of performance through the process on a consistent basis. Measures of performance that focus on input and output metrics allow the Service to assess its current performance, but measuring performance through the process will help the Service to better understand where it needs to focus both its continuous improvement programme and any future improvement initiatives. While the Service does this in a targeted way when it uncovers a reason to do so, it would benefit from doing so more consistently.
On the Service’s change programme
13 The Service recognises that its operational processes need to be modernised and in response has developed a major change programme. The Service recognises it can do more to be efficient. Its processes are currently overly reliant on paper records and case files. Interaction with consumers and financial service businesses could also be improved through better use of technology. In 2010, the Service began to implement a large programme of change to modernise its operational processes and improve efficiency. It includes a number of business process improvements, new ICT systems and organisational changes such as new business intelligence measures and a new collective reward scheme for staff.
14 The change programme has already begun to realise benefits. Over the longer term there are some further efficiency challenges that will need to be addressed. The change initiatives link clearly to the efficiency challenges facing the Service. The programme is about a third of the way through implementation, and has already begun to realise some quantifiable benefits, including savings of £30,000 from better use of electronic communications and £565,000 from moving administrative work in-house. Whilst the large change programme is addressing most of the key challenges the organisation faces, there are areas which the Service is not yet addressing. These include improving costing and forecasting techniques to predict performance and inform decision-making; embedding an understanding of the customer into its operational design; and ensuring that continuous improvement is focused on the whole process and not done in stage silos.

Efficient handling of financial services complaints Scope of this review 9
15 The programme is broadly being managed well, though some aspects of project management should be strengthened. We found that the Service is broadly on track for delivering its change programme successfully; however, some aspects of project and programme management need to be strengthened. Budgets for individual projects within the programme were not set at the beginning of each project, or robustly tracked. Assurance should be strengthened through consistent ongoing monitoring of risks, benefits, and unintended consequences across projects.
16 More could be done to obtain staff buy-in to some change projects, especially from the Ombudsman panel. There is currently a great deal of change happening in the Service that is significantly changing the way people work. Staff need to be fully engaged with these changes if the Service is to achieve its objectives. There was a lower level of engagement with key parts of the change programme such as the e-enablement project among ombudsmen than among other groups of staff.
Conclusion
Efficiency in the Financial Ombudsman Service
17 The Financial Ombudsman Service has been forced to increase rapidly since 2002 to meet demand, and in doing so has encountered a number of significant challenges to handling financial services complaints efficiently. Over the last few years the Service has experienced both a rise in its unit costs and an increase in the number of cases taking more than one year to resolve. The Service needs to achieve efficiencies of scale in order to deal with the highly volatile demand that it will continue to face in the future. To do so, the Service must develop a more complete understanding of the factors that are driving its unit costs so that it can begin to address the causes of the increases it has experienced. It is a data-rich organisation, and should better use the data it has on the distributions of elapsed times for resolving cases to understand and quantify which elements of the process are causing delays in processing times and consequently where efficiencies need to be made.
18 The Service has recognised areas in which it can improve its processes and be more responsive to the volatile demand for its services. It has put in place an ambitious change programme which should address many of the efficiency challenges it is facing. Delivering change on this scale is a major undertaking. The programme is being managed well, and the Service should be pleased with its progress to date. However, the Service should strengthen some elements of its programme management arrangements, such as the monitoring of both benefits and unintended impacts of change, and budget control.

10 Scope of this review Efficient handling of financial services complaints
Recommendations
a The Service quotes an annual unit cost figure in its Directors’ report, but year-on-year changes in this figure do not measure changes in the Service’s efficiency. The Service should do more to quantify the impact on its annual unit cost outturn figures of factors such as changes in the complexity of its cases, and upstream investment in new technology to achieve downstream savings, to communicate better to stakeholders why unit costs have increased over recent years.
b The time it takes to resolve a case depends on both the Service’s process efficiency and the responsiveness of consumers and firms to requests for information. The Service should develop a better understanding of the potential for delays within each stage of the case-handling process, as well as of the maximum number of cases staff can work on at any one time. It could build on its demand capacity and operational planning tool to incorporate the full distributions of elapsed times rather than using information only on average times, for example to help it forecast the impact of resourcing decisions on the proportion of cases resolved within 18 months.
c As mass complaints, for example in relation to payment protection insurance, increase, the Service becomes more exposed to cash flow problems. Since the Service was established, more than 50 per cent of its cases have come from just three issues: mortgage endowments, payment protection insurance, and bank and credit card charges. The Service should evaluate whether its current charging regime is still fit for purpose, and consider charging firms upon case conversion rather than at case closure.
d The way in which budgets, risks and progress are monitored is not standardised across the projects that make up the Service’s change programme. Costs and benefits for the change projects must be budgeted and measured. This will establish a clear baseline to assess programme performance and to inform decisions about current and future strategy.
e Although there is strong buy-in from staff to the Service’s key priorities and values, there is scope to improve engagement with some change projects, particularly from the Ombudsman panel. A variety of communication channels, such as demonstrations and open forums, should be used to improve staff engagement where the projects are making significant changes to the way of working, for example, through e-enablement. Given the ombudsmen’s key role in the organisation, it is imperative that they are fully engaged with, and supportive of, the business benefits of each project.

Efficient handling of financial services complaints Part One 11
Part One
The changing nature of financial services complaints
1.1 This part summarises how the Financial Ombudsman Service (‘the Service’) has changed in the ten years since it was established, and looks at the factors that have driven this change. It sets out the context for this study, and the areas we have considered in examining how the Service is responding to the efficiency challenges the changing environment entails. It shows that:
• the Service has had to cope with the challenges of a rapid increase in workload, reflected in increased size and budget;
• this growth is a consequence of the ongoing change in the scale and nature of complaints the Service receives; and
• the Service’s annual operating costs have increased by 214 per cent in real terms since it was established, while its caseload has increased by 376 per cent.
The role of the Financial Ombudsman Service
1.2 The Financial Ombudsman Service is the statutory dispute-resolution scheme for complaints about financial products such as bank accounts, loans, insurance and investments. It was set up in 2001, under the provisions of Part XVI and Schedule 17 of the Financial Services and Markets Act 2000, as the amalgamation of its predecessor ombudsman schemes, and its jurisdiction was later extended by Section 59 of the Consumer Credit Act 2006. The Service provides an alternative dispute resolution service to the Court system for addressing potential consumer harm, and to award redress where harm has been found.
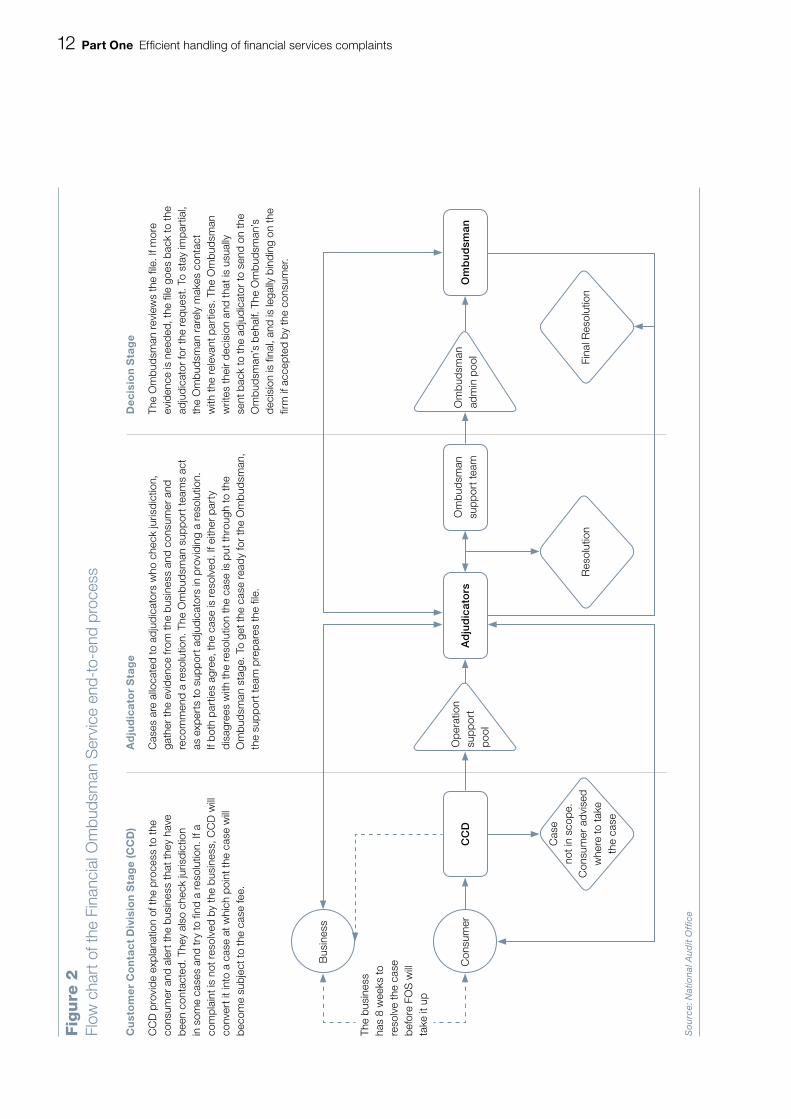
1.3 Consumers with unresolved complaints against a firm within the Service’s jurisdiction may take these up with the Service. If after eight weeks a complaint has not been solved by the firm to the consumer’s satisfaction, the consumer may request the Service to investigate the complaint on his or her behalf. Figure 2 overleaf shows the process a case goes through at the Service.
12 Part One Efficient handling of financial services complaints
Fig
ure
2Fl
ow c
hart
of t
he F
inan
cial
Om
buds
man
Ser
vice
end
-to-
end
proc
ess
CC
DO
mb
ud
sman
So
urce
: Nat
iona
l Aud
it O
ffi c
e
Cu
sto
me
r C
on
tac
t D
ivis
ion
Sta
ge
(CC
D)
CC
D p
rovi
de e
xpla
natio
n of
the
proc
ess
to th
e co
nsum
er a
nd a
lert
the
busi
ness
that
they
hav
e be
en c
onta
cted
. The
y al
so c
heck
juris
dict
ion
in s
ome
case
s an
d tr
y to
find
a r
esol
utio
n. If
a
com
plai
nt is
not
res
olve
d by
the
busi
ness
, CC
D w
ill co
nver
t it i
nto
a ca
se a
t whi
ch p
oint
the
case
will
beco
me
subj
ect t
o th
e ca
se fe
e.
Ad
jud
icat
or
Sta
ge
Cas
es a
re a
lloca
ted
to a
djud
icat
ors
who
che
ck ju
risdi
ctio
n,
gath
er th
e ev
iden
ce fr
om th
e bu
sine
ss a
nd c
onsu
mer
and
re
com
men
d a
reso
lutio
n. T
he O
mbu
dsm
an s
uppo
rt te
ams
act
as e
xper
ts to
sup
port
adj
udic
ator
s in
pro
vidi
ng a
res
olut
ion.
If
both
par
ties
agre
e, th
e ca
se is
res
olve
d. If
eith
er p
arty
di
sagr
ees
with
the
reso
lutio
n th
e ca
se is
put
thro
ugh
to th
e O
mbu
dsm
an s
tage
. To
get t
he c
ase
read
y fo
r th
e O
mbu
dsm
an,
the
supp
ort t
eam
pre
pare
s th
e fil
e.
Dec
isio
n S
tag
e
The
Om
buds
man
rev
iew
s th
e fil
e. If
mor
e ev
iden
ce is
nee
ded,
the
file
goes
bac
k to
the
adju
dica
tor
for
the
requ
est.
To s
tay
impa
rtia
l, th
e O
mbu
dsm
an r
arel
y m
akes
con
tact
w
ith th
e re
leva
nt p
artie
s. T
he O
mbu
dsm
an
writ
es th
eir
deci
sion
and
that
is u
sual
ly
sent
bac
k to
the
adju
dica
tor
to s
end
on th
e O
mbu
dsm
an’s
beh
alf.
The
Om
buds
man
’s
deci
sion
is fi
nal,
and
is le
gally
bin
ding
on
the
firm
if a
ccep
ted
by th
e co
nsum
er.
Fina
l Res
olut
ion
Res
olut
ion
Cas
e no
t in
scop
e.
Con
sum
er a
dvi
sed
whe
re to
take
the
case
Ad
jud
icat
ors
Om
buds
man
su
ppor
t tea
m
Bus
ines
s
Con
sum
erO
pera
tion
supp
ort
pool
Om
buds
man
ad
min
poo
l
The
busi
ness
ha
s 8
wee
ks to
re
solv
e th
e ca
se
befo
re F
OS
will
take
it u
p

Efficient handling of financial services complaints Part One 13
1.4 A consumer with a potential complaint against a firm will first contact the Service’s Customer Contact Division (CCD). If the complaint is eligible for the Service to take up, the enquiry is converted into a case. Converted cases can go through two main stages before resolution is achieved. The first stage attempts to settle the case informally by adjudicating between the two parties. If the case cannot be settled by an adjudicator at this stage, it can progress to an Ombudsman for a final decision. When a final decision has been made by an Ombudsman, the consumer has the choice to accept or reject the decision. If the decision is accepted by the consumer it is binding on the firm.
1.5 The Service is funded via fees and charges levied on financial services firms. A flat-rate case fee of £500 is charged to a firm on all cases, regardless of the outcome. The case fee is only charged if the complaint received about the firm is converted into a case, and it is payable when the case is resolved. A firm is not charged for the first three cases it is involved in that the Service takes up within a year, but is charged for subsequent cases thereafter. In addition to the case fee income, financial services firms pay an annual levy to the Service, on the basis that the Service underpins consumer confidence in the industry. The levy is fixed by the Financial Services Authority and is apportioned amongst businesses, based on the Service’s forecast of how its resources will be allocated amongst industry sectors. Figure 3 shows that the levy has remained relatively constant over time, but case fee income has grown steadily as the number of complaints brought to the Service and converted to cases has increased.
Income (£m)
Figure 3The Financial Ombudsman Service's income
Levy income Case fee income
Source: Financial Ombudsman Service Directors Reports and Financial Statements
0
20
40
60
80
100
120
2003 2004 2005 2006 2007 2008 2009 2010 2011
16.4
21.1 27.4 31.239.8
36.135.9
46.4
78.4 77.1
13.1 12.4 11.716.6 19.6 19.3 20.6 20.9
14 Part One Efficient handling of financial services complaints
Growth in demand for the Financial Ombudsman Service
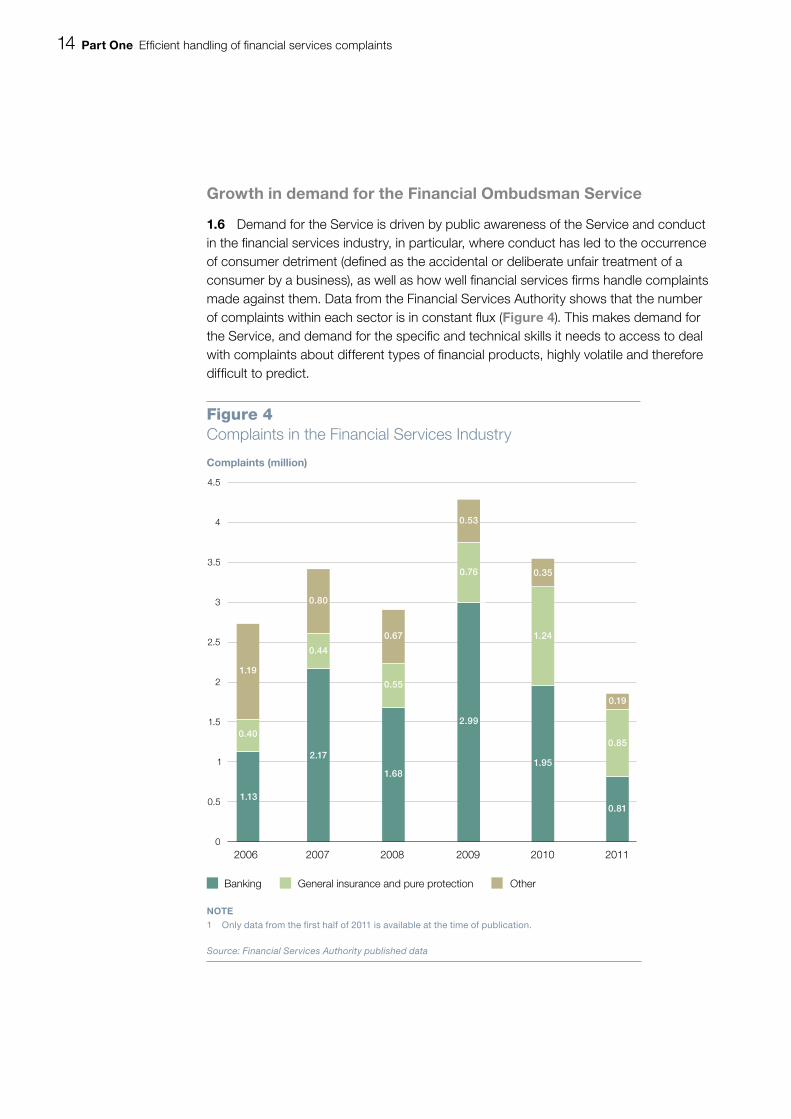
1.6 Demand for the Service is driven by public awareness of the Service and conduct in the financial services industry, in particular, where conduct has led to the occurrence of consumer detriment (defined as the accidental or deliberate unfair treatment of a consumer by a business), as well as how well financial services firms handle complaints made against them. Data from the Financial Services Authority shows that the number of complaints within each sector is in constant flux (Figure 4). This makes demand for the Service, and demand for the specific and technical skills it needs to access to deal with complaints about different types of financial products, highly volatile and therefore difficult to predict.
0
0.5
1
1.5
2
2.5
3
3.5
4
4.5
2006 2007 2008 2009 2010 2011
Complaints (million)
Figure 4Complaints in the Financial Services Industry
Banking OtherGeneral insurance and pure protection
NOTE1 Only data from the first half of 2011 is available at the time of publication.
Source: Financial Services Authority published data
1.19
0.40
1.13
0.35
1.24
1.95
2.99
0.76
0.53
1.68
0.55
0.67
2.17
0.80
0.44
0.81
0.85
0.19
Efficient handling of financial services complaints Part One 15
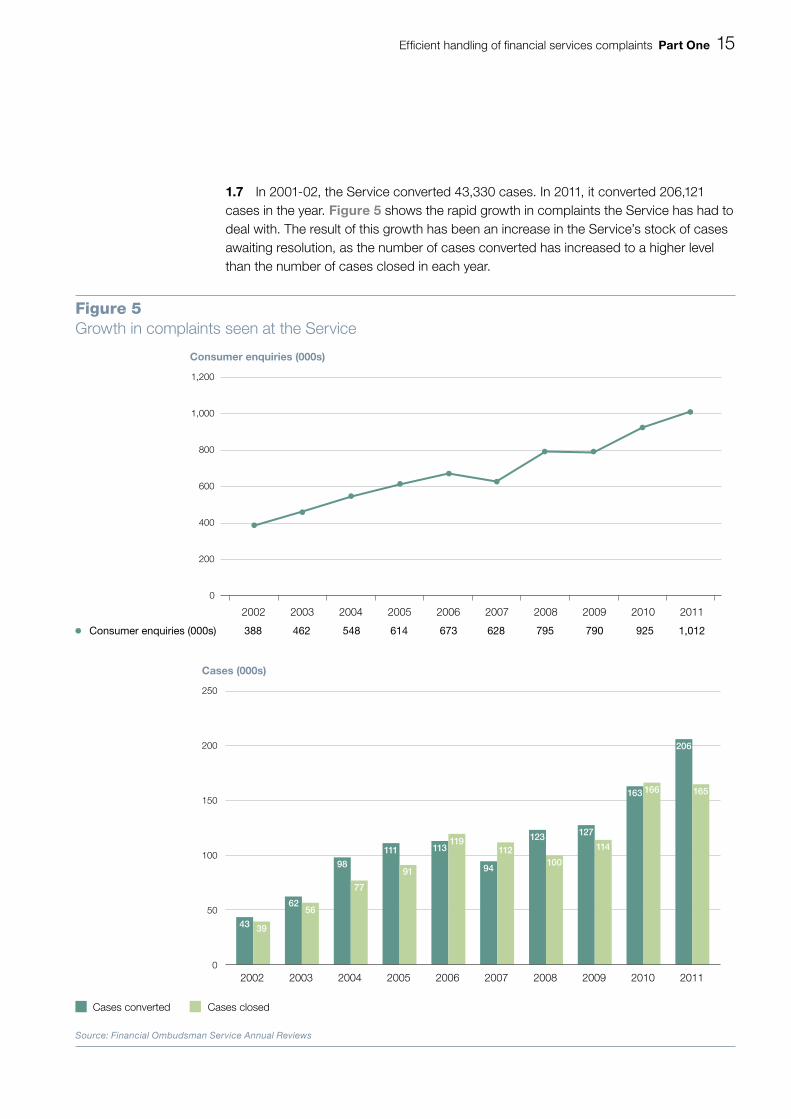
1.7 In 2001-02, the Service converted 43,330 cases. In 2011, it converted 206,121 cases in the year. Figure 5 shows the rapid growth in complaints the Service has had to deal with. The result of this growth has been an increase in the Service’s stock of cases awaiting resolution, as the number of cases converted has increased to a higher level than the number of cases closed in each year.
Figure 5Growth in complaints seen at the Service
Consumer enquiries (000s)
1,200
1,000
800
600
400
200
0
2002 2003 2004 2005 2006 2007 2008 2009 2010 2011
Source: Financial Ombudsman Service Annual Reviews
Consumer enquiries (000s) 388 462 548 614 673 628 795 790 925 1,012
Cases (000s)
250
200
150
100
50
02002 2003 2004 2005 2006 2007 2008 2009 2010 2011
206
165166163
114
127
100
123112
94
119113
91
111
77
98
5662
3943
Cases converted Cases closed

16 Part One Efficient handling of financial services complaints
£ million
120
100
80
60
40
20
0
Figure 6Staff levels at the Financial Ombudsman Service 2002–11
Total Staff Numbers 392 461 503 634 826 987 1,000 897 793 1,051 1,178
Total Costs (£m) 20.60 27.18 34.62 36.50 45.81 52.33 55.31 56.40 57.87 92.50 106.78
Source: Financial Ombudsman Service data
2001 2002 2003 2004 2005
Staff Numbers
1,400
1,200
1,000
800
600
400
200
02006 2007 2008 2009 2010 2011
1.8 The Customer Contact Division (CCD) deals with a large number of consumer enquiries that never become converted cases. The type of enquiries CCD takes include providing explanations of the rules governing complaints in financial services, giving consumers independent reassurance that what a firm has told them is correct, and redirecting calls from consumers who have an enquiry that can be better addressed outside the Service. In 2010-11, the number of enquiries being taken by CCD reached just over one million, split equally between phone and post enquiries.
1.9 The Service has been forced to react to this significant increase in demand by increasing in size over time. Figure 6 shows that the organisation’s total costs have increased from £27.2 million in 2001-02 to over £100 million in 2010-11, and total staff numbers have increased from 461 to 1,178 in the same period. This change in cost represents an increase of 214 per cent in real terms, while the volume of cases converted has increased by 376 per cent.

Efficient handling of financial services complaints Part One 17
The changing nature of demand
1.10 The sources of complaints received by the Service have also changed over the last five years. A significant proportion of the cases that the Service receives now come through claims management companies (CMCs), rather than directly from consumers. CMCs are businesses that offer advice or services to consumers in respect of claims for compensation, restitution, repayment or any other remedy for loss or damage. Figure 7 shows that the proportion of cases that the Service receives through CMCs has increased from 18 per cent in 2007 to 45 per cent in 2011.
Percentage
100
90
80
70
60
50
40
30
20
10
0
Figure 7Where complaints come from
Direct from consumer OtherClaims management companies
Source: Financial Ombudsman Service annual review
2007 2008 2009 2010 2011
7
18
75
8
19
73
9
26
65
12
28
60
12
45
43

18 Part One Efficient handling of financial services complaints
1.11 The growth in the activity of CMCs has been driven by mass claims about the mis-selling of particular types of products in recent years, notably mortgage endowment cases from 2004, and payment protection insurance (PPI) from 2009. In fact, over the history of the Service, more than 50 per cent of its cases have come from just three issues: mortgage endowments, PPI, and bank and credit card charges. The number of complaints about PPI converted into cases annually grew from around 1,800 (2 per cent of total cases) in 2007 to some 105,000 (51 per cent of total cases) in 2011.
1.12 In August 2010, following evidence of the extensive mis-selling of PPI, the Financial Services Authority issued guidance about the approach that financial firms should take in relation to PPI complaints. The British Bankers’ Association judicially reviewed the Financial Services Authority and the Financial Ombudsman Service regarding what it claimed were retrospective elements in the guidance for handling PPI complaints. The judgment was handed down on 20 April 2011 and found in favour of the Financial Services Authority and the Service. While the review was under way, however, the Service was unable to process the existing PPI complaints it had, and was receiving up to 5,000 new cases per week. As these cases were not being resolved, the Service was unable to collect the case fees for the work. This had a significant impact on the Service’s cash flow, and it was forced to rely on reserves. As a result, the Service has changed its reserves policy to cover 13 weeks’ expenditure rather than 2.6 weeks’ expenditure, and raised a further £25 million in 2010-11 from the financial services industry.
Context of this review
1.13 Over the ten years since the Financial Ombudsman Service was established, the volume and complexity of the consumer complaints it handles have increased to a level where efficiencies of scale in the way the Service operates have become possible and necessary. To realise these efficiencies it has to address a number of factors – which we have termed efficiency challenges – both internal and external to the Service.
1.14 This review examines these challenges, and how the Service is responding to them. In 2010, the Service initiated a major change programme, one of the aims of which was to improve efficiency and enable the Service to become more adaptive to the pressures it faces. We have therefore focused our assessment on the extent to which the Service is:
• using information effectively to identify, monitor, and understand its efficiency challenges (discussed in Part Two of the report);
• addressing them through a well-designed change programme and managing the programme well (Part Three); and
• geared up to deal with future challenges it may face (Part Four).

Efficient handling of financial services complaints Part One 19
1.15 We carried out our fieldwork between June and October 2011. Our methods of collecting and analysing evidence included document and case file reviews; interviews with project and programme managers and senior staff; focus groups with staff in a range of grades and posts; and interviews with stakeholders from industry, regulators and consumer groups. We also ran a number of ‘consumption mapping’ workshops with consumers and with financial services firms to compare perceptions of the case handling process from different user perspectives. To assess the extent to which the change programme is leading to improved business processes, we used the ‘Process Management Maturity Assessment’ tool developed by the National Audit Office (see Appendix Three). To help us understand and analyse drivers of elapsed times in case handling, we built a discrete event simulation model using data supplied by the Service. Full details of our methodology are set out in Appendix One.
20 Part Two Efficient handling of financial services complaints
Part Two
Identifying, monitoring, and understanding efficiency challenges
2.1 This Part examines how the Service measures its own efficiency as part of its wider approach to performance measurement, and the key challenges it is facing to maintain and improve efficiency. It shows that:
• the Service has two key metrics of efficiency: unit costs, and the time taken from accepting a complaint to its resolution;
• unit costs depend mainly on the Service’s staff costs and associated overheads, whereas elapsed times depend both on the Service’s own process efficiency and the efficiency with which businesses and consumers respond to requests for information;
• unit costs have increased over time, and some of this increase can be explained by the increase in more complex cases that the Service receives;
• building on the management information it now collects, there is scope for the Service to develop a more nuanced understanding of the drivers of these efficiency metrics;
• the Service is a data-rich organisation, and is now beginning to use data effectively to monitor and manage the challenge to efficiency we identified; and
• the Service has put in place a large programme of change to deal with the efficiency challenges it has identified. Some efficiency challenges remain to be addressed by the programme.
Identifying and monitoring efficiency
Unit costs
2.2 One metric the Service uses to measure efficiency is its unit cost. This is calculated each year by dividing the Service’s total running costs (less financing costs and bad debts) by the total number of cases closed in the year. Figure 8 shows the Service’s unit costs over time. The Service attributes the rise in unit cost to the changing nature of the case mix it receives and the complaint-handling behaviour of financial services firms, although this is based on observation of casework trends rather than detailed data analysis.

Efficient handling of financial services complaints Part Two 21
2.3 Annual increases in unit costs do not necessarily indicate reductions in efficiency. Unit costs are driven by (i) the direct cost of the staff time needed to resolve cases, and (ii) the cost of the overheads (such as accommodation, IT, training and management costs) needed to support this activity. If there is an increase in the complexity of the cases received by the service from one year to the next, then the average amount of staff time needed to resolve a case, and hence the unit cost, will also increase, even if efficiency remains constant. Similarly, if efficiency remains constant, but there is an increase in overheads (for example from upstream investment in technology improvement to deliver downstream savings), then unit costs will also rise.
2.4 The unit cost metric can only be used as a measure of efficiency, therefore, if it is possible to strip out the effect of planned changes in overhead costs and changes in the complexity of overall caseload over time. To do so, segmented data on activity levels over time (e.g., the average amount of adjudicator or ombudsman effort expended on a case of a certain type) is needed. The difficulty lies in how to group cases into ‘types’. For example, factors such as whether a case has come through a CMC, or what kind of consumer or what kind of business is involved in the complaint and hence how entrenched the relative positions of the parties are, or whether there is related ongoing legal action, may affect the amount of resource needed to solve it.
Figure 8Reported unit costs
Unit Cost (£)
Source: Financial Ombudsman annual review
484.00 529.00 508.00 555.00 639.00
400
450
500
550
600
650
2007 2008 2009 2010 2011

22 Part Two Efficient handling of financial services complaints
2.5 As part of its Demand Capacity and Operational Planning change project, which commenced in April 2011, the Service has begun to measure data on activity levels (expressed in average days of adjudicator or ombudsman effort expended) at the product family level. The results show that there are currently systematic differences in the average amount of resource used to solve cases by product family, and this might help to explain some of the variation in unit costs over time.
2.6 To test this, we did an illustrative analysis using 2011 data that isolates the impact on unit cost solely of changes in the mix of cases by product family from one year to the next, holding case complexity constant. Figure 9 shows actual reported unit costs from 2007 to 2011, against comparative calculated unit costs that hold average case complexity (measured by the net average number of days spent on a single case of that type by both an adjudicator and an ombudsman) constant at 2011 levels. It shows that the annual changes in the broad categories of cases the Service receives account for some, but only a relatively small proportion, of the change in unit costs over time. Much of the change is therefore due to other factors:
Figure 9Analysis of the impact on unit costs solely of changes in the mix of cases by product family over time, if activity levels are held constant
Unit Cost (£)
400
450
500
550
600
650
2007 2008 2009 2010 2011
Source: The National Audit Office analysis of unit costs
29% increase solely due to changes in product type
71% increase due to other factors such as complexity and upstream investmentNearly all increase due
to other factors such as complexity and upstream investment
Nearly all decrease due to factors such as complexity and upstream investment
55% increase due to other factors such as complexity and upstream investment
45% increase solely due to change in product type
Reported Unit Cost Unit cost based on previous years case mix
2007
2008
2009
2010

Efficient handling of financial services complaints Part Two 23
• Some may be due to systematic differences in cases complexity over time (for example, increasing volumes of complaints coming in from CMCs, changes in the nature of complaints about certain types of products, changes in the make-up and behaviour of the population of consumers and firms, etc.).
• Some may be due to the costs of handling surges of cases, with increases in recruitment and training costs and greater use of (more expensive) contingent resource to bridge the gap.
• Some may be due to efficiency variations over time.
• For 2010-11, some will represent investment to deliver downstream efficiencies through the Service’s change programmes, although there is no information that allows the Service to strip this out.
• Some may be due to changes in procedures.
2.7 The better the Service is able to analyse and understand these factors through the collection and analysis of appropriate information, the more definitively it will be able to conclude on the extent to which unit cost changes reflect changes in efficiency, and to communicate to stakeholders why unit costs have increased over recent years.
Time to close cases
2.8 The second overarching metric the Service uses to measure efficiency is the time taken from accepting a complaint (i.e., converting a complaint to a case) to its resolution. Currently the Service has two targets relating to this measure: to resolve 50 per cent of cases within 3 months, and 100 per cent of cases older than 18 months by the end of this year.
2.9 Figure 10 overleaf shows the Service’s progress against the target to resolve 50 per cent of cases within 3 months.
2.10 Figure 11 overleaf shows how the distribution of time to close cases has changed over time. Between 2004 and 2005 there was a substantial increase in the proportion of cases taking more than a year to resolve following the significant jump in complaints about mortgage endowments at that time. This proportion began to decline again from 2008, but increased from 11 per cent to 13 per cent of cases in 2011, as a result of the impact of the surge in PPI cases.
2.11 As part of its Demand Capacity and Operational Planning change project, the Service has developed a planning tool, in the form of a spreadsheet-based model that allows the Service to estimate the effect of increases in demand in specific products, and to model the pipeline effects of different potential allocations of staff. The tool uses median process times to estimate the extent to which cases will build up in a queue unless more resources are brought in.

24 Part Two Efficient handling of financial services complaints
Figure 10Performance against target to close 50 per cent of cases in 3 months
Months
Non-PPI (months) 4.7 4.4 3.6 5.4 4.2 3.2 3.5
PPI (months) n/a n/a n/a n/a 5.0 4.9 4.7
All cases (months) 4.7 4.4 3.6 5.3 4.4 3.6 4.3
Target 3.0 3.0 3.0 3.0 3.0 3.0 3.0
Source: Financial Ombudsman Service data
2005-06 2006-07 2007-08 2008-09 2009-10 2010-11 2011-12 (YTD)
0
1
2
3
4
5
6
Figure 11Time to close cases
Year Less than 3 months
(%)
3 to 9months
(%)
9 to 18months
(%)
Over 18months
(%)
2003 44 46 9 1
2004 47 44 8 1
2005 32 48 17 3
2006 32 43 19 6
2007 34 42 17 7
2008 42 39 11 8
2009 30 47 16 7
2010 38 43 15 4
2011 41 40 14 5
Source: Financial Ombudsman Service data

Efficient handling of financial services complaints Part Two 25
2.12 An advantage of focusing on median processing times is that they reflect one of the two targets mentioned in paragraph 2.8 (resolving 50 per cent of cases within three months means having a median case processing time of three months). A potential disadvantage is that the tool does not yet integrate the analysis of the impact of changes in patterns of demand or resource allocation on the cases that take significantly longer to process than the median case. For the future, we suggest that the Service should consider integrating the analyses of processing times it is now able to carry out to examine the drivers of elapsed times in more detail for the 50 per cent of cases that take more than the median time to resolve. We discuss the analysis of elapsed times further in Part Four, and give an illustrative example based on a model of the Service’s end-to-end process using discrete event simulation.
Using information effectively to monitor and deliver efficiency
2.13 Maintaining efficiency requires the Service to have robust and reliable data on its process performance, as part of the overall suite of information it uses to manage performance. These data should not just focus on input and output metrics, but look at performance through the process to help assess how performance can be improved.
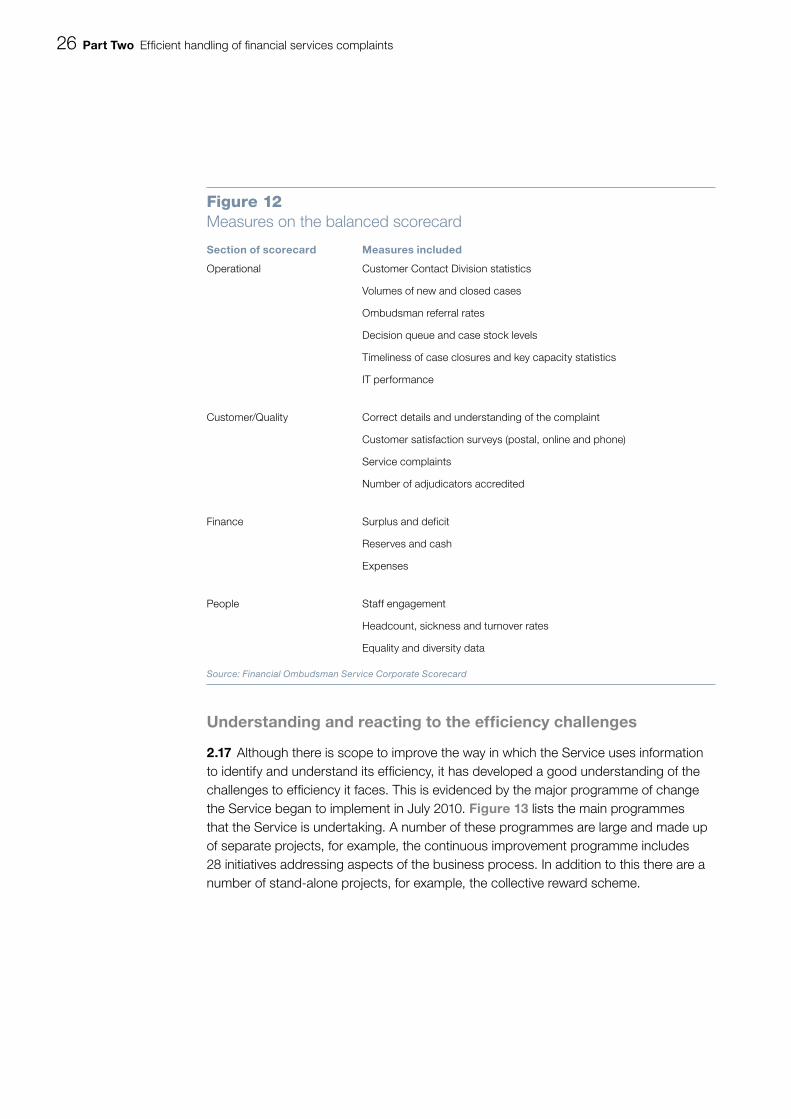
2.14 We found that the Financial Ombudsman Service is a data-rich organisation with a large amount of information available. Board members told us that the way in which information had been presented to them in the past became increasingly less fit for the purpose of strategic decision-making and overseeing operational performance as the Service had expanded in size. This improved with the introduction of a new balanced scorecard in March 2011, which has made the information clearer, more concise and more usable. Figure 12 overleaf shows the metrics that are covered on the balanced scorecard. In addition to this information, the board receives a set of operational information.
2.15 We found that the Service is very good at measuring input and output metrics, although there is scope to develop metrics to measure the performance through the system on a consistent basis, such as the amount of time adjudicators spend working on a case and the amount of time they spend waiting for necessary information to arrive.
2.16 Analysis of this kind of data at the operational level can inform corporate decisions by helping the executive team focus on elements of the process which are suboptimal, if information on output performance suggests that improvements are necessary to achieve efficiency targets, such as resolving all cases within 18 months.
26 Part Two Efficient handling of financial services complaints
Understanding and reacting to the efficiency challenges
2.17 Although there is scope to improve the way in which the Service uses information to identify and understand its efficiency, it has developed a good understanding of the challenges to efficiency it faces. This is evidenced by the major programme of change the Service began to implement in July 2010. Figure 13 lists the main programmes that the Service is undertaking. A number of these programmes are large and made up of separate projects, for example, the continuous improvement programme includes 28 initiatives addressing aspects of the business process. In addition to this there are a number of stand-alone projects, for example, the collective reward scheme.
Figure 12Measures on the balanced scorecard
Section of scorecard Measures included
Operational Customer Contact Division statistics
Volumes of new and closed cases
Ombudsman referral rates
Decision queue and case stock levels
Timeliness of case closures and key capacity statistics
IT performance
Customer/Quality Correct details and understanding of the complaint
Customer satisfaction surveys (postal, online and phone)
Service complaints
Number of adjudicators accredited
Finance Surplus and deficit
Reserves and cash
Expenses
People Staff engagement
Headcount, sickness and turnover rates
Equality and diversity data
Source: Financial Ombudsman Service Corporate Scorecard

Efficient handling of financial services complaints Part Two 27
Figure 13List of change programmes
Title Description
E-enablement: E-comms Increasing the Service’s electronic communication methods including email, text and spreadsheets
E-enablement: E-files This project involves moving towards a paper-free office, by scanning and indexing incoming documents to be stored and viewed on an electronic system
E-enablement: Portals Development of internet portals for tracking of cases for both businesses and consumers
Resources: Resourcing strategy Review and implementation of adjudicator resource model
Resources: DC&OP The development of a demand, capacity and operational planning tool
Lean: General office Identifying and eliminating unnecessary costs in general office
Lean: Continuous improvement Development of internal capacity for lean continuous improvement to conduct numerous continuous improvement initiatives
Career model Development of career pathways and accreditation model for casework staff
Performance scorecard Design and implementation of a balanced scorecard at corporate, team and individual level
Collective reward scheme Implementation of a new collective reward scheme for all staff
Knowledge resources Development of existing knowledge resources
Quality framework Development of a new quality checking framework for case-handling
IT improvement A number of improvement projects such as development of a skills matrix and an HR system upgrade
Procurement function Development and integration of procurement function and purchase order system
Transparency work Improvement of transparency of the organisation, including publication of complaints data
Source: National Audit Offi ce

28 Part Two Efficient handling of financial services complaints
2.18 We looked at how these change programmes will address the challenges that the organisation faces in maintaining its efficiency.
2.19 Figure 14 shows that many of the challenges will be addressed by the programme of change.
Figure 14How change is addressing the effi ciency challenges
Deliver a trusted, fair and easy to use service – for everyone
Operate a lean and efficient
organisation to deal with cases
well, cost-effectively
Source: National Audit Offi ce
Improvements to information
requests from firms
Communicating better with consumers
Unclear consumer complaint
Quality checks
To put knowledge
and expertise at the heart
of everything we do
PPI/coping with volatile
demand
To be flexible, reliable and
effective ... to be ready whatever
the product or demand
Time to closure and queue times
Internal comms
Firm behaviour
Issues with files:
Incomplete, mix of format, lack of control and
standardisation
Improvement to
forecasting
To share our experience and insight – helping to prevent future
problems
Key priorities
Efficiency challenges

Efficient handling of financial services complaints Part Two 29
2.20 Our analysis also identified a number of efficiency challenges that affect the organisation’s priorities, but are not currently being addressed by the change projects. Figure 15 shows the gaps we identified.
2.21 These gaps are areas in which efficiency challenges will remain after the implementation of the change programmes. The Service should seek where appropriate to focus their change programme in order to bring these gaps within scope. Where this is not possible, the Service should consider implementing further change at an appropriate time.
Figure 15Gaps in the change programme meeting the effi ciency challenges
Challenge Examples of how challenges impact on efficiency
Improvements to information requests from firms
Through our file review and interviews with stakeholders we found that when dealing with cases numerous information requests were made of firms by the Service. Sending a detailed information request initially may save case processing time. In some cases firms do not have the information to hand at the beginning of the investigation, due to having carried out an incomplete investigation of the complaint.
Identifying the underlying consumer complaint
We received feedback from some staff that identifying the consumer’s complaint can be challenging. Some of the reasons for this include deciphering the complaint on the consumer complaint form, and also the inherent difficulty in consumers explaining their complaint.
Improvement to forecasting Forecasting volatile demand will remain a significant challenge for the Service.
Firm behaviour Currently there are no disincentives for firms not to delay the process where it might suit them to.
Source: National Audit Offi ce

30 Part Three Efficient handling of financial services complaints
Part Three
Managing the change programme to improve efficiency
3.1 This Part sets out our assessment of how the Service is implementing its change programmes. It shows that:
• the Service is broadly on track for delivering its change programme successfully;
• some of the project and programme management areas need to be strengthened; and
• there is a large amount of change taking place at one time, so staff engagement is critical for these changes to become fully embedded.
Project and programme management
3.2 For effective implementation we would expect to see strong project and programme management to be evidenced throughout. This requires:
• projects and programmes to have clear aims and objectives including descriptions of the organisation before and after the change;
• project and programme managers to have clear roles and responsibilities and the support of senior management, through channels such as programme management groups;
• clear project start-up documents including project plans;
• ongoing monitoring of resources, risks, budgets and project progress so that if problems occur these can be quickly identified, escalated, if necessary, and resolved; and
• clear success criteria and measurement of benefits so that the completion of the project can be clearly defined.
3.3 We reviewed the project and programme management arrangements for a number of the change projects currently running, to determine whether change is being delivered effectively. In the main, we found that the project and programme management arrangements in place are suitable and will be effective for the Service to deliver the change programme. We found that all projects we reviewed were clearly supported by senior management, with project and programme management roles laid out clearly.

Efficient handling of financial services complaints Part Three 31
3.4 For each project we would expect to see plans and initiation documents that clearly set out the aims of the project, the stages for completion, budgets, resources and evaluation criteria. We reviewed a selection of documentation from the change projects and whilst there were project plans or initiation documents for all projects, in many cases these documents lacked the detail we would have expected to see.
3.5 We found that the IT development team was effectively using a development methodology known as Agile within the e-enablement programme for a number of the projects relating to the development of e-communication methods. Agile is a method for managing projects in a flexible and interactive way using short iterations of delivery that keeps development in line with emerging business requirements. This methodology allowed the Service to effectively manage project progress, quickly resolve any problems and cascade targets to teams.
3.6 Where external contracts were awarded we would expect to see appropriate documentation outlining the specification of the work, with roles and responsibilities clearly defined between the two parties. We reviewed the documentation and found that tender documents were clearly laid out in defining the specification of the project and that the evaluation of bids was done systematically and transparently. However, we found that project plans would have benefited from greater details concerning the contractors’ responsibilities, what the risks to fulfilling these responsibilities were, and a contingent exit strategy for the Service.
Monitoring of projects
3.7 We would expect to see consistent monitoring of resources, risks, budgets and project progress across all projects. We would also expect that there would be clear escalation procedures for any problems to a project board, and then programme level.
3.8 We found that there was a lack of standardisation for the ongoing monitoring of risks and progress across the projects. Although templates were available for risk registers and progress reports these were not used consistently across all projects or consistently escalated to programme level. The result of this is a lack of assurance that risks are being managed effectively at programme level.
3.9 Additionally, although benefits were clearly measured and laid out for some of the projects – for example, the savings from reductions in the cost of outgoing post through the pilots of the projects relating to e-communications methods – these were not consistently measured across all projects. These benefits should be clearly owned, measured and documented for all projects to ensure that they are realised, and to ensure programme objectives are met. Figure 16 overleaf demonstrates some of these benefits and project impacts, from the pilots where this information was available.

32 Part Three Efficient handling of financial services complaints
Budget control
3.10 Effective budget control is an important factor in the delivery of projects. We would expect all projects to have a budget clearly laid out, with a detailed breakdown of how much has been allocated to different streams of the project, such as resources and equipment. We would expect the project manager to have ownership of this budget and to monitor current spend against it, with reporting on a regular basis to the project board and programme level.
3.11 The most expensive change programme is the e-enablement programme. An overall programme budget of £4.3 million was set for this, with a business case approved by the board, but we found that budgets at a project level within this programme were not set at the beginning of each project, and that project managers had little control over their own budgets. We found that project budgets can be altered by programme managers. This reduces the incentive for project managers to focus on cost control, as well as leading to a lack of clarity about whether any significant over or underspend is happening at the project level.
Figure 16Benefi ts and project impacts
Barclays email communication – sending communications electronically
CMC spreadsheet communication – daily bulk communication
Time period January – March 2011 January – April 2011
Savings from pilot £2,340 –
Anticipated annual savings
£10,281 £21,000
Impact on process time Reduction in time taken for cases to be received (20.8 to 17.0 days)
–
Impact on staff Negative: increased time scanning due to lack of equipment
Positive: reduction of outgoing post in General Office
Positive: reduction of outgoing post in General Office
Customer feedback Initially very positive but as number of cases increased and the time taken increased due to the lack of scanning equipment less positive feedback received
Positive reaction from CMCs
Source: Financial Ombudsman Service data

Efficient handling of financial services complaints Part Three 33
Embedding change
3.12 At the organisational level, we found that staff engagement is very high with a strong buy-in amongst all staff for the organisation’s key priorities and values. We also examined the level of staff engagement with the projects that make up the change programme specifically, and the extent to which there is buy-in to the way in which these changes will affect their everyday working. Staff engagement in these changes is imperative for achieving success and effective communication is a key part of achieving this. We would expect to see communication plans drawn up for each programme that include the information to be explained, the audience(s), and the channels and frequency of communication. We would expect the information communicated to include the reason for the change, how and when this is taking place, the expectations of the change, and how it will affect staff.
3.13 We found that there is a large amount of change happening at the same time, and this is having a significant impact on staff. Whilst project and programme management staff, and senior management, have enthusiasm and a clear understanding of how these projects fit with the organisation’s key priorities, there was a much lower level of engagement and understanding among those staff not actively involved in the projects. We reviewed communication plans for some change projects, however these were not consistent across all projects and did not include all the details expected. In the case of the large e-enablement project, most communication about the change projects and how they affect day-to-day working was via the organisation’s intranet rather than through a variety of channels.
3.14 The Service recognises the need to use additional channels of communication that may be more appropriate for different groups of staff – for example, team meetings, emails and demonstrations – to increase staff engagement. We held four focus groups with different grades of staff and asked them the extent to which they have had the opportunity to provide input into the changes that are currently taking place. A small number of staff told us that they have had the opportunity to sit on various user groups, although those staff who had provided input said they were not clear on how this had been used to inform the changes taking place. To increase the engagement of all staff with the change programme the Service should consider how it can demonstrate more clearly how staff feedback on change projects has been used.
3.15 The ombudsmen have a special statutory basis as individual quasi-judicial decision-makers, but they are an integral part of the end-to-end case handling process and therefore they have to be equally engaged in the change programme as staff at other grades. However, we observed a lower level of engagement in the change programmes from the ombudsman than other groups of staff. Ombudsmen raised more concerns with e-enablement than other members of staff, who generally voiced more positive attitudes towards this key change project. The ombudsmen we spoke to did not appear to have bought into the structure of the new office-wide collective reward scheme. Given the ombudsmen’s key role in the organisation it is imperative that they are made partners for change.

34 Part Three Efficient handling of financial services complaints
Potential unintended impacts
3.16 Any major change programme runs the risk of having unintended impacts. We would expect that analysis of management information should identify impacts of change and that unexpected impacts should also be considered when monitoring this data. In our review of the change programme, we found a number of potential adverse impacts which the Service is not currently monitoring. Figure 17 provides three examples of such impacts. It is important for the Service to review the progress of change on an ongoing basis to monitor both the benefits as well as the unintended impacts that need to be addressed.
Figure 17Potential unintended impacts of change
Potential impact Description of risk
Improvement in silos Improvements taking place in silos have had adverse impacts on other areas. New letters sent by case-handling staff to consumers were not explained to consumer consultants in the Customer Contact Division which resulted in confusion when dealing with consumer queries.
Automated processes The introduction of auto-closure of cases prevented adjudicators using their discretion not to close certain cases, resulting in re-work, and confusion for consumers.
Performance scorecard The Service will need to monitor (for example through its staff survey) the impact on staff morale of the performance scorecards. Some adjudicators told us they were unhappy with two of the measures they are being scored against: service complaints directed at cases either before or after they have taken ownership of that case; and the length of time a case sits in the queue waiting for allocation to the Ombudsman, after it has been through adjudication.
Source: National Audit Offi ce

Efficient handling of financial services complaints Part Four 35
Part Four
Preparing for future efficiency challenges
4.1 This part examines some of the ongoing challenges the Service faces, and its ability to respond. It shows that the Service:
• will need to continue to develop its approach to coping with volatile demand;
• should ensure that improvements are focused on the whole process and not implemented in stage silos; and
• has yet to embed fully the understanding it has developed of its customer base into its operational design.
Dealing with volatile demand
4.2 Volatile demand is the most significant challenge that the Financial Ombudsman Service faces in maintaining its efficiency. The Service cannot influence demand. It is driven by the nature of complaints in the financial services sector, which is constantly changing. In order deal with this volatility we would therefore expect to see:
• transparent and robust demand forecasting that is clearly linked to operational planning;
• a flexible resourcing strategy across all processes; and
• analysis of the sensitivity of the end-to-end process to volatile demand.
Forecasting
4.3 Demand forecasting should collate information to inform the Service of the challenges it may face in the future, including the emergence of further bulk claims. The Service gathers this information from a variety of sources, including collecting internal information and from regular engagement with the financial services industry.
4.4 Currently the Service conducts demand forecasting through its annual plan and budget consultation. These are based on information collected in the Customer Contact Division (CCD) about queries relating to certain product types, and information from meetings with industry stakeholders. The way in which the Service uses this information to model potential future scenarios, or translates these into operational plans, is not transparent.

36 Part Four Efficient handling of financial services complaints
Demand and Capacity Planning
4.5 The recent development of the Demand Capacity and Operational Planning tool (DC&OP) has been a positive step in planning capacity based on forecast demand. We examined how the tool has been used to make a planning decision, based on an increase in demand for mortgage cases that the Service forecasted. The tool was used to determine that the Service would need to increase permanent staff and bring in a contingent resource for six months to deal with the forecast increase in demand.
4.6 We built an alternative model of the Service’s end-to-end process, taking a dynamic (simulation-based), rather than a static (spreadsheet-based) approach. Details of the model are provided in the technical paper that accompanies this report. We applied this model to the same scenario of a forecast increase in demand for mortgage cases.
4.7 Our model indicated that by increasing the number of adjudicators, the number of cases solved at adjudicator stage, and the average time these cases spend in the system, would return to levels similar to those seen before the forecast rise in demand. However, we found that this had the effect of shifting the backlog to the decision (Ombudsman) stage of the process, creating an increase in queuing time at that stage. The result was that the proportion of cases solved within 18 months would decrease. Figure 18 shows that the average time cases spend in the system is still too high for those cases that are not resolved at adjudication, after the number of adjudicators is increased. The Service is currently recruiting additional ombudsmen. The DC&OP tool can predict the effect of bringing in additional ombudsmen on average case processing times, but not its effect on the proportion of cases closed within 18 months because of its use of median times rather than distributions, which are analysed outside the DC&OP tool.
4.8 Introducing the DC&OP tool is a positive step. Our analysis has, however, highlighted some areas in which the Service might consider developing this to better account for the fact that the Service’s process is dynamic and operates within a volatile environment. The areas in which we would suggest there is scope for development are:
• making greater use of distributions of elapsed times, rather than just median times, in making planning decisions, to explore the impacts of different demand scenarios on elapsed times for the 50 per cent of cases that take longer than the median time to solve; and
• forecasting over longer periods of time than one year, since some cases spend longer than a year in the system, in order to fully recognise the impacts of increased demand on queue lengths and processing times.
4.9 Our analysis indicated that elapsed times in the end-to-end process are highly sensitive to the number of cases an adjudicator, the ombudsman support teams or ombudsmen can work at any one time. The Service should ensure that it has a good understanding of how this parameter varies in order to better determine optimal numbers of resources.

Efficient handling of financial services complaints Part Four 37
4.10 The analysis the Service have used for the development of DC&OP treats each stage of the process as a ‘black box’, and the timings of the individual activities that take place within each stage, for example, waiting for responses from firms or consumers, in the process are not analysed. This is despite the fact that, as noted in Figure 1, the time it takes to process cases is a function not only of the number of resources, but also of delays caused by flows of information between different actors.
4.11 Improving its understanding of the drivers of these delays will allow the Service to make better planning decisions by understanding the optimal level of resourcing requirements to meet performance targets without increasing costs.
Resourcing
4.12 Another important component of a strategy to deal with volatile demand is a resourcing model flexible enough to react to changes in demand. Previously, the Service had two contractors supplying contingent staff based on a Managed Operation model. This meant that these third parties were contracted to provide a managed end-to-end case-handling service. The model did not provide the flexibility that the organisation needed and became expensive as the demand for PPI cases grew at an unexpected rate. It was therefore decided to exit these contracts and develop a new resourcing model.
Days
900
800
700
600
500
400
300
200
100
0
Figure 18Simulated average time of mortgage cases spent in the system
Source: National Audit Office simulation model
Historic Performance Increase in cases Increase in casesand adjudicators
Cases solved at Adjudication
Cases solved at Final Decision
Cases solved at Draft Decision
Cases solved at Final Decision with Provisional decision
139
432381
434
716
825 807837
810
597638
128

38 Part Four Efficient handling of financial services complaints
4.13 The new resourcing model is based on a single third party supplier providing a managed service for the recruitment and placement of contingency and permanent staff. The model allows the Service to increase staff appropriately to deal with any increases in demand, and subsequently decrease staff if demand levels fall. We found the new resourcing strategy to be an improvement on the old as it allows the Service to better control the performance of contingent staff, and provides the commercial benefit of not paying a premium for management or a sub-vendor layer. This has produced savings which are demonstrated in Figure 19.
4.14 While the Service has addressed the need for flexibility with respect to the total number of adjudicators needed to meet demand, we found that the scope to flex staff within the adjudicator teams is limited, given that each area requires specialist knowledge of specific types of financial products. There is some scope to use the ombudsman support teams flexibly across areas, although our observations of team managers’ approaches to allocating cases to ombudsman support teams suggested that allocations are sometimes based on the set capacity of the team, rather than being led by consumer demand. In some cases we found that team managers stopped allocating cases of a particular product to the ombudsman support teams if they noticed ombudsmen queues for those cases increasing. We recognise that a difficult challenge facing the Service is finding a balance between ensuring it has the necessary skills and knowledge available to deal with the cases it receives, while maintaining flexibility to move staff between areas as case mix changes over time.
Figure 19Transition from Managed Operation to Resource Provider Model of outsourcing
Resourcing and monthly costs September 2010 March 2011 September 2011
Adjudicator resource in house (%) 70 83 85
Management resource in house (%) 57 70 100
Total casework operating costs (£000) 5,555 4,528 3,857
In-house cost (%) 48 63 82
Outsourced cost (%) 52 37 18
Case closure capacity (000s) 15,500 13,795 15,035
Average cost of contingent resource (per case) (£)
358 328 257
Source: Financial Ombudsman Service data

Efficient handling of financial services complaints Part Four 39
Achieving continuous improvement
4.15 Continuous improvement refers to the ongoing effort to improve processes. We would expect to see a consistent approach to case handling which staff are trained in and use appropriately, with all staff being encouraged to identify and propose ways in which it could be improved. We would expect the whole end-to-end process to be considered strategically, to ensure that effort expended on improvement is targeted on priority areas. Furthermore, we would expect the organisation to understand the value derived from improvement activities in each part of its business, to help it assess whether other areas of the business also need improvement and, where relevant, to replicate improvement activity elsewhere in the organisation.
4.16 While improvement work to date has focused on the areas of most benefit to achieving the key aims of the service, we found that improvement activity is not yet part of business as usual but is instead being implemented through 28 continuous improvement projects. A structured way of capturing lessons learnt from improvement activity, communicating them across the business and having a standard way of tracking the benefits of each main improvement activity could enable the Service to improve faster.
4.17 We found that there is a tendency in the Service for process improvements to take place in silos. We found, for example, that measures of process performance tend to cover performance within specific business units, rather than being clearly linked to the end-to-end objectives of the process.
4.18 Furthermore, staff told us that the different parts of the end-to-end process do not communicate well with each other. The Consumer Consultants from CCD told us that other areas of the business do not understand what they do or the importance of CCD for the business. The Operations Director, to whom both CCD and all the business units within casework report, should therefore take responsibility for mitigating the natural tendency of business units to operate rather independently from each other.
Embedding the customer perspective
4.19 The Financial Ombudsman Service is a customer-facing organisation. It is therefore important that the organisation clusters its thinking around the common needs of its customers. We would expect to see understanding of the customer embedded into the operational design of the Service.
4.20 We found that there has been work undertaken at organisational level to understand the consumer journey and consumer types based on their individual characteristics. The Service has done research looking at the socio-demographic characteristics of complainants and how they have changed over time. For example, over the last three years, since consumer credit came under the Service’s jurisdiction, there has been a significant increase in complaints from consumers with lower socio-economic status, and an increase in hardship complaints due to the economic climate.

40 Part Four Efficient handling of financial services complaints
4.21 The Service also conducts a public awareness survey to monitor awareness of its services across the population. The Service has used this research to carry out behavioural analysis segmenting people into different types of complainants based on their attitudes towards complaining. However, these insights about consumers are not yet being translated into process design. Demand is not segmented on an understanding of the consumer and is limited to segmentation by product type. The Service should look to embed its understanding of consumers more fully into its process design, to help it provide a more efficient service to consumers.
4.22 The Service engages with businesses at a senior level on a regular basis and works closely with them to improve the compatibility of processes. Our consumption mapping exercises with three financial services firms suggested that more could be done to better understand the processes of complaint handlers at a working level in order to improve communication between them and the Service’s adjudicators.
Efficient handling of financial services complaints Appendix One 41
Appendix One
Methodology
The following table shows each of the main sections of fieldwork and its purpose. The fieldwork took place between June and October 2011.
Selected method Purpose
1 Review of key documents
We reviewed a selection of internal Financial Ombudsman Service documents relating to the change programmes.
To inform our understanding of what the change programmes consisted of and how they were being implemented. Further details are provided in Appendix Two.
2 Semi-structured interviews
We carried out interviews with Financial Ombudsman Service staff including: Senior management Project and programme managers
And with key stakeholders including: Regulatory bodies Consumer groups CMCs Firms
To develop our understanding of the efficiency challenges facing the Service and our understanding of the change programmes being implemented.
3 Staff focus groups
We conducted four staff focus groups with staff from different departments within the Financial Ombudsman Service.
To gain understanding of staff perspectives into the change programmes and the impact they felt these would have on their working practices.
4 Review of case files
We reviewed 20 case files covering a number of product types selected at random.
To understand the structure of the paper files and issues relating to resolving a case.
5 Process Management Maturity Assessment
We conducted this assessment using internal expertise in process management. The assessment included reviewing documents, interviews with staff and process walk-throughs.
To look at the information the Service collects and the extent to which they are using this information to improve their process. Further details are provided in Appendix Three.

42 Appendix One Efficient handling of financial services complaints
6 Discrete-Event simulation modelling
We created a model of the Financial Ombudsman Service’s case-handling process, and applied it specifically to mortgage cases.
To investigate how cases flow through the case-handling process and explore the impacts of changes in demand and resourcing. Further details are provided in the accompanying technical paper.
7 Unit cost analysis
We conducted analysis of the unit cost by breaking down the cost by product type.
To calculate how the unit cost is driven by case mix volatility.
8 Consumption Mapping
We built maps of the customer journey when resolving a complaint with the Financial Ombudsman Service for both consumers and firms.
To further understand the case-handling process identifying the parts of the process that are valuable to the customer and those that may add waste into the process.

Efficient handling of financial services complaints Appendix Two 43
Appendix Two
Change Programme Assessment Framework
In order to assess the implementation of the change programmes, we compared the evidence we collected from semi-structured interviews and document reviews against a framework of expected project and programme management characteristics. The framework consisted of statements, grouped into six areas, that we would expect to see in projects and programmes that are being managed to a high standard.
Area Expectations of good project management
Business Model Clear project vision articulated, project supports organisational targets, consideration of project interdependencies, clear success criteria, quantifiable clearly articulated and owned benefits, senior management support project, project and programme roles defined, project benefit to stakeholders, progress steps and risk registers monitored against targets and owned, detailed programme plan, and suitable budget, ownership and monitoring of this budget.
Implementation and Performance Management
Clear project plan with defined stages, project risk register that is escalated to programme risk register and then sponsoring group, progress regularly monitored against deadlines, effective management of risks, dependencies, budgets and benefits.
Service Management Where outsourcing is used: a structured Service Level Agreement including performance indicators, success criteria and accountability, which is regularly reviewed and updated.
People Effective reviewing of staff capacity and capability, consideration of additional resources, training process, detailed communication plan including consideration of channels of communication, high levels of awareness in staff affected by change.
Process End-to-end process owners identified with clear responsibilities and control, change will have a positive effect on the process, preparation for impact including monitoring for unintended impacts, clear and accessible documentation which is regularly updated.
Technology Piloting of applications before full implementation, applications are cost-effective and adaptable to allow continuous improvement, end-to-end process is secure, legacy data identified and clear transition arrangements planned.

44 Appendix Three Efficient handling of financial services complaints
Appendix Three
Process Management Maturity Assessment
1 Our specialist process management team performed process walk-throughs on six processes selected by the Service. We looked at the induction of new adjudicators (Human Resources), help-desk management (Information Technology), management information (Finance), converting a case (Customer Contact Division), initial decision (Adjudicator stage) and ombudsman administration (ombudsman stage). Employees of the Service had three weeks’ advance warning to prepare sources of evidence for review.
2 We assessed the processes examined against the National Audit Office’s Process Management Maturity Model to develop our understanding of whether the direction of travel in the Service is towards strong process management. Process maturity was assessed against five key areas in the framework:
• using strategy to define and drive process activity;
• using information to manage and improve process performance;
• using continuous improvement to target areas of most benefit;
• ensuring the end-to-end process has the capacity and capability to meet demand; and
• helping people manage and improve process performance.
3 The framework is broken down into an Organisational and Operational assessment. Forty questions are asked across the five areas which test 270 characteristics of process management. The evidence for the assessment is gathered from a number of sources, including reading relevant documents, talking to members of staff and looking at the process in operation.

Design and Production byNAO CommunicationsDP Ref: 009795-001
