department of education · department of education to the administration for community living inthe...
TRANSCRIPT

Department of Education
SALARIES AND EXPENSES OVERVIEW
Fiscal Year 2016 Budget Request
CONTENTS
Page
Introduction ............................................................................................................................. X-1 FY 2016 Budget Request ........................................................................................................ X-2 Participation in Governmentwide E-Government Initiatives ..................................................... X-7 Budget Authority by Account ................................................................................................... X-9 Budget Authority by Object Classification .............................................................................. X-10 Full-Time Equivalent Employment by Account ...................................................................... X-11 Full-time Equivalent Employment by Office ........................................................................... X-12 Detail of Full-time Equivalent Employment ............................................................................ X-13 Organization Chart ................................................................................................................ X-14 Locations of Major Administrative Contractors ...................................................................... X-15 Report on the Budget Formulation and Execution Line of Business ...................................... X-16

SALARIES AND EXPENSES OVERVIEW INTRODUCTION
This overview summarizes the administrative costs and staffing for all Department accounts. Departmental administrative costs and full-time equivalent (FTE) employment are supported in 2016 from funding in the following accounts: Program Administration (PA), Office for Civil Rights (OCR), Office of Inspector General (OIG), College Housing and Academic Facilities Loans Program (CHAFL), Historically Black College and University Capital Financing Program (HBCUCF), Institute of Education Sciences (IES), and Student Aid Administration (SAA). Greater detail on the funds supporting administrative costs and staffing is provided separately in each account’s justification materials.
Key programs administered by the Department include Title I of the Elementary and Secondary Education Act (ESEA), which under the Department’s 2016 request would provide $15.4 billion to help approximately 23.8 million students in high-poverty schools make progress toward State academic standards; Individuals with Disabilities Education Act Part B Grants to States, which would provide $11.7 billion to help States and school districts meet the special education needs of 6.6 million students with disabilities; Federal Pell Grants, which would make available nearly $32.1 billion in need-based grants to 8.4 million students enrolled in postsecondary institutions; and the postsecondary student loan programs, which would help provide roughly $137 billion in new and consolidated Direct Loans to help students and families pay for college.
Operational activities necessary for the everyday work of the Department, include expenses for:
• Facilities management, including rent for office space and guard services;
• Phone and computer network services;
• Operation and maintenance of the Department’s Web sites (e.g., www.ed.gov and www.studentaid.gov); and
• Grants payment processing.
The fiscal year (FY) 2016 budget request also places emphasis on improving departmental management of programs and resources. Specific management priorities include:
• Financial management, including projects designed to ensure accountability for departmental assets, improve grants management, and provide better financial data to managers;
• Improving staff performance, including leadership development for employees;
• Improving recruitment, retention, and development of staff;
• Improving the acquisition process through development of the acquisition workforce and reducing reliance on high-risk contract vehicles;
• Analyzing office space needs in order to identify opportunities to reduce the Department’s footprint;
X-1
SALARIES AND EXPENSES OVERVIEW
• Information technology, including improving the capability to collect educational data and a continued focus on data security;
• Student aid administration, with a focus on administering Pell Grants and student loans; and
• Program performance improvement to inform decisionmakers and focus limited resources on programs that work, and to reform or eliminate programs that do not.
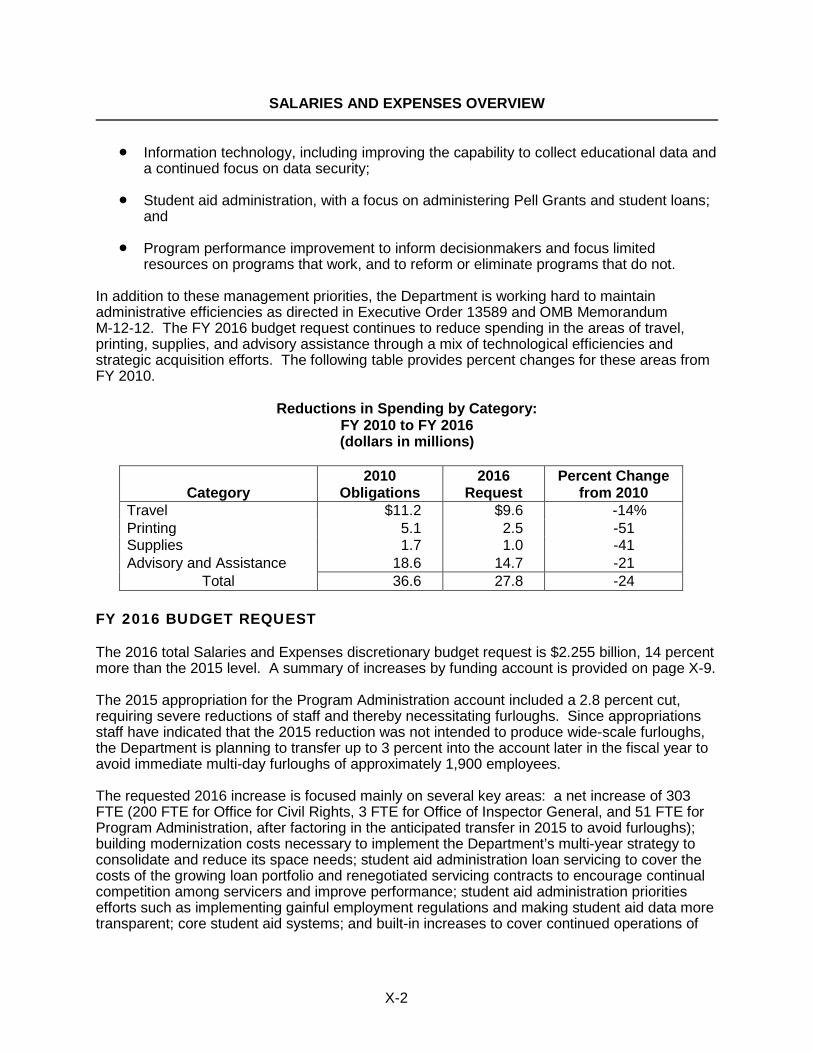
In addition to these management priorities, the Department is working hard to maintain administrative efficiencies as directed in Executive Order 13589 and OMB Memorandum M-12-12. The FY 2016 budget request continues to reduce spending in the areas of travel, printing, supplies, and advisory assistance through a mix of technological efficiencies and strategic acquisition efforts. The following table provides percent changes for these areas from FY 2010.
Reductions in Spending by Category: FY 2010 to FY 2016 (dollars in millions)
Category 2010
Obligations 2016
Request Percent Change
from 2010 Travel $11.2 $9.6 -14% Printing 5.1 2.5 -51 Supplies 1.7 1.0 -41 Advisory and Assistance 18.6 14.7 -21
Total 36.6 27.8 -24 FY 2016 Budget Request FY 2016 BUDGET REQUEST
The 2016 total Salaries and Expenses discretionary budget request is $2.255 billion, 14 percent more than the 2015 level. A summary of increases by funding account is provided on page X-9.
The 2015 appropriation for the Program Administration account included a 2.8 percent cut, requiring severe reductions of staff and thereby necessitating furloughs. Since appropriations staff have indicated that the 2015 reduction was not intended to produce wide-scale furloughs, the Department is planning to transfer up to 3 percent into the account later in the fiscal year to avoid immediate multi-day furloughs of approximately 1,900 employees.
The requested 2016 increase is focused mainly on several key areas: a net increase of 303 FTE (200 FTE for Office for Civil Rights, 3 FTE for Office of Inspector General, and 51 FTE for Program Administration, after factoring in the anticipated transfer in 2015 to avoid furloughs); building modernization costs necessary to implement the Department’s multi-year strategy to consolidate and reduce its space needs; student aid administration loan servicing to cover the costs of the growing loan portfolio and renegotiated servicing contracts to encourage continual competition among servicers and improve performance; student aid administration priorities efforts such as implementing gainful employment regulations and making student aid data more transparent; core student aid systems; and built-in increases to cover continued operations of
X-2
SALARIES AND EXPENSES OVERVIEW financial systems and IT security, a proposed pay raise, an extra paid day in 2016, increases in FERS benefits, and rent.
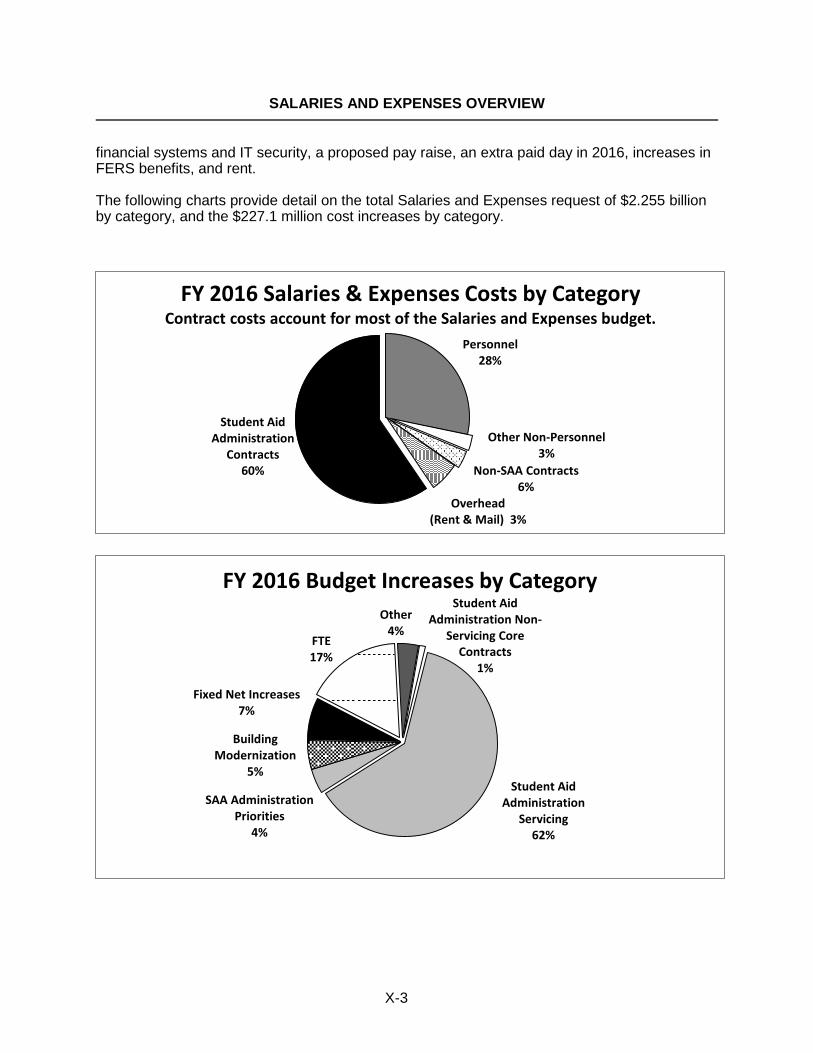
The following charts provide detail on the total Salaries and Expenses request of $2.255 billion by category, and the $227.1 million cost increases by category.
Personnel 28%
Other Non-Personnel 3%
Overhead (Rent & Mail) 3%
Non-SAA Contracts 6%
Student Aid Administration
Contracts 60%
FY 2016 Salaries & Expenses Costs by Category Contract costs account for most of the Salaries and Expenses budget.
Fixed Net Increases 7%
FTE 17%
Other 4%
Student Aid Administration Non-
Servicing Core Contracts
1%
Student Aid Administration
Servicing 62%
SAA Administration Priorities
4%
Building Modernization
5%
FY 2016 Budget Increases by Category
X-3

SALARIES AND EXPENSES OVERVIEW STAFFING AND COSTS SUMMARY
Staffing
The Department’s programs and responsibilities have grown substantially over the past two decades. There has been landmark legislation affecting the very core of the Department’s business. From elementary and secondary education reform to the transition to 100 percent direct lending to the significant increase in civil rights related complaints, the past decade has seen a steady and significant growth in Department workload. There has also been a dramatic increase in costs to maintain security of data systems, as well as an enhanced focus on prudent financial and information technology management.
At the same time, staffing levels for most Department accounts are at all-time lows, with many vacancies going unfilled for several years. The 2016 request includes funding for 4,328 FTE to provide an adequate level of personnel to address current workload demands. Requested FTE increases include 200 FTE for the Office of Civil Rights and 51 FTE for Program Administration (PA) (after excluding the reduction of FTE in 2016 resulting from the transfer of staff to HHS, and including the staffing impacts of the anticipated transfer in 2015 to avoid furloughs). The requested FTE level for PA would still be lower than 2008.
The Workforce Innovation and Opportunity Act, H.R. 803, Public Law 113-128, dated July 22, 2014, will transfer certain functions and personnel of the Rehabilitation Services Administration (RSA) and the functions and personnel of the National Institute on Disability and Rehabilitation Research in the Office of Special Education and Rehabilitative Services (OSERS) from the Department of Education to the Administration for Community Living in the Department of Health and Human Services. This transfer must occur within a year of bill passage (i.e., no later than July 21, 2015). OSERS estimates that 40 FTE will be transferred; these FTE, therefore, have been excluded from the 2016 request.
As shown in the following chart, Department staff are divided between Washington, D.C., headquarters, 11 regional offices, and 13 field offices. Most regional and field office staff are in Federal Student Aid (FSA), the Office of Inspector General, and the Office for Civil Rights. The FSA regional office staff conduct reviews of lenders, institutions, and guaranty agencies participating in student financial aid programs, and perform debt collection activities on defaulted student loans. OIG staff conduct audits and investigations of Department programs and operations. OCR staff investigate civil rights complaints and conduct civil rights compliance reviews.
X-4

SALARIES AND EXPENSES OVERVIEW
Personnel and Non-Personnel Costs Summary
The budget request includes $637.9 million for personnel compensation and benefits. The request is an increase of $52.7 million from the 2015 level. Non-personnel costs cover such items as travel, rent, mail, telephones, utilities, printing, information technology (IT), contractual services, equipment, supplies, and other departmental services. The total budget for non-personnel activities in 2016 is $1.6 billion, an increase of $227.1 million from the 2015 level. Seventy-seven percent, or $174 million of the non-pay increase, is the result of higher Student Aid Administration discretionary servicing costs. Other increases are in the areas of space reduction and consolidation, business process reengineering, and IT systems consolidation (e.g., migrating to laptops to facilitate telework and reduce rent for office space; redesigning the Impact Aid System; upgrading financial systems; obtaining an independent, third-party review of the Department’s IT security environment); and reengineering ED's management of student privacy controls.
Centralized Overhead and Technology
Departmental overhead expenses cover centralized support and administrative services for all program and staff offices. The funds are administered by the Office of Management. These services include rent, building alterations and repairs, lease renewal, training, supplies, mail, and physical security for buildings and personnel. A total of $149.8 million is requested for these costs in 2016, an increase of $23.3 million from the 2015 level. The increase is primarily
Boston
New York City
Philadelphia
Washington, D.C.
Regional Offices
Field Offices
Location of the Department of Education Regional and Field Offices
Seattle
SanFrancisco Denver
KansasCity
Chicago
Atlanta
Dallas
ClevelandSacramento
Long Beach
Puerto Rico Pembroke Pines
Pittsburgh
St. Paul
Austin
Phoenix
Nashville
Ann Arbor
X-5
SALARIES AND EXPENSES OVERVIEW for the renovation of Department occupied buildings to help reduce the overall space footprint, increases in background investigations mostly due to a higher number of contractors for Federal Student Aid requiring security clearances, increases in rent due to the expiration of the rent abatement for the LBJ Federal building as well as historically based cost escalations.
Information technology activities that comprise centralized IT services include computer operations, maintenance and improvements, local area network operations, initiatives designed to link Department business needs with the best available technology, and other commonly shared IT and office automation activities. The funds are administered by the Office of the Chief Information Officer. A total of $95.1 million is requested, an increase of $6.8 million from the 2015 level. The increase includes funding for continued operations, necessary upgrades of and enhancements to EDCAPS, the Department’s core financial system; and necessary upgrades to IT security operations, IT system consolidation (including migrating to laptops to facilitate telework and reduce rent costs), and Education Department Utility for Communications, Applications, and Technical Environment (EDUCATE), for the computer communications network and related services and equipment.
Improper Payments
The Department continues to focus on preventing, reducing, and recovering improper payments.
The Department relies on a variety of monitoring efforts to prevent and recapture improper payments. The Department has continuous controls monitoring software to help detect anomalies and potential issues in all grant, loan, and contract payments made through the G5 payment system. This automated tool is used to examine payment records and identify problems such as duplicate payments, unduly large payments, overpayments, and potential fictitious vendors. The Department maintains a robust internal control program to identify, recover, and report, as appropriate, all grant, loan, and other administrative payment errors. These efforts support the Department’s strategic goal to improve its organizational capacity by increasing the efficient and effective use of resources.
Another promising initiative is the improved use of data and text analytics for A-133 Single Audit reports to identify and address the root cause of common grantee challenges. The Department’s budget includes $1.4 million for this initiative, including funds for processing audits at the Federal Audit Clearinghouse, the Department’s Audit Accountability and Resolution Tracking System, and predictive analytics. The goal is to leverage existing data sources to improve program outcomes. Easier access to the audit data should help Education staff and grantees in resolving audits. The data analytics effort is consistent with OMB’s grant reform initiative and its new Omni circular, which streamlines eight Federal regulations into a single, comprehensive policy guide, to reform and strengthen Federal grantmaking.
Finally, risk assessments and estimates of improper payments continue to be performed in accordance with the Improper Payments Elimination and Recovery Improvement Act (IPERIA). For risk susceptible programs, management will continue to prioritize and assess risk for each type of payment within each program, identify and estimate improper payment amounts and rates, identify and categorize root causes for improper payments, and implement corrective actions to reduce improper payments. Existing corrective actions include activities to increase
X-6

SALARIES AND EXPENSES OVERVIEW accuracy of Student Aid Application information through the use of the Free Application for Federal Student Aid (FAFSA), the IRS Data Retrieval Tool (DRT), and school verification.
PARTICIPATION IN GOVERNMENTWIDE E-GOVERNMENT INITIATIVES
The Department is actively participating in a number of Governmentwide e-Government initiatives designed to make it easy for citizens and businesses to interact with the Government, save taxpayer dollars, and streamline citizen-to-Government communications. The Department has budgeted a total of $3.0 million in 2015, and requests $3 million in 2016 for these initiatives. The request includes support for the following initiatives:
(in whole dollars)
E-Gov Initiative FY 2015 FY 2016 Budget Formulation and Execution Line of Business $105,000 $105,000
Enterprise Human Resource Integration 133,000 140,000
E-Rulemaking 68,000 123,000
E-Travel 172,000 172,000
Financial Management Line of Business 220,000 231,000
Geospatial Line of Business 25,000 25,000
GovBenefits.gov* 298,000 269,000
Grants.gov 544,000 447,000
Human Resource Management Line of Business 65,000 65,000
Integrated Acquisition Environment 87,000 75,000
Integrated Acquisition Environment – Grants and Loans* 1,290,000 1,290,000
USAJOBS 25,000 23,000
Total $3,032,000 $2,965,000
NOTE: Funding for initiatives marked with an asterisk * is from the Student Aid Administration account; funding for all other initiatives is from the Program Administration account.
X-7

SALARIES AND EXPENSES OVERVIEW Shared Service (Non E-gov)
Planning and Performance Management Database – 2015: $100,000; 2016: $53,000; Program Administration account.
The Planning and Performance Management Database initiative will improve access to and the value of information on Government goals, performance, organization, and programs to enhance public accountability while meeting the GPRA Modernization Act reporting requirements efficiently.
X-8

SALARIES AND EXPENSES OVERVIEW
Department of Education
Budget Authority by Account (dollars in thousands)
Click here for accessible version
Budget Authority by Account
2016 Change fromACTIVITY 2014 2015 Request 2015 to 2016
Program Administration:
Salaries and Expenses $422,917 $411,000 $460,259 $49,259
Building Modernization 0 0 13,830 13,830
Office for Civil Rights 98,356 100,000 130,691 30,691
Office of Inspector General 57,791 57,791 59,256 1,465
Subtotal, Departmental Management 579,064 568,791 664,036 95,245
Administrative costs from program accounts:
College Housing and Academic Facilities Loans 435 435 450 15
Historically Black College and University Capital Financing 334 334 340 6
Institute of Education Sciences:
National Assessment Governing Board 8,235 8,235 7,827 (408)
National Board for Education Sciences 275 275 275 0
Student Aid Administration
Salaries and Expenses 663,251 715,745 726,643 10,898
Servicing Activities 502,749 681,179 855,211 174,032
Subtotal, program accounts 1,175,279 1,406,203 1,590,746 184,543
Total, Salaries and Expenses 1,754,343 1,974,994 2,254,782 279,788
NOTE: Excludes $1 million for the Health Education Assistance Loan (HEAL) transfer from HHS in FY 2014. The 2015 Appropriation forthe Program Administration account does not reflect two anticipated transfers. The first would transfer funds to the Department ofHealth and Human Services for necessary administrative expenses per Section 491 of the Workforce Innovation and Opportunity Act, P.L.113-128. The second would avoid potential furloughs of staff by using the Department’s authority to transfer up to 1 percent of another discretionary appropriation as long as the receiving appropriation does not increase by more than 3 percent, with the sending appropriationto be determined.
X-9

SALARIES AND EXPENSES OVERVIEW Budget Authority by Object Classification Click here for accessible version
Budget Authority by Object Classification(dollars in thousands)
2016 Change fromObject Class 2014 2015 Request 2015 to 2016
11.10 Full-time permanent $425,972 $433,339 $470,591 $37,25211.31 Full-time temporary 15,133 8,605 9,582 97711.32 Part-time 1,841 1,194 961 (233)11.33 Consultants 454 350 355 511.51 Overtime 437 446 503 5711.52 Awards 4,967 4,368 4,475 10711.80 Other Compensation 0 0 0 0
Compensation subtotal 448,804 448,302 486,467 38,165
12.00 Benefits 130,601 136,713 151,266 14,553
13.01 Benefits for former personnel 355 180 180 0
21.00 Travel 9,253 8,548 9,612 1,06422.00 Transportation of things 76 301 76 (225)
23.10 Rental Payments to GSA 74,523 73,831 78,239 4,40823.31 Communications 583 486 641 15523.32 Postage/fees 967 789 784 (5)
Subtotal 23 76,073 75,106 79,664 4,558
24.00 Printing & Reproduction 3,207 2,490 2,512 22
25.10 Advisory and Assistance Svcs 11,197 9,625 14,653 5,02825.21 Other Services 592,063 760,367 963,678 203,31125.22 Training/Tuition/Contracts 5,292 5,120 5,853 73325.23 Field Readers 10 10 10 025.30 Goods/Services from Gov't 46,866 38,323 42,925 4,60225.40 Operations/Maint of Facilities 381 256 266 1025.71 Operations/Maint of Equipment 1,334 1,163 1,164 125.72 IT Services/Contracts 424,824 484,279 483,780 (499)
Subtotal 25 1,081,967 1,299,143 1,512,329 213,186
26.00 Supplies 1,015 1,000 1,033 33
31.01 IT Equipment/Software 1,154 1,691 1,632 (59)31.03 Other Equipment 257 232 304 72
Subtotal 31 1,411 1,923 1,936 13
32.00 Building Alterations 1,581 1,288 9,707 8,41943.01 Interest and Dividends 0 0 0 0
Total 1,754,343 1,974,994 2,254,782 279,788
Total Pers. Comp. & Ben. 579,760 585,195 637,913 52,718Total Non-Personnel 1,174,583 1,389,799 1,616,869 227,070
NOTE: Excludes $1 million for the Health Education Assistance Loan (HEAL) transfer from HHS in FY 2014. The 2015 Appropriation for the Program Administration account does not reflect two anticipated transfers. The first would transfer funds to the Department of Health and Human Services for necessary administrative Act expenses per Section 491 of the Workforce Innovation and Opportunity Act, P.L.113-128. The second wouldpotential furloughs of staff by using the Department’s authority to transfer up to 1 percent of another discretionary appropriation as long as the receiving appropriation does not increase by more than 3 percent, with the sending appropriation to be determined.
X-10

SALARIES AND EXPENSES OVERVIEW
Department of Education
Full-time Equivalent Employment (Staff Years) by Account
Click here for accessible version Full-Time Equivalent Employment by Account
2016 Change fromACCOUNT 2014 2015 Request 2015 to 2016
Program Administration 1,898 1,861 1,961 100Office for Civil Rights 544 554 754 200Office of Inspector General 249 241 244 3 Subtotal, Departmental Management 2,691 2,656 2,959 303
FTE funded from program accounts:
College Housing and Academic Facilities Loans 3 3 3 0Historically Black College and University Capital Financing 1 1 1 0Institute of Education Sciences: National Assessment Governing Board 11 14 14 0 National Board for Education Sciences 1 1 1 0Student Aid Administration Discretionary authority 1,320 1,350 1,350 0 Mandatory authority 0 0 0 0 Subtotal, program accounts 1,336 1,369 1,369 0
Subtotal, FTE 4,027 4,025 4,328 303
Total, discretionary authority 4,027 4,025 4,328 303 Total, mandatory authority 0 0 0 0
Total, FTE 4,027 4,025 4,328 303
NOTE: The 2015 Appropriation for the Program Administration account does not reflect two anticipated transfers. The first would transfer funds to the Department of Health and Human Services for necessary administrative expenses per Section 491of the Workforce Innovation and Opportunity Act, P.L.113-128. The second would avoid potential furloughs of staff by using the Department’s authority to transfer up to 1 percent of another discretionary appropriation as long as the receiving appropriation does not increase by more than 3 percent, with the sending appropriation to be determined.
X-11

SALARIES AND EXPENSES OVERVIEW Full-time Equivalent Employment by office
Click here for accessible version
2016 Change fromOFFICE 2014 2015 Request 2015 to 2016
Advisory Committee on Student Financial Assistance 5 6 6 0
Career, Technical and Adult Education 77 72 75 3
Chief Financial Officer 172 166 174 8
Chief Information Officer 125 122 140 18
Civil Rights 544 554 754 200
Communications and Outreach 104 98 103 5
Deputy Secretary 63 37 52 15
Elementary and Secondary Education 224 244 262 18
English Language Acquisition, Language Enhancement, and
Academic Achievement for Limited English Proficient Students 15 18 19 1
Federal Student Aid 1,235 1,247 1,247 0
General Counsel 103 103 110 7
Innovation and Improvement 85 97 102 5
Inspector General 249 241 244 3
Institute of Education Sciences 173 174 188 14
Legislation and Congressional Affairs 17 18 19 1
Management 173 167 179 12
National Assessment Governing Board 12 14 14 0
National Board for Education Sciences 0 1 1 0
Planning, Evaluation, and Policy Development 100 102 108 6
Postsecondary Education 178 183 191 8
Secretary 93 88 92 4
Special Education and Rehabilitiative Services 246 240 213 -27
Under Secretary 34 33 35 2
Total, FTE 4,027 4,025 4,328 303
NOTE: The 2015 Appropriation for the Program Administration account does not reflect two anticipated transfers. The first would transfer funds to the Department of Health and Human Services for necessary administrative expenses per Section 491of the Workforce Innovation and Opportunity Act, P.L.113-128. The second would avoid potential furloughs of staff by using the Department’s authority to transfer up to 1 percent of another discretionary appropriation as long as the receiving appropriation does not increase by more than 3 percent, with the sending appropriation to be determined.
Department of Education
Full-time Equivalent Employment (Staff Years) by Office
X-12

SALARIES AND EXPENSES OVERVIEW
Detail of Full-time Equi valent Employment
Executive level I........................... 1 1 1Executive level II.......................... 2 3 3Executive level III......................... 1 1 1Executive level IV........................ 3 10 10Executive level V......................... 1 2 2 Subtotal..................................... 8 17 17 Total - EX Salary....................... $1,348,475 $2,799,675 $2,806,700
Senior Executive Service.............… 87 96 96 Subtotal - ES .....................…...... 1/ 87 96 96 Total - ES Salaries........................ $14,509,425 $15,926,400 $16,010,400
AL................................................. 1 1 1AD................................................ 165 165 176ED/EI........................................… 6 6 8GS/GM-15...............................…. 497 501 515GS/GM-14..................................... 914 921 948GS/GM-13..................................... 1,084 1,092 1,124GS-12........................................... 730 735 777GS-11........................................... 208 212 261GS-10........................................... 1 1 2GS-9............................................. 139 146 182GS-8............................................. 37 38 40GS-7............................................. 90 90 105GS-6............................................. 14 12 20GS-5............................................. 18 16 32GS-4............................................. 24 20 30GS-3............................................. 7 7 11GS-2............................................. 3 3 5GS-1............................................. 0 0 1 Subtotal...................................... 3,939 3,966 4,237
Total full-time equivalent employment, end of year........... 4,034 4,079 4,350
Full-time equivalent usage......................................... 4,027 4,025 4,328
Average ES salary....................... $166,775 $165,900 $166,775Average GS/GM grade................. 12.2 12.2 12.0Average GS/GM salary................ $106,535 $107,622 $107,989
1/ FY 2014 includes 12 FSA SES positions. FY 2015 & FY 2016 include 10 FSA SES positions.
Department of Education
Detail of Full-Time Equivalent Employment
2014 Actual 2016 RequestDetail
2015 Estimate
X-13
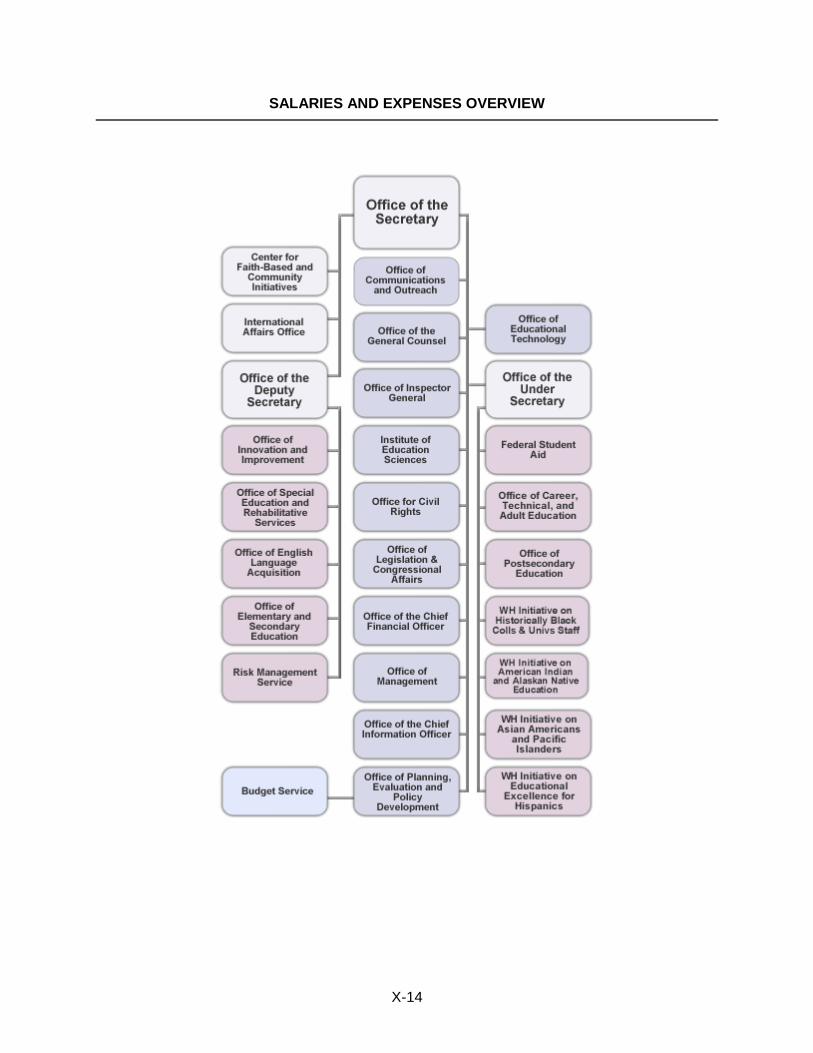
SALARIES AND EXPENSES OVERVIEW Organization Chart
X-14

Locations of Major Administrative Contractors
X-15
7 Denver
Department of Education Locations of Major Administrative Contracts
and Current Contractors
2,9 Plano 11 San Antonio
1,5,6,9,10 Lawrence
5, 10 Coralville, 3 West Des Moines
3 Louisville, KY 3 Frankfurt, KY 11 Monticello, KY
10 Montgomery
5,10,11 Arlington, VA
1,4,6,9,10,12 Washington, DC
1, 3* McLean, VA 2,9,10 Fairfax, VA
5 Great Falls, VA
11 Columbus
10, Rockville, MD 8 Bethesda, MD 6, Clarksville, MD
10 Phoenix
3* Madison
3* Lincoln
3* Chesterfield
10 Las Cruces
11 Niagara Falls
10 Reston, VA 1,5,6,9,10 Herndon, VA 1,5,6,10 Alexandria, VA 10 Ashburn, VA
3* Newark, DE
5 Venice
3* Salt Lake City
3* Concord, NH
3 Knoxville
11 Philadelphia 3* Harrisburg 3* Coraopolis
3* Oklahoma City
3 Columbia
3* Winooski, VT
10 Aurora, Mt. Vernon
NOTE: An asterisk represents a headquarters location for loan servicing contracts. A full listing of locations can be found in the Student Aid Administration Congressional Justification.
3 Raleigh
10 Hattiesburg, MS
1 Financial Management System (FSA) 7 Payroll/Personnel Processing Center (OM) 2 EDUCATE (OCIO) 8 Education Department Central Automated Processing 3 Loan Servicers (FSA) Systems (EDCAPS)(OCIO) 4 OCR CRDC Survey (OCR) 9 Virtual Data Center (FSA) 5 National Student Loan Data System (FSA) 10 Front End Business Integration (FSA) 6 Integrated Partner Management (FSA) 11 Common Origination and Disbursement (FSA)

SALARIES AND EXPENSES OVERVIEW Report on the Budget Formulation and Execution Line of Business as Required by Division D, Section 737(d) of the Consolidated Appropriations Act, 2008, P.L. 110-161
The U.S. Department of Education assumed the role as the first Managing Partner for the Budget Formulation and Execution Line of Business (BFELoB) in the fall of 2006. The focus of the BFELoB is to build a “budget of the future” by promoting information-sharing across Government Agency budget offices, as well as building a “community of practice.” Through this collaboration, the budget community has been identifying best practices for all aspects of budget formulation and execution. The BFELoB strives to find solutions linking budget formulation, execution, planning, performance, and financial management information.
Goals of the BFELoB include improvement and enhancements of:
• the efficiency and effectiveness of Agency and central processes for formulating and executing the Federal Budget;
• the integration and standardized exchange of budget formulation, execution, planning, performance measurement, and financial management information and activities across the Government;
• capabilities for analyzing budget formulation, execution, planning, performance, and financial information in support of decisionmaking;
• capabilities for aligning programs and their outputs and outcomes with budget levels and actual costs to institutionalize budget and performance integration; and
• the efficiency and effectiveness of the Federal budgeting workforce.
BFELoB anticipates 10-year savings of over $200 million Governmentwide due to efficiencies gained through collaboration and increased use of technology. Many Agency budget offices do not have automated systems to support budget formulation and execution activities. Agencies rely on basic office software and manual processes. BFELoB’s goal is to reduce time spent by budget personnel on manual processes and increase time spent on high priority analytical activities (via increased use of technology, improved processes, and a better equipped workforce).
BFELoB is a mixed lifecycle investment. Activities and solutions under development by BFELoB workgroups are at different stages within the development lifecycle. Products under development are listed in the Objectives and Benefits table below and include implementation or projected implementation dates.
The following tables display the objectives and benefits, risks, costs, and Agency contributions to BFELoB.
X-16

SALARIES AND EXPENSES OVERVIEW
Objectives and Benefits: Technology Capability Objectives and Benefits
Technology
Collaboration
Improves the efficiency and effectiveness of Government activities through the ready accessibility of information, and the ability to collaborate remotely both within an Agency (i.e., collaboration with regional and field staff) and across Federal Agencies (i.e., collaboration of each Agency with OMB and other Agencies on shared programs). Current products include the MAX Federal Community; secure online meeting capability; MAX Shared Desktop and MAX Calendar. Current Status: The MAX Federal Community, a cross-agency collaboration platform, provides increased information sharing, collaboration, and knowledge management securely across the Federal Government, as well as within each Agency. With approximately 119,000 members (up from 96,000 in February 2014), the MAX Federal Community is reportedly the largest Government- operated collaboration site. Usage is currently growing at a rate of over 1,000 users per month. Many Agencies are also using the secure MAX Shared Desktop or the secure online meeting tool allowing Agency personnel to attend meetings remotely with presentations displayed on their computer screens, and MAX survey to quickly gather and analyze information via tokenized surveys.
Data Collection & Tracking
Improves OMB and Agency efficiency and effectiveness in carrying out the numerous required budget data exercises. Benefits apply to both central budget exercises (i.e., those required of Agencies by OMB) and exercises at the departmental or Agency level (i.e., those requested by central offices of Agency regional and field offices). Agency benefits include increased data collection capabilities, reduced errors, and reduced time spent manually consolidating and publishing data. Current products include multiple Web-based data collection tools for central budget exercises, as well as a Web-based tool, MAX Collect, for Agency use in the collection of budget briefing and question and answer materials. Over 200 MAX Collect exercises have been utilized in the last year alone. Current Status: BFELoB data collection tools have already demonstrated value by automating the collection of data for dozens of centralized exercises related to the budget community for earmarks, continuing resolutions, Questions for the Record (QFRs) and across-the-board reductions. The MAX Collect tool provides even greater benefit by enabling Agency budget offices to automate their own data collection exercises. Agencies are now using the tool to facilitate a broad range of data calls and data collection exercises numbering in the hundreds.
X-17

SALARIES AND EXPENSES OVERVIEW
Knowledge Management
Improves the ability of Agencies to locate and access information, increases the availability and comprehensiveness of data, and improves the ability of the budgeting community to manage the impending retirement of key personnel. Database-driven products such as the MAX Federal Community and MAX Collect enhance knowledge management capabilities by capturing “knowledge” as it is generated, simply as a by-product of these tools.
Agency Budget Formulation and Execution Tools
Provides a cost-effective strategy for Agencies that do not have budget formulation and execution applications, or have outdated applications, to quickly improve their effectiveness through automation. This effort encourages common and integrated solutions that are reusable Governmentwide. Products include the Budget Formulation and Execution Manager system (BFEM), the first shared budget formulation system by the Department of Treasury; the Departmental E-Budgeting System (DEBS), a shared offering from the Department of Labor; the Decision Matrix for budget systems evaluation (full systems evaluations); the Budget Capability Self-Assessment Tool (BC SAT); and the MAX A-11 Data Transfer and Rule Validation project, for which multiple services have gone live each year from 2011 – 2014, the most recent of which is Appendix Text capabilities rolled out in November 2014. The Decision Matrix allows Agencies to define their specific budget system requirements and evaluates the capability and maturity of six Agency and three commercial budget systems against those requirements. The Budgeting Capability Self-Assessment Tool (BC SAT) has provided several Agencies with comprehensive resource listings to further help them with strategic planning and resourcing. Current Status: The MAX A-11 Rule Validation team developed processes, methodologies, and standards to enable Agencies to exchange data with OMB's MAX A-11 system through the use of multiple ‘services’, going live with the final set of services this year for A-11 Data Entry that have greatly improved the process, eliminated large amounts of manual data entry, and enabled availability of account level information on a real-time basis. BFELoB continues to support Treasury’s BFEM and Labor’s DEBS systems as they provide customer Agencies with enhanced connections to OMB’s MAX budget system and has been working with EPA as they finalize their budget system deployment as a potential shared service.
Analytical Tools
Enhances Federal capabilities for analyzing budget formulation, execution, planning, performance, and financial information. This enables more complete, thorough, and timely analysis, which will in turn provide policy decisionmakers with improved understanding of policy option impacts and alternatives. Current products include the MAX Analytics tool suite, which creates custom charts and graphs for analysis, and associated tools built upon the analytics core (such as MAX Calendar). Current Status: MAX Analytics integrates with BFELoB data collection and collaboration tools, enabling charts that update automatically as new data is entered. Agencies have been using MAX Analytics to dynamically display the results of their data collections and to transform how they use analytics to
X-18
SALARIES AND EXPENSES OVERVIEW
manage problems. BFELoB continues to work with Agencies to include the most relevant and useful capabilities in the tool suite. Several Agencies (OMB, DOJ, Treasury, etc.) are now utilizing MAX Analytics to drive decisionmaking based upon analysis not previously possible.
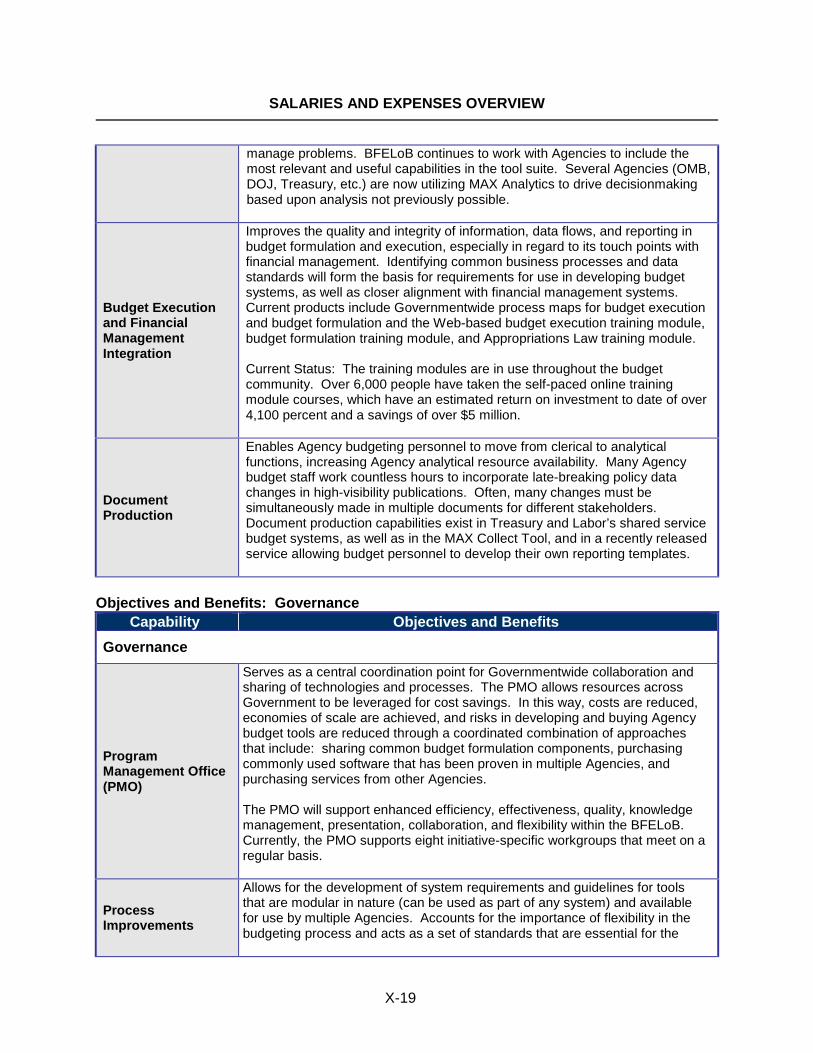
Budget Execution and Financial Management Integration
Improves the quality and integrity of information, data flows, and reporting in budget formulation and execution, especially in regard to its touch points with financial management. Identifying common business processes and data standards will form the basis for requirements for use in developing budget systems, as well as closer alignment with financial management systems. Current products include Governmentwide process maps for budget execution and budget formulation and the Web-based budget execution training module, budget formulation training module, and Appropriations Law training module. Current Status: The training modules are in use throughout the budget community. Over 6,000 people have taken the self-paced online training module courses, which have an estimated return on investment to date of over 4,100 percent and a savings of over $5 million.
Document Production
Enables Agency budgeting personnel to move from clerical to analytical functions, increasing Agency analytical resource availability. Many Agency budget staff work countless hours to incorporate late-breaking policy data changes in high-visibility publications. Often, many changes must be simultaneously made in multiple documents for different stakeholders. Document production capabilities exist in Treasury and Labor’s shared service budget systems, as well as in the MAX Collect Tool, and in a recently released service allowing budget personnel to develop their own reporting templates.
Objectives and Benefits: Governance
Capability Objectives and Benefits Governance
Program Management Office (PMO)
Serves as a central coordination point for Governmentwide collaboration and sharing of technologies and processes. The PMO allows resources across Government to be leveraged for cost savings. In this way, costs are reduced, economies of scale are achieved, and risks in developing and buying Agency budget tools are reduced through a coordinated combination of approaches that include: sharing common budget formulation components, purchasing commonly used software that has been proven in multiple Agencies, and purchasing services from other Agencies. The PMO will support enhanced efficiency, effectiveness, quality, knowledge management, presentation, collaboration, and flexibility within the BFELoB. Currently, the PMO supports eight initiative-specific workgroups that meet on a regular basis.
Process Improvements
Allows for the development of system requirements and guidelines for tools that are modular in nature (can be used as part of any system) and available for use by multiple Agencies. Accounts for the importance of flexibility in the budgeting process and acts as a set of standards that are essential for the
X-19

SALARIES AND EXPENSES OVERVIEW
Capability Objectives and Benefits automated exchange of budget data with Treasury and OMB, as well as Agency financial management systems. Current products include numerous updates to the MAX Federal Community, MAX Collect, MAX Analytics, and MAX Shared Desktop as well as implementation of MAX Authentication services at eight Agencies with work underway to support several more with “single sign-on” capabilities. We have had discussions with the Performance Management Line of Business on how we can best link up with that community to our mutual benefit and will continue to explore that relationship in the coming year.
Service Module Standardization
Encourages reusability and interoperability of budget systems across Agencies to achieve significant cost savings through a "build once, use often" philosophy. Service module registration via the PMO will help ensure that Agencies are aware of existing services so that duplicative investments are not made.
Objectives and Benefits: Human Capital
Capability Objectives and Benefits
Human Capital
Budget Human Capital
Enhances the effectiveness of the existing budgeting workforce and encourages participation from other professions within Government, the private sector, and universities. BFELoB provides a central venue for the budget community, OPM, and the Council of Human Capital Officers to grow the appeal of Federal Budgeting as a career by combining Agency efforts to define budget career paths, core competencies, leadership development, certification programs, and sharing of ideas in areas such as succession planning, retention and recruitment. Products include recommendations on core competencies and proficiency levels; a Budget Career Day conference devoted to enabling budget professionals to better plan their careers while providing tools for them to do so; and training curricula for budget analysts, as well as no-cost training courses for budget staff and self-paced training modules. More are planned for the coming year. Current status: Thousands of Government employees have undergone no-cost training through in-class, Web-based, or facilitated online training sessions hosted by the BFELoB. Monthly panel discussions featuring an OMB and senior agency budget staff, focusing on specific budgeting related topics, have been attended by over 1,500 individuals since the Department began hosting over 3 years ago. Brownbag discussion groups focusing on a deeper understanding of budget execution and on the Budget Career Road Map have been attended by over 500 people. An indepth course focusing on Basic Budget Processes began in 2013 and has been held quarterly, with waiting lists and strong participation. The first Budget Career Day, hosted at ED in June 2014 to great reviews, provided guidance, materials and expert advice from senior budget leaders and professionals across the budget community.
X-20
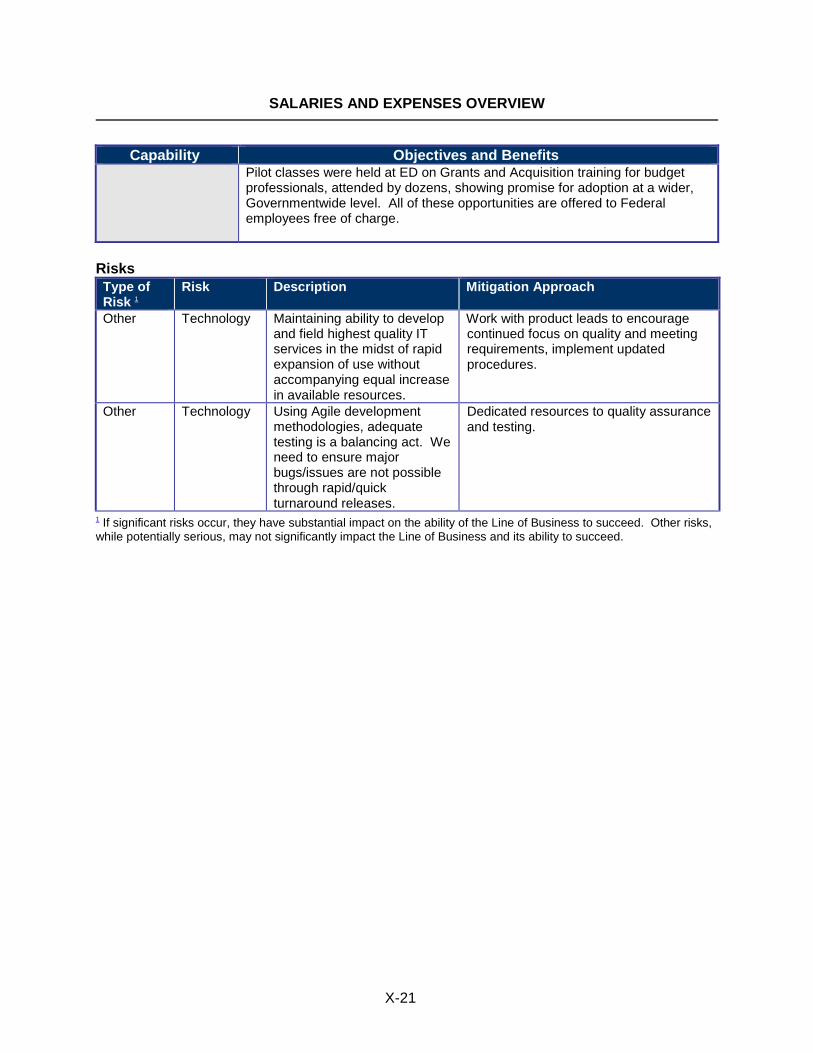
SALARIES AND EXPENSES OVERVIEW
Capability Objectives and Benefits Pilot classes were held at ED on Grants and Acquisition training for budget professionals, attended by dozens, showing promise for adoption at a wider, Governmentwide level. All of these opportunities are offered to Federal employees free of charge.
Risks Type of Risk 1
Risk Description Mitigation Approach
Other Technology Maintaining ability to develop and field highest quality IT services in the midst of rapid expansion of use without accompanying equal increase in available resources.
Work with product leads to encourage continued focus on quality and meeting requirements, implement updated procedures.
Other Technology Using Agile development methodologies, adequate testing is a balancing act. We need to ensure major bugs/issues are not possible through rapid/quick turnaround releases.
Dedicated resources to quality assurance and testing.
1 If significant risks occur, they have substantial impact on the ability of the Line of Business to succeed. Other risks, while potentially serious, may not significantly impact the Line of Business and its ability to succeed.
X-21

SALARIES AND EXPENSES OVERVIEW
Line of Business IT Costs (dollars in thousands)
Costs by project 2007 2008 2009 2010 2011 2012 2013 Planning 516 437 655 100 125 125 116 Acquisition 714 904 810 355 335 350 375 Operations & Maint. 401 650 680 720 685 700 781 Govt FTE Costs 376 490 444 162 172 238 244
2,007 2,481 2,589 1,337 1,317 1,413 1,516
FTEs 2 4 4 4 4 2 2
Costs by project 2014 2015 2016 Planning 78 95 95 Acquisition 178 285 285 Operations & Maint. 919 1185 1185 Govt FTE Costs 100 100 100
1,275 1,565 1565
FTEs 1 1 1
X-22

SALARIES AND EXPENSES OVERVIEW
Anticipated Contributions by Agency (dollars in thousands)
AGENCY FY
2014 FY
2015 FY
2016 Department of Agriculture $95 $95 $95 Department of Commerce 105 105 105 Department of Defense--Military 105 105 105 Department of Education (direct funds) 105 105 105 Department of Energy 105 105 105 Department of Health and Human Services 105 105 105 Department of Homeland Security 105 105 105 Housing and Urban Development 105 105 105 Department of the Interior 105 105 105 Department of Justice 105 105 105 Department of Labor 105 105 105 Department of State 105 105 105 Department of Transportation 105 105 105 Department of the Treasury 105 105 105 Department of Veterans Affairs 105 105 105 US Army Corps of Engineers-Civil Works 80 80 80 Environmental Protection Agency 75 75 75 General Services Administration 105 105 105 National Aeronautics and Space Administration 105 105 105 National Science Foundation 105 105 105 USAID 105 105 105 Office of Personnel Management 105 105 105 Small Business Administration 50 50 50 Securities and Exchange Commission 50 50 50 Social Security Administration 0 50 50 Millennium Challenge Corporation 50 50 50 Broadcasting Board of Governors 50 0 0 Office of National Drug Control Policy 50 50 50 Consumer Financial Protection Board 50 0 0
X-23