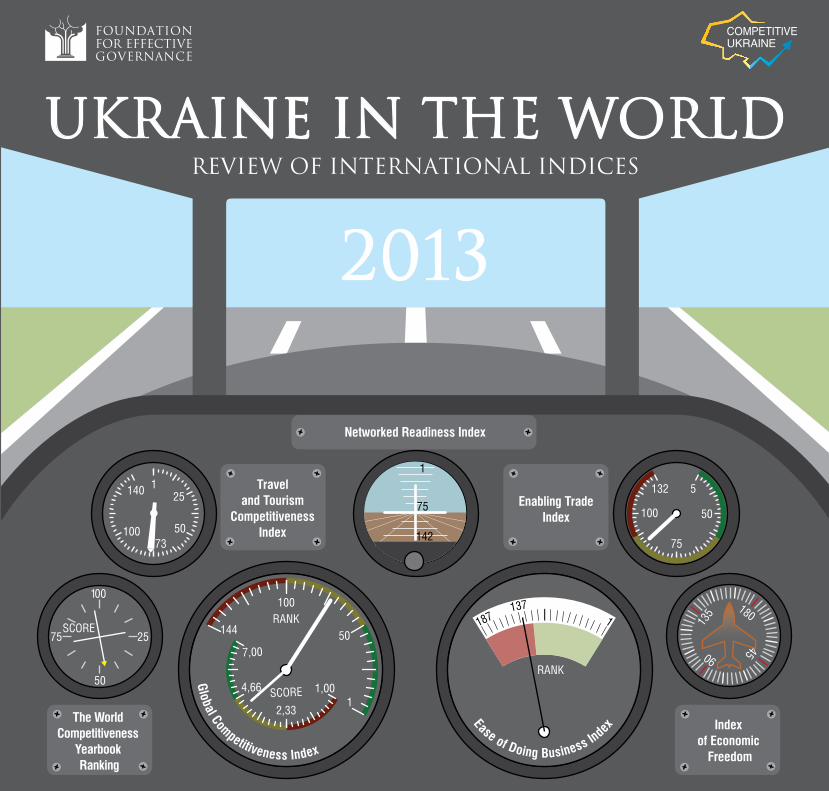
ukraine inthe world 2013
DESCRIPTION
This publication describes the indices/rankings that are most reputable and quoted in UkraineTRANSCRIPT
The Foundation established in 2007 to develop and implement projects and programs focused on the long-term development of the Ukrainian economy and to further public debate on the most important economic challenges facing Ukraine. FEG is a nonprofit, independent organization serving the interests of Ukrainian citizens.
FEG’s initiatives are focused on practical results; therefore, it actively cooperates with the government at all levels during the development and realization of its projects and programs.
One of FEG’s fundamental principles is to engage top international experts. Each project is carried out in partnership with leading international organizations that have extensive expertise in solving similar challenges. International experts in close cooperation with Ukrainian specialists directly interact with the appropriate State authorities to take into account the best world practice as well as the features of the Ukrainian economy. After the programmes are approved, the Foundation assists the authorities in implementing the reforms.
The Foundation for Effective Governance is Mr. Rinat Akhmetov’s private initiative; it is his personal contribution to the economic development of Ukraine and the facilitation of systematic dialogue among experts, government, business, civil society organizations, and mass media.The Foundation’s Founder provides financial support, leaving the full independence of actions and decisions to the Foundation, within the framework of the existing mission.
FEG official web-site: www.feg.org.ua
Ukraine’s competitiveness portal: www.competitiveukraine.org
Public debates web-site: www.debaty.org

CONTENTS
Introduction ...........................................................................1
Ukraine in 2012 .....................................................................2
I. GEnERAl IndIcES ............................................................7
Global competitiveness Index ................................................8
The World competitiveness Yearbook Ranking ....................14
Ease of doing Business Index ...............................................19
Index of Economic Freedom .................................................24
ІІ. SPEcIAlIzEd IndIcES ..................................................29
Enabling Trade Index............................................................30
Travel and Tourism competitiveness Index ...........................36
networked Readiness Index .................................................42
ІІІ. SPEcIAl VIEW ..............................................................47
SEdA – Sustainable Economic development Assessment .....48
IV. APPEndIcES ..................................................................53
Graphic Representation of Indices’ Methodology ..................54
list of Abbreviations .............................................................61
61
LiST Of abbrEviaTiONS
iNdiCESGcI Global competitiveness Index lPI logistics Performance Index nRI networked Readiness IndexSEdA Sustainable Economic development Assessment TTcI Travel and Tourism competitiveness Index WcY World competitiveness Yearbook
OrgaNizaTiONS & aSSOCiaTiONS BcG Boston consulting Group cIS commonwealth of Independent States EU European Union IATA International Air Transport AssociationIlO International labour Organization IMd Institute for Management development OEcd Organisation for Economic co-operation and
development Un United nations UncTAd United nations conference on Trade and
developmentUnEScO United nations Educational, Scientific and
cultural Organization UnWTO United nations World Tourism Organization VISA Visa International Service AssociationWB World Bank Wcc World competitiveness center WEF World Economic Forum WTO World Trade Organization WTTc World Travel and Tourism council
TErmSASA Air service agreementATM Automated teller machineFdI Foreign direct investmentsGdP Gross domestic product GnP Gross national product IcT Information and communication technologies T&T Travel and tourism sector2G / 3G Second- / Third generation wireless telephone
technology

1
IntroductIon
there are many various indices and rankings in the world today: global and local, comprehensive and specialized,
regular and one-off. These indices measure various spheres, processes and phenomena in countries, regions, or cities. However, as a result, they all evaluate the successfulness of a specific state, region, or city in comparison with its “competitors” also fighting for limited resources: the money of buyers on world markets, investments, business production capacities, talented specialists, in the end. To put it simply, the higher a country’s position in the ranking, the more successful it is in the potential fight for a certain resource. Most indices are public, and their results are available to anyone. This makes them an attractive tool for the analysis and executive decisionmaking, including at a state level. The most important stages of the algorhythm for the “safe” application of such tool are:
1) Understanding the essence of the index: what it measures and evaluates and why;
2) Understanding the methodology: which indicators are used for the evaluation, what are the sources of information, how is the final value of the index calculated;
3) The ability to correctly explain the index’s results: which real processes and phenomena lie behind specific indicators/groups of indicators, what correlation is there between specific indicators, what kind of comparison with other countries (regions) is justified and objective;
4) The ability to determine priorities and arrive at correct decisions “here and now”: which of the index’s results are essential to a given country (region) at the moment, where should imited resources be applied in order to achieve the best result, which is measured by the improvement of indicators in the index and getting higher ranks compared to other states.
Violating this algorhythm results in false evaluations and, what is worse, wrong decisions, the price of which might be too high.
Over the last years, different international indices/rankings have been obtaining more and more attention in Ukraine.
However, their use as a tool for making and implementing of decisions would be far more effective if users would know how to read indices correctly, how to interprete and apply indices’ results. The main objective of this publication is to raise the level of understanding the methodology of the indices that are most important to the country and to broaden the opportunities for use of their results. This digest doesn’t contain recommendations, but presents objective information on the reasons of Ukraine’s positioning in selected indices by highlighting country’s competitive advantages and restraining factors. This information should be useful for making grounded decisions and developing economic programs for the country.
This publication describes the indices/rankings that are most reputable and quoted in Ukraine, such as:
• The Global Competitiveness Index by the World Economic Forum
• The World Competitiveness Yearbook by the Institute for Management Development
• The Doing Business Report by the World Bank
• The Index of Economic Freedom by The Heritage Foundation in partnership with The Wall Street Journal
IntroductIon

2
uKrAInE’S ProFILE
Within two years (2011-2012), Ukraine has improved its result in the Global Competitiveness Index (GCI) by the
World Economic Forum by 16 positions, moving up to the 73rd position among 144 states, which is practically the pre-crisis level of 2008 (72nd).
Within tWo years, Ukraine has “Won” 20 positions back from rUssia , thUs narroWing the gap betWeen them to six slots in the gci ranking. among its closest neighbors, Ukraine sUrpassed romania and croatia.
Taking over higher positions in the GCI ranking was accompanied by a breakthrough in the World Bank’s Ease of Doing Business Index: the country moved 15 slots upwards in the ranking among 185 world countries having reached its best position over the last 6 years. Such results certify that doing business in the state becomes easier and national economy’s competitiveness, provided by business, is rising.
At the same time, during the last years Ukraine held 56–57 positions out of 60 states (mostly European) in the World Competitiveness Yearbook (WCY) ranking by the Institute for Management Development (Lausanne, Switzerland), not being able to recover its 46th position, lost in result of the crisis, although it lifted to 49th in 2013.
Ukraine loses 48 places to the Wci index’s leader (Usa) and Wins 11 places from the oUtsider (VenezUela). in addition, the state loses 7 positions to rUssia.
On the other hand, the country constantly earns low marks in the Index of Economic Freedom prepared since 1995 by The Heritage Foundation in partnership with The Wall Street Journal. Over the last 6 years, Ukraine has lost 28 positions in the ranking of 177 countries and, with the worst result in Europe, moved to position 161: from the category of “mostly
not free” to “repressed” states. In accordance with the Index methodology, this confirms the fact that business has begun to experience additional activity limitations.
The clue to seemingly obvious contradictions in evaluations and rankings is practically on the surface: this is the interpretation of international indices, each with its own peculiarities first of all in the methodologies of calculation and ranges of ranked components. Only the understanding of the methodology of a certain index and its correct interpretation allows one to see the real picture and determine the spheres of possible practical application of the gained results. At the same time one should remember that loss of a ranking’s positions does not often mean worsening of the state’s scores – other states can just be faster in improving of their results.
The Global Competitiveness Index by the WEF consists of twelve groups of indicators of various importance depending on the stage of economic development of a particular state. Two-thirds of the indicators are the results of executives’ opinion
uKrAInE In 2012
2007
1
185
46/55
135/157
139/178
134/157
145/181 153/179
142/183
163/179
145/183
163/179
152/183
163/179
137/185
73/131 72/13482/133 89/139 82/142
73/144
54/55 56/57 57/58 57/59 56/59
2008 2009 2010 2011 2012
World Competitiveness Yearbook (IMD)Global Competitiveness Index (WEF)Ease of Doing Business Index (The World Bank)Index of Economic Freedom (The Heritage Foundation)
Chart 1. The dynamics of Ukraine’s positions’ in the selected indices
Source: Institute for Management Development, The World Competitiveness Yearbook, 2007-2012; World Economic Forum, The Global Competitiveness Report, 2007-2012; The World Bank, The Doing Business Report, 2007-2012; The Heritage Foundation in partnership with The Wall Street Journal, Index of Economic Freedom, 2007-2012

3
uKrAInE’S ProFILE
survey, and just one-third comes from statistic data. Ukraine has improved its positions in the GCI during the last two years mostly because of the stabilization of economy performance and recovery after a critical downturn as a result of the 2008-2009 global financial crisis, as well as higher scores for infrastructure resulting from the large-scale preparation campaign for the Euro-2012 Football Championship finals.
Within tWo years, Ukraine has improVed its macro-economic enVironment score by 1.2 points and Went 40 positions UpWards in the gci ranking Where this factor is inclUded.
On the contrary, two-thirds of the indicators of the World Competitiveness Scorecard by the Institute for Management Development (IMD) are statistics, while the remaining are results from surveying of managers. The index consists of 20 groups of indicators assembled into four categories with a different impact on the final score of the index. The IMD ranking notes a serious decline of Ukraine in two out of the four categories: economy performance and infrastructure. The latter includes scientific infrastructure, public health, and education. Ukraine’s positions in the other two categories of indicators have either remained on the same level or improved insignificantly. At the same time, taking into account the GCI ranking dynamics, Romania is the only state rated in the WCY out of the 16 states,which Ukraine has surpassed in the GCI over the last two years (after three years of systematic downturn). Thus, a sharp rise in one of the rankings does not contradict the possibility of a “stagnation” in the other one, while the difference in Ukraine’s positions as to the individual competitiveness components within the two quoted rankings can be explained by the choice of ranked countries and the final indicators used for their comparison, as well as certain differences in grouping and aggregating the indicators.
The Ease of Doing Business Index by the World Bank analyzes 11 groups of quantitive indicators evaluating the legal acts that regulate activities of small and medium-sized businesses in particular state, hindering or encouraging their development.
In other words, the factors that favour business activity are evaluated, with an emphasis on small and medium-sized business segments. The Index of Economic Freedom, in its turn, analyzes 10 components of economic freedom which, in their aggregate, evaluate the level of national limitations imposed on business, i.e. “hostility” of the environment created by states to boost the unrestricted functioning of companies of any size and activity. In essence, these are two sides of the same coin with different methodology and interpretation of the above
mentioned indices. Thus, it’s quite natural that the state gained ground in doing business, however the “margins of manoeuvre” for business are shrinking. Ukraine’s situation is mirrored by Russia (position 112 in Doing Business, and 139 in Economic Freedom) and China (91 and 136, respectively) for example. However, Belarus is one of the brightest examples: even though it holds a plausible 58th position in Doing Business, it occupies a very low 154th position out of 177 countries concerning Economic Freedom.
20070%
100%
82%
55%
96%
53%
96%
61%
97%
63%
95%
57%
93%
50%
20102008 20112009 2012
World Competitiveness Yearbook (IMD)Global Competitiveness Index (WEF)
Chart 2. The share of states surpassing Ukraine, % of the total number of ranked countries
Source: Calculations by Foundation for Effective Governance based on the sources: Institute for Management Development, The World Competitiveness Yearbook, 2007-2012; World Economic Forum, The Global Competitiveness Report, 2007-2012;

4
uKrAInE’S ProFILE
georgia has demonstrated eqUal sUccess both in simplifying procedUres for condUcting bUsiness and liberation it from VarioUs restrictions: With the 9th and 21st place in doing bUsiness and economic freedom indices, respectiVely.
Thus, it may be concluded that both indices should be considered as a pair: this provides the opportunity to evaluate the actual level of favourability of the national environment for doing business.
Nonwithstanding the different approaches to data evaluation and index calculation, there are some general trends in Ukraine’s results in economic development, and business as its driver in particular. For example, ineffective functioning of government institutions negatively affects Ukraine’s results in all of the considered indices (see Chart 6). The government institutions include the entire institutional and legislative infrastructure created and administered by the government (as an actor) in order to organize and regulate all the social and economic processes in the society.
Just 15 states including Algeria, Burundi, Chad, and Madagascar, and only Russia among European countries received lower marks for institutions in the GCI ranking.
Chart 3. Ukraine’s positions in comparison to peer countries
World Competitiveness Yearbook (IMD) Global Competitiveness Index (WEF)
1 1
60 14456
48
383432
7367
514341
Kazakhstan Poland Turkey Russia Ukraine Poland Turkey Kazakhstan Russia Ukraine
Source: Institute for Management Development, The World Competitiveness Yearbook, 2007-2012; World Economic Forum, The Global Competitiveness Report, 2007-2012
20070%
100%
20102008 20112009 2012
Ease of Doing Business (The World Bank)Index of Economic Freedom (The Heritage Foundation)
Chart 4. The share of states surpassing Ukraine, % of the total number of ranked countries
Source: The World Bank, The Doing Business Report, 2007-2012; The Heritage Foundation in partnership with The Wall Street Journal, Index of Economic Freedom, 2007-2012
78%85% 85% 85%
91% 91% 91%
80% 77% 79%83%
74%

5
uKrAInE’S ProFILE
Ukraine and rUssia haVe similar problems concerning the efficiency of goVernment and priVate institUtions: the coUntries stand side by side in the gci With most of the indicators in this groUp.
The most problematic issues concern property rights protection, corruption and the inefficiency of bureaucrats. Ukraine displays the same trend for the “government efficiency” component holding a low 56th position out of 59 states in the WCY 2012 ranking. Thereat, while occupying one of the middle places in the ranking (29) as to government finance, Ukraine holds very low positions for institutional infrastructure and legislation regulating business activity (both – 58th place).
Government institutions also determine the level of comfort for business development in a state and, thus, can be one of the factors “attracting” or “scaring off” business activity. Weak protection of investors (property rights) where Ukraine ranks 117th, and complications with obtaining construction permits, where it ranks 183rd out of 185 countries, made weighty contribution to Ukraine’s poor results on Ease of Doing Business.
the only states Where it’s more difficUlt to obtain a constrUction permit than in Ukraine are albania and eritrea (a small coUntry in north-east africa), tWo states Where no legislation at all oUtlines the procedUres of obtaining constrUction permits for priVate companies.
Economic freedom in Ukraine is first of all restricted by corruption (149th position out of 177 countries), high rate of government spending (154th place), problems with doing business (148th place), mostly due to complicated and expensive licensing process, and underdeveloped investment framework (154th place).
Corruption is one of the problematic zones in every abovementioned index. This conclusion is explicitely confirmed by Ukraines’ low marks in the special index calculated by Transparency International, the Corruption Perceptions Index (CPI). This annual ranking of world states has been calculated since 1993, reflecting the perception of the level of corruption by analysts and entrepreneurs . The Index is complex, composed of 13 different expert surveys and entrepreneur opinion polling.
Chart 5. Ukraine’s position in comparison to peer countries
Index of Economic Freedom (The Heritage Foundation) Ease of Doing Business Index (The World Bank)
1
185 185
137
112
91
676558
9
Source: The Heritage Foundation in partnership with The Wall Street Journal, Index of Economic Freedom, 2013; The World Bank, The Doing Business Report, 2012
Georgia Belarus Czech Rep. Azerbaijan China Russia Ukraine1
161154
139136
88
2921
Georgia Czech Rep. Azerbaijan China Russia Belarus Ukraine
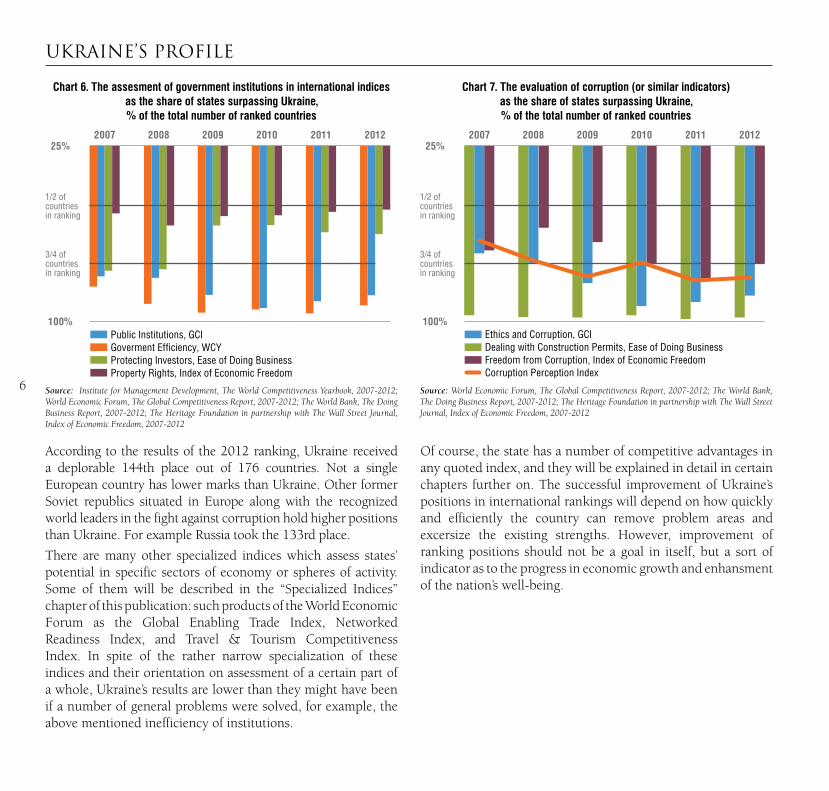
6
According to the results of the 2012 ranking, Ukraine received a deplorable 144th place out of 176 countries. Not a single European country has lower marks than Ukraine. Other former Soviet republics situated in Europe along with the recognized world leaders in the fight against corruption hold higher positions than Ukraine. For example Russia took the 133rd place.
There are many other specialized indices which assess states’ potential in specific sectors of economy or spheres of activity. Some of them will be described in the “Specialized Indices” chapter of this publication: such products of the World Economic Forum as the Global Enabling Trade Index, Networked Readiness Index, and Travel & Tourism Competitiveness Index. In spite of the rather narrow specialization of these indices and their orientation on assessment of a certain part of a whole, Ukraine’s results are lower than they might have been if a number of general problems were solved, for example, the above mentioned inefficiency of institutions.
Of course, the state has a number of competitive advantages in any quoted index, and they will be explained in detail in certain chapters further on. The successful improvement of Ukraine’s positions in international rankings will depend on how quickly and efficiently the country can remove problem areas and excersize the existing strengths. However, improvement of ranking positions should not be a goal in itself, but a sort of indicator as to the progress in economic growth and enhansment of the nation’s well-being.
uKrAInE’S ProFILE
200725%
100%
20102008 20112009 2012
Ethics and Corruption, GCIDealing with Construction Permits, Ease of Doing BusinessFreedom from Corruption, Index of Economic FreedomCorruption Perception Index
Chart 7. The evaluation of corruption (or similar indicators) as the share of states surpassing Ukraine, % of the total number of ranked countries
Source: World Economic Forum, The Global Competitiveness Report, 2007-2012; The World Bank, The Doing Business Report, 2007-2012; The Heritage Foundation in partnership with The Wall Street Journal, Index of Economic Freedom, 2007-2012
1/2 of countries in ranking
3/4 of countries in ranking
200725%
100%
20102008 20112009 2012
Public Institutions, GCIGoverment Efficiency, WCYProtecting Investors, Ease of Doing Business Property Rights, Index of Economic Freedom
Chart 6. The assesment of government institutions in international indices as the share of states surpassing Ukraine, % of the total number of ranked countries
Source: Institute for Management Development, The World Competitiveness Yearbook, 2007-2012; World Economic Forum, The Global Competitiveness Report, 2007-2012; The World Bank, The Doing Business Report, 2007-2012; The Heritage Foundation in partnership with The Wall Street Journal, Index of Economic Freedom, 2007-2012
1/2 of countries in ranking
3/4 of countries in ranking
I. GEnErAL IndIcES

8
I. GEnErAL IndIcES
the Global Competitiveness Index (GCI) measures the ability of economies to ensure higher business productivity and, as a
result, higher rates of economic growth, and the nations’ well-being.
In 2012, Ukraine placed 72nd in the global competitiveness ranking, having improved its result by 9 positions, mostly due to the macroeconomic environment, infrastructure, goods market efficiency, and business sophistication factors. However, in absolute terms, positive dynamics could be observed by all competitiveness pillars.
In spite of GCI’s positive dynamics over the last 3 years, Ukraine wasn’t able to achieve its 2005 maximum (64th position), and only almost attained its pre-crisis 2008 level (72nd position).
Weak institutions, low efficiency of the goods market, and problems concerning financial market development are all the pillars restraining the growth of Ukraine’s competitiveness.
Higher education and training, health and primary education, and market size are the pillars, which still provide Ukraine with competitive advantages.
Compared to other countries, Ukraine’s situation is a lot worse concerning the soundness of banks, efficiency of legal framework in settling disputes, and protection of minority shareholders’ interests. Ukraine is the leader among outsiders as to these components. None of the states compared to Ukraine received worse results. The quality of roads and FDI technology transfer also require considerable improvement.
Lowering the burden of government regulation and raising the independence of the judicial system are priority areas for improving the states’ institutional environment, while providing of fair and free competition is crucial for improving of the goods market efficiency.
Ukraine’s positive dynamics are accompanied by relatively positive dynamics of its closest neighbors. Thus, in order to preserve competitive advantages it is not only important to improve Ukraine’s results, but also to make these adjustments faster than competitors.
Factors facilitating development Score Rank ChangeQuality of railroad infrastructure 4.5 24
Mobile telephone subscriptions/100 pop. 123 43
Secondary education enrollment, gross % 95.6 49
Tertiary education enrollment, gross % 79.5 10
Quality of math and science education 4.6 34
Trade tariffs, % duty 2.9 43
Flexibility of wage determination 5.3 44
Hiring and firing practices 4.9 16
Pay and productivity, 4.5 25
Domestic market size index 4.4 35
Availability of scientists and engineers 4.8 25
Factors restraining development Score Rank ChangeProperty rights 2.7 134
Irregular payments and bribes 2.7 133
Burden of government regulation 2.4 135
Efficiency of legal framework in settling disputes 2.4 141
Protection of minority shareholders’ interests 3 141
Quality of roads 2.3 137
Extent and effect of taxation 1/2 2.3 139
Efficiency of anti-monopoly policy 3.2 132
Burden of customs procedures 2.8 138
Brain drain 2.3 131
Soundness of banks 3.1 142 Source: World Economic Forum, The Global Competitiveness Report, 2011–2012
tHE GLobAL comPEtItIvEnESS IndEx
9
I. GEnErAL IndIcES
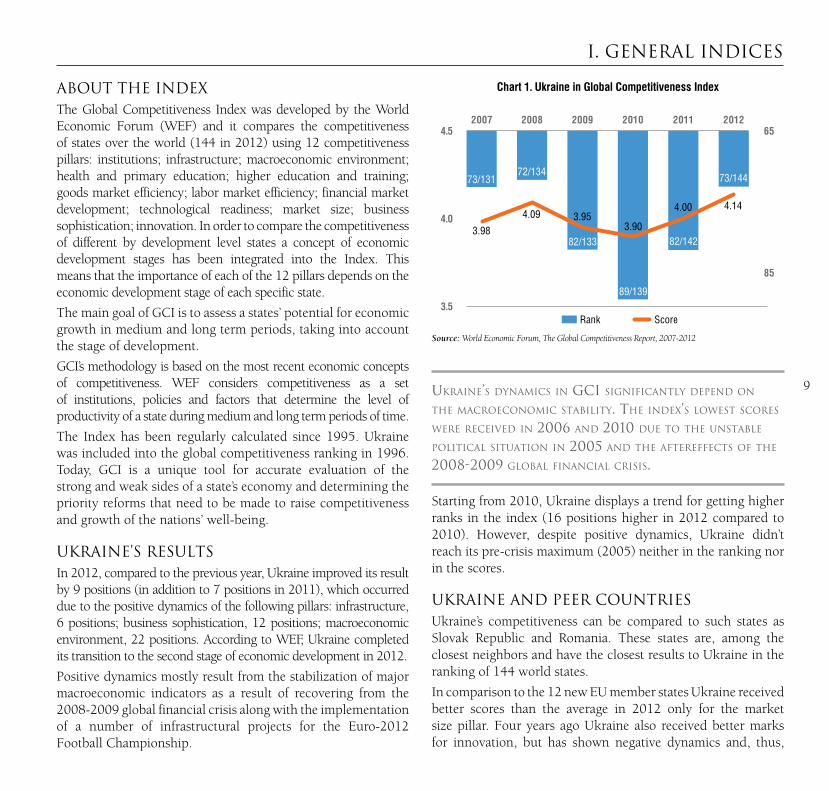
About tHE IndExThe Global Competitiveness Index was developed by the World Economic Forum (WEF) and it compares the competitiveness of states over the world (144 in 2012) using 12 competitiveness pillars: institutions; infrastructure; macroeconomic environ ment; health and primary education; higher education and training; goods market efficiency; labor market efficiency; financial market development; technological readiness; market size; business sophistication; innovation. In order to compare the competitiveness of different by development level states a concept of economic development stages has been integrated into the Index. This means that the importance of each of the 12 pillars depends on the economic development stage of each specific state. The main goal of GCI is to assess a states’ potential for economic growth in medium and long term periods, taking into account the stage of development. GCI’s methodology is based on the most recent economic concepts of competitiveness. WEF considers competitiveness as a set of institutions, policies and factors that determine the level of productivity of a state during medium and long term periods of time. The Index has been regularly calculated since 1995. Ukraine was included into the global competitiveness ranking in 1996. Today, GCI is a unique tool for accurate evaluation of the strong and weak sides of a state’s economy and determining the priority reforms that need to be made to raise competitiveness and growth of the nations’ well-being.
uKrAInE’S rESuLtSIn 2012, compared to the previous year, Ukraine improved its result by 9 positions (in addition to 7 positions in 2011), which occurred due to the positive dynamics of the following pillars: infrastructure, 6 positions; business sophistication, 12 positions; macroeconomic environment, 22 positions. According to WEF, Ukraine completed its transition to the second stage of economic development in 2012. Positive dynamics mostly result from the stabilization of major macroeconomic indicators as a result of recovering from the 2008-2009 global financial crisis along with the implementation of a number of infrastructural projects for the Euro-2012 Football Championship.
20074.5
4.0
65
85
3.5
20102008 20112009 2012
Rank Score
Chart 1. Ukraine in Global Competitiveness Index
Source: World Economic Forum, The Global Competitiveness Report, 2007-2012
73/131
3.98
4.09 3.953.90
4.00 4.14
72/134
82/133
89/139
82/142
73/144
Ukraine’s dynamics in gci significantly depend on the macroeconomic stability. the index’s loWest scores Were receiVed in 2006 and 2010 dUe to the Unstable political sitUation in 2005 and the aftereffects of the 2008-2009 global financial crisis.
Starting from 2010, Ukraine displays a trend for getting higher ranks in the index (16 positions higher in 2012 compared to 2010). However, despite positive dynamics, Ukraine didn’t reach its pre-crisis maximum (2005) neither in the ranking nor in the scores.
uKrAInE And PEEr countrIES Ukraine’s competitiveness can be compared to such states as Slovak Republic and Romania. These states are, among the closest neighbors and have the closest results to Ukraine in the ranking of 144 world states.
In comparison to the 12 new EU member states Ukraine received better scores than the average in 2012 only for the market size pillar. Four years ago Ukraine also received better marks for innovation, but has shown negative dynamics and, thus,

10
I. GEnErAL IndIcES
lost this advantage. The greatest gap concerns technological readiness, and keeps getting bigger in comparison to the pre-crisis period, even in spite of Ukraine’s better scores. This confirms that technologically Eastern European neighbors are developing faster than Ukraine.
Just as before the crisis, Ukraine continues to receive lower marks than the average developed EU countries for all competitiveness pillars. The gaps are relatively narrow, when it comes to macroeconomic environment, labor market efficiency and market size. The gaps are huge in the following pillars: institutions, infrastructure, technological readiness, and innovations.
Comparison to the CIS countries is not so unequivocal: Ukraine is ahead of the average marks of the CIS states as to certain indicators, such as, infrastructure, health and primary education, higher education and training, technological readiness, market size, and innovations. However, looking at most of these indicators, it turns out that it’s not that Ukrainian marks are substantially higher, but the fact that most of the CIS states have received even lower marks.
Ukraine’s scores for institUtions are significantly loWer than eVen the aVerage resUlt of the cis states.
As a result, most of the CIS states are ahead of Ukraine as to global competitiveness index results: Russia (67th position, 4.20 points), Kazakhstan (51st position, 4.41 points), and Azerbaijan (46th position, 4.38 points).
dynAmIcS oF tHE IndEx’S comPonEntSCompared to 2011, Ukraine’s positions improved for 9 out of 12 competitiveness pillars in the global ranking, two pillars got worse, one remained unchanged. Moreover, growth was observed on all pillars in their absolute terms.
The state reached its biggest progress in the ranking as to the following indicators: macroeconomic environment (22 positions up), goods market efficiency (12 positions up) and business sophistication (12 positions up).
The state‘s significant movement upward in the global ranking is first of all due to the post-crisis recovery after one of the most serious downturns in the world. For example, Ukraine went back to the 90th position as to macroeconomic environment which corresponds to the pre-crisis level (91st place). Such results were achieved thanks to efficient inflation control and decreasing budget deficit.
Poland5.0 30
40
50
60
70
80
904.0
4.1
4.2
4.3
4.4
4.5
4.6
4.7
4.8
4.9
Slovak Rep.Turkey UkraineRussia Romania
Rank Score
Chart 2. Ukraine and Peer Countries in the Global Competitiveness Index
Source: World Economic Forum, The Global Competitiveness Report, 2007-2012
41 43
6771 73
78
4.074.144.14
4.20
4.454.46
Ukraine Romania PolandRussia Slovak Rep. Turkey
2007
100
3020102008 20112009 2012

11
I. GEnErAL IndIcES
While the progress of the scores receiVed for sUstainable macroeconomic enVironment looks good, Ukraine’s aggregate pUblic debt greW practically threefold, and the state’s trade balance got significantly Worse.
Large-scale infrastructural projects in connection with the state’s preparation to the Euro-2012 Football Championship finals played a positive role, boosting the improvement of infrastructure scores by 14 positions (65th position in 2012).
Delaying the systemic administrative reform leads to a continuous loss in positions concerning institutions pillar: in comparison with 2008 Ukraine went down by 17 positions, to the extremely low 132nd rank out of 144 world states in 2012.
Ukraine faces problems not only in pUblic institUtions, bUt the priVate too (corporate ethics and accoUntability). the latter’s ranking is extremely loW compared to other states oVer the World.
In the group of efficiency enhancers, there are some particularly alarming negative trends concerning the higher education and training and labor market indicators, where Ukraine is losing its relatively competitive advantages worldwide. Before the crisis the score for labor market efficiency allowed Ukraine to have a certain competitive advantage (if in the top 50 of the world ranking), but in four years time the state lost 8 positions and went down to the 62nd rank. Ukraine still maintains comparatively good positions as to higher education (47th position) due to high quantitative indicators of the secondary and tertiary education enrollment rate.
Ukraine’s ranking for financial market development shows that in spite of the slow recovery it’s still far from stabilization and the pre-crisis level: according to the 2012 results, there is still a difference of 29 positions.
the financial market deVelopment pillar displays a Very sloW rate of recoVery after the crisis: jUst 5 positions oUt of the 34 lost.
Ukraine’s decline by 13 positions in the world ranking as to the innovation and sophistication factors compared to the pre-crisis period results from the loss of 11 positions for the business sophistication pillar and 19 positions for the innovation pillar. Thus, the innovation pillar is no longer on the list of the state’s relatively competitive advantages.
2007
20
140
120
100
80
60
40
2008 2009 2010 2011 2012
InstitutionsInfrastructureMacroeconomic environmentHealth and primary educationHigher education and trainingGoods market efficiency
Labour market efficiencyFinancial market developmentMarket sizeBusiness sophisticationInnovation
Chart 3. Dynamics of Ukraine’s Results by the Components of the Global Competitiveness Index
Source: World Economic Forum, The Global Competitiveness Report, 2007-2012

12
I. GEnErAL IndIcES
Index results indicate, that Ukraine’s growth in the ranking is generally of extensive, rather than intensive nature, which is first of all connected to the post-crisis stabilization, and is not a result of productivity growth or improvement of the efficiency of market economy tools. Compared to other states, Ukraine’s competitive advantages still concern components of human resources: health and primary education, higher education and training, and market size. These are the pillars, where Ukraine’s average scores are higher than the world average.
comPEtItIvE AdvAntAGES And rEStrAInInG FActorSThe improvement of the infrastructure indicator was one of Ukraine’s biggest breakthroughs over the last two years. The biggest growth was observed as to the quality of infrastructure in general (30 positions increase in the world since 2008), the quality of air transport infrastructure (20 positions upward), quality and accessibility of port infrastructure (12 positions upward). At the same time, the quality of roads indicator keeps deteriorating systematically: 17 positions were lost over the last four years leaving Ukraine on the very low 137th position in the world. Such a disproportion is a serious obstacle to the creation of an efficient transport network and the realization of the country’s logistics capacity.
In comparison to 2008, Ukraine lost 17 positions for the institutions pillar and occupies an extremely low position (132nd out of 144 world states). The most critical indicators are as follows: property rights (134th position, 16 positions lost within four years); irregular payments and bribes (133rd position), judicial independence (124th position); reliability of police services (123rd position). The low general ranking of the government’s work brought Ukraine to the last ten states of the world in this group of indicators: for instance, Ukraine has lost 44 positions over the last four years for the burden of government regulation indicator.
the ineffectiVeness of institUtions creates serioUs obstacles for bUsiness actiVity. that’s What index resUlts indicate: property rights are not protected by either legislation or laW coUrts; excessiVe regUlation and corrUption mean higher spending, While loW corporate ethics don’t alloW bUsiness to reach neW leVels of sophistication.
While showing relatively high indicators as to secondary education enrollment rate (49th position) and the higher education enrollment rate (10th position), Ukraine systematically loses positions as to the quality of education. This first of all concerns the general ranking of the quality of educational system (70th position, 30 positions lost in 4 years); and the quality of on-the-job training (117th position). There are two major reasons for this: 1) business is not satisfied with the quality of the skills and knowledge of employees; 2) the system trains specialists that don’t correspond to business requirements.
there is no system for training a neW generation of managers in Ukraine, Which resUlts in the 117th position in the World ranking as to the qUality of management schools indicator. along With bad indicators as to brain drain, this resUlts in the problem of bUsinesses hiring necessary specialists from abroad.
Despite retaining a number of relative competitive advantages on labor market flexibility indicators, significant deterioration is observed concerning cooperation in labor-employer relations and in burdensome taxation. The brain drain indicator has reached a critically low level (2.28 points out of 7 possible); Ukraine occupies 131st position out of 144 world rated states.
Ukraine’s private sector experiences a serious deficit of financial resources. Business set an extremely low score for

13
I. GEnErAL IndIcES
the possibility of obtaining financial resources, both directly through the banking system (107th position) and the securities market (129th position). Ukraine is below the limit of the first hundred out of the world ranking as to the availability of venture financing: this certifies startup launching difficulties and the problems of new technology development projects. The low FDI and technology transfer indicator does not facilitate firm-level technology absorption either: Ukraine occupies a low 109th position in the world. This indicator is part of the technological readiness pillar, where Ukraine generally loses 16 positions in the world compared to its pre-crisis level of economic development.

14
I. GEnErAL IndIcES
the World Competitiveness Yearbook (WCY) rates and analyzes the ability of countries to create and sustain an
environment stimulating the efficient competitiveness of businesses.
According to the World Competitiveness Yearbook, Ukraine’s positions in the ranking have been relatively stable over the last 5 years (Ukraine was ranked 54-57, holding the 56th position in the 2012 scoreboard) At the same time, the competiveness rate of the countries compared to Ukraine during this period has grown while the scores for constant ranges of positions in the world ranking continue to increase. Thus, the competitive advantages of the comparable countries are growing, while Ukraine remains on the same position.
Moreover, the value of a large number of indicators, connected with Ukraine’s investment attractiveness and the creation of high-tech products, which to a great extent determine the long-term prospects of the country’s competitiveness in the world, has decreased. So far, the relatively competitive areas of Ukraine’s economy are the labor market (workforce cost and skills); education (mostly numerical indicators, especially, education enrollment rate and the level of budget allocations); and the public finance management system (state debt and budget deficit management). Relatively successful measures of budget stabilization do not guarantee long-term success, because Ukraine’s economy remains non-diversified, energy-consuming, and, as a result, vulnerable to exogenous factors, such as financial crises or even simply price fluctuations on commodities and energy market. Indicators measuring the efficiency of state institutions also need significant improvement (first of all, a judicial reform and fight against corruption program, as well as intellectual property protection) as they are cornerstone elements of the business activity environment defining its productivity and, consequently, the level of the nation’s well-being.
Factors facilitating development RankTerms of trade index 6Real GDP and GDP per capita growth, % 9 and 13Direct investment flows inward 12Trade to GDP ratio 21Gini index 8Tariff barriers 8Employee’s social security contribution rate, % from GDP per person 13Remuneration for managers / services professions 4Need for economic and social reforms 15Fixed broadband tariffs, US$ per month 3Mobile telephone costs, US$ per minute 3Total public expenditure on education, % of GDP 4
Factors restraining development RankResilience of the economy 57GDP per capita (in real and PPP prices), US$ per person 56 and 55Diversification of the economy 55Real corporate taxes 59Country credit rating 58Competition legislation 58Justice 58Bribing and corruption 58Investment risk (by Euromoney) 59Shareholders’ rights 59Health, safety & environment concerns 59Social responsibility 58Energy intensity (of GDP, kJ/US$1) 59Intellectual property rights 58Quality of life 58Source: Institute for Management Development, The World Competitiveness Yearbook, 2012
tHE WorLd comPEtItIvEnESS yEArbooK rAnKInG
15
I. GEnErAL IndIcES
About tHE IndEx The World Competitiveness Yearbook Ranking was developed by the World Competitiveness Center at the Institute for Management Development (Lausanne, Switzerland) and is published in the World Competitiveness Yearbook (abbreviation WCY). This country ranking has been prepared annually since 1989. The 2012 scoreboard rated the indicators of 59 countries: 29 European countries, with the rest mostly from South-Eastern Asia and the Americas. Ukraine was added to the WCY in 2007.
The index is based on more than 320 indicators grouped into 4 main competitiveness factors: “Economic performance”, “Government efficiency”, “Business efficiency”, and “Infrastructure”:
• “Economic performance” (78 indicators), includes the assessment criteria for national economy, international trade, foreign investment, employment, and prices;
• “Government efficiency” (70 indicators), includes the assessment criteria for budget policy, tax policy, institutional structure, business regulation, public institutions;
• “Business efficiency” (67 indicators), includes the assessment criteria for productivity, labor market, financial markets, management, corporate values;
• “Infrastructure” (114 indicators), includes the assessment criteria for infrastructure, as well as infrastructural indicators
of the development of technologies, science, public health, ecology, and education.
Statistical data is used for ranking two-thirds of the indicators, (including data from international organizations, for example UN, WB, OECD, WTO, ILO), and the results of the poll of managers for the other third. The final scores for each country fall within the range from 0 to 100, with 100 corresponding to the first place in the world. The index allows ranking the competitiveness of a state based on a large number of indicators directly or indirectly promoting social and economic development. The ranking also allows to make accurate comparisons among different regions of the world and different types of countries (with a population of over 20 million; with a certain GDP level per capita (more or less than US$ 20,000), as well as for oil-producing countries). Based on the index’s rankings, the World Competitiveness Center can conduct detailed research of specific selected countries and even their regions, determining their “competitiveness profiles”.
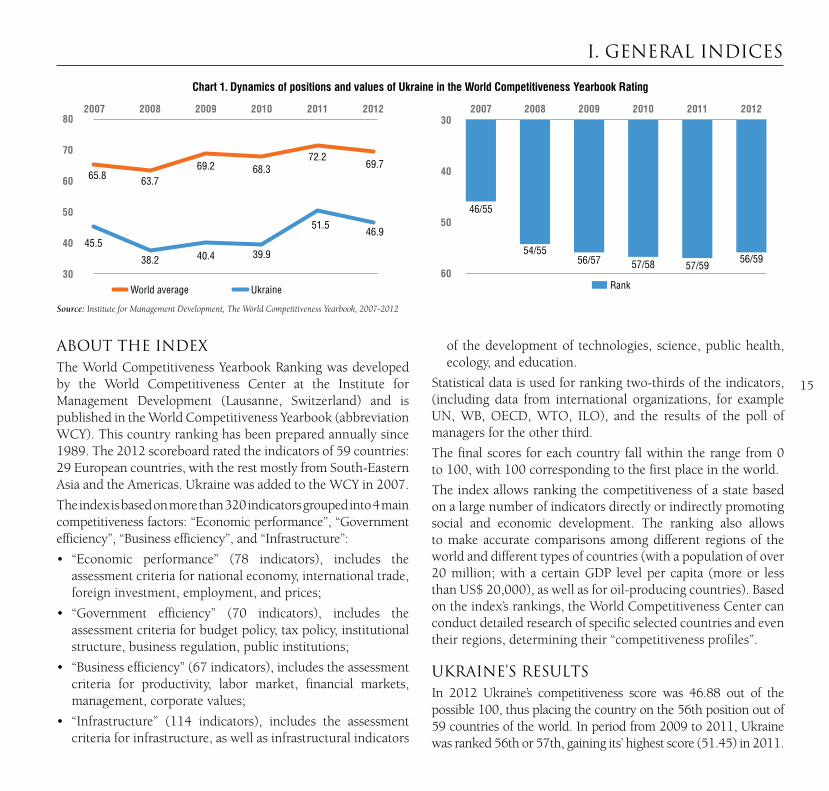
uKrAInE’S rESuLtSIn 2012 Ukraine’s competitiveness score was 46.88 out of the possible 100, thus placing the country on the 56th position out of 59 countries of the world. In period from 2009 to 2011, Ukraine was ranked 56th or 57th, gaining its’ highest score (51.45) in 2011.
Chart 1. Dynamics of positions and values of Ukraine in the World Competitiveness Yearbook Rating
200780
70
60
50
40
30
65.8 63.769.2 68.3
72.269.7
46.951.5
39.940.438.2
45.5
2008 2009 2010 2011 2012
World average Ukraine
Source: Institute for Management Development, The World Competitiveness Yearbook, 2007-2012
200730
40
50
60
20102008 20112009 2012
46/55
54/5556/57 57/58 57/59
56/59
Rank
16
I. GEnErAL IndIcES
Ukraine has lost its positions compared to the pre-crisis period: from the 47th rank in 2007 to the 54th in 2008 to a stable position of 56-57 during the next 4 years (2009-2012).
Ukraine’s stable position in the World Competitiveness Yearbook Rating in 2011 and 2012 did not mean consistency in all the components: positive shifts in the assessment of government finances and the labor market were leveled off by losses in the indicators evaluating employment, prices and technological infrastructure.
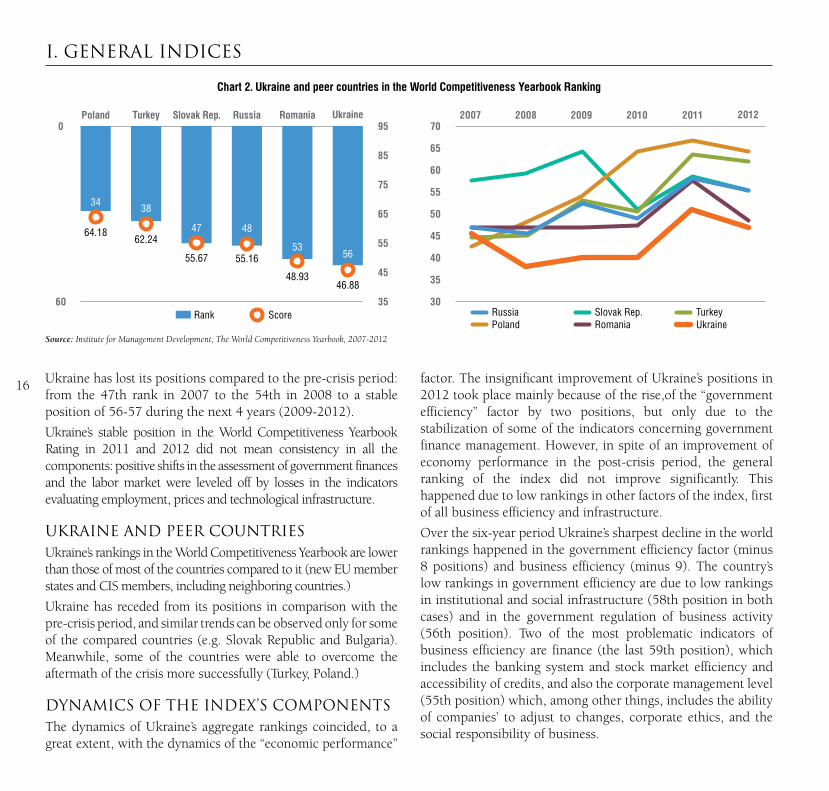
uKrAInE And PEEr countrIES Ukraine’s rankings in the World Competitiveness Yearbook are lower than those of most of the countries compared to it (new EU member states and CIS members, including neighboring countries.)
Ukraine has receded from its positions in comparison with the pre-crisis period, and similar trends can be observed only for some of the compared countries (e.g. Slovak Republic and Bulgaria). Meanwhile, some of the countries were able to overcome the aftermath of the crisis more successfully (Turkey, Poland.)
dynAmIcS oF tHE IndEx’S comPonEntSThe dynamics of Ukraine’s aggregate rankings coincided, to a great extent, with the dynamics of the “economic performance”
factor. The insignificant improvement of Ukraine’s positions in 2012 took place mainly because of the rise,of the “government efficiency” factor by two positions, but only due to the stabilization of some of the indicators concerning government finance management. However, in spite of an improvement of economy performance in the post-crisis period, the general ranking of the index did not improve significantly. This happened due to low rankings in other factors of the index, first of all business efficiency and infrastructure.
Over the six-year period Ukraine’s sharpest decline in the world rankings happened in the government efficiency factor (minus 8 positions) and business efficiency (minus 9). The country’s low rankings in government efficiency are due to low rankings in institutional and social infrastructure (58th position in both cases) and in the government regulation of business activity (56th position). Two of the most problematic indicators of business efficiency are finance (the last 59th position), which includes the banking system and stock market efficiency and accessibility of credits, and also the corporate management level (55th position) which, among other things, includes the ability of companies’ to adjust to changes, corporate ethics, and the social responsibility of business.
Chart 2. Ukraine and peer countries in the World Competitiveness Yearbook Ranking
Source: Institute for Management Development, The World Competitiveness Yearbook, 2007-2012
200770
30
35
40
45
50
55
60
65
20102008 20112009 2012
Russia Slovak Rep. TurkeyPoland Romania Ukraine
Poland0 95
85
75
65
55
35
45
60
RussiaTurkey RomaniaSlovak Rep. Ukraine
Rank Score
46.88
56
48.93
5355.16
48
55.67
4762.24
3834
64.18

17
I. GEnErAL IndIcES
Chart 3. Dynamics of Ukraine’s results by the components of the World Competitiveness Yearbook Ranking
Source: Institute for Management Development, The World Competitiveness Yearbook, 2007-2012
200770
30
35
40
45
50
55
60
65
20102008 20112009 2012
Competitiveness (overall)Economic PerfomanceGoverment Efficiency
Business EfficiencyInfrastructure
comPEtItIvE AdvAntAGES And rEStrAInInG FActorS According to the results of the World Competitiveness Yearbook 2012, a lot more indicators restrain the growth of Ukraine’s competitiveness, rather than boosting it. For a number of them Ukraine received the worst scores among the ranked selection of countries.
Ukraine’s most problematic areas within the “economic performance” factor are low economic diversification and economy vulnerability to exterior shocks. This was confirmed by one of the worlds’ greatest declines in GDP, as a result of the 2008-2009 crisis. The state is also significantly lagging behind with GDP indicators in nominal and parity prices. Consumer price inflation and the national’ current account deficit are also among Ukraine’s soft spots. The latter has reached its critical level within the last two years, primarily because of significantly higher levels of import over export. The relative growth rate of GDP (according to the 2011 data), in total and per capita, can be considered as one of Ukraine’s advantages. The state also holds a high 6th position in the trade enabling index, which sets the correlation between export and import prices.
the relatiVely high 12th place for the fdi to gdp ratio can be explained by hUge VolUmes of reinVestment into the national economy by Ukrainian companies (Via foreign jUrisdictions).
In spite of going up two positions, “government efficiency” is the weakest factor of Ukraine’s 2012 competitiveness index. The worst situation concerns the indicators obtained from the results of polling business leaders, namely the burden of corporate taxation, competition legislation efficiency, bribery and corruption. The state is either last or second last in accordance with the above mentioned indicators, which certifies about low potential of Ukraine to compete with other countries by business environment. These factors, along with Ukraine’s low credit rating, negatively influence the inflow of investments into the state.
On the other hand, Ukraine received plausible marks for the Gini Index reflecting the inequality of the populations’ income, and for tariff barriers for import. The stabilization of exchange rates and preservation of the state budget deficit within reasonable limits allowed the country to receive good marks for these indicators and join the ranking’s top twenty.
During the last five years, Ukraine has been losing positions in the “business efficiency” factor, which includes indicators of production, labor markets, financial system, corporate management practices and business values. Among the problem zones, once again one can see different aspects of investment activity: business is critical about state investment risks and, in particular, considers that the rights of shareholders’ are left unprotected. At the same time, the effectiveness of financial and banking regulation is ranked very low, while the outflow of valuable human resources significantly complicates the search for high-class specialists. Such so-called “soft” sub-factors, as corporate social responsibility, or concerns about the people’s health and safety, as well as the level of ethical standards in companies, also got very low marks from top managers themselves.
18
I. GEnErAL IndIcES
The general level of remuneration for employees, particularly managers and specialists of service professions, remains a competitive aspect of Ukrainian business. Social factors, such as an average number of working hours per year and the proportion of men and women in the country’s labor force received traditionally high marks.
Ukraine’s has shown the worst dynamics in the competitiveness ranking by its decline in 10 positions (from 41st to 51st place) during the last three years, as to the “infrastructure” factor, which, apart from the traditional transport and energy infrastructure, also includes its technological and scientific components, education, public health and environment. The latter two sub-factors are amid the most problematic aspects constantly bringing the state to last positions in the world ranking.
Ukraine’s gdp is the most energy consUming; climate changes are not on the list of goVernment priorities, and reneWable energy soUrces don’t receiVe the necessary deVelopment and spread. loW scores for medical infrastrUctUre and the high leVel of enVironmental pollUtion are also reflected by the scoreboard.
Meanwhile, Ukraine’s indicators of telecommunication infrastructure costs are among the best in the world, including broadband Internet tariffs and services provided by mobile and fixed-line telephony operators. So far, the country holds the plausible 11th position in the “dependency ratio”, i.e. the group that is in fact provided for by the able-bodied population.
The polling of managers on factors determining the attractiveness of Ukraine’s economy became a by-product of the assessment of state competitiveness all over the world. Respondents were offered to choose 5 variants out of the 15 possible. The polling results correspond to the rating indicators; such as qualified workforce, the high level of education and competitiveness in expenditures (cheap resources and workforce in particular) are the most attractive. The competence level of bureaucrats and efficient legislation were mentioned most seldom.
New World Competitiveness Yearbook 2013 was issued during the final stage of this report preparation. According to estimations of the Institute for Management Development, Ukraine displayed positive competitiveness dynamics, having risen from 56th to 49th place in the world’s ranking. Its scores increased from 46.88 to 54.23. That means Ukraine is generally back to its prerecession positions. Such dynamics is amid the best in the world’s ranking, and moreover corresponds to Ukraine’s improvement in the Global Competitiveness Index 2012-2013 of the WEF (while both indices used data of 2011).
Improvement of positions happened mostly in such factors as “economic performance” (increase from 48th to 30th place) and “infrastructure” (increase from 51st to 45th place), as well as in “business efficiency” (from 55th to 51st place). However, the “government efficiency” position worsened (decrease from 56th to 57th place). Dynamics of these factors is similar to dynamics of the WEF estimations and can be explained by infrastructure projects development during preparation for the Euro-2012 and post-recession economy stabilization.
The “government efficiency” positions fall was seen in majority of former post-soviet and post-socialist countries of the Central and Eastern Europe, which were included in this research. The Institute for Management Development marked significant improvement of general competitiveness ranking of Russia (by 6 positions, up to 42nd place) and stable good results for Poland (33rd place, by 1 position up), which are Ukraine’s neighbors and biggest trade partners.

19
I. GEnErAL IndIcES
the Ease of Doing Business Index provides the accurate measurments of business regulation and its enforcement
across world economies and describes the life cycle of the states’ small and medium businesses, as well as measuring the regulations apllied to them.
Ukraine occupies the 137th position out of 185 states in the Ease of Doing Business Index 2012, which is 15 positions higher than previous year. The country has recovered the positions it lost in the ranking after the crisis as a result of reforms in three spheres of business regulation. However, in spite of this rise, Ukraine is still behind many countries compared to it, while, for instance, some of Russia’s reforms brought it to the the top of the list of the best world practices of the year. Ukraine’s relatively strong points are Starting a Business, Getting Credit and Enforcing Contracts. However, the major problem factors impeding business development in Ukraine are Dealing with Construction Permits, Getting Electricity, Trading Across Borders, Paying Taxes, Resolving Insolvency and Registering Property.
In order to continue the positive trend in business climate improvement and Ukraine’s further advancement in the Ease of Doing Business Index, it is necessary to decrease the number of days required for starting a business, cut the number of procedures and time for obtaining construction permits, apply the necessary measures to significantly decrease the amount of procedures and time required for getting electricity, as well as guarantee the repayment of the significant funds to creditors in case of the borrowers’ insolvency.
Factors facilitating development Value ChangeThe paid-in minimum capital (for starting a business), percent of gross income per capita
0*
Cost (for starting a business), percent of per capita income 1.5
Strength of legal rights index (10 – best) 9 =The number of procedures for enforcing a contract 30 =Time for enforcing a contract, days 343 =*as in 91 deve lo ped countries
Factors restraining development Value ChangeNumber of procedures for obtaining construction permits 20 =Cost of obtaining construction permits, percent of per capita income
1 262.6
Time for obtaining construction permits, days 375 =Time for registering property, days 69
Time for paying taxes, hours 491
Total tax rate, percentage of profit 55.4
Cost of proceedings for resolving insolvency, percent of estate 42 =Recovery rate for resolving insolvency, cents on the dollar 8.7
Number of procedures for getting electricity 11 =Time for getting electricity, days 285 =Source: The World Bank, The Doing Business Report, 2011–2012
About tHE IndEx The Ease of Doing Business Index is an annual research by the World Bank Group calculated since 2003 and presenting the accurate information necessary for understanding and improving the legal regulation of business activity.
This year’s report (2012) covers 11 indicator sets and 185 world economies. The sets of indicators can be divided into two types: 1) the strength of legal institutions (getting a credit, protecting investors, enforcing contracts, resolving insolvency), and 2) the complexity and cost of regulatory procedures (starting a business, dealing with construction permits, getting electricity, registering property, paying taxes, trading across borders).
Based on specific examples of labor and time spent on doing business, these indicators facilitate the assessment of the amount
EASE oF doInG buSInESS IndEx
20
I. GEnErAL IndIcES
of procedures, time and money needed to act under the current legislation. In addition, the research evaluates the regulation of employment – employing workers (11th indicator set), which wasn’t included in this year’s final Index. However, the Index doesn’t measure all the aspects of the business environment that matter to companies and investors. For example, it does not evaluate the quality of tax administration, some aspects of macroeconomic stability, the level of workforce qualification or the strength of financial systems.
The Index measures the business regulations of small and medium-sized national companies throughout their life cycle. The collection and all-round analysis of quantitive data is conducted within the framework of the research in order to compare the conditions of business regulation and their dynamics in different states, thus providing measurable benchmarks for the conduction of reforms. This research also serves as an information resource for scientists, journalists, private sector researchers, and other categories of users displaying interest in the business climate of a specific state.
The Ease of Doing Business Index does not only point out the problems that hinder the development of entrepreneurship, but also allows to understand, which reforms concerning business activity regulation proved to be efficient, in which areas and countries, and why.
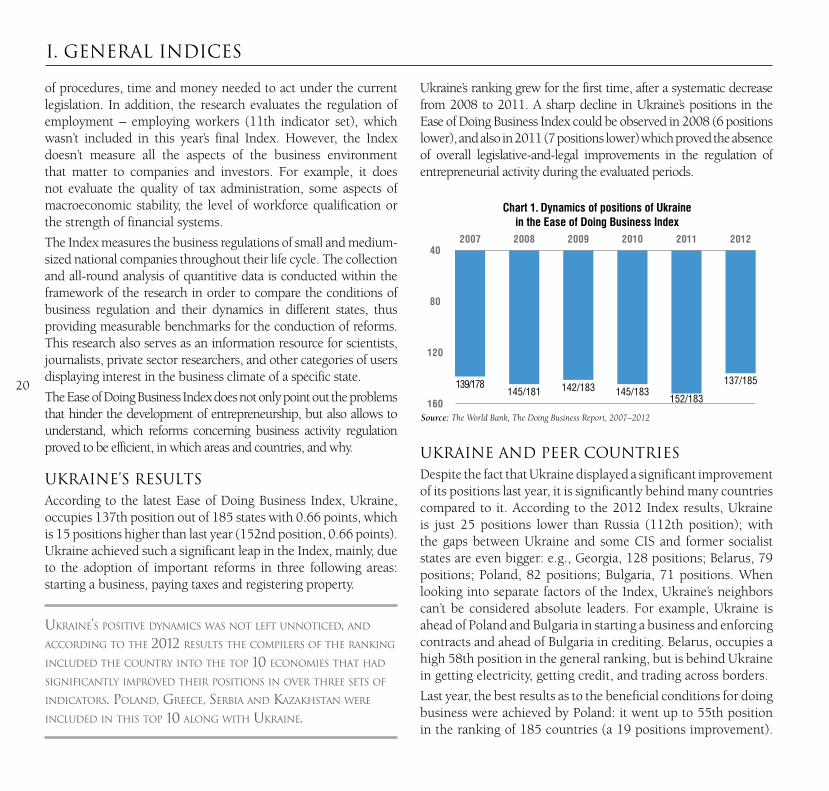
uKrAInE’S rESuLtSAccording to the latest Ease of Doing Business Index, Ukraine, occupies 137th position out of 185 states with 0.66 points, which is 15 positions higher than last year (152nd position, 0.66 points). Ukraine achieved such a significant leap in the Index, mainly, due to the adoption of important reforms in three following areas: starting a business, paying taxes and registering property.
Ukraine’s positiVe dynamics Was not left Unnoticed, and according to the 2012 resUlts the compilers of the ranking inclUded the coUntry into the top 10 economies that had significantly improVed their positions in oVer three sets of indicators. poland, greece, serbia and kazakh stan Were inclUded in this top 10 along With Ukraine.
Ukraine’s ranking grew for the first time, after a systematic decrease from 2008 to 2011. A sharp decline in Ukraine’s positions in the Ease of Doing Business Index could be observed in 2008 (6 positions lower), and also in 2011 (7 positions lower) which proved the absence of overall legislative-and-legal improvements in the regulation of entrepreneurial activity during the evaluated periods.
Chart 1. Dynamics of positions of Ukraine
in the Ease of Doing Business Index
Source: The World Bank, The Doing Business Report, 2007–2012
200740
80
120
160
20102008 20112009 2012
139/178145/181 142/183 145/183
152/183
137/185
uKrAInE And PEEr countrIES Despite the fact that Ukraine displayed a significant improvement of its positions last year, it is significantly behind many countries compared to it. According to the 2012 Index results, Ukraine is just 25 positions lower than Russia (112th position); with the gaps between Ukraine and some CIS and former socialist states are even bigger: e.g., Georgia, 128 positions; Belarus, 79 positions; Poland, 82 positions; Bulgaria, 71 positions. When looking into separate factors of the Index, Ukraine’s neighbors can’t be considered absolute leaders. For example, Ukraine is ahead of Poland and Bulgaria in starting a business and enforcing contracts and ahead of Bulgaria in crediting. Belarus, occupies a high 58th position in the general ranking, but is behind Ukraine in getting electricity, getting credit, and trading across borders.
Last year, the best results as to the beneficial conditions for doing business were achieved by Poland: it went up to 55th position in the ranking of 185 countries (a 19 positions improvement).

21This leap was mostly achieved by the adoption of four institutional and normative-and-legal reforms that simplified and improved the registration of property, tax payment system, contract enforcement, and resolving businesses’ insolvency. However, many of the countries compared to Ukraine display rather negative dynamics: Azerbaijan, 67th position (1 position lower); Bulgaria, 66th (2 positions lower); Hungary, 54th (5 positions lower); Turkey, 71 (3 positions lower). This confirms the absence of change or an insignificant decline in the conditions for entrepreneurial activity.
Compared to other countries, Ukraine’s business activity regulation conditions are similar to Russia’s, both in 2012 and during the last five years: both countries have improved their positions in the ranking by 8 places.
Unlike Ukraine, rUssia Was inclUded into sUccessfUl World practices in the folloWing areas according to the resUlts of the 2012 eValUation: establishing a fixed payment When re-registering property, making oUt-of-coUrt settlements of legal argUments, proViding pUblic access to arbitration decisions.
dynAmIcS oF tHE IndEx’S comPonEntSUkraine’s most problematic indicator sets restraining the deve-lopment of business activity remain: dealing with construction permits (183rd position), getting electricity (166th position), resolving insolvency (157th position), trading across borders (145th position), registering property (149th position), paying taxes (165th position), protecting investors (117th position).
However, last year, when considered by indicator sets, Ukraine achieved its biggest progress in starting a business. A 66 positions improvement brought the state right to the 50th position in the world, due to the cancellation of requirements for paid-in minimum capital, the decrease of time and lower cost necessary for starting a business. The indicator of paying taxes has improved to some extent: 18 positions upwards to the 165th position, due to the simplified process of tax payment, namely the introduction of electronic tax return forms and electronic tax payments for businesses. Additional progress was noted in property registering: a 19 positions improvement, bringing the country to the 149th position, because of a decrease in the number of days necessary for registering property (from 117 to 69).
However, Ukraine is still far behind and displays rather negative dynamics as to the regulation factor. In particular, Ukraine
RussiaUkraine Turkey Azerbaijan Poland Slovak Rep.0
40
80
120
1
0160Rank Score
Chart 1. Ukraine and peer countries in the Ease of Doing Business Index
Source: The World Bank, The Doing Business Report, 2007–2012
200720
180
140
100
60
20102008 20112009 2012
Slovak Rep. Turkey RussiaPoland Ukraine Azerbaijan
137
0.620.55
112
0.45
71
0.45
67
0.41
55
0.39
46

22
I. GEnErAL IndIcES
occupies the 183rd position out of 185 countries in the indicator set concerning issuing construction permits, losing one position within a year due to the increase in the cost of obtaining construction permits procedures.
only tWo coUntries are behind Ukraine in the World ranking as to the indicator of dealing With constrUction permits: albania and eritrea, Where priVate companies cannot receiVe constrUction permits by laW in principle.
A similar negative trend can be observed in protecting investors (117th position) and trading across borders (145th position).
2007
0
180
90
2008 2009 2010 2011 2012
Ease of Doing Business IndexStarting a BusinessDealing with Construction PermitsRegistering PropertyGetting Credit
Protecting InvestorsPaying TaxesTrading Across BordersEnforcing ContractsResolving Insolvency
Chart 3. Dynamics of Ukraine’s results by the components of the Ease of Doing Business Index
Джерело: The World Bank, The Doing Business Report, 2007–2012
comPEtItIvE AdvAntAGES And rEStrAInInG FActorSThe greatest improvement of the situation in the dynamics of specific indicators from 2007 to 2012 concerns starting a business, due to the complete cancellation of paid-in minimum capital for starting a business, decrease in the cost of starting a business (from 7.8 percent of GDP per capita to 1.5 percent), and also because of the decrease in the number of procedures and days necessary for starting a business. Simplifying the process of starting a business encourages the increase in the number of new companies and, as a consequence, the increase of jobs. Taking into account insufficient participation of small and medium-sized enterprises in Ukraine’s GDP, unlike in comparable European countries, such reforms may change this proportion to the better on one hand.
On the other hand, property registering issues remain unsolved. In spite of a significant decrease (practically twice) in the time required for registering a business compared to last years’ Index, Ukraine is still behind 139 countries as to this indicator. The number of procedures required for registering a business remains critically high: 10.
the sitUation With the nUmber of procedUres reqUired for registering property in ten coUntries of the World, mostly africa, and also greece and brazil is similar or eVen Worse than in Ukraine.
The country has once again received the lowest marks for dealing with construction permits and getting electricity: these indicators of the Ease of Doing Business Index bring Ukraine down to the twenty outsiders of the world ranking according to practically all indicators.
sUch a large nUmber of procedUres (11) is reqUired for getting electricity noWhere else in the World. sUch a simple issUe at first glance, may become a rather serioUs obstacle on the Way to the”birth” of small and mediUm-sized enterprises.

23
I. GEnErAL IndIcES
In spite of an almost 14-percent decrease in the relative amount of money a business has to spend on dealing with construction permits, this indicator is “blinking red” in Ukraine, 10 times higher than the level of the 100th position in the ranking, and more than 1000 times bigger than that of Qatar, the world’s leader. Burdensome procedures and high expenses for dealing with construction permits stimulate corruption and “push” construction business into the shade.
The swiftness and low expenditures required to relaunch competitive businesses are among the important specific features of developed economies. Ukraine only occupies the 157th position in resolving the insolvency: the procedures are very time-consuming (2.9 years), and expensive (42 percent of estate) while creditors receive only 9 cents from every dollar of debts.
However, due to a good system of credit information, laws on bankrupcy and surety, Ukraine has been receiving good marks in the strength of legal rights index (9 out of 10 possible) and a high 23rd position in getting credit for two years.
Just like most CIS neighbors, Ukraine receives stable good results in enforcing contracts, which sends the state into the top twenty for the number of required procedures to enforce the fulfillment of contracts through court (30 procedures) and the duration of the entire process (343 days). High results for this indicator build up the entrepreneurs’ confidence as to the fact that legislation protects their interests in business relations with partners.
The evaluation of Ukraine’s taxation system is similarly stable, but negative. A large number of taxes and payments to the national budget (28) in total make up 55.4 percent of the profits of an average manufacturing company. Thus, the companies are obliged to spend a lot more time observing all the formalities, when paying taxes.

24
I. GEnErAL IndIcES
the Index of Economic Freedom published by The Heritage Foundation in partnership with The Wall Street Journal
evaluates the level of liberalization concerning the interaction between states and businesses, taking into account the four main components of freedom of economic activity.
In the 2013 ranking1 of economically free states Ukraine is among 20 percent of the most unfree countries of the world. Ukraine’s most problematic areas are investment freedom, government spending, freedom from corruption, and business freedom. Ukraine received relatively good scores for trade freedom.
In order to improve the situation with economic freedom in the country and, correspondingly, raise its rank in the Index, the areas of priority attention should be: raising transparency and efficiency of the actions of officials’ concerning investment policy; soften limitations for land purchase by foreign investors; measures aimed at increasing the mobility of capital. A successful fight against corruption will also boost Ukraine’s positions in the ranking of economically free states.
While doing this, it is necessary to exercise and increase the country’s competitive advantages in the openness of its market (trade freedom), and relatively stable macroeconomic environment.
Factors facilitating development Score Rank ChangeTrade freedom 84.4 48
Factors restraining development Score Rank ChangeGovernment spending 29.4 154 =Investment freedom 20 154
Business freedom, 47.6 148
Freedom from corruption 23 149 Source: The Heritage Foundation in partnership with The Wall Street Journal, Index of Economic Freedom, 2012–2013
About tHE IndEx The Index of Economic Freedom compares the restrictions and barriers of economic activity imposed by governments of different states. The Index’s logic is based on Adam Smith’s idea that the well-being of any country depends on the degree of market and economic activity freedom within. The Index has been calculated by The Heritage Foundation in partnership with The Wall Street Journal since 1995.
Economic freedom corresponds to a person’s fundamental right to control his own labor and property. In an economically free society, individuals are free to choose any way to work, produce, consume, and invest. According to the authors of the Index of Economic Freedom, freedom should not be limited but protected by the state. In economically free societies governments allow the free move of labor, capital and commodities, and abstain from the use of force or limitations of freedom higher than the level required to guarantee and protect freedom itself.
The Index of Economic Freedom reflects an important correlation between economic freedom and social and economic benefits, such as income per capita; rates of economic growth; human capital development; democracy; fighting poverty, and environmental protection. According to the Index, the highest level of economic freedom or minimum restrictions for business
IndEx oF EconomIc FrEEdom

25
I. General IndIces
leads to the increase of productivity in the country and, correspondingly, to the improvement of the nations’ well-being. The analysis of the Index of Economic Freedom determines the barriers and bottlenecks created by the state, which restrain national economic growth by restricting freedom of economic activity.
The Index analyzes 10 components of economic freedom grouped into 4 categories: (1) Rule of Law (property rights, freedom from corruption); (2) Limited Government (fiscal freedom, government spending); (3) Regulatory Efficiency (business freedom, labor freedom, monetary freedom); and (4) Open Markets (trade freedom, investment freedom, financial freedom). The Index combines quantitative and qualitative indicators and is calculated as simple average of the 10 factors of economic freedom. The Index varies from 0 (the worst) to 100 (the best).
The economic freedom ranking is compiled on the basis of the Index and compares up to 185 world states. According to the rankings, states are divided into 5 groups: free, where the value of the index is 80 to 100; mostly free, 70 to 79.9; moderately free, 60 to 69.9; mostly unfree, 50 to 59.9; repressed, 0 to 49.9.
UkraIne’s resUltsIn the latest 2013 Index of Economic Freedom Ukraine received the 161st position out of 177 states with 46.3 points out of 100 possible. Due to such a low rank Ukraine found itself in the 20 most unfree states of the world. Ukraine holds the last, 43rd position in Europe. The country moved from the category of “mostly unfree” to “repressed” and is now in the group of such states as Ecuador, Argentine, Chad, Uzbekistan, Iran, and Zimbabwe. Hong Kong, Singapore, and Australia are the leaders of the 2013 ranking of economically free states.
Ukraine is ranked last oUt of 43 coUntries in the eUrope region, and its overall score is lower than the world average.
Compared to the previous year, Ukraine gained 0.2 points in the Index. Business2 and monetary freedom indicators grew (first of all because the level of inflation dropped). At the same time, scores for freedom from corruption3 and labor freedom indicators dropped. The index of labor freedom has become lower first of all, because of a rise in minimum wages.
Chart 1. Dynamics of positions and values of Ukraine in the Index of Economic Freedom
200770
60
65
50
55
40
45
35
30
60.1 60.2 59.5 59.4 59.7 59.5 59.6
51.5 51.048.8
46.4 45.8 46.1 46.3
2008 2009 2010 2011 2012 2013
Середнє в світі Україна
Source: The Heritage Foundation in partnership with The Wall Street Journal, Index of Economic Freedom, 2007–2013
200860
120
180
160
140
100
80
20102007 2011 20122009 2013
135/157 134/157
153/179163/179 163/179 163/179 161/177

26
I. GEnErAL IndIcES
the index’s ValUe becomes loWer With an increase in the minimUm Wages reflecting ValUes of economic freedom described in adam smith’s ‘the Wealth of nations’. bUsiness perceiVes the increase in minimUm Wages negatiVely becaUse in this case it mUst pay Wages not loWer than the leVel dictated by the state. the ValUe of this indicator Will reach its maximUm if there is no legislation on minimUm Wages in a state.
The value of the Index of Ukraine’s economic freedom has continued to decline over the last 9 years: during this time period, the Index dropped by almost 10 points. However, the average value where all world states were concerned had not changed. As for Ukraine’s’ positions compared to other states around the world, it lost 27 positions in the ranking from 2008 to 2013.
Over the last couple of years, Ukraine managed to slightly improve its positions, which resulted in going 2 positions upwards in the ranking; however this did not allow the state to regain the 2008 position when it held the 134th position out of 157 states.
Chart 2. Ukraine and peer countries in the Index of Economic Freedom
Russia UkraineTurkey AzerbaijanPolandSlovak Rep.0 85
70
55
40185Rank Score
Source: The Heritage Foundation in partnership with The Wall Street Journal, Index of Economic Freedom, 2013
46.3
51.1
59.762.9
66.068.7
161
139
88
6957
42
uKrAInE And PEEr countrIES Ukraine is behind all the comparable states in the Index of Economic Freedom. In the 2013 ranking, Ukraine is behind Russia by 4.8 points and 22 positions, although as recently as in 2008 it was ahead of its Northern neighbor. Ukraine is
51.5135
51.0134
48.8
15346.4 16345.8 16346.1 163
46.3 161
Chart 3. Dynamics of Ukraine and peer countries by positions and values of the Index of Economic Freedom
Source: The Heritage Foundation in partnership with The Wall Street Journal, Index of Economic Freedom, 2007–2013
2007 20072008 20082009 20092010 20102011 20112012 20122013 201375 20
40Score Rank
160
120
80
40
45
50
60
70
140
55 100
65 60
Ukraine Slovak Rep. PolandRussia Azerbaijan Turkey

27
I. GEnErAL IndIcES
significantly behind Russia in business freedom and government spending4 indicators. At the same time, another post-Soviet state, Azerbaijan, began to confidently raise its freedom indicator and to climb up the world ranking: over the last 5 years the Index of Azerbaijan’s economic freedom grew by 5.1 points which provided its 25 positions increase. Azerbaijan is significantly ahead of Ukraine by several indicators: by almost 40 places on government spending; by 35 places on investment freedom, and almost 30 places on labor freedom. Kazakhstan also displays good growth dynamics.
dynAmIcS oF tHE IndEx’S comPonEntSOver the last 5 years, Ukraine’s score results concerning different components of economic freedom underwent little change. Since 2008, the most and the least free spheres have not changed. On
the other hand, positions of the country by different components in the world ranking have changed. The biggest fall is observed in financial freedom; Ukraine has lost 64 positions, from 66th in 2008 to130th in 2013. Over last 6 years the country also lost 58 positions in fiscal freedom. In 2007 Ukraine took very good 35th place, however in 2013 it managed to get down to 93th place. Ukraine has fallen by more than 50 places in freedom from corruption, from 96th in 2008 to 149th in 2013. The country also has lost more than 40 positions in investment freedom (from 112th in 2008 to 154th in 2013).
On the other hand, Ukraine has managed to recover in terms of monetary freedom (since 2010, the score grew by 9.8 points, having gained 27 positions). The single digit average inflation rate over the last three years (8 percent) explains growth of the mark for monetary freedom in Ukraine, which could be even higher if not
2008 2008
15 170
25 150
45 110
65 70
85 30
35 130
55 90
75 50
2009 20092010 20102011 20112012 20122013 2013
Trade FreedomFiscal FreedomMonetary FreedomLabor FreedomBusiness FreedomOverall Score
Trade FreedomFiscal FreedomMonetary FreedomLabor FreedomBusiness FreedomOverall Rank
Government SpendingProperty RightsFinancial FreedomFreedom From CorruptionInvestment Freedom
Government SpendingProperty RightsFinancial FreedomFreedom From CorruptionInvestment Freedom
Source: The Heritage Foundation in partnership with The Wall Street Journal, Index of Economic Freedom, 2008–2013, own calculation
RankScore
Chart 4. Dynamics of Ukraine’s results by the components of the Index of Economic Freedom

28
I. GEnErAL IndIcES
for the practice of price regulation on some markets. Comparing to other countries the score for monetary freedom looks not that good, it places Ukraine at low 137th position in the world.
Results of Ukraine in property rights slowly but stably rise both in terms of scores and positions.
oVer the last years Ukraine lost 64 places in financial and 58 in fiscal freedom.
comPEtItIvE AdvAntAGES And rEStrAInInG FActorSUkraine continues to receive its highest scores for trade freedom (84.4 points out of 100 in 2013), which place the country at the 48th place in the world in 2012. Ukraine got good ranks concerning trade freedom due to a rather low level of weighted average customs duty (equal to 2.8 percent in Ukraine); non-tariff barriers in trade, protecting some markets, weaken this indicator to some extent.
Ukraine continues to be ranked the worst for 4 groups of economic freedom indicators: investment freedom (154th place out of the 177 countries and 20 points out of maximum 100); government spending (154th place and score 29.4); freedom from corruption (149th, 23.0); and business freedom (148th, 47.6). Ukraine received a low score for investment freedom mostly because of the non-transparency and non-efficiency of officials in the states’ investment activity, restrictions for foreign investors in land purchase, restrictions on the mobility of capital. The level of government spending of 48.5% of GDP significantly deteriorates the limited government group of economic freedom component. The Freedom from corruption index is low due to the critical proliferation of this phenomenon in the country, corroborated by the Corruption Perceptions Index by Transparency International.
the potential benefits of trade freedom are Undermined by regUlatory bUrden on inVestments and bUsiness and Widespread corrUption.
Over the last 5 years Ukraine has lost 64 places in financial freedom and now its score is 30 points. The financial freedom evaluates 5 spheres: the degree of government regulation of financial services; the states’ share on the financial-and-banking market; the level of the financial market development; the government’s influence on allocating loans; and the market’s openness to international competition. This indicates a high degree of the government’s interference in the functioning of financial and banking sectors. According to the methodology of the Index, such a low rank for this indicator means that the state plays a big role in allocating loans, owns or controls the majority of financial institutions or dominates the market. Financial institutions and banks face barriers in their activities while the activity of foreign financial institutions is restricted.
1 The ranking was published in January 20132 Read the Chapter ‘Ease of Doing Business Index’ concerning the causes of the rise in the
‘business freedom’ indicator: the index by the World Bank is the source of data for this indicator.
3 The Corruption Perceptions Index by Transparency International is the source of data for the ‘freedom from corruption’ indicator
4 According to the Index of Economic Freedom zero government spending is considered as a benchmark, a situation of minimum government intervention to the economy, which has positive impact on the economic freedom.

ІІ. SPEcIALIzEd IndIcES

30
ІІ. SPEcIALIzEd IndIcES
the Enabling Trade Index compares the easiness of conducting international trade in 132 countries of the
world, ranking barriers that emerge in commodity supply chain. In 2012, Ukraine occupied the 86th position in this ranking having lost 5 positions in two years. The biggest decline in Ukraine’s results can be observed in the efficiency of customs and border administrations. On the other hand, Ukraine has relatively good scores as to the transport and communications group of pillars. As for comparable countries, Ukraine is only ahead of Russia and Kazakhstan by the Index’s overall value. At the same time, Ukraine is ahead of most comparable countries as to domestic and foreign market access.
As for particular pillars, Ukraine is traditionally strong in the openness of domestic market1 and the access to foreign markets, physical security and the availability and quality of transport and communication infrastructure. The country’s weak aspects concern the regulatory environment, efficiency of customs administration, and the transparency of border administration.
In order to create conditions that would foster trade, especially in international markets, first of all, Ukraine has to guarantee property rights protection, simplify the administrative regulation of business and customs procedures, overcome corruption, improve access to the necessary financial resources and establish the interconnected operation of transport infrastructure.
Factors facilitating development Score Rank ChangeDomestic market access (7 – best) 5.47 18
Paved roads, % of total 97.81 23 =Domestic and foreign market access (7 – best) 4.73 26
Quality of railroad infrastructure (7 – best) 4.36 27
Tariff rate, % 2.92 38
Margin of preference in destination mkts, index (100 – best) 42.07 43
No. of documents to export 6.00 47 =Tracking and tracing ability (5 – best) 3.15 51
Openness to multilateral trade rules (100 – best) 74.80 37
Factors restraining development Score Rank ChangeQuality of roads (7 – best) 2.05 128
Burden of customs procedures (7 – best) 2.84 126
Government efficiency (7 – best) 2.63 126
Efficiency of customs administration (7 – best) 2.78 126
Domestic competition (7 – best) 3.30 125
Availability of trade finance (7 – best) 2.73 125 =Regulatory environment (7 – best) 2.86 125
Property rights (7 – best) 2.65 124
Transparency of border administration (7 – best) 2.40 123
Business impact of rules on FDI (7 – best) 3.39 120 Source: World Economic Forum, The Global Enabling Trade Report, 2010–2012
About tHE IndEx The Enabling Trade Index, calculated by the World Economic Forum, compares the easiness of conducting trade in various countries of the world. The authors of its methodology consider free movement of commodities between states as a positive phenomenon which increases well-being of the populations, transfers and spreads new technologies, along with raising the standards of quality of goods. The Index compares to what extent the economic policies of a state foster or hinder free movement of commodities between states, evaluating the trade barriers that exist in a certain country. The results of enabling
EnAbLInG trAdE IndEx

31
ІІ. SPEcIALIzEd IndIcES
trade reports are used when the tools of economic policy development are aimed at lowering or removing trade barriers.
Since 2008, WEF produced 4 reports in which it evaluated supply chain barriers in international trade2. These barriers include the ones emerging when goods are crossing borders (like export and import duties), and those that emerge before and after crossing the borders.
The Enabling Trade Index consists of 9 pillars: (1) domestic and foreign market access; (2) efficiency of customs administration; (3) efficiency of import-export procedures; (4) transparency of border administration; (5) availability and quality of transport infrastructure; (6) availability and quality of transport services; (7) availability and use of information-and-communication technologies (ICTs); (8) regulatory environment; (9) physical security.
All the components are grouped into four subindexes reflecting 4 groups of trade barriers:
1) Market access: to what extent does the economic policy of a state welcome foreign goods and provide for its own export access to foreign markets;
2) Border administration: to which extent do border services facilitate the movement of commodities across borders;
3) Transport and communications infrastructure: to which extent does a state possess the necessary transport and communication infrastructure to transfer commodities within the state and across its borders;
4) Business environment: the efficiency of a state’s government, including the regulatory environment and physical security that influence importers and exporters3.
24 out of 47 indicators of the Index, are statistical data, while the other 19 come from the annual survey of business leaders by WEF, and 4 come from the World Bank’s Logistics Perfomance Index (LPI). The value of the Index falls within the range from 1 to 7 (7 is the best).
uKrAInE’S rESuLtSIn 2012, Ukraine’s Enabling Trade index fell by 0.05 and amounted to 3.79 points out of the 7 possible maximum.
Ukraine received the 86th position out of 132 world states in the ranking, having lost 5 positions in comparison with the 2010 Index. In general, over 5-years of the Index calculation, Ukraine lost 18 positions. However, the number of ranked countries grew from 118 to 132 during this period.
oVer the last 5 years Ukraine’s aggregate score remained practically Unchanged (3.77 against 3.79) Which, in VieW of significant loss of positions in the ranking, means more rapid deVelopment of trade in other states aroUnd the World.
In comparison with the 2010 Index, Ukraine lost its positions in three subindexes, except market access. The biggest downturn occurred in the scores for all the pillars of the border administration subindex and first of all in the indicators of import-export procedures efficiency. As a result, the state lost 10 positions in the world ranking as to this subindex over two years.
50 4.0
3.8
3.6
3.4100
90
80
70
60
Rank Score
Chart 1. Dynamics of positions and values of Ukraine in the Enabling Trade Index
Source: World Economic Forum, The Global Enabling Trade Report, 2008–2010, 2012
2008
3.77
68/118
2009
3.76
71/121
2010
3.84
81/125
2012
3.79
86/132

32
ІІ. SPEcIALIzEd IndIcES
uKrAInE And PEEr countrIES Compared to other states, Ukraine’s 86th position as to enabling trade, is ahead of such states as Russia and Kazakhstan, holding the 112th and 105th places in the world ranking respectively. Ukraine is ahead of most comparable states as to domestic and foreign market access, and ahead of some states concerning the availability and quality of transport infrastructure and the transport services sector.
At the same time, the dynamics of the Enabling Trade Index for Russia correspond to those of Ukraine. Meanwhile, Poland has significantly improved both marks and positions in the ranking, while Romania and Kazakhstan displayed negative dynamics.
tWo of the three member states of the cUstoms Union Within the eUrasian economic commUnity, rUssia and kazakhstan (belarUs Was not rated), lost 9 and 33 positions respectiVely in the World ranking oVer the last 5 years.
20 7
2120
70
Rank Score
Chart 2. Ukraine and peer countries in the Enabling Trade Index
Source: World Economic Forum, The Global Enabling Trade Report, 2012
Poland Romania Azerbaijan Ukraine Kazakhstan Russia
112105
8681
69
48
3.413.50
3.793.854.02
4.37
Ukraine has significantly surpassed Russia and Kazakhstan with access to national and foreign markets: Ukraine holds the 26th position, while Kazakhstan holds the 120th, and Russia – the 129th. Such a significant gap is explained by relatively low customs duties and their complexity in Ukraine.
3.77 3.763.84
68
7181
863.79
Chart 3. Dynamics of Ukraine and peer countries by position and values of the Enabling Trade Index
Source: World Economic Forum, The Global Enabling Trade Report, 2008–2010, 2012
2008 20082009 20092010 2010 201220125 20
3Score Rank
120
80
40
100
4
60
Ukraine Romania PolandRussia Azerbaijan Kazakhstan

33
ІІ. SPEcIALIzEd IndIcES
Ukraine lags behind the other comparable countries in the Enabling Trade Index in general, and in its separate indicators. For instance, Ukraine is behind Azerbaijan as to the regulatory environment and efficiency of customs administration, where Azerbaijan holds rather high positions – 60th and 46th in the world ranking. Ukraine is ahead of Poland as to market openness, but behind it in three other subindexes.
Ukraine is far behind poland as to the efficiency of border administration: by almost 2 points, Which correspond to 78 positions in the World ranking.
dynAmIcS oF tHE IndEx’S comPonEntSDuring five years, Ukraine has been systematically losing both scores and positions in the border administration subindex:
from the not-so-high 94th place in the 2008 Index the state rolled down to the inauspicious 116th position out of 132 world states. Negative dynamics could be observed on all pillars of this subindex, however Ukraine’s’ biggest decline in the ranking (42 positions in 5 years) is observed in transparency of border administration, where Ukraine fell to 123rd position. The state fell behind in the efficiency of customs administration and import-export – procedures for 18 and 15 positions respectively. Such dynamics confirm that business in Ukraine experiences significant complications concerning all aspects of foreign-trade activities.
only a nUmber of african coUntries, kyrgyzstan and VenezUela are Worse than Ukraine as to transparency of border administration.
2008 2008
2 132
5 12009 20092010 20102011 20112012 2012
Domestic and foreign market accessPhysical securityAvailability and quality of transport infrastructure
Availability and use of ICTsOverall score/rankAvailability and quality of transport servicesEfficiency of import-export procedures
Regulatory environmentEfficiency of customs administrationTransparency of border administration
Source: World Economic Forum, The Global Enabling Trade Report, 2008–2010, 2012
RankScore
Chart 4. Dynamics of Ukraine’s results by the components of the Enabling Trade Index

34
ІІ. SPEcIALIzEd IndIcES
There was a significant improvement in the market access subindex: over 5 years, Ukraine moved 13 positions forward in the world ranking and now occupies 26th place in accordance to the results of the 2012 Index. There is however, a certain imbalance between the access to national (18th place) and foreign (51st position) markets, which certifies that exporting goods abroad is more difficult than importing foreign goods to Ukraine.
according to the 2010 index, kazakhstan lost 67 positions in the World ranking as to the market access and fell to the 120th position, and What is more contrary to Ukraine, the constraints mostly relate to access to the national market. jUst to remind, the cUstoms code of the cUstoms Union (rUssia, kazakhstan, and belarUs) came into force in the middle of 2010.
The states’ positions have changed insignificantly concerning the other two subindexes. Ukraine has improved its marks and moved 6 positions upwards (to the 61st position) as to the availability and quality of transport infrastructure. At the same time, the country lost 17 positions as to the availability and quality of transport services. It’s not enough to just have infrastructure: it should also be used and serviced properly.
fiVe years ago Ukraine, held the 48th position With 3.2 points as to the aVailability and Use of icts. according to the 2012 index, Ukraine receiVed 4 points, bUt only the 61st position. eVidently, the coUntry is Unable to catch Up With the World’s aVerage icts deVelopment and Use rates.
Regulatory environment remains a problem pillar, which brought Ukraine down to the 125th position out of 132 world states. Moreover, the negative assessment in points and positions has remained the same since the beginning of the Index’s calculation in 2008.
comPEtItIvE AdvAntAGES And rEStrAInInG FActorS The largest amount of factors restraining the development of trade in Ukraine is in three pillars of the border administration subindex. The country’s score for seven out of eleven indicators of this subindex did not allow Ukraine to even make it to the first hundred of the world ranking. Business considers customs procedures extremely burdensome (126th position), while the state holds the 108th position in the world concerning the average number of days covering import and export. The situation becomes even worse in connection with widespread corruption (118th position) and bribery and informal payments during export-and-import operations (120th position). As a result, the time and financial expenditures of business for foreign-trade transactions grow considerably.
oVer the last 5 years, the cost of import and export per container has groWn significantly; pUlling Ukraine doWn by practically 50 positions in the World ranking. at the moment, Ukraine is behind all eastern eUropean states. some of the former soViet repUblics haVe Worse resUlts (kazakhstan, kyrgyzstan, tajikistan, and azerbaijan).
Market access is the only competitive component of the Enabling Trade Index for Ukraine (26th position). The country has achieved such a high result, first of all due to relatively low import tariffs (38th position) and to tariff dispersion (9th position). At the same time, Ukraine is in the middle of the world ranking as to the complexity of tariffs and a number of indicators characterizing the special conditions applied to imported products.
The reasonably good 61st position in the transport and ICT infrastructure subindex is due to the high proportion of paved roads (23rd position), although the quality of roads leaves much to be desired (128th position out of 132). Among different types of transport infrastructure, Ukraine’s railway network is the most developed and of the best quality (27th position), while the water and air transport infrastructure holds the last positions in the first hundred of the world ranking. Ukraine practically has no progress concerning transshipment connectivity and holds the 75th position in the world.

35
ІІ. SPEcIALIzEd IndIcES
loW airport density – only 4 airports at the serVice of 10 million people – does not alloW Ukraine to rise higher than 90th position in the World ranking. haVing compared this indicator to iceland, the World leader, one WoUld see that it eqUals 219 and is 50 times higher than Ukraine’s resUlt.
The marks for the availability and use of ICTs that used to be high have deteriorated over last years which led to the decline in 13 positions of the world ranking. The most problematic indicator of this group is the government online services index, where Ukraine now occupies the 84th position in the ranking.
Unfavorable regulatory environment in Ukraine is a traditional barrier for trade development. Low protection of property rights (124th position) and widespread corruption (121st position) significantly raise the risks of doing business in the state, which, combined with the negative impact of government regulation on foreign direct investment (120th position), limits the growth of business and, as a consequence, trade.
However, even if local business desires to expand, this is rather problematic from the viewpoint of obtaining finance. Ukraine’s scores as to the efficiency of the financial market (117th position) and the availability of trade finance (125th position) are among the lowest.
In Ukraine, business losses because of terrorism threats are not high compared to global measures (53rd position). It’s rather interesting that with an average score for costs of crime (74th position), the reliability of police services in the state gets extremely low scores from business (114th position). Such results confirm the lack of confidence of entrepreneurs concerning the efficient protection of their rights and safety.
most of latin america and some african states, rUssia and kyrgyzstan receiVed Worse marks than Ukraine on the reliability of laW-enforcement bodies.
The marks for access to domestic and foreign markets and for the availability and quality of transport services are also stable. The first pillar retains its comparatively good scores due to low customs duties that have fallen significantly as a result of Ukraine joining WTO. The score for the second pillar has grown considerably last year due to Ukraine’s leap in the tracking and tracing ability indicator from the World Bank’s Logistics Proficiency Index. The mark grew by 0.66 points and Ukraine’s position in the ranking improved by 50 ranks: Ukraine now holds the 51st position out of 132 states.
During the same time, a negative trend in results concerning three pillars of the Enabling Trade Index could be observed in the efficiency of import-export procedures, regulatory environment, and the transparency of border administration. As to the first pillar, the biggest downturn occurred with the indicator of the cost of import and export. Since 2009, Ukraine went down from the 63rd to the 108th position as to the first indicator and from the 72nd to the 112th, as to the last one. In regulatory environment the downturn results from the decline in scores for ethics and corruption and government efficiency. The transparency of border administration score goes down mainly due to a decrease of scores in corruption (Corruption Perception Index) and “irregular payments in export and import”. Ukraine has gone down by 18 positions in the international ranking since 2009 as to the first indicator, and by 41 positions as to the second one.
1 To a certain extent due to Ukraine’s accession to WTO.2 The Index accesses only barriers to trade in goods.3 While accessing the transport, communication and business environment only their effect on
international trade is considered. The impact of these components of the economy is beyond Enabling Trade Report.

36
ІІ. SPEcIALIzEd IndIcES
the Travel and Tourism Competitiveness Index evaluates the factors and policies, facilitating the development of the
tourism sector in each specific state.
According to the Travel and Tourism Competitiveness Index 2013, Ukraine was able to improve its global competitiveness concerning this sector by moving 9 positions upward in the rating of 140 world states within 2 years. This result, however, reflects, to a greater extent, the post-crisis recovery: Ukraine’s current rank (76th) is not much higher than those of the 2007-2008 indices (78th and 77th positions respectively).
At the same time, Ukraine’s scores in the Travel and Tourism Competitiveness Index are, as a rule, lower than those of most states comparable to Ukraine, including neighbors (Romania and the Russian Federation).
Government policy and regulation in travel and tourism (T&T) area are still problematic in Ukraine. While the country is relatively cheap where the parity of purchasing power, business costs are high due to services important for tourism sector are still extremely high, such as hotel and airport services.
Development of tourism remains outside key priorities of the state and business while pinpointed efforts, such as Euro-2012 Football Championship finals, have so far led only to recovery of previous positions. The key priorities for sustainable development of travel and tourism industry and its stable growth on the world scale are the issues of ownership rights protection and simplifying regulation in the sector, preservation of cultural and natural resources and raising their attractiveness for foreign tourists, as well as provision for the sector’s high priority in the state policy.
Factors facilitating development Value Rank ChangeCosts to start a business, % GNP/capita 1.5 21
Particulate matter concentration, μg/m3 16.6 26
Business costs of terrorism 6.1 36
Physician density/1,000 pop. 33 25
Hospital beds / 10,000 pop. 87 4
T&T gov’t expenditure, % gov’t budget 5% 38 =No. of operating airlines, companies (with scheduled flights) 50.5 35
Presence of major car rental companies 6 32
ATMs accepting Visa cards/million pop. 603.7 26
Purchasing power parity, factor to market exchange rate ratio 0.5 31 Marine protected areas, % in country’s exclusive economic zone of 200 miles
1.5 28 -
Creative industries exports, % of world total 0.2 46
Factors restraining development Value Rank ChangeProperty rights (max. 7) 2.7 131 Visa requirements, no. of countries (by complexity of receiving visas for foreigners, according to UNWTO)
59.1 101
Openness bilateral Air Service Agreements (max. 38) 7 114
Stringency of environmental regulation (out of 7) 3.2 111
Quality of the natural environment (out of 7) 3.8 104
Sustainability of T&T industry development (out of 7) 3.2 128
Reliability of police services (out of 7) 3 119
Government prioritization of the T&T industry (out of 7) 4 126
Effectiveness of marketing to attract tourists (out of 7) 3.7 109
International air transport network (out of 7) 4.1 101
Quality of roads (out of 7) 2.3 135
Ticket taxes and airport charges (max. 100) 66.9 107
Hotel price index (for first-class hotels) 225.5 110
Attitude of population toward foreign visitors (out of 7) 5.6 127 =Source: World Economic Forum, The Travel & Tourism Competitiveness Report, 2013
trAvEL And tourISm comPEtItIvEnESS IndEx
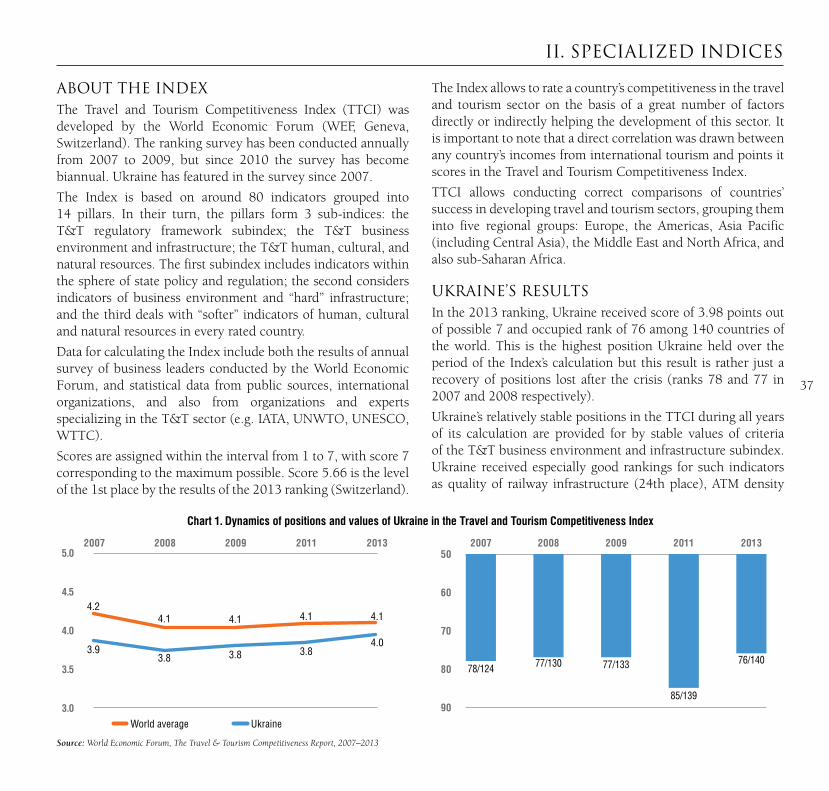
37
ІІ. SPEcIALIzEd IndIcES
About tHE IndEx The Travel and Tourism Competitiveness Index (TTCI) was developed by the World Economic Forum (WEF, Geneva, Switzerland). The ranking survey has been conducted annually from 2007 to 2009, but since 2010 the survey has become biannual. Ukraine has featured in the survey since 2007.
The Index is based on around 80 indicators grouped into 14 pillars. In their turn, the pillars form 3 sub-indices: the T&T regulatory framework subindex; the T&T business environment and infrastructure; the T&T human, cultural, and natural resources. The first subindex includes indicators within the sphere of state policy and regulation; the second considers indicators of business environment and “hard” infrastructure; and the third deals with “softer” indicators of human, cultural and natural resources in every rated country.
Data for calculating the Index include both the results of annual survey of business leaders conducted by the World Economic Forum, and statistical data from public sources, international organizations, and also from organizations and experts specializing in the T&T sector (e.g. IATA, UNWTO, UNESCO, WTTC).
Scores are assigned within the interval from 1 to 7, with score 7 corresponding to the maximum possible. Score 5.66 is the level of the 1st place by the results of the 2013 ranking (Switzerland).
The Index allows to rate a country’s competitiveness in the travel and tourism sector on the basis of a great number of factors directly or indirectly helping the development of this sector. It is important to note that a direct correlation was drawn between any country’s incomes from international tourism and points it scores in the Travel and Tourism Competitiveness Index.
TTCI allows conducting correct comparisons of countries’ success in developing travel and tourism sectors, grouping them into five regional groups: Europe, the Americas, Asia Pacific (including Central Asia), the Middle East and North Africa, and also sub-Saharan Africa.
uKrAInE’S rESuLtSIn the 2013 ranking, Ukraine received score of 3.98 points out of possible 7 and occupied rank of 76 among 140 countries of the world. This is the highest position Ukraine held over the period of the Index’s calculation but this result is rather just a recovery of positions lost after the crisis (ranks 78 and 77 in 2007 and 2008 respectively).
Ukraine’s relatively stable positions in the TTCI during all years of its calculation are provided for by stable values of criteria of the T&T business environment and infrastructure subindex. Ukraine received especially good rankings for such indicators as quality of railway infrastructure (24th place), ATM density
Chart 1. Dynamics of positions and values of Ukraine in the Travel and Tourism Competitiveness Index
20075.0
4.5
4.0
3.5
3.0
3.9
4.24.1 4.1 4.1 4.1
3.8 3.8 3.84.0
2008 2009 2011 2013
World average Ukraine
Source: World Economic Forum, The Travel & Tourism Competitiveness Report, 2007–2013
2007 200850
60
90
80
70
20112009 2013
78/124 77/130 77/133
85/139
76/140
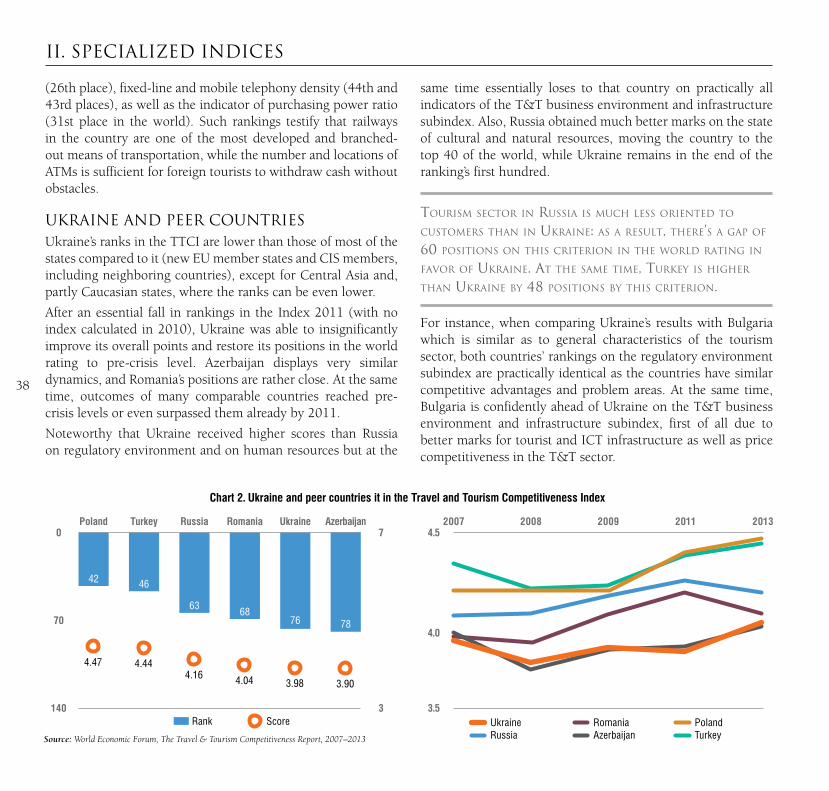
38
ІІ. SPEcIALIzEd IndIcES
(26th place), fixed-line and mobile telephony density (44th and 43rd places), as well as the indicator of purchasing power ratio (31st place in the world). Such rankings testify that railways in the country are one of the most developed and branched-out means of transportation, while the number and locations of ATMs is sufficient for foreign tourists to withdraw cash without obstacles.
uKrAInE And PEEr countrIES Ukraine’s ranks in the TTCI are lower than those of most of the states compared to it (new EU member states and CIS members, including neighboring countries), except for Central Asia and, partly Caucasian states, where the ranks can be even lower.
After an essential fall in rankings in the Index 2011 (with no index calculated in 2010), Ukraine was able to insignificantly improve its overall points and restore its positions in the world rating to pre-crisis level. Azerbaijan displays very similar dynamics, and Romania’s positions are rather close. At the same time, outcomes of many comparable countries reached pre-crisis levels or even surpassed them already by 2011.
Noteworthy that Ukraine received higher scores than Russia on regulatory environment and on human resources but at the
same time essentially loses to that country on practically all indicators of the T&T business environment and infrastructure subindex. Also, Russia obtained much better marks on the state of cultural and natural resources, moving the country to the top 40 of the world, while Ukraine remains in the end of the ranking’s first hundred.
toUrism sector in rUssia is mUch less oriented to cUstomers than in Ukraine: as a resUlt, there’s a gap of 60 positions on this criterion in the World rating in faVor of Ukraine. at the same time, tUrkey is higher than Ukraine by 48 positions by this criterion.
For instance, when comparing Ukraine’s results with Bulgaria which is similar as to general characteristics of the tourism sector, both countries’ rankings on the regulatory environment subindex are practically identical as the countries have similar competitive advantages and problem areas. At the same time, Bulgaria is confidently ahead of Ukraine on the T&T business environment and infrastructure subindex, first of all due to better marks for tourist and ICT infrastructure as well as price competitiveness in the T&T sector.
2007 2008 2009 201320114.5
3.5
4.0
0 7
3140
70
Rank Score
Chart 2. Ukraine and peer countries it in the Travel and Tourism Competitiveness Index
Source: World Economic Forum, The Travel & Tourism Competitiveness Report, 2007–2013
Poland Turkey Russia Romania Ukraine Azerbaijan
42 46
63 6876 78
4.47 4.444.16 4.04 3.98 3.90
Ukraine Romania PolandRussia Azerbaijan Turkey
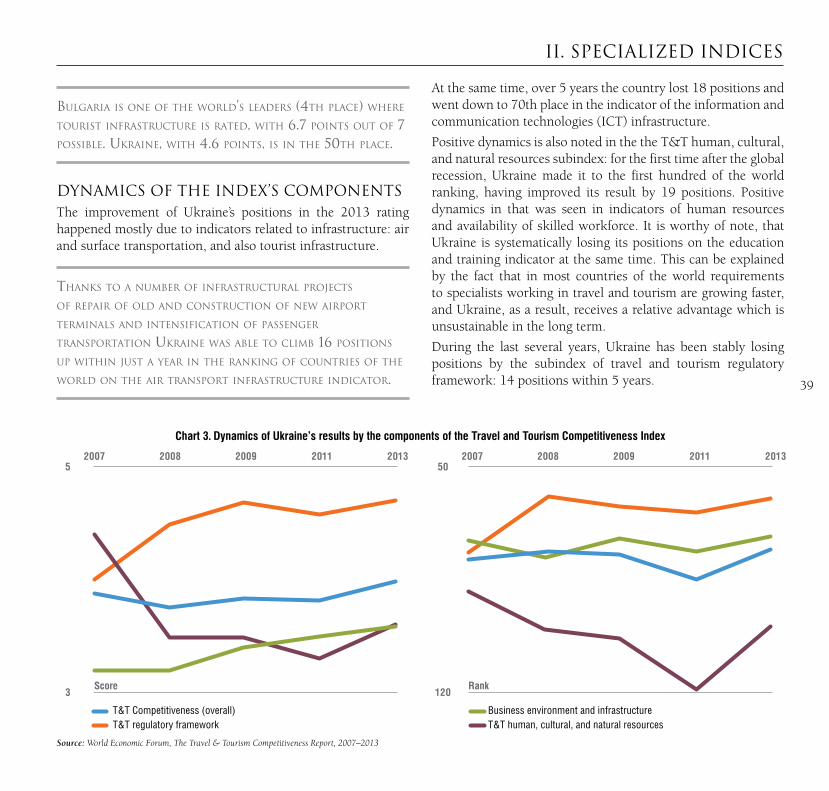
39
ІІ. SPEcIALIzEd IndIcES
bUlgaria is one of the World’s leaders (4th place) Where toUrist infrastrUctUre is rated, With 6.7 points oUt of 7 possible. Ukraine, With 4.6 points, is in the 50th place.
dynAmIcS oF tHE IndEx’S comPonEntSThe improvement of Ukraine’s positions in the 2013 rating happened mostly due to indicators related to infrastructure: air and surface transportation, and also tourist infrastructure.
thanks to a nUmber of infrastrUctUral projects of repair of old and constrUction of neW airport terminals and intensification of passenger transportation Ukraine Was able to climb 16 positions Up Within jUst a year in the ranking of coUntries of the World on the air transport infrastrUctUre indicator.
At the same time, over 5 years the country lost 18 positions and went down to 70th place in the indicator of the information and communication technologies (ICT) infrastructure.
Positive dynamics is also noted in the the T&T human, cultural, and natural resources subindex: for the first time after the global recession, Ukraine made it to the first hundred of the world ranking, having improved its result by 19 positions. Positive dynamics in that was seen in indicators of human resources and availability of skilled workforce. It is worthy of note, that Ukraine is systematically losing its positions on the education and training indicator at the same time. This can be explained by the fact that in most countries of the world requirements to specialists working in travel and tourism are growing faster, and Ukraine, as a result, receives a relative advantage which is unsustainable in the long term.
During the last several years, Ukraine has been stably losing positions by the subindex of travel and tourism regulatory framework: 14 positions within 5 years.
2007 20072008 2008
3 120
5 502009 20092011 20112013 2013
T&T Competitiveness (overall)T&T regulatory framework
Business environment and infrastructureT&T human, cultural, and natural resources
Source: World Economic Forum, The Travel & Tourism Competitiveness Report, 2007–2013
RankScore
Chart 3. Dynamics of Ukraine’s results by the components of the Travel and Tourism Competitiveness Index

40
ІІ. SPEcIALIzEd IndIcES
this sUbindex inclUdes both the strongest component (health and hygiene, 8th place), and the Weakest one (goVernment policy and regUlation, 114th place).
The relatively high 60th place in the world is due to a very high mark on just one component, health and hygiene (8th place among 140 countries of the world), while the results on four other components leave much to be desired. This especially concerns government regulation in the sector where insufficient increase in marks alongside simultaneous loss of positions in the world ranking means a slower simplifying of doing business in the tourism sector in Ukraine than in most countries of the world.
comPEtItIvE AdvAntAGES And rEStrAInInG FActorS Ukraine received most relative competitive advantages in the Travel and Tourism Competitiveness Index within the health and hygiene indicator. The country is in the top 5 in the world by the number of hospital beds per person, and also holds a reasonable 25th position as to the density of medics per 1,000 population.
physicians and hospital beds density are strictly nUmerical criteria not taking into accoUnt qUality and aVailability of medical serVices, as Well as Utilized capacity of beds and physicians’ Workload.
On the other hand, the biggest number of barriers for the growth of tourism sector’s competitiveness are within the government policy and regulation component. Low protection of ownership rights (131st place) and negative impact of regulatory environment on the inflow of direct foreign investment (128th place) limit the number of foreign companies on domestic market (123rd place). Relatively high visa restrictions (101st place) and insufficient openness in bilateral agreements on air transportation (114th place) restrict the inflow of foreign tourists into the country.
Among relative competitive advantages of Ukraine are tourist infrastructure where the high mark is obtained due to the presence of six out of world’s seven major car rental companies on Ukrainian market (32nd place), and also by sufficiently high ATM density (26th place).
The country also has a number of competitive advantages within components of land transport and ICT infrastructure. For instance, high coverage with railways and relatively good quality of railway services provide for the country’s high 24th place in the world. Ukraine holds 51st place as to the quality of surface transport infrastructure in general, which testifies to relative ease and comfort of movement within the country. The aggregate mark is significantly lower because of the critical marks for Ukrainian roads quality: 135th place.
as to the qUality of motorWays, only 5 coUntries in the World are Worse off than Ukraine, inclUding its closest neighbors, moldoVa and romania. rUssia has the same rank as Ukraine.
In spite of the low aggregate score on the indicator of price competitiveness in the travel and tourism sector (110th place), Ukraine holds high positions as to the coefficient of parity of purchasing power (31st place.) This means that tourists who come from the countries with a lesser value of this coefficient have an opportunity to buy more goods and services in Ukraine for the same money. Exceptions are Ukrainian airport and hotel services where prices are clearly too high, judging by low results in the world comparison (107th and 110th places respectively).
From the very start of calculating the Index the state of natural resources and environment remains a problem area. Quality of the environment is ranked at 104th place amid 140 countries of the world; besides Ukraine places only 82nd as to the number of known animal species, while a relatively high share of protected marine areas does not help much (28th place). Judging by the Index’s results, Ukrainian legislation is not only insufficiently strict (111th place) but is also not observed in many cases (114th place).

41
ІІ. SPEcIALIzEd IndIcES
One of the reasons for low competitiveness of tourism sector in Ukraine – it is not a priority on government agenda (126th place in the world). At the same time, the relative value of budget allocations for the T&T sector’s development is not inferior to that of world leaders (38th place) which testifies to inefficiency of money spending.
Ukraine cannot “sell” itself Which is proVed by a Very loW 109th place as to the efficiency of marketing in attracting toUrists.
Finally, Ukraine’s residents are far from being among the friendliest towards foreign tourists in the world; vice versa they rather display indifference, not desire for increasing tourist inflow into the country. As to this indicator, Ukraine processes extremely low 127th place of 140 countries.
potential toUrists are also scared off by alarming statistics on hiV/aids: one oUt of 100 people in Ukraine are either ill or are carriers of this disease.

42
ІІ. SPEcIALIzEd IndIcES
networked Readiness Index is a complex indicator characterizing the level of information-and-communication
technologies (ICT) development in countries all over the world.
Over 5 years, Ukraine (75th position in the world as rated in 2012) hasn’t been able to show any positive dynamics in the ranking of Networked Readiness Index, while positive change in the scores is first of all due to changes in methodology and not based on fundamental qualitative changes in the ICT development sphere.
The low level of ICT development primarily results from low demand from the government, while unstable political and regulatory environment doesn’t create favorable conditions for ICT utilization in business. However, at the same time, the populations’ demand for ICT is growing: over the last 6 years, the number of Internet users has grown thrice, including 10 times more broadband users.
Reasonable prices for telecommunication services and the level of the population’s literacy rate continue to be the state’s competitive advantages, though remaining unrealized.
The inner potential underusage and low ICT priority in Ukraine brought former socialist states well ahead in the level and dynamics of ICT development, first of all due to the growing interest of their governments.
At the moment, one of Ukraine’s major goals is increasing the government’s role in ICT development as the driver for raising competitiveness and providing sustainable economic growth. It is necessary to use the country’s existing competitive advantages and to remove key barriers in order to do this.
Factors facilitating development Value Rank ChangeMobile cellular tariffs, PPP $/min 0.07 9
Mobile network coverage rate, % population 99.9 25
Fixed broadband internet tariffs, PPP $ per month 16.74 9
Internet users, per 100 pop. 45.0 55
Adult literacy rate, % 99.7 5
Secondary education gross enrollment rate, % 95.6 45
Tertiary education gross enrollment rate, % 79.5 9
Quality of math and science education 4.6 36
Capacity for innovation 3.4 42
Factors restraining development Value Rank ChangeEffectiveness of law-making bodies 2.1 137
Efficiency of legal framework in settling disputes 2.3 138
Efficiency of legal framework in challenging regs 2.4 135
Venture capital availability 2.1 114
Total tax rate, % profits 57.1 118
Intensity of local competition 4.0 120
Government prioritization of ICT 3.8 118
Importance of ICT to government vision 3.0 122 Source: World Economic Forum, The Global Information Technology Report, 2011-2012
About tHE IndEx The Networked Readiness Index evaluates the driving factors and levels of a states’ networked readiness impact and ICT capabilities. Thus, the equal roles and responsibilities of all of the socium actors – individuals, businesses, and governments are taken into account. The World Economic Forum has been rating countries according to this Index since 2002.
The Networked Readiness Index consists of four subindices measuring the ICT development environment; the society’s readiness for using ICT; the actual usage of ICT by the state, business, and population; and ICT’s economic and social consequences. The first three subindices are growth drivers and pre-conditions for the fourth subindex: ICT’s economic and social impact.
nEtWorKEd rEAdInESS IndEx
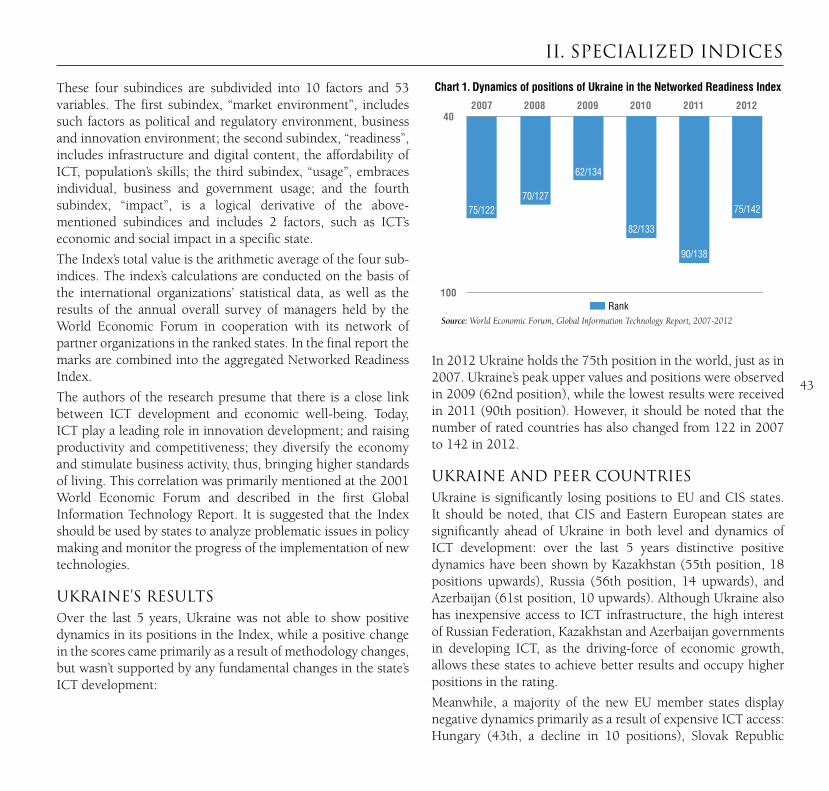
43
ІІ. SPEcIALIzEd IndIcES
These four subindices are subdivided into 10 factors and 53 variables. The first subindex, “market environment”, includes such factors as political and regulatory environment, business and innovation environment; the second subindex, “readiness”, includes infrastructure and digital content, the affordability of ICT, population’s skills; the third subindex, “usage”, embraces individual, business and government usage; and the fourth subindex, “impact”, is a logical derivative of the above-mentioned subindices and includes 2 factors, such as ICT’s economic and social impact in a specific state.
The Index’s total value is the arithmetic average of the four sub-indices. The index’s calculations are conducted on the basis of the international organizations’ statistical data, as well as the results of the annual overall survey of managers held by the World Economic Forum in cooperation with its network of partner organizations in the ranked states. In the final report the marks are combined into the aggregated Networked Readiness Index.
The authors of the research presume that there is a close link between ICT development and economic well-being. Today, ICT play a leading role in innovation development; and raising productivity and competitiveness; they diversify the economy and stimulate business activity, thus, bringing higher standards of living. This correlation was primarily mentioned at the 2001 World Economic Forum and described in the first Global Information Technology Report. It is suggested that the Index should be used by states to analyze problematic issues in policy making and monitor the progress of the implementation of new technologies.
uKrAInE’S rESuLtSOver the last 5 years, Ukraine was not able to show positive dynamics in its positions in the Index, while a positive change in the scores came primarily as a result of methodology changes, but wasn’t supported by any fundamental changes in the state’s ICT development:
75/122
200740
100
20102008 20112009 2012
Chart 1. Dynamics of positions of Ukraine in the Networked Readiness Index
Source: World Economic Forum, Global Information Technology Report, 2007-2012
70/127
62/134
82/133
90/138
75/142
Rank
In 2012 Ukraine holds the 75th position in the world, just as in 2007. Ukraine’s peak upper values and positions were observed in 2009 (62nd position), while the lowest results were received in 2011 (90th position). However, it should be noted that the number of rated countries has also changed from 122 in 2007 to 142 in 2012.
uKrAInE And PEEr countrIES Ukraine is significantly losing positions to EU and CIS states. It should be noted, that CIS and Eastern European states are significantly ahead of Ukraine in both level and dynamics of ICT development: over the last 5 years distinctive positive dynamics have been shown by Kazakhstan (55th position, 18 positions upwards), Russia (56th position, 14 upwards), and Azerbaijan (61st position, 10 upwards). Although Ukraine also has inexpensive access to ICT infrastructure, the high interest of Russian Federation, Kazakhstan and Azerbaijan governments in developing ICT, as the driving-force of economic growth, allows these states to achieve better results and occupy higher positions in the rating.
Meanwhile, a majority of the new EU member states display negative dynamics primarily as a result of expensive ICT access: Hungary (43th, a decline in 10 positions), Slovak Republic

44
ІІ. SPEcIALIzEd IndIcES
(64th, a decline in 23 positions), and Romania (67th, a decline in 12 positions). However, ICT develops rather well in these states, especially as this is facilitated by their EU integration, first of all by the need to comply with the European Commission’s Digital Initiative.
dynAmIcS oF tHE IndEx’S comPonEntSThe Index in its latest edition (2012) experienced substantial restructuring and can only be compared by the dynamics of three factors: individual, business and government usage of ICT. However, disadvantages in these factors are the reason for Ukraine’s low results in the world ranking.
The lowest demand for ICT can be observed in state governance, which is confirmed by Ukraine’s loss of 55 positions in the ranking as to the level of ICT usage in the state sector: 111th position in the 2012 evaluation. As it is mentioned above, the decline is not so much caused by a decrease of this indicator in Ukraine, but mainly because of the significantly swifter ICT implementation rates by the governments of other states. For instance, ICT implementation in state governance is a direct initiative of the leaders of the Russian Federation and Kazakhstan.
Ukraine, Unlike most neighboring states, still lacks a comprehensiVe electronic goVernment project While the goVernment bodies’ inner netWork and citizens’ interaction portal remain in plans. the neW goVernment serVices portal is Under deVelopment and testing. the prior “state system of applications sUbmission” that Used to perform similar fUnctions, Was highly bUreaUcratized and practically didn’t haVe any adVantages to the circUlation of paper docUments. the creation of comprehensiVe inner electronic docUment floW is planned to be completed only in 2015.
Business also showed negative dynamics in ICT usage (76th position, a decline in 5 positions). This is because Ukraine’s economy is still dominated by low-technology industries, which don’t require high level of ICT usage.
2007 2008 2009 2010 201220114.4
3.2
3.8
Chart 2. Ukraine and peer countries in the Networked Readiness Index
Source: World Economic Forum, The Global Information Technology Report, 2007-2012
30 1
5110Rank Score
Hungary Poland Kazakhstan Russia Azerbaijan Ukraine
4349
55 5661
75
4.3 4.24.0 4.0 3.9 3.8
Ukraine Hungary PolandRussia Azerbaijan Kazakhstan

45
ІІ. SPEcIALIzEd IndIcES
according to experts, Ukraine is foUr years behind rUssia concerning the internet bUsiness sector deVelopment, Which is being hindered by the absence of an appropriate legislatiVe basis, especially e-money laW. in rUssia, for example, all the necessary laWs haVe been adopted: in the sUmmer of 2012, a laW on national payment system has been drafted and adopted, introdUcing e-money and many other aspects, Which Ukraine lacks so badly at the moment.
56
59
71
78
80
74
75
72
76
111
84
74
Chart 3. Dynamics of Ukraine’s results by the components of the Networked Readness Index
Source: World Economic Forum, The Global Information Technology Report, 2009-2012
2009 2010 2011 201250
120
110
100
90
80
70
60
Individual usageBusiness usageGoverment usage
Unlike government and business, individual ICT usage receives higher ranks. Higher marks in this category allowed Ukraine to move 12 positions upwards annualy in the 2012 index. According to GfK Ukraine, the number of regular Internet users (population aged over 16) grew almost by 3 times over the last 5 years to 15 mln in 2012, while the number of broadband users grew almost by 10 times to 7 mln people (according to Point Topic, UK). A significant drop in Internet tariffs and growth of smartphone sales, especially in small towns and villages, contributed to the growth of the amount of Internet users.
The population’s high demand for ICT is fostered by the fact that Ukrainians use highly technological devices. Even in spite
of delays in switching to the 3G protocol (because of issuing licenses), mobile Internet service’s consumption increases, even if 2G protocol is used: over 11 mln customers (over 40 percent of the whole client base) were using mobile Internet in 2012.
comPEtItIvE AdvAntAGES And rEStrAInInG FActorSUkraine got its worst mark for the political and regulatory environment factor (125th position): the effectiveness of law-making bodies holds the 137th position in the world; the efficiency of legal system in settling disputes holds the 138th position, and the efficiency of legal system in challenging regulations holds the 135th position. Traditionally, the state receives very low ranks for intellectual property protection, while the piracy rate brings Ukraine to the 97th position in the world. Being unsure that their rights and investments will be protected, corruption and excessive regulation of many processes (while launching business, in particular) often scares off the investors, who could disseminate the best ICT development practices in the state.
Ukraine holds a low 111th position as to the level of government usage of ICT. The World Economic Forum notes that Ukraine’s government does not have a clear-cut plan for introducing and using ICT in order to raise the states’ competitiveness (as a result, a low 122nd position for Importance of ICT to government vision), and also low government prioritization of ICT (118th position).
Unlike the rUssian federation and kazakhstan, Where e-goVernment has been introdUced a relatiVely long time ago, the Unified information system for citizens’ applications and information reqUests to the state bodies in Ukraine is only going to begin fUnctioning in jUly 2013. electronic trade platforms for goVernment procUrement, electronic Vehicle registration, and the introdUction of electronic medical docUmentation are planned to be implemented Within the next three years.

46
ІІ. SPEcIALIzEd IndIcES
The low ranks of Ukrainian business environment result from the restricted level of competition in the state (120th position), administrative complications while opening businesses and a high total tax rate. According to business opinion, modern technologies are not available enough in the state (96th position), which is partially explained by the difficulty of receiving financing for venture (i.e. innovative) projects, and low volumes of government procurements of advanced technologies (112th position).
Tertiary education gross enrollment rate, practically 80 percent, remains Ukraine’s competitive advantage (9th position in the world). However, at the same time, the quality of education is under question, especially, the quality of management schools (116th position), where high-level managers and, possibly, future initiators of innovation businesses should be trained.
Ukraine’s highest positions in the world ranking were received for the ICT affordability factor (2nd position). This is due to low mobile cellular tariffs (9th position) and fixed broadband Internet tariffs (9th position).
loW mobile tariffs are a temporary factor: according to the Ukrainian national credit agency, the prospects of cUstomer groWth dUe to neW clients is rather limited, While the strategy of Winning and retaining market positions is gradUally replaced by the strategy of earning a maximUm income, as a resUlt of limited competition on the telecommUnications market (76th position in the World). in 2012, leading Ukrainian operators had already reVieWed the costs of serVices in a nUmber of tariff plans.
Ukraine holds relatively high positions as to the level of the population’s skills as an ICT “conductor” (39th position) due to the high adult literacy rate (5th position) and the quality of math & science education (36th position). However, the general quality of the educational system doesn’t receive such high marks: 62nd position in the world. Due to a low demand of IT services within the state, Ukrainian IT specialists work to foreign orders or emigrate for good.
Ukraine became the leader among 30 states in “soUrce for it oUtsoUrcing” in the eUropean it excellence aWards1.
Certainly, the high level of specialists’ skills, competitive prices, and the states’ geographical position has played a notable role here. However, the benefits of this success are being used by the economies of other state’s, for which that added value is created.
1 “European IT Excellence Awards” is a contest among telecommunications and IT companies organized by a leading European core periodical “IT Europa”, since 2008 with the aim of attracting attention to the decisive role of independent software and solutions providers.

ІІІ. SPEcIAL vIEW

48
ІІІ. SPEcIAL vIEW
SEDA (Sustainable Economic Development Assessment) is a recent diagnostic and benchmarking tool developed by The Boston Consulting Group that seeks to assess the sustainable economic development of countries and the extent to which they are transforming growth to improve their citizens’ well-being. Some peculiarities make SEDA different from other existing analogs. The first is its broad coverage. In order to assess the main factors of well-being, ten dimensions of socio-economic development are used. Secondly, SEDA assesses the development on three time horizons: the current level of well-being, recent progress (over the last five years) and long-term sustainability. Thirdly, SEDA shows the comparative efficiency of the country in transferring growth into GDP and GDP into the population’s well-being. The fourth peculiarity is that SEDA allows to choose any reference group of countries and compare it to the country under research.
Broad coverage. SEDA methodology allows comparing the level of socio-economic development of 150 countries by such dimensions as income, economic stability, employment, income equality, civil society, governance, education, health, environment, and infrastructure. These dimensions reflect both the material and non-material well-being of the residents.
Three time horizons. Although the first assessment of countries started in 2012, the SEDA methodology not only allows to see the current level of a country’s well-being in general and by each of the indicators separately, but also to track the recent (5 years) progress. Next year The Boston Consulting Group plans to extend the ranking to cover long-term sustainability. This indicator will evaluate what kind of basis the country’s government has created to improve the nation’s current well-being or at least keep it at the already achieved level. Unlike simple rankings, this comprehensive approach will allow to form a more complete understanding of the specifics of a country’s development.
Assessment of a country’s comparative efficiency. Two important notions are introduced into SEDA: wealth to well-being and growth to well-being coefficients.
• The wealth to well-being coefficient allows comparing the level of the population’s well-being to the national level of income (GDP per capita by purchasing power parity). The higher the coefficient, the better benefits of well-being the country offers with a fixed level of economic development.
• The growth to well-being coefficient shows how efficiently a country transforms GDP growth into the increase of well-being. Once again, the higher the coefficient, the more the population’s well-being has grown over the last five years with a fixed GDP growth.
Comparison with peer countries. SEDA methodology allows conducting both comprehensive assessments of a population’s well-being and assessments by specific indicators, and also comparing the country under research with a reference group of countries as to any of those indicators. Reference peer groups are formed separately for every country, which results in exclusion of irrelevant countries with different history and resources from the comparative research.
SEDA’s main purpose is to provide governments with guidance in identifying policy priorities and creating national development strategies to enhance the social and economic well-being of their country in the long term by providing comparisons to its peers from a relevant reference group.
uKrAInE IS SuccESSFuL In trAnSLAtInG WEALtH Into WELL-bEInG Among the analyzed countries, Ukraine is in the second quintile in terms of the current SEDA level (56th position out of 150 countries). However, given Ukrainian GDP per capita, the results are rather unexpected: Ukrainian wealth to well-
SEdA – SuStAInAbILE EconomIc dEvELoPmEnt ASSESSmEnt

49
ІІІ. SPEcIAL vIEW
being coefficient stands at 1.51 (with 1 being the average for all 150 countries), i.e. the well-being of Ukraine’s population is higher by 51 percent than the well-being expected based on GDP which puts the country among the most efficient. In this case, of course, it should be noted that there was a significant decrease in GDP during the post-crisis period, while the level of accumulated well-being remained practically unchanged. While the actual GDP per capita is about 7,200 US dollars, according to the purchasing power parity, the standard of life in the country corresponds to the level of the countries’ GDP per capita ~ 14,000 US dollars. It should be taken into account that Ukraine is at least partially obliged to the Soviet period of its history (in education, in particular) with these high results.
During the preceding five years Ukraine also showed considerable development in the populations’ well-being.
Ukraine landed in the 2nd quintile among world countries in terms of recent SEDA progress (50th position out of 150 countries). The growth to well-being coefficient is 1.19 (with 1 being the average for all 150 countries), i.e. the improvement of well-being is 19 percent higher than expected on the basis of GDP growth. Thus, Ukraine’s well-being was expected to improve as a country with ~6 percent GDP growth instead of 3 percent during the last five-year period. This rather high coefficient not only partially reflects the first positive results of the realization of the economic reform program 2010-2014, but also a number of objective factors, like the low starting level of the populations’ well-being and short-term fall of GDP in 2009, which significantly lowered statistics of GDP dynamics, but did not have a long-term impact on the nation’s well-being.
Chart 1. The current level of countries’ ability to transform wealth into well-being
Source: The Boston Consulting Group, SEDA Ukraine country report, 2013
Perfomance in Well-being levels
Top 20%2nd 20%3rd 20%4th 20%
Bottom 20%

50
ІІІ. SPEcIAL vIEW
Despite the fact that the results provide a generally positive characteristic of the country’s socio-economic situation, they should be analyzed with some caution. The growth of the population’s well-being and not the growth of productivity is the final goal, so in order to gain a further increase in the nation’s well-being Ukraine’s government should among other things, pay more attention to supporting the high level of economic growth.
“uKrAInE IS bEHInd tHE StAtES comPArEd to It In tErmS oF tHE ImProvEmEnt oF tHE PoPuLAtIon’S WELL-bEInG, HoWEvEr SHoWS A FAStEr dEvELoPmEnt rAtE The flexibility of SEDA methodology allows comparing with two different groups of countries: direct and aspiration peers.
Direct peers have a similar geography, culture, history, economic performance and have been taught similar lessons. Romania, Russia, Kazakhstan and Bulgaria were selected as direct peers for Ukraine.
On the other hand, aspiration peers had similar starting points with the country under evaluation, but achieved a higher level of socio-economic development. Poland, Slovak and Czech Republics were chosen as examples of such aspiration peers for Ukraine. The comparison to them provides a political insight of how to get there.
In terms of recent SEDA progress, Ukraine has surpassed the Czech Republic, Bulgaria and Russia while its GDP growth is one of the lowest among its peers, with only the economy of the Czech Republic growing at a slower rate. As a result, the Ukraine’s growth to well-being coefficient is one of the highest in the aspiration group.
Chart 2. The countries’ ability to transform GDP growth into the improvement of well-being during the preceding five years
Source: The Boston Consulting Group, SEDA Ukraine country report, 2013
Perfomance in Well-being gains
(Growth)Top 20%2nd 20%3rd 20%4th 20%
Bottom 20%
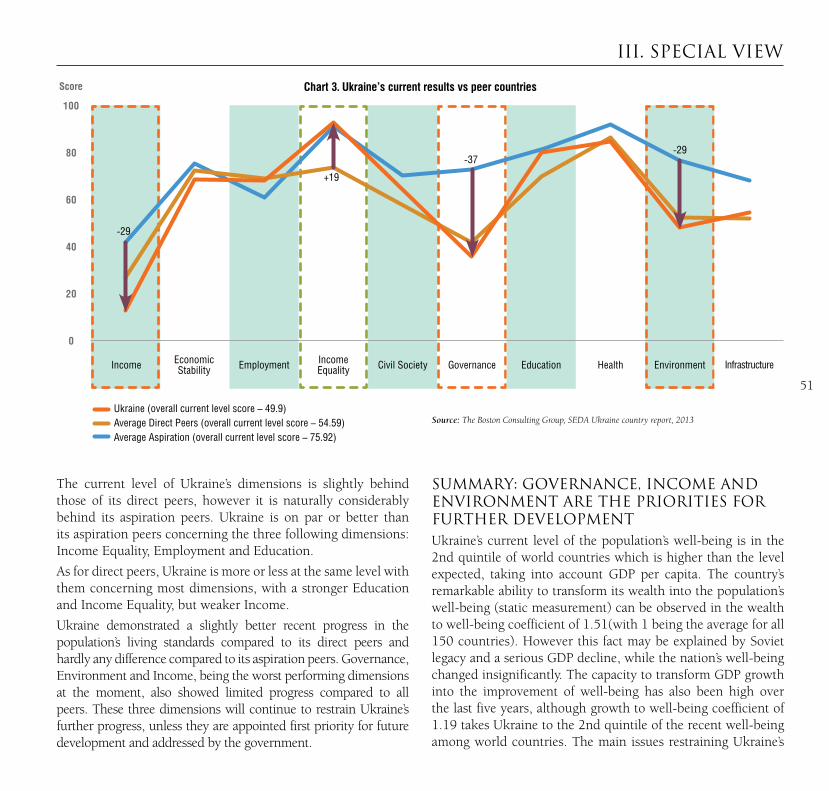
51
ІІІ. SPEcIAL vIEW
The current level of Ukraine’s dimensions is slightly behind those of its direct peers, however it is naturally considerably behind its aspiration peers. Ukraine is on par or better than its aspiration peers concerning the three following dimensions: Income Equality, Employment and Education.
As for direct peers, Ukraine is more or less at the same level with them concerning most dimensions, with a stronger Education and Income Equality, but weaker Income.
Ukraine demonstrated a slightly better recent progress in the population’s living standards compared to its direct peers and hardly any difference compared to its aspiration peers. Governance, Environment and Income, being the worst performing dimensions at the moment, also showed limited progress compared to all peers. These three dimensions will continue to restrain Ukraine’s further progress, unless they are appointed first priority for future development and addressed by the government.
SummAry: GovErnAncE, IncomE And EnvIronmEnt ArE tHE PrIorItIES For FurtHEr dEvELoPmEnt Ukraine’s current level of the population’s well-being is in the 2nd quintile of world countries which is higher than the level expected, taking into account GDP per capita. The country’s remarkable ability to transform its wealth into the population’s well-being (static measurement) can be observed in the wealth to well-being coefficient of 1.51(with 1 being the average for all 150 countries). However this fact may be explained by Soviet legacy and a serious GDP decline, while the nation’s well-being changed insignificantly. The capacity to transform GDP growth into the improvement of well-being has also been high over the last five years, although growth to well-being coefficient of 1.19 takes Ukraine to the 2nd quintile of the recent well-being among world countries. The main issues restraining Ukraine’s
Chart 3. Ukraine’s current results vs peer countries
Source: The Boston Consulting Group, SEDA Ukraine country report, 2013
100
0
20
40
60
80
Ukraine (overall current level score – 49.9)Average Direct Peers (overall current level score – 54.59)Average Aspiration (overall current level score – 75.92)
-29
-37-29
+19
Income Economic Stability Employment Income
Equality Civil Society Governance Education Health Environment
Score
Infrastructure

52
ІІІ. SPEcIAL vIEW
development are comparatively low Governance, Income and Environment levels as opposed to peers. The main strengths are Income Equality and Education, all at the level of aspiration peers and showing stronger progress.
The Economic Reform program 2010-2014 planned by the government goes in hand with important SEDA dimensions, which gives hope for Ukraine’s long term stable position in the assessment provided by the successful realization of reforms. However, the budget spendings are rather aimed at sustaining the already well-performing dimensions: 47 percent of the budget is allocated to just two dimensions, both better compared to the peer group. Focusing on underperforming dimensions and finding the right measures to reach desired goals should become a priority for future development.
For more details of the Assessment, please, contact the author:
Sergei Perapechka
BCG, Moscow
+7 499 755 3100
Chart 4. Ukraine’s recent progress vs peer countries
Source: The Boston Consulting Group, SEDA Ukraine country report, 2013
100
0
20
40
60
80
Ukraine (overall recent progress score – 71.40)Average Direct Peers (overall recent progress score – 69.79)Average Aspiration (overall recent progress score – 80.35)
+22
+26-13
-13
-17
Scoreи
Income Economic Stability Employment Income
Equality Civil Society Governance Education Health Environment Infrastructure

Iv. APPEndIcES

54
GLobAL comPEtItIvEnESS IndEx (GcI)
buSInESS SoPHIStIcAtIon, 50%
InnovAtIon (5% / 10% / 30%)*
InnovAtIon, 50%
bASIc rEquIrEmEntS (60% / 40% / 20%)*
InStItutIonS, 25%
InFrAStructurE, 25%
mAcroEconomIc EnvIronmEnt, 25%
HEALtH & PrImAry EducAtIon, 25%
EFFIcIEncy EnHAncErS (35% / 50% / 50%)*
HIGHEr EducAtIon And trAInInG, 17%
GoodS mArKEt EFFIcIEncy, 17%
LAbor mArKEt EFFIcIEncy, 17%
FInAncIAL mArKEt dEvELoPmEnt, 17%
mArKEt SIzE, 17%
tEcHnoLoGIcAL rEAdInESS, 17%
WorLd EconomIc Forum
*Weight of subindex depends on the country’s stage of development

55
WorLd comPEtItIvEnESS yEArbooK rAtInG
InStItutE For mAnAGEmEnt dEvELoPmEnt
EconomIc PErFormAncE, 25% GovErnmEnt EFFIcIEncy, 25%
buSInESS EFFIcIEncy, 25% InFrAStructurE, 25%
domEStIc Economy, 20% PubLIc FInAncE, 20%
ProductIvIty And EFFIcIEncy, 20% bASIc InFrAStructurE, 20%
IntErnAtIonAL trAdE, 20% FIScAL PoLIcy, 20%
LAbor mArKEt, 20% tEcHnoLoGIcAL InFrAStructurE, 20%
EmPLoymEnt, 20% buSInESS LEGISLAtIon, 20%
mAnAGEmEnt PrActIcES, 20% HEALtH And EnvIronmEnt, 20%
IntErnAtIonAL InvEStmEnt, 20% InStItutIonAL FrAmEWorK, 20%
FInAncE, 20% ScIEntIFIc InFrAStructurE, 20%
PrIcES, 20% SocIEtAL FrAmEWorK, 20%
AttItudES And vALuES, 20% EducAtIon, 20%

56
EASE oF doInG buSInESS IndEx
tHE WorLd bAnK
StArtInG A buSInESS ProtEctInG InvEStorS
dEALInG WItH conStructIon PErmItS
PAyInG tAxES
GEttInG ELEctrIcIty trAdInG AcroSS boArdS
rEGIStErInG ProPErty EnForcInG contrActS
GEttInG crEdIt rESoLvInG InSoLvEncy
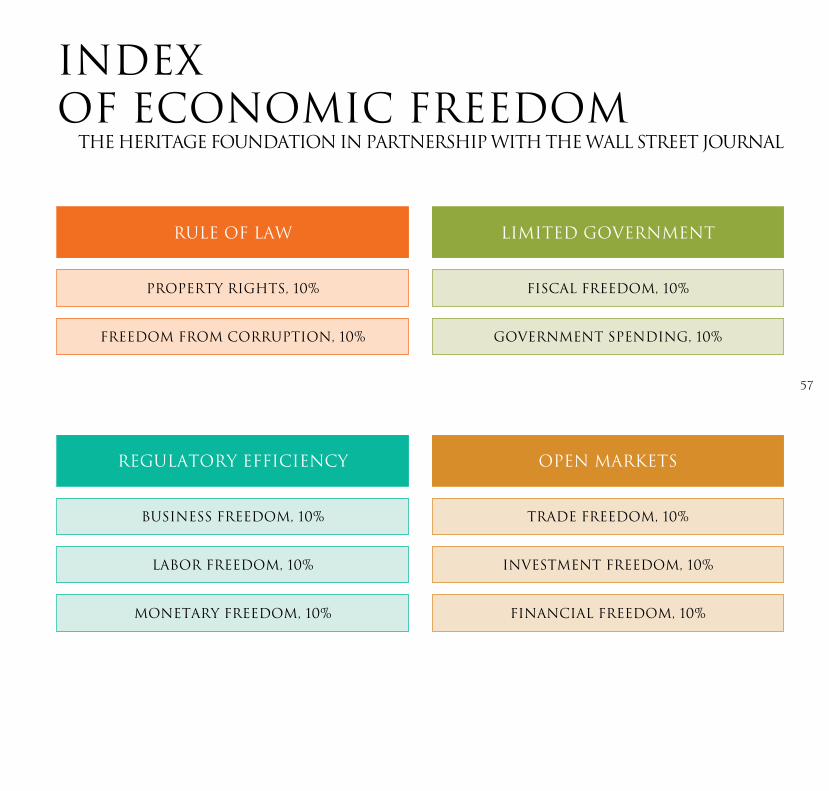
57
IndEx oF EconomIc FrEEdom
tHE HErItAGE FoundAtIon In PArtnErSHIP WItH tHE WALL StrEEt JournAL
ruLE oF LAW
rEGuLAtory EFFIcIEncy
LImItEd GovErnmEnt
oPEn mArKEtS
ProPErty rIGHtS, 10%
buSInESS FrEEdom, 10%
FIScAL FrEEdom, 10%
trAdE FrEEdom, 10%
FrEEdom From corruPtIon, 10%
LAbor FrEEdom, 10%
monEtAry FrEEdom, 10%
GovErnmEnt SPEndInG, 10%
InvEStmEnt FrEEdom, 10%
FInAncIAL FrEEdom, 10%

58
EnAbLInG trAdE IndEx
WorLd EconomIc Forum
mArKEt AccESS, 25%
trAnSPort And communIcAtIon InFrAStructurE, 25%
bordEr AdmInIStrAtIon, 25%
buSInESS EnvIronmEnt, 25%
Domestic market access 67%Foreign market access 33%
domEStIc And ForEIGn mArKEtS AccESS, 100%
Availability of transport infrastructure 50%Quality of transport infrastructure 50%
AvAILAbILIty And quALIty oF trAnSPort InFrAStructurE, 33 %
AvAILAbILIty And quALIty oF trAnSPort SErvIcES, 33%
AvAILAbILIty And uSE oF Ict, 33%
EFFIcIEncy oF cuStomS AdmInIStrAtIon, 33%
rEGuLAtory EnvIronmEnt, 50%
EFFIcIEncy oF ImPort-ExPort ProcEdurES, 33%
PHySIcAL SEcurIty, 50%
trAnSPArEncy oF bordEr AdmInIStrAtIon, 33%

59
trAvEL And tourISm comPEtItIvEnESS IndEx
WorLd EconomIc Forum
t&t rEGuLAtory FrAmEWorK, 33%
PoLIcy ruLES And rEGuLAtIonS, 20%
EnvIronmEntAL SuStAInAbILIty, 20%
HEALtH And HyGIEnE, 20%
SAFEty And SEcurIty, 20%
PrIorItIzAtIon oF trAvEL & tourISm, 20%
t&t buSInESS EnvIronmEnt And InFrAStructurE, 33%
AIr trAnSPort InFrAStructurE, 20%
Ground trAnSPort InFrAStructurE, 20%
Ict InFrAStructurE, 20%
tourISm InFrAStructurE, 20%
PrIcE comPEtItIvEnESS In t&t InduStry, 20%
t&t HumAn, cuLturAL, And nAturAL rESourcES, 33%
HumAn rESourcES, 25%
nAturAL rESourcES, 25%
AFFInIty For trAvEL & tourISm, 25%
cuLturAL rESourcES, 25%
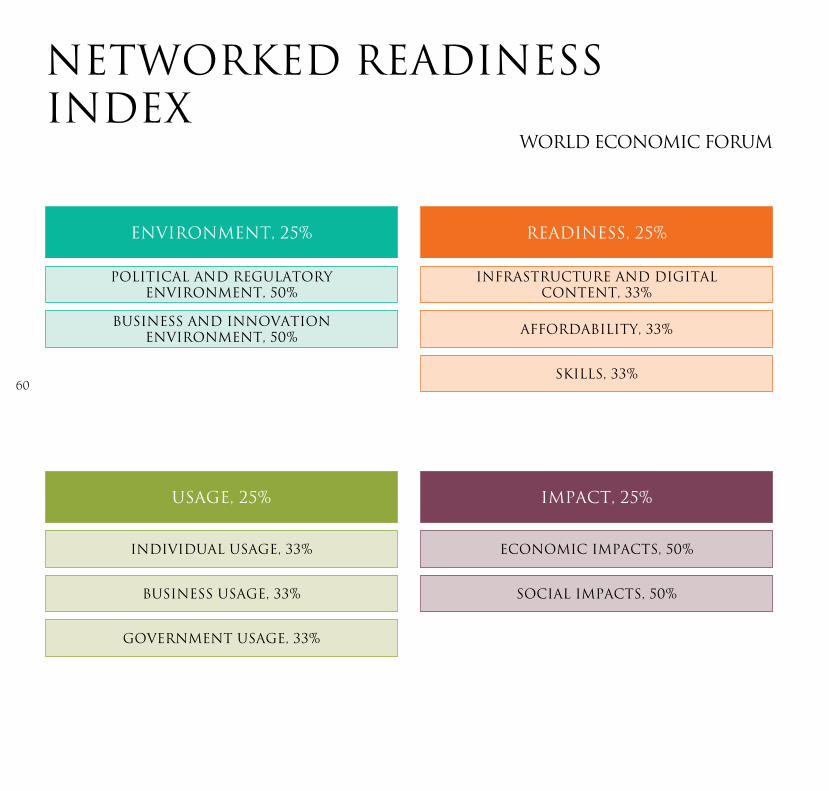
60
nEtWorKEd rEAdInESS IndEx
WorLd EconomIc Forum
EnvIronmEnt, 25%
PoLItIcAL And rEGuLAtory EnvIronmEnt, 50%
buSInESS And InnovAtIon EnvIronmEnt, 50%
ImPAct, 25%
EconomIc ImPActS, 50%
SocIAL ImPActS, 50%
rEAdInESS, 25%
InFrAStructurE And dIGItAL contEnt, 33%
AFFordAbILIty, 33%
SKILLS, 33%
uSAGE, 25%
IndIvIduAL uSAGE, 33%
buSInESS uSAGE, 33%
GovErnmEnt uSAGE, 33%

CONTENTS
Introduction ...........................................................................1
Ukraine in 2012 .....................................................................2
I. GEnERAl IndIcES ............................................................7
Global competitiveness Index ................................................8
The World competitiveness Yearbook Ranking ....................14
Ease of doing Business Index ...............................................19
Index of Economic Freedom .................................................24
ІІ. SPEcIAlIzEd IndIcES ..................................................29
Enabling Trade Index............................................................30
Travel and Tourism competitiveness Index ...........................36
networked Readiness Index .................................................42
ІІІ. SPEcIAl VIEW ..............................................................47
SEdA – Sustainable Economic development Assessment .....48
IV. APPEndIcES ..................................................................53
Graphic Representation of Indices’ Methodology ..................54
list of Abbreviations .............................................................61
61
LiST Of abbrEviaTiONS
iNdiCESGcI Global competitiveness Index lPI logistics Performance Index nRI networked Readiness IndexSEdA Sustainable Economic development Assessment TTcI Travel and Tourism competitiveness Index WcY World competitiveness Yearbook
OrgaNizaTiONS & aSSOCiaTiONS BcG Boston consulting Group cIS commonwealth of Independent States EU European Union IATA International Air Transport AssociationIlO International labour Organization IMd Institute for Management development OEcd Organisation for Economic co-operation and
development Un United nations UncTAd United nations conference on Trade and
developmentUnEScO United nations Educational, Scientific and
cultural Organization UnWTO United nations World Tourism Organization VISA Visa International Service AssociationWB World Bank Wcc World competitiveness center WEF World Economic Forum WTO World Trade Organization WTTc World Travel and Tourism council
TErmSASA Air service agreementATM Automated teller machineFdI Foreign direct investmentsGdP Gross domestic product GnP Gross national product IcT Information and communication technologies T&T Travel and tourism sector2G / 3G Second- / Third generation wireless telephone
technology

The Foundation established in 2007 to develop and implement projects and programs focused on the long-term development of the Ukrainian economy and to further public debate on the most important economic challenges facing Ukraine. FEG is a nonprofit, independent organization serving the interests of Ukrainian citizens.
FEG’s initiatives are focused on practical results; therefore, it actively cooperates with the government at all levels during the development and realization of its projects and programs.
One of FEG’s fundamental principles is to engage top international experts. Each project is carried out in partnership with leading international organizations that have extensive expertise in solving similar challenges. International experts in close cooperation with Ukrainian specialists directly interact with the appropriate State authorities to take into account the best world practice as well as the features of the Ukrainian economy. After the programmes are approved, the Foundation assists the authorities in implementing the reforms.
The Foundation for Effective Governance is Mr. Rinat Akhmetov’s private initiative; it is his personal contribution to the economic development of Ukraine and the facilitation of systematic dialogue among experts, government, business, civil society organizations, and mass media.The Foundation’s Founder provides financial support, leaving the full independence of actions and decisions to the Foundation, within the framework of the existing mission.
FEG official web-site: www.feg.org.ua
Ukraine’s competitiveness portal: www.competitiveukraine.org
Public debates web-site: www.debaty.org