department of education (doe) request for public input on budget 2007 copyright © 2007 hawaii state...
TRANSCRIPT

Department of Education (DOE)Request for Public Input on Budget
2007
Copyright © 2007 Hawaii State Department of Education

2
Focus on Students:One - Six - Three
• One Vision
• Six General Learner Outcomes
• Three Student Priorities

3
Vision of the Public School Graduate
• Realize their goals and aspirations• Have attitudes, knowledge and skills to
contribute positively to and compete in a global society
• Exercise the rights and responsibilities of citizenship
• Pursue post-secondary education or careers without need for remediation
All public school graduates will:
2005-2008 DOE Strategic Plan, page 1Copyright © 2007 Hawaii State Department of Education

4
General Learner Outcomes• Responsible for one’s own learning• Work well with others• Engage in complex thinking and problem
solving• Recognize quality performance and produce
quality products• Communicate effectively• Use a variety of technologies effectively and
ethically
2005-2008 DOE Strategic Plan, page 1Copyright © 2007 Hawaii State Department of Education
5
Student Priorities Act 238 (2000)/Act 51 (2004)
• Achievement
• Civic Responsibility
• Safety and Well-being
Copyright © 2007 Hawaii State Department of Education

6
Number of Public Schools 2006-07
Total 284
Elementary * 180
Middle/Intermediate * 42
High * 33
Charter 27
Special 2
Complex Areas 15
* Each summarized level includes multi-level schools where the lowest grade is represented.
Copyright © 2007 Hawaii State Department of Education

7
OfficialStudent Enrollment Count
2006-07General Charter Total %
Total 173,556 5,678 179,234 100%
General Education
K-6 grades 86,173 3,109 89,282 50%
7-8 grades 22,776 1,010 23,786 13%
9-12 grades 45,996 1,140 47,136 26%
Special Education
K-6 grades 7,901 200 8,101 5%
7-8 grades 3,154 112 3,266 2%
9-12 grades 7,556 107 7,663 4%
Fall 2006
8
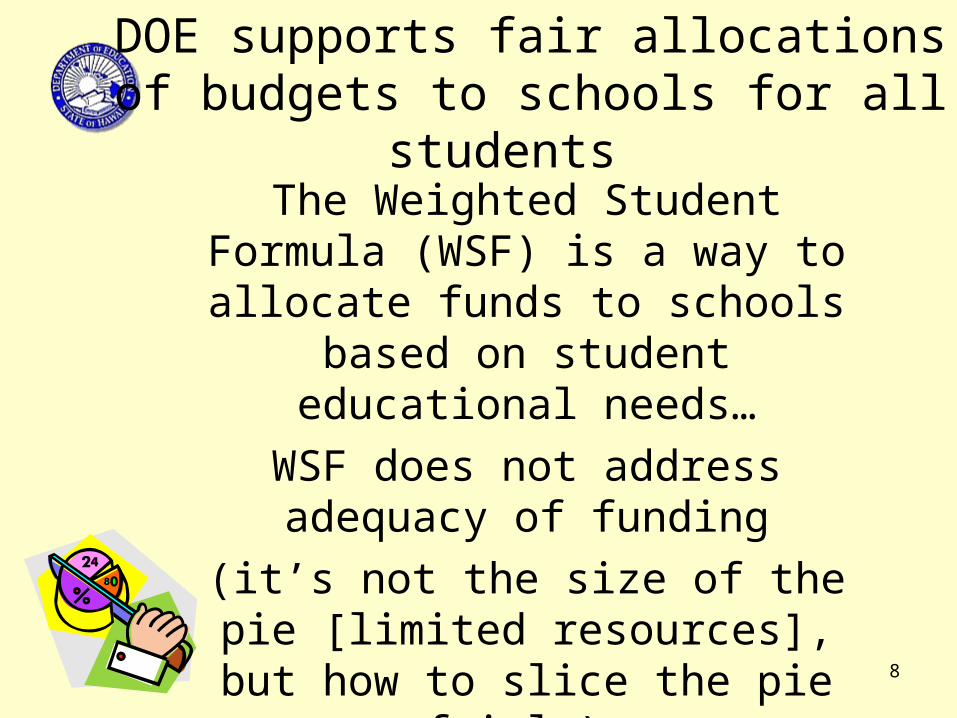
DOE supports fair allocations of budgets to schools for all students
The Weighted Student Formula (WSF) is a way to allocate funds to
schools based on student educational needs…
WSF does not address adequacy of funding
(it’s not the size of the pie [limited resources], but how to slice the pie
fairly).

9
What do we mean by Fair?
1. Schools with similar students should get a similar amount of funds.
2. Schools with students who have a harder time becoming proficient should get more funds to support their efforts.
10
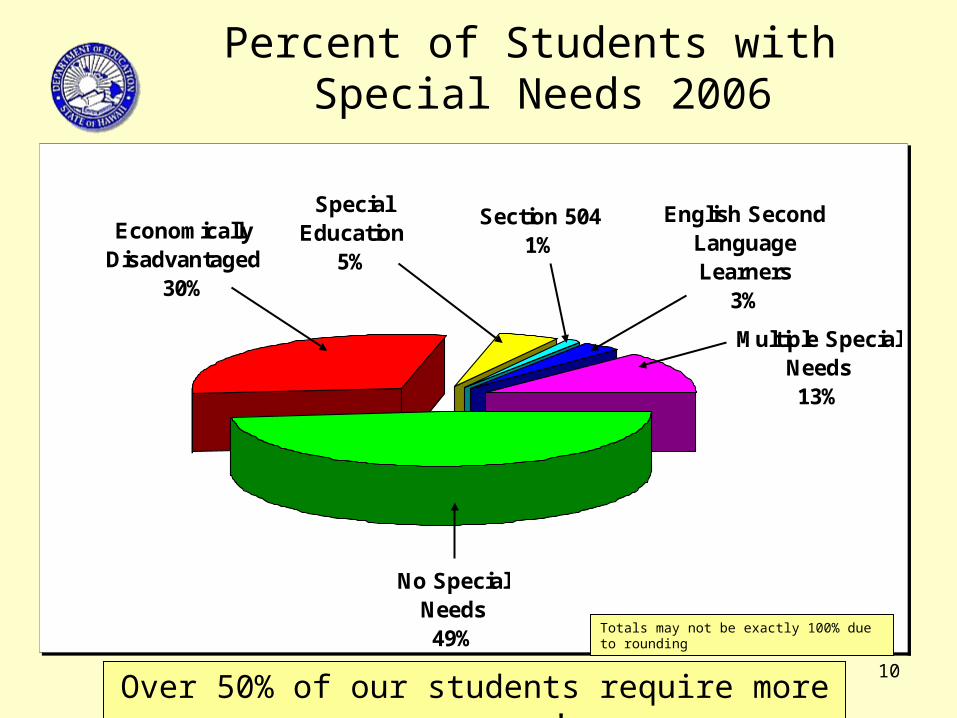
Percent of Students with Special Needs 2006
Special Education
5%
Section 5041%
Multiple Special Needs13%
Economically Disadvantaged
30%
No Special Needs49%
English Second Language Learners
3%
Totals may not be exactly 100% due to rounding
Over 50% of our students require more resources!

11
Hawaii State Assessment Data for Reading
Reading - Percent Proficient
58%58%58%
72%72%
86%
100%
30%30%30%44% 44%44%
48% 47%45%
41%42%
0%
20%
40%
60%
80%
100%
120%
School Year
Plan
Actual
Copyright © 2007 Hawaii State Department of Education
12
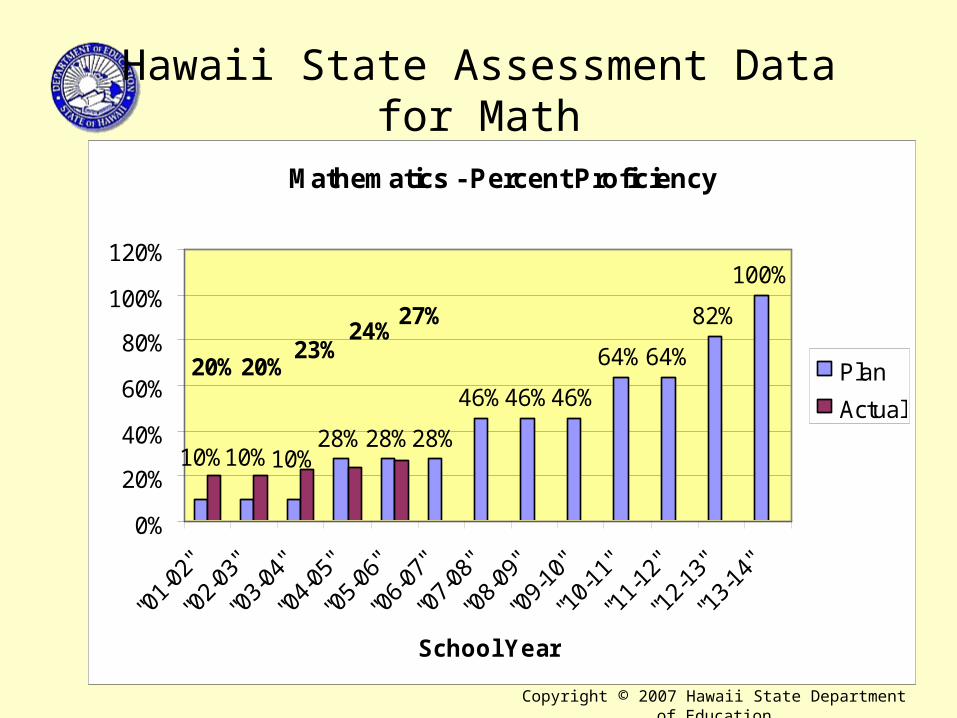
Hawaii State Assessment Data for Math
Mathematics - Percent Proficiency
28%28%28%
46%46%46%
64%64%
82%
100%
10%10%10%
20%20%23%
24%27%
0%
20%
40%
60%
80%
100%
120%
School Year
Plan
Actual
Copyright © 2007 Hawaii State Department of Education

What is the current DOE Budget?

14
DOE Operating BudgetFY2006-07 per Act 51/SLH 2004
(excludes Debt Service)
73% Spent by Principals 23% State level Central
Services 2% Instructional Support
2% State/Complex Area AdministrationCopyright © 2007 Hawaii State Department of Education

15
DOE Operating BudgetFY2006-07 per Act 51/SLH 2004
(excludes Debt Service)
Weighted Student Formula
$0.47
Special Education
$0.13
Categorical General/ Fed Fund Programs
$0.12
Centralized SPED &
Related Svcs $0.11
Food Service, Student Transportation, Utilities, Work-order R & M $0.10
Adult Education &
A+ $0.02
Instructional Support
$0.02
State & Complex
Area $0.02
$0.73 Expended
by Principals
Special & Trust Funds
$0.01
$0.23 Centrally Expended
for Schools
Copyright © 2007 Hawaii State Department of Education
16
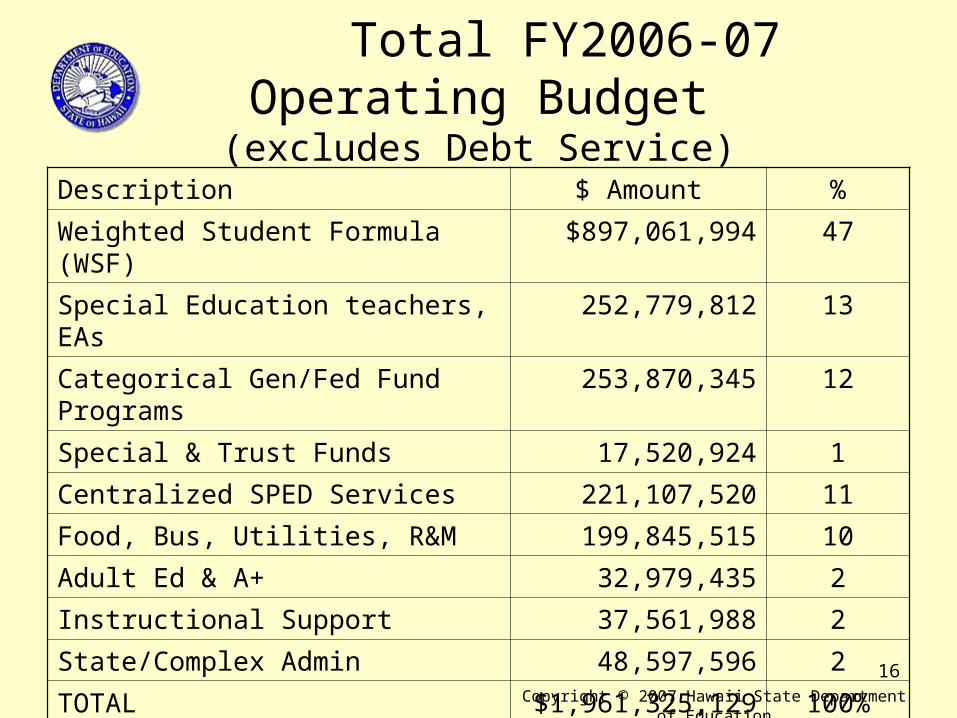
Total FY2006-07 Operating Budget(excludes Debt Service)
Description $ Amount %
Weighted Student Formula (WSF) $897,061,994 47
Special Education teachers, EAs 252,779,812 13
Categorical Gen/Fed Fund Programs 253,870,345 12
Special & Trust Funds 17,520,924 1
Centralized SPED Services 221,107,520 11
Food, Bus, Utilities, R&M 199,845,515 10
Adult Ed & A+ 32,979,435 2
Instructional Support 37,561,988 2
State/Complex Admin 48,597,596 2
TOTAL $1,961,325,129 100%
Copyright © 2007 Hawaii State Department of Education
17
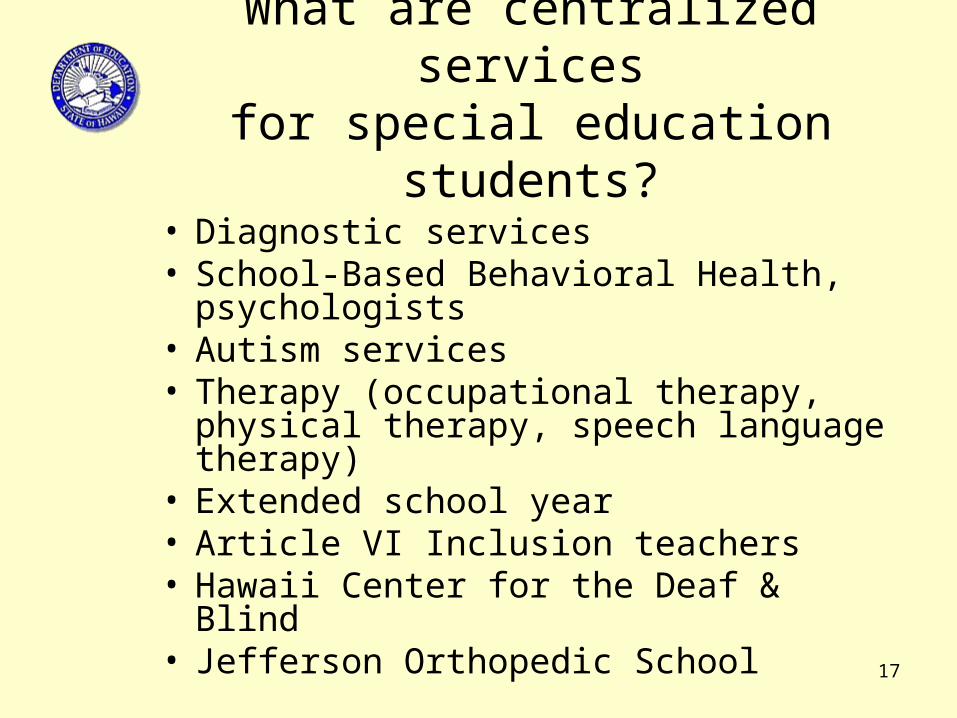
What are centralized servicesfor special education students?
• Diagnostic services• School-Based Behavioral Health,
psychologists• Autism services• Therapy (occupational therapy, physical
therapy, speech language therapy)• Extended school year• Article VI Inclusion teachers• Hawaii Center for the Deaf & Blind• Jefferson Orthopedic School

18
What are centralized servicesfor special education students?
• Transition Services• Therapeutic placements• Instruction for pregnant adolescents• Home/hospital instruction• Special Olympics• Section 504 compliance - barrier
removal• Complaints Management

19
DOE Centralized Services
– Paying electricity bills and other utilities– Network infrastructure support/development– School food services– Student transportation– Diagnostic services for SPED services qualification – Personnel hiring, recruitment, and recordkeeping– Workers compensation – Unemployment benefits administration– Financial accounting and reporting– IT development, implementation, operations– Litigation support
• Autism, school based behavioral health, etc.• Special education provision and recordkeeping
Copyright © 2007 Hawaii State Department of Education
20
DOE Statewide Responsibilities
– Strategic Planning– Student Achievement Standards Development– Budget Consolidation– Teacher Certification– Hawaii State Assessments– Policy Development– Internal Audit– Compliance with US DOE and State Regulations– Federal Reporting Requirements– Inter-governmental relationship management
Copyright © 2007 Hawaii State Department of Education

21
Over the past years, the DOE Budget has increased primarily due to the following:
• The pass-through of employee fringe benefits and debt service
• Services to special needs students
• Transfers of programs from other state agencies
Copyright © 2007 Hawaii State Department of Education
22
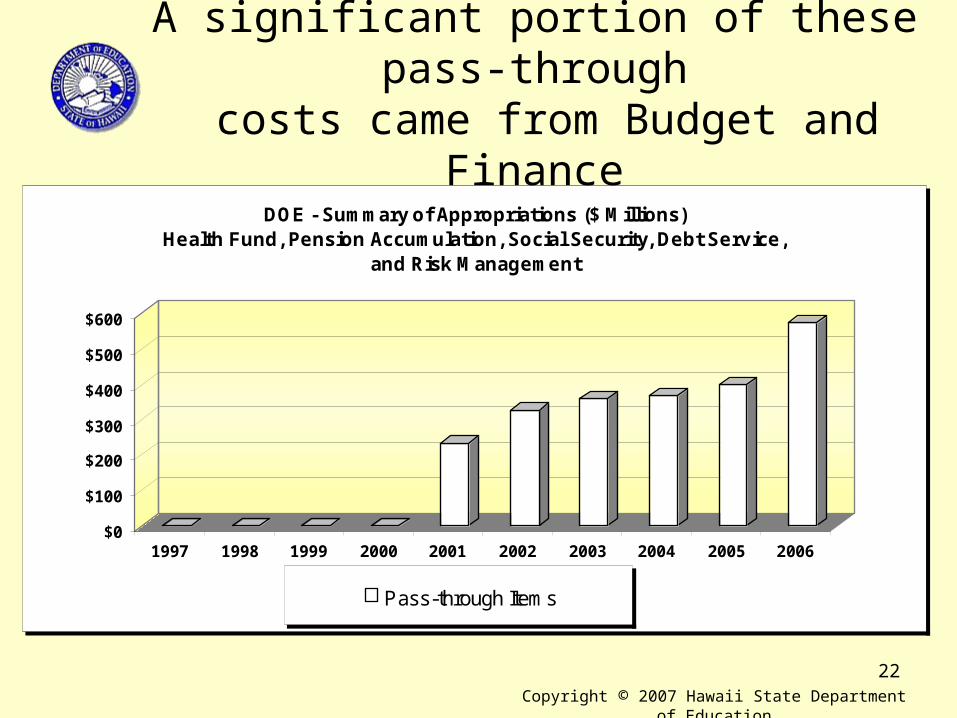
A significant portion of these pass-through costs came from Budget and Finance
$0
$100
$200
$300
$400
$500
$600
1997 1998 1999 2000 2001 2002 2003 2004 2005 2006
DOE - Summary of Appropriations ($ Millions)Health Fund, Pension Accumulation, Social Security, Debt Service,
and Risk Management
Pass-through Items
Copyright © 2007 Hawaii State Department of Education

23
Special Education also expanded in compliance with the Felix Consent Decree
$0
$50
$100
$150
$200
$250
$300
1997 1998 1999 2000 2001 2002 2003 2004 2005 2006
DOE - Summary of Appropriations ($ Millions)Special Education Services
Special Education Services
Copyright © 2007 Hawaii State Department of Education

24
Most recently, several programs were transferred to DOE from other state agencies
$0
$10
$20
$30
$40
$50
$60
1997 1998 1999 2000 2001 2002 2003 2004 2005 2006
DOE - Summary of Appropriations ($ Millions)Night Security, Student Transportation, Repair and Maintenance Projects,
Facilities Development and Maintenance
Other Programs Transferred to DOE
Copyright © 2007 Hawaii State Department of Education
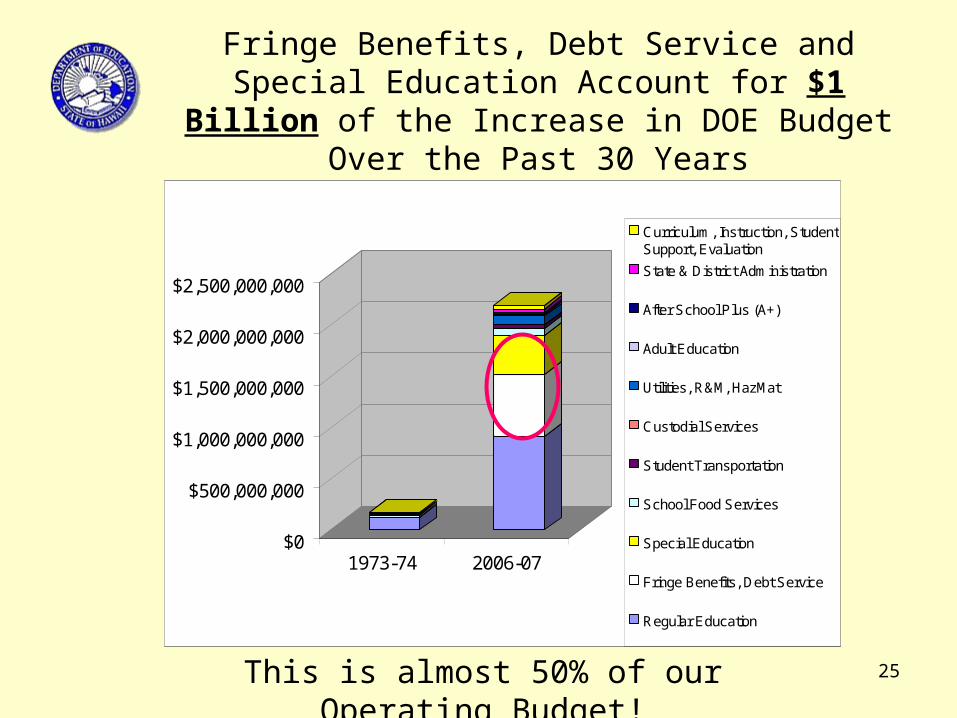
25
$0
$500,000,000
$1,000,000,000
$1,500,000,000
$2,000,000,000
$2,500,000,000
1973-74 2006-07
Curriculum, Instruction, StudentSupport, Evaluation
State & District Administration
After School Plus (A+)
Adult Education
Utilities, R&M, HazMat
Custodial Services
Student Transportation
School Food Services
Special Education
Fringe Benefits, Debt Service
Regular Education
Fringe Benefits, Debt Service and Special Education Account for $1 Billion of the Increase in
DOE Budget Over the Past 30 Years
This is almost 50% of our Operating Budget!

26
Two Types of Budgets
• Operating Budget
• Capital Improvement Program (CIP) Budget

Operating Budget Request Fiscal Biennium 2007-09
Copyright © 2007 Hawaii State Department of Education

28
Operating Budget Process
• Board of Education sets the final priorities
• Priorities are based on the Board’s and the Department’s Visions, Strategic Plan, public input, and such mandates as:– No Child Left Behind Act– Individuals with Disabilities Education Improvement
Act of 2004– Sustaining special education services– Reinventing Education Act of 2004 (Act 51/SLH 2004)
Copyright © 2007 Hawaii State Department of Education
29
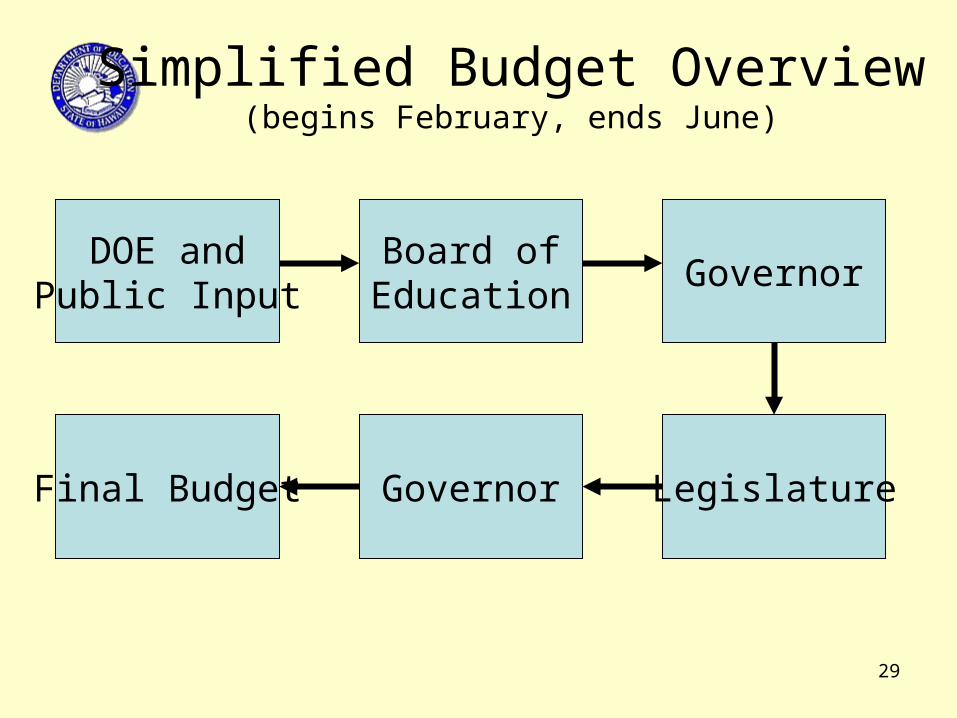
Simplified Budget Overview(begins February, ends June)
DOE andPublic Input
Board ofEducation
Governor
LegislatureFinal Budget Governor

30
Total DOE Operating Budget:
Governor’s and Board’s Request ($ millions)
Grand Total – BOE Request --- $ 2,386.1 $ 2,420.8
FY 06-07 FY 07-08 FY 08-09
General Funds $ 1,867.3 $ 1,980.0 $ 2,009.4
Special Funds 32.0 32.9 33.5
Federal Funds 256.0 262.2 261.8
Trust Funds 6.0 6.3 6.8
Interdept Transfer Funds 11.4 12.3 13.8
Revolving Funds 12.9 19.4 19.4
Subtotal – Current Budget $ 2,185.6 --- ---
Grand Total – Gov Request --- $ 2,313.1 $ 2,344.7

31
Board of Education General Fund Budget RequestCompared to Governor’s Budget
FY2007-08 (Excluding Fixed Costs)($ millions)
BOE-Approved Budget Requests BOE
Request
Governor’s
Budget Difference
Shortfalls $ 32.1 $ 18.7 $ 13.4
Weighted Student Formula 29.3 20.0 9.3
NCLB / Restructuring / School Redesign 12.3 8.7 3.6
Other Student Needs 1.6 0.9 0.7
Infrastructure / Technology 10.4 1.2 9.2
Equipment / Facilities 3.9 2.4 1.5
Enrollment 4.0 (0.2) 4.2
Risk Management 1.2 1.2 ---
Recurring Items in Act 160/06 21.0 ---
21.0
Continuation of Specific Appropriations 3.9 1.0 2.9
Transfers 5.7 (0.2) 5.9
Total $ 125.4 $ 53.7 $ 71.7
32
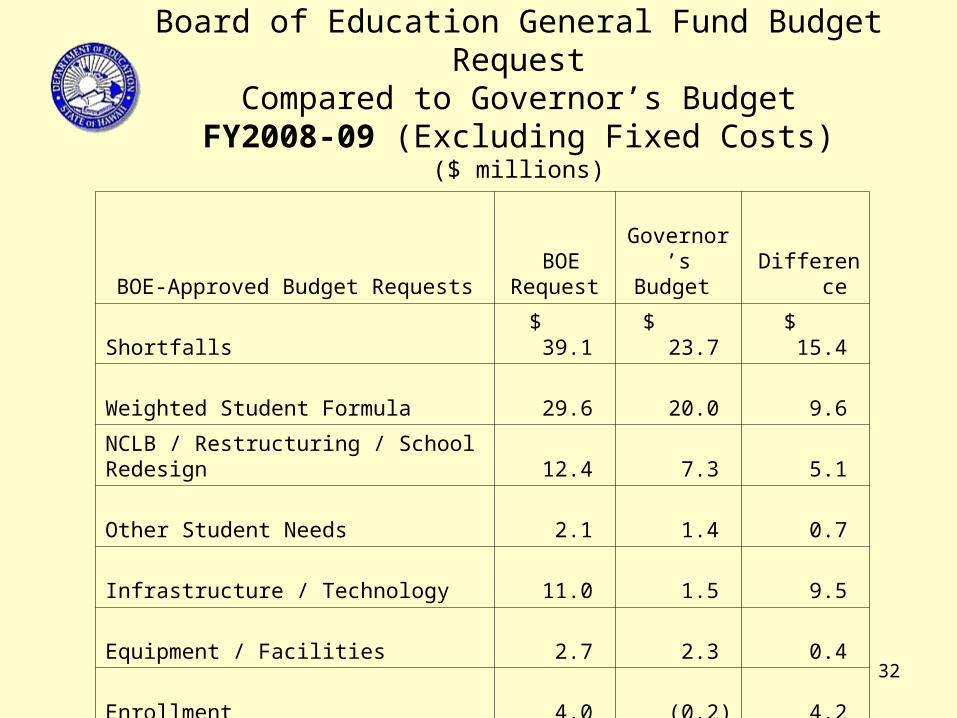
Board of Education General Fund Budget RequestCompared to Governor’s Budget
FY2008-09 (Excluding Fixed Costs)($ millions)
BOE-Approved Budget Requests BOE
Request
Governor’s
Budget Difference
Shortfalls $ 39.1 $ 23.7 $ 15.4
Weighted Student Formula 29.6 20.0 9.6
NCLB / Restructuring / School Redesign 12.4 7.3 5.1
Other Student Needs 2.1 1.4 0.7
Infrastructure / Technology 11.0 1.5 9.5
Equipment / Facilities 2.7 2.3 0.4
Enrollment 4.0 (0.2) 4.2
Risk Management 1.2 1.2 ---
Recurring Items in Act 160/06 21.0 ---
21.0
Continuation of Specific Appropriations 3.9 1.0 2.9
Transfers 5.7 (0.2) 5.9
Total $ 132.7 $ 58.0 $ 74.7

Capital Improvement Program (CIP) Budget Request
Fiscal Biennium 2007-09

34
School Building Improvements (Major R&M) – Total Backlog
$0
$100
$200
$300
$400
$500
$600
$700
$800
Jan.2001
Aug.2001
Mar.2002
Dec.2003
Apr.2004
Sep.2004
Sep.2005
Sep.2006
($M
illi
on
s)
Delink w/ DAGS
35
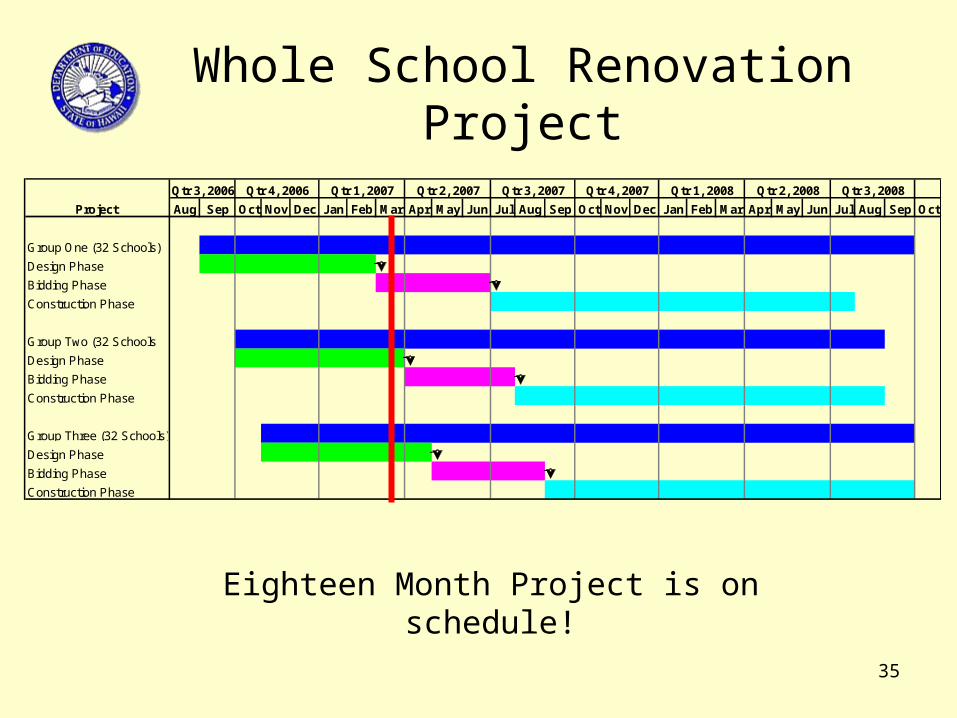
Whole School Renovation Project
Aug Sep Oct Nov Dec Jan Feb Mar Apr May Jun Jul Aug Sep Oct Nov Dec Jan Feb Mar Apr May Jun Jul Aug Sep Oct
Group One (32 Schools)
Design Phase
Bidding Phase
Construction Phase
Group Two (32 Schools
Design Phase
Bidding Phase
Construction Phase
Group Three (32 Schools)
Design Phase
Bidding Phase
Construction Phase
Qtr 3, 2008
Project
Qtr 3, 2007 Qtr 4, 2007 Qtr 1, 2008 Qtr 2, 2008Qtr 3, 2006 Qtr 4, 2006 Qtr 1, 2007 Qtr 2, 2007
Eighteen Month Project is on schedule!

36
Capital Improvement Program (CIP) Process of Obtaining Input
• Input gathered from many sources:
–School level personnel
–DOE administrators
–Community organizations (Neighborhood boards, PTSA, etc.)
–Enrollment projections
–Classroom capacity data

37
Capital Improvement Program (CIP) Prioritization Matrix
• Classroom space is becoming a critical factor in supporting growing communities as well as an influx of special education and behavioral health professionals at the school level.
• Prioritization Process
Health and SafetyHealth and Safety
Classroom CapacityClassroom Capacity
Support Facility ProjectsSupport Facility Projects
State / District ImprovementsState / District Improvements
Program NeedsProgram Needs

38
Capital Improvement Program (CIP)FY2007-08 Budget Request
Highlights*
Project Description FY 2007-08 Amount Ewa Makai Middle School
$67.7 million
Wailuku II Elementary School
$43.0 million
Electrical Upgrades (92 schools statewide)
$75.0 million
School Building Improvements (R&M)
$75.0 million
Other** $137.0 million Total CIP FY 2008 $397.7 million
* Board approved 34 projects (14 line item plus 20 lump sum areas), totaling $397.7 million.
**Other projects include projects such as ADA improvements, asbestos and lead removal, noise/heat abatement, telecommunications, and new facilities at existing schools.

39
Board of Education Request Compared to Governor’s Request
Capital Improvement Program (CIP)FY2007-08
($ millions)
BOE Request
Governor’s Budget
Difference
CIP Project Funding $397.7 $145.2 $252.5 Number of Line Items 34 15 19

40
Board of Education RequestCompared to Executive Request
Capital Improvement Program (CIP)FY2008-09
($ millions)
BOE Request
FY 2008-09 Executive
Budget Difference
CIP Project Funding $400.8 $154.9 $245.9 Number of Line Items 34 13 21

41
Request for Public Input forFY2008-09 Budget Process
• Operating Budget
• Capital Improvement Program (CIP)

42
Public Input Will Be Considered
• Board of Education must weigh priorities statewide
• Consideration will be given to the items raised at Community Meetings or through other communications
43
What do you think are theTop Five areas of highest need?
• Early Education
(Pre-school Readiness to Learn)
• Reading/Comprehension
• Math Skills/Application
• Job/Career Preparation
• Smaller Class Size
• Teachers
• Textbooks for All Classes

44
• Computers for All Students/Teachers• Classroom Supplies• School Safety• Classroom Environment• Restroom Environment• Buildings and Campus Well-maintained
and Functional• Other Needs
What do you think are theTop Five areas of highest need?

45
What’s Paid With WSF?
• General instruction services, including instruction for students who are gifted and talented, and/or who speak English as a second language, such as classroom instruction, classroom supplies, textbooks, computers, software, and functions formerly called “IRA, PINS, CORE”
• School-level management and supervision• School administrative and clerical
functions, office equipment, office supplies, telephone bills
(continued on the next page)
46
What’s Paid With WSF? (continued)
• Instructional support functions such as library services and library books
• Student body activities such as coordination services, organization membership, intramurals, student exhibits and fairs
• Services that enhance parent involvement and reflect the specific needs of students and their families
(continued on the next page)

47
What’s Paid With WSF? (continued)
• Student support such as coordination of student services, transition for students entering kindergarten, and transition for students with disabilities exiting high school
• Cleaning and maintenance of school buildings and grounds, minor repairs, supplies
• Safety and security functions on school campuses

48
What is in Categorical General Fund Programs?
• Vocational Education• Athletics• At-Risk Programs (ALCs)• Student conference, state student council• Athletics (ADs, coaches, medics, trainers,
supplies, transportation)• Learning Centers• JROTC• Hawaiian Language Immersion Program• Hawaiian Studies(continued on the next page)

49
What is in Categorical General Fund Programs?
(continued)
• Environmental Education (Keakealani, Kokee)• Space Education (Challenger Center, teacher for
Onizuka Memorial Space Museum)• Equipment/texts/furniture for new schools and
new classroom buildings, school libraries• Night security• Substitute clerks, security attendants, custodians
(continued on next page)

50
What is in Categorical General Fund Programs?
(continued)
• School Assessment Liaisons (SALs)• Administrative Services Assistants (ASAs)• In-school suspension• Workers Compensation• Unemployment Insurance• Standards resource development and
accountability reports, data, analysis• Private agency projects (e.g. Read-to-Me, Frank
Delima, Pacific and Asian Affairs Council, others)

51
What is in Categorical Federal Fund Programs?
• Substitute teachers• Vocational Education• Driver safety• Coordinated school health program• Advanced Placement Fee Payment• NCLB Titles I, II, III, IV, V, VI• Learn & Serve America• Education of Native Hawaiians

52
Want More Information on Your School’s Budget?
• mySchool link on DOE website:
http://doe.k12.hi.us/myschool/index.htm

53
Contact Information for Public Input to the Budget
Phone: 586-9307 (voice mail)
Fax: 586-3362
E-mail: [email protected]
Website: http://doe.k12.hi.us/surveys/budgetpriorities.htm
Last Day of Public Input for FY2008-09 Budget: May 31, 2007

54
Mailing Address for Public Input to the Budget
Address: Attn: Public Input to the Budget
Department of Education
Budget Office
P.O. Box 2360
Honolulu, Hawaii 96804
Last Day of Public Input for FY2008-09 Budget: May 31, 2007

55
Questions? Mahalo!