department of economics - india environment portal industry 2008.pdf · 2 department of economics...
TRANSCRIPT
DEPARTMENT OF ECONOMICS
PERFORMANCE OF INDIAN CEMENT INDUSTRY:
THE COMPETITIVE LANDSCAPE
By
L. G. Burange
Shruti Yamini
WORKING PAPER UDE(CAS)25/(9)/3/2008
APRIL 2008
2
DEPARTMENT OF ECONOMICS UNIVERSITY OF MUMBAI
Vidyanagari, Mumbai 400 098
Documentation Sheet
Title:
PERFORMANCE OF INDIAN CEMENT INDUSTRY:
THE COMPETITIVE LANDSCAPE
Author(s):
L. G. Burange
Shruti Yamini
External Participation: -----
WP. No.: UDE(CAS)25/(9)/3/2008
Date of Issue: April 2008
Contents: 41 P, 12 T, 8 F, 28 R.
No. of Copies: 100
Abstract
The cement industry is experiencing a boom on account of the overall growth
of the Indian economy primarily because of increased industrial activity, flourishing
real estate business, growing construction activity, and expanding investment in the
infrastructure sector. The performance of the industry, under different policy regimes,
truly establishes that decontrol of the industry and liberalization of the economy has
led to remarkable improvement in the indicators such as installed capacity, capacity
utilization, per capita consumption and exports. The industry experienced a complete
shift in the technology of production, from wet process to dry process.
The competitiveness among the firms in Indian cement industry has also been
evaluated. For the year 2006-07, out of the sample of seventeen firms (90.21% of the
total market share), about 47% have recorded above industry average performance in
the overall competitiveness index. The marginal difference between the
competitiveness of different firms reveals the tough competition in the industry.
Key Words: Cement, History, Evolution, Decontrol, Performance, Competitiveness,
Financial- Non Financial, Regional Dynamics.
JEL Code(s): L61

3
PERFORMANCE OF INDIAN CEMENT INDUSTRY:
THE COMPETITIVE LANDSCAPE
L. G. Burange*
Shruti Yamini**
1. INTRODUCTION:
Cement is an essential component of infrastructure development and most
important input of construction industry, particularly in the government’s
infrastructure and housing programs, which are necessary for the country’s socio-
economic growth and development. It is also the second most consumed material on
the planet (WBCSD 2002). The Indian cement industry is the second largest producer
of cement in the world just behind China, but ahead of the United States and Japan. It
is consented to be a core sector accounting for approximately 1.3% of GDP and
employing over 0.14 million people. Also the industry is a significant contributor to
the revenue collected by both the central and state governments through excise and
sales taxes.
1.1. Structure of the Industry:
The characteristics of the Indian cement industry need to be discussed to
understand its structure better. Firstly, it is a combination of mini (more than 300
units) and large capacity cement plants, where majority of the production of cement
(94%) in the country is by large plants. The conventional method of cement
manufacturing used by large plants (Rotary Kiln) needs high capacity, huge deposits
of lime stone in its vicinity, high capital investment and long gestation period. Hence
mini cement plants based on Vertical Shaft Kiln technology, suiting the small deposits
of limestone are becoming popular. Also they create less environmental pollution.
Against the requirement of Rs. 3500 per tonne of capacity of large plants, capital costs
for mini-cement plants come to about Rs. 1,400 to Rs. 1,600 per tonne (ICRA 2006).
The viability of the location plays a major role in the economics of cement
manufacturing (Schumacher and Sathaye 1999). One of the other defining features of
the Indian cement industry is that the location of limestone reserves in select States
* Professor of International Economics
** Research Scholar
4
has resulted in it’s evolving in the form of clusters. The proximity of coal deposits
constitutes another important factor in cement manufacturing. Since cement is a high
bulk and low value commodity, competition is also localized because the cost of
transportation of cement to distant markets often results in the product being
uncompetitive in those markets. There are at present seven clusters, where Satna
(Madhya Pradesh) cluster is the leader in capacity as well as production (CMA 2007).
Others are Chandrapur (North Andhra Pradesh and Maharashtra), Gulbarga (North
Karnataka and East AP), Chanderia (South Rajasthan, Jawad and Neemuch in MP),
Bilaspur (Chattisgarh), Yerraguntla (South AP), and Nalgonda (Central AP).
Traditionally, cement has been a heavily taxed sector with both the central and
the state governments levying the taxes which amount to around 30% of the selling
price of cement or around 70% of the ex-factory price (excluding local transport and
dealer margins) (ICRA 2006). The major taxes/ levies comprise central excise duty;
sales tax levied by the respective state governments; royalty and cess on limestone
and coal; and, duties on power tariff. The excise duty rates on cement are on specific
basis, as against ad valorem rates on most products.
The cement industry is energy intensive and thus power costs form the most
critical cost component in cement manufacturing, of about 35% to total cost of
production. The issues here is the technology used (dry versus wet process), fuel
efficiency (efficient use of coal/lignite/any other material used for burning) and power
efficiency (power availability, use of alternative fuels, unit power consumption, cost
and availability of captive power). The scope for cost reduction through better energy
efficiency may now be limited for better performing companies since they have
already reached the best feasible levels. One more characteristic of the industry comes
from it being capital intensive. Since the capital intensity of a new cement project is
high, access to capital has become a significant entry barrier. The cost of a new
cement plant can be equivalent to about 3 years of revenue (WBCSD 2002).
Another distinguishing characteristic comes from it being cyclical in nature as
the market and consumption is closely linked to the economic and climatic cycles. In
India, cement production normally peaks in the month of March while it is at its
lowest in the month of August and September. The cyclical nature of this industry has

5
meant that only large players are able to withstand the downturn in demand due to
their economies of scale, operational efficiencies, centrally controlled distribution
systems and geographical diversification. Lastly, it is worth mentioning that cement
industry has a significant role in the climate change debate and issue of sustainable
development. The cement industry produces 5% of global man-made carbon dioxide,
a major gas contributing to climate change (WBCSD 2005). In short, the main
environmental challenges facing the cement manufacturing industry are (Environment
Agency 2005), releases to air of oxides of nitrogen, sulphur dioxide, particulates and
carbon dioxide, use of resources, especially primary raw materials and fossil fuel and
generation of waste.
1.2. Evolution of the Indian Cement Industry:
The story of the evolution of the Indian cement industry is rather long, where
it has seen many ups and downs, but finally has arrived in its maturity stage as it is
beginning to gather the benefits of its decontrol by the government in 1989-90.
1.2.1. Invention of Cement
Ever since civilizations first started to build, the world has sought a man made
bonding material that would bind stones into a solid, formed mass. During the
Paleolithic Age, men used to enjoy adequate shelter provided by nature. The Bronze
Age witnessed the use of building materials from a clay based mixture and air
hardening lime. The Egyptians advanced to the discovery of lime and gypsum mortar
as a binding agent for building such structures as the Pyramids. The Greeks made
further improvements and finally the Romans developed cement that produced
structures of remarkable durability (Cement Association of Canada 2006). The secret
of Roman success in making cement was traced to the mixing of slaked lime with
Pozzolana, a volcanic ash from Mount Vesuvius. This process produced cement
capable of hardening under water. During the Middle Ages this art was somehow lost.
In the 18th
century, big efforts started in Europe to understand why some limes
have hydraulic properties (Cimenterie Nationale 2007). John Smeaton often referred
to as ‘father of civil engineering’ in England concentrated his work in this field and

6
made the first modern concrete by adding pebbles as a coarse aggregate and mixing
powered brick into the cement in 1759. A number of discoveries followed. It was in
1817 that Louis Vicat conducted work on the hydraulic nature of the lime-volcanic
ash mixture. He was the first person to accurately determine the proportions of
limestone and silica required to make the mixture of cement. He published the results
of his research, but did not apply for a patent. Finally, in 1824 Joseph Aspdin patented
the basic process of slower-setting cement. He addressed this as ‘Portland cement’
due to the fact that in appearance and hardness, it resembled the upper Jurassic rock
found in the region of Portland, in southern England (Lafarge 2004).
1.2.2. The Beginning of Indian Cement Industry
The attempt to produce cement in India dates back to 1889 when a Calcutta
firm attempted to produce cement from Argillaceous (kankar). But the first organized
effort on mass scale to manufacture Portland cement commenced in Madras
(Washermanpet), in 1904, by South India Industries Limited (Cement Manufacturers
Association 1964; Gadhok 2000). The factory could not succeed hence it failed.
However, it was in 1914 that the first commissioned cement-manufacturing unit in
India was set up by India Cement Company Limited at Porbandar, Gujarat, with an
installed capacity of 10,000 tonnes and production of 1000 tonnes. Subsequently two
plants; one at Katni (M.P.) and another at Lakheri (Rajasthan) were set up. The First
World War gave positive stimulus to the infant industry. The following decades saw
increase in number of plants, installed capacity and production. This period can thus
be called the Nascent Stage of Indian cement industry.
The problem of supply outstripping demand was significant in early period of
the industry. Problem of disposal of cement was aggravated by the prejudice with
which indigenous cement was regarded. This was followed by a price war between
the producers where they resorted to cutting down of prices and selling at below
production cost. This situation forced many companies into liquidation.
It was then when the government of India intervened into the market and
referred the cement industry to the Tariff Board. The board recommended protection
by government and cooperation among existing cement units. All these events

7
resulted in formation of Indian Cement Manufacturers’ Association in 1925 whose
main function was to regulate prices in the industry. In 1927, Concrete Association of
India was formed whose two main objectives were to educate public about the use of
cement and to play an active role in popularizing Indian cement. The next step in the
direction of rescuing cement industry was the formation of Cement Marketing
Company of India Limited in 1930 to promote and control the sale and distribution of
cement at regulated prices.
After all these initiatives, the sales increased along with more plants. In 1936,
eleven companies, except Sone Valley Portland Cement Company Limited, merged to
form Associated Cement Company Limited (ACC). In 1937, Dalmiya Jain Group set
up five factories with installed capacity of 575000 tonnes and ACC added four more
plants. With all these expansions, price war again started off which resulted into a
significant decrease in prices. But in the post world war period, setting up of
Department of Planning and independence of the country provided fresh impetus to
the industry.
The price and distribution control system on cement, implemented in 1956,
aimed at ensuring fair prices to producers and consumers all over the country, thus
reducing regional imbalances, and at reaching self-sufficiency within a short time
period (Schumacher and Sathaye 1999). Although due to slow growth in capacity
expansion and rising cost in the industry, the government had to increase the fixed
price several times. However, these price increases as well as financial incentives to
enhance investment, showed little effect on the industry. In spite of the fact that
government exercised no control over the Indian cement industry all through the
Third Five Year Plan (1961-1967), growth was low due to inadequate retention price
and lack of adequate financial resources to the existing companies.
1.2.3. Control Period (1969-1982)
The Indian cement sector had been under strict government control for almost
the whole of the period. Government intervention took place both directly and
indirectly. Direct intervention happened in the form of government control over
production, capacity and distribution of cement, while indirect intervention took the

8
form of price control. During this period, many companies and their plants started off
but still growth was not seen at the desired rate. In 1977, higher prices were allowed
for cement produced by new plants or major expansions of existing plants. Due to
maintained slow development, the uniform price imposed by the government, was
substituted by a three-tier price system in 1979. Different prices were assigned to
cement produced in low, medium and high cost plants.
However, further increases of input costs could not be neutralized adequately.
Thus, controlled price did not reflect the true economic cost, and profit margins
reduced increasingly, preventing essential investments in capacity and production
expansion. A permit system introduced by 14 states and union territories in the period
comprised direct control over public distribution of cement to ensure fair supplies to
priority sectors. However, the system resulted in artificial shortages, extensive black
marketing and corruption in the civil supply departments of the government.
The system of price control was accompanied by a policy of freight pooling.
The price control fixed a uniform price according to estimated production costs at
which cement was required to be sold all over the country. This price contained a
freight component that was averaged over the country as a whole. This freight pooling
system promoted equal industrial development all over the country. It supported
regional dispersion. Yet, it also implied that producers had no incentive in locating
production such that transportation costs of cement would be minimized. Market
distance became a less important issue. As a result of non-optimal location of
industries, average costs of production as well as demand for scarce railway capacity
for transportation increased.
1.2.4. Partial Decontrol (1982-1989)
On account of the above-mentioned difficulties in the cement industry the
government of India introduced a system of partial decontrol in 1982. A levy quota of
66.60 % for sales to government and small house builders was imposed on existing
units while for new and sick units a lower quota at 50% was established. The balance
of 33.40% could be sold in the free open market to general consumers. A ceiling price
was set for sales in the open market in order to protect consumers from unreasonably

9
high pricing of cement. Under the system of partial decontrol, freight pooling no
longer covered non-levy cement. Furthermore, specific mini units were completely
freed from price and distribution controls. Although overall profitability increased
substantially immediately after the introduction of partial decontrol, profits obtained
through non-levy sales decreased with greater availability of cement in the market and
continuously rising input costs.
To sustain an accelerating course, the government subsequently introduced
changes in levy obligations and retention prices regularly. As a result, in 1988 the
levy quota was as low as 30% for units established before 1982 and the retention price
had increased substantially. In 1987, the Cement Manufacturers Association and the
government decided that there was no further necessity for a maximum price ceiling.
1.2.5. Total Decontrol (1989 onwards)
Finally in 1989, the cement industry was considered to be prepared for free
market competition, and all price and distribution controls on sale of cement were
withdrawn. The system of freight pooling was abandoned and a subsidy scheme to
ensure availability of cement at reasonable prices in remote and hilly regions of the
country was worked out. The industry was then de-licensed in July 1991 under the
policy of economic liberalization. By removing all controls on the cement sector the
government hoped to accelerate growth and induce further modernization and
expansion investments. It was after this decontrol that the Indian cement industry
moved towards globalization, with increasing emphasis on the exports. The expansion
of the industry was evident after the decontrol where capacity as well as production
increased many fold. Growth was seen from 91 plants and 43 million tonnes of
production in 1989-90 boosting to 132 plants and 161.66 million tonnes production in
2006-07 (CMA 2007). Total capacity utilization for the industry has also increased
from 78% to 91% during the same period. The evolution of the industry during
various Five Year Plans (at the end of plan) can be seen in the following Table 1.
Hence, the history of the Indian cement industry indicates the role of
government played in influencing the twists and turns in the industry. It might be
noted that government interventions have been a mix of fiscal instruments and direct

10
control on production, pricing and distribution on the one hand and technological
intervention through government promoted research institutions on the other hand.
Table 1: Growth of Indian Cement industry (at the end of the Five Year Plan)
(Including mini and white plants)
End Year of the Plan Capacity (M.t.) Production (M.t.) Capacity Utilization (%)
Pre- Plan Period (1950-51) 3.28 2.20 67
1st Plan (1955-56) 5.02 4.60 92
2nd Plan (1960-61) 9.30 7.97 86
3rd Plan (1965-66) 12.00 10.97 91
4th Plan (1973-74) 19.76 14.66 74
5th Plan (1978-79) 22.58 19.42 86
6th Plan (1984-85) 42.00 30.13 72
7th Plan (1989-90) 61.37 45.42 74
8th Plan (1996-97) 105.26 76.22 72
9th Plan (2001-02) 145.99 106.90 73
10th Plan (2006-07) 177.83 161.66 91
Source: CMA
Figure 1: Trends in Cement Industry during Five-Year Plans
The paper is organized such that after the introductory discussion on the
Indian cement industry, the second section deals with the performance of the industry
especially after its decontrol in 1989. Section three examines the increased
competitiveness of firms in the industry as a result of greater consolidations and
influx of foreign firms after favorable policy changes. This section is followed by
conclusion.
67
9286
91
74
86
72 74 72 73
91
0.00
20.00
40.00
60.00
80.00
100.00
120.00
140.00
160.00
180.00
Pre- Plan
Period(1950-51)
1st Plan
(1955-56)
2nd Plan
(1960-61)
3rd Plan
(1965-66)
4th Plan
(1973-74)
5th Plan
(1978-79)
6th Plan
(1984-85)
7th Plan
(1989-90)
8th Plan
(1996-97)
9th Plan
(2001-02)
10th Plan
(2006-07)
Capacity (M.t.) Production (M.t.) Capacity Utilisation (%)

11
2. PERFORMANCE OF THE INDUSTRY:
Price and distribution controls lifted on 1st March 1989 and licensing
abolished since 25th July 1991, gave fresh impetus to the key infrastructure industry.
However, the performance of the industry improved all the more after late 1990s
guiding it to newer heights. The process of improvement in key performance
indicators of the industry can be analyzed during changing policy regimes of the
government. All the indicators are grouped into primary and other indicators, which
clearly reflect the status of the industry in control and decontrol periods. For the
purpose the main data source is the Cement Manufacturers Association (CMA).
2.1. Primary Indicators:
In order to study the growth in main indicators, Annual Compound Growth
Rates (ACGR) is computed as per the semi-log method for 37 years from 1970-71 to
2006-07. The kinked exponential growth model (Boyce 1986) is also used to estimate
the growth rates for the two sub-periods i.e. 1970-71 to 1988-89 which reflect the
control period and 1989-90 to 2006-07 representing decontrol period.
2.1.1. Installed Capacity
The installed capacity of the Indian cement industry has continuously shown
an increase over the period. The industry started with 0.0010 million tonnes (m.t.) of
installed capacity in 1914 and reached 3.28 m.t. in 1950 and 9.30 m.t. in 1960. The
growth in the capacity has been traced from 1970 onwards when the industry fell in
the hands of government control. In the period between 1970-71 and 1988-89, the
installed capacity of the cement industry grew from 17.61 m.t. to 58.97 m.t. at the
ACGR of 7.47%. This remarkable growth in the capacities was due to producers’
expectation of growing markets. But due to various controls and lack of adequate
demand, the growth of the industry was not noticed on the desired rates. This resulted
in oversupply and low capacity utilizations. Following this, the period after total
decontrol till 2006-07, the capacity addition although increased at rates approximately
equal to previous period at 7.09% annually, it could hardly match the pace. This was
although good for capacity utilizations as production increased at greater rates. The
ACGR in the total period of 1970-71 to 2006-07 is calculated to be a decent 7.28%.
12
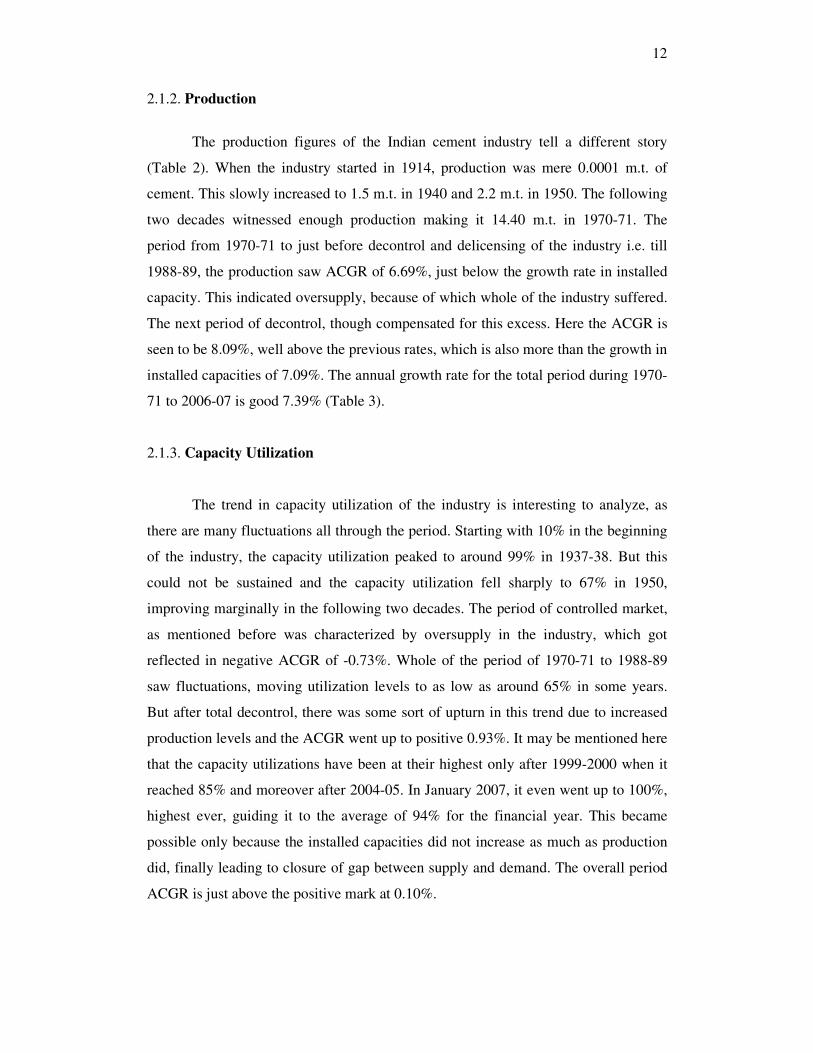
2.1.2. Production
The production figures of the Indian cement industry tell a different story
(Table 2). When the industry started in 1914, production was mere 0.0001 m.t. of
cement. This slowly increased to 1.5 m.t. in 1940 and 2.2 m.t. in 1950. The following
two decades witnessed enough production making it 14.40 m.t. in 1970-71. The
period from 1970-71 to just before decontrol and delicensing of the industry i.e. till
1988-89, the production saw ACGR of 6.69%, just below the growth rate in installed
capacity. This indicated oversupply, because of which whole of the industry suffered.
The next period of decontrol, though compensated for this excess. Here the ACGR is
seen to be 8.09%, well above the previous rates, which is also more than the growth in
installed capacities of 7.09%. The annual growth rate for the total period during 1970-
71 to 2006-07 is good 7.39% (Table 3).
2.1.3. Capacity Utilization
The trend in capacity utilization of the industry is interesting to analyze, as
there are many fluctuations all through the period. Starting with 10% in the beginning
of the industry, the capacity utilization peaked to around 99% in 1937-38. But this
could not be sustained and the capacity utilization fell sharply to 67% in 1950,
improving marginally in the following two decades. The period of controlled market,
as mentioned before was characterized by oversupply in the industry, which got
reflected in negative ACGR of -0.73%. Whole of the period of 1970-71 to 1988-89
saw fluctuations, moving utilization levels to as low as around 65% in some years.
But after total decontrol, there was some sort of upturn in this trend due to increased
production levels and the ACGR went up to positive 0.93%. It may be mentioned here
that the capacity utilizations have been at their highest only after 1999-2000 when it
reached 85% and moreover after 2004-05. In January 2007, it even went up to 100%,
highest ever, guiding it to the average of 94% for the financial year. This became
possible only because the installed capacities did not increase as much as production
did, finally leading to closure of gap between supply and demand. The overall period
ACGR is just above the positive mark at 0.10%.
13
2.1.4. Export
The export of Indian cement has increased over the years mostly after
decontrol, giving the much-required boost to the industry. The demand for cement is a
derived demand, for it depends on industrial activity, real estate, and construction
activity. Since growth is taking place all over the world in these sectors, Indian export
of cement is also increasing. India has an immense potential to tap cement markets of
countries in the Middle East and South East Asia due to its strengths of locational
advantage, large-scale limestone and coal deposits, adequate cement capacity and
production of world-class quality of cement with the latest technology.
Hence, the firms in the industry are capitalizing on the opportunities, provided
by the government accompanied by favorable economic conditions. This is evident by
the data, which shows negative ACGR of -5.52% in the control period because of
highly protected markets. The average export volume in the period was around only
1.7 lakh tonne (L.t.) of cement. As the industry was decontrolled and economy
opened up, cement exports started making rapid strides. The period has seen annual
compound exponential growth rate of 35.35%. In volume terms, the exports from
Indian cement industry increased from 1.43 L.t. in 1989-90 to 58.70 L.t. in 2006-07.
The overall ACGR for the period of 37 years however equalized a bit at 13.10%.
2.1.5. Per Capita Consumption
The per capita consumption of 136 kgs in the year 2006-07, compares poorly
with the world average of over 350 kgs and more than 660 kgs in China. Similarly in
Japan it is 631 kg/capita while in France it is 447 kg/capita. The process of catching
up with international averages emphasizes the tremendous scope for growth in the
Indian cement industry in the long term. Also, one of the reasons for strong interest
shown by the foreign players in India is due to its lower per capita consumption of
cement. The period of 1970-71 to 2006-07 has shown ACGR of 5.15%. When seen
under two sub periods of control and decontrol, it displays much higher growth rates
of 9.35% in the decontrol period, as compared to 1.11% in the period from 1970-71 to
1988-89. The cement consumption projections by National Council of Applied
Economic Research, on a conservative basis, have placed the cement demand of 225

14
million tonnes by the year 2010-11 (CARE 2007). And if the government goes ahead
with infrastructure projects in a big way as planned, the consumption is pegged to be
at much higher levels of 291 million tonnes. This will surely increase the current per
capita consumption of cement in India.
Table 2: Trend in Primary Performance Indicators of the Indian Cement Industry
Year Installed
Capacity (Million tonne)
Production (Million tonne)
Capacity
Utilization
(%)
Export (Lakh tonne)
Per Capita
Consumption
(Kg.)
1970-71 17.61 14.40 81.77 1.78 26
1971-72 19.56 15.10 77.20 2.66 28
1972-73 19.76 15.60 78.95 2.08 28
1973-74 19.76 14.70 74.39 2.05 26
1974-75 20.06 14.80 73.78 1.32 24
1975-76 21.16 17.30 81.76 3.36 26
1976-77 21.46 18.80 87.60 7.25 29
1977-78 21.91 19.40 88.54 8.27 29
1978-79 22.56 19.42 86.08 0.66 32
1979-80 24.29 17.60 72.46 0.50 30
1980-81 27.92 18.66 66.83 0.74 30
1981-82 29.26 21.10 72.11 0.26 32
1982-83 34.39 23.30 67.75 0.05 32
1983-84 37.04 27.00 72.89 0.06 36
1984-85 42.00 30.13 71.74 0.29 44
1985-86 44.39 33.13 74.63 0.47 39
1986-87 54.40 36.40 66.91 0.48 44
1987-88 57.47 39.37 68.51 0.00 47
1988-89 58.97 44.08 74.75 0.31 51
1989-90 61.55 45.41 73.78 1.43 54
1990-91 63.96 48.76 76.24 2.54 57
1991-92 66.56 53.61 80.54 2.88 63
1992-93 70.09 53.72 76.64 6.65 61
1993-94 76.88 57.96 75.39 19.87 62
1994-95 82.69 62.35 75.40 16.95 65
1995-96 97.25 69.57 71.54 15.70 72
1996-97 105.25 76.22 72.42 19.70 78
1997-98 109.30 83.16 76.08 26.80 82
1998-99 118.97 87.91 73.89 20.60 85
1999-00 119.10 100.45 84.34 19.50 97
2000-01 130.40 97.61 74.85 31.50 99
2001-02 146.13 108.40 74.18 33.80 97
2002-03 151.17 116.35 76.97 34.70 106
2003-04 157.48 123.50 78.42 33.63 110
2004-05 164.69 133.57 81.10 40.71 115
2005-06 160.24 141.81 88.50 60.07 125
2006-07 165.22 155.31 94.00 58.70 136
It can be seen from the above analysis that the performance of primary
indicators in the Indian cement industry has been very impressive during the years
(Table 2). The annual compound growth rates (ACGR) of the industry has been good

15
in the overall period, showing better performance in the decontrol period than in the
control period, which is evident from Table 3. The only exception to this being
installed capacity growth rate, which was slightly higher in the control period leading
to oversupply in the industry.
Table 3: ACGR of Primary Performance Indicators (%)
Indicators Total Period
(1970-71 to 2006-07) Control Period
(1970-71 to 1987-88) Decontrol Period
(1988-89 to 2006-07)
Installed Capacity 7.28 7.47 7.09
Production 7.39 6.69 8.09
Capacity Utilization 0.10 -0.73 0.93
Exports 13.10 -5.52 35.38
Per Capita Consumption 5.15 1.11 9.35
7.28 7.39
0.10
13.10
5.15
7.476.69
-5.52
1.11
7.098.09
0.93
35.38
9.35
-0.73
-10.00
-5.00
0.00
5.00
10.00
15.00
20.00
25.00
30.00
35.00
40.00
Installed Capacity Production Capacity Utilization Exports Per Capita Consumption
Total Period (1970-2007) Control Period (1970-1988) Decontrol Period (1989-2007)
Figure 2: Comparison of ACGR (%) in Primary Performance Indicators
2.2. Other Indicators:
Recent trends in some of the other performance indicators of the cement
industry are studied in the following section.
2.2.1. Technology
The Indian cement industry has undergone vital changes through technological
upgradation and assimilation of latest technology in the pursuit of cost efficiency and

16
the drive for consolidation. Modernisations at the plants and the improvement of plant
processes have also helped reduce manpower requirements (IBEF 2006). Cement
production is an energy-intensive process in which a combination of raw materials is
chemically altered through intense heat to form a compound with binding properties.
These can be ground as a dry mixture or combined with water to form slurry. The
addition of water at this stage has important implications for the production process
and for the energy demands during production. The three different cement-
manufacturing processes in the country are: (a) wet process, (b) semi-wet process, and
(c) dry process. The dry and semi-wet processes are more fuel-efficient. The wet
process requires 0.28 tonnes of coal and 110 kWh of power to manufacture one tonne
of cement, whereas the dry process requires only 0.18 tonnes of coal and 100 kWh of
power (IBEF 2006).
The proportion of cement capacity by the wet and semi-wet processes has
been decreasing over the past decades. In 1950-51, the major share of cement capacity
was from the wet process (97%); the semi-wet process contributed only 3%, with no
plants using dry process for production. Since then there is no looking back for the
technological upgradations, as today only 2% of capacity uses wet process. The
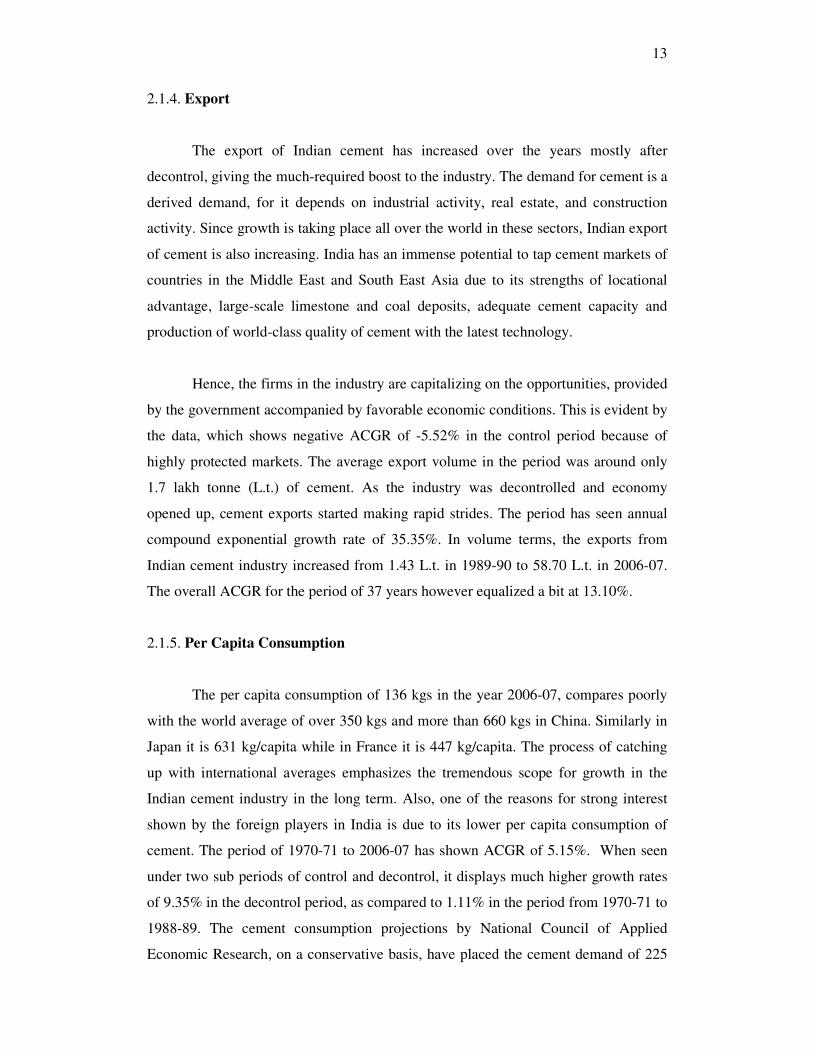
change in technology in Indian cement industry can be seen from figure 3.
Table 4: Process-wise Capacity in Indian Cement Industry (%)
Year Wet Process Dry Process Semi-Wet Process Total
1950-51 97 0 3 100
1960-60 94 1 5 100
1970-71 69 22 9 100
1980-81 61 33 6 100
1990-91 17 81 2 100
1991-92 16 82 2 100
1992-93 16 82 2 100
1993-94 12 86 2 100
1994-95 12 86 2 100
1995-96 11 87 2 100
1996-97 9 89 2 100
1997-98 7 91 2 100
1998-99 7 91 2 100
1999-00 5 93 2 100
2000-01 4 94 2 100
2001-02 4 94 2 100
2002-03 4 94 2 100
2003-04 3 95 2 100
2004-05 3 96 1 100
2005-06 3 96 1 100
2006-07 2 97 1 100
17
0%
10%
20%
30%
40%
50%
60%
70%
80%
90%
100%
1950-51 1960-60 1970-71 1980-81 1990-91 1991-92 1992-93 1993-94 1994-95 1995-96 1996-97 1997-98 1998-99 1999-00 2000-01 2001-02 2002-03 2003-04 2004-05 2005-06 2006-07
Wet Process Dry Process Semi-Wet Process
Figure 3: Process-wise Capacity in Indian Cement Industry
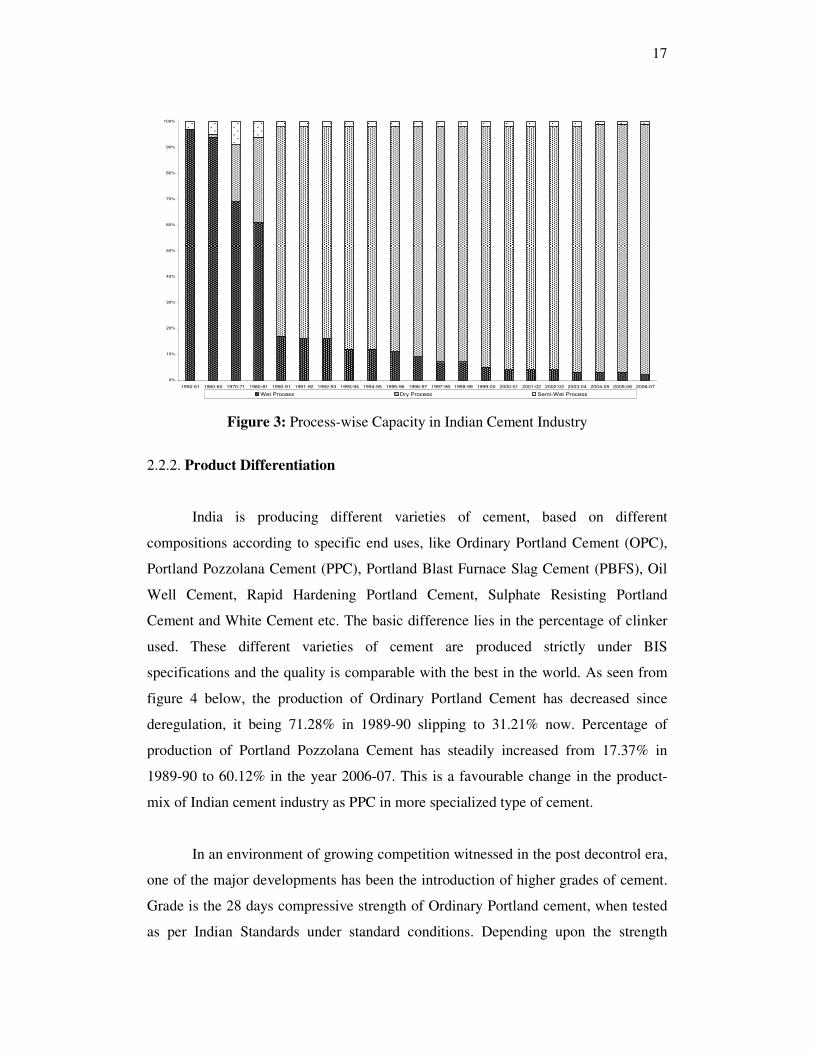
2.2.2. Product Differentiation
India is producing different varieties of cement, based on different
compositions according to specific end uses, like Ordinary Portland Cement (OPC),
Portland Pozzolana Cement (PPC), Portland Blast Furnace Slag Cement (PBFS), Oil
Well Cement, Rapid Hardening Portland Cement, Sulphate Resisting Portland
Cement and White Cement etc. The basic difference lies in the percentage of clinker
used. These different varieties of cement are produced strictly under BIS
specifications and the quality is comparable with the best in the world. As seen from
figure 4 below, the production of Ordinary Portland Cement has decreased since
deregulation, it being 71.28% in 1989-90 slipping to 31.21% now. Percentage of
production of Portland Pozzolana Cement has steadily increased from 17.37% in
1989-90 to 60.12% in the year 2006-07. This is a favourable change in the product-
mix of Indian cement industry as PPC in more specialized type of cement.
In an environment of growing competition witnessed in the post decontrol era,
one of the major developments has been the introduction of higher grades of cement.
Grade is the 28 days compressive strength of Ordinary Portland cement, when tested
as per Indian Standards under standard conditions. Depending upon the strength

18
requirement, OPC is thus classified as OPC-33 grade, OPC-43 grade and OPC-53
grade. However, realization is growing fast amongst the consumers at large, that the
properties of durability are of greater importance than strength.
Figure 4: Trend in Variety-wise Cement Production (%)
2.2.3. Concentration
Concentration in the Indian cement industry can be seen through following
two indicators.
2.2.3.1. Regional Concentration
Cement, being a bulk commodity, is freight intensive and transporting cement
over long distances can prove to be uneconomical. This has resulted in cement being
largely a regional play with the industry divided into five main regions, viz., North,
South, West, East and the Central region. Until 1999-2000, Indian was divided in only
four regions; centre came up only after that. Punjab, Rajasthan, Haryana and
Himachal Pradesh fall in northern region whereas Bihar, Jharkhand, Orrisa, West
Bengal and Chattisgarh are in eastern region. The west comprises of Gujrat and
Maharashta and the central region has Uttar Pradesh and MP, thus leaving AP, Tamil
Nadu, Kerala and Karnataka for southern region.
In terms of capacity historically, the southern region has always dominated the
industry and is excess in capacity owing to the availability of limestone, but the
0
10
20
30
40
50
60
70
80
1989-90
1990-91
1991-92
1992-93
1993-94
1994-95
1995-96
1996-97
1997-98
1998-99
1999-00
2000-01
2001-02
2002-03
2003-04
2004-05
2005-06
2006-07
OPC PPC PBFS OTHERS
19
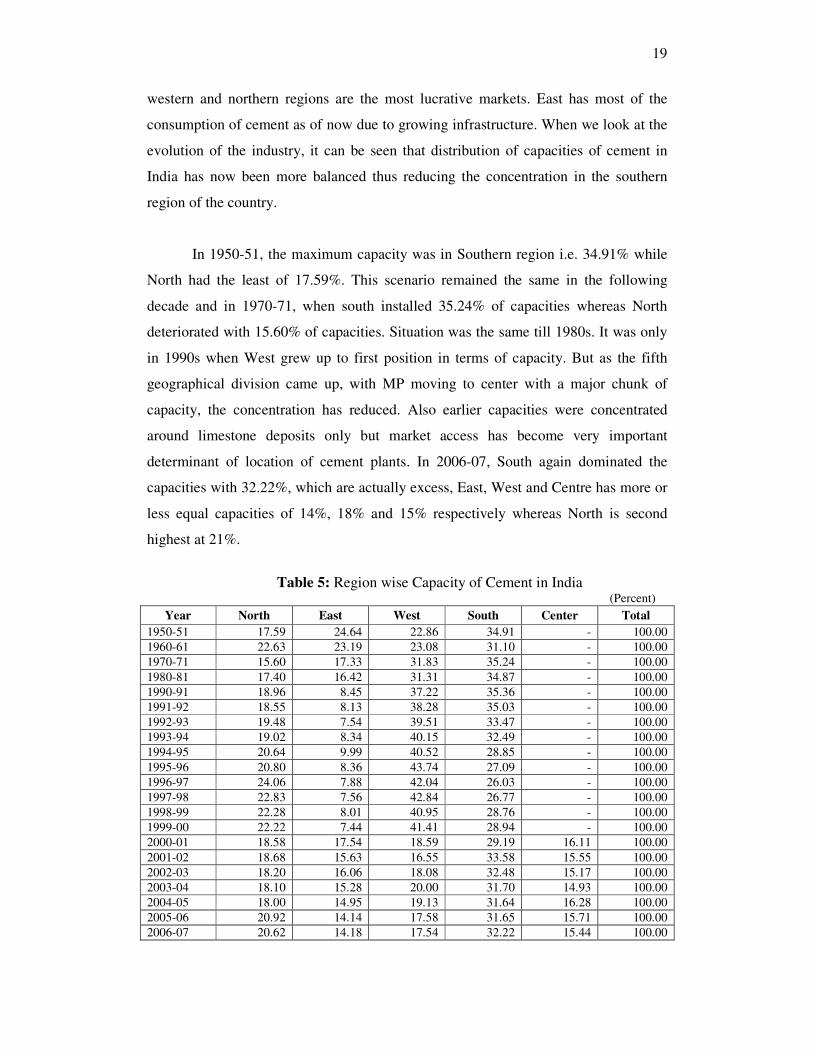
western and northern regions are the most lucrative markets. East has most of the
consumption of cement as of now due to growing infrastructure. When we look at the
evolution of the industry, it can be seen that distribution of capacities of cement in
India has now been more balanced thus reducing the concentration in the southern
region of the country.
In 1950-51, the maximum capacity was in Southern region i.e. 34.91% while
North had the least of 17.59%. This scenario remained the same in the following
decade and in 1970-71, when south installed 35.24% of capacities whereas North
deteriorated with 15.60% of capacities. Situation was the same till 1980s. It was only
in 1990s when West grew up to first position in terms of capacity. But as the fifth
geographical division came up, with MP moving to center with a major chunk of
capacity, the concentration has reduced. Also earlier capacities were concentrated
around limestone deposits only but market access has become very important
determinant of location of cement plants. In 2006-07, South again dominated the
capacities with 32.22%, which are actually excess, East, West and Centre has more or
less equal capacities of 14%, 18% and 15% respectively whereas North is second
highest at 21%.
Table 5: Region wise Capacity of Cement in India (Percent)
Year North East West South Center Total
1950-51 17.59 24.64 22.86 34.91 - 100.00
1960-61 22.63 23.19 23.08 31.10 - 100.00
1970-71 15.60 17.33 31.83 35.24 - 100.00
1980-81 17.40 16.42 31.31 34.87 - 100.00
1990-91 18.96 8.45 37.22 35.36 - 100.00
1991-92 18.55 8.13 38.28 35.03 - 100.00
1992-93 19.48 7.54 39.51 33.47 - 100.00
1993-94 19.02 8.34 40.15 32.49 - 100.00
1994-95 20.64 9.99 40.52 28.85 - 100.00
1995-96 20.80 8.36 43.74 27.09 - 100.00
1996-97 24.06 7.88 42.04 26.03 - 100.00
1997-98 22.83 7.56 42.84 26.77 - 100.00
1998-99 22.28 8.01 40.95 28.76 - 100.00
1999-00 22.22 7.44 41.41 28.94 - 100.00
2000-01 18.58 17.54 18.59 29.19 16.11 100.00
2001-02 18.68 15.63 16.55 33.58 15.55 100.00
2002-03 18.20 16.06 18.08 32.48 15.17 100.00
2003-04 18.10 15.28 20.00 31.70 14.93 100.00
2004-05 18.00 14.95 19.13 31.64 16.28 100.00
2005-06 20.92 14.14 17.58 31.65 15.71 100.00
2006-07 20.62 14.18 17.54 32.22 15.44 100.00

20
Figure 5: Regional Concentration of Cement Capacities (%)
2.2.3.2. Market Concentration and Increased Competition
Though the industry saw consolidation by domestic players starting in the
mid-1990s, it was only in the late 1990s that foreign players entered the market. The
structure of the industry can be viewed as fragmented, although the concentration at
the top has increased, as the top 5 players control around 60.28% of market share,
which was 55% in 1989-90, whereas the other 39.72% of market share is distributed
among 50 minor players. The fragmented structure is a result of the low entry barriers
in the post decontrol period and the ready availability of technology.
The extent of concentration in the Indian cement industry has increased over
the years. This concentration is mainly because of the focus of the larger and the more
efficient units to consolidate their operations by restructuring their business and
taking over relatively weaker units. Also the relatively smaller and weaker units are
finding it difficult to resist the cyclical pressure of the cement industry. Some of the
key benefits (ICRA 2006) accruing to the acquiring companies from these acquisition
deals include-
0%
20%
40%
60%
80%
100%
1950
-51
1960
-61
1970
-71
1980
-81
1990
-91
1991
-92
1992
-93
1993
-94
1994
-95
1995
-96
1996
-97
1997
-98
1998
-99
1999
-00
2000
-01
2001
-02
2002
-03
2003
-04
2004
-05
2005
-06
2006
-07
North East West South Center

21
� Economies of scale resulting from the larger size of operations
� Savings in the time and cost required setting up a new unit
� Access to newer markets
� Access to special facilities / features of the acquired company
� Benefits of tax shelter
The cement industry is witnessing a number of multinationals entering the
market and mergers and acquisitions in domestic market itself, bringing smaller
players under the umbrella of larger companies, and larger companies coming under
the umbrella of global players.
The booming demand for cement, both in India and abroad, has attracted
global majors to India. In 2005-06, four of the top-5 cement companies in the world
entered India through mergers, acquisitions, joint ventures or greenfield projects.
These include France's Lafarge, Holcim from Switzerland, Italy's Italcementi and
Germany's Heidelberg Cements. The consolidation witnessed in the industry in recent
times has resulted in two crucial domestic deals. First being the de-merger of L&T’s
cement (renamed as Ultratech Cement Ltd.) division and its acquisition by Grasim.
This has led to the creation of cement giant, making the Ultratech- Grasim combine
the market leader in the country in terms of market share, particularly in the South.
The other consolidation effort was seen when Gujarat Ambuja acquired 14.4% stake
in ACC in 2000 (India Infoline 2003). Following this Holcim took a big stake in ACC
in the year 2005 and has recently announced an acquisition of 14.8% in Gujarat
Ambuja Cement Ltd., now Ambuja Cements Ltd. Thus, the top two groups in the
industry, Aditya Birla Group (Grasim and Ultratech Cements Ltd. combine) and
Holcim Group (Ambuja Cements Ltd. - ACC Ltd. combine) now control more than
45 % of total capacity in the country.
The Herfindahl-Hirschman Index (Burange 2003) is calculated to view the
industry concentration ratios, which shows steady increase. The index (converted into
percentage) has increased particularly in late the 1990s, reaching highest in 2000-01,
although it decreased thereafter. The value has again started to increase from the
previous year 2005-06, it being 7.80% then and 8.84% in 2006-07.

22
Figure 6: Herfindahl-Hirschman Index for Industry Concentration
All this indicates that the consolidation of capacities through mergers and
acquisitions is going to be the name of the game for the players to grow and
consolidate their share since green field projects involve a considerable gestation
period. Further, the fragmented nature of the industry, offers ample opportunity for
quickly acquiring the capacities and size (CARE 2007). This trend is also in line with
the global trend, where only two or three cement producers dominate the entire
market in their respective countries.
It is known that the status of the industry is only the sum total of the
performance of the firms within it. Hence it becomes relevant here to study the
performance of firms in the Indian cement industry, with reference to increased
competitiveness in domestic market among firms, especially after decontrol of the
industry and resultant influx of multinational firms. The following section will reflect
the current scenario of competition in the Indian cement industry.
3. COMPETITIVENESS OF FIRMS IN THE INDUSTRY:
The structure and competitive scenario of the Indian cement industry can be
described concisely with the help of Porters’ notable Five-Forces Model (1980) that
7.72
8.68
7.98 8.00
8.498.29
7.998.13
8.318.58
8.85
9.24 9.34
8.77 8.708.45
8.91
7.80
8.84
5.00
5.50
6.00
6.50
7.00
7.50
8.00
8.50
9.00
9.50
10.00
1989
1990
1991
1992
1993
1994
1995
1996
1997
1998
1999
2000
2001
2002
2003
2004
2005
2006
2007
Herfindahl-Hirschman Index Linear (Herfindahl-Hirschman Index )

23
Inter Firm Rivalry-Intense
Large number of players, intermittent
overcapacity; marginal product
differentiation; high storage costs;
and, high exit barrier in form of
significant capital investment has led
to stiff competition in the industry.
Threat of Substitutes - Limited
Only bitumen in road, and
engineering plastics in building offer
some element of competition,
otherwise no close substitutes are
popular in India.
Threat of New Entrants- Limited
High capital investment, broad
distribution network and
oversupplied market deter new
entrants. However, technology and
manpower are easily available.
Bargaining Power of
Buyers-Limited Rising share of retail
purchase, declining share of
bulk purchase by
Government has taken away
the bargaining power of
customers.
Bargaining Power of
Suppliers-Very High
Monopolistic control of
external cost element (coal,
power, transportation and
taxes) results in high
bargaining power with the
government.
determine the attractiveness of the industry and the way in which individual firms
might choose to compete.
3.1. Methodology:
The technique that is used for evaluating competitiveness of firms in the
Indian cement industry is construction of composite competitiveness index. A
composite indicator is the mathematical combination of individual indicators that
represent different dimensions of a concept whose description is the objective of the
analysis (Saisana and Tarantola 2002). We attempt to aggregate various dimensions of
the problem of firm level competitiveness so that it can well be measured. There are
various methodological choices confronted in the problem of building the index, the
specific techniques used for our study has been discussed below.
It is appropriate to firstly define competitiveness of firms in short as one of the
immediate problems in analyzing competitiveness is that despite widespread
acceptance of its importance for economic performance and growth, no consensus
exists on its definition and measurement because of its several interpretations. Main
issues regarding the concept of competitiveness are pertaining to the level of
aggregation (firm, industry, nation and regions) and the number of dimensions it
measures. We are primarily concerned with the measurement of multidimensional
concept of competitiveness at the firm level in the Indian cement industry.
24
One of the most interesting attempts to capture more than one dimension of
firm competitiveness was made by Buckley et al. (1988). According to him, “a firm is
competitive if it can produce products and services of superior quality and at lower
costs than its domestic and international competitors. Competitiveness is synonymous
with a firm's long-run profit performance and its ability to compensate its employees
and provide superior returns to its owners”.
Gelei (2003) has used the definition of firm competitiveness as ‘the basic
capability of perceiving changes in both the external and internal environment and the
capability of adapting to these changes in a way that the profit flow generated
guarantees the long term operation of the firm’. As to him, firm competitiveness is
basically a function of two factors. First, it is determined by the extent a company can
identify those value dimensions that are important for their customers. These are the
main features of the firm’s complex product and service package a customer expects.
The second factor of firm competitiveness is the sum of resources and capabilities that
make a firm capable to create and deliver the identified important value dimensions
for the customer. Prahalad and Hamel (1990) call these core competences.
A White Paper on competitiveness by the UK Government (Department of
Trade and Industry 1994) offers a multi-notion definition at the company level, which
says, ‘for a firm, competitiveness is the ability to produce the right goods and services
of the right quality, at the right price, at the right time. It means meeting customers’
needs more efficiently and more effectively than other firms’.
Another significant discussion on the concept of competitiveness of firms was
published by ADB (2003). It states that competitiveness can be defined as a firm’s
ability to survive under competition and being competitive implies succeeding in an
environment where firms try to stay ahead of each other by reducing prices, by
increasing the quality of their current products and services, and by creating new
ones. A firm’s competitiveness can thus be examined as a function of factors such as
(i) its own resources (ii) its market power; (iii) its behavior toward rivals and other
economic agents; (iv) its capability to adapt to changing circumstances; (v) its
capability to create new markets; and (vi) the institutional environment, largely

25
provided by the government, including physical infrastructure and the quality of
government policies.
3.2. Data- Coverage and Adjustments:
The variables that constitute the competitiveness index for Indian cement
industry have been identified on the basis of factors related to competitiveness at the
firm level, considering the specific issues peculiar to the industry. Total number of
sub-indicators used for the competitiveness index are 63 out of which 38 (60.3%) are
taken from PROWESS database of Centre for Monitoring Indian Economy (CMIE)
and 25 (39.7%) from other data sources. Other data sources include a questionnaire
survey, which was carried out for all sample firms. Some of the other sources used for
preparing the database are company websites, Cement Manufactures’ Association
(CMA) website and other publications.
One of the sub-indicators used for technological index, is environmental
indicator, which includes Total Emissions, Industrial Waste Usage in Production,
Suspended Particulate Material (SPM), Noise Pollution, Certification to Plants, and
Environmental Management Expenditure. Due to lack of response from the sample
firms, we used Centre for Science and Environment (CSE) scores of Green Rating
Project (CSE 2005), which include similar indicators.
The sub-indicators, which are used to construct the competitiveness index of
the firm, are listed in Table 6. All of these sub-indicators are then grouped into ten
main indicators that clearly describe its components.
3.3. Sample Selection:
The sample of firms has been chosen on the basis of market share in sales for
the year 2006-07 (Table 7). Efforts have been made to include a representative
sample, which covers at least 90% of the overall market share of the industry. Also all
firms that have greater than 1% of the shares are included, thus making total count of
sample firms to 17.

26
Table 6: Description of the Sub-indicators in the Competitiveness Index
for Indian Cement Industry
Indicators Sub- indicators
o Capacity Utilization 1. Productive Performance
o Labour Productivity
Liquidity Ratio:
o Current Ratio
o Quick Ratio
Leverage Ratio:
o Debt-Equity Ratio
o Interest Coverage Ratio
Efficiency Ratio:
o Inventory Management
o Debtors Turnover Ratio
Profitability Ratio:
o Net Margin Ratio
o Return on Assets Ratio
o Return on Net Worth (ROE)
o Return on Capital Employed (ROCE)
Other Ratios:
o Net Working Capital Cycle
o Solvency Ratio
2. Financial Performance
o Asset Turnover Ratio
o Cost As % of Gross Sales
Other Cost Indicators:
o Raw Materials, Stores etc.
3. Cost Effectiveness
o Financial Charges
o Market Share
o Department for Brand Management
o Number of Dealers/ Stockists
o Expenditure on Marketing
4. Sales and Marketing Strategy
o Expenditure on Advertising
o Earnings Per Share
o Price- Earning Ratio
5. Stock Market Performance
o Book Value Per Share
o Customer Satisfaction Studies
o Techniques for Measuring Customer Satisfaction
6. Consumer Satisfaction
o Award for Customer Satisfaction
Technology Acquisition:
o Technology Strategy: Import or In-House Development
o Foreign Exchange Spending on Capital Goods
o Royalty know how expenses
o R & D Expenditure
Technology Management:
o Number of Production Plants
o Product Differentiation (brands)
o Grades of Ordinary Portland Cement Produced
o Power and Fuel Expenses
o Packaging Expenses
o Internal Audit of the Quality System
o Logistics- Distribution Cost as % of Total Cost
Environmental Indicators:
o Total Emissions
7. Technology and Environmental
Indicators
o Industrial Waste Usage in Production

27
o Suspended Particulate Material (SPM)
o Noise Pollution
o Certification to Plants
o Environmental Management Expenditure
o Employment Generation
o Employee Cost as % of Total Cost
o Performance Incentives to Employees
o Skill Enhancing Training
o Certification to Plants (Health And Safety)
8. Human Resource Development
and Social Indicators
o Loss Due to Labor Unrest
o Net Foreign Exchange Earned 9. Foreign Trade Measure
o Exports as % of Gross Sales
Growth Variables (over previous year):
o Total Assets
o PAT (NNRT)
o Net Sales
o Total Exports
Future Plans:
o Firm’s Investment Plans over the Next 2 Years
o Plans to Launch any New Brands in Next 2 Years
Contingency Planning:
o Insurance Premium Expenses
o Any Department for Disaster Management
10. Growth Variables and Potential
o Maintenance- Plant and Machinery Repairs Expenditure
Table 7: Market Share in Sales of the Sample Firms in Cement Industry in 2006-07
Firm Market Share (%)
1. Grasim Industries Ltd. 18.38
2. Ambuja Cements Ltd. 13.34
3. A C C Ltd. 12.13
4. Ultratech Cement Ltd. 10.49
5. Century Textiles & Inds. Ltd. 6.89
6. India Cements Ltd. 4.82
7. Birla Corporation Ltd. 3.47
8. Madras Cements Ltd. 3.37
9. Shree Cement Ltd. 3.00
10. J K Cement Ltd. 2.64
11. Dalmia Cement (Bharat) Ltd. 2.10
12. J K Lakshmi Cement Ltd. 1.81
13. Sanghi Industries Ltd. 1.75
14. O C L India Ltd. 1.73
15. Chettinad Cement Corpn. Ltd. 1.65
16. Binani Cement Ltd. 1.45
17. Prism Cement Ltd. 1.19
Total 90.21
Source: Prowess Database
3.4. Building of the Index:
The technique used for normalizing and aggregation of indicators for the
cement industry competitiveness index of firms, is based on the method used by
Burange and Yamini (2008). Identically, the Budget Allocation Method is used to

28
assign weights to all indicators. This method is a participatory method in which
experts are given a ‘budget’ of N points, to be distributed over a number of indicators,
‘paying’ more for those indicators whose importance they want to stress (Saisana
2005). As experts in the field participate, weights necessarily reflect the viewpoint of
the industry in question, as a whole.
In the present study, the ten broad indicators were listed in the questionnaires
itself. The objective was to take opinions of maximum number of experts from each
of the sample firms, particularly those with more experience in the industry. This
reduced the subjectivity in the index as officials already working in the industry have
clear insight into the problem of competitiveness. The weights were then averaged out
across the sample firms, which showed the following (Table 8) results.
Table 8: Weights of the Indicators
Indicators Average Weights
1. Productive Performance 10.43
2. Financial Performance 10.86
3. Cost Effectiveness 11.29
4. Sales And Marketing Strategy 12.50
5. Stock Market Performance 06.79
6. Consumer Satisfaction 10.78
7. Technological and Environmental Indicators 11.14
8. Human Resource Development 09.86
9. Foreign Trade 04.71
10. Growth Performance and Potential 11.64
Total 100.00
After weight allocation to each of the ten indicator indices, these scores are
aggregated linearly into a composite score. Lastly, the ten indicators are grouped in
two groups namely Financial and Non-financial Indicators and constructed separate
for both the indices for the purpose of analysis. Also industry average scores are
calculated to measure the average competitiveness in the industry.
3.5. Results and Analysis:
Industry average score of competitiveness index has been calculated at 45.45,
which is used to analyse the competitive performance of firms above and below it. It
is hence used to benchmark the firms’ competitive standings in the industry. Eight
firms from the sample of seventeen firms i.e. 47% of the total sample size, show
performance above industry average and remaining nine (53%) are below this

29
average. The competitive scenario thus reflected here suggests that the difference
between top ranking players and lower ranking players is immense which has pulled
down the industry average score for competitiveness of firms. The main firms above
industry average score out of the eight are Grasim Industries Ltd., ACC Ltd., Ambuja
Cements Ltd., and Ultratech Cement Ltd. Others in this group are India Cements Ltd.,
Prism Cement Ltd., Madras Cements Ltd. and Birla Corporation Ltd. the remaining
firms in the sample are below this average.
Table 9: Overall Rankings and Scores of Cement Firms
Firm Rank Score
Ambuja Cements Ltd. 1 68.77
Grasim Industries Ltd. 2 61.99
A C C Ltd. 3 60.72
Ultratech Cement Ltd. 4 60.24
India Cements Ltd. 5 54.73
Prism Cement Ltd. 6 53.41
Madras Cements Ltd. 7 52.28
Birla Corporation Ltd. 8 48.14
Industry Average 45.45
Dalmia Cement (Bharat) Ltd. 9 45.15
Shree Cement Ltd. 10 43.75
J K Cement Ltd. 11 37.17
Chettinad Cement Corpn. Ltd. 12 34.54
Century Textiles & Inds. Ltd. 13 31.77
Sanghi Industries Ltd. 14 31.68
J K Lakshmi Cement Ltd. 15 31.32
Binani Cement Ltd. 16 31.08
O C L India Ltd. 17 25.91
25.91
31.08
31.32
31.68
31.77
34.54
37.17
43.75
45.15
45.45
48.14
52.28
53.41
54.73
60.24
60.72
61.99
68.77
0.00 10.00 20.00 30.00 40.00 50.00 60.00 70.00 80.00
O C L India Ltd.
Binani Cement Ltd.
J K Lakshmi Cement Ltd.
Sanghi Industries Ltd.
Century Textiles & Inds. Ltd.
Chettinad Cement Corpn. Ltd.
J K Cement Ltd.
Shree Cement Ltd.
Dalmia Cement (Bharat) Ltd.
Industry Average
Birla Corporation Ltd.
Madras Cements Ltd.
Prism Cement Ltd.
India Cements Ltd.
Ultratech Cement Ltd.
A C C Ltd.
Grasim Industries Ltd.
Ambuja Cements Ltd.
Figure 7: Scores of Cement Firms in Competitiveness Index

30
3.5.1. Competitiveness of the Firm:
In the overall competitiveness rankings, Ambuja Cements Ltd. comes first
with 68.77 score. This result is because of its outstanding performance in all the
indicators, except in stock market performance. The firm has scored particularly well
in productive performance, cost effectiveness and foreign trade with first ranking in
productive performance and third ranking in the other two. Ambuja Cements Ltd. has
maximum score in both sub-indicators of productive performance i.e. capacity
utilization (more than 100%) and labour productivity. Also it has best foreign
exchange earnings in its pool, along with good financial ratios, especially profitability
ratios. Sales and marketing strategy, consumer satisfaction and growth potential also
seem to be its strengths. In all the remaining indices, the firm has above average
performance, thus justifying its top most ranking in the competitiveness rankings.
Grasim industries has secured second ranking in the overall rankings with a
score of 61.99 which is much lower than the first ranking score of 68.77. This is due
to the fact that it scored below average scores in four of the indicator indices.
Although it may be noted in Table 10, that in the indicators in which it marked above
average scores, the firm has done exceptionally well thus pulling its position to
number two. The firm has got maximum score in sales and marketing strategy and
consumer satisfaction, whereas second in stock market performance, technology and
environmental indicators and human resource development. Its weakness lies in the
productive performance, cost effectiveness and foreign trade measure.
The third position is taken by ACC Ltd. with 60.72 score. This result is largely
on account of its superior performance in technological and environmental indicators
as well as in growth variables and potential. In both the indicator index, it has got first
rankings. Technological superiority comes from maximum research and development
expenditure and broad production base with good number of plants, whereas it shows
great growth potential with firms’ expansion plans and good maintenance
expenditure. ACC Ltd. has also performed well in indicators of cost effectiveness,
sales and marketing strategy, consumer satisfaction and human resource development.
Although, it’s overall ranking slipped due to poor productive performance with only
76% of capacity utilization and foreign trade indicator with negative forex earnings

31
Table 10: Scores and Ranks of the Firms for Indicators
Note: Shaded scores of firms indicate above industry average performance in that particular indicator.
Productive
Performance
Financial
Performance
Cost
Effective-
ness
Sales and
Marketing
Strategy
Stock Market
Performance
Consumer
Satisfaction
Technology
and
Environmen-
tal Indicators
Human
Resource
Development
Foreign
Trade
Measure
Growth
Variable and
Potential Firm
Score Rank Score Rank Score Rank Score Rank Score Rank Score Rank Score Rank Score Rank Score Rank Score Rank
A C C Ltd. 1.93 15 5.89 8 8.75 3 8.56 3 1.70 5 9.59 3 7.38 1 8.26 3 1.61 12 7.06 1
Ambuja Cements
Ltd. 10.43 1 8.25 3 9.46 2 8.48 4 0.63 14 9.59 4 5.55 5 7.32 6 2.81 2 6.28 4
Binani Cement
Ltd. 6.31 3 2.40 17 7.52 9 2.98 12 0.63 13 0.00 15 3.39 15 3.35 15 1.55 14 2.96 13
Birla
Corporation Ltd. 1.22 17 8.46 2 8.49 5 4.86 9 0.74 11 4.79 8 4.54 12 8.98 1 1.83 5 4.24 10
Century Textiles
& Inds. Ltd. 2.38 14 3.77 16 4.82 15 4.10 11 2.80 3 0.00 16 5.43 7 4.65 11 1.83 6 1.99 17
Chettinad
Cement Corp Ltd 7.83 2 5.23 10 6.05 14 1.12 16 1.01 9 1.20 11 4.20 13 3.60 14 1.69 10 2.61 16
Dalmia Cement
(Bharat) Ltd. 4.72 7 4.26 14 3.90 16 4.39 10 1.27 7 5.99 6 5.16 8 7.08 7 1.40 16 7.00 2
Grasim
Industries Ltd. 1.45 16 6.50 5 6.12 13 10.62 1 4.71 2 10.79 1 7.15 2 8.91 2 0.18 17 5.56 5
India Cements
Ltd. 4.23 9 4.44 11 7.90 8 7.85 5 0.92 10 9.59 5 5.55 6 7.42 4 1.76 7 5.09 7
J K Cement Ltd. 2.51 13 5.28 9 6.96 10 5.81 8 0.57 15 2.40 9 4.63 11 3.67 13 1.73 8 3.62 11
J K Lakshmi
Cement Ltd. 3.33 12 6.71 4 7.99 6 1.47 14 0.52 16 1.20 12 2.95 16 2.18 17 1.69 9 3.29 12
Madras Cements
Ltd. 4.22 10 5.99 7 8.58 4 6.18 7 5.04 1 2.40 10 5.68 4 7.33 5 1.50 15 5.36 6
O C L India Ltd. 4.13 11 4.03 15 3.04 17 1.44 15 1.08 8 0.00 17 3.74 14 3.70 12 1.86 4 2.89 14
Prism Cement
Ltd. 5.90 5 8.59 1 11.00 1 1.04 17 0.30 17 5.99 7 5.72 3 6.75 8 1.68 11 6.45 3
Sanghi Industries
Ltd. 4.49 8 4.29 13 6.32 12 1.90 13 0.65 12 1.20 13 1.95 17 3.34 16 4.68 1 2.85 15
Shree Cement
Ltd. 5.66 6 4.42 12 6.92 11 6.45 6 2.08 4 1.20 14 4.92 10 5.53 9 1.59 13 4.98 8
Ultratech
Cement Ltd. 5.93 4 6.30 6 7.93 7 10.03 2 1.61 6 10.79 2 4.96 9 5.26 10 2.62 3 4.80 9
Industry
Average 4.51 5.58 7.16 5.13 1.54 4.51 4.88 5.73 1.88 4.53
32
coupled with meager exports. The forth position, very close to ACC Ltd., is held by
another cement major, Ultratech Cement Ltd. which has 60.24 score. This firm has
performed well in sales and marketing strategy where its dealer’s base is vast with
strong advertising and foreign trade measure with a decent net forex earned. The only
indicator in which it has performed below average is human resource development.
Ambuja Cements appears to be comfortable with much difference of overall
score with the second ranking firm. But if Grasim and Ultratech are looked upon
jointly, under the Aditya Birla Group, Ambuja’s first position will surely be in danger.
But large stakes of Holcim, the second largest cement producer in the world, in
Ambuja and ACC, has also made sure that they compete well with the Aditya Birla
Group. With such a scenario in the market, stiff competition lies merely between the
Aditya Birla Group and Holcim at the top, which when combined also control around
54% market share of the industry.
India Cements Ltd. is at the fifth position but the difference of score with
Ultratech Cement Ltd. is much where it has got only 54.73 points. This again
indicates the true market situation of the Indian cement industry where the above
mentioned four companies are dominant, creating an oligopolistic situation. However,
considering the fact that India Cements Ltd. mainly caters to southern market, its
position is good enough. The company has performed well in human resource
development as well as sales and marketing strategy. Prism Cement Ltd. and Madras
Cements Ltd. who are very close with India Cements Ltd hold sixth and seventh
positions. It is noteworthy that Prism Cement Ltd. has got such a low position in spite
of it being at the top in financial performance and cost effectiveness thus indicating
high profitability. But it’s especially bad performance in sales and marketing strategy,
stock market performance and foreign trade measure has pulled down its overall
ranking. Madras Cements Ltd. has proved its superiority in stock market with best
earning per shares (EPS). However, it fumbled in foreign trade and productive
performance. The last company above the industry average is mid-cap Birla
Corporation Ltd. with 48.14 score. It is best in human resource and second in
financial performance but last in productive performance with low levels of capacity
utilization as well as labour productivity.
33
All the above-discussed firms are above the industry average in terms of their
competitive performance in various indicators and hence showing good competitive
behavior. The remaining eight firms, which are below the industry average, are
discussed below. The ninth, tenth, eleventh and twelfth positions are taken by Dalmia
Cement (Bharat) Ltd. (45.15), Shree Cement Ltd. (43.75), J K Cement Ltd. (37.17)
and Chettinad Cement Corpn. Ltd (34.54). Dalmia Cement (Bharat) Ltd. has
weakness in cost effectiveness but is very strong in growth prospects with major
expansion plans for future. Shree Cement Ltd. has good stock market performance
where it stands 4th
. J K Cement Ltd. has above industry average performance in only
sales and marketing. Same is the case with Chettinad Cement Corpn. Ltd. where it has
attained second ranking only in productive performance, all other indicators show
below average performance.
There is not much difference in the competitive score between 13th
, 14th
, 15th
and 16th
ranking firms i.e. Century Textiles & Inds. Ltd., Sanghi Industries Ltd., J K
Lakshmi Cement Ltd. and Binani Cement Ltd. The scores of all these firms are
around 31. Sanghi Industries Ltd. has scored first rank in foreign trade measure with
maximum exports. OCL India Ltd. has got minimum of 25.91 score as it has
performed below average in all the ten indicators.
3.5.2. Financial and Non-Financial Indices:
Competitiveness is related to the ability of firms to perform better than rivals,
where performance is dependent on both financial and non-financial conditions. For
the purpose of analysis, competitiveness index has been divided into financial index
and non-financial index. The objective is to ascertain which of the two indices has
greater significance on the overall competitiveness index of a firm.
With this objective, financial indicators such as different financial ratios, cost
effectiveness, stock market performance and foreign trade indicators are grouped
under financial index and other indicators such as productive performance, sales and
marketing strategy, consumer satisfaction, technological issues, human resource and
growth variables are grouped under non-financial indicators. The former has 33.64%
of the total weights whereas the later gets remaining 66.36%. Importance to non-
34
financial factors is given visibly more by the industry experts in the survey of sample
firms (Table 8). Using the weighted average of the indicator indices, financial and
non-financial indices are constructed.
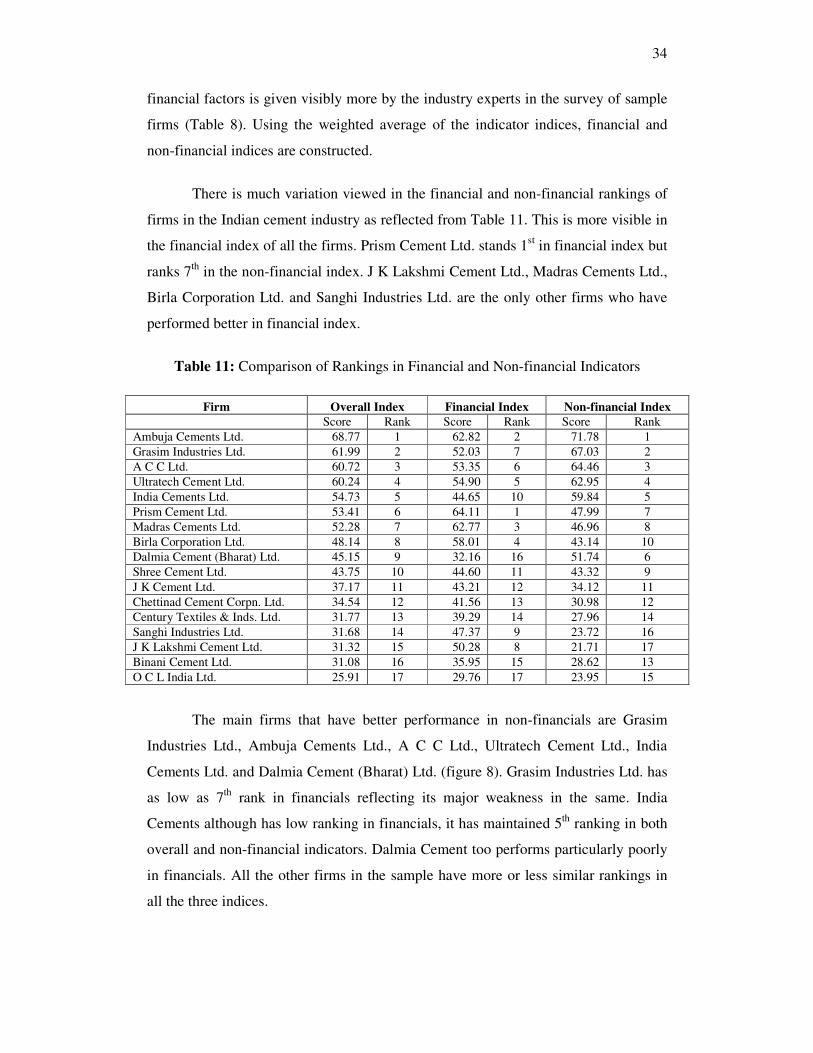
There is much variation viewed in the financial and non-financial rankings of
firms in the Indian cement industry as reflected from Table 11. This is more visible in
the financial index of all the firms. Prism Cement Ltd. stands 1st in financial index but
ranks 7th
in the non-financial index. J K Lakshmi Cement Ltd., Madras Cements Ltd.,
Birla Corporation Ltd. and Sanghi Industries Ltd. are the only other firms who have
performed better in financial index.
Table 11: Comparison of Rankings in Financial and Non-financial Indicators
The main firms that have better performance in non-financials are Grasim
Industries Ltd., Ambuja Cements Ltd., A C C Ltd., Ultratech Cement Ltd., India
Cements Ltd. and Dalmia Cement (Bharat) Ltd. (figure 8). Grasim Industries Ltd. has
as low as 7th
rank in financials reflecting its major weakness in the same. India
Cements although has low ranking in financials, it has maintained 5th
ranking in both
overall and non-financial indicators. Dalmia Cement too performs particularly poorly
in financials. All the other firms in the sample have more or less similar rankings in
all the three indices.
Firm Overall Index Financial Index Non-financial Index
Score Rank Score Rank Score Rank
Ambuja Cements Ltd. 68.77 1 62.82 2 71.78 1
Grasim Industries Ltd. 61.99 2 52.03 7 67.03 2
A C C Ltd. 60.72 3 53.35 6 64.46 3
Ultratech Cement Ltd. 60.24 4 54.90 5 62.95 4
India Cements Ltd. 54.73 5 44.65 10 59.84 5
Prism Cement Ltd. 53.41 6 64.11 1 47.99 7
Madras Cements Ltd. 52.28 7 62.77 3 46.96 8
Birla Corporation Ltd. 48.14 8 58.01 4 43.14 10
Dalmia Cement (Bharat) Ltd. 45.15 9 32.16 16 51.74 6
Shree Cement Ltd. 43.75 10 44.60 11 43.32 9
J K Cement Ltd. 37.17 11 43.21 12 34.12 11
Chettinad Cement Corpn. Ltd. 34.54 12 41.56 13 30.98 12
Century Textiles & Inds. Ltd. 31.77 13 39.29 14 27.96 14
Sanghi Industries Ltd. 31.68 14 47.37 9 23.72 16
J K Lakshmi Cement Ltd. 31.32 15 50.28 8 21.71 17
Binani Cement Ltd. 31.08 16 35.95 15 28.62 13
O C L India Ltd. 25.91 17 29.76 17 23.95 15

35
0.00
10.00
20.00
30.00
40.00
50.00
60.00
70.00
Ambuja
Cements Ltd.
Grasim
Industries
Ltd.
A C C Ltd. Ultratech
Cement Ltd.
India
Cements Ltd.
Prism
Cement Ltd.
Madras
Cements Ltd.
Birla
Corporation
Ltd.
Dalmia
Cement
(Bharat) Ltd.
Shree
Cement Ltd.
J K Cement
Ltd.
Chettinad
Cement
Corpn. Ltd.
Century
Textiles &
Inds. Ltd.
Sanghi
Industries
Ltd.
J K Lakshmi
Cement Ltd.
Binani
Cement Ltd.
O C L India
Ltd.
FINANCIAL INDEX NON-FINANCIAL INDEX
Figure 8: Comparison Financial and Non-financial Indicators
3.5.3. Regional Rankings:
Cement being a regional play; we study the rankings of the firms depending
upon their areas of operation. It becomes proper to view the overall scores and
rankings in the context of five regions of India; North, East, South, West and Center.
It can be ascertained from Table 12 that two of the regions i.e. Center and South are
dominated by the presence of the firm that has all- India presence i.e. Grasim
Industries. Ambuja Cements obviously has first ranking in the remaining three
regions i.e. East, West and North.
What is more significant here, is the ranking of other firms, who although are
on lower ranks in the overall index, have performed comparatively better in regional
rankings. One such firm is Prism Cement Ltd., which has stood 4th
in North and 3rd
in
Central region, the only two regions it caters inspite of having 6th
rank in the overall
index. This shows its good regional competitive performance. Birla Corporation Ltd.
also has 4th
rank in Centre, and 5th
in North and East but 8th
in overall rankings. One
more point cannot be ignored is that there are many smaller firms operating in single
or even two regions who are not included in the sample. Including them in the
regional market sharing will definitely bring more competition.
36
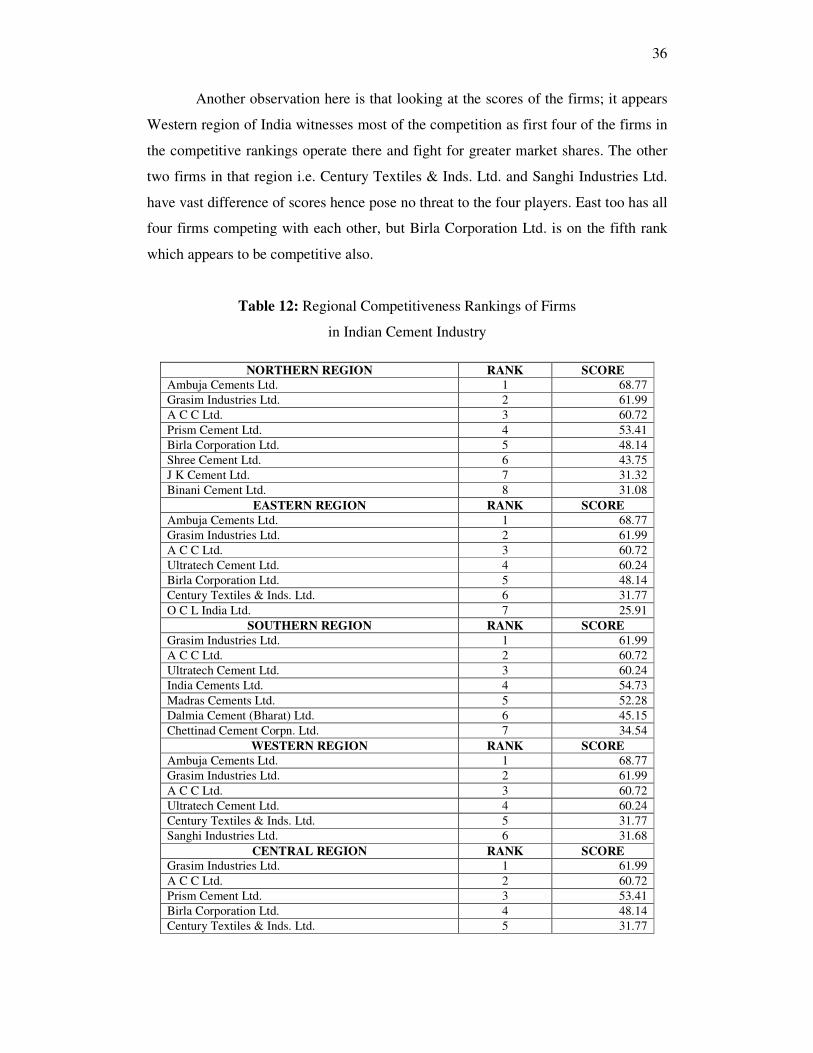
Another observation here is that looking at the scores of the firms; it appears
Western region of India witnesses most of the competition as first four of the firms in
the competitive rankings operate there and fight for greater market shares. The other
two firms in that region i.e. Century Textiles & Inds. Ltd. and Sanghi Industries Ltd.
have vast difference of scores hence pose no threat to the four players. East too has all
four firms competing with each other, but Birla Corporation Ltd. is on the fifth rank
which appears to be competitive also.
Table 12: Regional Competitiveness Rankings of Firms
in Indian Cement Industry
NORTHERN REGION RANK SCORE
Ambuja Cements Ltd. 1 68.77
Grasim Industries Ltd. 2 61.99
A C C Ltd. 3 60.72
Prism Cement Ltd. 4 53.41
Birla Corporation Ltd. 5 48.14
Shree Cement Ltd. 6 43.75
J K Cement Ltd. 7 31.32
Binani Cement Ltd. 8 31.08
EASTERN REGION RANK SCORE
Ambuja Cements Ltd. 1 68.77
Grasim Industries Ltd. 2 61.99
A C C Ltd. 3 60.72
Ultratech Cement Ltd. 4 60.24
Birla Corporation Ltd. 5 48.14
Century Textiles & Inds. Ltd. 6 31.77
O C L India Ltd. 7 25.91
SOUTHERN REGION RANK SCORE
Grasim Industries Ltd. 1 61.99
A C C Ltd. 2 60.72
Ultratech Cement Ltd. 3 60.24
India Cements Ltd. 4 54.73
Madras Cements Ltd. 5 52.28
Dalmia Cement (Bharat) Ltd. 6 45.15
Chettinad Cement Corpn. Ltd. 7 34.54
WESTERN REGION RANK SCORE
Ambuja Cements Ltd. 1 68.77
Grasim Industries Ltd. 2 61.99
A C C Ltd. 3 60.72
Ultratech Cement Ltd. 4 60.24
Century Textiles & Inds. Ltd. 5 31.77
Sanghi Industries Ltd. 6 31.68
CENTRAL REGION RANK SCORE
Grasim Industries Ltd. 1 61.99
A C C Ltd. 2 60.72
Prism Cement Ltd. 3 53.41
Birla Corporation Ltd. 4 48.14
Century Textiles & Inds. Ltd. 5 31.77

37
4. CONCLUSION:
It can be concluded that given the sustained growth in the housing sector, the
government's emphasis on infrastructure (both at the national and the state level) and
increased global demand, the prospect for India's cement industry is exceedingly
promising. The dynamics of Indian cement industry is undergoing a gradual shift.
From an oversupply situation not long ago, a phase has come where demand growth is
outstripping supply.
While tracing the growth of the industry in different policy regimes, it became
observable that the industry has matured with the help of all indicators of
performance, such as size, production, capacity utilization, consumption and exports,
after its decontrol in 1989-90. Technology of production and quality of product too
has advanced a lot along with decrease in regional concentration. Another significant
trend which the industry has witnessed is of greater consolidation of power by larger
players through mergers and acquisitions and entry of foreign majors in the ever
growing market. This growth and development of the industry is all the more evident
in recent years especially after 1999-2000.
All the above mentioned trends in the Indian cement industry have only
contributed to the growing competitiveness between the firms. The efforts have been
made to build up a composite index that reflects the competitiveness of firms in the
industry, indicating their areas of superiority and the domains of weaknesses. A
composite competitiveness index is defined as the mathematical combination of
individual indicators that represent different dimensions of the concept whose
description is the objective of the analysis.
The findings of the study reflect the relative competitive position of the
sample firms and also the overall picture of the industry. It also throws some light on
the regional dominance of the players. Out of seventeen sample firms, performance of
eight firms was above the industry average scores of overall competitiveness index.
Ambuja Cement Ltd. scored highest in the group getting top most ranking mainly
because of its consistent performance in both financial and non-financial index. This
is followed by Grasim Industries, which has scored second rank due to better non-

38
financial performance in terms of sales and marketing strategy, etc. Looking at the
financial and non-financial index separately, it is seen that the rankings differ a lot as
some firms perform better in one than the other. In the regional rankings, it is learned
that Northern, Western and Eastern markets are dominated by Ambuja Cement Ltd.
whereas South and Central regions by Grasim Industries Ltd.
It can be hoped that the overall index, ten indicator indices and financial/ non
financial index prove to be helpful in formulating competitive policies by the firms. It
will also be useful to consumers to judge the competitive performance of these firms
from the product quality and investment point of view.

39
REFERENCES
1. Asian Development Bank (2003), Asian Development Outlook, Competitiveness
in Developing Asia: Taking Advantage of Globalization, Technology, and
Competition in Part 3, Manila.
http://www.adb.org/Documents/Books/ADO/2003/part3.asp
2. Boyce, J (1986), Kinked Exponential Models for Growth Rate Estimation, Oxford
Bulletin of Economics and Statistics, Department of Economics, University of
Oxford, Vol. 48, No. 4, pp. 385-391.
3. Buckley, Peter J., Christopher L. Pass, and Kate Prescott (1988), Measures of
International Competitiveness: A Critical Survey, Journal of Marketing
Management 4 (2).
4. Burange, L. G. and Shruti Yamini (2008), Competitiveness of Firms in Indian
Automobile Industry, Paper presented in International Conference on
Transportation System Studies, Department of Economics, University of Mumbai,
Mumbai.
5. Burange, L. G. (2003), Industry: Changing Structure, Composition and Slackening
Growth, Ed. Bhalchandra Mungekar in The Economy of Maharashtra- Changing
Structure and Emerging Issues, Dr. Ambedkar Institute of Social and Economic
Change, Mumbai.
6. CARE (2007), Cement Industry: Better Fortunes Ahead…, Cement Industry
CARE Ratings, Mumbai.
7. Cement Manufacturers’ Association (2007, 2006, 2005), Indian Cement Industry-
At a Glance (Various Years), New Delhi.
8. Cement Manufacturers’ Association (1964), 50 Years- The Cement Industry in
India 1914 -1964, New Delhi.
9. Centre for Science and Environment (2005), Concrete Plans: The life cycle of the
Indian Cement Industry, Green Rating Project, New Delhi.
10. Chakravarty, S.M. (1989), Indian Cement Industry from Control to Decontrol,
Wadhera Publications, Bombay.
11. Chakravarty, S.M. (1993), Growth Prospects for Cement Industry in India,
Aashish Publications, New Delhi.
12. Department of Trade and Industry (1994), Competitiveness, White Paper, Cm
2563, London, HMSO.
13. Environment Agency (2005), Improving Environmental Performance: Sector Plan
for the Cement Industry, Version 1, Bristol.

40
14. Gadhok, K.D. (2000), 85 Years of Cement Industry (1914-1999), National Council
for Cement and Building Materials (NCB), New Delhi.
15. Gelei, Andrea (2003), Competitiveness: A Match between Value Drivers and
Competencies In The Hungarian Automotive Supply Chain, Budapest University
of Economic Sciences and Public Administration, Hungary.
16. Gokarn, Subir and Rajendra Vaidya (1993), Deregulation and Industrial
Performance, The Indian Cement Industry, Economic and Political Weekly,
volume xxviii, numbers 8 and 9, February 20.
17. ICRA (2006), The Indian Cement Industry, Industry Comment, Sector Analysis,
Credit Rating Agency of India Limited, New Delhi.
18. India Brand Equity Foundation (2006), Cement, Report by Crisil for IBEF,
Gurgaon.
19. India Infoline Ltd. (2003), Indian Cement Sector- The Untold Story, Part 2, Sector
Reseach, Mumbai.
20. NCAER (1979), Cement Industry in India, Problems and Prospects, National
Council for Applied Economic Research, The Bengal Press, New Delhi.
21. Porter, M.E. (1980), Competitive Strategy: Techniques for Analyzing Industries
and Competitors, Free Press, New York.
22. Prahalad, C. K. and G. Hamel (1990), The Core Competence of the Corporation,
Harvard Business Review, Vol. 68, No.3, pp.79-81.
23. Saisana, Michaela (2005), State-of-the-Art Report on Composite Indicators for the
Knowledge-based Economy, Work-package 5, KEI-project, European
Commission: Joint Research Centre, Ispra, Italy.
24. Saisana, Michaela and S. Tarantola, (2002), State-of-the-art Report on Current
Methodologies and Practices for Composite Indicator Development, EUR 20408
EN, Institute for the Protection and Security of the Citizen, JRC Ispra, Italy.
25. Sarathy, R. Partha and S. M. Chakravarty (1998), Indian Cement Industry-
Emerging Trends, Cement Manufactures’ Association of India (CMA), New
Delhi.
26. Schumacher, Katja and Jayant Sathaye (1999), India’s Cement Industry:
Productivity, Energy Efficiency and Carbon Emissions, Ernest Orlando Lawrence
Berkeley National Laboratory, Environmental Energy Technologies Division,
Berkeley.
http://ies.lbl.gov/iespubs/41842.pdf
27. World Business Council for Sustainable Development (2005), The Cement
Sustainability Initiative: CO2 Accounting and Reporting Standard for the Cement
Industry, WBCSD, Geneva, Switzerland.

41
28. World Business Council for Sustainable Development (2002), The Cement
Sustainability Initiative: Our Agenda for Action, WBCSD, Geneva, Switzerland.
WEBSITES:
Cement Association of Canada (2006), A History of Cement, Ottawa.
http://www.cement.ca/cement.nsf/e/E5422FE72FC1740A852568C5004EDB3? Op
enDocument
Cimenterie Nationale (2007), History of Cement, retrieved on 11-11-07 from
http://www.cimnat.com.lb/History/History.asp
Lafarge (2004), All About Cement, retrieved on 26-03-06 from
http://www.lafarge.com/wps/portal/4_3_5_1Histoire#editoEncartVide0000000000
009572