department of commerce international trade administration ... fy 2017 cbj final not50… · ita -1...
TRANSCRIPT
ITA -1
Department of Commerce International Trade Administration Budget Estimates, Fiscal Year 2017
Congressional Submission TABLE OF CONTENTS
Exhibit Number
Exhibit Page Number
2 Organization Chart ITA- 3 3 Executive Summary ITA- 5
Operations and Administration 5 Summary of Resource Requirements: Direct Obligations ITA- 9
6 Summary of Reimbursable Obligations ITA- 10 7 Summary of Financing ITA- 11 9 Justification of Adjustments to Base ITA- 13
Justification of Program and Performance Industry and Analysis 10 Program and Performance: Direct Obligations ITA- 17
11 Program and Performance: Reimbursable Obligations ITA- 18 12 Justification of Program and Performance ITA- 19 13
Program Changes for FY 2017 ITA- 22
14 Program Change Personnel Detail ITA- 25 15
Program Change Detail by Object Class ITA- 26
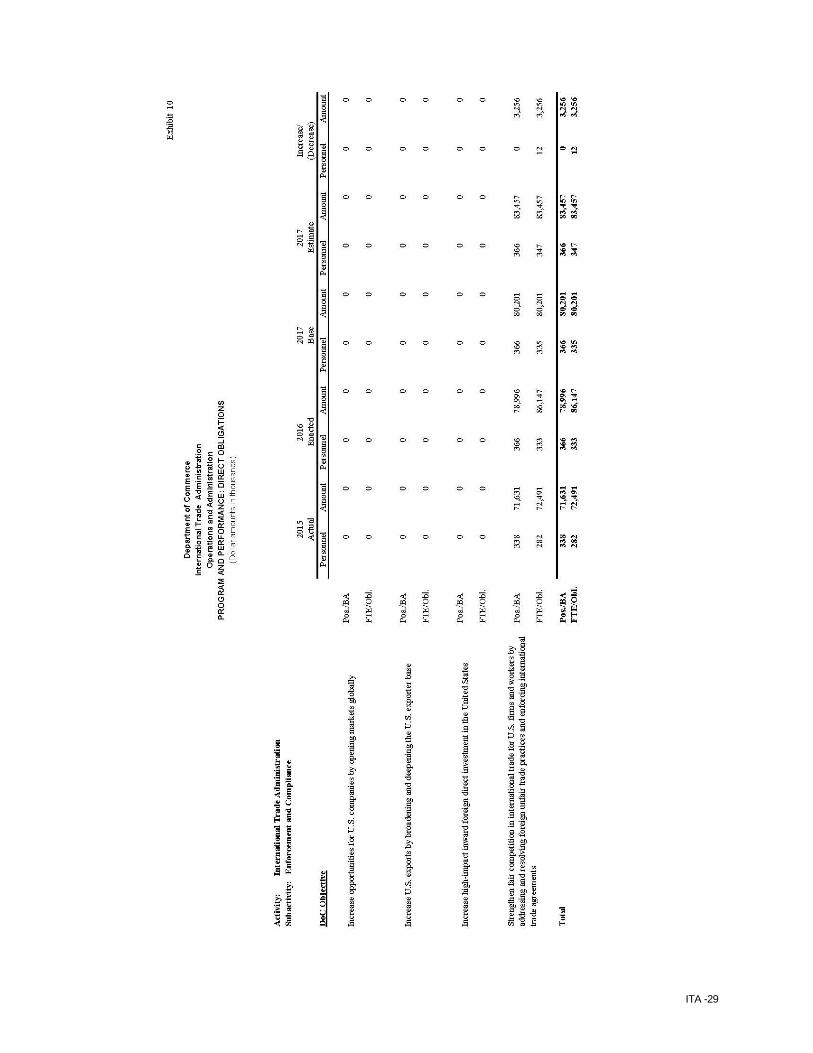
Enforcement and Compliance 10 Program and Performance: Direct Obligations ITA- 29
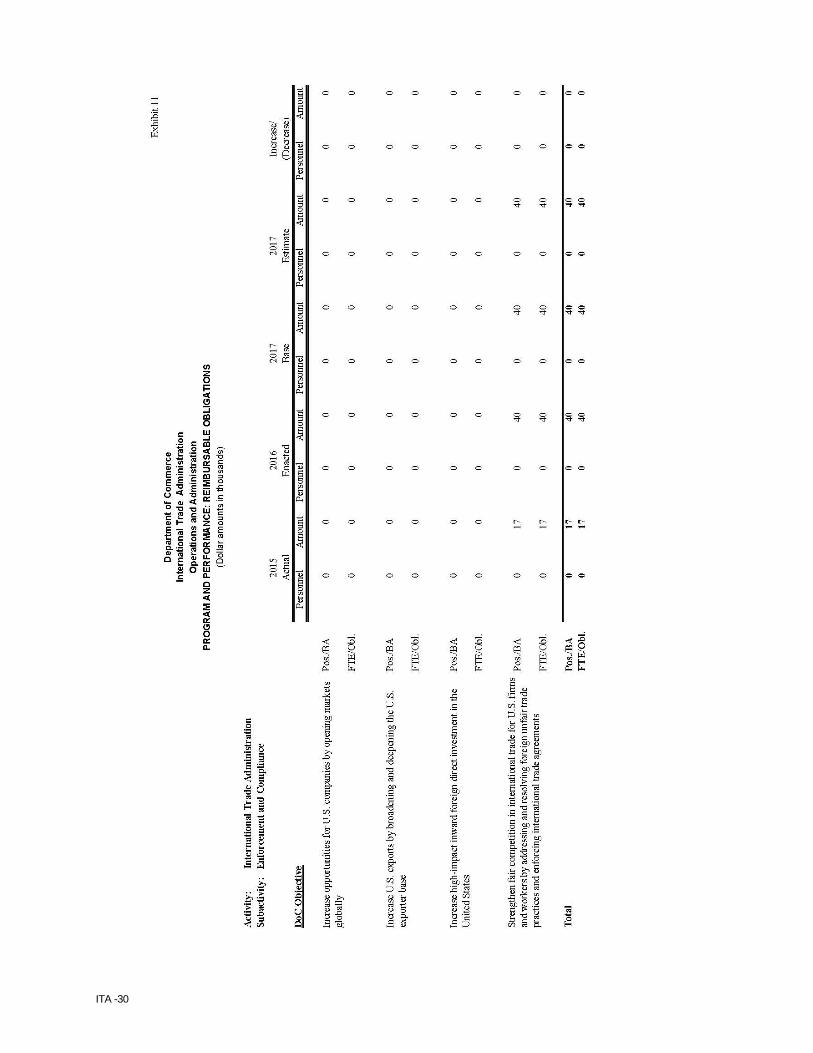
11 Program and Performance: Reimbursable Obligations ITA- 30 12
Justification of Program and Performance ITA- 31
13
Program Changes for FY 2017 ITA- 37 15
Program Change Detail by Object Class ITA- 42
Global Markets 10 Program and Performance: Direct Obligations ITA- 45
11 Program and Performance: Reimbursable Obligations ITA- 46 12 Justification of Program and Performance ITA- 47 13 Program Changes for 2017 ITA- 52 14 Program Change Personnel Detail ITA- 57 15 Program Change Detail by Object Class ITA- 59 Executive Direction and Administration
10 Program and Performance: Direct Obligations ITA- 63 11 Program and Performance: Reimbursable Obligations ITA- 64 12 Justification of Program and Performance ITA- 65 13 Program Changes for 2017 ITA- 67 15 Program Change Detail by Object Class ITA- 68
ITA -2
Exhibit Number Exhibit Page Number
16 Summary of Requirements by Object Class ITA- 69 32 Justification of Proposed Language Changes ITA- 71 34 Advisory and Assistance Services ITA- 73 35 Periodicals, Pamphlets, and Audiovisual Services ITA- 75 36 Average Grade and Salaries ITA- 77
Grants to Manufacturers of Worsted Wool 5 Summary of Resource Requirements: Direct Obligations ITA- 79
7 Summary of Financing ITA- 81 10 Program and Performance: Direct Obligations ITA- 83 12 Justification of Program and Performance ITA- 85 16 Summary of Requirements by Object Class ITA- 87 FY 2017 Performance Planning and FY 2015 Report
Backup ITA- 89 Glossary of Budget Acronyms and Terms ITA- 103
ITA -3
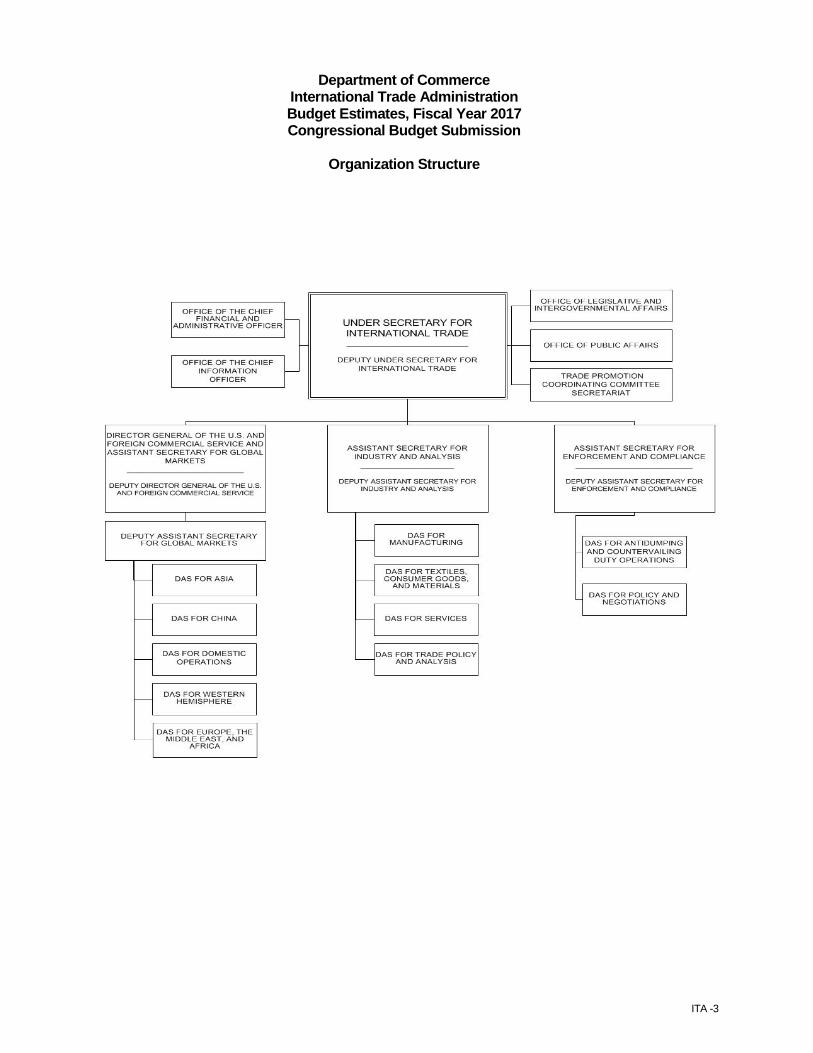
Department of Commerce International Trade Administration Budget Estimates, Fiscal Year 2017 Congressional Budget Submission
Organization Structure

ITA -4
This Page Intentionally Left Blank
ITA -5
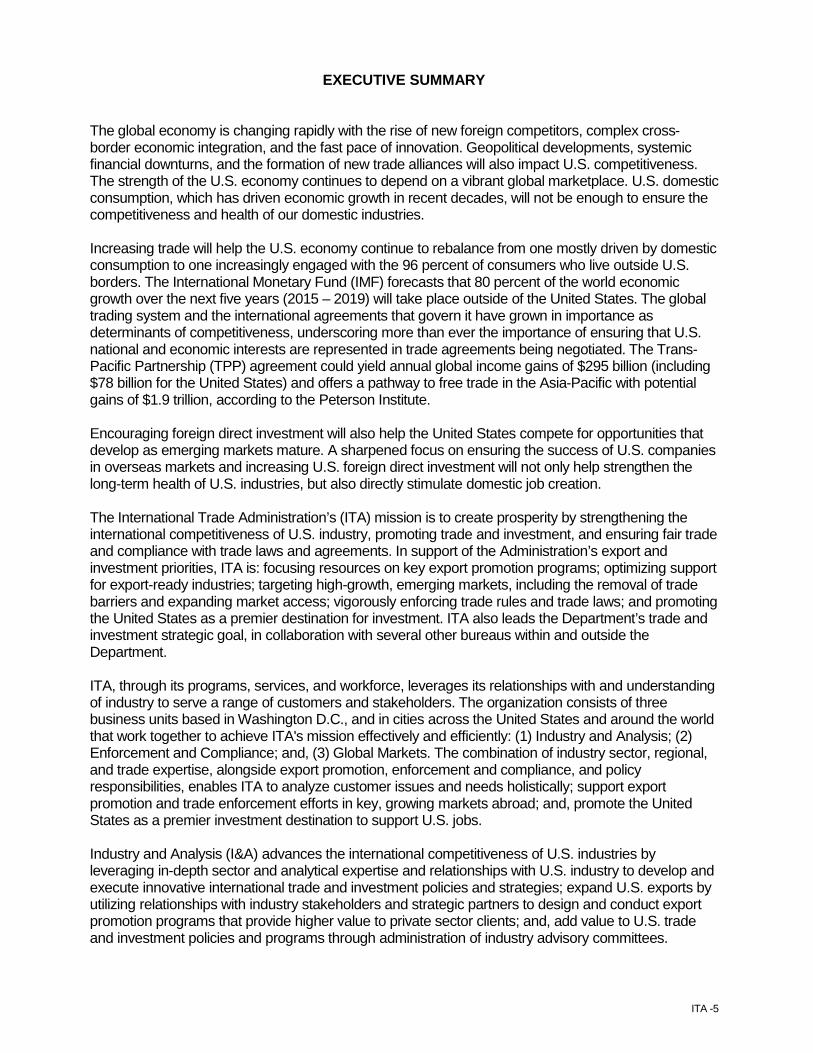
EXECUTIVE SUMMARY
The global economy is changing rapidly with the rise of new foreign competitors, complex cross-border economic integration, and the fast pace of innovation. Geopolitical developments, systemic financial downturns, and the formation of new trade alliances will also impact U.S. competitiveness. The strength of the U.S. economy continues to depend on a vibrant global marketplace. U.S. domestic consumption, which has driven economic growth in recent decades, will not be enough to ensure the competitiveness and health of our domestic industries. Increasing trade will help the U.S. economy continue to rebalance from one mostly driven by domestic consumption to one increasingly engaged with the 96 percent of consumers who live outside U.S. borders. The International Monetary Fund (IMF) forecasts that 80 percent of the world economic growth over the next five years (2015 – 2019) will take place outside of the United States. The global trading system and the international agreements that govern it have grown in importance as determinants of competitiveness, underscoring more than ever the importance of ensuring that U.S. national and economic interests are represented in trade agreements being negotiated. The Trans-Pacific Partnership (TPP) agreement could yield annual global income gains of $295 billion (including $78 billion for the United States) and offers a pathway to free trade in the Asia-Pacific with potential gains of $1.9 trillion, according to the Peterson Institute. Encouraging foreign direct investment will also help the United States compete for opportunities that develop as emerging markets mature. A sharpened focus on ensuring the success of U.S. companies in overseas markets and increasing U.S. foreign direct investment will not only help strengthen the long-term health of U.S. industries, but also directly stimulate domestic job creation. The International Trade Administration’s (ITA) mission is to create prosperity by strengthening the international competitiveness of U.S. industry, promoting trade and investment, and ensuring fair trade and compliance with trade laws and agreements. In support of the Administration’s export and investment priorities, ITA is: focusing resources on key export promotion programs; optimizing support for export-ready industries; targeting high-growth, emerging markets, including the removal of trade barriers and expanding market access; vigorously enforcing trade rules and trade laws; and promoting the United States as a premier destination for investment. ITA also leads the Department’s trade and investment strategic goal, in collaboration with several other bureaus within and outside the Department. ITA, through its programs, services, and workforce, leverages its relationships with and understanding of industry to serve a range of customers and stakeholders. The organization consists of three business units based in Washington D.C., and in cities across the United States and around the world that work together to achieve ITA's mission effectively and efficiently: (1) Industry and Analysis; (2) Enforcement and Compliance; and, (3) Global Markets. The combination of industry sector, regional, and trade expertise, alongside export promotion, enforcement and compliance, and policy responsibilities, enables ITA to analyze customer issues and needs holistically; support export promotion and trade enforcement efforts in key, growing markets abroad; and, promote the United States as a premier investment destination to support U.S. jobs. Industry and Analysis (I&A) advances the international competitiveness of U.S. industries by leveraging in-depth sector and analytical expertise and relationships with U.S. industry to develop and execute innovative international trade and investment policies and strategies; expand U.S. exports by utilizing relationships with industry stakeholders and strategic partners to design and conduct export promotion programs that provide higher value to private sector clients; and, add value to U.S. trade and investment policies and programs through administration of industry advisory committees.
ITA -6
Enforcement and Compliance (E&C) promotes the efficient and effective administration of U.S. antidumping (AD) /countervailing duty (CVD) trade law remedies; addresses and curtails trade-distorting practices; promotes adoption of disciplines and practices by U.S. trading partners that enhance transparency and impartiality in foreign trade law practices and administration; and, administers the Foreign Trade Zone (FTZ) program and other import programs that support U.S. jobs. E&C also represents and advocates on behalf of U.S. industry interests with regard to the exercise and enforcement of U.S. rights under bilateral and multilateral trade agreements, including through the interagency mechanisms. Global Markets (GM) advances U.S. commercial interests by engaging with foreign governments and U.S. businesses, identifying and resolving country-specific market barriers, and leading interagency efforts that advocate for U.S. firms with foreign governments. GM also works to expand U.S. exports by developing and implementing policies and programs to increase U.S. access to and presence in foreign markets; provides market contacts, knowledge, opportunities, and customized solutions to U.S. firms, especially small and medium-sized enterprises; and, expands foreign investment into the United States by promoting the U.S. as an investment destination. Strengthening ITA’s Enforcement & Compliance: +$2.0 million / +12 FTE ITA requests an additional $2.0 million and 12 FTE in FY 2017 to provide full year funding for personnel hired in FY 2016 to strengthen the enforcement of the U.S. antidumping duty (AD) and countervailing duty (CVD) laws. The additional funds will maintain new AD/CVD staff brought on-board to keep up with workload in order to meet statutory deadlines and ensure case resolution quality. Export Expansion and Investment: +$10.4 million / +20 FTE [I&A +$1.4 million/ +4 FTE, GM +$9.0 million/ +16 FTE] ITA requests an additional $10.4 million and 20 FTE in FY 2017 to support the expansion of ITA’s capacity and footprint to position the United States and American companies to compete effectively in the global marketplace. Based on current projections, the additional funding will place personnel in overseas markets where demand for Commercial Diplomacy, market entry assistance, and the potential for FDI is the greatest. ITA will also place personnel in the US field to serve existing clients and “touch” potential new clients; and, will add staff in headquarters to provide supporting analytical expertise. SelectUSA: +$10.0 million / +16 FTE ITA is requesting an increase of 16 FTE and $10.0 million to expand covered markets with dedicated SelectUSA personnel. The addition in funds will allow SelectUSA to increase coverage to more than 25 focus markets representing the greatest opportunity for inward investment into the United States and the resources needed to bolster U.S. export competitiveness. The SelectUSA program helps promote the United States as the best market for investment; serves as an ombudsman for U.S. industry; and, serves as an investment advocate for U.S. cities, states, and regions.
ITA -7
Survey of International Air Travelers: +$2.0 million / +0 FTE ITA requests an increase of $2.0 million to increase the sample size of the Survey of International Air Travelers (SIAT) to provide data on the economic contribution of international travel and tourism to a greater number of smaller states and cities, as well as market intelligence on a greater number of source markets. Program Support Across All Business Units: +$8.0 million / +0 FTE Funding will sustain program capabilities across all ITA business units. Through investments in personnel and non-personnel support costs, this increase provides day-to-day resources to maintain mission and operational excellences within ITA. FTE levels would not be affected by this change.

ITA -8
This Page Intentionally Left Blank
ITA -9

ITA -10
ITA -11

ITA -12
This Page Intentionally Left Blank
ITA -13
Exhibit 9 Department of Commerce
International Trade Administration Operations and Administration
JUSTIFICATION OF ADJUSTMENTS TO BASE (Dollar amounts in thousands)
FTE Amount
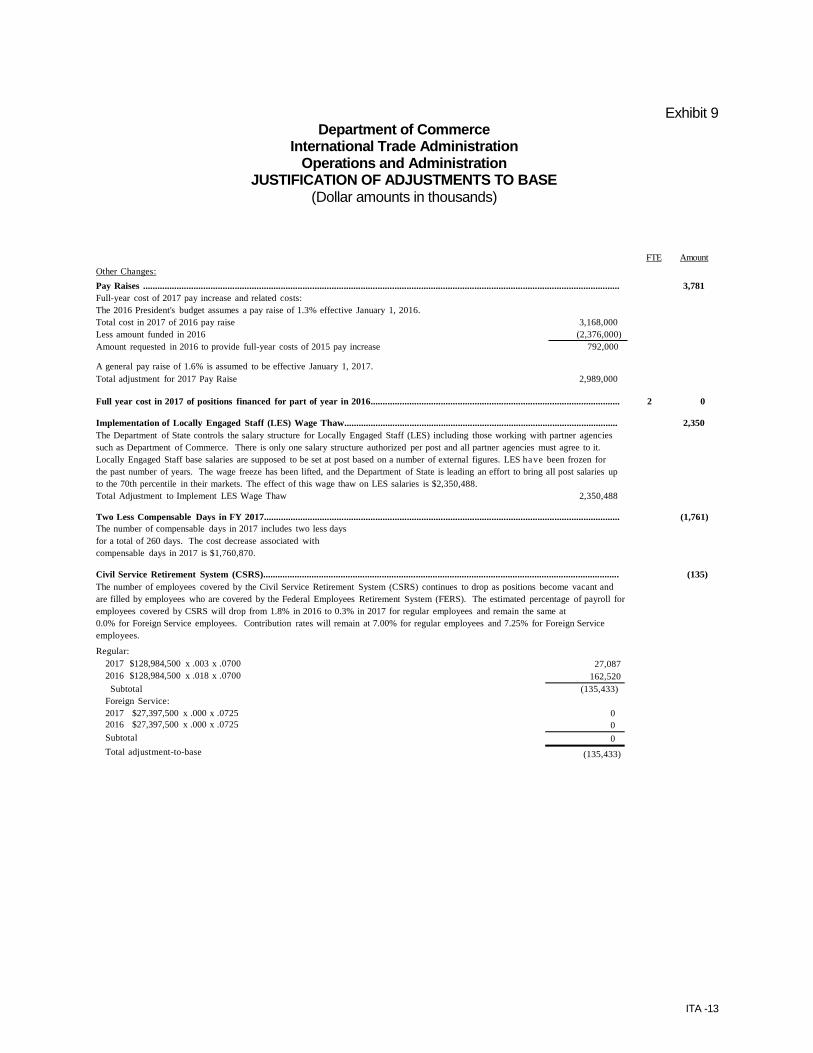
Other Changes: Pay Raises ..................................................................................................................................................................................................... 3,781 Full-year cost of 2017 pay increase and related costs: The 2016 President's budget assumes a pay raise of 1.3% effective January 1, 2016. Total cost in 2017 of 2016 pay raise 3,168,000 Less amount funded in 2016 (2,376,000) Amount requested in 2016 to provide full-year costs of 2015 pay increase 792,000 A general pay raise of 1.6% is assumed to be effective January 1, 2017. Total adjustment for 2017 Pay Raise 2,989,000 Full year cost in 2017 of positions financed for part of year in 2016....................................................................................................... 2 0 Implementation of Locally Engaged Staff (LES) Wage Thaw................................................................................................................. 2,350 The Department of State controls the salary structure for Locally Engaged Staff (LES) including those working with partner agencies such as Department of Commerce. There is only one salary structure authorized per post and all partner agencies must agree to it. Locally Engaged Staff base salaries are supposed to be set at post based on a number of external figures. LES have been frozen for the past number of years. The wage freeze has been lifted, and the Department of State is leading an effort to bring all post salaries up to the 70th percentile in their markets. The effect of this wage thaw on LES salaries is $2,350,488. Total Adjustment to Implement LES Wage Thaw 2,350,488 Two Less Compensable Days in FY 2017................................................................................................................................................... (1,761) The number of compensable days in 2017 includes two less days for a total of 260 days. The cost decrease associated with compensable days in 2017 is $1,760,870. Civil Service Retirement System (CSRS)................................................................................................................................................... (135) The number of employees covered by the Civil Service Retirement System (CSRS) continues to drop as positions become vacant and are filled by employees who are covered by the Federal Employees Retirement System (FERS). The estimated percentage of payroll for employees covered by CSRS will drop from 1.8% in 2016 to 0.3% in 2017 for regular employees and remain the same at 0.0% for Foreign Service employees. Contribution rates will remain at 7.00% for regular employees and 7.25% for Foreign Service employees.
Regular: 2017 $128,984,500 x .003 x .0700 27,087 2016 $128,984,500 x .018 x .0700 162,520
Subtotal Foreign Service: 2017 $27,397,500 x .000 x .0725
(135,433)
0 2016 $27,397,500 x .000 x .0725 0 Subtotal 0 Total adjustment-to-base (135,433)

ITA -14
FTE Amount
Federal Employees Retirement System (FERS)......................................................................................................................................... 265 The number of employees covered by FERS continues to rise as employees covered by CSRS leave and are replaced by employees covered by FERS. The estimated percentage of payroll for employees covered by FERS will rise from 98.2% in 2016 to 99.7% in 2017 for regular employees and remain the same at 100.0% for Foreign Service employees. The contribution rate will remain at 13.7% for regular employees, and 32.52% for Foreign Service employees.
Regular: 2017 $128,984,500 x .997 x .137
17,617,864
2016 $128,984,500 x .982 x .137 17,352,801 Subtotal
Foreign Service: 2017 $27,397,500 x 1.0 x .3252
265,063
8,909,667 2016 $27,397,500 x 1.0 x .3252 8,909,667 Subtotal 0
Total adjustment-to-base 265,063
Thrift Savings Plan (TSP)............................................................................................................................................................................ 39 The cost of ITA's contributions to the Thrift Savings Plan will also rise as FERS participation increases. The contribution rate is expected to remain at 2%.
Regular: 2017 $128,984,500 x .997 x .02 2,571,951 2016 $128,984,500 x .982 x .02 2,533,256
Subtotal Foreign Service: 2017 $27,397,500 x 1.0 x .02
38,695
547,950 2016 $27,397,500 x 1.0 x .02 547,950 Subtotal 0
Total adjustment-to-base 38,695 Federal Insurance Contribution Act (FICA)............................................................................................................................................. 5 As the percentage of payroll covered by FERS rises, the cost of Old Age Survivor and Disability Insurance (OASDI) contributions will increase. The contribution rate will remain 6.2%.
Regular: 2017 $128,984,500 x .997 x .96 x.062 7,654,126 2016 $128,984,500 x .982 x .98 x.062 7,696,030
Subtotal Foreign Service: 2017 $27,397,500 x 1.0 x .906 x .062
(41,904)
1,538,972 2016 $27,397,500 x 1.0 x .878 x .062 1,491,410 Subtotal Other Salaries; Regular Salaries 2017 $492,000 x .96 x .062
47,562
29,284 2016 $492,000 x .98 x .062 29,894 Subtotal (610)
Total adjustment-to-base 5,048
Health Insurance........................................................................................................................................................................................... 416 Effective January 2017, this Bureau's contribution to Federal employees' health insurance premiums increased by an average rate of 2.967%. Applied against the 2016 estimate of $14,014,000, the additional amount required is $415,855. Federal Employee's Compensation Act...................................................................................................................................................... (7) The Employee's Compensation Fund bill for the year ending in June 30, 2017 is estimated to be $597,129, which is $7,479 less than FY 2016 payment. Upon enactment of the 2017appropriation, ITA will reimburse the Department of Labor pursuant to 5 U.S.C. 8147. Travel (Mileage)............................................................................................................................................................................................ 8 The reimbursable rate for the use of a privately owned automobile is expected to increase. A rate increase of 2.679% was applied to the 2016 estimate of $303,000 to arrive at an increase of $8,116 for 2017. Foreign Per Diem.......................................................................................................................................................................................... (151) The average rate for foreign per diem decreased 4.4% or $150,633 from the 2016 estimate of $3,447,500.
ITA -15
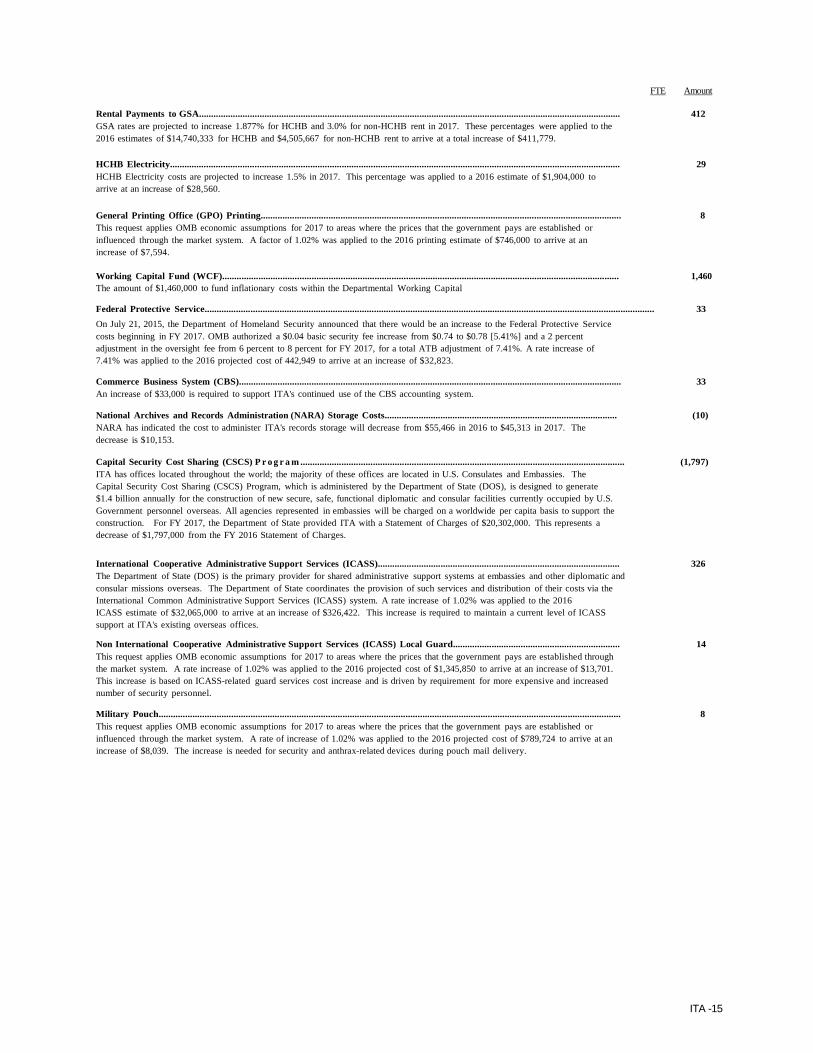
FTE Amount Rental Payments to GSA.............................................................................................................................................................................. 412 GSA rates are projected to increase 1.877% for HCHB and 3.0% for non-HCHB rent in 2017. These percentages were applied to the 2016 estimates of $14,740,333 for HCHB and $4,505,667 for non-HCHB rent to arrive at a total increase of $411,779. HCHB Electricity.......................................................................................................................................................................................... 29 HCHB Electricity costs are projected to increase 1.5% in 2017. This percentage was applied to a 2016 estimate of $1,904,000 to arrive at an increase of $28,560. General Printing Office (GPO) Printing..................................................................................................................................................... 8 This request applies OMB economic assumptions for 2017 to areas where the prices that the government pays are established or influenced through the market system. A factor of 1.02% was applied to the 2016 printing estimate of $746,000 to arrive at an increase of $7,594. Working Capital Fund (WCF).................................................................................................................................................................... 1,460 The amount of $1,460,000 to fund inflationary costs within the Departmental Working Capital Federal Protective Service.......................................................................................................................................................................................... 33 On July 21, 2015, the Department of Homeland Security announced that there would be an increase to the Federal Protective Service costs beginning in FY 2017. OMB authorized a $0.04 basic security fee increase from $0.74 to $0.78 [5.41%] and a 2 percent adjustment in the oversight fee from 6 percent to 8 percent for FY 2017, for a total ATB adjustment of 7.41%. A rate increase of 7.41% was applied to the 2016 projected cost of 442,949 to arrive at an increase of $32,823. Commerce Business System (CBS).............................................................................................................................................................. 33 An increase of $33,000 is required to support ITA's continued use of the CBS accounting system. National Archives and Records Administration (NARA) Storage Costs................................................................................................ (10) NARA has indicated the cost to administer ITA's records storage will decrease from $55,466 in 2016 to $45,313 in 2017. The decrease is $10,153. Capital Security Cost Sharing (CSCS) P r o g r a m ...................................................................................................................................... (1,797) ITA has offices located throughout the world; the majority of these offices are located in U.S. Consulates and Embassies. The Capital Security Cost Sharing (CSCS) Program, which is administered by the Department of State (DOS), is designed to generate $1.4 billion annually for the construction of new secure, safe, functional diplomatic and consular facilities currently occupied by U.S. Government personnel overseas. All agencies represented in embassies will be charged on a worldwide per capita basis to support the construction. For FY 2017, the Department of State provided ITA with a Statement of Charges of $20,302,000. This represents a decrease of $1,797,000 from the FY 2016 Statement of Charges. International Cooperative Administrative Support Services (ICASS).................................................................................................... 326 The Department of State (DOS) is the primary provider for shared administrative support systems at embassies and other diplomatic and consular missions overseas. The Department of State coordinates the provision of such services and distribution of their costs via the International Common Administrative Support Services (ICASS) system. A rate increase of 1.02% was applied to the 2016 ICASS estimate of $32,065,000 to arrive at an increase of $326,422. This increase is required to maintain a current level of ICASS support at ITA's existing overseas offices. Non International Cooperative Administrative Support Services (ICASS) Local Guard..................................................................... 14 This request applies OMB economic assumptions for 2017 to areas where the prices that the government pays are established through the market system. A rate increase of 1.02% was applied to the 2016 projected cost of $1,345,850 to arrive at an increase of $13,701. This increase is based on ICASS-related guard services cost increase and is driven by requirement for more expensive and increased number of security personnel. Military Pouch............................................................................................................................................................................................... 8 This request applies OMB economic assumptions for 2017 to areas where the prices that the government pays are established or influenced through the market system. A rate of increase of 1.02% was applied to the 2016 projected cost of $789,724 to arrive at an increase of $8,039. The increase is needed for security and anthrax-related devices during pouch mail delivery.
ITA -16
FTE Amount
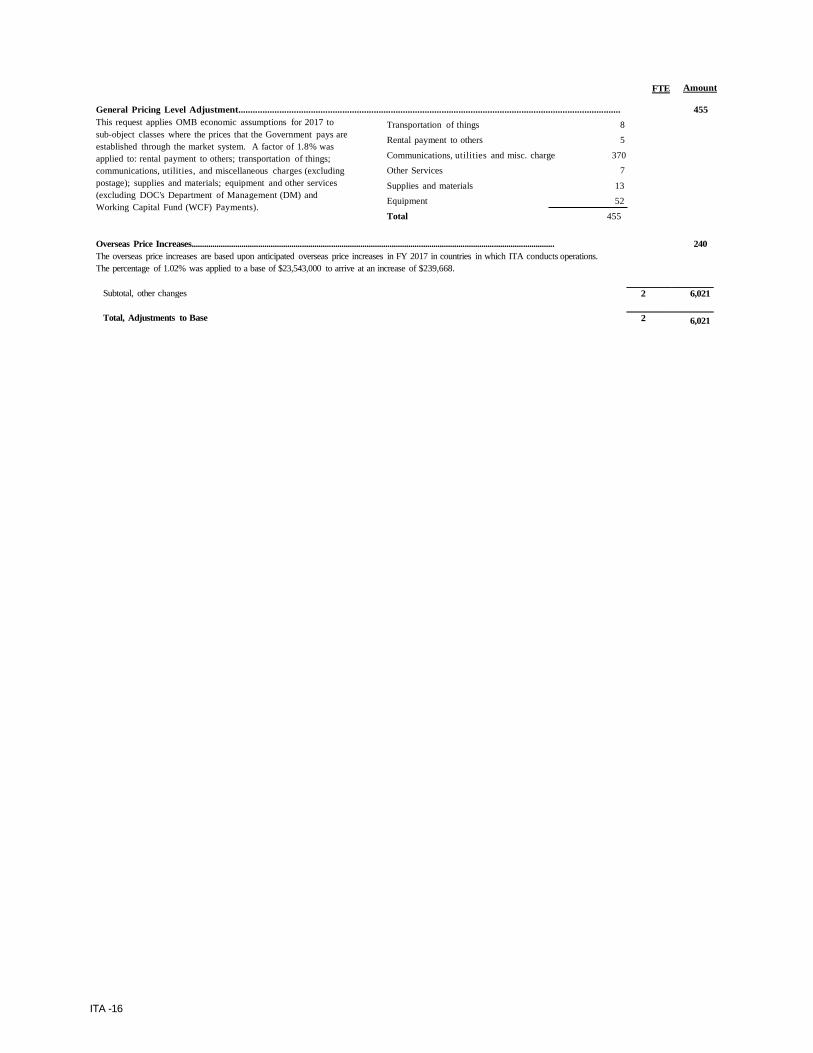
General Pricing Level Adjustment.............................................................................................................................................................. 455 This request applies OMB economic assumptions for 2017 to sub-object classes where the prices that the Government pays are established through the market system. A factor of 1.8% was applied to: rental payment to others; transportation of things; communications, utilities, and miscellaneous charges (excluding postage); supplies and materials; equipment and other services (excluding DOC's Department of Management (DM) and Working Capital Fund (WCF) Payments).
Transportation of things 8 Rental payment to others 5
Communications, utilities and misc. charge 370 Other Services 7
Supplies and materials 13 Equipment 52
Total 455 Overseas Price Increases.............................................................................................................................................................................. 240 The overseas price increases are based upon anticipated overseas price increases in FY 2017 in countries in which ITA conducts operations. The percentage of 1.02% was applied to a base of $23,543,000 to arrive at an increase of $239,668.
Subtotal, other changes 2 6,021 Total, Adjustments to Base 2 6,021
ITA -17
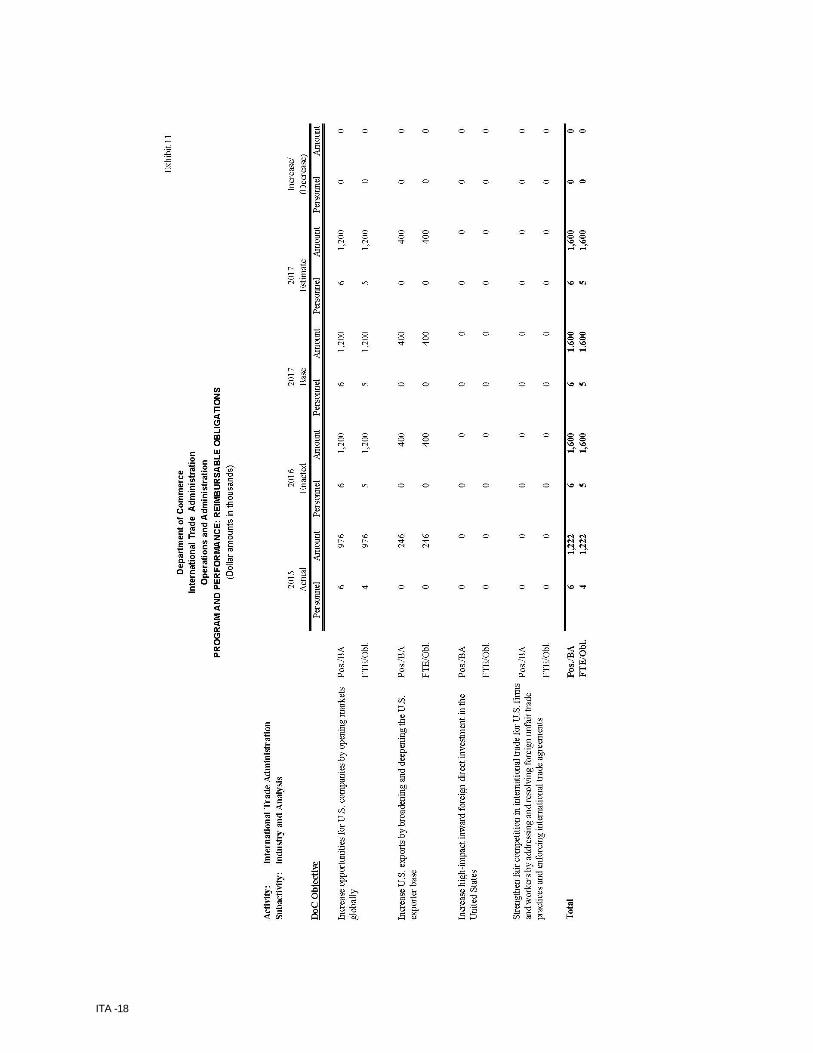
ITA -18
ITA -19
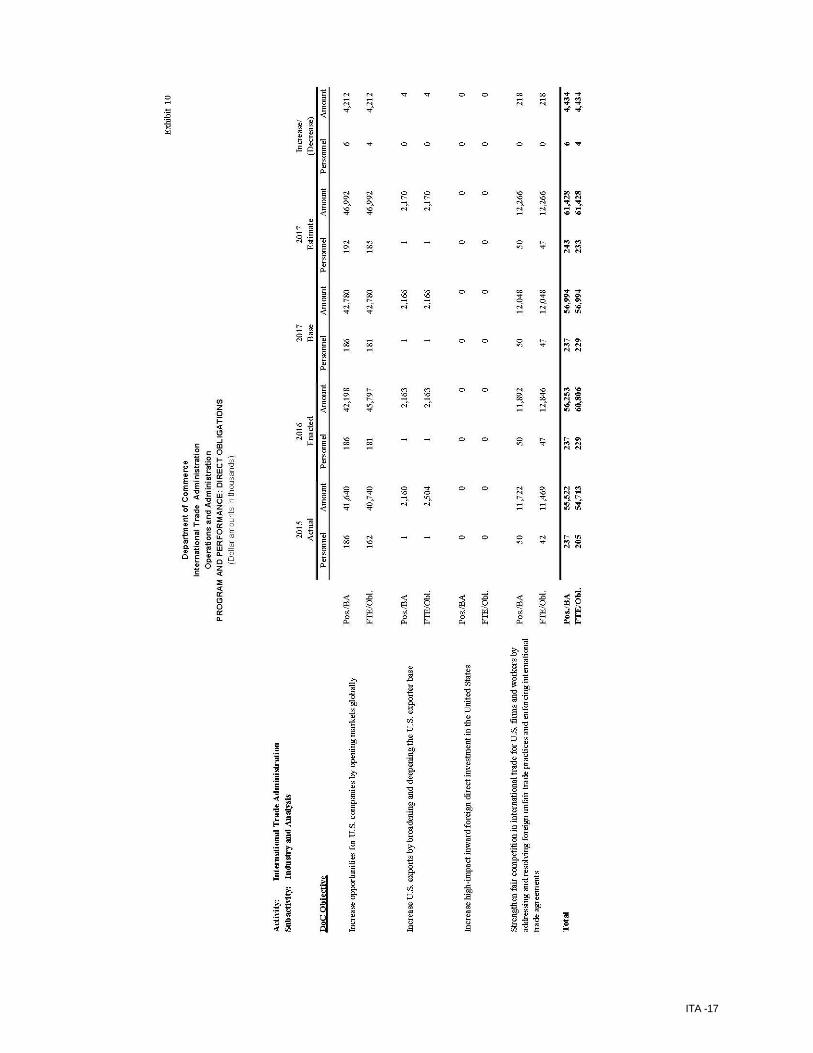
Exhibit 12-15 (Congressional) APPROPRIATION ACCOUNT: OPERATIONS AND ADMINISTRATION BUDGET PROGRAM: INDUSTRY AND ANALYSIS For FY 2017, ITA requests a total of $61,428,000 and 233 FTE for Industry and Analysis (including inflationary adjustments of $741,000 and 0 FTE). This request includes three program changes that together total an increase of $4,434,000 and 4 FTE. BASE JUSTIFICATION: Industry and Analysis Overview Industry and Analysis (I&A) leverages its sectoral and analytical expertise to improve the international competitive position of U.S. industry through the development and execution of trade policy, export expansion initiatives, and investment promotion strategies. I&A is the central agency of the U.S. Government (USG) providing industry-based analytical support to all USG agencies involved in trade negotiations, including the United States Trade Representative (USTR), the Department of Commerce, the Department of State, and the Department of Agriculture. I&A:
• Engages industry and other stakeholders to gather input for trade policy development, negotiations, and implementation strategies through an extensive network of industry advisory groups and public-private partnerships.
• Publishes international economic and policy analysis, and produces actionable intelligence on industry market conditions (including Top Markets reports), as well as trade data tools, that are used to expand global market access for U.S. industry and to design and implement innovative trade and investment promotion programs.
• Serves as the primary liaison between U.S. industry and the USG on industry-specific trade and U.S. investment promotion issues.
• Directly supports USTR in negotiating bilateral and multilateral trade agreements affecting U.S. industries by providing key technical support for relevant chapters in Free Trade Agreements (FTAs); evaluating industry views on international trade issues; and formulating policy positions on proposed trade agreements and legislative initiatives.
• Delivers analysis and advice from industry to senior government leaders; impartially administers dispute settlement provisions for trade agreements; leads the development of ITA positions on cross-sectoral international trade policy issues; and, develops and maintains data critical in supporting USG international trade objectives.
• Administers programs that support small and medium-sized enterprise (SMEs) access to global markets, such as the Market Development Cooperator Program (MDCP) and the administration of the Export Trading Company Act (ETCA).
The I&A unit is organized into two sub-programs under the Operations and Administration appropriation:
• Industry Analysis by Sector • Cross-Sectoral Industry Analysis
ITA -20
INFLATIONARY ADJUSTMENTS: ITA requests a net increase of 0 FTE and $0.7 million to fund inflationary adjustments. The figure reflects an increase to fund the estimated 2017 Federal pay raise of 1.6 percent as well as inflationary increases for non-labor activities, including service contracts, utilities, the Department of Commerce Working Capital Fund and rent charges from the General Service Administration (GSA). SUB-PROGRAM: INDUSTRY ANALYSIS BY SECTOR I&A has four program offices dedicated to conducting industry outreach and analysis by sector: The Manufacturing (MFG) business unit supports U.S. manufacturing sectors (including energy, environmental industries, transportation, machinery, health and information technologies) by utilizing in-depth industry expertise to increase exports and promote job creation. MFG develops and implements policies to improve U.S. business competitiveness globally by focusing specifically on high growth export sectors and markets as well as opportunities for foreign direct investment in the United States. The National Travel and Tourism Office (NTTO) coordinates government-wide activities in support of exports and investment in the U.S. travel and tourism industry. NTTO includes the Office of Travel and Tourism Industries, represents U.S. travel and tourism policy in international forums, serves as the principal liaison to the Corporation for Travel Promotion (CTP), and performs research and other functions delineated in the Travel Promotion Act of 2009. NTTO administers research programs that provide the sole source of data on international arrivals and outbound travel, the Survey of International Air Travelers (SIAT), and a Canadian data program. NTTO also develops and issues a forecast of international travel to the U.S., federal estimates from the Travel & Tourism Satellite Accounts which measures the contribution of travel and tourism on the U.S, economy. The Services (SVCS) business unit represents services sectors and industries that account for 70% of total U.S. GDP and employment (including finance and insurance; shipping, transportation and logistics; professional and business services; education; engineering and construction; information, communications and digital services; media and entertainment; and retail, wholesale, and franchising). SVCS assesses the global environment for services sectors; addresses foreign market trade and investment barriers; and promotes services export opportunities in order to increase exports of U.S. services. The Textiles, Consumer Goods and Materials (TCGM) business unit represents U.S. textiles, apparel, consumer goods, and materials industries. TCGM administers and enforces agreements and preference programs tied to textile, apparel, footwear, and travel goods industries, and works to ensure fair trade and a level playing field for these industries to enhance competitiveness in international markets. TCGM also administers textile and apparel-related provisions of U.S. trade agreement and preference programs, and chairs the interagency Committee for the Implementation of Textile Agreements (CITA) which sets policy on textile safeguard actions, actions against illegal transshipment, and other related issues.
ITA -21
SUB-PROGRAM: CROSS-SECTORAL INDUSTRY ANALYSIS I&A has five program areas dedicated to conducting industry outreach and representation across sectors and analysis on cross-sectoral issues: The Market Development Cooperator Program (MDCP) provides federal financial assistance and technical support from ITA staff to trade associations, chambers of commerce, and other non-profit industry groups that are particularly effective in helping SMEs to export. Such groups compete for a limited number of MDCP awards and must commit at least two-thirds of the project cost if selected. Since the program began in FY 1993, MDCP award winners have generated more than $9 billion in U.S. exports. Between FY 1997 and FY 2014, MDCP has helped generate $336 in U.S. exports for every $1 of the federal contribution to the MDCP award. The Office of Advisory Committees and Industry Outreach (OACIO) serves as the communications channel for U.S. companies and other organizations to provide analysis and advice to U.S. policymakers on trade and other economic policy issues. The twenty-four Industry Trade Advisory Committees (ITACs) with more than 500 appointed industry representatives provide a critical link between the economic interests of U.S. industries and the broader public policy concerns of the USG. Advisory committees include the President’s Advisory Council on Doing Business in Africa, President’s Export Council (PEC), the Manufacturing Council, sixteen Industry Trade Advisory Committees and the Committee of Chairs (administered jointly with USTR), the Environmental Technologies Trade Advisory Committee, the Civil Nuclear Trade Advisory Committee, the Renewable Energy and Energy Efficiency Advisory Committee, the Advisory Committee on Supply Chain Competitiveness, and the Travel and Tourism Advisory Board (TTAB). The Trade Agreement Secretariat (TAS) is responsible for the impartial administration of dispute settlement provisions for nearly all of the free trade agreements to which the Unites States is a party. The Trade Policy and Analysis (TPA) business unit supports USG trade policy formulation and negotiations by providing cross-sectoral trade and economic analysis and issue expertise needed to expand exports and foreign direct investment in the United States. TPA provides guidance on trade negotiations for U.S. market access positions on industrial goods, rules of origin, and government procurement. The unit is also active in public outreach efforts for completed trade agreements, develops tools to enable U.S. exporters to utilize those agreements, provides analytical support on safeguard actions, and leads the analysis of miscellaneous tariff bills (MTBs). TPA participates in the development of international standards and works to ensure ITA stakeholders have an opportunity to shape standards affecting their interests. TPA assists U.S. companies in resolving or overcoming Intellectual Property (IP) related trade barriers in foreign markets through the negotiation of trade agreement obligations, provision of bilateral advocacy on systemic and company-specific challenges, and managing the USG’s STOPFakes.gov program. TPA is also responsible for development and maintenance of the Jobs Supported by Exports Report, the Metropolitan Export Series, TradeStats Express (TSE), and the Trade Policy Information System (TPIS). The office also represents the Department of Commerce on the Committee on Foreign Investment in the United States (CFIUS), and administers certification for the Export Trading Company Act (ETCA). TPA also administers the Emerging Industries Program to engage them in addressing trade policy issues, assist them in establishing exports sales channels, and inform them through the publication of research and analysis.
ITA -22
PROGRAM CHANGES FOR FY 2017: Program Support (Base Funding: $56.9 million and 229 FTE; Program Change: $1.0 million and 0 FTE): ITA requests $1,034,000 in order to sustain program capabilities in I&A. Through investments in personnel and non-personnel support costs, this increase provides day-to-day resources to maintain mission and operational excellences within ITA. FTE levels would not be affected by this change. Expansion of Survey of International Air Travelers (Base funding: $2.0 million and 0 FTE; Program Change: +$2.0 million and 0 FTE): ITA requests an increase of $2,000,000 to double the sample size of the Survey of International Air Travelers. This increase will make progress in meeting the mandate of the Travel Promotion Act to expand the Survey of International Air Travelers to reach the goal of 1% and increase the data on the number of destinations and countries reported. The Survey of International Air Travelers is the only source for international travel statistics, including travelers’ spending, destinations visited, purpose of trip (e.g. medical and education), and other key traveler characteristics. This data is used by the Bureau of Economic Analysis (BEA) to measure the contribution of international travel to the economy, and by Congress and the Executive branch to develop public policy on this key industry sector. Stakeholders such as U.S. states, travel destinations, and travel businesses rely upon this data for market intelligence. Global Markets and I&A Travel and Tourism Team members use the data extensively in advising clients about markets. The expansion of the survey will enable ITA to provide more country data, and also enable a greater number of states and localities to benefit from this data in expanding markets and job-creation strategies. In addition, the expansion will enable more robust data to be used by the private sector to analyze business opportunities and anticipate market shifts. The current methodology has been reviewed extensively by BEA, Census and the private sector Travel and Tourism Advisory Board and has universally been acknowledged to be sound and cost effective given current collection methods. Additional funding will allow us to attract a larger pool of contractors, increasing competition that will lead to a greater variety of approaches that could provide economies of scale in collection methodologies. Export Expansion and Investment (Base Funding: $56.9 million and 229 FTE; Program Change: $1.4 million and 4 FTE): ITA requests an increase of $1,400,000 and 4 FTE in I&A to simultaneously expand promotion of exports from high-growth, priority industries and markets, and emerging industries; and, address barriers to exports in these areas. The expansion and optimization of I&A supports trade and investment through:
• Increasing opportunities for U.S. companies by further opening markets globally; • Increasing exports by broadening and deepening the U.S. exporter base; • Strengthening fair competition in international trade for U.S. firms and workers by addressing
and resolving unfair trade practices; and • Improving data-based services, decision making, and data sharing within the Department of
Commerce and with other parts of the federal government. I&A is working directly with customers to obtain the most up-to-date information concerning client needs in high-growth, priority industries. This collaboration with customers will help direct new strategic staffing support. Additional staffing will be distributed to strategic staffing support for Trade Promotion Partnerships and in emerging industries such as additive manufacturing & advanced robotics, neurotechnology and wearable technology.
ITA -23
Increased staffing to support exports from high-growth, priority industries and markets, and emerging industries is needed to expand exports, as well as help remove barriers to such exports. Expanded international trade specialist staffing is intended to lead more companies develop export strategies. In addition, all companies will have access to additional analysis to support entry into a greater number of export markets. Performance Goals and Measurement Data: Performance Measure: Exports generated annually from public/private partnerships ($ in millions)
FY 2014
Actual
FY 2015
Actual
FY 2016
Target
FY 2017
Target
FY 2018
Target
FY 2019
Target
FY 2020
Target
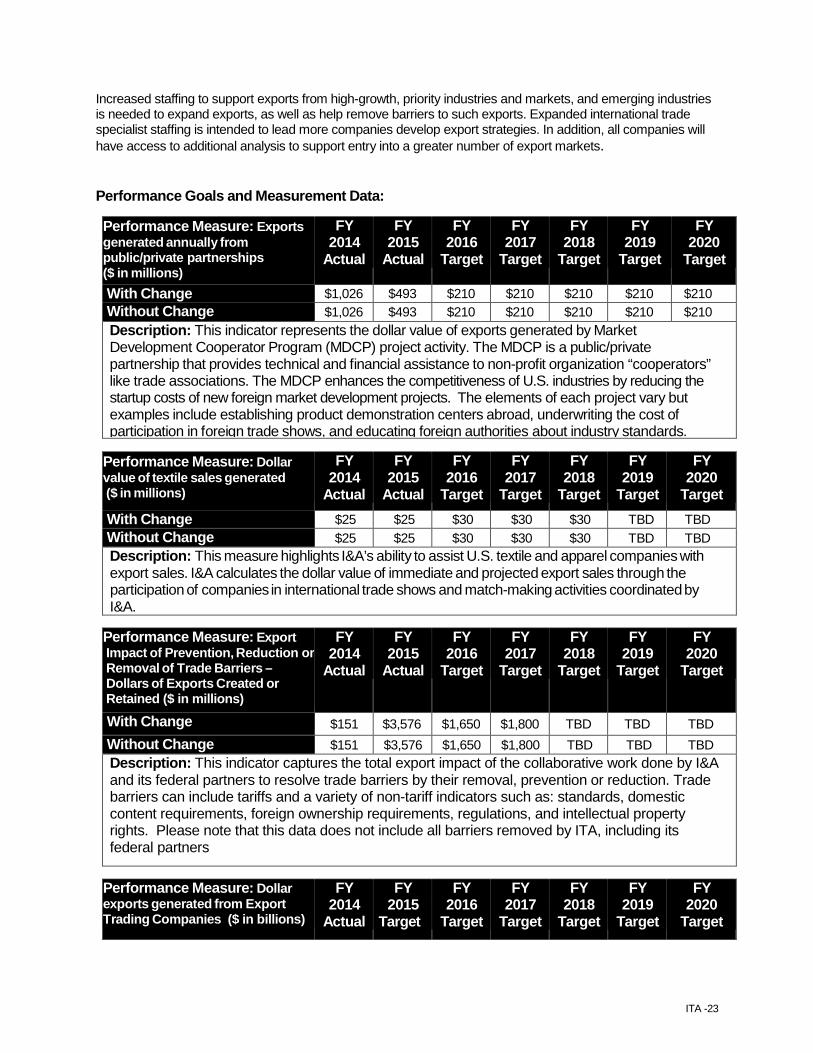
With Change $1,026 $493 $210 $210 $210 $210 $210 Without Change $1,026 $493 $210 $210 $210 $210 $210 Description: This indicator represents the dollar value of exports generated by Market Development Cooperator Program (MDCP) project activity. The MDCP is a public/private partnership that provides technical and financial assistance to non-profit organization “cooperators” like trade associations. The MDCP enhances the competitiveness of U.S. industries by reducing the startup costs of new foreign market development projects. The elements of each project vary but examples include establishing product demonstration centers abroad, underwriting the cost of participation in foreign trade shows, and educating foreign authorities about industry standards.
Performance Measure: Dollar value of textile sales generated ($ in millions)
FY 2014
Actual
FY 2015
Actual
FY 2016
Target
FY 2017
Target
FY 2018
Target
FY 2019
Target
FY 2020
Target With Change $25 $25 $30 $30 $30 TBD TBD Without Change $25 $25 $30 $30 $30 TBD TBD Description: This measure highlights I&A’s ability to assist U.S. textile and apparel companies with export sales. I&A calculates the dollar value of immediate and projected export sales through the participation of companies in international trade shows and match-making activities coordinated by I&A.
Performance Measure: Export Impact of Prevention, Reduction or Removal of Trade Barriers – Dollars of Exports Created or Retained ($ in millions)
FY 2014
Actual
FY 2015
Actual
FY 2016
Target
FY 2017
Target
FY 2018
Target
FY 2019
Target
FY 2020
Target
With Change $151 $3,576 $1,650 $1,800 TBD TBD TBD Without Change $151 $3,576 $1,650 $1,800 TBD TBD TBD Description: This indicator captures the total export impact of the collaborative work done by I&A and its federal partners to resolve trade barriers by their removal, prevention or reduction. Trade barriers can include tariffs and a variety of non-tariff indicators such as: standards, domestic content requirements, foreign ownership requirements, regulations, and intellectual property rights. Please note that this data does not include all barriers removed by ITA, including its federal partners
Performance Measure: Dollar exports generated from Export Trading Companies ($ in billions)
FY 2014
Actual
FY 2015
Target
FY 2016
Target
FY 2017
Target
FY 2018
Target
FY 2019
Target
FY 2020
Target
ITA -24
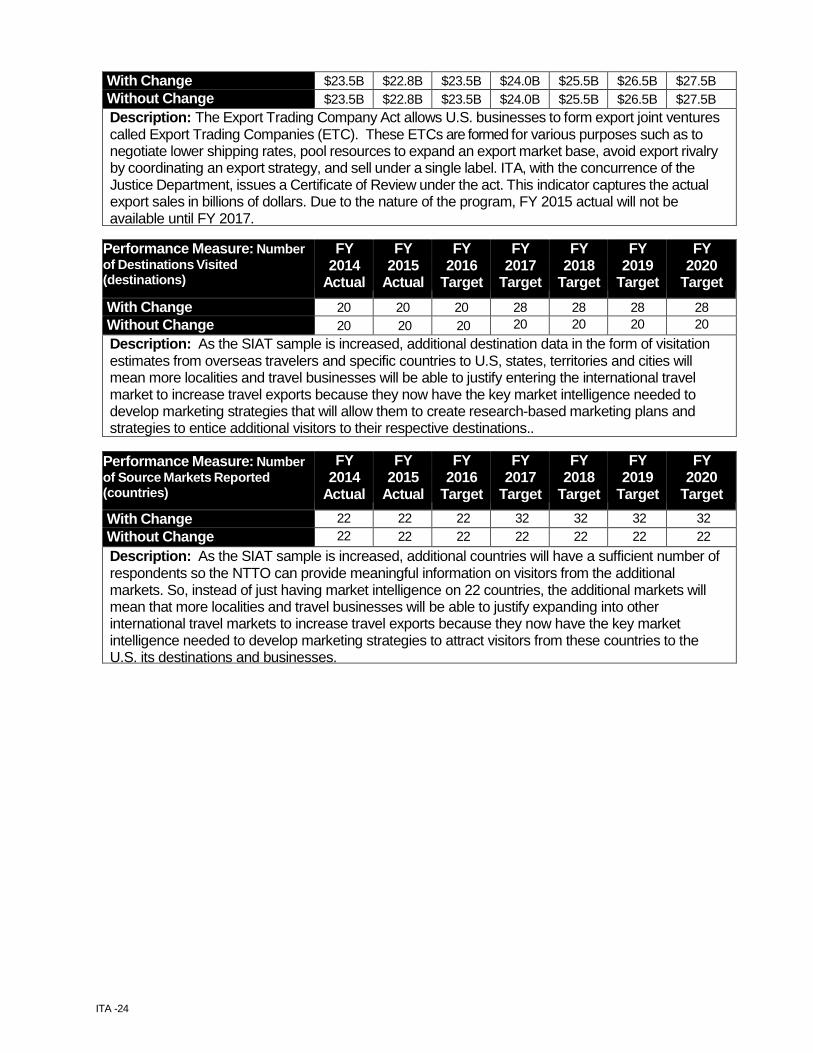
With Change $23.5B $22.8B $23.5B $24.0B $25.5B $26.5B $27.5B Without Change $23.5B $22.8B $23.5B $24.0B $25.5B $26.5B $27.5B Description: The Export Trading Company Act allows U.S. businesses to form export joint ventures called Export Trading Companies (ETC). These ETCs are formed for various purposes such as to negotiate lower shipping rates, pool resources to expand an export market base, avoid export rivalry by coordinating an export strategy, and sell under a single label. ITA, with the concurrence of the Justice Department, issues a Certificate of Review under the act. This indicator captures the actual export sales in billions of dollars. Due to the nature of the program, FY 2015 actual will not be available until FY 2017.
Performance Measure: Number of Destinations Visited (destinations)
FY 2014
Actual
FY 2015
Actual
FY 2016
Target
FY 2017
Target
FY 2018
Target
FY 2019
Target
FY 2020
Target With Change 20 20 20 28 28 28 28 Without Change 20 20 20 20 20 20 20 Description: As the SIAT sample is increased, additional destination data in the form of visitation estimates from overseas travelers and specific countries to U.S, states, territories and cities will mean more localities and travel businesses will be able to justify entering the international travel market to increase travel exports because they now have the key market intelligence needed to develop marketing strategies that will allow them to create research-based marketing plans and strategies to entice additional visitors to their respective destinations..
Performance Measure: Number of Source Markets Reported (countries)
FY 2014
Actual
FY 2015
Actual
FY 2016
Target
FY 2017
Target
FY 2018
Target
FY 2019
Target
FY 2020
Target With Change 22 22 22 32 32 32 32 Without Change 22 22 22 22 22 22 22 Description: As the SIAT sample is increased, additional countries will have a sufficient number of respondents so the NTTO can provide meaningful information on visitors from the additional markets. So, instead of just having market intelligence on 22 countries, the additional markets will mean that more localities and travel businesses will be able to justify expanding into other international travel markets to increase travel exports because they now have the key market intelligence needed to develop marketing strategies to attract visitors from these countries to the U.S. its destinations and businesses.

ITA -25
Exhibit 14
PROGRAM CHANGE PERSONNEL DETAIL (Dollars in thousands)
Budget Program: Industry and Analysis Sub-program: Industry and Analysis Program Change: Export Expansion and Investment
Number Annual TotalTitle: Location Grade of Positions Salary Salaries
International Trade Specialist Washington, D.C. GS-14 1 116,154$ 116,154$ International Trade Specialist Washington, D.C. GS-13 2 98,294$ 196,588$ International Trade Specialist Washington, D.C. GS-12 1 82,664$ 82,664$ International Trade Specialist Washington, D.C. GS-11 1 68,965$ 68,965$ International Trade Specialist Washington, D.C. GS-9 1 59,689$ 59,689$
Subtotal 6 524,060$ Less Lapse 25% (2) (131,015)$ Total Full-time permanent: 4 393,045$ 2016 Pay Adjustment 1.3% 5,110$ 2017 Pay Adjustment 1.6% 6,370$ Subtotal 4 404,525$
Total 404,525$
Personnel Data
Full-time Equivalent EmploymentFull-time permanent 4Other than full-time permanent 0Total 4
Authorized Positions:Full-time permanent 6Other than full-time permanent 0Total 6
ITA -26
Exhibit 15
PROGRAM CHANGE DETAIL BY OBJECT CLASS (Dollar amounts in thousands)
Budget Program: Industry and Analysis Sub-program : Industry and Analysis Program Change: Program Support
FY 2017Object Class Increase
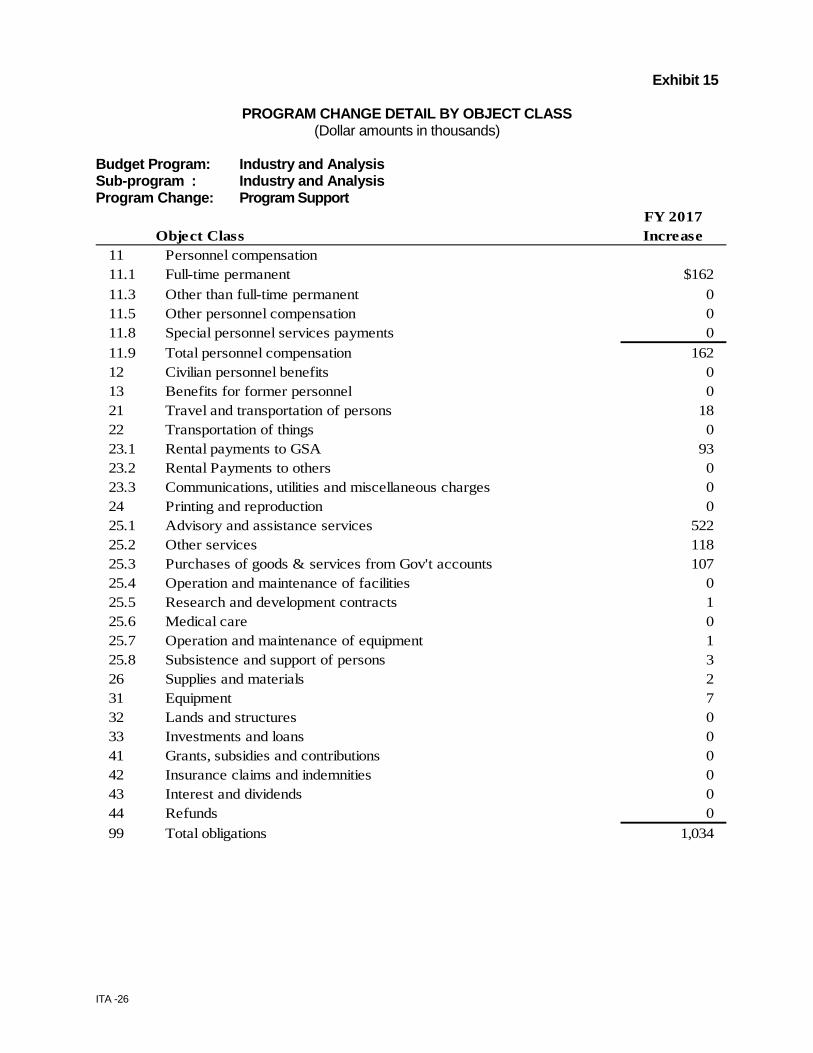
11 Personnel compensation11.1 Full-time permanent $162 11.3 Other than full-time permanent 0 11.5 Other personnel compensation 0 11.8 Special personnel services payments 0 11.9 Total personnel compensation 162 12 Civilian personnel benefits 0 13 Benefits for former personnel 0 21 Travel and transportation of persons 18 22 Transportation of things 0 23.1 Rental payments to GSA 93 23.2 Rental Payments to others 0 23.3 Communications, utilities and miscellaneous charges 0 24 Printing and reproduction 0 25.1 Advisory and assistance services 522 25.2 Other services 118 25.3 Purchases of goods & services from Gov't accounts 107 25.4 Operation and maintenance of facilities 0 25.5 Research and development contracts 1 25.6 Medical care 0 25.7 Operation and maintenance of equipment 1 25.8 Subsistence and support of persons 3 26 Supplies and materials 2 31 Equipment 7 32 Lands and structures 0 33 Investments and loans 0 41 Grants, subsidies and contributions 0 42 Insurance claims and indemnities 0 43 Interest and dividends 0 44 Refunds 0 99 Total obligations 1,034
ITA -27
Exhibit 15
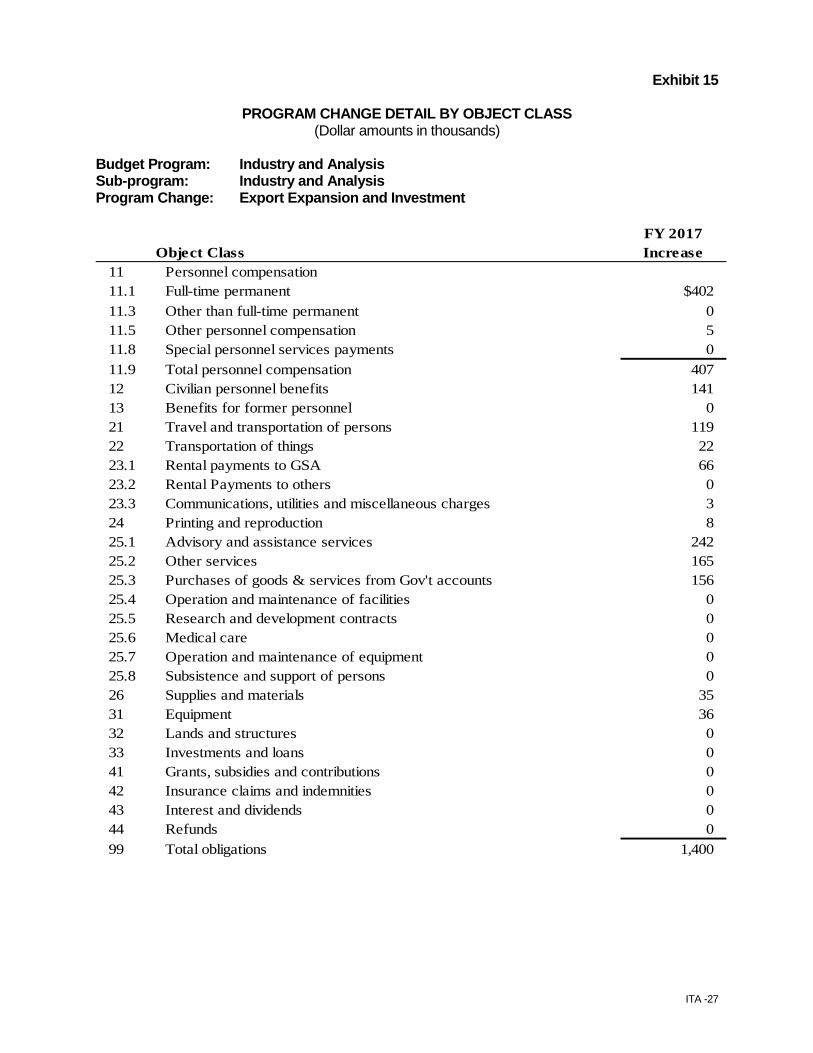
PROGRAM CHANGE DETAIL BY OBJECT CLASS (Dollar amounts in thousands)
Budget Program: Industry and Analysis Sub-program: Industry and Analysis Program Change: Export Expansion and Investment
FY 2017Object Class Increase
11 Personnel compensation11.1 Full-time permanent $402 11.3 Other than full-time permanent 0 11.5 Other personnel compensation 5 11.8 Special personnel services payments 0 11.9 Total personnel compensation 407 12 Civilian personnel benefits 141 13 Benefits for former personnel 0 21 Travel and transportation of persons 119 22 Transportation of things 22 23.1 Rental payments to GSA 66 23.2 Rental Payments to others 0 23.3 Communications, utilities and miscellaneous charges 3 24 Printing and reproduction 8 25.1 Advisory and assistance services 242 25.2 Other services 165 25.3 Purchases of goods & services from Gov't accounts 156 25.4 Operation and maintenance of facilities 0 25.5 Research and development contracts 0 25.6 Medical care 0 25.7 Operation and maintenance of equipment 0 25.8 Subsistence and support of persons 0 26 Supplies and materials 35 31 Equipment 36 32 Lands and structures 0 33 Investments and loans 0 41 Grants, subsidies and contributions 0 42 Insurance claims and indemnities 0 43 Interest and dividends 0 44 Refunds 0 99 Total obligations 1,400

ITA -28
Exhibit 15
PROGRAM CHANGE DETAIL BY OBJECT CLASS (Dollar amounts in thousands)
Budget Program: Industry and Analysis Sub-program: Industry and Analysis Program Change: Expand SIAT Survey
FY 2017Object Class Increase
11 Personnel compensation11.1 Full-time permanent $0 11.3 Other than full-time permanent 0 11.5 Other personnel compensation 0 11.8 Special personnel services payments 0 11.9 Total personnel compensation 0 12 Civilian personnel benefits 0 13 Benefits for former personnel 0 21 Travel and transportation of persons 0 22 Transportation of things 0 23.1 Rental payments to GSA 0 23.2 Rental Payments to others 0 23.3 Communications, utilities and miscellaneous charges 0 24 Printing and reproduction 0 25.1 Advisory and assistance services 2,000 25.2 Other services 0 25.3 Purchases of goods & services from Gov't accounts 0 25.4 Operation and maintenance of facilities 0 25.5 Research and development contracts 0 25.6 Medical care 0 25.7 Operation and maintenance of equipment 0 25.8 Subsistence and support of persons 0 26 Supplies and materials 0 31 Equipment 0 32 Lands and structures 0 33 Investments and loans 0 41 Grants, subsidies and contributions 0 42 Insurance claims and indemnities 0 43 Interest and dividends 0 44 Refunds 0 99 Total obligations 2,000
ITA -29
ITA -30
ITA -31
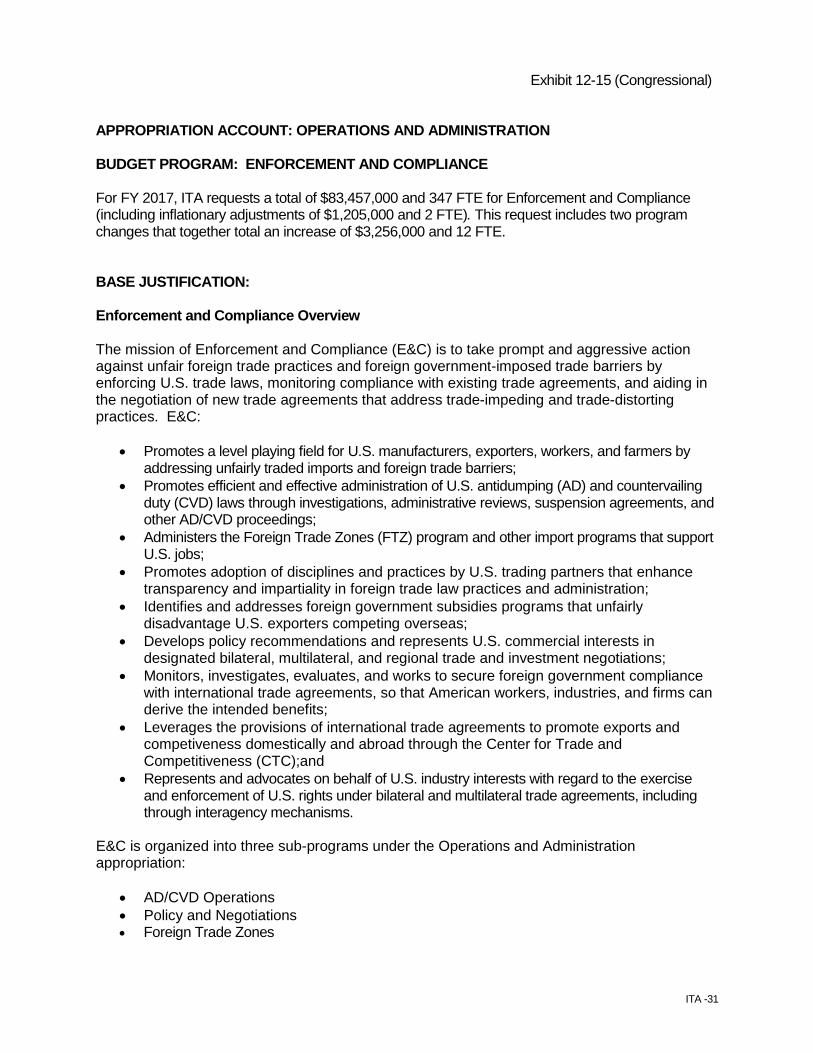
Exhibit 12-15 (Congressional) APPROPRIATION ACCOUNT: OPERATIONS AND ADMINISTRATION BUDGET PROGRAM: ENFORCEMENT AND COMPLIANCE For FY 2017, ITA requests a total of $83,457,000 and 347 FTE for Enforcement and Compliance (including inflationary adjustments of $1,205,000 and 2 FTE). This request includes two program changes that together total an increase of $3,256,000 and 12 FTE. BASE JUSTIFICATION: Enforcement and Compliance Overview The mission of Enforcement and Compliance (E&C) is to take prompt and aggressive action against unfair foreign trade practices and foreign government-imposed trade barriers by enforcing U.S. trade laws, monitoring compliance with existing trade agreements, and aiding in the negotiation of new trade agreements that address trade-impeding and trade-distorting practices. E&C:
• Promotes a level playing field for U.S. manufacturers, exporters, workers, and farmers by addressing unfairly traded imports and foreign trade barriers;
• Promotes efficient and effective administration of U.S. antidumping (AD) and countervailing duty (CVD) laws through investigations, administrative reviews, suspension agreements, and other AD/CVD proceedings;
• Administers the Foreign Trade Zones (FTZ) program and other import programs that support U.S. jobs;
• Promotes adoption of disciplines and practices by U.S. trading partners that enhance transparency and impartiality in foreign trade law practices and administration;
• Identifies and addresses foreign government subsidies programs that unfairly disadvantage U.S. exporters competing overseas;
• Develops policy recommendations and represents U.S. commercial interests in designated bilateral, multilateral, and regional trade and investment negotiations;
• Monitors, investigates, evaluates, and works to secure foreign government compliance with international trade agreements, so that American workers, industries, and firms can derive the intended benefits;
• Leverages the provisions of international trade agreements to promote exports and competiveness domestically and abroad through the Center for Trade and Competitiveness (CTC);and
• Represents and advocates on behalf of U.S. industry interests with regard to the exercise and enforcement of U.S. rights under bilateral and multilateral trade agreements, including through interagency mechanisms.
E&C is organized into three sub-programs under the Operations and Administration appropriation:
• AD/CVD Operations • Policy and Negotiations • Foreign Trade Zones
ITA -32
INFLATIONARY ADJUSTMENTS: ITA requests a net increase of 2 FTE and $1.2 million to fund inflationary adjustments. The figure reflects an increase to fund the estimated 2017 Federal pay raise of 1.6 percent as well as inflationary increases for non-labor activities, including service contracts, utilities, the Department of Commerce Working Capital Fund and rent charges from the General Service Administration (GSA). SUB-PROGRAM: AD/CVD OPERATIONS The AD/CVD Operations sub-program vigorously enforces U.S. trade laws by conducting AD/CVD investigations, administrative reviews, new shipper reviews, sunset reviews, changed circumstances reviews, and scope and anti-circumvention inquiries within statutory and/or regulatory time limits. AD/CVD Operations also assists in the defense of E&C determinations, all of which are subject to judicial review in U.S. courts and before WTO and NAFTA Panels. E&C conducts investigations under the AD/CVD laws in response to U.S. industry petitions alleging that imports are being dumped or unfairly subsidized and that those imports are materially injuring, or threatening material injury to, the competing U.S. industry. These investigations vary widely in scope and complexity; each investigation requires:
• Intensive analysis of information provided by the petitioning U.S. industry to determine whether the legal standards for the initiation of an investigation have been satisfied;
• Preparation of extensive questionnaires sent to the relevant foreign governments and/or industry, requesting detailed (and, in most instances, proprietary) information about foreign government subsidy programs and the distribution of benefits, or individual firms pricing and selling practices, corporate structures, affiliations, and production costs;
• Analysis of responses to the questionnaires and on-site verification of such responses in the foreign country at the relevant national, provincial, and local government sites or company offices and, when appropriate, at U.S. affiliate offices and production facilities;
• Calculation of subsidy rates or dumping margins and duty deposit rates; • Preparation of preliminary and final determinations, including detailed analyses of the
information obtained in the investigation and the arguments submitted by the U.S. industry and the affected foreign parties; and,
• Preparation of detailed instructions so that Customs and Border Protection (CBP) can implement and enforce the Commerce Department’s determinations.
E&C performs many of the same steps when it conducts administrative reviews of the AD/CVD orders that result from its investigations. Whereas investigations (1) determine whether imports are being dumped or unfairly subsidized, and (2) estimate the levels of dumping and unfair subsidization, administrative reviews determine the actual amount of duties to be collected to remedy those unfair practices. E&C routinely receives significantly more requests for review of individual exporters than its available resources permit it to conduct. Increased concerns about evasion of AD/CVD duties, and efforts undertaken to detect and stop such practices place additional demands on E&C resources. E&C also conducts several other types of reviews of outstanding AD/CVD orders as required by U.S. law and our international obligations, including “new shipper” reviews for exporters that begin shipping to the United States after an AD/CVD order is imposed; periodic “sunset reviews” to determine whether AD/CVD orders should remain in place; and, scope and circumvention inquiries to determine whether particular imported products are covered by outstanding AD/CVD orders. Some importers are increasingly resorting to illegal or inappropriate behavior to avoid or minimize the payment of AD/CVD duties. For example, some importers misreport the country of origin of products
ITA -33
subject to AD/CVD orders or establish shell companies to import at lower duties. E&C is elevating its efforts to counter such activities by working collaboratively with CBP, the Department of Justice, and other federal agencies to identify and address fraudulent activity, in some cases leading to fines, felony indictments, and imprisonment of offending parties.
In FY 2015, 384 preliminary or final AD/CVD determinations were issued. The number of new investigations has increased steadily over the past several years. New investigations increased from 23 in FY 2012 to 62 in FY 2015. Moreover, the average number of AD/CVD determinations issued during this four-year period was approximately 362 per fiscal year. SUB-PROGRAM: POLICY AND NEGOTIATIONS The Policy and Negotiations sub-program oversees a variety of activities and policies regarding the negotiation of trade disciplines in international agreements, the administration of the AD/CVD laws and international subsidies disciplines, the negotiation and administration of suspension agreements of U.S. AD/CVD investigations, as well as the improvement of access to export markets for U.S. companies facing a range of foreign government practices and barriers that are inconsistent with international trade rules and agreements. The major activities conducted by E&C under this sub-program include support for the administration of U.S. AD/CVD laws, including policy support and accounting expertise, as well as negotiation and administration of AD/CVD suspension agreements and other bilateral agreements; negotiation of trade disciplines in international agreements (including rules on trade remedies, technical barriers to trade, customs/trade facilitation, investment, subsidies, government procurement, competition/state-owned enterprises, environment, labor and other areas of particular expertise in negotiations) such as the Trans-Pacific Partnership (TPP), Transatlantic Trade and Investment Partnership (TTIP), Bilateral Investment Treaties (BITs) and initiatives in the World Trade Organization (WTO); outreach and assistance to U.S. industries and workers (especially small and medium-sized enterprises (SMEs) seeking to use U.S. AD/CVD laws to remedy injury from unfairly traded imports; outreach and assistance to U.S. companies or industries confronting foreign government trade actions or barriers that block or impede U.S. exports or investment, including barriers that are governed by trade agreement obligations vis-à-vis the United States; and, leading the Center for Trade and Competitiveness (CTC). These and similar activities are outlined in greater detail below. Enforcement of U.S. AD/CVD Laws
• Policy Support for AD/CVD Cases. E&C has staff dedicated to the consistent application of policies and procedures in AD/CVD proceedings, while ensuring that broader policy objectives and statutory and international obligations are respected. This staff strives to achieve consistency by reviewing case determinations, and developing new policies for major or emerging issues. E&C policy staff is responsible for analyzing and informing case investigators and decision makers of the potential ramifications on AD/CVD proceedings posed by developments in the WTO and its associated agreements. This staff also supports the Office of the General Counsel in reviewing decisions made by the Court of International Trade, the Court of Appeals for the Federal Circuit, WTO dispute settlement panels, and the WTO Appellate Body in addition to providing analytical support in drafting response briefs and argument in proceedings before such bodies.
• Accounting Expertise. Accounting staff work alongside investigators in vigorously enforcing
U.S. AD/CVD laws. While the main areas of expertise are cost of production, constructed value, and factors of production calculations, the accounting staff are also actively involved in
ITA -34
analyzing scope and circumvention inquiries, enforcing trade agreements, providing support to U.S. companies in defense of foreign trade remedy investigations, and addressing other technical accounting-related issues that arise throughout E&C. In FY 2014, the accounting staff worked on over 140 AD investigations and reviews.
• Bilateral AD/CVD Agreements. E&C is responsible for the negotiation and administration of AD and CVD suspension agreements and other bilateral agreements. E&C also administers various existing suspension agreements with Russia, Ukraine, Mexico, and Argentina, covering products such as steel, uranium, sugar, tomatoes, and lemon juice. Administering these agreements includes such responsibilities as calculating and monitoring export limits and reference prices and calculating normal values, or “minimum prices,” for signatory producers/exporters. This staff also conducts five-year sunset reviews of these suspension agreements and any requested administrative reviews.
Trade Negotiations & Agreement Implementation. E&C leads the negotiating efforts relating to WTO AD rules and works closely with the Office of the United States Trade Representative (USTR) on negotiations relating to a broad range of issues such as subsidies and countervailing measures, including fish subsidies, technical barriers to trade, sanitary and phytosanitary measures, regulatory coherence, customs and trade facilitation, import licensing, government procurement, anti-corruption, investment, competition, environment, and labor. In addition, E&C assists USTR and the Department of State in the negotiation of bilateral investment treaties and FTA investment chapters. E&C also actively supports implementation of WTO and FTA trade and investment agreements, including through participating in the relevant WTO or FTA Committees and other bilateral or regional policy dialogues covering these agreement provisions. E&C is also actively involved in regional and bilateral trade negotiations such as the Trans-Pacific Partnership Agreement and the Transatlantic Trade and Investment Partnership. In these negotiations, E&C staff help strengthen the trade and investment “rules of the road” so that U.S. exporters and investors face a more level playing field in international trade. E&C experts offer technical knowledge and detailed expertise regarding both the strengths and weaknesses of existing international trade and investment rules and implementation of agreement provisions in order to achieve more effective agreements and enhanced market access. Outreach and Petition Counseling. E&C staff conducts outreach to U.S. businesses, workers, and trade associations to raise awareness of trade remedy laws and of ITA resources available to address foreign government-imposed barriers to trade. E&C experts, using knowledge in trade remedy petitions and cases as well as international trade agreement obligations, counsel U.S. companies, industries, and workers that express interest in seeking relief from unfairly traded imports or barriers to foreign market access. Staff members assist clients in drafting petitions through providing guidance documents, reviewing draft petitions, investigating trade barrier complaints, and maintaining a website and hotline designed to educate the public about trade remedy laws and international trade agreements. E&C continues to expand outreach efforts to U.S. industries and workers, particularly SMEs that may be unfamiliar with the remedies and rights available under trade laws or international trade agreements and who may be unable to afford legal or other appropriate assistance. In FY 2015, 755 petition counseling sessions were conducted with a wide variety of firms. In the same period, more than 35 trade barrier cases involving international trade agreements were initiated.
ITA -35
Enforcement Efforts to Address Foreign Trade Barriers and Unfair Trade Practices • Trade Agreements Compliance Program. E&C works closely with other ITA programs to monitor
foreign government implementation of international trade agreements signed with the United States to identify compliance problems. Working directly with U.S. businesses and trade associations, other DOC units and U.S. embassies, E&C investigates potential failures by foreign governments to implement and adhere fully to trade agreements. Once a foreign government-imposed trade barrier is identified, a case is initiated and a team of experts is formed to reduce or eliminate the barrier, thus opening markets and reinstating the benefit of the trade agreement for American workers and firms. In FY 2015, E&C initiated 62 new trade agreement compliance investigations, and concluded 56. E&C also works with the USTR Monitoring and Enforcement Unit, which includes representing ITA on USTR task forces, to prioritize potential dispute settlement issues for interagency consideration and to develop cases for formal dispute settlement through the WTO, free trade agreement, or other dispute resolution mechanisms. E&C works with other ITA units to monitor whether existing agreement obligations are sufficient to open foreign markets or to ensure the anticipated U.S. industry access to these markets.
• Subsidies Enforcement. E&C staff implement an active subsidies enforcement program that
provides monitoring, analysis, counseling, and advocacy services to U.S. parties harmed by unfair foreign government subsidization and related practices. As directed by law, these activities involve: (1) coordinating U.S. CVD and multilateral subsidies enforcement efforts; (2) assisting the private sector by monitoring and identifying foreign subsidies that can be remedied under U.S. law and the WTO Subsidies Agreement; and (3) producing an annual report to Congress on subsidy monitoring and enforcement activities. The subsidies enforcement staff has identified, and is currently evaluating, 1,300 foreign subsidies and government support practices, the largest portion of which relate to China. This staff works closely with USTR to coordinate the U.S. Government’s response to foreign CVD investigations brought against U.S. exports, involving outreach to all relevant federal, state and local government agencies that administer alleged U.S. subsidy programs.
• Foreign Trade Remedy Compliance. E&C tracks country use of trade remedies, including AD
and safeguard laws, and provides assistance to U.S. companies facing potential obstacles in accessing export markets due to foreign trade remedy cases. E&C works with many U.S. companies targeted by trade remedy actions, including engaging the foreign governments when circumstances warrant and, if necessary, assisting USTR in addressing such problems at the WTO. Since 2001, over 160 companies employing over 1.6 million U.S. workers have been assisted by E&C in such cases. These advocacy efforts helped bring about the successful termination of 22 of these types of measures in FY 2015, keeping open over $110 million in U.S. export markets.
• Center for Trade and Competiveness (CTC). ITA has always played a leading role in securing
foreign government implementation of, and compliance with, the negotiated terms of U.S. international trade agreements. As the United States looks forward to implementing the Trans-Pacific Partnership and negotiating further 21st century trade agreements, ITA aims to expand and deepen its historical “trade compliance” strategy to help ensure that U.S. companies are able to tap the full market access potential of such agreements. Therefore, building upon ITA’s longstanding trade enforcement and compliance work, the Department established a new center housed within ITA’s office of Enforcement and Compliance with the dedicated mission of leveraging the provisions of international trade agreements to promote exports and competitiveness at home and abroad. The CTC provides the additional resources necessary to strategically and proactively identify and quantify trade barriers and compliance problems so that they can be addressed as quickly as possible using all available tools and approaches. The
ITA -36
Center also serves as a first-ever body charged with coordinating across the Department’s policy and technical/scientific bureaus (PTO, NOAA, and Census) to ensure that the United States’ multilateral, regional, and bilateral agreements are performing optimally and delivering their maximum benefit for U.S. industry.
The Center’s core mission is to make better, more coordinated use of the unique and unmatched capabilities of ITA and Commerce’s other bureaus to better assist U.S. industry as it looks to fully utilize new trade agreements and to achieve and maintain access to foreign markets. The Center includes an expert team with specialized language, economic and technical expertise in non-tariff barrier disciplines, along with strategically located regional compliance attaches dedicated exclusively to identifying and resolving enforcement and compliance problems. The Center also focuses on leveraging Commerce’s technical and policy expertise, along with its unrivaled connections to industry stakeholders, to more effectively assist U.S. exporters to make full use of the opportunities promised through the United States’ trade agreements program. The Center and ITA will continue to support interagency efforts to enhance enforcement of U.S. trade rights and domestic trade laws.
• Steel Import Monitoring and Analysis. E&C administers the Steel Import Monitoring and Analysis
(SIMA) program, a web-based steel import licensing and monitoring program that provides both government officials and the public with the earliest accurate information regarding imports of all basic steel mill products. As of December 1, 2015, about 4 million import licenses have been issued by E&C’s web-based system since its inception in March 2003.
SUB-PROGRAM: FOREIGN-TRADE ZONES The Foreign Trade Zones (FTZ) sub-program helps to encourage commercial activity at U.S. facilities in competition with foreign alternatives by allowing delayed or reduced duty payments on foreign merchandise, as well as other savings. FTZs help to reduce production, transaction, and logistics-related costs by lowering effective duty rates, allowing special entry procedures, and encouraging activity closer to market. Reducing costs through FTZ use can lead to more competitive U.S. operations, thereby helping to maintain U.S. commercial presence and jobs. E&C’s FTZ staff serves as the operational arm of the FTZ Board, an interagency body chaired by the Secretary of Commerce. The Board was established to license (through grants of authority) and regulate foreign trade zones under the FTZ Act of 1934 (19 USC 81) and the Board's regulations (15 CFR 400). The FTZ Board licenses public or public-type corporations to administer zones on a local level. Private corporations generally operate the zones under agreement with licensees. Each zone must publish a rate schedule and provide equal access to all companies seeking to use the zone. States and local communities use zones as an element of their economic development efforts. As of the end of 2014, there were over 250 zones that sponsor more than 1,000 single-user FTZ locations in the United States. In 2014, employment in U.S. foreign-trade zones and subzones exceeded 400,000 persons. The volume of exports leaving U.S. foreign-trade zones amounted to over $99 billion in 2014. FTZ Board action in FY 2015 included approvals for three new zone projects and 23 expansions or reorganizations of existing zones, as well as decisions on 54 requests for manufacturing authority within zones. Under delegated authority, the FTZ Board staff processed an additional 169 requests – primarily requests for site designations for individual companies. In reviewing new manufacturing applications in zones and subzones in terms of the public interest, the Board evaluates the net economic effect of the proposed operation, considering such factors as public policy, import
ITA -37
penetration, export development, employment impact, and impact on domestic industry. In addition, the FTZ Act requires the FTZ Board to submit a report annually to Congress. The annual report provides information on the use of the program and summarizes FTZ operations for that year. E&C compiles information for the report directly from each zone through a web-based filing system. E&C monitors ongoing FTZ activity for compliance with applicable scope and FTZ Board grant restrictions. E&C is also involved in outreach to local communities to enhance awareness and understanding of the FTZ program as a tool in local economic development. PROGRAM CHANGES FOR FY 2017: Program Support (Base Funding: $80.0 million and 335 FTE; Program Change: $1.3 million and 0 FTE): ITA requests $1,256,000 in order to sustain program capabilities in E&C. Through investments in personnel and non-personnel support costs, this increase provides day-to-day resources to maintain mission and operational excellences within ITA. FTE levels would not be affected by this change. Strengthening ITA’s Enforcement & Compliance (E&C) Programs (Base Funding: $80.0 million and 335 FTE; Program Change: +$2.0 million and +12 FTE): With the goal of maximizing domestic competitiveness, E&C takes prompt and effective action against foreign unfair trade practices that harm, or threaten harm to, U.S. industries and workers. ITA requests an increase of $2,000,000 and 12 FTE to annualize the increased funding and additional staff hired in FY 2016 as a result of an appropriation funding these new staff. The FY 2017 increase will ensure the sustainment of this additional staffing. Under U.S law and our international obligations, where possible we are expected to investigate companies accounting for 100 percent of imports of merchandise subject to each investigation, or 100 percent of companies for which an administrative review is requested. At current staffing levels, E&C almost always lacks the resources to examine all exporters in a given investigation or review. As so far allowed under U.S. law, E&C typically individually examines no more than two companies per case, even in cases where there are hundreds of foreign companies subject to the proceeding. Increasingly, the U.S. industries seeking effective relief from unfair trade under the U.S. AD/CVD laws have expressed concern over the Department’s resource constraints in this regard. In addition, there have been a number of recent adverse court rulings that stem from the Department’s inability to investigate more than one or two companies in AD/CVD cases. E&C issues, on average, nearly 400 AD/CVD determinations every year. Each determination results from a complex, quasi-judicial proceeding lasting from 9 to 18 months pursuant to strict statutory deadlines. These determinations involve in-depth investigation/examination of detailed corporate sales and production information, accounting records, and other operating information submitted by foreign companies and/or governments. The number and complexity of E&C’s AD/CVD cases have increased dramatically, while staff resources have decreased from a high of 123 AD/CVD Analysts in FY 2011 to 116 by the end of FY 2015. By the beginning of February FY 2016, E&C has already initiated 18 new AD/CVD cases. By comparison, over the same period in 2015, E&C initiated only 8 AD/CVD cases. As most AD/CVD investigations result in AD/CVD orders, the number of AD/CVD orders subject to administrative review will continue to grow, adding to the baseload of proceedings for which E&C is responsible. Currently, our AD/CVD case teams made up of analysts, accountants, economists and attorneys, are stretched to the limits of capacity. The predicted increased case load creates an urgent need for additional staffing, which ITA is putting in place during FY 2016.
ITA -38
The average AD/CVD case analyst works on five to eight cases at a time, more than double the optimal number from past years of two to three. In 2015, E&C Operations received and examined each month, on average over 200,000 pages of filings from parties in AD/CVD proceedings. This figure is up almost 15 percent from the prior year and is expected to climb significantly as new cases are filed and our base load of AD and CVD orders continues to grow. As a result, our AD/CVD case analysts are often completely consumed with meeting process and statutory/regulatory deadline requirements at the expense of engaging in probing and comprehensive analyses of the unfair trade allegations, further constraining E&C’s enforcement efforts. Similarly, each AD/CVD policy analyst is, on average, advising on policy issues in up to 50 cases at a time, a significant increase from historical rates about 25 cases at a given time. Our accounting staff has seen a similar increase in its work load. In addition to increasing the number of AD/CVD case analysts, E&C also requires in-house expertise to examine critically and address properly the many complex case-related issues that arise in the course of AD/CVD law administration that require technical product- and industry-specific evaluation. E&C currently administers over 300 AD and CVD orders covering a wide range of products from over 36 countries. Approximately 40 percent of these orders deal with steel sector products, including various pipe and tube products, flat steel, and long products. Additionally, over 22 percent of E&C’s AD/CVD orders cover chemical products (including rubber and plastics), 15 percent deal with other metals and articles made of metal, nearly eight percent involve agricultural/foodstuff products, and approximately five percent cover paper products (although recently that percentage has continued to increase). Further, recent cases cover complex products related to the solar cell industry. Vigorous enforcement of the AD/CVD laws requires E&C case analysts, policy analysts and accountants to quickly come up to speed on an array of product information regarding manufacturing processes, product grade and technical specifications, and distribution and selling practices in the industries under examination. Although parties to AD/CVD proceedings are required to provide much of this information as part of the investigatory/review process conducted by E&C, their reporting of the information is understandably presented in a manner that best supports their particular interests. This can impede E&C’s efforts to reach objective and legally-defensible determinations in trade remedy cases and, in some instances, it can jeopardize the defensibility of determinations that are challenged in courts if the product and sector information underpinning AD/CVD determinations is incomplete or imperfect. The lack of in-house expertise involving products most often subject to investigation/review, e.g., steel, chemical, metals, agricultural, and paper products, can also hamper E&C’s work with the Department of Homeland Security’s Customs and Border Protection (CBP) to identify and thwart evasion and circumvention of remedial duties imposed upon importation of covered merchandise into the United States. New AD/CVD case analysts, supported by additional policy analysts, accountants and attorneys, would function as experts in the steel, chemical industry, metals, agriculture, and forestry/paper products industries and would work hands-on in the most complicated cases.
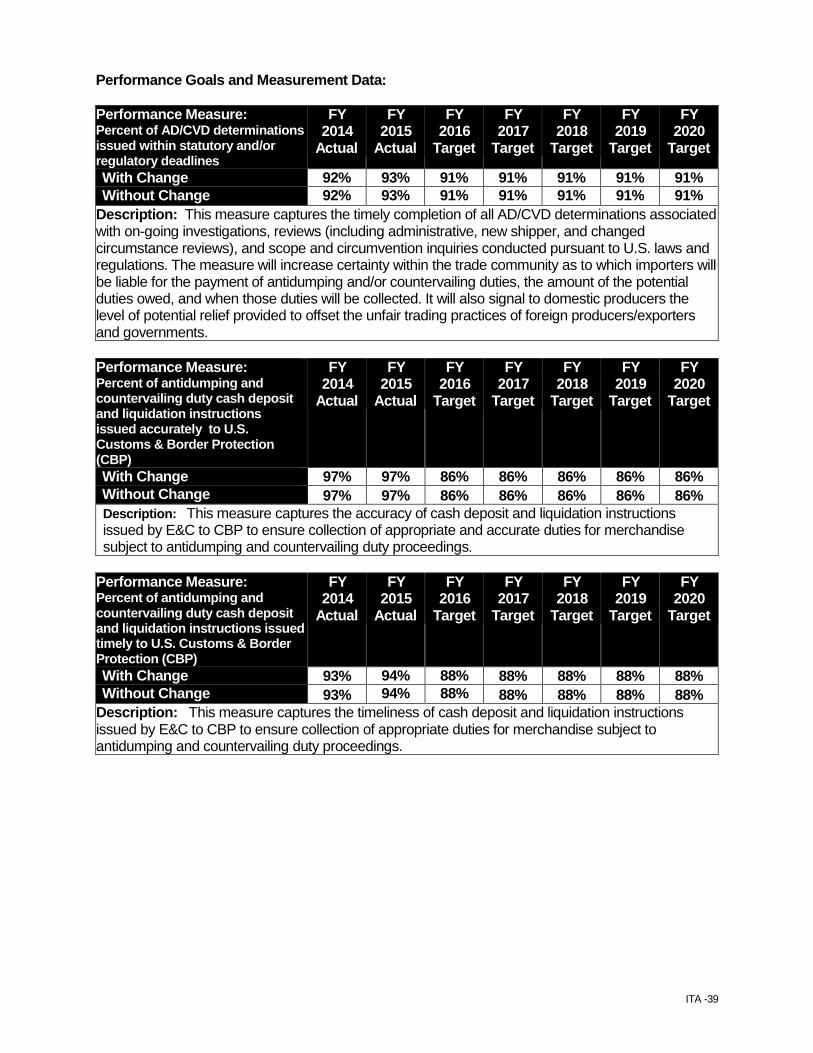
ITA -39
Performance Goals and Measurement Data: Performance Measure: Percent of AD/CVD determinations issued within statutory and/or regulatory deadlines
FY 2014
Actual
FY 2015
Actual
FY 2016
Target
FY 2017
Target
FY 2018
Target
FY 2019
Target
FY 2020
Target
With Change 92% 93% 91% 91% 91% 91% 91% Without Change 92% 93% 91% 91% 91% 91% 91%
Description: This measure captures the timely completion of all AD/CVD determinations associated with on-going investigations, reviews (including administrative, new shipper, and changed circumstance reviews), and scope and circumvention inquiries conducted pursuant to U.S. laws and regulations. The measure will increase certainty within the trade community as to which importers will be liable for the payment of antidumping and/or countervailing duties, the amount of the potential duties owed, and when those duties will be collected. It will also signal to domestic producers the level of potential relief provided to offset the unfair trading practices of foreign producers/exporters and governments. Performance Measure: Percent of antidumping and countervailing duty cash deposit and liquidation instructions issued accurately to U.S. Customs & Border Protection (CBP)
FY 2014
Actual
FY 2015
Actual
FY 2016
Target
FY 2017
Target
FY 2018
Target
FY 2019
Target
FY 2020
Target
With Change 97% 97% 86% 86% 86% 86% 86% Without Change 97% 97% 86% 86% 86% 86% 86% Description: This measure captures the accuracy of cash deposit and liquidation instructions issued by E&C to CBP to ensure collection of appropriate and accurate duties for merchandise subject to antidumping and countervailing duty proceedings.
Performance Measure: Percent of antidumping and countervailing duty cash deposit and liquidation instructions issued timely to U.S. Customs & Border Protection (CBP)
FY 2014
Actual
FY 2015
Actual
FY 2016
Target
FY 2017
Target
FY 2018
Target
FY 2019
Target
FY 2020
Target
With Change 93% 94% 88% 88% 88% 88% 88% Without Change 93% 94% 88% 88% 88% 88% 88%
Description: This measure captures the timeliness of cash deposit and liquidation instructions issued by E&C to CBP to ensure collection of appropriate duties for merchandise subject to antidumping and countervailing duty proceedings.
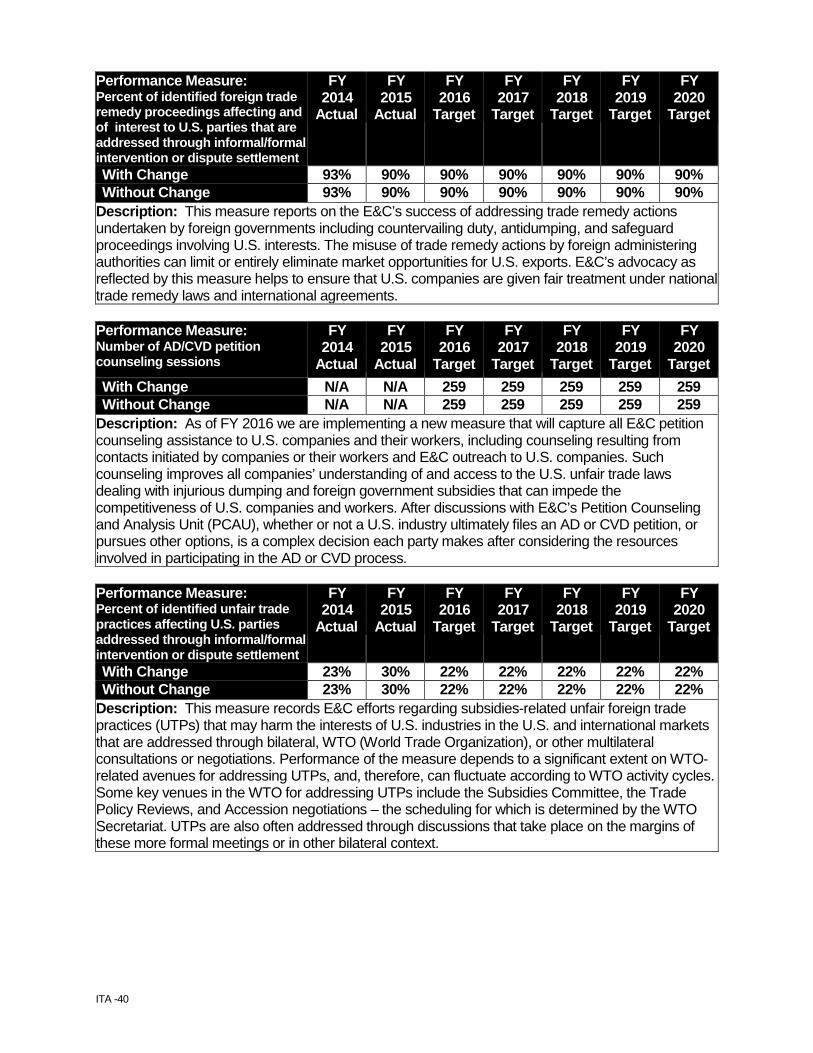
ITA -40
Performance Measure: Percent of identified foreign trade remedy proceedings affecting and of interest to U.S. parties that are addressed through informal/formal intervention or dispute settlement
FY 2014
Actual
FY 2015
Actual
FY 2016
Target
FY 2017
Target
FY 2018
Target
FY 2019
Target
FY 2020
Target
With Change 93% 90% 90% 90% 90% 90% 90% Without Change 93% 90% 90% 90% 90% 90% 90%
Description: This measure reports on the E&C’s success of addressing trade remedy actions undertaken by foreign governments including countervailing duty, antidumping, and safeguard proceedings involving U.S. interests. The misuse of trade remedy actions by foreign administering authorities can limit or entirely eliminate market opportunities for U.S. exports. E&C’s advocacy as reflected by this measure helps to ensure that U.S. companies are given fair treatment under national trade remedy laws and international agreements. Performance Measure: Number of AD/CVD petition counseling sessions
FY 2014
Actual
FY 2015
Actual
FY 2016
Target
FY 2017
Target
FY 2018
Target
FY 2019
Target
FY 2020
Target With Change N/A N/A 259 259 259 259 259 Without Change N/A N/A 259 259 259 259 259
Description: As of FY 2016 we are implementing a new measure that will capture all E&C petition counseling assistance to U.S. companies and their workers, including counseling resulting from contacts initiated by companies or their workers and E&C outreach to U.S. companies. Such counseling improves all companies’ understanding of and access to the U.S. unfair trade laws dealing with injurious dumping and foreign government subsidies that can impede the competitiveness of U.S. companies and workers. After discussions with E&C’s Petition Counseling and Analysis Unit (PCAU), whether or not a U.S. industry ultimately files an AD or CVD petition, or pursues other options, is a complex decision each party makes after considering the resources involved in participating in the AD or CVD process. Performance Measure: Percent of identified unfair trade practices affecting U.S. parties addressed through informal/formal intervention or dispute settlement
FY 2014
Actual
FY 2015
Actual
FY 2016
Target
FY 2017
Target
FY 2018
Target
FY 2019
Target
FY 2020
Target
With Change 23% 30% 22% 22% 22% 22% 22% Without Change 23% 30% 22% 22% 22% 22% 22%
Description: This measure records E&C efforts regarding subsidies-related unfair foreign trade practices (UTPs) that may harm the interests of U.S. industries in the U.S. and international markets that are addressed through bilateral, WTO (World Trade Organization), or other multilateral consultations or negotiations. Performance of the measure depends to a significant extent on WTO-related avenues for addressing UTPs, and, therefore, can fluctuate according to WTO activity cycles. Some key venues in the WTO for addressing UTPs include the Subsidies Committee, the Trade Policy Reviews, and Accession negotiations – the scheduling for which is determined by the WTO Secretariat. UTPs are also often addressed through discussions that take place on the margins of these more formal meetings or in other bilateral context.
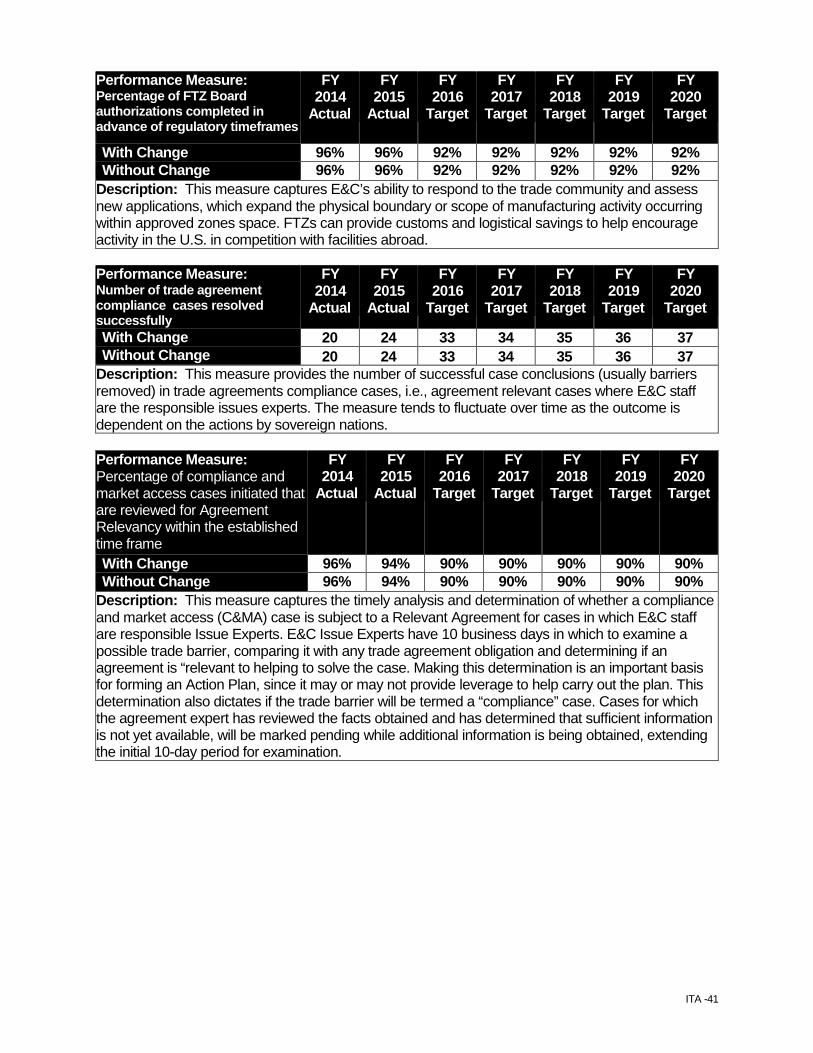
ITA -41
Performance Measure: Percentage of FTZ Board authorizations completed in advance of regulatory timeframes
FY 2014
Actual
FY 2015
Actual
FY 2016
Target
FY 2017
Target
FY 2018
Target
FY 2019
Target
FY 2020
Target
With Change 96% 96% 92% 92% 92% 92% 92% Without Change 96% 96% 92% 92% 92% 92% 92%
Description: This measure captures E&C’s ability to respond to the trade community and assess new applications, which expand the physical boundary or scope of manufacturing activity occurring within approved zones space. FTZs can provide customs and logistical savings to help encourage activity in the U.S. in competition with facilities abroad. Performance Measure: Number of trade agreement compliance cases resolved successfully
FY 2014
Actual
FY 2015
Actual
FY 2016
Target
FY 2017
Target
FY 2018
Target
FY 2019
Target
FY 2020
Target
With Change 20 24 33 34 35 36 37 Without Change 20 24 33 34 35 36 37
Description: This measure provides the number of successful case conclusions (usually barriers removed) in trade agreements compliance cases, i.e., agreement relevant cases where E&C staff are the responsible issues experts. The measure tends to fluctuate over time as the outcome is dependent on the actions by sovereign nations. Performance Measure: Percentage of compliance and market access cases initiated that are reviewed for Agreement Relevancy within the established time frame
FY 2014
Actual
FY 2015
Actual
FY 2016
Target
FY 2017
Target
FY 2018
Target
FY 2019
Target
FY 2020
Target
With Change 96% 94% 90% 90% 90% 90% 90% Without Change 96% 94% 90% 90% 90% 90% 90%
Description: This measure captures the timely analysis and determination of whether a compliance and market access (C&MA) case is subject to a Relevant Agreement for cases in which E&C staff are responsible Issue Experts. E&C Issue Experts have 10 business days in which to examine a possible trade barrier, comparing it with any trade agreement obligation and determining if an agreement is “relevant to helping to solve the case. Making this determination is an important basis for forming an Action Plan, since it may or may not provide leverage to help carry out the plan. This determination also dictates if the trade barrier will be termed a “compliance” case. Cases for which the agreement expert has reviewed the facts obtained and has determined that sufficient information is not yet available, will be marked pending while additional information is being obtained, extending the initial 10-day period for examination.
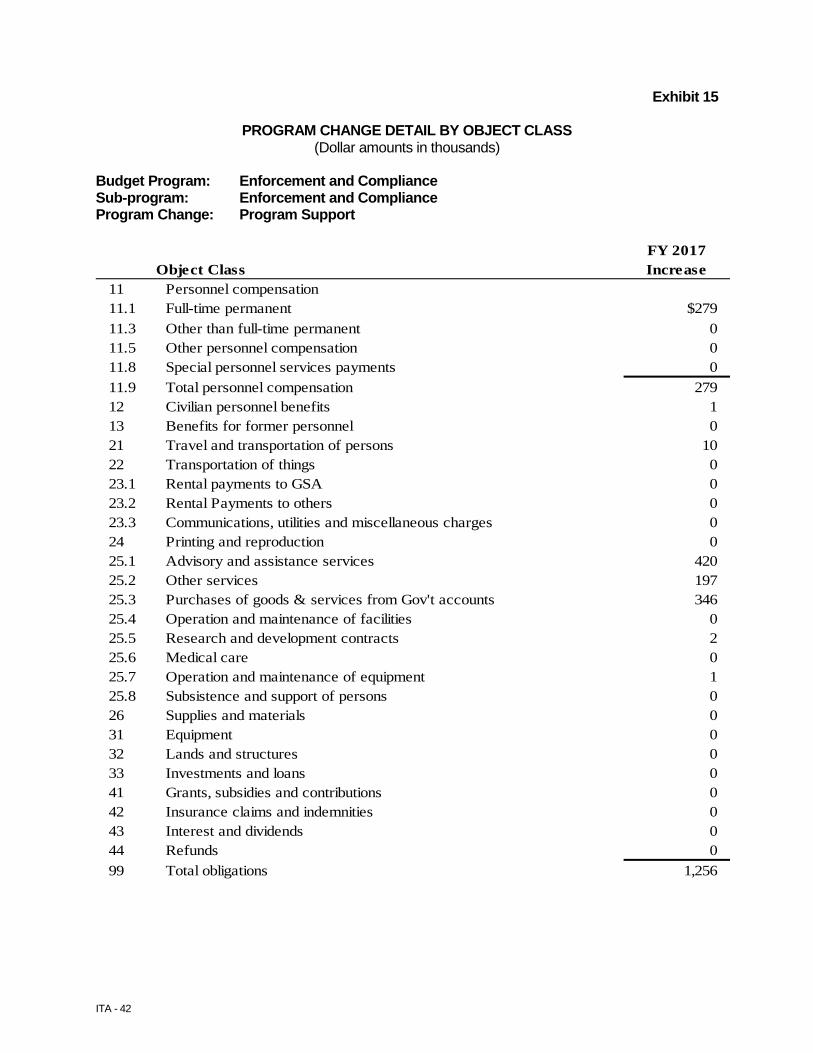
ITA - 42
Exhibit 15
PROGRAM CHANGE DETAIL BY OBJECT CLASS
(Dollar amounts in thousands) Budget Program: Enforcement and Compliance Sub-program: Enforcement and Compliance Program Change: Program Support
FY 2017Object Class Increase
11 Personnel compensation11.1 Full-time permanent $279 11.3 Other than full-time permanent 0 11.5 Other personnel compensation 0 11.8 Special personnel services payments 0 11.9 Total personnel compensation 279 12 Civilian personnel benefits 1 13 Benefits for former personnel 0 21 Travel and transportation of persons 10 22 Transportation of things 0 23.1 Rental payments to GSA 0 23.2 Rental Payments to others 0 23.3 Communications, utilities and miscellaneous charges 0 24 Printing and reproduction 0 25.1 Advisory and assistance services 420 25.2 Other services 197 25.3 Purchases of goods & services from Gov't accounts 346 25.4 Operation and maintenance of facilities 0 25.5 Research and development contracts 2 25.6 Medical care 0 25.7 Operation and maintenance of equipment 1 25.8 Subsistence and support of persons 0 26 Supplies and materials 0 31 Equipment 0 32 Lands and structures 0 33 Investments and loans 0 41 Grants, subsidies and contributions 0 42 Insurance claims and indemnities 0 43 Interest and dividends 0 44 Refunds 0 99 Total obligations 1,256
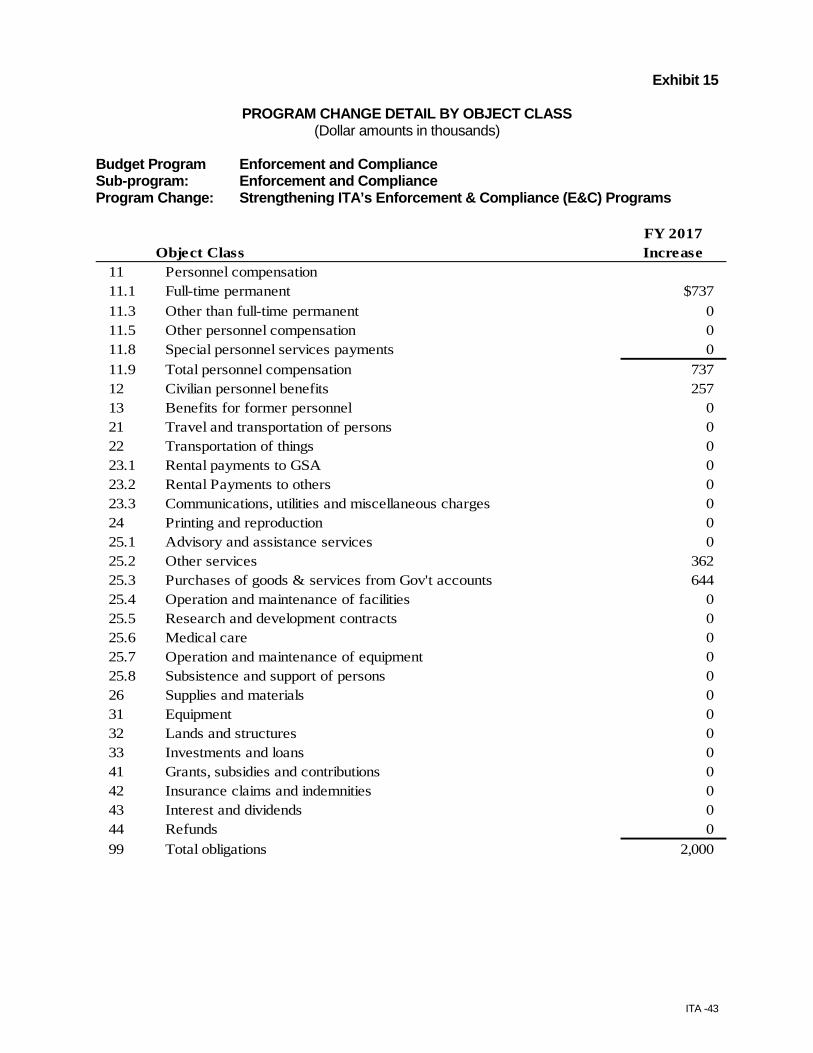
ITA -43
Exhibit 15
PROGRAM CHANGE DETAIL BY OBJECT CLASS (Dollar amounts in thousands)
Budget Program Enforcement and Compliance Sub-program: Enforcement and Compliance Program Change: Strengthening ITA’s Enforcement & Compliance (E&C) Programs
FY 2017Object Class Increase
11 Personnel compensation11.1 Full-time permanent $737 11.3 Other than full-time permanent 0 11.5 Other personnel compensation 0 11.8 Special personnel services payments 0 11.9 Total personnel compensation 737 12 Civilian personnel benefits 257 13 Benefits for former personnel 0 21 Travel and transportation of persons 0 22 Transportation of things 0 23.1 Rental payments to GSA 0 23.2 Rental Payments to others 0 23.3 Communications, utilities and miscellaneous charges 0 24 Printing and reproduction 0 25.1 Advisory and assistance services 0 25.2 Other services 362 25.3 Purchases of goods & services from Gov't accounts 644 25.4 Operation and maintenance of facilities 0 25.5 Research and development contracts 0 25.6 Medical care 0 25.7 Operation and maintenance of equipment 0 25.8 Subsistence and support of persons 0 26 Supplies and materials 0 31 Equipment 0 32 Lands and structures 0 33 Investments and loans 0 41 Grants, subsidies and contributions 0 42 Insurance claims and indemnities 0 43 Interest and dividends 0 44 Refunds 0 99 Total obligations 2,000

ITA - 44
This Page Intentionally Left Blank
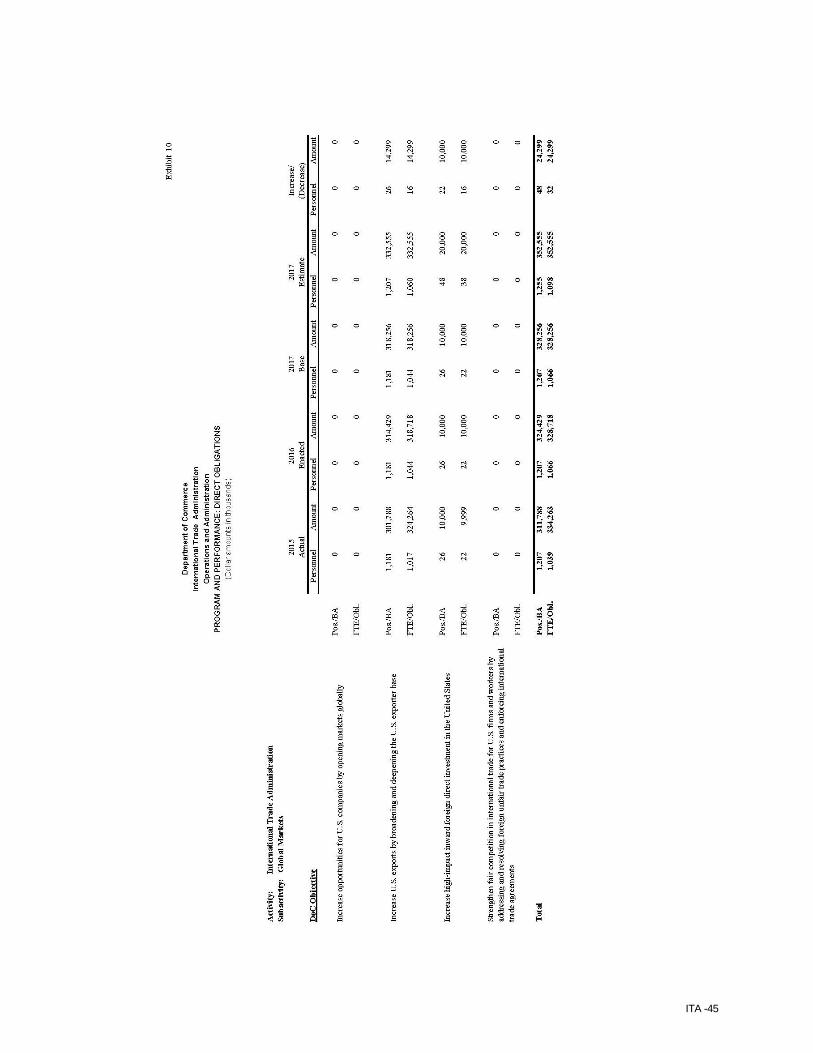
ITA -45
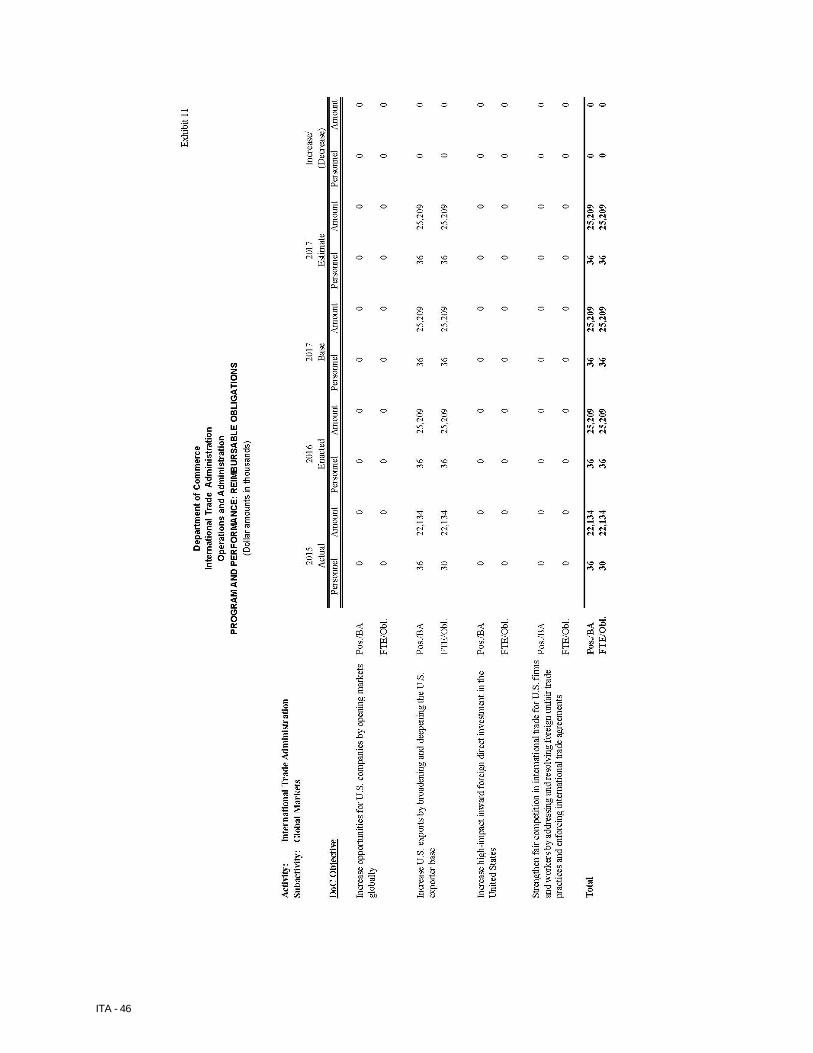
ITA - 46
ITA -47
Exhibit 12-15 (Congressional) APPROPRIATION ACCOUNT: OPERATIONS AND ADMINISTRATION BUDGET PROGRAM: GLOBAL MARKETS For FY 2017, ITA requests a total of $352,555,000 and 1,098 FTE for Global Markets (including inflationary adjustments of $3,827,000 and 0 FTE). This request includes three program changes that together total an increase of $24,299,000 and 32 FTE. BASE JUSTIFICATION: Global Markets Overview Global Markets (GM) assists and advocates for U.S. businesses in international markets to foster U.S. economic prosperity. Utilizing our network of more than 1,500 trade promotion and policy professionals located in over 70 countries and 100 U.S. locations, Global Markets promotes U.S. exports, especially among small and medium-sized enterprises (SMEs); advances and protects U.S. commercial interests overseas; and attracts inward investment into the United States. Global Markets has a federal government presence both across the United States and in countries that represent 91 percent of worldwide GDP1 with impartial and accessible professionals who have specific trade and investment expertise. GM effectively assists U.S. businesses and partners in entering and expanding international markets, addressing barriers to accessing foreign markets, winning foreign government procurements, and attracting inward investment. The roll-out of a new web-based, client relationship management system in FY2015 will further enable professionals across GM to better coordinate assistance for U.S. companies. The Global Markets unit is organized into four sub-programs under the Operations and Administration appropriation:
• International Field • U.S. Field • Advocacy Center • SelectUSA
GM and its sub-programs are focused on achieving the following three strategic objectives: 1) Export Promotion: Connect export-ready U.S. companies, particularly, small- and medium-sized enterprises, to foreign markets and buyers. Contributing Sub-Programs: International Field and U.S. Field U.S. companies, particularly small and medium-sized enterprises (SMEs), continue to list “poor sales” as a top business problem. While foreign markets offer new business opportunities, the majority of U.S. companies do not export and only 8% of those that do sell to more than ten foreign countries.2 Global Markets is the inter-agency leader in connecting foreign buyers and U.S. sellers,
1 USDOC, US Census Bureau, U.S. International Trade in Goods and Services 2 http://www.nfib.com/research-foundation/surveys/small-business-economic-trends
ITA - 48
and seeks to improve coordination and increase effectiveness of all USG inter-agency export promotion efforts through the following objectives:
• Deliver customized international business development solutions that enable U.S. businesses, especially SMEs, to meet exporting objectives.
• Develop innovative service offerings for U.S. businesses that leverage industry, country
and regional expertise.
• Educate U.S. companies and communities on the benefits of exporting. 2) Commercial Diplomacy: Trade Compliance, Market Access, and Advocacy. Contributing Sub-Programs: International Field, U.S. Field, and Advocacy Center U.S. companies can only enter new foreign markets and expand export sales when they have access and can compete on a level playing field. In the past several years, non-tariff barriers and threats to U.S. competiveness, such as foreign government support for domestic industries, business environments that are not conducive to U.S. commercial interests and restrictive legislation, have gradually risen. Purchases by foreign governments are estimated at 15% of total gross national product3, but U.S. firms fail to win all or part of these purchases because procurements may unfairly restrict U.S. company participation. GM addresses these issues through commercial diplomacy which is substantive work on behalf of a U.S. business or industry, or in support of broader national economic and commercial interests, that is directed at foreign authorities and carried out in an official U.S. government capacity. The goal of commercial diplomacy is to try to bring about an official host government action or decision benefiting the U.S. objectives in a market. GM will focus efforts on addressing U.S. business and industry needs directly with foreign governments, as well as advocating for these needs in the interagency community through the following objectives:.
• Remove, reduce, or prevent trade barriers for U.S. businesses to sell abroad.
• Create improvements in market opportunities and provide official U.S. Government Advocacy for U.S. businesses competing for specific international contracts.
• Formulate, guide, and direct the President’s trade policy agenda to help U.S. businesses
sell abroad. 3) Investment Promotion: Expand foreign direct investment into the United States by promoting our country as a prime investment destination. Contributing Sub-Programs: International Field, U.S. Field, and SelectUSA In an era of global capital mobility, the U.S. share of global inward foreign direct investment (FDI) slipped from 30% in 1993 to 19% in 2013.4 FDI plays a vital role in supporting U.S. jobs and helping to bolster U.S. export competitiveness. U.S. subsidiaries of foreign-owned firms accounted for over one-fifth of all U.S. goods exports in 2012. In the same year, they employed nearly 5.8 million U.S. workers. GM’s SelectUSA was established in June 2011 to strengthen federal inward investment promotion efforts. SelectUSA coordinates investment-related resources across more than 20 federal agencies and operates as a partner to state and local economic development efforts to promote the United
3 http://trade.gov/press/publications/newsletters/ita_0506/gpa_0506.asp 4 http://www.ofii.org/docs/FDIUS_2010.pdf

ITA -49
States as the best market for investment in the world and addresses business climate concerns that may impede investment. SelectUSA serves as an information clearinghouse for the global investment community, an ombudsman for investors, and an advocate for U.S. cities, states, tribes, and regions. GM will continue to place increased emphasis on the goal of attracting and retaining foreign investment in the American economy from sources including major mature economies, such as Canada and various countries in Europe, from which the United States currently attracts the bulk of its inward investment. GM will also emphasize attracting investment from emerging markets, such as China and India, where capital for investment is rapidly growing. GM is committed to developing the business processes, tools, and service offerings needed to market the strengths of the United States as a premier investment location. Through SelectUSA, GM will proactively engage the local investment community, provide clear, complete, and consistent information to potential foreign investors, and actively work to address, minimize, or remove unnecessary obstacles to investment. SelectUSA will build its service offerings based on internal and competitor nation best practices, assessment of client needs and client feedback, and market research/industry analysis; ensure that GM IT systems can effectively manage the client base and track the pipeline of investment clients and projects; and leverage partnerships with State Economic Development Organizations as well as federal agencies to ensure seamless coordination of inward direct investment promotion across the United States. INFLATIONARY ADJUSTMENTS: ITA requests a net increase of 0 FTE and $3.8 million to fund inflationary adjustments. The figure reflects an increase to fund the estimated 2017 federal pay raise of 1.6 percent as well as inflationary increases for non-labor activities, including service contracts, utilities, the Department of Commerce Working Capital Fund and rent charges from the General Service Administration (GSA). SUB-PROGRAM: INTERNATIONAL FIELD The International Field program includes Foreign Service Officers (FSOs) and Locally Engaged Staff (LES) located in markets of U.S. commercial significance worldwide and headquarters-based country and regional experts who advance U.S. commercial interests, identify opportunities for U.S. exports, clarify local regulations and standards, resolve disputes with foreign local government officials, and counsel companies on the best strategies to succeed in overseas markets. The program assists companies of all sizes to identify opportunities and develop strategies for successful market entry or expansion in countries around the globe This includes bringing foreign buyers and U.S. companies together through business matchmaking services, promotional support and representation at trade shows and fairs, trade events, product launches, and technical seminars. Program staff also conduct advocacy on behalf of U.S. firms, providing official support for U.S. companies bidding on government contracts in overseas markets. International field staff also help U.S. companies find new foreign buyers, partners, or distributors resulting from rapid economic development, rising middle classes, and consumer expansion in key emerging markets such as India, China, and Brazil. GM collaborates with U.S. businesses and trade associations, other DOC units, and U.S. embassies, to investigate transactional problems or market access barriers that could disrupt a U.S. company’s access to foreign markets. GM specialists work to resolve trade problems before companies have to

ITA - 50
resort to lengthy, formal dispute settlement procedures. The country and regional experts in GM provide technical knowledge and detailed country and issue expertise needed for addressing and resolving trade issues through formal and informal bilateral and regional discussions. GM analyzes market barriers, develops detailed data and information related to technical problems and obstacles, and conducts economic and commercial analyses necessary for U.S. business clients, as well as supports successful negotiation of trade agreements. GM’s regional units initiate a variety of public-private programs to promote pro-growth policies in foreign markets and pre-empt potential trade barriers. GM operates such programs through government-to-government and public/private dialogues seeking to improve the overall level of U.S. trade. These activities support increasing exports and building a stronger, market-oriented economic system in these areas of the world, which contributes to U.S. economic goals and global stability. GM assists U.S. companies to determine their rights under U.S. trade agreements and to resolve market access barriers on their own. GM recognizes that many U.S. firms, especially SMEs, may not be aware of their rights, obligations, and opportunities in foreign markets, nor are they aware of the assistance the ITA can provide in resolving trade problems. To ensure companies are aware of the programs and services available, the International Field, working with the U.S. Field, continues to execute an outreach program to U.S. businesses and industry associations across the country. In addition, GM provides market research and services to the more than 300,000 U.S. exporters, to expand U.S. business opportunities in core market areas. GM uses local experts in the international field to identify market trends and opportunities as they develop, communicate that market intelligence to the U.S. business community, and provide targeted services so that more U.S. companies can find local partners/distributors and buyers for their exports in important markets. Key regional initiatives include a focus on Asia and Sub-Saharan Africa. GM will continue the requisite support domestically and abroad to expand and maintain its overseas presence. These actions aim to help U.S. exporters capture opportunities in important and growing markets. SUB-PROGRAM: U.S. FIELD The U.S. Field program includes a network of 108 U.S. Export Assistance Centers (USEACs) across the United States that focus primarily on the exporting needs of small and medium-sized enterprises (SMEs). Working alongside the International Field, U.S. Field trade specialists help identify opportunities for U.S. exporters, clarify foreign regulations and standards, provide support to clients who have business disputes abroad or encounter foreign market barriers, and counsel U.S. companies on the best strategies to succeed in overseas markets. The U.S. Field also plays a primary role in educating U.S. firms, especially SMEs that may not be aware of their rights, obligations, and opportunities in foreign markets or of the assistance ITA can provide in resolving their trade problems. Working with other ITA programs, the U.S. Field organizes educational outreach programs to U.S. businesses and industry associations across the country. Many U.S. companies, particularly SMEs, do not possess international business expertise in critically important functional areas, such as marketing, global logistics, international strategy development, international taxation, and trade finance. Working with Trade Promotion Coordinating Committee (TPCC) partners, the U.S. Field’s international trade specialists fill this gap, enabling U.S. companies to compete more effectively in the global marketplace. U.S. Field employees help U.S. exporters to develop international marketing strategies, find partners, and overcome a range of hurdles to exporting.
ITA -51
The U.S. Field’s Global Industry Teams bring together GM professionals from around the world to help service clients and develop industry-specific educational content to help U.S. exporters. In addition, the U.S. Field works together to deploy the Discover Global Markets conference series. This series has proven to be excellent in educating U.S. companies about the benefits of exporting, creating awareness about exporting opportunities, and getting U.S. companies started on more export sales. GM is also an integral component in the Administration’s “Made in Rural America” export and investment initiative. As part of this initiative, the U.S. Field focuses on providing enhanced export counseling for rural businesses to connect with foreign buyers, coordinate across the administration to promote rural-produced goods and services at trade events including trade missions, buyer programs, trade shows, and other promotion programs and educate local leaders across the country on the importance of rural exports. GM is also focused on increasing sector specialization in the U.S. Field and delivering deeper industry knowledge and contacts to U.S. exporters. This includes providing SMEs with information and tools to successfully leverage E-Commerce to begin exporting and to expand sales overseas. In addition, the U.S. Field helps to train and inform U.S. companies through an E-Commerce exporter guide, as well as educational events focused on E-Commerce topics. SUB-PROGRAM: ADVOCACY CENTER The Advocacy Center leads the federal government’s advocacy effort for U.S. companies bidding on foreign government procurement and project opportunities by coordinating federal resources to level the playing field on behalf of U.S. business interests as they compete against foreign firms. The Advocacy Center helps support and retain U.S. jobs through exports and is an essential element in the success of GM initiatives. The Advocacy Center is comprised of both GM U.S. Field and International Field staff, including commercial liaisons to the five multilateral development banks, and also leverages the resources of GM’s International Field to deliver on its mission of levelling the playing field on behalf of U.S. business interests. GM domestic staff provides outreach to clients, serves as case managers on specific projects, coordinates case strategies, and counsels companies on advocacy services. GM overseas staff provides counseling to companies on advocacy; performs and coordinates advocacy efforts overseas; and, provides key market intelligence that guides national interest determinations and advocacy campaigns. In December of 2012, the President signed an Executive Order (EO) giving the Advocacy Center the authority to call upon the resources of participants of the Interagency Task Force on Commercial Advocacy to carry out its duties internationally. The EO identifies the Advocacy Center as the primary interagency coordinator across 14 different agencies to execute a “whole of government” approach to help U.S. exporters win business overseas. The resulting interagency coordination has delivered demonstrated successes as evidenced by bids won. Between 2010 and 2014, the Advocacy Center coordinated a total of 313 wins supporting $210.7 billion in U.S. export content. In that time, the number of cases on which the Advocacy Center is supporting U.S. exports has grown by more than 300 percent. The Advocacy Center is focused on supporting U.S. business interests to take advantage of infrastructure project opportunities around the world, providing quality information earlier to clients, and increasing the number of U.S. companies bidding on foreign infrastructure projects, ultimately leading to more awards.
ITA - 52
SUB-PROGRAM: SELECTUSA SelectUSA coordinates investment-related resources across more than 20 federal agencies, operates as a partner to state and local economic development efforts to promote the United States as the best market for investment in the world, and addresses business climate concerns that may impede investment. SelectUSA serves as an information clearinghouse for the global investment community, an ombudsman for investors, and an advocate for U.S. cities, states, tribes, and regions. The SelectUSA program leverages the resources of GM’s International Field and the U.S. Department of State around the world to deliver on its mission of promoting inward investment in the United States. With the cooperation of U.S. commercial and economic teams overseas, coordinated, global teams actively work with current and potential investors, U.S. economic development organizations, service providers, foreign governments, and multiplier organizations to facilitate investment and create U.S. jobs. PROGRAM CHANGES FOR FY 2017: Program Support (Base Funding: $318.0million and 1,044 FTE; Program Change: +$5.3 million and 0 FTE): ITA requests $5,337,000 ITA requests $1,034,000 in order to sustain program capabilities in GM. Through investments in personnel and non-personnel support costs, this increase provides day-to-day resources to maintain mission and operational excellences within ITA. FTE levels would not be affected by this change. Export Expansion (Base Funding: $318.0 million and 1,044 FTE; Program Change: +$9.0 million and 16 FTE): ITA requests an increase of $8,962,000 and 16 FTE (not including 32 Locally Engaged Staff) in order to expand its capacity and footprint to position the United States and American companies compete effectively in the global marketplace. This initiative positions the International Trade Administration to help advance the U.S. economy through trade, in an increasingly complex and competitive global market. The global economy is changing rapidly. Within this decade alone, we have seen how geopolitical developments, systemic financial downturns, epidemics, and unfair foreign practices can impact U.S. competitiveness. We have seen how the rise of economies in Asia, Africa, and Latin America can present new opportunities for U.S. exporters, as well as job-creating investments in the United States. The dynamics of globalization have also evolved, from China’s influence on developing economies to its position in global manufacturing and supply chains, to increased competition to attract and retain investment dollars. Foreign direct investment is becoming more important as governments around the world focus on the range of issues that affect their ability to participate and compete in a global economy. In order to be competitive in the 21st century global economy, U.S. manufacturers and service providers depend upon access to a vibrant global marketplace and growing foreign markets. More than one billion new consumers worldwide will enter the middle class during the next 15 years, and their buying power will increase the consumption of goods and services worldwide. • Expansion of International Field The International Field program expansion ($8.2 million of total export expansion) includes 12 Foreign Service Officers (FSOs) and 32 Locally Engaged Staff (LES) located in international markets of U.S. commercial significance to advance U.S. commercial interests, identify opportunities for U.S.
ITA -53
exports, clarify local regulations and standards, resolve disputes with foreign local government officials, and counsel companies on the best strategies to succeed in overseas markets. This initiative will ensure growing support to U.S. companies in core markets. Additionally, it will support the goals of continued increased exports and foreign direct investment attraction; advancement of key regional trade priorities to expand market clusters tied to the Asia Rebalance, such as India and China; Doing Business in Africa, such as South Africa; and opening a presence in Cuba (pending legislative changes that would allow trade promotion engagement). Final staffing allocations will be based on internal analysis and a planning tool developed in partnership with an external consultant. Additional resources will also help U.S. firms to take more advantage of trade agreements, reductions in barriers to trade, and the growth of the global middle class-creating stability and ongoing market opportunities for U.S. firms. In addition, this will have immediate impacts on the future development of the highly successful U.S.-China Joint Commission on Commerce and Trade (JCCT), the more recently launched U.S.-India Strategic & Commercial Dialogue (S&CD), and the President’s Advisory Council on Doing Business in Africa (PAC-DBIA). These programs are part of GM’s commercial diplomacy efforts and present medium to long-term market openings. For example, a third party contractor estimated that the maximum possible economic impact of just seven commercial diplomacy Successes in FY 2015 equaled $444 million in increased U.S. exports with an impact on total U.S. economic output of $940 million, which is sufficient to sustain or create 3,539 jobs. Global Markets will use the additional funding to assist more clients, and serve those clients better through greater industry expertise; more in-depth assistance; and quicker response times. Global Markets succeeds when U.S. companies can compete and win in foreign markets. In FY 2014, 83% of GM clients surveyed reported that they were highly likely to recommend the agency’s services; and 73% reported that the organization’s services and assistance met their objectives. • Expansion of U.S. Field
This initiative ($0.8 million of total export expansion) will allow for the placement of six (6) international trade specialists (4 FTE) in critical U.S. Export Assistance Centers (USEACs) across the United States. U.S. exporter-facing trade professionals within the USEAC network have declined markedly since FY 2005 (currently at 260, down from 316 in FY 2005). The requested increase in staff will help address staffing shortfalls at key USEACs. USEACs getting additional staff will be identified through a review of the updated Domestic Resource Allocation Model (DRAM), as well as demand and performance metrics maintained by the Office of U.S. Operations. The result will be an increased number of U.S. exporter companies counseled and connected with opportunities in overseas markets. The U.S. Field program includes a network of 108 U.S. Export Assistance Centers (USEACs) across the United States that focus primarily on the exporting needs of small and medium-sized enterprises (SMEs). Working alongside the International Field, U.S. Field trade specialists help identify opportunities for U.S. exporters, clarify foreign regulations and standards, provide support to clients who have business disputes abroad or encounter foreign market barriers, and counsel U.S. companies on the best strategies to succeed in overseas markets. The U.S. Field also plays a primary role in educating U.S. firms, especially SMEs that may not be aware of their rights, obligations, and opportunities in foreign markets or of the assistance ITA can provide in resolving their trade problems. Working with other ITA programs, the U.S. Field organizes educational outreach programs to U.S. businesses and industry associations across the country.
ITA - 54
The U.S. exporting community consistently reports, via Department of Commerce surveys and studies, that it requires strategies for market entry informed by sector and sub-sector market intelligence. The U.S. Field is responding to this need by utilizing industry expertise of both headquarters and field-based industry analysts more directly in company and EDO counseling. This initiative would place additional resources in the U.S. Field to deliver industry expertise in key sectors such as e-commerce and infrastructure. Trade professionals with expertise in critical industry sectors will provide client-facing trade specialists with customized sector-specific intelligence to enable enhanced client and partner service. In FY 2014, GM assisted over 17,000 clients; 83% of GM clients surveyed reported that they were highly likely to recommend the agency’s services; and 73% reported that the organization’s services and assistance met their objectives. In addition, GM reached over 2,000 companies through export outreach and educational events like Discover Global Markets and TradeWinds; 92% of survey respondents from these events plan to use ITA services to build their businesses. Increased resources to enable enhanced U.S. industry sector specific services will respond directly to consistent feedback from U.S. companies, and should result in an increase in companies expressing satisfaction with, and that objectives were met by, GM services. Expand SelectUSA (Base Funding: $10.0 million and 22 FTE; Program Change: +$10.0 million and 16 FTE): ITA requests 16 FTE (not including 15 LES) and $10,000,000 to support GM’s implementation of the SelectUSA program. SelectUSA facilitates and promotes inward investment into the United States to support jobs and spur economic growth. Increased funding will allow SelectUSA to increase the quality and quantity of work performed by expanding LES presence to 14 additional priority markets, developing a foreign direct investment (FDI) database that will provide unbiased market intelligence, client profiles for state economic development organizations, and standardizing SelectUSA roadshow processes. The increased funding will also integrate investment work into commercial service activities by modifying and rolling out products and services that are scalable and align with existing GM products and services for export such as gold key services and comprehensive business plans for entry or expansion into the U.S. market. FDI plays a vital role in supporting U.S. jobs and helping to bolster U.S. export competitiveness. U.S. subsidiaries of foreign owned firms accounted for more than one-fifth of all U.S. goods exports in 2013. In the same year, they employed approximately 6.1 million U.S. workers, with an average salary of $79,979 per year.

ITA -55
PERFORMANCE GOALS AND MEASUREMENT DATA:
Performance Measure: Number of clients assisted by Global Markets
FY 2014
Actual
FY 2015
Actual
FY 2016
Target
FY 2017
Target
FY 2018
Target
FY 2019
Target
FY 2020
Target With Change 17,593 25,029 23,000 26,500 30,000 32,500 35,000 Without Change 17,593 25,029 23,000 23,000 23,000 23,000 23,000 Description: This indicator illustrates ITA’s reach into the U.S. business community. Historical data indicates that over 75 percent of companies assisted are small and medium-sized enterprises.
Performance Measure: Number of Commercial Diplomacy/Advocacy WINs5
FY 2014
Actual
FY 2015
Actual
FY 2016
Target
FY 2017
Target
FY 2018
Target
FY 2019
Target
FY 2020
Target
With Change 343 287 300 330 360 380 400 Without Change 343 287 300 300 300 300 300 Description: This measure captures the results of Global Markets’ front-line diplomatic engagement with foreign governments in support of a U.S. company or industry. A WIN occurs when a foreign government action/decision as a result of GM engagement results in the following outcomes for a U.S. company or industry: Reduced/removed/prevented trade barrier; Reduced/removed threat to U.S. business/economic interest; Foreign compliance with a trade agreement; Facilitated an export transaction; or a U.S. company has a signed contract for a foreign procurement.
5 This measure reflects, in part, the “Number of Advocacy Wins” cited under Strategic Objective 1.1 in the Department’s Strategic Plan. While it incorporates the “Number of Advocacy Wins,” the measurement also includes additional policy work not reflected in the “Number of Advocacy Wins” reported for the similar Strategic Plan indicator. Thus, the actual for this indicator may include more (i.e., may be different) than the actual reported for the “Number of Advocacy Wins” in the Strategic Plan.
Performance Measure: Percentage of Global Markets clients that achieved their export objectives
FY 2014
Actual
FY 2015
Actual
FY 2016
Target
FY 2017
Target
FY 2018
Target
FY 2019
Target
FY 2020
Target
With Change 73% 73% 73% 75% 73% 73% 73% Without Change 73% 73% 71% 71% 71% 71% 71% Description: This measure evaluates Global Markets’ effectiveness in helping companies achieve their export objectives. Global Markets offers U.S. companies a robust set of capabilities to help them achieve their international exporting goals, whether those goals are to set up an overseas distribution channel, gain easier access to challenging markets, or meet additional foreign buyers for their goods. Global Markets focuses on understanding clients’ exporting needs, and providing services to meet those needs.
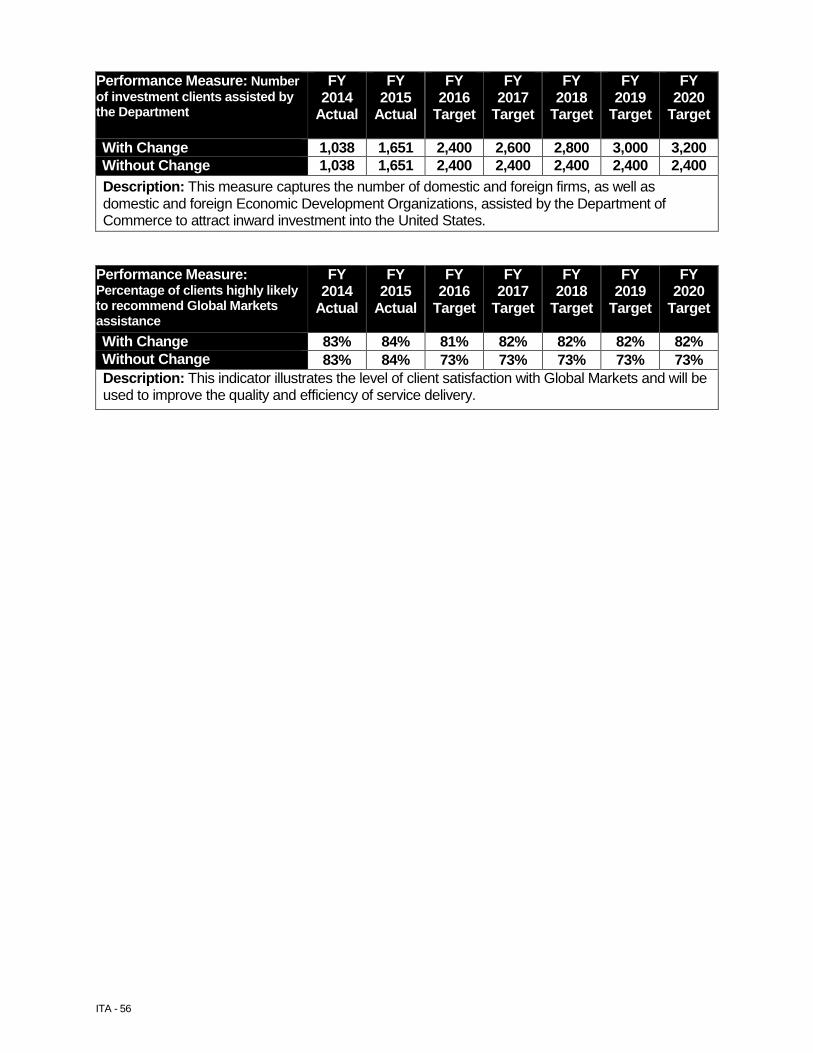
ITA - 56
Performance Measure: Number of investment clients assisted by the Department
FY 2014
Actual
FY 2015
Actual
FY 2016
Target
FY 2017
Target
FY 2018
Target
FY 2019
Target
FY 2020
Target
With Change 1,038 1,651 2,400 2,600 2,800 3,000 3,200 Without Change 1,038 1,651 2,400 2,400 2,400 2,400 2,400 Description: This measure captures the number of domestic and foreign firms, as well as domestic and foreign Economic Development Organizations, assisted by the Department of Commerce to attract inward investment into the United States.
Performance Measure: Percentage of clients highly likely to recommend Global Markets assistance
FY 2014
Actual
FY 2015
Actual
FY 2016
Target
FY 2017
Target
FY 2018
Target
FY 2019
Target
FY 2020
Target
With Change 83% 84% 81% 82% 82% 82% 82% Without Change 83% 84% 73% 73% 73% 73% 73% Description: This indicator illustrates the level of client satisfaction with Global Markets and will be used to improve the quality and efficiency of service delivery.
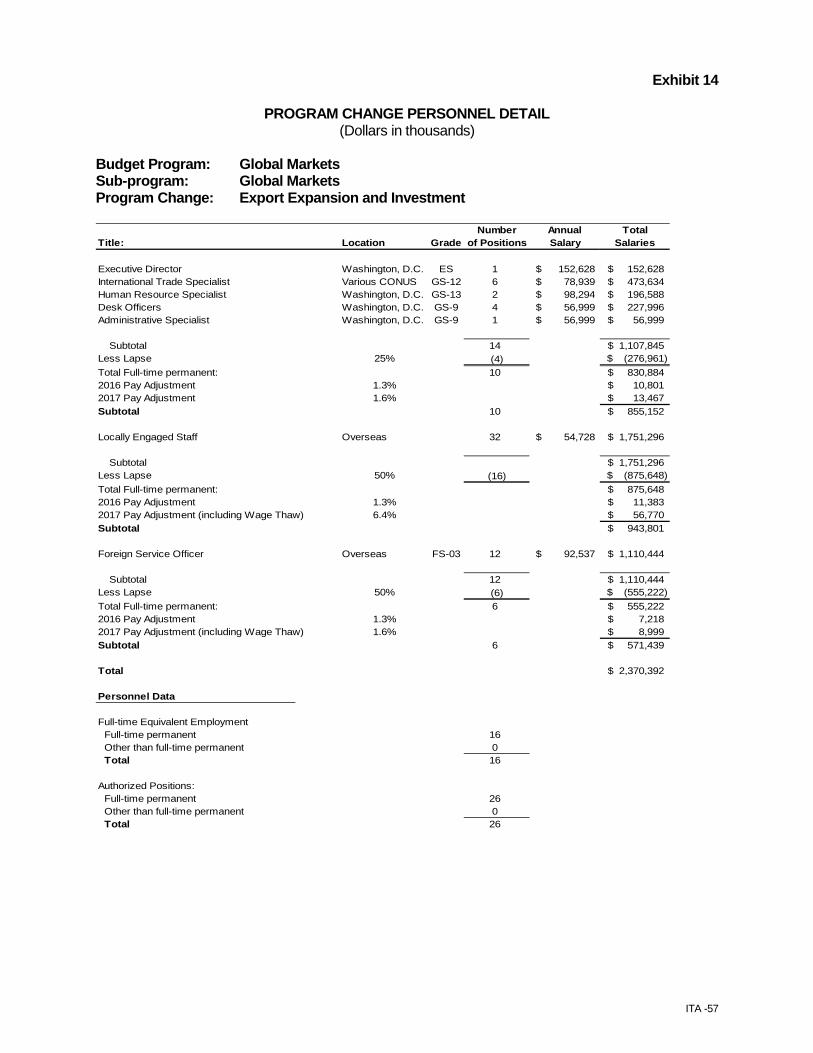
ITA -57
Exhibit 14
PROGRAM CHANGE PERSONNEL DETAIL (Dollars in thousands)
Budget Program: Global Markets Sub-program: Global Markets Program Change: Export Expansion and Investment
Number Annual TotalTitle: Location Grade of Positions Salary Salaries
Executive Director Washington, D.C. ES 1 152,628$ 152,628$ International Trade Specialist Various CONUS GS-12 6 78,939$ 473,634$ Human Resource Specialist Washington, D.C. GS-13 2 98,294$ 196,588$ Desk Officers Washington, D.C. GS-9 4 56,999$ 227,996$ Administrative Specialist Washington, D.C. GS-9 1 56,999$ 56,999$
Subtotal 14 1,107,845$ Less Lapse 25% (4) (276,961)$ Total Full-time permanent: 10 830,884$ 2016 Pay Adjustment 1.3% 10,801$ 2017 Pay Adjustment 1.6% 13,467$ Subtotal 10 855,152$
Locally Engaged Staff Overseas 32 54,728$ 1,751,296$
Subtotal 32 1,751,296$ Less Lapse 50% (16) (875,648)$ Total Full-time permanent: 16 875,648$ 2016 Pay Adjustment 1.3% 11,383$
6.4% 56,770$ Subtotal 16 943,801$
Foreign Service Officer Overseas FS-03 12 92,537$ 1,110,444$
Subtotal 12 1,110,444$ Less Lapse 50% (6) (555,222)$ Total Full-time permanent: 6 555,222$ 2016 Pay Adjustment 1.3% 7,218$ 2017 Pay Adjustment (including Wage Thaw) 1.6% 8,999$ Subtotal 6 571,439$
Total 2,370,392$
Personnel Data
Full-time Equivalent EmploymentFull-time permanent 16Other than full-time permanent 0Total 16
Authorized Positions:Full-time permanent 26Other than full-time permanent 0Total 26
2017 Pay Adjustment (including Wage Thaw)
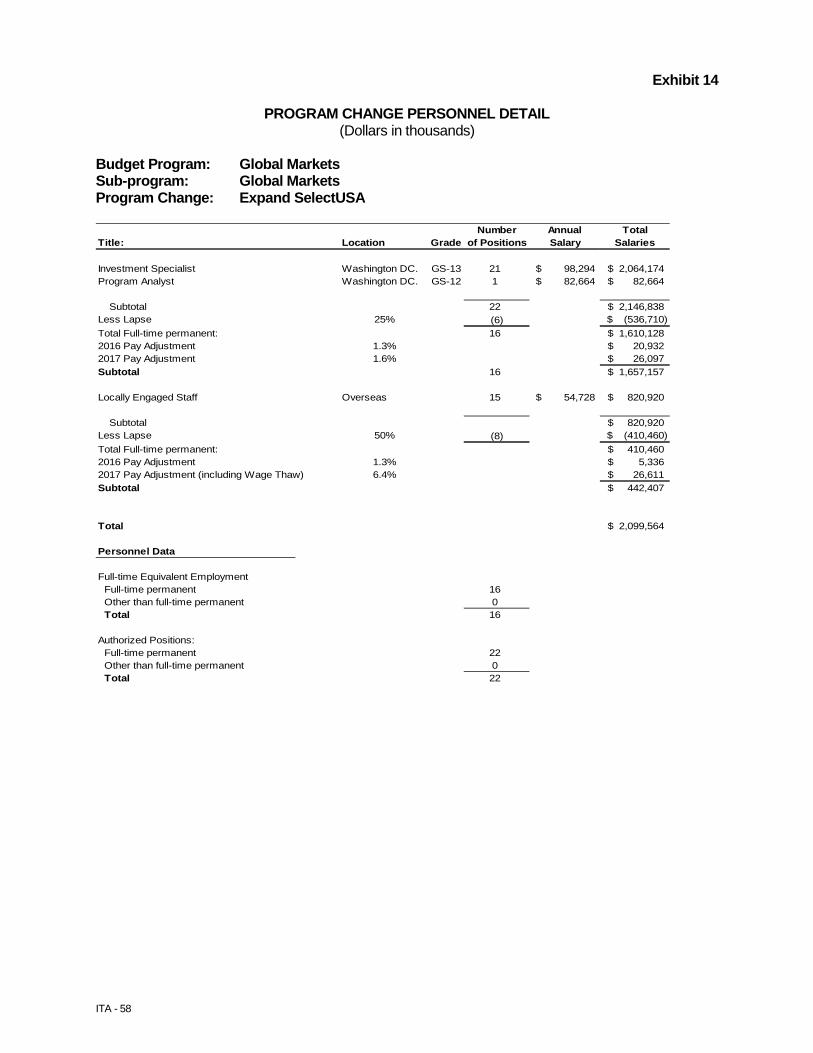
ITA - 58
Exhibit 14
PROGRAM CHANGE PERSONNEL DETAIL (Dollars in thousands)
Budget Program: Global Markets Sub-program: Global Markets Program Change: Expand SelectUSA
Number Annual TotalTitle: Location Grade of Positions Salary Salaries
Investment Specialist Washington DC. GS-13 21 98,294$ 2,064,174$ Program Analyst Washington DC. GS-12 1 82,664$ 82,664$
Subtotal 22 2,146,838$ Less Lapse 25% (6) (536,710)$ Total Full-time permanent: 16 1,610,128$ 2016 Pay Adjustment 1.3% 20,932$ 2017 Pay Adjustment 1.6% 26,097$ Subtotal 16 1,657,157$
Locally Engaged Staff Overseas 15 54,728$ 820,920$
Subtotal 15 820,920$ Less Lapse 50% (8) (410,460)$ Total Full-time permanent: 7 410,460$ 2016 Pay Adjustment 1.3% 5,336$
6.4% 26,611$ Subtotal 7 442,407$
Total 2,099,564$
Personnel Data
Full-time Equivalent EmploymentFull-time permanent 16Other than full-time permanent 0Total 16
Authorized Positions:Full-time permanent 22Other than full-time permanent 0Total 22
2017 Pay Adjustment (including Wage Thaw)
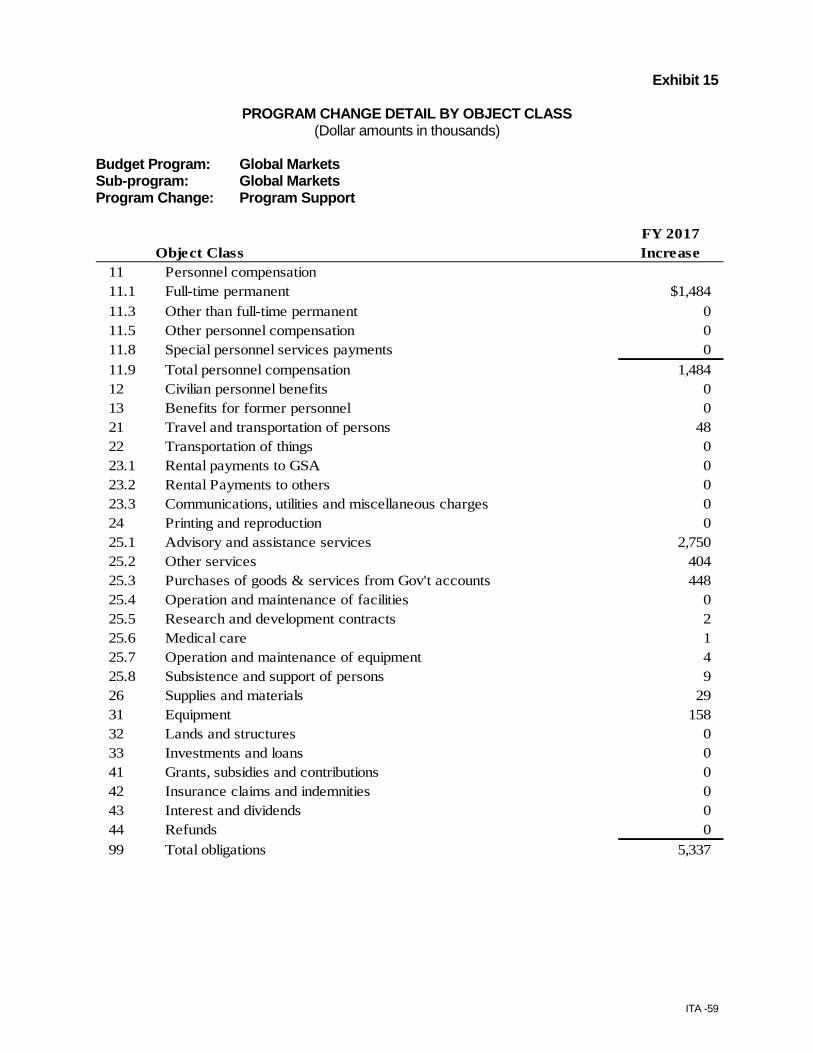
ITA -59
Exhibit 15
PROGRAM CHANGE DETAIL BY OBJECT CLASS (Dollar amounts in thousands)
Budget Program: Global Markets Sub-program: Global Markets Program Change: Program Support
FY 2017Object Class Increase
11 Personnel compensation11.1 Full-time permanent $1,484 11.3 Other than full-time permanent 0 11.5 Other personnel compensation 0 11.8 Special personnel services payments 0 11.9 Total personnel compensation 1,484 12 Civilian personnel benefits 0 13 Benefits for former personnel 0 21 Travel and transportation of persons 48 22 Transportation of things 0 23.1 Rental payments to GSA 0 23.2 Rental Payments to others 0 23.3 Communications, utilities and miscellaneous charges 0 24 Printing and reproduction 0 25.1 Advisory and assistance services 2,750 25.2 Other services 404 25.3 Purchases of goods & services from Gov't accounts 448 25.4 Operation and maintenance of facilities 0 25.5 Research and development contracts 2 25.6 Medical care 1 25.7 Operation and maintenance of equipment 4 25.8 Subsistence and support of persons 9 26 Supplies and materials 29 31 Equipment 158 32 Lands and structures 0 33 Investments and loans 0 41 Grants, subsidies and contributions 0 42 Insurance claims and indemnities 0 43 Interest and dividends 0 44 Refunds 0 99 Total obligations 5,337
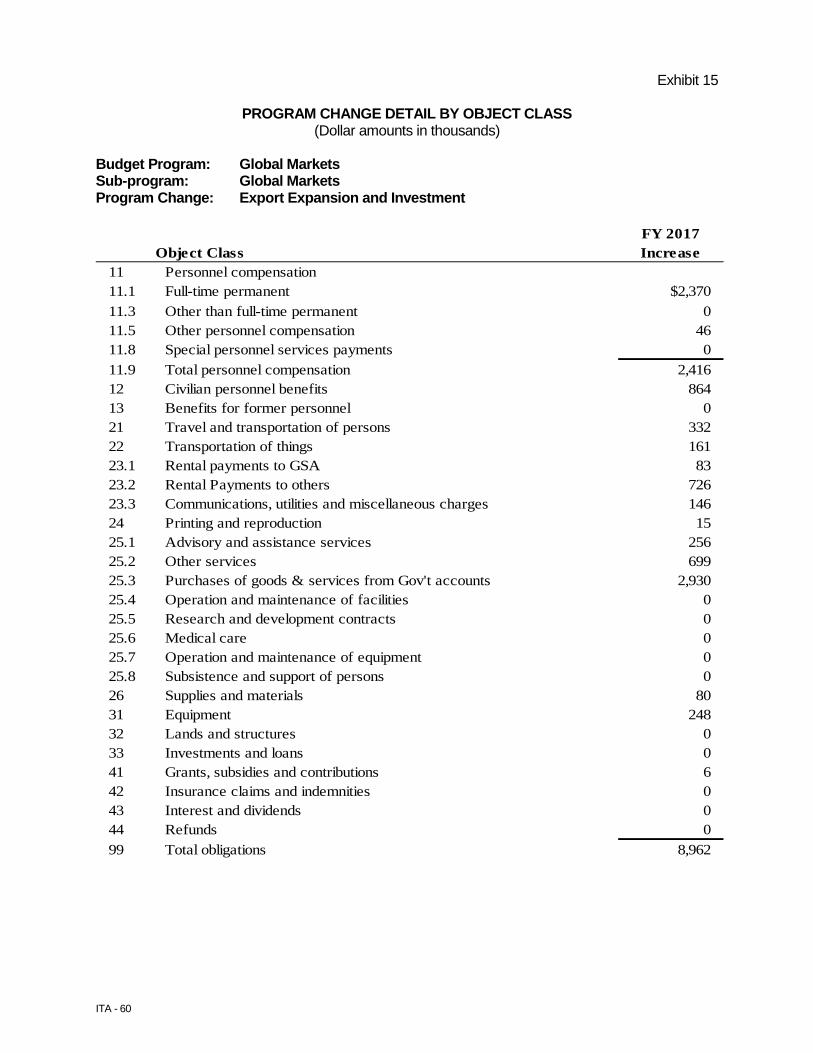
ITA - 60
Exhibit 15
PROGRAM CHANGE DETAIL BY OBJECT CLASS (Dollar amounts in thousands)
Budget Program: Global Markets Sub-program: Global Markets Program Change: Export Expansion and Investment
FY 2017Object Class Increase
11 Personnel compensation11.1 Full-time permanent $2,370 11.3 Other than full-time permanent 0 11.5 Other personnel compensation 46 11.8 Special personnel services payments 0 11.9 Total personnel compensation 2,416 12 Civilian personnel benefits 864 13 Benefits for former personnel 0 21 Travel and transportation of persons 332 22 Transportation of things 161 23.1 Rental payments to GSA 83 23.2 Rental Payments to others 726 23.3 Communications, utilities and miscellaneous charges 146 24 Printing and reproduction 15 25.1 Advisory and assistance services 256 25.2 Other services 699 25.3 Purchases of goods & services from Gov't accounts 2,930 25.4 Operation and maintenance of facilities 0 25.5 Research and development contracts 0 25.6 Medical care 0 25.7 Operation and maintenance of equipment 0 25.8 Subsistence and support of persons 0 26 Supplies and materials 80 31 Equipment 248 32 Lands and structures 0 33 Investments and loans 0 41 Grants, subsidies and contributions 6 42 Insurance claims and indemnities 0 43 Interest and dividends 0 44 Refunds 0 99 Total obligations 8,962
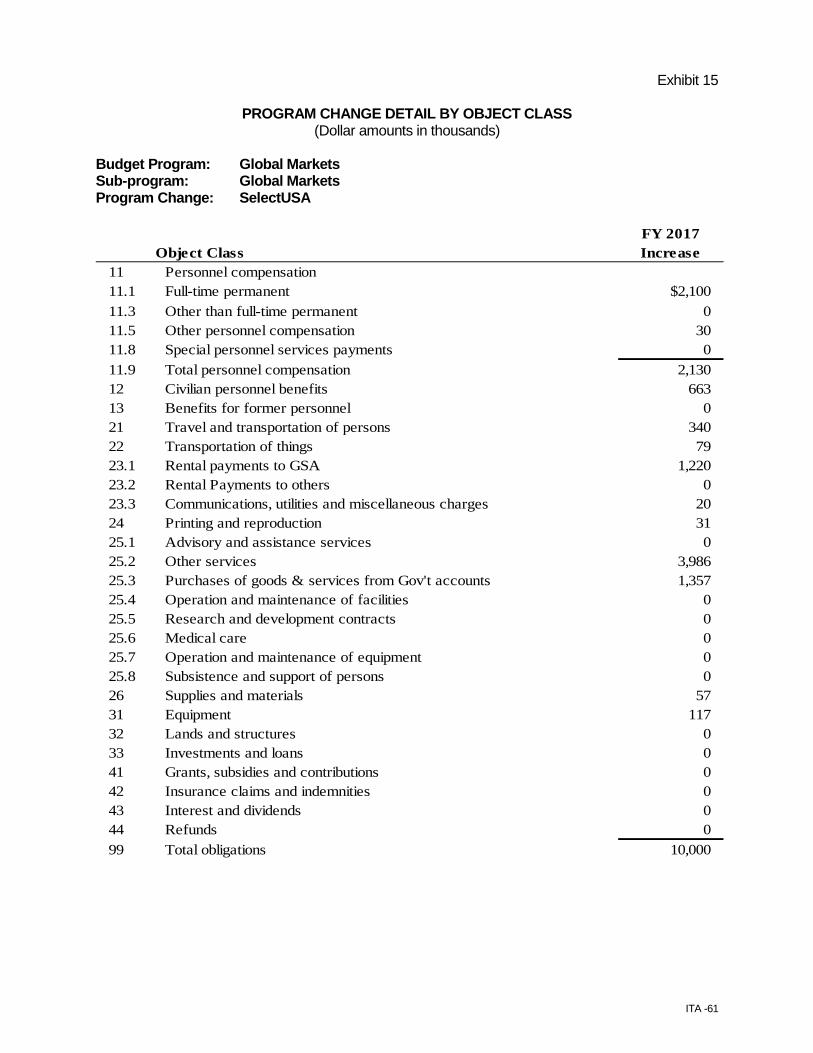
ITA -61
Exhibit 15
PROGRAM CHANGE DETAIL BY OBJECT CLASS (Dollar amounts in thousands)
Budget Program: Global Markets Sub-program: Global Markets Program Change: SelectUSA
FY 2017Object Class Increase
11 Personnel compensation11.1 Full-time permanent $2,100 11.3 Other than full-time permanent 0 11.5 Other personnel compensation 30 11.8 Special personnel services payments 0 11.9 Total personnel compensation 2,130 12 Civilian personnel benefits 663 13 Benefits for former personnel 0 21 Travel and transportation of persons 340 22 Transportation of things 79 23.1 Rental payments to GSA 1,220 23.2 Rental Payments to others 0 23.3 Communications, utilities and miscellaneous charges 20 24 Printing and reproduction 31 25.1 Advisory and assistance services 0 25.2 Other services 3,986 25.3 Purchases of goods & services from Gov't accounts 1,357 25.4 Operation and maintenance of facilities 0 25.5 Research and development contracts 0 25.6 Medical care 0 25.7 Operation and maintenance of equipment 0 25.8 Subsistence and support of persons 0 26 Supplies and materials 57 31 Equipment 117 32 Lands and structures 0 33 Investments and loans 0 41 Grants, subsidies and contributions 0 42 Insurance claims and indemnities 0 43 Interest and dividends 0 44 Refunds 0 99 Total obligations 10,000

ITA - 62
This Page Intentionally Left Blank

ITA -63

ITA - 64

ITA -65
Exhibit 12-15 (Congressional) APPROPRIATION ACCOUNT: OPERATIONS AND ADMINISTRATION BUDGET PROGRAM: EXECUTIVE DIRECTION AND ADMINISTRATION For FY 2017, ITA requests a total of $23,981,000 and 107 FTE for Executive Direction and Administration (including inflationary adjustments of $248,000 and 0 FTE). This request includes one program changes of $411,000 and 0 FTE. BASE JUSTIFICATION: Executive Direction and Administration Overview The mission of the Executive Direction and Administration (ExAd) unit is to achieve U.S. trade expansion and economic growth through executive leadership; well-conceived policy guidance; and, efficient and effective management of ITA resources. This unit coordinates policy; directs programmatic activities; oversees the agency’s budget, financial, and internal control requirements; conducts program and performance evaluation; and, provides centralized strategic and operational management of information technology (IT) resources. The ExAd budget is organized into the following three main units that support the Management & Corporate Services sub-program under the Operations and Administration appropriation:
• Executive Direction • The Office of the Chief Financial and Administrative Officer (OCFAO) • The Office of the Chief Information Officer (OCIO)
INFLATIONARY ADJUSTMENTS: ITA requests a net increase of 0 FTE and $0.2 million to fund inflationary adjustments. The figure reflects an increase to fund the estimated 2017 Federal pay raise of 1.6 percent as well as inflationary increases for non-labor activities, including service contracts, utilities, the Department of Commerce Working Capital Fund and rent charges from the General Service Administration (GSA). SUB-PROGRAM: MANAGEMENT & CORPORATE SERVICES Executive Direction Executive Direction includes the Office of the Under Secretary, the Office of the Deputy Under Secretary, the Office of Public Affairs, the Office of Legislative and Intergovernmental Affairs, and the Trade Promotion Coordinating Committee. The Offices of the Under Secretary and Deputy Under Secretary provide overall executive leadership and guidance to ITA through: the planning, determination, and coordination of policy; providing direction on strategic priorities; and, the development and implementation of a government-wide strategy for federal trade and investment promotion efforts. The work of employees within Executive
ITA - 66
Direction supports the work of the National Economic Council, the Trade Policy Review Group, and serves on other Secretarial level boards, committees, or panels for which the primary focus is international trade and/or investment. The Office of the Deputy Under Secretary is also responsible for the day-to-day management of ITA. The Office of Public Affairs communicates to the public the importance of exports, trade, and investment in support of the U.S. economy and U.S. global competitiveness. The office also: communicates ITA’s services to the appropriate press and business audiences in the United States and around the world; enhances customer service to internal and external stakeholders; and, provides information to the public and the press on issues related to the activities of the ITA. The Office of Legislative and Intergovernmental Affairs acts as a liaison to the Legislative branch; informs legislative and intergovernmental stakeholders about current international trade and investment matters as well as export opportunities; and, keeps ITA informed about trade-related legislative activities. The Trade Promotion Coordinating Committee (TPCC) Secretariat convenes the Principals and Deputies meetings of the TPCC member agencies and the working groups that contribute to export promotion. Additionally, the TPCC Secretariat coordinates and manages initiatives at the programmatic level to ensure all export-promotion agencies are working together for the benefit of U.S. exporters.
Office of the Chief Financial and Administrative Officer (OCFAO) OCFAO oversees the agency’s resources and coordinates measurement of program performance to ensure ITA’s success in achieving strategic goals. The office provides shared services solutions to ITA programs and manages the budgetary, financial, and administrative aspects of ITA, and ensures the needs of ITA clients and employees are fulfilled. OCFAO helps ITA programs operate efficiently and ensure overall effectiveness through the use of integrated systems, program analysis and evaluation, strategic planning, employee engagement activities, and continuous business process improvement. In addition, OCFAO ensures linkages between performance and budgets so that resource requests are tied to needed performance outputs and outcomes. Office of the Chief Information Officer (OCIO) OCIO provides enterprise-wide leadership for ITA’s strategic and operational use of information technology resources. OCIO develops and implements IT policy, manages ITA’s IT planning activities, oversees IT investments through the capital planning and review process, and delivers IT services and solutions that empower ITA and partner organizations to execute their missions efficiently and effectively. By providing the necessary IT tools and maintenance, the OCIO provides a platform that ITA employees and customers around the world use to research trade issues, understand trade agreements, and collaborate on export promotion activities. OCIO integrates many of the facets of ITA’s organizational efforts into one seamless and unified informational space by managing ITA’s global network infrastructure spanning over 70 countries and 200 locations; hosting
TPCC FEDERAL AGENCIES Department of Commerce Department of Energy Department of the Treasury Department of State National Economic Council United States Trade Representative Department of Agriculture Department of the Interior U.S. Trade and Development Agency U.S. Agency for International Development Department of Defense Council of Economic Advisors Small Business Administration Office of Management and Budget Department of Transportation Export-Import Bank of the United States Department of Labor Overseas Private Investment Corporation Environmental Protection Agency U.S. Information Agency

ITA -67
ITA Central, ITA’s enterprise-wide collaborative intranet; and, providing technical leadership and supporting key enterprise systems. These systems include ITA’s public facing web infrastructure, which supports ITA outreach and initiatives such as export promotion through ITA’s public web venue of Trade.gov, and ITA’s Customer Relationship Management (CRM) system that provides the ITA workforce with a comprehensive view of all client and customer interactions. OCIO also ensures the security of information and technology assets by operating a comprehensive world-wide cyber security program. PROGRAM CHANGES FOR FY 2017: Program Support (Base Funding: $23.5 million and 107 FTE; Program Change: $0.4 million and 0 FTE): ITA requests $411,000 ITA requests $1,034,000 in order to sustain program capabilities in ExAd. Through investments in personnel and non-personnel support costs, this increase provides day-to-day resources to maintain mission and operational excellences within ITA. FTE levels would not be affected by this change. . Performance Goals and Measurement Data: Performance Measure: Percent of Clean Audit Opinion
FY 2014
Actual
FY 2015
Target
FY 2016
Target
FY 2017
Target
FY 2018
Target
FY 2019
Target
FY 2020
Target With Change 100% 100% 100% 100% 100% 100% 100% Without Change 100% 100% 100% 100% 100% 100% 100%
Description: This measure illustrates that ITA’s finances are presented in conformity with U.S. generally accepted accounting principles and there are no material weaknesses identified within the Department’s Audit that are attributable to ITA. Performance Measure: Percent of the 80-day hiring model deadlines within the bureaus span of control that are met.
FY 2014
Actual
FY 2015
Target
FY 2016
Target
FY 2017
Target
FY 2018
Target
FY 2019
Target
FY 2020
Target
With Change 80% 80% 80% 80% 80% 80% 80% Without Change 80% 80% 80% 80% 80% 80% 80%
Description: This measure illustrates the percent of deadlines, as defined by the 80-day hiring model, that ITA meets that are within its control. This number takes into account both the amount of transactions and the overall time taken on them.
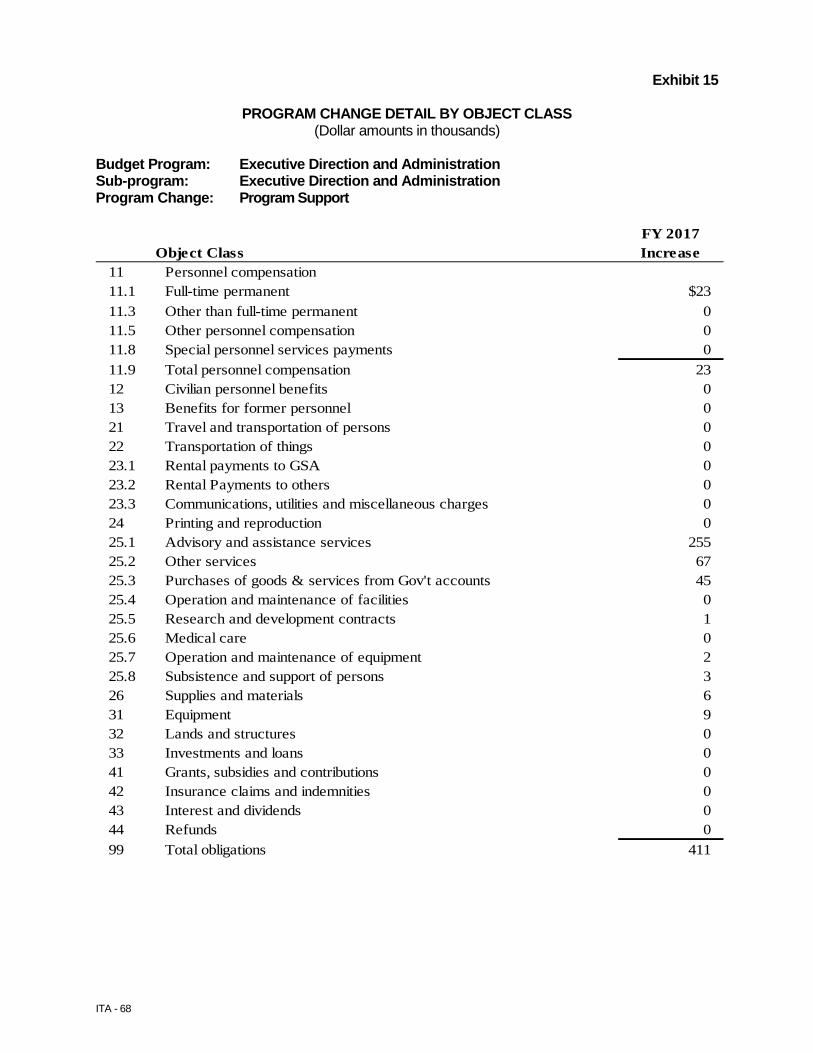
ITA - 68
Exhibit 15
PROGRAM CHANGE DETAIL BY OBJECT CLASS (Dollar amounts in thousands)
Budget Program: Executive Direction and Administration Sub-program: Executive Direction and Administration Program Change: Program Support
FY 2017Object Class Increase
11 Personnel compensation11.1 Full-time permanent $23 11.3 Other than full-time permanent 0 11.5 Other personnel compensation 0 11.8 Special personnel services payments 0 11.9 Total personnel compensation 23 12 Civilian personnel benefits 0 13 Benefits for former personnel 0 21 Travel and transportation of persons 0 22 Transportation of things 0 23.1 Rental payments to GSA 0 23.2 Rental Payments to others 0 23.3 Communications, utilities and miscellaneous charges 0 24 Printing and reproduction 0 25.1 Advisory and assistance services 255 25.2 Other services 67 25.3 Purchases of goods & services from Gov't accounts 45 25.4 Operation and maintenance of facilities 0 25.5 Research and development contracts 1 25.6 Medical care 0 25.7 Operation and maintenance of equipment 2 25.8 Subsistence and support of persons 3 26 Supplies and materials 6 31 Equipment 9 32 Lands and structures 0 33 Investments and loans 0 41 Grants, subsidies and contributions 0 42 Insurance claims and indemnities 0 43 Interest and dividends 0 44 Refunds 0 99 Total obligations 411
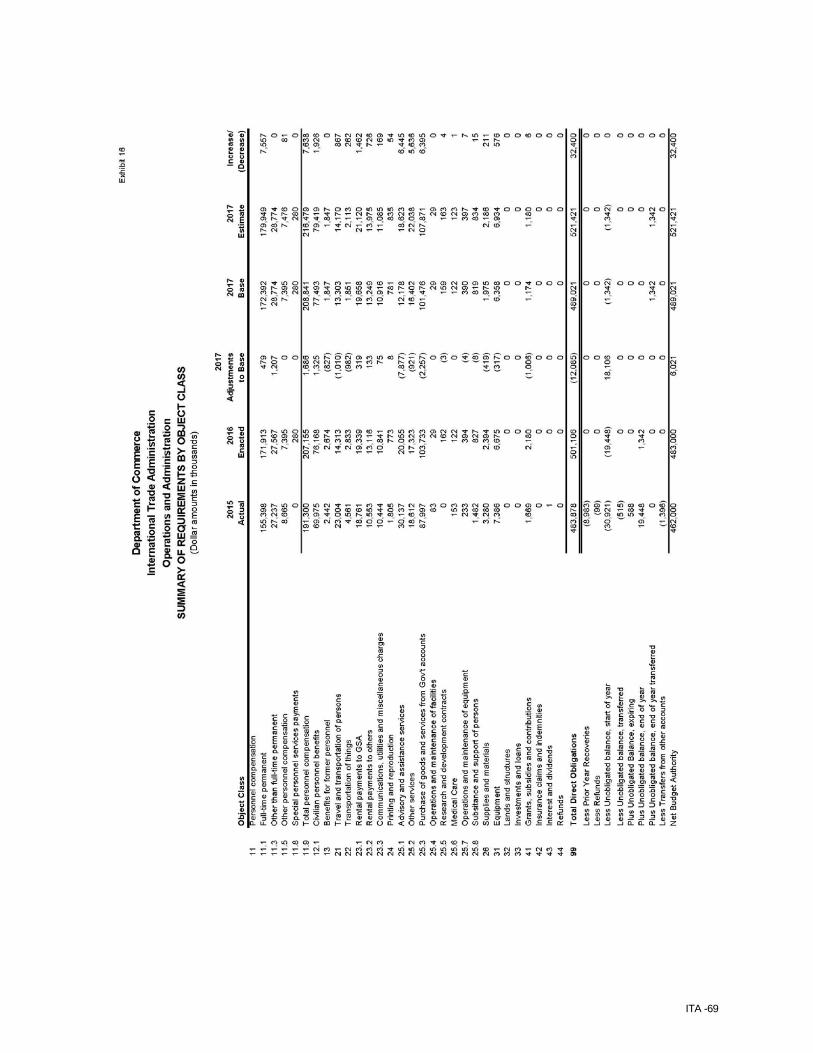
ITA -69

ITA - 70
ITA -71
Exhibit 32
DEPARTMENT OF COMMERCE
International Trade Administration Operations and Administration
JUSTIFICATION OF PROPOSED LANGUAGE CHANGES After the phrase “For necessary expenses for international trade activities of the Department of Commerce provided for by law,” insert the following: “for activities associated with facilitating, attracting, and retaining business investment in the United States,” The language provides ITA the authority required to fully implement the SelectUSA initiative. SelectUSA is a Government wide initiative to attract and retain investment in the American economy. The retention of investment—addressing U.S. firms that are considering whether to expand or retain a domestic investment, or instead to invest overseas, is not an “international trade activity” of ITA as that term is used in the annual appropriations act. As a result, moneys appropriated under that heading can’t be used to address the retention of U.S. investment. ITA is currently required to conduct activities involving retention of U.S. investment using the Economic Development Agency’s (EDA’s) legal authority. The requested language change would allow the SelectUSA program to fully carry out its mandate.

ITA - 72
This Page Intentionally Left Blank
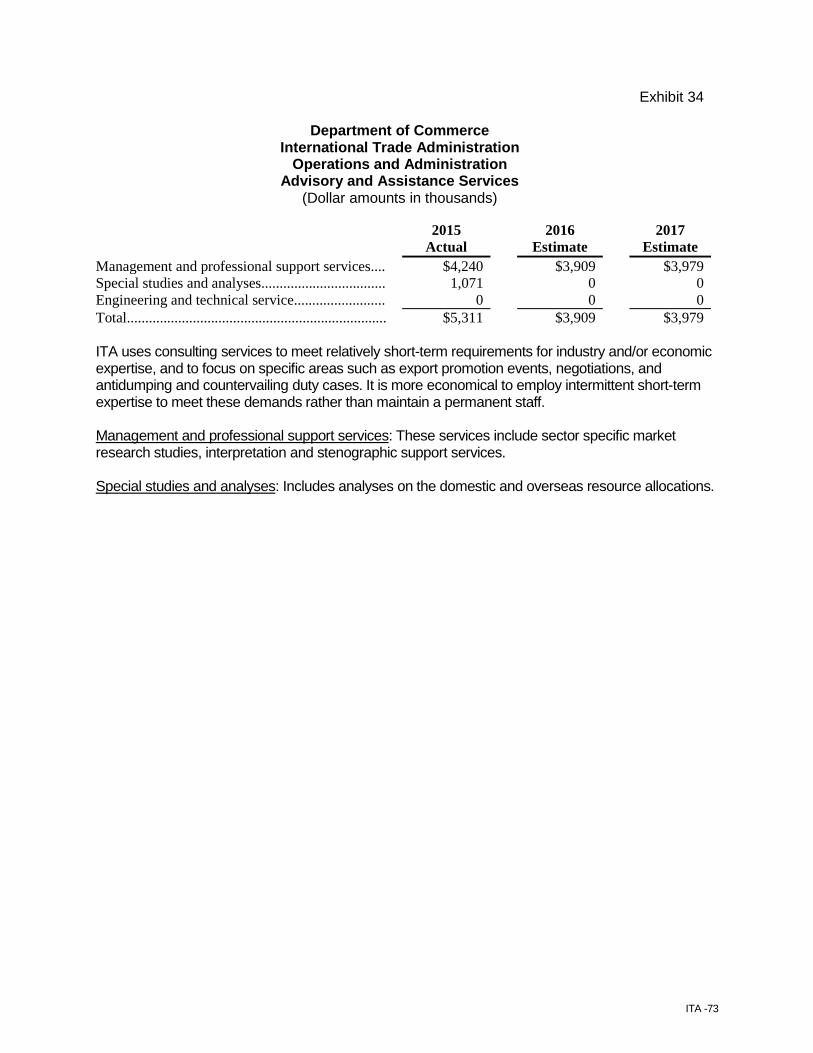
ITA -73
Exhibit 34
Department of Commerce
International Trade Administration Operations and Administration
Advisory and Assistance Services (Dollar amounts in thousands)
2015 2016 2017 Actual Estimate Estimate
Management and professional support services.... $4,240 $3,909 $3,979 Special studies and analyses.................................. 1,071 0 0 Engineering and technical service......................... 0 0 0 Total....................................................................... $5,311 $3,909 $3,979
ITA uses consulting services to meet relatively short-term requirements for industry and/or economic expertise, and to focus on specific areas such as export promotion events, negotiations, and antidumping and countervailing duty cases. It is more economical to employ intermittent short-term expertise to meet these demands rather than maintain a permanent staff. Management and professional support services: These services include sector specific market research studies, interpretation and stenographic support services. Special studies and analyses: Includes analyses on the domestic and overseas resource allocations.

ITA - 74
This Page Intentionally Left Blank
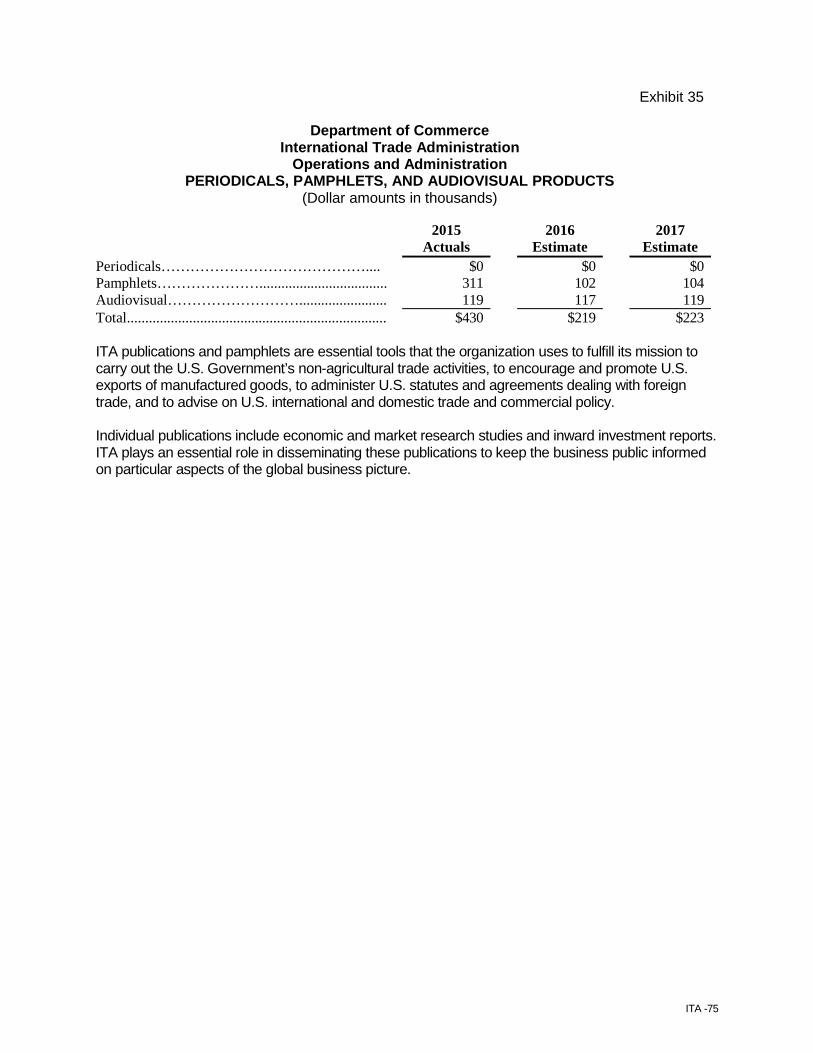
ITA -75
Exhibit 35
Department of Commerce
International Trade Administration Operations and Administration
PERIODICALS, PAMPHLETS, AND AUDIOVISUAL PRODUCTS (Dollar amounts in thousands)
2015 2016 2017 Actuals Estimate Estimate
Periodicals…………………………………….... $0 $0 $0 Pamphlets…………………................................... 311 102 104 Audiovisual………………………........................ 119 117 119 Total....................................................................... $430 $219 $223
ITA publications and pamphlets are essential tools that the organization uses to fulfill its mission to carry out the U.S. Government’s non-agricultural trade activities, to encourage and promote U.S. exports of manufactured goods, to administer U.S. statutes and agreements dealing with foreign trade, and to advise on U.S. international and domestic trade and commercial policy. Individual publications include economic and market research studies and inward investment reports. ITA plays an essential role in disseminating these publications to keep the business public informed on particular aspects of the global business picture.

ITA - 76
This Page Intentionally Left Blank

ITA -77
Exhibit 36
Department of Commerce
International Trade Administration Operations and Administration
AVERAGE GRADE AND SALARIES
2015
2016
2017 Actual
Estimate
Estimate
Direct
Average ES $165,474 $167,210
$169,384
Average GS grade 13.5 13.5
13.5 Average GS salary $104,711 $106,072
$107,769
Average grade and salary established by the Foreign Service Act of 1980 (U.S.C. 801-1158):
Average Senior Foreign Service salary $169,636 $171,841
$174,591 Average Foreign Service Officer grade 2.10 2.10
2.10
Average Foreign Service Officer salary $125,468 $127,099
$129,133 Average Foreign Service Staff salary $97,879 $99,151
$100,738
Average Foreign Service salary in foreign countries $123,774 $125,383
$127,389

ITA - 78
This Page Intentionally Left Blank

ITA -79

ITA - 80
This Page Intentionally Left Blank

ITA -81

ITA - 82
This Page Intentionally Left Blank
ITA -83

ITA - 84
This Page Intentionally Left Blank

ITA -85
Exhibit 12 (Congressional) APPROPRIATION ACCOUNT: GRANTS TO MANUFACTURERS OF WORSTED WOOL
FABRICS BUDGET ACTIVITY: INDUSTRY AND ANALYSIS
For FY 2017, the International Trade Administration (ITA) requests no funding for Grants to Manufacturers of Worsted Wool Fabrics. This program has been renewed in the Agricultural Act of 2014 (P.L. 113-79). Related funding has now been switched to the Commodity Credit Corporation administered by the Secretary of Agriculture. BASE JUSTIFICATION: Title V of the Trade and Development Act of 2000 created tariff rate quotas, providing reduced and duty-free treatment for a specified quantity of imports of certain worsted wool fabrics suitable for use in manufacturing certain tailored garments. Authority for the Tariff Rate Quota program has been extended several times and now legislatively is slated to terminate at the end of 2014. The Miscellaneous Trade and Technical Corrections Act of 2004 provided authority to the Secretary of Commerce to promote domestic employment by issuing grants to manufacturers of worsted wool fabrics. The grant program is paid for by the Wool Apparel Manufacturers Trust Fund, maintained by Treasury, which receives a portion of the duties collected from importers of certain wool products. Each year, Treasury is required to transfer approximately $5.3M from the Trust Fund to the ITA, so that ITA can distribute those funds through grants to a small number of firms in the worsted wool fabric manufacturing industry, allocated through a six-year-old formula according to each company’s share of the relevant market in 1999, 2000, and 2001. The program was originally slated to expire in 2007, but was extended multiple times and legislatively expired at the end of 2014.

ITA - 86
This Page Intentionally Left Blank
ITA -87
ITA - 88
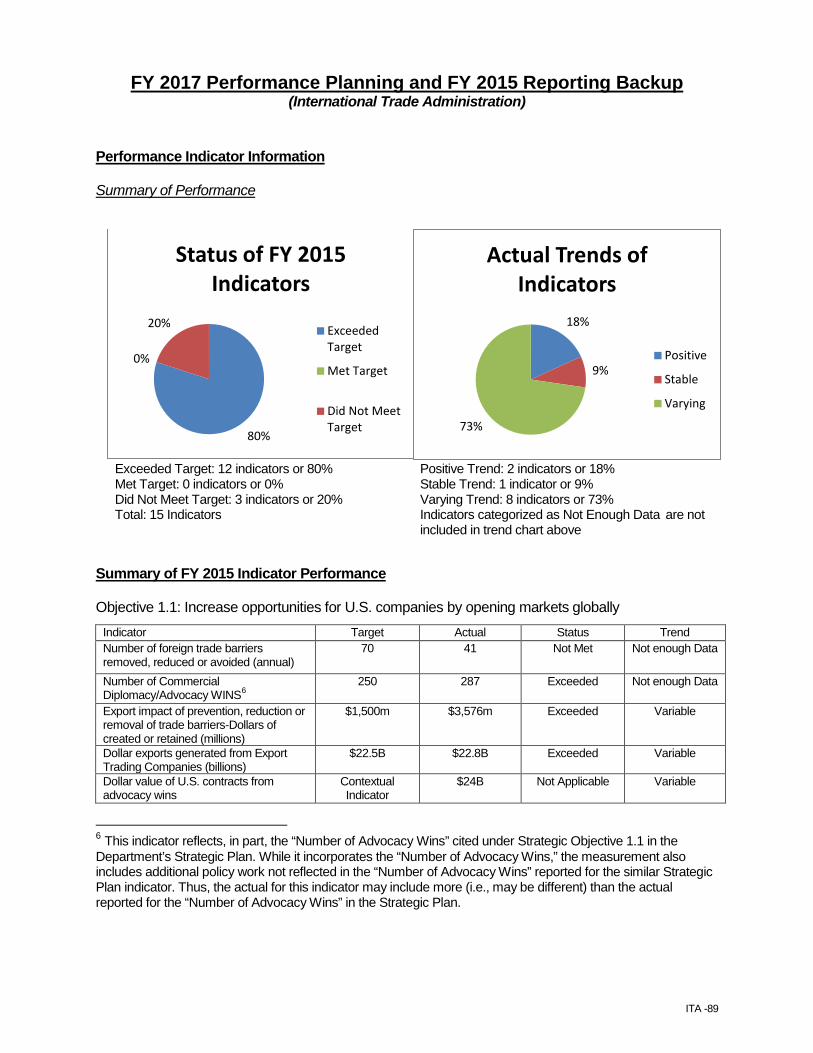
ITA -89
FY 2017 Performance Planning and FY 2015 Reporting Backup (International Trade Administration)
Performance Indicator Information Summary of Performance
Exceeded Target: 12 indicators or 80% Met Target: 0 indicators or 0% Did Not Meet Target: 3 indicators or 20% Total: 15 Indicators
Positive Trend: 2 indicators or 18% Stable Trend: 1 indicator or 9% Varying Trend: 8 indicators or 73% Indicators categorized as Not Enough Data are not included in trend chart above
Summary of FY 2015 Indicator Performance Objective 1.1: Increase opportunities for U.S. companies by opening markets globally
Indicator Target Actual Status Trend Number of foreign trade barriers removed, reduced or avoided (annual)
70 41 Not Met Not enough Data
Number of Commercial Diplomacy/Advocacy WINS6
250 287 Exceeded Not enough Data
Export impact of prevention, reduction or removal of trade barriers-Dollars of created or retained (millions)
$1,500m $3,576m Exceeded Variable
Dollar exports generated from Export Trading Companies (billions)
$22.5B $22.8B Exceeded Variable
Dollar value of U.S. contracts from advocacy wins
Contextual Indicator
$24B Not Applicable Variable
6 This indicator reflects, in part, the “Number of Advocacy Wins” cited under Strategic Objective 1.1 in the Department’s Strategic Plan. While it incorporates the “Number of Advocacy Wins,” the measurement also includes additional policy work not reflected in the “Number of Advocacy Wins” reported for the similar Strategic Plan indicator. Thus, the actual for this indicator may include more (i.e., may be different) than the actual reported for the “Number of Advocacy Wins” in the Strategic Plan.
80%
0%
20%
Status of FY 2015 Indicators
ExceededTarget
Met Target
Did Not MeetTarget
18%
9%
73%
Actual Trends of Indicators
Positive
Stable
Varying
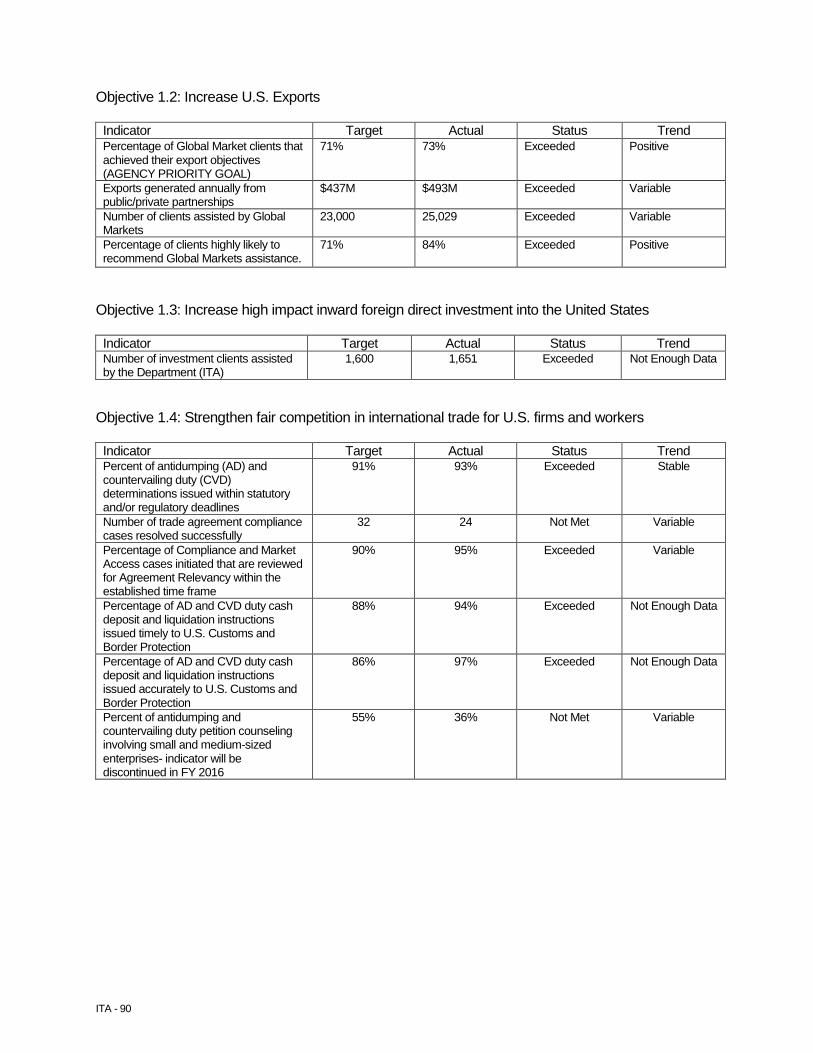
ITA - 90
Objective 1.2: Increase U.S. Exports Indicator Target Actual Status Trend Percentage of Global Market clients that achieved their export objectives (AGENCY PRIORITY GOAL)
71% 73% Exceeded Positive
Exports generated annually from public/private partnerships
$437M $493M Exceeded Variable
Number of clients assisted by Global Markets
23,000 25,029 Exceeded Variable
Percentage of clients highly likely to recommend Global Markets assistance.
71% 84% Exceeded Positive
Objective 1.3: Increase high impact inward foreign direct investment into the United States Indicator Target Actual Status Trend Number of investment clients assisted by the Department (ITA)
1,600 1,651 Exceeded Not Enough Data
Objective 1.4: Strengthen fair competition in international trade for U.S. firms and workers Indicator Target Actual Status Trend Percent of antidumping (AD) and countervailing duty (CVD) determinations issued within statutory and/or regulatory deadlines
91% 93% Exceeded Stable
Number of trade agreement compliance cases resolved successfully
32 24 Not Met Variable
Percentage of Compliance and Market Access cases initiated that are reviewed for Agreement Relevancy within the established time frame
90% 95% Exceeded Variable
Percentage of AD and CVD duty cash deposit and liquidation instructions issued timely to U.S. Customs and Border Protection
88% 94% Exceeded Not Enough Data
Percentage of AD and CVD duty cash deposit and liquidation instructions issued accurately to U.S. Customs and Border Protection
86% 97% Exceeded Not Enough Data
Percent of antidumping and countervailing duty petition counseling involving small and medium-sized enterprises- indicator will be discontinued in FY 2016
55% 36% Not Met Variable
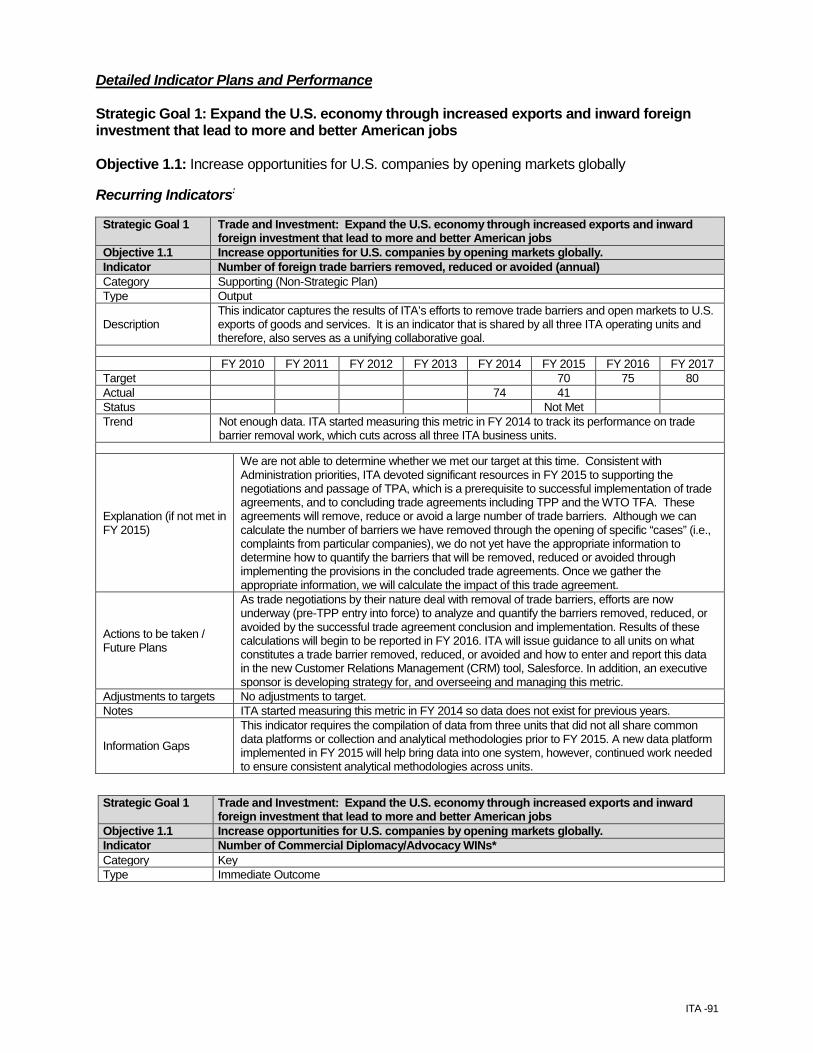
ITA -91
Detailed Indicator Plans and Performance Strategic Goal 1: Expand the U.S. economy through increased exports and inward foreign investment that lead to more and better American jobs Objective 1.1: Increase opportunities for U.S. companies by opening markets globally Recurring Indicators:
Strategic Goal 1 Trade and Investment: Expand the U.S. economy through increased exports and inward foreign investment that lead to more and better American jobs
Objective 1.1 Increase opportunities for U.S. companies by opening markets globally. Indicator Number of foreign trade barriers removed, reduced or avoided (annual) Category Supporting (Non-Strategic Plan) Type Output
Description This indicator captures the results of ITA’s efforts to remove trade barriers and open markets to U.S. exports of goods and services. It is an indicator that is shared by all three ITA operating units and therefore, also serves as a unifying collaborative goal.
FY 2010 FY 2011 FY 2012 FY 2013 FY 2014 FY 2015 FY 2016 FY 2017 Target 70 75 80 Actual 74 41 Status Not Met Trend Not enough data. ITA started measuring this metric in FY 2014 to track its performance on trade
barrier removal work, which cuts across all three ITA business units.
Explanation (if not met in FY 2015)
We are not able to determine whether we met our target at this time. Consistent with Administration priorities, ITA devoted significant resources in FY 2015 to supporting the negotiations and passage of TPA, which is a prerequisite to successful implementation of trade agreements, and to concluding trade agreements including TPP and the WTO TFA. These agreements will remove, reduce or avoid a large number of trade barriers. Although we can calculate the number of barriers we have removed through the opening of specific “cases” (i.e., complaints from particular companies), we do not yet have the appropriate information to determine how to quantify the barriers that will be removed, reduced or avoided through implementing the provisions in the concluded trade agreements. Once we gather the appropriate information, we will calculate the impact of this trade agreement.
Actions to be taken / Future Plans
As trade negotiations by their nature deal with removal of trade barriers, efforts are now underway (pre-TPP entry into force) to analyze and quantify the barriers removed, reduced, or avoided by the successful trade agreement conclusion and implementation. Results of these calculations will begin to be reported in FY 2016. ITA will issue guidance to all units on what constitutes a trade barrier removed, reduced, or avoided and how to enter and report this data in the new Customer Relations Management (CRM) tool, Salesforce. In addition, an executive sponsor is developing strategy for, and overseeing and managing this metric.
Adjustments to targets No adjustments to target. Notes ITA started measuring this metric in FY 2014 so data does not exist for previous years.
Information Gaps
This indicator requires the compilation of data from three units that did not all share common data platforms or collection and analytical methodologies prior to FY 2015. A new data platform implemented in FY 2015 will help bring data into one system, however, continued work needed to ensure consistent analytical methodologies across units.
Strategic Goal 1 Trade and Investment: Expand the U.S. economy through increased exports and inward foreign investment that lead to more and better American jobs
Objective 1.1 Increase opportunities for U.S. companies by opening markets globally. Indicator Number of Commercial Diplomacy/Advocacy WINs* Category Key Type Immediate Outcome
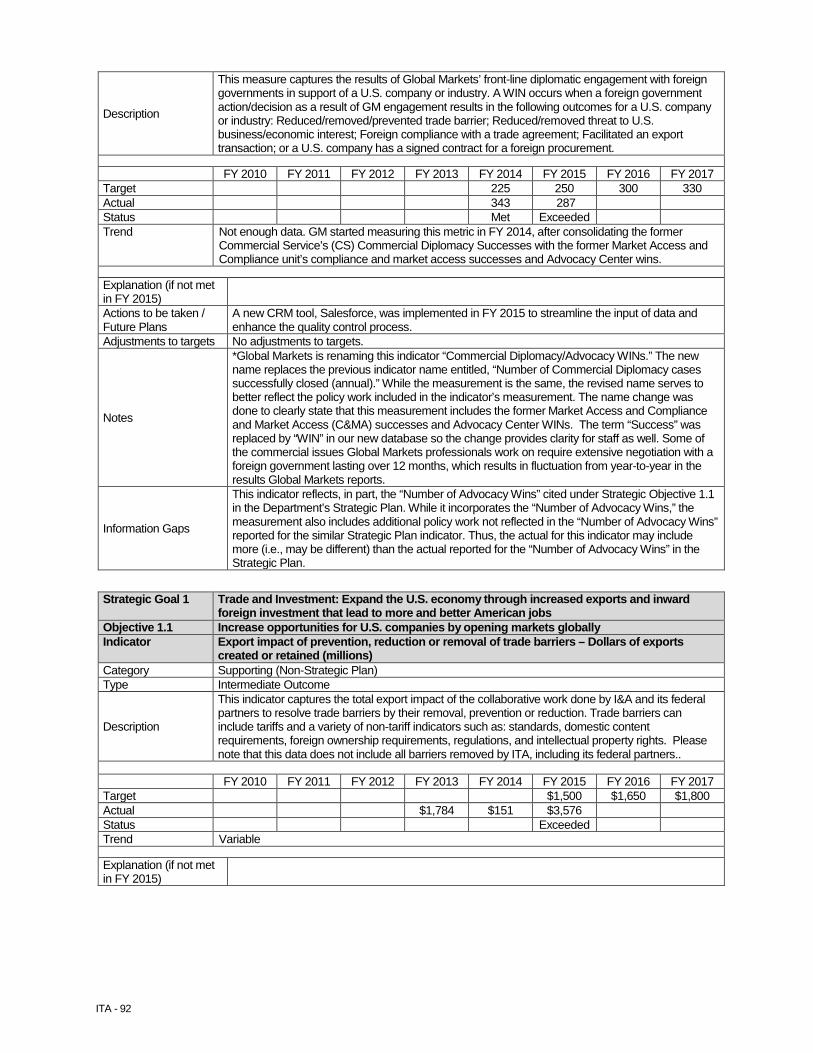
ITA - 92
Description
This measure captures the results of Global Markets’ front-line diplomatic engagement with foreign governments in support of a U.S. company or industry. A WIN occurs when a foreign government action/decision as a result of GM engagement results in the following outcomes for a U.S. company or industry: Reduced/removed/prevented trade barrier; Reduced/removed threat to U.S. business/economic interest; Foreign compliance with a trade agreement; Facilitated an export transaction; or a U.S. company has a signed contract for a foreign procurement.
FY 2010 FY 2011 FY 2012 FY 2013 FY 2014 FY 2015 FY 2016 FY 2017 Target 225 250 300 330 Actual 343 287 Status Met Exceeded Trend Not enough data. GM started measuring this metric in FY 2014, after consolidating the former
Commercial Service’s (CS) Commercial Diplomacy Successes with the former Market Access and Compliance unit’s compliance and market access successes and Advocacy Center wins.
Explanation (if not met in FY 2015)
Actions to be taken / Future Plans
A new CRM tool, Salesforce, was implemented in FY 2015 to streamline the input of data and enhance the quality control process.
Adjustments to targets No adjustments to targets.
Notes
*Global Markets is renaming this indicator “Commercial Diplomacy/Advocacy WINs.” The new name replaces the previous indicator name entitled, “Number of Commercial Diplomacy cases successfully closed (annual).” While the measurement is the same, the revised name serves to better reflect the policy work included in the indicator’s measurement. The name change was done to clearly state that this measurement includes the former Market Access and Compliance and Market Access (C&MA) successes and Advocacy Center WINs. The term “Success” was replaced by “WIN” in our new database so the change provides clarity for staff as well. Some of the commercial issues Global Markets professionals work on require extensive negotiation with a foreign government lasting over 12 months, which results in fluctuation from year-to-year in the results Global Markets reports.
Information Gaps
This indicator reflects, in part, the “Number of Advocacy Wins” cited under Strategic Objective 1.1 in the Department’s Strategic Plan. While it incorporates the “Number of Advocacy Wins,” the measurement also includes additional policy work not reflected in the “Number of Advocacy Wins” reported for the similar Strategic Plan indicator. Thus, the actual for this indicator may include more (i.e., may be different) than the actual reported for the “Number of Advocacy Wins” in the Strategic Plan.
Strategic Goal 1 Trade and Investment: Expand the U.S. economy through increased exports and inward foreign investment that lead to more and better American jobs
Objective 1.1 Increase opportunities for U.S. companies by opening markets globally Indicator Export impact of prevention, reduction or removal of trade barriers – Dollars of exports
created or retained (millions) Category Supporting (Non-Strategic Plan) Type Intermediate Outcome
Description
This indicator captures the total export impact of the collaborative work done by I&A and its federal partners to resolve trade barriers by their removal, prevention or reduction. Trade barriers can include tariffs and a variety of non-tariff indicators such as: standards, domestic content requirements, foreign ownership requirements, regulations, and intellectual property rights. Please note that this data does not include all barriers removed by ITA, including its federal partners..
FY 2010 FY 2011 FY 2012 FY 2013 FY 2014 FY 2015 FY 2016 FY 2017 Target $1,500 $1,650 $1,800 Actual $1,784 $151 $3,576 Status Exceeded Trend Variable Explanation (if not met in FY 2015)

ITA -93
Actions to be taken / Future Plans
The FY 2016 actual will be significantly impacted by the conclusion of the Trans Pacific Partnership trade agreement. ITA will continue to assess this metric to determine whether any further improvements may be warranted.
Adjustments to targets Targets have been revised upward because previous targets were based on I&A’s estimated contribution only. The reported actual export impact now reflects the total export impact of the barrier resolution. Accordingly, targets needed to be revised to reflect that change.
Notes
*Based on ITA’s evaluation, it is revising this metric to reflect the total export impact, rather than only I&A’s contribution. ITA determined that the revised methodology is a more accurate calculation and captures the collaborative work achieved with its federal partners, including the Office of the United States Trade Representative. Accordingly, prior actuals for FY 2013 through FY 2014 have been adjusted to reflect the methodological change. These calculations are based on current economic literature and standard economic models. These calculations use data from Census, and a variety of international sources (e.g., IMF, World Bank, United Nations). In addition, input from the relevant industry is sought when appropriate. Since ITA is now reporting the total export impact, FY 2013 and FY 2014 actuals and FY 2015-2017 targets have been revised to reflect that change.
Information Gaps
Strategic Goal 1 Trade and Investment: Expand the U.S. economy through increased exports and inward foreign investment that lead to more and better American jobs
Objective 1.1 Increase opportunities for U.S. companies by opening markets globally Indicator Dollar exports generated from Export Trading Companies (billions) Category Supporting (Non-Strategic Plan) Type Intermediate
Description
The Export Trading Company Act allows U.S. businesses to form export joint ventures called Export Trading Companies (ETC). These ETCs are formed for various purposes such as to negotiate lower shipping rates, pool resources to expand an export market base, avoid export rivalry by coordinating an export strategy, and sell under a single label. ITA, with the concurrence of the Justice Department, issues a Certificate of Review under the Act. This indicator captures the actual export sales in billions of dollars.
FY 2010 FY 2011 FY 2012 FY 2013 FY 2014 FY 2015 FY 2016 FY 2017 Target $22.5 $23.5 $24.0 Actual $17.3 $23.9 $21.1 $22.8 $23.5 $22.8 Status Exceeded Trend Variable Explanation (if not met in FY 2015)
Actions to be taken / Future Plans
Adjustments to targets No adjustments to target. Notes None
Information Gaps Timely reporting of export sales by Export Trading Companies. Pursuant to 15 CFR Part 325, full receipt by ITA of all current participating ETC’s reported export sales generally lags 12 months from reporting year. Consequently, most recent year data are estimated.
Other Indicators for 1.1
Strategic Goal 1 Trade and Investment: Expand the U.S. economy through increased exports and inward foreign investment that lead to more and better American jobs
Objective 1.1 Increase opportunities for U.S. companies by opening markets globally. Indicator Dollar Value of U.S. contracts from advocacy wins Type Contextual
Description
The estimated dollar value (in billions) of U.S. goods or services to a foreign government of contracts signed by U.S. businesses or their representatives with U.S. Government assistance. Commerce serves as the Chair of the Interagency Task Force on Commercial Advocacy and is the lead coordinator of advocacy efforts across the U.S. Government.
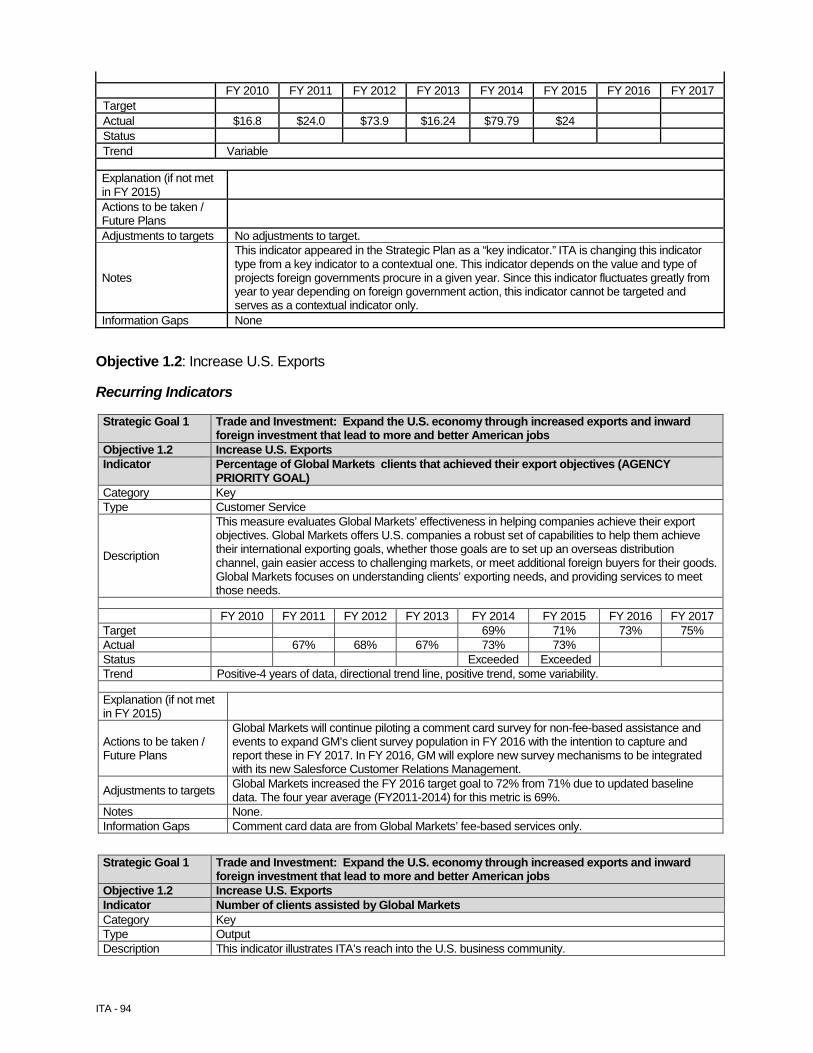
ITA - 94
FY 2010 FY 2011 FY 2012 FY 2013 FY 2014 FY 2015 FY 2016 FY 2017 Target Actual $16.8 $24.0 $73.9 $16.24 $79.79 $24 Status Trend Variable Explanation (if not met in FY 2015) Actions to be taken / Future Plans
Adjustments to targets No adjustments to target.
Notes
This indicator appeared in the Strategic Plan as a “key indicator.” ITA is changing this indicator type from a key indicator to a contextual one. This indicator depends on the value and type of projects foreign governments procure in a given year. Since this indicator fluctuates greatly from year to year depending on foreign government action, this indicator cannot be targeted and serves as a contextual indicator only.
Information Gaps None Objective 1.2: Increase U.S. Exports Recurring Indicators
Strategic Goal 1 Trade and Investment: Expand the U.S. economy through increased exports and inward foreign investment that lead to more and better American jobs
Objective 1.2 Increase U.S. Exports Indicator Percentage of Global Markets clients that achieved their export objectives (AGENCY
PRIORITY GOAL) Category Key Type Customer Service
Description
This measure evaluates Global Markets’ effectiveness in helping companies achieve their export objectives. Global Markets offers U.S. companies a robust set of capabilities to help them achieve their international exporting goals, whether those goals are to set up an overseas distribution channel, gain easier access to challenging markets, or meet additional foreign buyers for their goods. Global Markets focuses on understanding clients’ exporting needs, and providing services to meet those needs.
FY 2010 FY 2011 FY 2012 FY 2013 FY 2014 FY 2015 FY 2016 FY 2017 Target 69% 71% 73% 75% Actual 67% 68% 67% 73% 73% Status Exceeded Exceeded Trend Positive-4 years of data, directional trend line, positive trend, some variability. Explanation (if not met in FY 2015)
Actions to be taken / Future Plans
Global Markets will continue piloting a comment card survey for non-fee-based assistance and events to expand GM’s client survey population in FY 2016 with the intention to capture and report these in FY 2017. In FY 2016, GM will explore new survey mechanisms to be integrated with its new Salesforce Customer Relations Management.
Adjustments to targets Global Markets increased the FY 2016 target goal to 72% from 71% due to updated baseline data. The four year average (FY2011-2014) for this metric is 69%.
Notes None. Information Gaps Comment card data are from Global Markets’ fee-based services only.
Strategic Goal 1 Trade and Investment: Expand the U.S. economy through increased exports and inward foreign investment that lead to more and better American jobs
Objective 1.2 Increase U.S. Exports Indicator Number of clients assisted by Global Markets Category Key Type Output Description This indicator illustrates ITA’s reach into the U.S. business community.
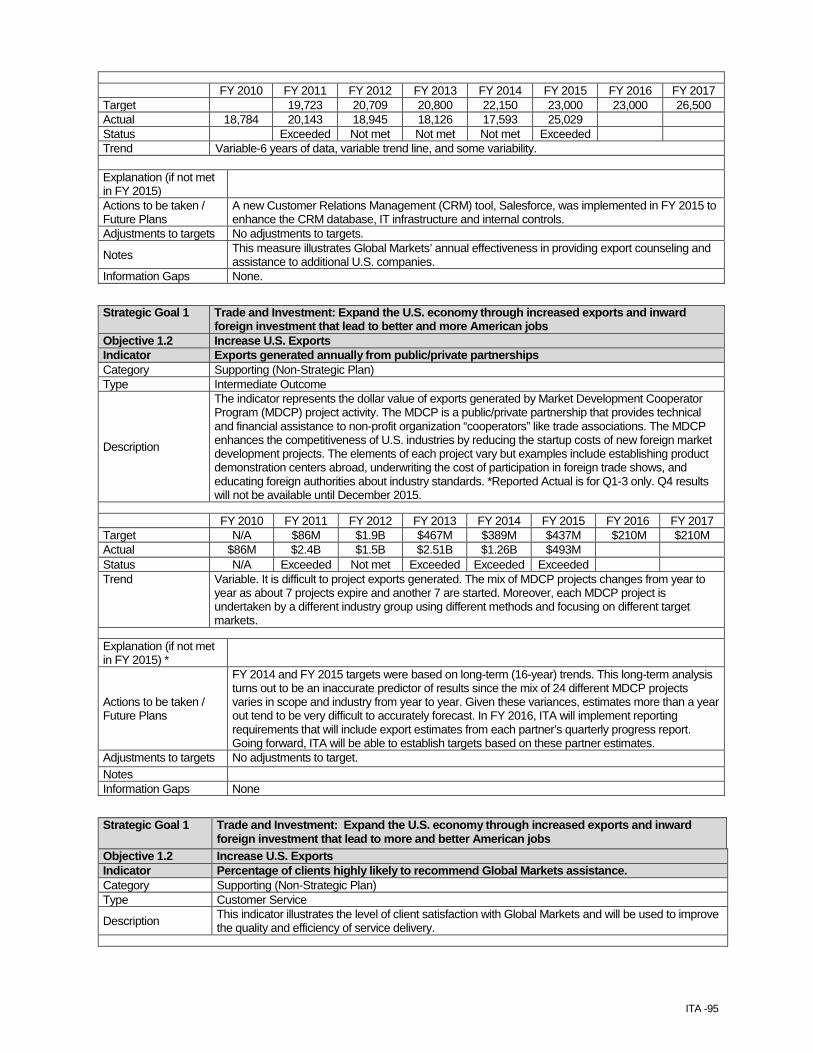
ITA -95
FY 2010 FY 2011 FY 2012 FY 2013 FY 2014 FY 2015 FY 2016 FY 2017 Target 19,723 20,709 20,800 22,150 23,000 23,000 26,500 Actual 18,784 20,143 18,945 18,126 17,593 25,029 Status Exceeded Not met Not met Not met Exceeded Trend Variable-6 years of data, variable trend line, and some variability. Explanation (if not met in FY 2015)
Actions to be taken / Future Plans
A new Customer Relations Management (CRM) tool, Salesforce, was implemented in FY 2015 to enhance the CRM database, IT infrastructure and internal controls.
Adjustments to targets No adjustments to targets.
Notes This measure illustrates Global Markets’ annual effectiveness in providing export counseling and assistance to additional U.S. companies.
Information Gaps None.
Strategic Goal 1 Trade and Investment: Expand the U.S. economy through increased exports and inward foreign investment that lead to better and more American jobs
Objective 1.2 Increase U.S. Exports Indicator Exports generated annually from public/private partnerships Category Supporting (Non-Strategic Plan) Type Intermediate Outcome
Description
The indicator represents the dollar value of exports generated by Market Development Cooperator Program (MDCP) project activity. The MDCP is a public/private partnership that provides technical and financial assistance to non-profit organization “cooperators” like trade associations. The MDCP enhances the competitiveness of U.S. industries by reducing the startup costs of new foreign market development projects. The elements of each project vary but examples include establishing product demonstration centers abroad, underwriting the cost of participation in foreign trade shows, and educating foreign authorities about industry standards. *Reported Actual is for Q1-3 only. Q4 results will not be available until December 2015.
FY 2010 FY 2011 FY 2012 FY 2013 FY 2014 FY 2015 FY 2016 FY 2017 Target N/A $86M $1.9B $467M $389M $437M $210M $210M Actual $86M $2.4B $1.5B $2.51B $1.26B $493M Status N/A Exceeded Not met Exceeded Exceeded Exceeded Trend Variable. It is difficult to project exports generated. The mix of MDCP projects changes from year to
year as about 7 projects expire and another 7 are started. Moreover, each MDCP project is undertaken by a different industry group using different methods and focusing on different target markets.
Explanation (if not met in FY 2015) *
Actions to be taken / Future Plans
FY 2014 and FY 2015 targets were based on long-term (16-year) trends. This long-term analysis turns out to be an inaccurate predictor of results since the mix of 24 different MDCP projects varies in scope and industry from year to year. Given these variances, estimates more than a year out tend to be very difficult to accurately forecast. In FY 2016, ITA will implement reporting requirements that will include export estimates from each partner’s quarterly progress report. Going forward, ITA will be able to establish targets based on these partner estimates.
Adjustments to targets No adjustments to target. Notes Information Gaps None
Strategic Goal 1 Trade and Investment: Expand the U.S. economy through increased exports and inward foreign investment that lead to more and better American jobs
Objective 1.2 Increase U.S. Exports Indicator Percentage of clients highly likely to recommend Global Markets assistance. Category Supporting (Non-Strategic Plan) Type Customer Service
Description This indicator illustrates the level of client satisfaction with Global Markets and will be used to improve the quality and efficiency of service delivery.

ITA - 96
FY 2010 FY 2011 FY 2012 FY 2013 FY 2014 FY 2015 FY 2016 FY 2017 Target 66% 69% 71% 81% 82% Actual 77% 79% 82% 78% 83% 84% Status Exceeded Exceeded Exceeded Trend Positive- 6 years of data, directional trend line, positive trend, some variability. Explanation (if not met in FY 2015)
Actions to be taken / Future Plans
Global Markets will continue piloting a comment card survey for non-fee-based assistance and events to expand Global Markets’ client survey population in FY 2016 with the intention to capture and report these in FY 2017. In FY 2016, Global Markets will explore new survey mechanisms to be integrated with its new Salesforce Customer Relations Management.
Adjustments to targets Global Markets increased FY 2016’s target goal to 81% from 73% due to updated baseline data. The four year average (FY 2011-2014) for this metric is 80%.
Notes None. Information Gaps Comment card data are from Global Markets’ fee-based services only.
Other Indicators for 1.2:
Strategic Goal 1 Trade and Investment: Expand the U.S. economy through increased exports and inward foreign investment that lead to more and better American jobs
Objective 1.2 Increase U.S. exports Indicator Number of U.S small- and medium-sized enterprise (SME) exporter clients assisted by Global
Markets Category Other Type Output
Description This is a contextual indicator to enhance ITA’s reach into the U.S. small- and medium-sized business community.
FY 2010 FY 2011 FY 2012 FY 2013 FY 2014 FY 2015 FY 2016 FY 2017 Actual
Notes This measure illustrates Global Markets’ annual effectiveness in providing export counseling and assistance to small and medium-sized enterprises. This is a contextual indicator and no target has been set. No previous data exists. Global Markets will begin collecting data in FY 2016.
Information Gaps Global Markets will only count assistance to companies that have 500 or fewer employees as SMEs.
Objective 1.3: Increase high impact inward foreign direct investment into the United States Recurring Indicators:
Strategic Goal 1 Trade and Investment: Expand the U.S. economy through increased exports and inward foreign investment that lead to more and better American jobs
Objective 1.3 Increase high impact inward foreign investment into the United States Indicator Number of investment clients assisted by the Department (ITA) Category Key Type Output
Description This measure captures the number of domestic and foreign firms, as well as domestic and foreign Economic Development Organizations, assisted by the Department of Commerce to attract inward investment into the United States.
FY 2010 FY 2011 FY 2012 FY 2013 FY 2014 FY 2015 FY 2016 FY 2017 Target 900 1,600 2,400 2,600 Actual 1,038 1,651 Status Exceeded Exceeded Trend Not enough data. Explanation (if not met in FY 2015)
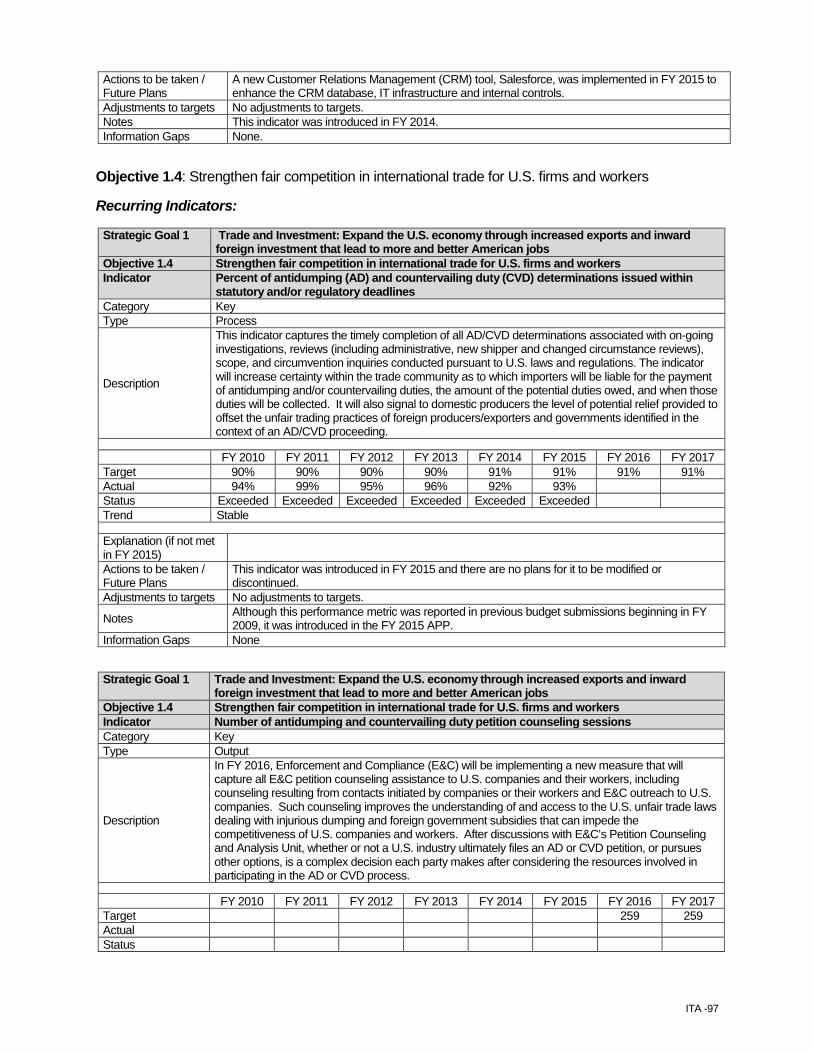
ITA -97
Actions to be taken / Future Plans
A new Customer Relations Management (CRM) tool, Salesforce, was implemented in FY 2015 to enhance the CRM database, IT infrastructure and internal controls.
Adjustments to targets No adjustments to targets. Notes This indicator was introduced in FY 2014. Information Gaps None.
Objective 1.4: Strengthen fair competition in international trade for U.S. firms and workers Recurring Indicators:
Strategic Goal 1 Trade and Investment: Expand the U.S. economy through increased exports and inward foreign investment that lead to more and better American jobs
Objective 1.4 Strengthen fair competition in international trade for U.S. firms and workers Indicator Percent of antidumping (AD) and countervailing duty (CVD) determinations issued within
statutory and/or regulatory deadlines Category Key Type Process
Description
This indicator captures the timely completion of all AD/CVD determinations associated with on-going investigations, reviews (including administrative, new shipper and changed circumstance reviews), scope, and circumvention inquiries conducted pursuant to U.S. laws and regulations. The indicator will increase certainty within the trade community as to which importers will be liable for the payment of antidumping and/or countervailing duties, the amount of the potential duties owed, and when those duties will be collected. It will also signal to domestic producers the level of potential relief provided to offset the unfair trading practices of foreign producers/exporters and governments identified in the context of an AD/CVD proceeding.
FY 2010 FY 2011 FY 2012 FY 2013 FY 2014 FY 2015 FY 2016 FY 2017 Target 90% 90% 90% 90% 91% 91% 91% 91% Actual 94% 99% 95% 96% 92% 93% Status Exceeded Exceeded Exceeded Exceeded Exceeded Exceeded Trend Stable Explanation (if not met in FY 2015)
Actions to be taken / Future Plans
This indicator was introduced in FY 2015 and there are no plans for it to be modified or discontinued.
Adjustments to targets No adjustments to targets.
Notes Although this performance metric was reported in previous budget submissions beginning in FY 2009, it was introduced in the FY 2015 APP.
Information Gaps None
Strategic Goal 1 Trade and Investment: Expand the U.S. economy through increased exports and inward foreign investment that lead to more and better American jobs
Objective 1.4 Strengthen fair competition in international trade for U.S. firms and workers Indicator Number of antidumping and countervailing duty petition counseling sessions Category Key Type Output
Description
In FY 2016, Enforcement and Compliance (E&C) will be implementing a new measure that will capture all E&C petition counseling assistance to U.S. companies and their workers, including counseling resulting from contacts initiated by companies or their workers and E&C outreach to U.S. companies. Such counseling improves the understanding of and access to the U.S. unfair trade laws dealing with injurious dumping and foreign government subsidies that can impede the competitiveness of U.S. companies and workers. After discussions with E&C’s Petition Counseling and Analysis Unit, whether or not a U.S. industry ultimately files an AD or CVD petition, or pursues other options, is a complex decision each party makes after considering the resources involved in participating in the AD or CVD process.
FY 2010 FY 2011 FY 2012 FY 2013 FY 2014 FY 2015 FY 2016 FY 2017 Target 259 259 Actual Status
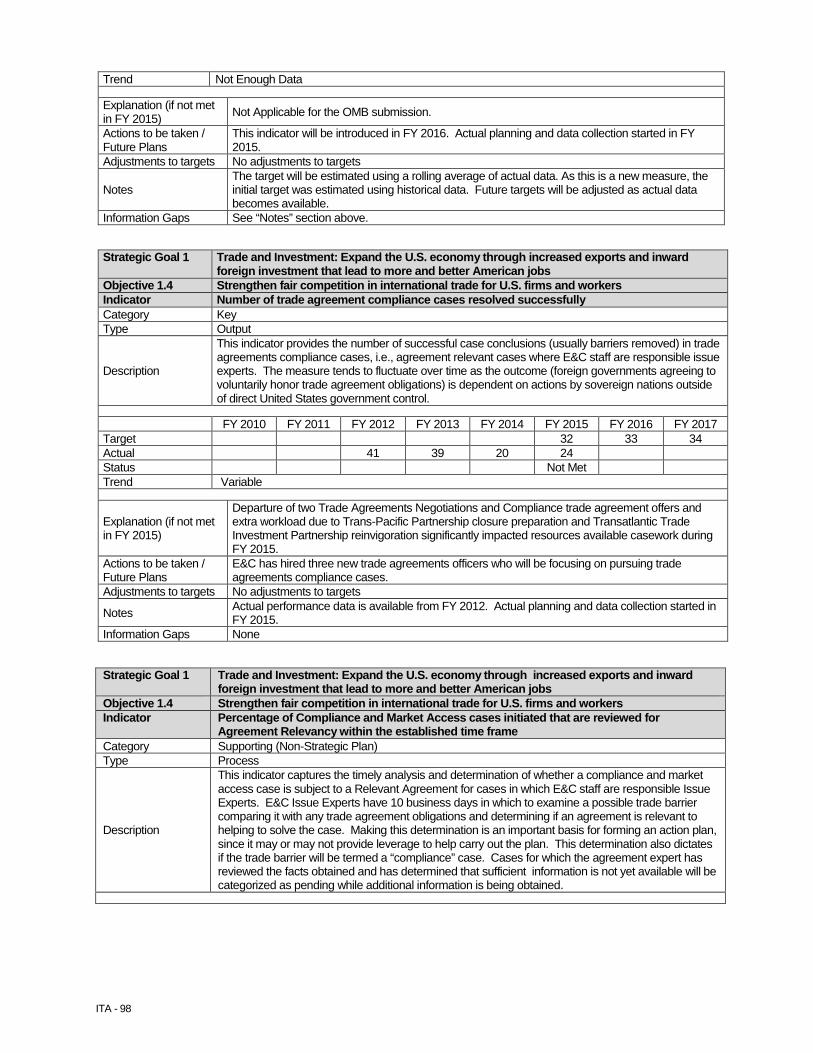
ITA - 98
Trend Not Enough Data Explanation (if not met in FY 2015) Not Applicable for the OMB submission.
Actions to be taken / Future Plans
This indicator will be introduced in FY 2016. Actual planning and data collection started in FY 2015.
Adjustments to targets No adjustments to targets
Notes The target will be estimated using a rolling average of actual data. As this is a new measure, the initial target was estimated using historical data. Future targets will be adjusted as actual data becomes available.
Information Gaps See “Notes” section above.
Strategic Goal 1 Trade and Investment: Expand the U.S. economy through increased exports and inward foreign investment that lead to more and better American jobs
Objective 1.4 Strengthen fair competition in international trade for U.S. firms and workers Indicator Number of trade agreement compliance cases resolved successfully Category Key Type Output
Description
This indicator provides the number of successful case conclusions (usually barriers removed) in trade agreements compliance cases, i.e., agreement relevant cases where E&C staff are responsible issue experts. The measure tends to fluctuate over time as the outcome (foreign governments agreeing to voluntarily honor trade agreement obligations) is dependent on actions by sovereign nations outside of direct United States government control.
FY 2010 FY 2011 FY 2012 FY 2013 FY 2014 FY 2015 FY 2016 FY 2017 Target 32 33 34 Actual 41 39 20 24 Status Not Met Trend Variable
Explanation (if not met in FY 2015)
Departure of two Trade Agreements Negotiations and Compliance trade agreement offers and extra workload due to Trans-Pacific Partnership closure preparation and Transatlantic Trade Investment Partnership reinvigoration significantly impacted resources available casework during FY 2015.
Actions to be taken / Future Plans
E&C has hired three new trade agreements officers who will be focusing on pursuing trade agreements compliance cases.
Adjustments to targets No adjustments to targets
Notes Actual performance data is available from FY 2012. Actual planning and data collection started in FY 2015.
Information Gaps None
Strategic Goal 1 Trade and Investment: Expand the U.S. economy through increased exports and inward foreign investment that lead to more and better American jobs
Objective 1.4 Strengthen fair competition in international trade for U.S. firms and workers Indicator Percentage of Compliance and Market Access cases initiated that are reviewed for
Agreement Relevancy within the established time frame Category Supporting (Non-Strategic Plan) Type Process
Description
This indicator captures the timely analysis and determination of whether a compliance and market access case is subject to a Relevant Agreement for cases in which E&C staff are responsible Issue Experts. E&C Issue Experts have 10 business days in which to examine a possible trade barrier comparing it with any trade agreement obligations and determining if an agreement is relevant to helping to solve the case. Making this determination is an important basis for forming an action plan, since it may or may not provide leverage to help carry out the plan. This determination also dictates if the trade barrier will be termed a “compliance” case. Cases for which the agreement expert has reviewed the facts obtained and has determined that sufficient information is not yet available will be categorized as pending while additional information is being obtained.
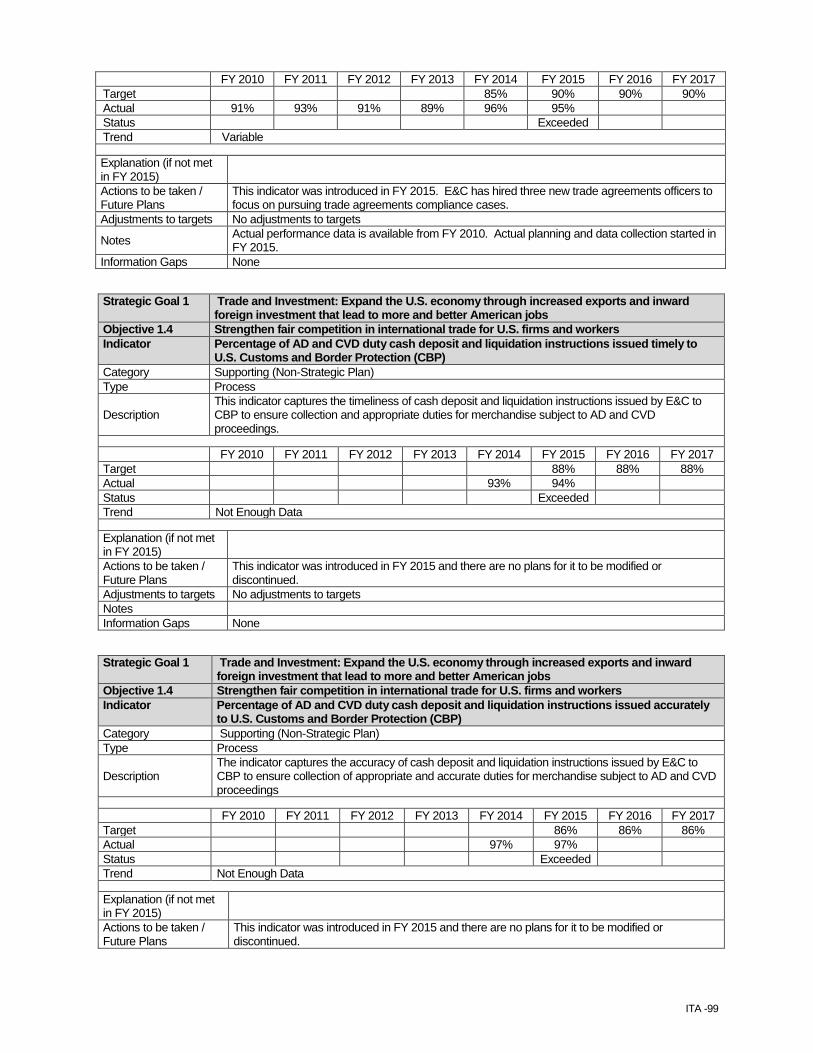
ITA -99
FY 2010 FY 2011 FY 2012 FY 2013 FY 2014 FY 2015 FY 2016 FY 2017 Target 85% 90% 90% 90% Actual 91% 93% 91% 89% 96% 95% Status Exceeded Trend Variable Explanation (if not met in FY 2015)
Actions to be taken / Future Plans
This indicator was introduced in FY 2015. E&C has hired three new trade agreements officers to focus on pursuing trade agreements compliance cases.
Adjustments to targets No adjustments to targets
Notes Actual performance data is available from FY 2010. Actual planning and data collection started in FY 2015.
Information Gaps None
Strategic Goal 1 Trade and Investment: Expand the U.S. economy through increased exports and inward foreign investment that lead to more and better American jobs
Objective 1.4 Strengthen fair competition in international trade for U.S. firms and workers Indicator Percentage of AD and CVD duty cash deposit and liquidation instructions issued timely to
U.S. Customs and Border Protection (CBP) Category Supporting (Non-Strategic Plan) Type Process
Description This indicator captures the timeliness of cash deposit and liquidation instructions issued by E&C to CBP to ensure collection and appropriate duties for merchandise subject to AD and CVD proceedings.
FY 2010 FY 2011 FY 2012 FY 2013 FY 2014 FY 2015 FY 2016 FY 2017 Target 88% 88% 88% Actual 93% 94% Status Exceeded Trend Not Enough Data Explanation (if not met in FY 2015)
Actions to be taken / Future Plans
This indicator was introduced in FY 2015 and there are no plans for it to be modified or discontinued.
Adjustments to targets No adjustments to targets Notes Information Gaps None
Strategic Goal 1 Trade and Investment: Expand the U.S. economy through increased exports and inward foreign investment that lead to more and better American jobs
Objective 1.4 Strengthen fair competition in international trade for U.S. firms and workers Indicator Percentage of AD and CVD duty cash deposit and liquidation instructions issued accurately
to U.S. Customs and Border Protection (CBP) Category Supporting (Non-Strategic Plan) Type Process
Description The indicator captures the accuracy of cash deposit and liquidation instructions issued by E&C to CBP to ensure collection of appropriate and accurate duties for merchandise subject to AD and CVD proceedings
FY 2010 FY 2011 FY 2012 FY 2013 FY 2014 FY 2015 FY 2016 FY 2017 Target 86% 86% 86% Actual 97% 97% Status Exceeded Trend Not Enough Data Explanation (if not met in FY 2015)
Actions to be taken / Future Plans
This indicator was introduced in FY 2015 and there are no plans for it to be modified or discontinued.
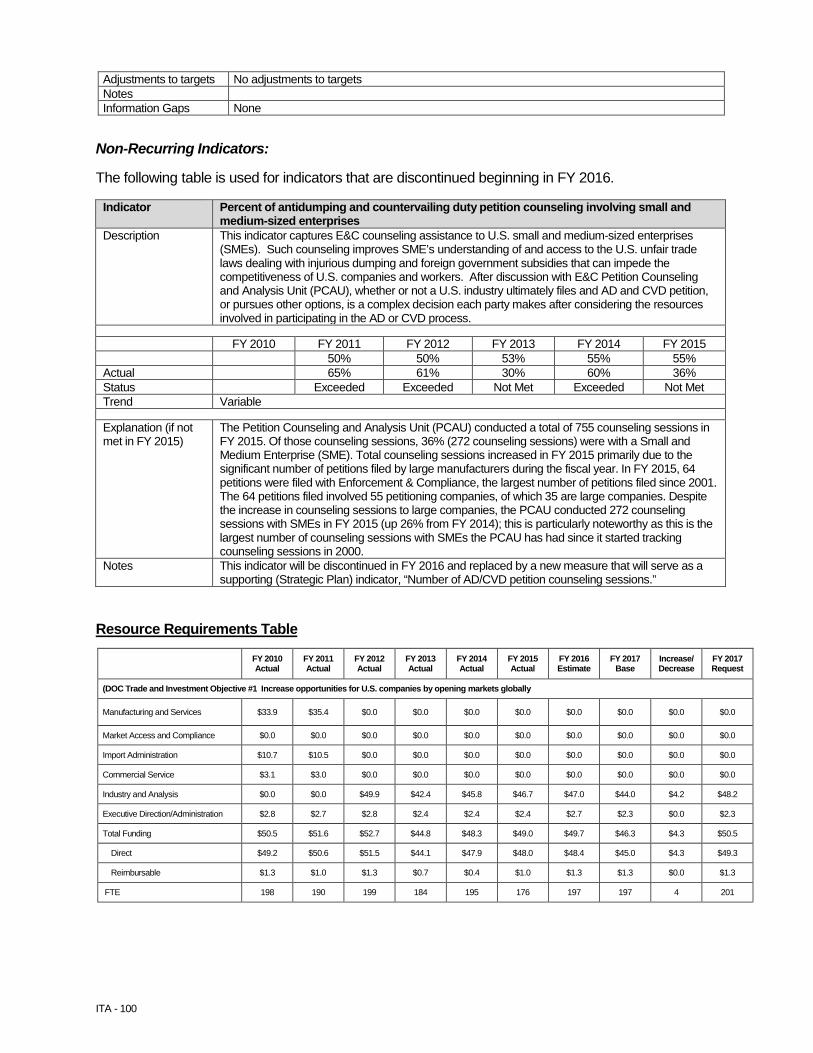
ITA - 100
Adjustments to targets No adjustments to targets Notes Information Gaps None
Non-Recurring Indicators: The following table is used for indicators that are discontinued beginning in FY 2016.
Indicator Percent of antidumping and countervailing duty petition counseling involving small and medium-sized enterprises
Description This indicator captures E&C counseling assistance to U.S. small and medium-sized enterprises (SMEs). Such counseling improves SME’s understanding of and access to the U.S. unfair trade laws dealing with injurious dumping and foreign government subsidies that can impede the competitiveness of U.S. companies and workers. After discussion with E&C Petition Counseling and Analysis Unit (PCAU), whether or not a U.S. industry ultimately files and AD and CVD petition, or pursues other options, is a complex decision each party makes after considering the resources involved in participating in the AD or CVD process.
FY 2010 FY 2011 FY 2012 FY 2013 FY 2014 FY 2015 50% 50% 53% 55% 55% Actual 65% 61% 30% 60% 36% Status Exceeded Exceeded Not Met Exceeded Not Met Trend Variable Explanation (if not met in FY 2015)
The Petition Counseling and Analysis Unit (PCAU) conducted a total of 755 counseling sessions in FY 2015. Of those counseling sessions, 36% (272 counseling sessions) were with a Small and Medium Enterprise (SME). Total counseling sessions increased in FY 2015 primarily due to the significant number of petitions filed by large manufacturers during the fiscal year. In FY 2015, 64 petitions were filed with Enforcement & Compliance, the largest number of petitions filed since 2001. The 64 petitions filed involved 55 petitioning companies, of which 35 are large companies. Despite the increase in counseling sessions to large companies, the PCAU conducted 272 counseling sessions with SMEs in FY 2015 (up 26% from FY 2014); this is particularly noteworthy as this is the largest number of counseling sessions with SMEs the PCAU has had since it started tracking counseling sessions in 2000.
Notes This indicator will be discontinued in FY 2016 and replaced by a new measure that will serve as a supporting (Strategic Plan) indicator, “Number of AD/CVD petition counseling sessions.”
Resource Requirements Table
FY 2010 Actual
FY 2011 Actual
FY 2012 Actual
FY 2013 Actual
FY 2014 Actual
FY 2015 Actual
FY 2016 Estimate
FY 2017 Base
Increase/ Decrease
FY 2017 Request
(DOC Trade and Investment Objective #1 Increase opportunities for U.S. companies by opening markets globally
Manufacturing and Services $33.9 $35.4 $0.0 $0.0 $0.0 $0.0 $0.0 $0.0 $0.0 $0.0
Market Access and Compliance $0.0 $0.0 $0.0 $0.0 $0.0 $0.0 $0.0 $0.0 $0.0 $0.0
Import Administration $10.7 $10.5 $0.0 $0.0 $0.0 $0.0 $0.0 $0.0 $0.0 $0.0
Commercial Service $3.1 $3.0 $0.0 $0.0 $0.0 $0.0 $0.0 $0.0 $0.0 $0.0
Industry and Analysis $0.0 $0.0 $49.9 $42.4 $45.8 $46.7 $47.0 $44.0 $4.2 $48.2
Executive Direction/Administration $2.8 $2.7 $2.8 $2.4 $2.4 $2.4 $2.7 $2.3 $0.0 $2.3
Total Funding $50.5 $51.6 $52.7 $44.8 $48.3 $49.0 $49.7 $46.3 $4.3 $50.5
Direct $49.2 $50.6 $51.5 $44.1 $47.9 $48.0 $48.4 $45.0 $4.3 $49.3
Reimbursable $1.3 $1.0 $1.3 $0.7 $0.4 $1.0 $1.3 $1.3 $0.0 $1.3
FTE 198 190 199 184 195 176 197 197 4 201

ITA -101
FY 2010 Actual
FY 2011 Actual
FY 2012 Actual
FY 2013 Actual
FY 2014 Actual
FY 2015 Actual
FY 2016 Estimate
FY 2017 Base
Increase/ Decrease
FY 2017 Request
(DOC Trade and Investment Objective #2 Increase U.S. exports by broadening and deepening the U.S. exporter base)
Manufacturing and Services $5.7 $2.9 $0.0 $0.0 $0.0 $0.0 $0.0 $0.0 $0.0 $0.0
Market Access and Compliance $23.8 $27.0 $0.0 $0.0 $0.0 $0.0 $0.0 $0.0 $0.0 $0.0
Import Administration $8.3 $8.4 $0.0 $0.0 $0.0 $0.0 $0.0 $0.0 $0.0 $0.0
Commercial Service $273.3 $272.5 $0.0 $0.0 $0.0 $0.0 $0.0 $0.0 $0.0 $0.0
Industry and Analysis $0.0 $0.0 $7.7 $3.4 $3.5 $2.8 $2.6 $2.6 $0.0 $2.6
Global Markets $0.0 $0.0 $325.0 $319.9 $328.1 $346.4 $343.9 $343.5 $14.3 $357.8
Executive Direction/Administration $18.0 $19.6 $18.4 $17.2 $16.0 $15.6 $17.7 $16.6 $0.3 $16.9
Total Funding $329.1 $330.5 $351.1 $340.4 $347.5 $364.8 $364.2 $362.6 $14.6 $377.2
Direct $310.1 $309.0 $329.7 $317.4 $324.1 $342.0 $338.2 $336.6 $14.6 $351.2
Reimbursable $18.6 $21.5 $21.4 $23.0 $23.4 $22.8 $26.0 $26.0 $0.0 $26.0
FTE 1,184 1,155 1,185 1,148 1,100 1,118 1,156 1,156 16 1,172
(DOC Trade and Investment Objective #3 Increase high-impact inward foreign direct investment in the United States)
Manufacturing and Services $0.0 $0.0 $0.0 $0.0 $0.0 $0.0 $0.0 $0.0 $0.0 $0.0
Market Access and Compliance $0.5 $0.5 $0.0 $0.0 $0.0 $0.0 $0.0 $0.0 $0.0 $0.0
Import Administration $0.0 $0.0 $0.0 $0.0 $0.0 $0.0 $0.0 $0.0 $0.0 $0.0
Commercial Service $0.0 $0.3 $0.0 $0.0 $0.0 $0.0 $0.0 $0.0 $0.0 $0.0
Global Markets $0.0 $0.0 $0.6 $0.8 $4.7 $10.0 $10.0 $10.0 $10.0 $20.0
Executive Direction/Administration $0.0 $0.0 $0.0 $0.3 $0.3 $0.3 $0.3 $0.3 $0.0 $0.3
Total Funding $0.5 $0.7 $0.6 $1.2 $5.1 $10.3 $10.3 $10.3 $10.0 $20.3
Direct $0.5 $0.7 $0.6 $1.2 $5.1 $10.3 $10.3 $10.3 $10.0 $20.3
Reimbursable $0.0 $0.0 $0.0 $0.0 $0.0 $0.0 $0.0 $0.0 $0.0 $0.0
FTE 3 4 4 6 14 23 23 23 16 39
(DOC Trade and Investment Objective #4 Strengthen fair competition in international trade for U.S. firms and workers by addressing and resolving foreign unfair trade practices and enforcing international trade agreements)
Manufacturing and Services $11.6 $11.6 $0.0 $0.0 $0.0 $0.0 $0.0 $0.0 $0.0 $0.0
Market Access and Compliance $22.9 $21.4 $0.0 $0.0 $0.0 $0.0 $0.0 $0.0 $0.0 $0.0
Import Administration $56.5 $55.0 $0.0 $0.0 $0.0 $0.0 $0.0 $0.0 $0.0 $0.0
Commercial Service $4.7 $4.6 $0.0 $0.0 $0.0 $0.0 $0.0 $0.0 $0.0 $0.0
Industry and Analysis $0.0 $0.0 $12.4 $11.9 $11.5 $11.5 $12.8 $12.0 $0.2 $12.2
Enforcement and Compliance $0.0 $0.0 $70.5 $70.7 $69.1 $72.5 $86.2 $80.2 $3.3 $83.5
Executive Direction/Administration $6.7 $6.5 $5.4 $5.1 $4.8 $4.7 $5.3 $5.0 $0.1 $5.1
Total Funding $102.4 $99.1 $88.2 $87.7 $85.4 $88.7 $104.4 $97.2 $3.6 $100.8
Direct $101.9 $98.7 $87.4 $87.6 $85.3 $88.6 $104.2 $97.1 $3.6 $100.6
Reimbursable $0.5 $0.4 $0.8 $0.1 $0.1 $0.1 $0.2 $0.2 $0.0 $0.2
FTE 498 501 390 358 357 344 402 404 12 416
Grand Total
Total Funding $482.5 $481.9 $492.6 $474.1 $486.3 $512.8 $528.6 $516.5 $32.5 $548.9
Direct $461.7 $459.0 $469.2 $450.3 $462.4 $488.9 $501.1 $489.0 $32.5 $521.4
Reimbursable $20.4 $22.9 $23.5 $23.8 $23.9 $23.9 $27.5 $27.5 $0.0 $27.5
FTE 1,883 1,850 1,778 1,696 1,666 1,661 1,778 1,780 48 1,828

ITA - 102
This Page Intentionally Left Blank

ITA -103
Department of Commerce International Trade Administration
Operations and Administration GLOSSARY OF BUDGET ACRONYMS AND TERMS
ABC Activity‐Based Cost AC Advocacy Center AD Antidumping AGOA African Growth and Opportunities Act APEC Asia/Pacific Economic Cooperation ASEAN Association of Southeast Asian Nations ATB Adjustment to Base BEA Bureau of Economic Analysis BY Budget Year CBP Customs and Border Protection CBS Commerce Business System (Accounting System) CEE Central and Eastern Europe CEEBIC Central and Eastern Europe Business Information Center CFAO Chief Financial and Administrative Officer CIT Court of International Trade CITA Committee for the Implementation of Textile Agreements CSRS Civil Service Retirement System CTP Corporation for Travel Promotion CVD Countervailing Duty CS Commercial Service DAS Deputy Assistant Secretary DEC District Export Council DM Departmental Management DOA Director of Administration DOS Department of State E&C Enforcement and Compliance ECF Employees Compensation Fund EFM Export Finance Matchmaker EPA Environmental Protection Agency EU European Union ExAd Executive Direction and Administration FCC Federal Communications Commission FCIB Finance, Credit and International Business FDA Food and Drug Administration FDI Foreign Direct Investment FERS Federal Employees Retirement System FFMIA Federal Financial Management Improvement Act FFS Federal Financial System FICA Federal Insurance Contribution Act FSN Foreign Service National FTA Free Trade Agreement

ITA - 104
Department of Commerce International Trade Administration
Operations and Administration GLOSSARY OF BUDGET ACRONYMS AND TERMS
FTE Full Time Equivalent FTZ Foreign Trade Zones FY Fiscal Year GATS General Agreement on Trade in Services GATT General Agreement on Tariffs and Trade GBDe Global Business Dialogue on electronic commerce GCC Gulf Cooperation Council GDI Global Diversity Initiative GDP Gross Domestic Product GM Global Markets GPO Government Printing Office I&A Industry and Analysis LES Locally Employed Staff MOU Memorandum of Understanding MRA Mutual Recognition Arrangement NACC North American Competitiveness Council NAFTA North American Free Trade Agreement NARA National Archives and Records Administration NEI National Export Initiative NES National Export Strategy NME Non‐Market Economy NSC National Security Council NTBs Non‐Tariff Barriers OASDI Old Age Survivor and Disability Insurance OECD Organization for Economic Cooperation and Development OGC Office of General Counsel OIG Office of Inspector General OLIA Office of Legislative and Intergovernmental Affairs OMB Office of Management and Budget OPA Office of Public Affairs OPIC Overseas Private Investment Corporation PART Program Assessment Rating Tool PMA President’s Management Agenda PSC Personal Service Contractors QEC Quality Enhancement and Control SIPS Statutory Import Program Staff SMEs Small and medium‐sized Enterprises STOP Strategy Targeting Organized Piracy TABD Transatlantic Business Dialogue TCC Trade Compliance Center TCG Textiles Consultative Group
ITA -105
Department of Commerce International Trade Administration
Operations and Administration GLOSSARY OF BUDGET ACRONYMS AND TERMS
TCI Trade Compliance Initiative TDA Trade Development Agency TIC Trade Information Center TNIS Trade Negotiation Information System TP/US&FCS Trade Promotion / United States & Foreign Commercial Service TPA Trade Promotion Authority Trusted IC Trusted Internet Connection TSP Thrift Savings Plan TTAB Travel and Tourism Advisory Board U.K. United Kingdom USAID U.S. Agency for International Development USDOC U.S. Department of Commerce USCIS U.S. Citizenship and Immigration Services (Formerly known as the INS) USEAC U.S. Export Assistance Centers USG United States Government USPTO U.S. Patent and Trademark Office USTR U.S. Trade Representative WCF Working Capital Fund WTO World Trade Organization

ITA - 106
This Page Intentionally Left Blank