department of analytical chemistry at university of...
TRANSCRIPT

M ulti C lass, M ulti Residue M ethod for Determination of
Penicil lins, Cephalosporins and Q uinolones in Cow M ilk and Validation in
Accordance with Commission Decision
2002/657/E C
European M asters in Q uality in A nalytical Laboratories
Rameshwari Amatya
F ebruary 2010

Under the supervision of Dr. José Barbosa Torralbo and Dra. Dolores Barrón Bueno in
Department of Analytical Chemistry at University of Barcelona
The project entitled
M ulti-C lass, M ulti Residue M ethod for Determination of Penicillins, Cephalosporins and Q uinolones in Cow M ilk and Validation in Accordance
with Commission Decision 2002/657/E C
In partial fulfillment
Of the requirements for the degree
Masters in Quality in Analytical Laboratories
Submitted By
Rameshwari Amatya
February, 2010 Approved by: Dr. José Barbosa Torralbo Dra. Dolores Barrón Bueno
European Masters in Quality in Analytical Laboratories
Acknowledgement
There are few people without whose involvement this project work would never have
come to be. So I take this opportunity to thank and dedicate the following lines.
I would like to express my deepest gratitude to my supervisors, Dr. José Barbosa
Torralbo (Professor, Department of Analytical Chemistry, University of Barcelona)
and Dra. Dolores Barrón Bueno, for their support, guidance, and encouragement
during the course of this project and helping me to develop an understanding of the
subject. I am much obliged to them for sharing their ideas with me to complete the
project successfully.
Thanks to Anna Jubert, Technical Director of ALLIC for providing positive samples.
I take this opportunity to thank Pili for providing me helpful suggestions.
Heartfelt thanks goes to Sandra for guiding me, for having patience to listen to me
and clearing my doubts and queries from the preliminary to the concluding level.
I am very grateful to Rafa for helpful discussions, constant support and friendship.
I also wish to acknowledge Fernando, Estela for their kind cooperation and helping
hands.
Thanks to Marta, Sílvia, Sergio, Raquel, Cristina, Leyre, Edyta, Gultekin and Dilara
for their company, kind cooperation thus making my stay at Bioanalysis department
memorable.
Finally and most importantly, I would like to thank my parents Mr. Ramhari Amatya
and Mrs. Sulochana Amatya, my family and my friends for their support, concern
throughout all my studies at University.

European Masters in Quality in Analytical Laboratories
Abbreviations
A C N - Acetonitrile
A L L I C - Laboratori Interprofessional Lleter de Catalunya
A M O X - Amoxicillin
A MPI - Ampicillin
C E - Collision Energy
C IP - Ciprofloxacin
C L O X - Cloxacillin
C UR - Curtain Gas
D A N - Danofloxacin
DI C L - Dicloxacillin
DP - Declustering Potential
E NR - Enrofloxacin
EP - Entrance Potential
F L U - Flumequine
FP - Focusing Potential
H Ac - Acetic Acid
H Fo - Formic Acid
H L B - Hydrophilic Lipophilic Balance
IS - Internal Standard
L E X - Cefalexin

European Masters in Quality in Analytical Laboratories
L C-MS/MS - Liquid Chromatography coupled to Tandem Mass
Spectrometry
L O D - Limit of Detection
L O N - Cefalonium
L O Q - Limit of Quantification
M A R - Marbofloxacin
M eO H - Methanol
M R L - Maximum Residual Limit
M RM - Multiple Reaction Monitoring
N A F C - Nafcillin
N E B - Nebuliser Gas
O X A C - Oxacillin
PBPs - Penicillin Binding Protein
PE R - Cefaperazone
PIP - Pipemidic Acid
PIPE - Piperacillin
PIR - Cefapirin
Q UI - Cefquinome
RSD - Relative Standard Deviation
SPE - Solid Phase Extraction
T I O - Ceftiofur
UPL C-MS/MS - Ultra Performance Liquid Chromatography coupled to
Tandem Mass Spectrometry

Contents
Objective ................................................................................................................................ 1
Abstract .................................................................................................................................. 3
1. Introduction ..................................................................................................................... 5
1.1. Classification of Antibiotics ................................................................................... 5
1.2. Mechanism of Action of Antibiotics ....................................................................... 6
1.3 Antibiotic Resistance Mechanism ........................................................................... 8
1.4. Use of Veterinary Antibiotics in Dairy Cows ........................................................ 10
1.5. Antibiotic Resistance associated with Therapeutic use of Veterinary
Medicine ................................................................................................................... 11
1.6 Importance of determination of Antibiotic Residue ............................................... 11
1.7 - Lactam Antibiotics ........................................................................................... 12
1.8 Quinolones........................................................................................................... 13
1.9 Multiclass, Multi Residue determination of Antibiotic in Food Samples ............... 14
1.10 European Regulation for the Use of Veterinary Drugs .......................................... 20
2. Experimental ................................................................................................................. 27
2.1 Reagents and Materials ......................................................................................... 27
2.2 Instrumentation .................................................................................................... 29
2.3. Experimental Procedure........................................................................................ 31
3. Results and Discussion .................................................................................................. 43
3.1. Preliminary Study ................................................................................................. 43
3.2. Optimization of the Extraction Method ................................................................. 44
3.3. UPLC-MS/MS Optimization ................................................................................ 46
3.4. Comparative Study of Two UPLC Columns ......................................................... 47
3.5. Quality Parameters ............................................................................................... 50

3.6. Applicability of the Method .................................................................................. 61
4. Conclusions ................................................................................................................... 67
References ............................................................................................................................ 69
Appendix 1: Antibiotic use in Europe ..................................................................................... I
Appendix 2: Usage of Antibiotic in Human and Animals....................................................... II
Appendix 3: Antibiotic Resistance in Europe ........................................................................ IV

European Masters in Quality in Analytical Laboratories
1
Objective
The objective of this work was to develop and validate a method for multi-class,
multiresidue determination of the series of Penicillins (Amoxycillin, Ampicillin,
Cloxacillin, Dicloxacillin, Nafcillin, Oxacillin and PENG), Cephalosporins
(Cefalexin, Cafalonium, Cefapirin, Cefaperazone, Cefquinome, Ceftiofur and
Cefazolin) and Quinolones (Ciprofloxacin, Danofloxacin, Enrofloxacin, Flumequine
and Marbofloxacin) regulated by European legislation 2377/90/EC in cow milk using
LC-MS/MS.

European Masters in Quality in Analytical Laboratories
3
Abstract
The method was developed to determine simultaneously 19 drugs of three classes
(seven Penicillins and Cephalosporins, and five Quinolones) regulated by European
legislation 2377/90/EC in cow milk using LC-MS/MS. To make the sample
preparation as simple as possible deproteinization step using organic solvent was
eliminated. SPE clean up and concentration was done using OASIS HLB cartridge.
The separation of 19 antibiotics was achieved in 11 minutes using C8 column with
gradient elution. MS data was acquired on MRM mode with two transitions for each
compound. Validation procedure was conducted based on European directive
2002/657/EC. 89% of drugs presented recoveries higher than 65 % with exception of
AMOX (57%) and DAN (38 %). Repeatability values expressed as relative standard
deviation, (RSDs) were not more than 15 %. LODs values ranged from 0.03 (NAFC)
to 0.5 µg/kg (PER) and LOQs from 0.1 (NAFC, PENG, CIP, DAN, and ENR) to
1.25 µg/kg (PER). The method was applied to 49 real samples. 37% of the sample
was found to be non-compliant with an error probability of . Of all samples
analysed, 14 % of samples contained AMOX and 16 % contained PENG. AMOX
and PENG was the most common residue found in milk sample.

European Masters in Quality in Analytical Laboratories
5
1. Introduction
Antibacterial agents also categorized as anti infective, antimicrobials or
chemotherapeutics comprise synthetic and natural compounds. The latter known as
antibiotics are produced by fungi and bacteria at low concentrations for inhibiting
growth of other microorganisms. Strictly antibiotics should include only five classes
penicillins, tetracyclines, macrolides, aminoglycosides and Amphenicols. However
currently the terms antibiotic is used synonymous with antibacterial, so synthetic drugs
(e.g. quinolones or nitrofurans) and substances of high molecular weight (e.g. peptide
antibiotics) also belong to this group [1].
1.1. C lassification of Antibiotic
On the basis of type of activity antibiotics can be divided into two groups:
1.1.1 Bactericidal
Antibiotics that cause bacterial cell death are called bactericidal.
-Lactams: - Lactams basically consists of two classes of thermally labile
compounds, penicillins and cephalosporin. They are probably the most widely used
class of antibiotics in veterinary medicine for the treatment of bacterial infections
especially in lactating cows [2].
Quinolones: Quinolones are synthetic broad spectrum antimicrobial agents used in
the treatment of livestock and in aquaculture. They are used in veterinary medicine
for the treatment of pulmonary infections, urinary infections and digestive infections
in cows, pigs, turkeys or chicken [3-4].
Aminoglycosides: In veterinary medicine and animal husbandry, they are widely
used in the treatment of bacterial infections, e.g. bacterial enteritis and mastitis, and
have been added to feeds for prophylaxis and to promote growth. They are currently
not permitted for use as growth promoters in the European Union [5].
Nitroimidazoles: Nitroimidazoles are a class of veterinary drugs used for the
treatment and prevention of certain bacterial and protozoal diseases in poultry
(histomoniasis in turkeys, trichomoniasis in pigeons etc) and for swine dysentery.
Nitroimidazoles posses mutagenic, carcinogenic and toxic properties so have been
prohibited in EU [3].
Nitrofurans: Nitrofurans are antibacterial agents which have been widely used as
feed additives for the treatment of gastrointestinal infections (bacterial enteritis
European Masters in Quality in Analytical Laboratories
6
caused by Escherichia coli and salmonella) in cattle, pigs and poultry. Use of
nitrofuran antimicrobials in food producing animals have been prohibited within EU
since 1997 since they have been reported to be carcinogenic and mutagenic [3].
1.1.2 Bacteriostatic
Antibiotics that stops bacteria growth and allow host's normal defense mechanisms to
combat the infection are bacteriostatic. Antibiotics that are predominantly bacteriostatic
include the tetracyclines, the macrolides, chloramphenicol and trimethoprim.
Tetracyclines: Tetracyclines are broad spectrum antibiotics effective against gram
positive as well as gram negative bacteria. They are used for promoting growth in
cattle and poultry [3].
Sulphonamides and T rimethoprim: They exhibit a bacteriostatic rather than
bactericidal effect. Sulphonamides are used as veterinary drugs for prophylactic and
therapeutic purposes; they also act as growth promoting substances [3].
M acrolides: They are derived from Streptomyces bacteria, and got their name due to
their macrocyclic lactone chemical structure. Macrolides are an important class of
antibiotics which are widely used in veterinary practice to treat respiratory diseases
or as feed additives to promote growth [3].
Amphenicols: They are synthetic antibiotics with similar broad-spectrum of activity.
The Amphenicols class of antibiotics consists of chloramphenicol, thiamphenicol and
florfenicol [6].Chloramphenicol is a broad spectrum antibiotic active against a
variety of pathogen. It was previously used in veterinary and human medicine,
however reports of plastic anemia in humans arising from its use led to its ban in the
US and EU in 1994 [3]. The use of nitrofurans and chloramphenicol is not allowed in
EU and therefore these compounds are classified in group A, the forbidden
substances group [7].
1.2. M echanism of Action of Antibiotics
The mechanism of action of antibiotics falls into following categories [6].
1.2.1 Antimicrobials which can act on the Bacterial Cell Wall
These interfere with synthesis of peptidoglycan layer in cell wall; they eventually cause
cell lysis, bind to and inhibit activity of enzymes responsible for peptidoglycan
synthesis. They interfere with cell wall synthesis by binding to penicillin binding
proteins (PBPs), which are located in b -Lactams)
European Masters in Quality in Analytical Laboratories
7
1.2.2 Antimicrobials acting on Nucleic Acid Synthesis
Inhibitor of RNA synthesis and function: These antimicrobials bind to DNA-
dependent RNA polymerase and inhibit initiation of RNA synthesis. They inhibit
transcription. (E.g. Rifampin, rifampicin)
Inhibitor of DNA replication: They inhibit bacterial topoisomerase which are
necessary for DNA synthesis. (E.g. nalidixic acid, ciprofloxacin)
Inhibitors of precursor synthesis: They inhibit early stages of folate synthesis. (E.g.
sulphonamides)
1.2.3 Antimicrobials acting on Protein Synthesis
Antimicrobials acting on protein can be classified into those bind to 30S ribosome and
50s ribosome subunit.
Antimicrobials that bind to the 30S Ribosomal Subunit
Aminoglycosides: The aminoglycosides irreversibly bind to the 30S ribosome and
freeze the 30S initiation complex (30S-mRNA-tRNA), so that no further initiation
can occur. The aminoglycosides also slow down protein synthesis that has already
initiated and induce misreading of the mRNA.
Tetracyclines: The tetracyclines reversibly bind to the 30S ribosome and inhibit
binding of aminoacyl-t-RNA to the acceptor site on the 70S ribosome.
Spectinomycin: Spectinomycin reversibly interferes with mRNA interaction with
the 30S ribosome. It is structurally similar to aminoglycosides but does not cause
misreading of mRNA.
Antimicrobials that bind to the 50S Ribosomal Subunit
Chloramphenicol, lincomycin, clindamycin: These antimicrobials bind to the 50S
ribosome and inhibit peptidyl transferase activity.
M acrolides: The macrolides inhibit translocation of the peptidyl tRNA from the A to
the P site on the ribosome by binding to the 50S ribosomal 23S RNA. E.g.
erythromycin, azithromycin, clarithromycin
1.2.4 Inhibitors of Bacterial Folate Synthesis
These block cell metabolism by inhibiting enzymes which are needed in the
biosynthesis of folic acid which is a necessary cell compound.
Sulphonamides, sulfones: These antimicrobials are analogues of para-aminobenzoic
acid and competitively inhibit formation of dihydropteric acid.

European Masters in Quality in Analytical Laboratories
8
T rimethoprim, methotrexate, pyrimethamine : These antimicrobials bind to
dihydrofolate reductase and inhibit formation of tetrahydrofolic acid.
1.2.5 Antimicrobials acting on the Cell Membrane
Amphotericin that binds to the sterol-containing membranes of fungi,
Polymyxins that act like detergents and disrupt the Gram negative outer membrane
and
Fluconazole and itraconazole that interfere with the biosynthesis of sterol in fungi.
The diverse sites of action of antibiotics are summarized in figure 1.1.
Figure (1.1): Action Sites of Antibiotics
1.3 Antibiotic Resistance M echanism
Bacteria may manifest resistance to antibacterial drugs through a variety of
mechanisms. Some species of bacteria are innately resistant to 1 class of antimicrobial
agent. Other cases are acquired resistance. Acquired resistance that develops due to
chromosomal mutations and selection is called vertical evolution. Bacteria also develop
resistance through the acquisition of new genetic material from other organisms. This is
termed as horizontal evolution. A resistance mutation can be expressed in several ways
[8-9].

European Masters in Quality in Analytical Laboratories
9
1.3.1 Production of Enzyme that destroys Active Drug
The first central mechanism by which bacteria can be resistant to an antibiotic is by
production of enzymes that inactivate antimicrobials. The organism may acquire genes
encoding enzymes such as -lactamases that destroy the antibacterial agent from the cell
before it can reach its target site and exert its effect.
1.3.2 Mutations in E fflux Mechanisms
Antibiotic efflux pumps are a common way for bacteria to resist the action of numerous
classes of antibiotics. Bacteria may acquire efflux pumps that extrude the antibacterial
agent from the cell before it can reach its target site and exert its effect. They are chiefly
concerned with removal of waste products, but changes in their conformation can
enable them to remove antimicrobials. Gram positive organisms can show resistance to
macrolides by this mechanism and resistance to tetracyclines is usually mediated via
efflux.
1.3.3 Bypass of Metabolic Pathway
Bacteria may acquire several genes for a metabolic pathway which ultimately produces
altered bacterial cell walls that no longer contain the binding site of the antimicrobial
agent, or bacteria may acquire mutations that limit access of antimicrobial agents to the
intracellular target site via down regulation of porin genes. Resistance to sulfonamides
and trimethoprim is mediated by metabolic bypass, in this case due to synthesis of
altered dihydropteroate synthetase and dihydropteroate reductase. These enzymes have
reduced susceptibility and affinity for sulfonamides and trimethoprim respectively.
O ther mechanism of resistance may occur through one of several genetic mechanism
including transformation, conjugation and transduction.
The most important vehicles for transfer of resistance genes in bacteria are plasmids,
transposons and integrons.
Plasmids: Plasmids are extra chromosomal, replicable circular DNA molecules that
may contain resistance genes. They replicate independently of bacterial chromosomal
DNA. Plasmids are important in bacterial evolution, because they affect replication,
metabolism, bacterial fertility as well as resistance to bacterial toxins, antibiotics and
bacteriophages.

European Masters in Quality in Analytical Laboratories
10
T ransposons: Transposons (jumping genes) are short sequence of DNA that can move
between plasmids, between a plasmid and the bacterial chromosome or between a
plasmid and a bacteriophage (bacterial virus). Unlike plasmids transposons are not able
to replicate independently and must be maintained within a functional replicon (plasmid
or chromosome).
Integrons and G ene Cassettes: Integrons are naturally occurring gene expression
elements. They are composed of two conserved regions and an interposed variable
region, which contains gene cassettes for antibiotic resistance.
Some of the many mechanisms of resistance are indicated schematically in the figure
1.2
Figure (1.2): Mechanism of antibiotic resistance
1.4. Use of Veterinary Antibiotics in Dairy Cows
fermentation process used in commercial chlortetracycline production was found to
improve the growth rates of pigs, poultry, and cattle [10].
The use of antibiotics in veterinary medicine and especially in dairy cows involves [6]
1.4.1. Therapeutic use to treat infected animals against diseases e. g. mastitis of dairy
cows, diarrhoea, pulmonary diseases, bacteremia, etc.
1.4.2. Prophylactic use to avoid infection of rest animals, preventing diseases. In dairy
cows, antibiotics are routinely administered directly into the udder to cure and

European Masters in Quality in Analytical Laboratories
11
avoid mastitis (e. g. in dry-cow therapy). The same therapeutic antibiotics are
delivered directly into the fodder or drinking water.
1.4.3. Use at sub-therapeutic levels to induce growth promotion.
1.5. Antibiotic Resistance associated with Therapeutic use of Veterinary M edicine
Antimicrobials use will lead to the selection of resistant forms of bacteria which occurs
with all uses including treatment, prophylaxis and growth promotion. Adverse
consequences of selecting resistant bacteria in animals include:
1.5.1. An increase in the prevalence of resistant bacteria in animals, the transfer of
resistant pathogens to humans via direct contact with animals or through the
consumption of contaminated food and water,
1.5.2. The transfer of resistance genes to human bacteria,
1.5.3. An increase in the incidence of human infections caused by resistant pathogens,
1.5.4. Potential therapeutic failures in animals and humans. Few examples associated
with resistance mechanisms are:
Fluoroquinolones use in poultry has given a dramatic rise in the prevalence of
fluoroquinolones-resistant Campylobacter jejuni isolated in live poultry, poultry
meat and from infected humans. Multi resistant Escherichia coli have been
selected by the use of broad spectrum antimicrobials in both livestock and
humans.
1.5.5. Residues of antimicrobial agents in food of animal origin in excess of the agreed
acceptable minimum residue level (MRLs) may contribute to the generation of
resistance in bacteria in humans [11].
1.6 Importance of determination of Antibiotic Residue
Residue analysis is concerned with food safety, as it establishes whether food is safe or
unsafe for human consumption. Incorrect use of antibiotics in veterinary practice may
leave residues in edible tissues. These residues may have direct toxic effects on
consumer e.g. antibiotics such as penicillin can evoke allergic reactions in
hypersensitive individuals even though small amount are ingested or exposed by
parental routes. Or they may cause problems indirectly through induction of resistant

European Masters in Quality in Analytical Laboratories
12
strains of bacteria. As a result the antibiotic resistant pathogens do not respond well to
therapy by ordinary antibiotics as a result new antibiotics must be developed [3, 10].
1.7 - Lactam Antibiotics
-Lactam antibiotics comprise several classes of compounds such as penicillins,
cephalosporins, and carbapenems, monobactams among which the penicillin and the
-lactam
ring, free carboxyl acid group and a substituted amino acid side chain. Both penicillin
-lactam ring but in the case of penicillin it is fused to a five
membered thiazolidine ring, and in the case of cephalosporin it is fused to a six
membered dihydrothiazine ring.
Figure (1.3): Structure of penicillin and cephalosporin
1.7.1. Penicillins
-lactam drugs because of their unique four-membered
lactam ring. They share features of chemistry, mechanism of action, pharmacologic and
clinical effects, and immunologic characteristic -lactam compounds [12].
They are compounds with limited stability because of the presence of the four term ring
in their structure and they are thermolabile, unstable in alcohols and isomerize in acid
ambient [2].
Chemistry
All penicillins have the basic structure shown in figure 1.4. A thiazolidine ring (A) is
-lactam ring (B) that carries a secondary amino group (RNH ).
Substituent - R can be attached to the amino group. Structural integrity of the 6
aminopenicillanic acid nucleus is essential for the biologic activity of these compounds.
- -lactamases, the resulting
product, penicilloic acid, lacks antibacterial activity. The penicillins are susceptible to

European Masters in Quality in Analytical Laboratories
13
bacterial metabolism and inactivation by amidases and lactamases at the points shown
below[12].
Figure (1.4): Basic structure of penicillin (6-aminopenicillanic acid)
1.7.2. Cephalosporins
Cephalosporin is similar to penicillins chemically, in mechanism of action, and in
toxicity. Cephalosporins are more stable than penicillins to many bacterial -lactamases
and therefore usually have a broader spectrum of activity. The cephalosporins are
bactericidal and inhibit the third stage of bacterial cell wall synthesis by interfering with
cross-linking of linear peptidoglycan strands [13].
Chemistry
The nucleus of the cephalosporins, 7-aminocephalosporanic acid (Figure 1.5), bears a
close resemblance to 6-aminopenicillanic acid (Figure 1.4). The intrinsic antimicrobial
activity of natural cephalosporins is low, but the attachment of various R1 and R2
groups has yielded drugs of good therapeutic activity and low toxicity. The
cephalosporins have molecular weights of 400 450. They are soluble in water and
relatively stable to pH and temperature changes [12].
Figure (1.5): Structure of Cephalosporin
1.8 Quinolones
Quinolone are broad spectrum synthetic antimicrobial agent used in the treatment of
livestock and aquaculture. The older quinolones e.g. nalidixic acid have limited activity
against gram negative organisms while the more recently introduced fluoroquinolones
e.g. Enrofloxacin have a wide spectrum of activity . In general Quinolone carboxylic
acids are amphoteric with poor water solubility between pH 6 and 8 [13].

European Masters in Quality in Analytical Laboratories
14
Chemistry
The general structure consists of quinolones consists of a 1-substituted-1, 4-dihydro-4-
oxopyridine-3-caboxylic moiety combined with an aromatic or heteroaromatic ring .The
carboxylic acid at position 3 and the ketone group at position 4 are necessary for DNA
gyrase inhibition, where as substitution at position 1 and 7 influence the potency and the
biological spectrum of activity of the drugs [4].
Figure (1.6): Basic structure for Quinolone
Due to the presence of carboxylic acid (pka
groups (pka -9), quinolones have amphoteric and zwitterionic properties; between pH
6 and 8, they exhibit poor water solubility, but are lipid soluble and able to penetrate
tissues [41].
M echanism of Action:
Quinolones block bacterial DNA synthesis by inhibiting bacterial topoisomerase II
(DNA gyrase) and topoisomerase IV. Inhibition of DNA gyrase prevents the relaxation
of positively super coiled DNA that is required for normal transcription and replication
[12].
1.9 Multiclass, M ulti Residue determination of Antibiotic in Food Samples
Multiclass, multi residue methods are gaining importance for residue control in food
products. These methods are limited in comparision to single class residual methods
not because that they are not needed, but because of a number of analytical challenges
which have to be overcome. The first multi-class method for veterinary drugs residue in
food products was reported by Yamada et.al in 2006 [14].
Form the literature review [45] we can see that multi-class, multiresidue analysis is
performed in two different ways.
European Masters in Quality in Analytical Laboratories
15
Qualitative [18] or quantitative screening assays [25],
Screening and confirmation [15, 19, and 21],
Screening and quantification [26].
Quantitative confirmatory
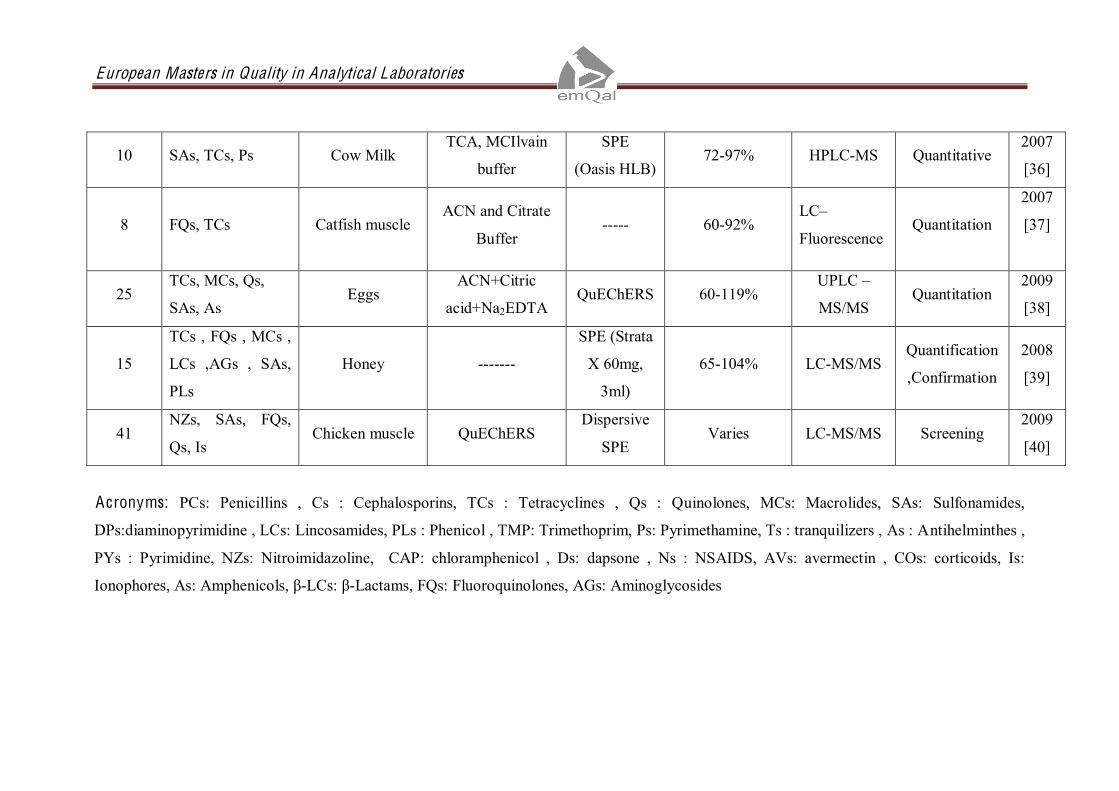
Table 1.1 provides a summary of recent chromatographic methods for detection of
multiclass, multi residue analysis of antibiotics in wide range of sample matrices such
as animal tissue, liver, kidney, egg, milk and honey.
The articles [15, 22-23, 32-33, 35-36] are based on determination of multi-class, multi
residue of antibiotics in milk samples. Some papers [14, 22] include validation data but
do not fully comply with the EU commission decision 2002/657/EC.
From the table 1.1, we can see that most of the papers utilizes Oasis HLB for clean up.
However some papers eliminate the clean up in order to make the method fast and
simple [24]. Some paper [33, 38, and 40] utilizes extraction procedure based on
QuEChERS methodology.
As can be seen from table 1.1, LC-MS/MS and UPLC-MS/MS are the common
detection techniques for multi-class, multi residue analysis.
This work involves development of method for Quantitative, confirmatory analysis of
penicillins, cephalosporins and quinolones in milk using LC-MS/MS.

European Masters in Quality in Analytical Laboratories
Table 1.1 Summaries of Existing Chromatographic M ethodologies for Detection of Multiclass, M ulti Residue Analysis of Antibiotics
No. of
Residues Analyte M atrix
Ext raction
Technique C lean up Recovery (%)
Detection
System Application
Date
[Ref]
130 Many Bovine, Porcine,
Chicken Muscle
ACN:
MeOH(95:5)
----- 70-110% LC-MS/MS Quantitation 2006
[14]
25 LCs,SAs,Qs,MCs Milk Acetonitrile SPE
(Oasis HLB)
Low for -‐LCs,
MCs and Qs
above 70%, TCs
50-60%
LC-MS/MS Screening,
Confirmation
2008
[15]
6 TCs, PCs Bovine and
Swine, Muscle
Kidney and Liver
No No 70-115% LC MS/MS Screening 2005
[16]
18 TCs, SAs, Qs Shrimp Meat TCA SPE
(Oasis HLB)
-------- LC-Ion trap Screening
/Confirmatory
2006
[17]
21 TCs, Qs Pig Kidney ,
Liver and meat
EDTA-McIIvaine
buffer
SPE
(Oasis HLB)
80.2-117.8% UPLC-
MS/MS
Screening,
Confirmatory
2007
[19]

European Masters in Quality in Analytical Laboratories
19 TCs, SAs, Qs,
-LCs, MCs
Muscle (Pig ,
Cattle, Sheep,
Horse, Deer ,
Reindeer) Kidney
(Pig , Cattle,
Sheep, Horse)
70 % Methanol --------- --------
LC-MS/MS Screening ,
Confirmation
2007
[20]
29 SAs, TCs, FQs,
-LCs
Eggs ---------- SPE
(Oasis HLB)
--------- LC-MS/MS Screening ,
confirmation
200
[21]
150 AVs,BZs, agonist,
-LCs, Cs, NZs,
Qs, SAs, TCs
Milk ACN -------- No UPLC-TOF-
MS
Screening 2007
[22]
10 PLs , TCs, Cs Milk Methanol,
MCIlvaine Buffer
SPE
(Oasis HLB)
52.1% -101.0%
UPLC Quantification
2009
[23]
39 TCs, Qs, PCs, SAs
,TMP,MCs
Chicken Muscle MeOH:H2O(70:30)
Containing EDTA
No clean up 60-96.5% UPLC-
MS/MS
Quantification,
Confirmation
2008
[24]
100 BZs, CH,DV,
LI,MCs, NZs,PCs,
SAs,TCs, Ts
Muscle , Liver ,
Kidney
Liquid Liquid
Extraction
SPE
(Oasis HLB)
Muscle:14-118%
Liver:16- 121%
Kidney:13-141%
UPLC-TOF Quantitative 2008
[25]

European Masters in Quality in Analytical Laboratories
100 BZs,MCs,PCs,Qs,
SAs,PYs,TCs,NZs
, Ts,Ns,Is,As,
Milk ACN SPE
(Strata- X)
80-120% UPLC-TOF-
MS
Screening,
Quantification,
Confirmation
2008
[26]
15 PCs ,Cs Bovine Muscle,
Kidney and Milk
ACN/Water SPE
(Oasis HLB)
Milk : 57-115%
Muscle:65-111%
Kidney:46-90%
LC-MS-MS Screening /
Quantification/
Confirmation
2004
[28]
47 TCs,Qs,MCs ,SAs
,DPs ,LCs Milk
TCA, MCIlvaine
buffer
SPE
Oasis HLB 94-112% LC-MS/MS
Quantification
2009
[32]
18 Qs, SAs, MCs,
As, TCs Milk
Liquid Extraction
with ACN No cleanup 70-110%
UPLC
MS/MS
Quantification,
Confirmation
2008
[33]
19 TCs, SAs, TMP,
Ds
Muscle (Bovine,
Ovine, Porcine
and Poultry)
0.1M EDTA and
ACN
No SPE
clean up 94-102.1%
UPLC
MS/MS
Quantification
Confirmation
2009
[34]
7 TCs, SAs ,CPs Bovine Milk TCA SPE
(Oasis HLB) 83-112% HPLC-DAD Quantitative
2009
[35]
European Masters in Quality in Analytical Laboratories
10 SAs, TCs, Ps Cow Milk TCA, MCIlvain
buffer
SPE
(Oasis HLB) 72-97% HPLC-MS Quantitative
2007
[36]
8 FQs, TCs Catfish muscle ACN and Citrate
Buffer ----- 60-92%
LC
Fluorescence Quantitation
2007
[37]
25 TCs, MCs, Qs,
SAs, As Eggs
ACN+Citric
acid+Na2EDTA QuEChERS 60-119%
UPLC
MS/MS Quantitation
2009
[38]
15
TCs , FQs , MCs ,
LCs ,AGs , SAs,
PLs
Honey -------
SPE (Strata
X 60mg,
3ml)
65-104% LC-MS/MS Quantification
,Confirmation
2008
[39]
41 NZs, SAs, FQs,
Qs, Is Chicken muscle QuEChERS
Dispersive
SPE Varies LC-MS/MS Screening
2009
[40]
Acronyms: PCs: Penicillins , Cs : Cephalosporins, TCs : Tetracyclines , Qs : Quinolones, MCs: Macrolides, SAs: Sulfonamides,
DPs:diaminopyrimidine , LCs: Lincosamides, PLs : Phenicol , TMP: Trimethoprim, Ps: Pyrimethamine, Ts : tranquilizers , As : Antihelminthes ,
PYs : Pyrimidine, NZs: Nitroimidazoline, CAP: chloramphenicol , Ds: dapsone , Ns : NSAIDS, AVs: avermectin , COs: corticoids, Is:
Ionophores, As: Amphenicols, - -Lactams, FQs: Fluoroquinolones, AGs: Aminoglycosides
European Masters in Quality in Analytical Laboratories
20
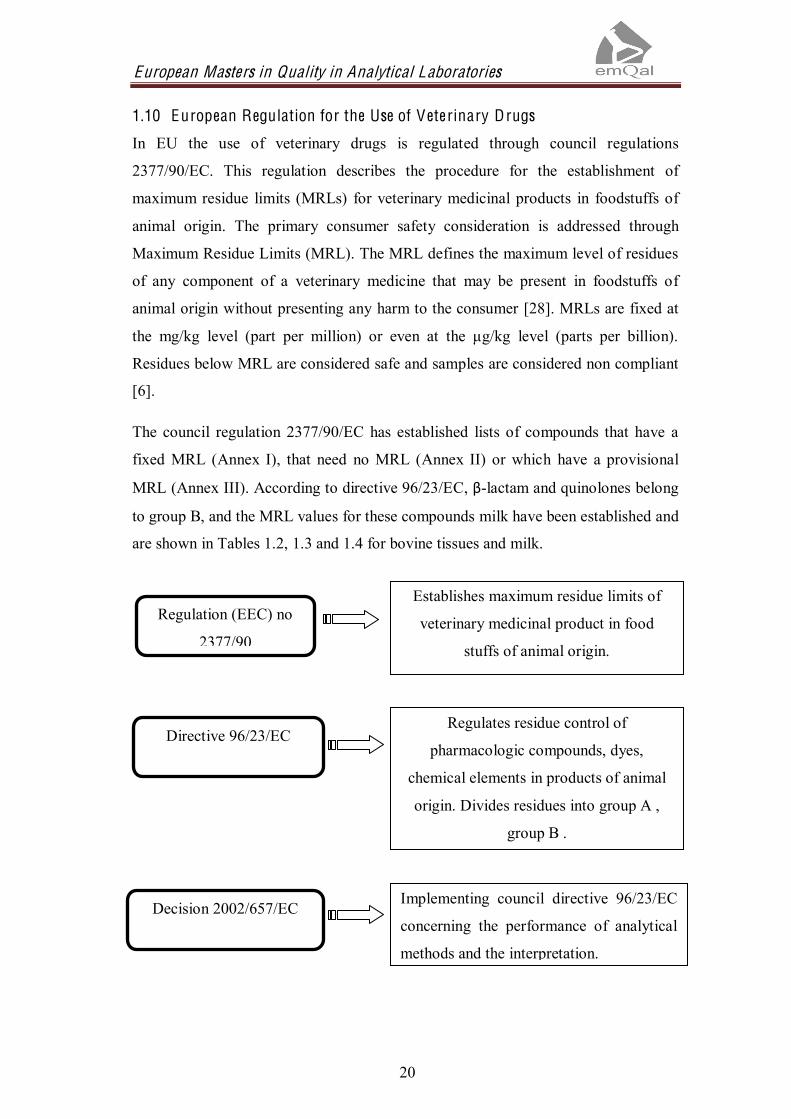
1.10 European Regulation for the Use of Veterinary Drugs
In EU the use of veterinary drugs is regulated through council regulations
2377/90/EC. This regulation describes the procedure for the establishment of
maximum residue limits (MRLs) for veterinary medicinal products in foodstuffs of
animal origin. The primary consumer safety consideration is addressed through
Maximum Residue Limits (MRL). The MRL defines the maximum level of residues
of any component of a veterinary medicine that may be present in foodstuffs of
animal origin without presenting any harm to the consumer [28]. MRLs are fixed at
the mg/kg level (part per million) or even at the µg/kg level (parts per billion).
Residues below MRL are considered safe and samples are considered non compliant
[6].
The council regulation 2377/90/EC has established lists of compounds that have a
fixed MRL (Annex I), that need no MRL (Annex II) or which have a provisional
MRL (Annex III). According to directive 96/23/EC, -lactam and quinolones belong
to group B, and the MRL values for these compounds milk have been established and
are shown in Tables 1.2, 1.3 and 1.4 for bovine tissues and milk.
Regulation (EEC) no
2377/90
Directive 96/23/EC
Decision 2002/657/EC
Establishes maximum residue limits of
veterinary medicinal product in food
stuffs of animal origin.
Regulates residue control of
pharmacologic compounds, dyes,
chemical elements in products of animal
origin. Divides residues into group A ,
group B .
Implementing council directive 96/23/EC
concerning the performance of analytical
methods and the interpretation.

European Masters in Quality in Analytical Laboratories
21
Table: 1.2. L ist of Penicillins that are regulated by E U in M ilk
Name and Chemical Structure Animal Species M R L Target
T issue
Amoxycillin (AMOX)
O
HN
NO
S
COOH
CH3
CH3
OH
NH2
All food
producing species
50 µg/kg
50 µg/kg
50 µg/kg
50 µg/kg
4 µg/kg
Muscle
Fat
Liver
Kidney
M ilk
Ampicillin (AMPI)
O
HN
NO
S
COOH
CH3
CH3
NH2
All food
producing species
50 µg/kg
50 µg/kg
50 µg/kg
50 µg/kg
4 µg/kg
Muscle
Fat
Liver
Kidney
M ilk
Benzylpenicillin (PEN G)
All food
producing species
50 µg/kg
50 µg/kg
50 µg/kg
50 µg/kg
4 µg/kg
Muscle
Fat
Liver
Kidney
M ilk
Cloxacillin (CLOX)
NO
NH
O
CH3
NO
S CH3
CH3
COOH
Cl
All food
producing species
300 µg/kg
300 µg/kg
300 µg/kg
300 µg/kg
30 µg/kg
Muscle
Fat
Liver
Kidney
M ilk
Dicloxacillin (DICL)
NO
NH
O
CH3
NO
S CH3
CH3
COOH
Cl
Cl
All food
producing species
300 µg/kg
300 µg/kg
300 µg/kg
300 µg/kg
30 µg/kg
Muscle
Fat
Liver
Kidney
M ilk

European Masters in Quality in Analytical Laboratories
22
Nafcillin (NAFC)
NH
O
N
O
S CH3
CH3
COOHOC2H5
All ruminants
300 µg/kg
300 µg/kg
300 µg/kg
300 µg/kg
30 µg/kg
Muscle
Fat
Liver
Kidney
M ilk
Oxacillin (OXAC)
NO
NH
O
CH3
NO
S CH3
CH3
COOH
All food
producing species
300 µg/kg
300 µg/kg
300 µg/kg
300 µg/kg
30 µg/kg
Muscle
Fat
Liver
Kidney
M ilk
Table: 1.3. L ist of Cephalosporins that are regulated by E U in milk
Name and Chemical Structure Animal species M R L Target tissue
Cefalexin (LEX)
Bovine
200 µg/kg
200 µg/kg
200 µg/kg
1000µg/kg
100µg/kg
Muscle
Fat
Liver
Kidney
M ilk
Cefalonium (LON)
Bovine 20µg/kg M ilk
Cefapirin (PIR)
Bovine
50 µg/kg
50 µg/kg
100µg/kg
60 µg/kg
Muscle
Fat
Kidney
M ilk

European Masters in Quality in Analytical Laboratories
23
Cefazolin (ZOL)
Bovine , ovine ,
caprine 50 µg/kg M ilk
Cefaperazone (PER)
Bovine
50 µg/kg
M ilk
Cefquinome (QUI)
Bovine
50 µg/kg
50 µg/kg
100µg/kg
200µg/kg
20 µg/kg
Muscle
Fat
Liver
Kidney
M ilk
Ceftiofur (TIO)
All mammalian
food producing
species
1000 µg/kg
2000 µg/kg
2000 µg/kg
6000 µg/kg
100 µg/kg
Muscle
Fat
Liver
Kidney
M ilk
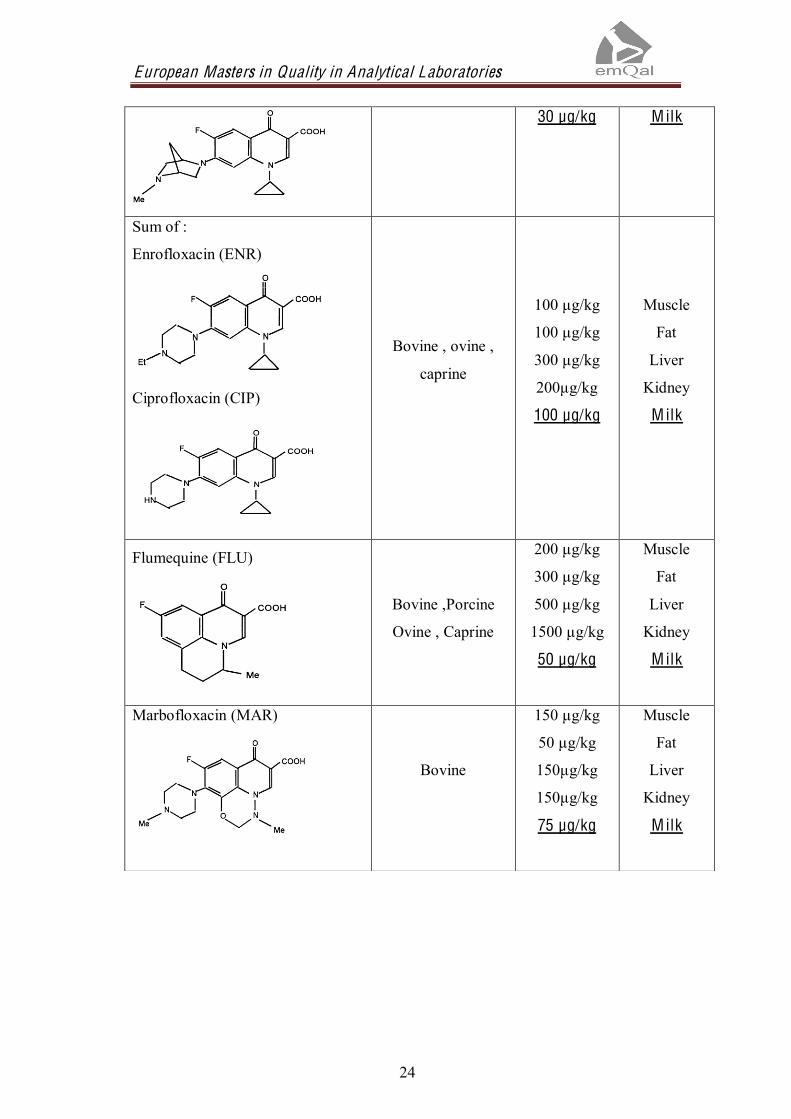
Table: 1.4. L ist of Quinolones that are regulated by E U in milk
Name and Chemical Structure Animal species M R L Target tissue
Danofloxacin (DAN)
Bovine, ovine,
caprine
200 µg/kg
100 µg/kg
400 µg/kg
400 µg/kg
Muscle
Fat
Liver
Kidney
European Masters in Quality in Analytical Laboratories
24
30 µg/kg M ilk
Sum of :
Enrofloxacin (ENR)
Ciprofloxacin (CIP)
Bovine , ovine ,
caprine
100 µg/kg
100 µg/kg
300 µg/kg
200µg/kg
100 µg/kg
Muscle
Fat
Liver
Kidney
M ilk
Flumequine (FLU)
Bovine ,Porcine
Ovine , Caprine
200 µg/kg
300 µg/kg
500 µg/kg
1500 µg/kg
50 µg/kg
Muscle
Fat
Liver
Kidney
M ilk
Marbofloxacin (MAR)
Bovine
150 µg/kg
50 µg/kg
150µg/kg
150µg/kg
75 µg/kg
Muscle
Fat
Liver
Kidney
M ilk

European Masters in Quality in Analytical Laboratories
25
Figure 1.7 and 1.8 shows the chemical structure for internal standard
Figure (1.7): PIPE (Piperacillin)
Figure (1.7)PIPE (Piperacillin)
Figure (1.8) PIP (Pipemidic acid)
The determination of single class of antibiotics has been carried out previously in our
research group [29-31]. This method involves combination of these works for
simultaneous determination of penicillins, cephalosporins and quinolones in milk
samples by LC-MS/MS.
The work begins with preliminary study to choose the type of milk to develop the
method. After selection of type of milk further a comparative study was done for
optimization of extraction method for better recovery of analytes. We have then
proceeded to validation of the method according to European commission decision
2002/657/EC and some parameters from FDA guidelines using raw milk. Finally the
method was applied for real samples (positive milk samples) supplied by Laboratori
Interprofessional Lleter de Catalunya (ALLIC).
N
S
HOOC H
O
CONHCHH2NCONHN
OO
CH3CH2
CH3
CH3
N
S
HOOC H
O
CONHCHH2NCONHN
OO
CH3CH2
CH3
CH3

European Masters in Quality in Analytical Laboratories
27
Exper imental
2.1 Reagents and M aterials
2.1.1. Standards
Benzylpenicillin (PENG) were supplied by the European pharmacopeia
(Strasbourg Cedex, France), Amoxycillin (AMOX), Nafcillin(NAFC) and
Oxacillin (OXAC) were obtained from Sigma-Aldrich (St. Louis, MO, USA), and
Cloxacillin (CLOX) were obtained from Fluka (Buchs, Switzerland).
The cephalosporin standard Cephalexin (LEX),Cefalonium ( LON), Cefapirin
(PIR), Cefazolin (ZOL) and Cefoperazone (PER) were obtained from Sigma
Aldrich, Cefquinome (QUI) from A.K Scientific, and Ceftiofur (TIO) from
Riedel-de Haën.
The Quinolone standard Danofloxacin (DAN) were purchased from Pfizer
(Karlsruhe, Germany) , Enrofloxacin (ENR) (Cenavisa Reus, Spain) , Flumequine
(FLU), Marbofloxacin (MAR), Ciprofloxacin (CIP) from (Sigma, St. Louis
,MO,USA),
The internal standard Piperacillin (PIPE) and Pipemidic acid (PIP) were obtained
from Fluka (Buchs, Switzerland) and (Prodesfarma) respectively.
2.1.2. Reagent and Solvent
All reagents were LC grade. Methanol, MeOH (99.9%), Acetonitrile, ACN
(99.9%), Formic acid, HFO (98%), Acetic acid (glacial), HAC 99.9 % were
obtained from Merck, Darmstadt, Germany.
obtained using a water
purifier Purelab plus.
Sodium dihydrogen phosphate, NaH2PO4 > 99.0 % was obtained from Merck
Darmstadt, Germany.
2.1.3 Preparation of Standard and Stock Solutions
Individual Stock Solutions: Stock standard solution of each antibiotics were
prepared at a concentration of 100 ppm by dissolving the quantity of each
compound (AMOX, AMPI, PENG, CLOX, DICL, NAFC, OXAC, LEX, LON,

European Masters in Quality in Analytical Laboratories
28
PER, QUI, TIO, ZOL and PIR) in water, (CIP, DAN, ENR, and MAR) in 50 Mm
acetic acid and FLU in acetonitrile.
Working Solutions: 100 MRL of the working standard mixture solutions used to
spike the milk samples were prepared by mixing the individual solution and stored
under refrigeration (-8°C) until use. These solutions were prepared separately for
penicillins, cephalosporins and quinolones. 100 MRL solution was prepared in
following way.20 MRL solution was prepared by diluting 100 MRL solution.
For penicillins 40µl of AMOX, AMPI, PENG and 300 µl of CLOX, DICL,
OXAC and NAFC in 10 ml of water.
For cephalosporins 600µl of PIR, 200 µl of QUI, LON, 500 µl of ZOL, PER
and 1000 µl of LEX and TIO in 10 ml of water.
For quinolones 300µl of DAN, 1000 µl of ENR and CIP, 500 µl of FLU and
375 of MAR in 10 ml of water.
A solution of PIPE and PIP was prepared at concentration of 100 mg L-1 in water.
0.1M sodium dihydrogen phosphate solution at pH 10 was prepared by dissolving
in water adjusting pH by 5M NaOH.
2.1.4. Solid Phase Extraction Cartridge
The solid phase extraction (SPE) cartridge used in this study was Oasis HLB (3 ml,
60 mg) obtained from Waters, Milliford; USA. Oasis HLB is a macro porous
copolymer consisting of two monomers, the lipophilic N-divinylbenzene and the
hydrophilic N-vinylpyrrolidone. The hydrophilic N-vinylpyrrolidone increases the
water wettability of the polymer and the lipophilic divinylbenzene provides the
reversed phase retention necessary to retain analytes [3].
The characteristics, properties and structure of the Oasis HLB sorbent are detailed in
figure 2.1 and table 2.1.

European Masters in Quality in Analytical Laboratories
29
Table: 2.1. Prope rties of Oasis H L B sorbent
Figure (2.1): Structure of Oasis HLB cartridge
Oasis HLB cartridges was choosen for this experimental procedure because it allows
to extract all kinds of antibiotics studied at the same time. From the literature review
we can see that Oasis HLB has been successful in isolating residues of interest in
milk [15,23,32,36] and also have been successfully utilized in many multiclass
residue methods [17,19,21,25,27].It has proven to provide efficient extraction with
optimal recovery, equal retention and also history of batch to batch reproducibility
[25].
2.2 Inst rumentation
Technical balance from Sartorius laboratory (model LP2200P, sensitivity 0.01-
0.05g) was used to weigh the samples and NaH2PO4 buffer.
Specification
Specific surface area ( m2/g) 727-889
Average pore diameter (A° ) 73-89
Total pore volume ( cm3/g) 1.18-1.44
Average partic le diameter (µm) 25.0-35.0
F ines content
European Masters in Quality in Analytical Laboratories
30
Analytical balance from Mettler Toledo (Model AB204, precision 0.1 mg) was
used for weighing standards.
Selecta ultrasound system was used to dissolve the standard solutions.
The pH of the buffer and mobile phase was measured using Crison-micro pH
2002 Potentiometer (± 0.1 mV) (Crison, Barcelona, Spain). A 5203 combinated
pH electrode from Crison was used and the electrode was soaked in water when
not in use.
A vortex mixer Heidolph, model Reax 2000 was used for samples agitation.
Supelco visidry 24 port was used for solid phase extraction
Additive Visidry desiccant, designed for the Supelco Visiprep vacuum distributor,
using a stream of compressed nitrogen was used for sample evaporation.
Hettich Mikro 20 Mini centrifuge, to centrifuge the samples after being
reconstructed
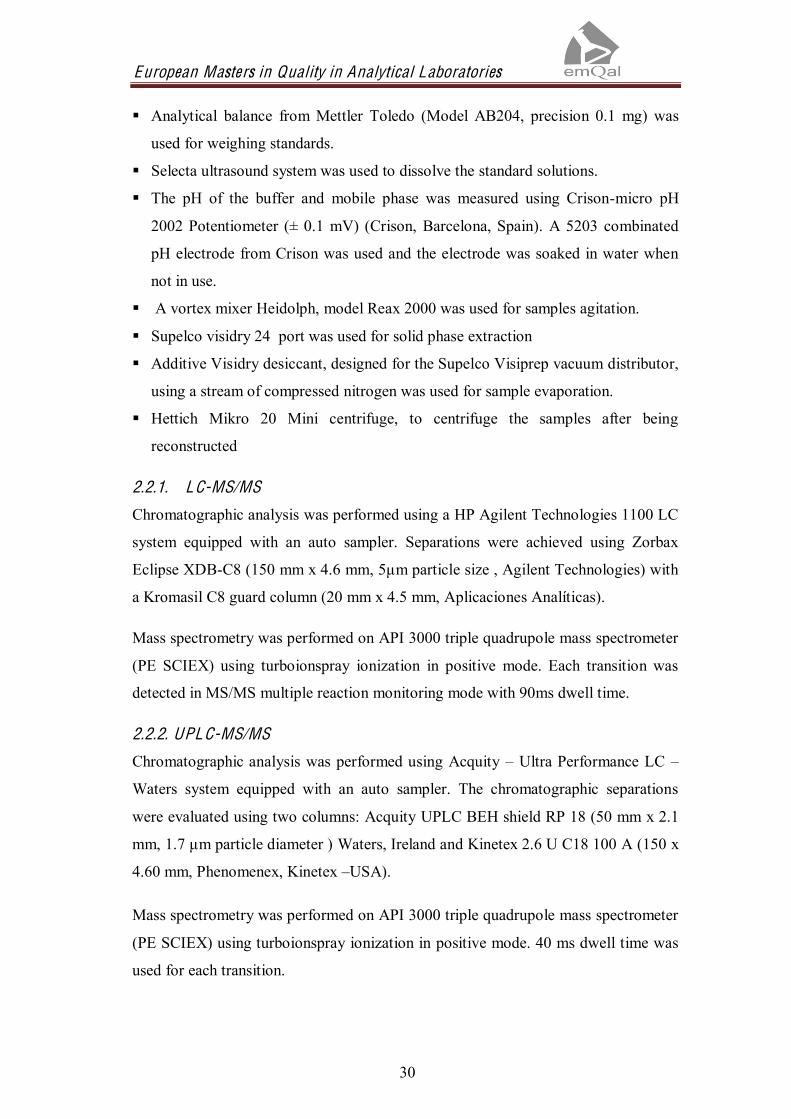
2.2.1. LC-MS/MS
Chromatographic analysis was performed using a HP Agilent Technologies 1100 LC
system equipped with an auto sampler. Separations were achieved using Zorbax
Eclipse XDB-C8 (150 mm x 4.6 mm, 5µm particle size , Agilent Technologies) with
a Kromasil C8 guard column (20 mm x 4.5 mm, Aplicaciones Analíticas).
Mass spectrometry was performed on API 3000 triple quadrupole mass spectrometer
(PE SCIEX) using turboionspray ionization in positive mode. Each transition was
detected in MS/MS multiple reaction monitoring mode with 90ms dwell time.
2.2.2. UPLC-MS/MS
Chromatographic analysis was performed using Acquity Ultra Performance LC
Waters system equipped with an auto sampler. The chromatographic separations
were evaluated using two columns: Acquity UPLC BEH shield RP 18 (50 mm x 2.1
mm, 1.7 µm particle diameter ) Waters, Ireland and Kinetex 2.6 U C18 100 A (150 x
4.60 mm, Phenomenex, Kinetex USA).
Mass spectrometry was performed on API 3000 triple quadrupole mass spectrometer
(PE SCIEX) using turboionspray ionization in positive mode. 40 ms dwell time was
used for each transition.

European Masters in Quality in Analytical Laboratories
31
2.2.3. Data Process
For both instruments, instrument control and data acquisition were performed with
.
2.3. Experimental Procedure
2.3.1. Milk Samples
Different kinds of milk samples were analysed. Raw milk samples (not pasteurized)
were used for method validation which was kindly supplied by Laboratori
Interprofessional Lleter de Catalunya (ALLIC). The raw milk sample was stored in
frozen state at -20°C until analysis. The commercial milk samples (whole milk) were
obtained from local supermarket. Positive milk samples were obtained from different
-Lactams antibiotics which were supplied by
ALLIC.
2.3.2. Sample Preparation
Sample preparation is one of the critical steps for multiclass, multi residue
determination of antibiotics in food sample because antibiotics with different
physicochemical properties (pka, polarity, solubility) have to be determined
simultaneously. To establish a suitable method for extraction of antibiotics from raw
milk different extraction methods were applied represented in table 2.2.
Table: 2.2 Nomenclature of Ext raction Procedure
M ethod Ext raction Procedure Procedure
1 E1
Weigh,
Spike with WS and IS
No centrifugation of the sample
2 E2
Centrifuge the sample,
Weigh,
Spike with standards
3 E3
Weigh,
Spike
Centrifuge the sample before
passing through SPE cartridge

European Masters in Quality in Analytical Laboratories
32
The steps of sample preparation are listed below:
2 g of milk was weighed into a polypropylene centrifuge tube in case of E1 and
E3. However, in case of E2 the sample was centrifuge before weighing.
2 ml of Milli Q water was added into individual test tubes.
The sample was spiked with working standard and internal standard.
0.5 ml of 0.1 M NaH2PO4 (pH 10) solution was added and the mixture was vortex
for 40 seconds.
Conditioning of the sorbent: Before the sample was passed through the SPE
cartridge it was precondition with 1 ml of MeOH, 1 ml of H2O and 1 ml of
NaH2PO4 solution at pH10.
Application of sample to the sorbent: Retention of analyte and matrix occurs in
sorbent. In case of E2 the sample was centrifuge after addition of standards,
before passing through SPE cartridge. Care was taken so that supernatant was
transferred to cartridge avoiding any visible fat layer. Positive pressure was
applied with the help of syringe when needed.
Rinsing the sorbent bed: After the sample is passed through the cartridge to
decrease the matrix interference it was cleaned with 3 ml of water.
Elution of the retained compounds: In order to disrupt the analyte sorbent
interaction, 2 ml of methanol was added and substances were eluted.
The eluate was evaporated to dryness by nitrogen stream and the residue was
reconstituted with 200 µl of water.
The tube containing the extract was vortex for 1 min and was transferred to
eppendorf which was centrifuged at 10000 rpm for 4 minutes and supernatant is
stored in glass vials in freezer at -8°C until analysed by LC-MS/MS.
For UPLC-MS/MS analysis, samples were further filtered by using a Millipore
ultra free -MC centrifugal filter device. (Centrifuge filter device, 0.22 µm filter
unit) before injection.

European Masters in Quality in Analytical Laboratories
33
General Steps involved in the use of SPE are represented schematically in the
figure 2.2
Figure (2.2): General SPE procedure

European Masters in Quality in Analytical Laboratories
34
Flow chart diagram of the process is represented schematically in Fig 2.3
Figure (2.3): Flow chart for extraction of Analyte
Sample Preparation
SPE Clean Up +
Concentration
HPL C-MS/MS UPL C-MS/MS
Pass M ilk through
Cartridge
Wash with 3 ml of Water
E lute with 2 ml of Methanol
Nitrogen Drying
Reconstitute with 200 µl of H 20
Add 2ml of Water
Spike with working
standard & IS
OASIS HLB
Reduces viscosity, improves
uniformity and loading of
sample.
To decrease the matrix interference
Store the Supernatant
Ensure Reproducible retention of Analytes.
2 g of
M ilk
Add 0.5 ml of phosphate solution pH10
Vor
tex
1ml of MeoH 1 ml of H2O
1 ml of phosphate solution pH10
SPE
Conditioning

European Masters in Quality in Analytical Laboratories
35
2.3.3. Chromatographic Condition
2.3.3.1. LC-MS/MS
Separation was performed on a gradient mode with mobile phase A consisting of 0.1
% formic acid in H2O and mobile phase B consists of 0.1% formic acid in ACN.
Both A and B contains 0.1 % formic acid as mobile phase additive. Addition of
formic acid in mobile phase can change the pH value of mobile phase and affect the
chromatographic separation. The flow rate was set at 1ml/min and the injection
volume was 20µl.The total run time for each injection was 10 min. Table 2.3 shows
the gradient used for the separation using LC-MS/MS system and E3 extraction
method.
Table 2.3 L C-MS/MS gradient
Figure 2.4 shows the separation of antibiotics studied
Time A(H2O) B(A C N)
0 85 15
2 85 15
4 55 45
7 44 56
8.5 85 15
11 85 15

European Masters in Quality in Analytical Laboratories
36
XIC of +MRM (21 pairs): 335,0/160,0 amu from Sample 21 (RE_4_2_LC) of 27_10_09.wiff (Turbo Spray) Max. 1,5e5 cps.
1 2 3 4 5 6 7 8 9 10Time, min
0,02,0e54,0e56,0e58,0e51,0e61,2e61,4e61,6e61,8e62,0e62,2e62,4e62,6e62,8e63,0e63,2e63,4e63,6e63,8e64,0e64,2e64,4e64,6e64,8e6
Intensity, cps
1
2
3 4
5
8 9
10
11
1213
1415
16
17
1819
20
21
6
7
Figure (2.4): Chromatogram obtained from a milk sample fortified to the 4MRL
concentration using LC-MS/MS where 1)AMOX, 2) PIR, 3) QUI, 4) PIP, 5) MAR,
6) AMPI, 7) LEX, 8) LON, 9) CIP, 10) DAN, 11)ENR, 12) ZOL, 13) PER, 14)
TIO,15)PIPE 16 ) PENG 17 ) FLU 18) OXAC 19) CLOX 20) NAFC, and 21) DICL.
2.3.3.2. UPLC-MS/MS System
The mobile phase used for UPLC-MS/MS is similar to that used for LC-MS/MS as
described in 2.3.3.1. Two columns were checked for the separation efficiency of
analytes. Properties for packing for both column are given below.
A) Acquity UPLC BEH (Bridged ethylsiloxane/silica hybrid particle) Shield RP 18
The column chemistry is shown in figure 2.5 and the properties of the packing
material of the column is described in table 2.4
Figure (2.5) ACQUITY UPLC BEH Shield RP 18

European Masters in Quality in Analytical Laboratories
37
Table (2.4) Acquity UPL C B E H Chemist ry
Bonded phase
Ligand type Monofunctional embedded polar group
Ligand Density 3.3 µmol/m2
Carbon Load 17%
Endcap style TMS
pH range 2-12
BEH Particle
Pore Diameter 130 A
Pore Volume 0.7 mL/g
Surface Area 185 m2/g
b) Kinetex 2.6 µm Core-Shell Particle
Kinetex core shell particle consists of porous shell and core shell. The material
characteristics of Kinetex column is shown in table (2.5)
Figure (2.6) Kinetex 2.6 µm Core-Shell Particle
Table (2.5) K inetex 2.6 µm Core-Shell Partic le
Total Particle size (µm) 2.6
Porous Shell (µm) 0.35
Solid core (µm) 1.9
Pore Size ( A) 100
Effective surface area (m2/g) 200
Effective carbon load % 12
pH stability 1.5-10
Pressure stability 600 bar
European Masters in Quality in Analytical Laboratories
38
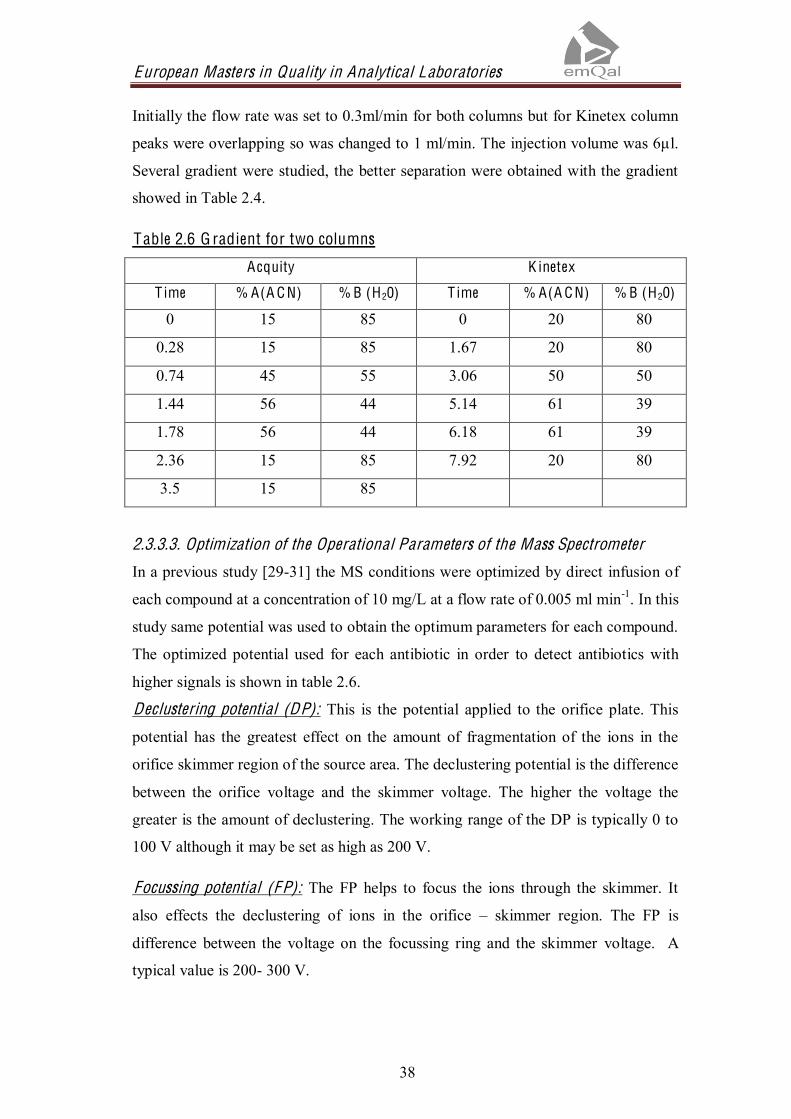
Initially the flow rate was set to 0.3ml/min for both columns but for Kinetex column
peaks were overlapping so was changed to 1 ml/min. The injection volume was 6µl.
Several gradient were studied, the better separation were obtained with the gradient
showed in Table 2.4.
Table 2.6 G radient for two columns
Acquity K inetex
T ime % A(A C N) % B (H20) T ime % A(A C N) % B (H20)
0 15 85 0 20 80
0.28 15 85 1.67 20 80
0.74 45 55 3.06 50 50
1.44 56 44 5.14 61 39
1.78 56 44 6.18 61 39
2.36 15 85 7.92 20 80
3.5 15 85
2.3.3.3. Optimization of the Operational Parameters of the Mass Spectrometer
In a previous study [29-31] the MS conditions were optimized by direct infusion of
each compound at a concentration of 10 mg/L at a flow rate of 0.005 ml min-1. In this
study same potential was used to obtain the optimum parameters for each compound.
The optimized potential used for each antibiotic in order to detect antibiotics with
higher signals is shown in table 2.6.
Declustering potential (DP): This is the potential applied to the orifice plate. This
potential has the greatest effect on the amount of fragmentation of the ions in the
orifice skimmer region of the source area. The declustering potential is the difference
between the orifice voltage and the skimmer voltage. The higher the voltage the
greater is the amount of declustering. The working range of the DP is typically 0 to
100 V although it may be set as high as 200 V.
Focussing potential (FP): The FP helps to focus the ions through the skimmer. It
also effects the declustering of ions in the orifice skimmer region. The FP is
difference between the voltage on the focussing ring and the skimmer voltage. A
typical value is 200- 300 V.

European Masters in Quality in Analytical Laboratories
39
Entrance potential (EP): The EP is the difference between the voltage on the high
pressure entrance quadrupole and the skimmer voltage. It is typically set at 10 V
and affects selling of all other instrument voltage.
Table 2.6 shows the optimal values of the potentials
Table 2.7 Optimal values of the potentials
Family Antibiotic DP FP EP
Penicillins
AMOX 40 150 6
AMPI 65 150 6
CLOX 40 140 7
DICL 50 150 8
OXAC 50 120 9
NAFC 40 160 9
PENG 65 220 7
Cephalosporin
LEX 30 125 5
LON 30 125 5
PIR 40 150 5
PER 50 200 11
QUI 40 175 5
TIO 50 200 5
ZOL 40 175 5
Quinolones
CIP 45 200 10
DAN 45 200 10
ENR 45 200 10
FLU 38 200 10
MAR 45 200 10
IS PIP 50 200 10
PIPE 40 175 5

European Masters in Quality in Analytical Laboratories
40
The turboion spray was in positive mode with following settings:
Ion spray voltage This is the voltage applied to the needle that ionizes and nebulises the sample. The
ion spray voltage parameter depends on the polarity and affects the stability of the
spray and sensitivity. The ion spray voltage used is 4500V.
Nebuliser gas (NEB) This is the gas that focuses the spray in the nebuliser. The nebuliser gas parameter
affects the stability of the spray and sensitivity. The Nebulizer gas used is 10
arbitrary units.
Curtain gas (CUR) This is the gas between the curtain plate and the orifice plate. The main function of
the curtain gas is to prevent the contamination of the ions optics. The curtain gas
depends on the solvent flow rate. The curtain gas used is 12 arbitrary units.
Auxiliary Gas The nebuliser and auxiliary gas affects the stability of the spray and sensitivity.
These gases have different names in different instruments. For turbo ion spray
sources the auxiliary gas is the turbo (heater) gas. Auxiliary gas flow is 4500
cm3/min and Auxiliary gas temperature is 400 º C.

European Masters in Quality in Analytical Laboratories
Two MRM transitions were studied for each analyte. The most intense one was used for the quantification and the minor one for confirmation of
the analyte. The quantification and identification transition that was optimized in a previous study [29-31] was applied in this study.
European commission decision 2002/657/EC establishes identification (IPs) in order to confirm the residues of antibiotics in food stuffs of
animal origin. For the confirmation of antibiotics studied (listed in group B of Annex I of directive 96/23/EC), a minimum of 4 IPs is required.
With two transitions, 1 precursor and two daughter ions, we achieve total of 4 IPs using LC-MS/MS.
Table 2.7 shows MS/MS transitions for quantification and confirmation as well as collision energy values optimized for each of the studied
antibiotics.
Table 2.8 MS/MS Parameters for the antibiotics studied
Family Antibiotic HPL C *
tR(min)
UPL C#
tR(min)
Quantification
T ransition
Collision Energy
(C E)
Identification
T ransition
Collision Energy
(C E)
Penicillins
AMOX 2.1 0.65 28 19
AMPI 4.26 0.86 26 21
CLOX 8.76 2 20 20
DICL 9.75 2.21 21 22
NAFC 8.94 2.05 19 21
OXAC 8.23 1.89 18 18
PENG 7.42 1.68 16 16

European Masters in Quality in Analytical Laboratories
Cephalosporins
LEX 2.31 0.85 35 15
LON 6.18 1.12 30 20
PIR 4.38 0.68 20 35
PER 6.49 1.43 35 20
QUI 4.76 0.74 20 20
TIO 5.73 1.45 30 25
ZOL 2.61 1.34 15 25
Quinolones
CIP 5.19 1.08 32 27
DAN 5.33 1.11 31 31
ENR 5.5 1.14 29 29
FLU 7.92 1.75 26 45
MAR 4.22 0.88 22 30
I .S. PIPE 2.85 1.54 25 5 15
PIP 6.88 0.71 30 25
* Column used for separation is Zorbax Eclipse XDB-C8 (150mm x 4.6mm, Agilent Technologies)
# Column used for separation is Acquity UPLC BEH shield RP 18.


European Masters in Quality in Analytical Laboratories
43
3. Results and Discussion
3.1. Preliminary Study
3.1.1. Comparision between Raw and Commercial Milk
Milk consists of fat which have a very different composition in raw and commercial
milk. In order to optimize the extraction method a preliminary study was done using
commercial whole milk (CM) and comparing the recoveries obtained with the raw
milk (RM). In order to compare the behaviour of the antibiotics in both milk
samples, the easier method i.e. E1 was applied as described in experimental section
2.3.2.
Figure 3.1.shows the recoveries obtained from both milk samples. We can see that
half of the antibiotics present significantly different recovery in both milk samples.
Recovery for antibiotics obtained with commercial milk is better. We can say that
may be the presence of high fat content in raw milk makes the recovery worse than
commercial milk. From this we can draw a conclusion that to optimize the extraction
method it is necessary to use the raw milk not the commercial milk.
Figure (3.1) Recovery obtained from raw and commercial milk.
3.1.2. Comparison between Air and Nitrogen Drying
Evaporation step is a critical part of the sample preparation process. A study was
done comparing (%) recovery of each analyte using commercial milk to see if there
is difference between the nitrogen and air drying of the sample. 6 samples were

European Masters in Quality in Analytical Laboratories
44
prepared at 2 MRL level for each antibiotic and extraction was performed as
described in section 2.3.2. The elution fraction obtained from SPE was evaporated to
dryness under a stream of air or nitrogen.
The recoveries for quinolones and penicillins are similar using two different drying
techniques. However, the recoveries for cephalosporins are slightly higher with
nitrogen drying as can be observed in figure 3.2. So nitrogen drying was preferred
for subsequent studies to be made with raw milk.
Figure (3.2) Recovery (%) obtained for cephalosporin using air and nitrogen drying.
3.2. Optimization of the Extraction M ethod
Three different extraction methods were compared in analysing raw milk to obtain
maximum recovery. As can be observed in experimental section, table 2.2, methods
E2 and E3 have a centrifugation step that is made at different points of the sample
preparation process while E1 do not have their centrifugation step.
Figure 3.3 show the recovery of the penicillins studied using three different
extraction methods (E1, E2 and E3).

European Masters in Quality in Analytical Laboratories
45
Figure (3.3) Recoveries (%) of penicillins using three different extraction methods
We can see that except for AMOX and AMPI in E2 and E3 the recoveries of
penicillins are higher than 80 %.
Figure 3.4 show the recovery of cephalosporins studied using the three methods. As
can be observed in the figure, the recoveries for cephalosporins are approximately 70
% except for LEX and QUI.
Figure 3.4 Recoveries (%) of cephalosporins using three different extraction methods
Figure 3.5 shows the recovery of quinolones using three methods. Quinolones
present higher recoveries than 60 % except for DAN in method E3.

European Masters in Quality in Analytical Laboratories
46
Figure 3.5 Recoveries (%) of quinolones using three different extraction methods
Following conclusions are drawn from the result obtained using three (E1, E2 and
E3) extraction method. E1 was not choosen as due to higher amount of fat present in
raw milk it was difficult to pass the sample through the SPE cartridge without
centrifugation. E2 and E3 have a centrifugation step. E2 begins with this
centrifugation step and E3 spike with antibiotics and then centrifuged. Although the
results of E2 are better than those obtained with E3, the E3 method was choosen for
subsequent studies because the procedure is more similar to the procedure used for
positives samples. The E3 method would be given lower results because drugs would
be lost during the centrifugation step in the same way as positive samples. Thus E3
was choosen for performing validation study.
3.3. UPL C-MS/MS Optimization
The method that was developed in LC was applied to UPLC. When we change from
LC to UPLC analysis, the MS parameters need to be altered to obtain the highest MS
signals. One of the parameters that need to be adjusted is dwell time. Dwell time was
changed to obtain enough data points for each peak considering that we analyse 21
antibiotics simultaneously. This parameter measures the period of time that is spend
collecting data, at a particular mass , and usually ranges 10 ms to 200 ms. Variations
in dwell time (90 msec, 40 msec, 20 msec and 10 msec) was made with mixture of
standards. Appropriate dwell time balance the improvement of signal to noise ratio
with sufficient data points to characterize the chromatographic peaks. With 40ms
European Masters in Quality in Analytical Laboratories
47
dwell time the baseline noise is reduced and the peaks are well separated .So 40 ms
dwell time was selected for carrying out the experimental work.
3.4. Comparative Study of Two UPL C Columns
In order to achieve better separation and retention of analytes, main chromatographic
condition such as chromatographic column and gradient elution profile was studied
using two different columns .The column chemistry for two are different as shown in
experimental section table 2.4 and 2.5 so the separation achieved with two columns
are different.
3.4.1. Acquity UPLC B E H shield RP 18 (50 x 2.1 mm, 1.7µm particle diameter)
Acquity BEH incorporates an embedded polar group (carbamate group) into the
bonded phase ligand. Features of embedded polar group include alternate selectivity
to that of alkyl reversed phase columns, excellent peak shape for bases reducing peak
tailing and aqueous mobile phase compatibility. The organic-inorganic hybrid, with
ethylsiloxane bridges both on the surface and throughout the body of the material,
provides a broader range of chemical stability, especially the pH operating range
(pH1-12), while minimizing interactions of the matrix with any analyte
functionalities.
Due to different nature of analytes and in order to elute all analytes in a reasonably
short time different gradient profile was studied. Initially, the flow was set to 0.20
ml/min. But the flow rate was small for chromatographic separation so with the same
gradient condition, flow rate was changed to 0.3 ml/min. The optimized gradient is
shown in experimental section table 2.4 and figure 3.6 shows the separation.

European Masters in Quality in Analytical Laboratories
48
XIC of +MRM (21 pairs): 424,0/292,0 amu from Sample 18 (RE_4MRL_2) of 10_11_09.wiff (Turbo Spray) Max. 1,9e6 cps.
0,2 0,4 0,6 0,8 1,0 1,2 1,4 1,6 1,8 2,0 2,2 2,4 2,6 2,8Time, min
0,0
1,0e5
2,0e5
3,0e5
4,0e5
5,0e5
6,0e5
7,0e5
8,0e5
9,0e5
1,0e6
1,1e6
1,2e6
1,3e6
1,4e6
1,5e6
1,6e6
1,7e6
1,8e6
1,9e6
2,0e6
Intensity, cps
0,68
2
1
21
20
1918
17
16
15
14
13
12
11
8
9
9 10
7
6
53
4
Figure (3.6) Separations obtained from a milk sample fortified to the 4MRL
concentration for all antibiotics using Acquity UPLC BEH shield RP 18 column,
where 1)AMOX, 2) PIR, 3) PIP, 4) QUI, 5) LEX, 6) AMPI, 7) MAR, 8) CIP, 9)
DAN, 10) LON,11) ENR, 12) ZOL, 13) PER 14) TIO, 15) PIPE 16) PENG, 17)
FLU,18) OXAC, 19) CLOX, 20) NAFC, and 21) DICL.
3.4.2. Kinetex 2.6 U C18 (150 x 4.6 mm)
The Kinetex core-shell particle is not fully porous. Using sol-gel processing
techniques, a durable, homogenous porous shell is grown on a solid silica core. This
highly optimized growth process produces an extremely narrow particle size
distribution and dramatically reduces two major sources of peak dispersion- Eddy
Diffusion and Resistance to Mass Transfer. This reduces all major sources of band
broadening that allows for ultra-high performance on any LC system
Kinetex C18 column was applied in order to obtain the separation for the antibiotics
studied. The flow rate was changed from 0.3 to 1 ml/min to obtain better separation.
The best result was obtained with the gradient shown in table 2.4 and the separation
in Figure 3.7.

European Masters in Quality in Analytical Laboratories
49
XIC of +MRM (21 pairs): 424,0/292,0 amu from Sample 11 (RE_4MRL_3) of Kinetex.wiff (Turbo Spray) Max. 1,7e6 cps.
0,5 1,0 1,5 2,0 2,5 3,0 3,5 4,0 4,5 5,0 5,5 6,0 6,5 7,0 7,5 8,0Time, min
0,0
1,0e5
2,0e5
3,0e5
4,0e5
5,0e5
6,0e5
7,0e5
8,0e5
9,0e5
1,0e6
1,1e6
1,2e6
1,3e6
1,4e6
1,5e6
1,6e61,7e6
Intensity, cps
1
21
20
1918
1716
1514
13
12
11
10
98
76
54
23
Figure (3.7) Separations obtained from milk sample fortified to the 4MRL conc.
using Kinetex column where 1) AMOX, 2) PIR 3) QUI, 4) PIP, 5) AMPI, 6) LEX, 7)
MAR, 8) LON, 9) CIP, 10) DAN, 11) ENR, 12) ZOL, 13) PER, 14) TIO, 15) PIPE,
16) PENG, 17) FLU, 18) OXAC, 19) CLOX, 20) NAFC, and 21) DICL.
From the figure 3.6 and 3.7 we can see that the separation of antibiotics with Kinetex
column is not good because the bands are too broad especially for quinolones.
Comparatively better results were obtained with the Acquity UPLC BEH RP 18
column. However desirable, complete separation of the 21 drugs is a secondary
requirement for multi class multi residue analysis because the quantification and
identification transition are different for all substances. Moreover the analysis by
Acquity UPLC column is achieved in less than 3 minutes which is beneficial to be
applied in routine analytical laboratories as it helps to decrease analysis time and
solvent consumption. This column was used for carrying out (%) recovery and for
analysis of positive samples.

European Masters in Quality in Analytical Laboratories
50
3.5. Quality Parameters
The performance of the developed method was validated according to the European
Union regulation 2002/657/EC [43] and some parameters from the FDA guidelines
for bio analytical procedure [44]. The quality parameter established were
Limit of detection (LOD),
Limit of quantification (LOQ),
Linearity (calibration curve),
Recovery (%),
Precision
Decision limit (CC ), and
Detection capability (CC )
3.5.1. Limit of detection (LOD) and Limit of quantification (LOQ)
LOD is the lowest concentration of an analyte that the bioanalytical procedure can
reliably differentiate from background noise [44] and the limit of quantification
(LOQ) is the smallest analyte concentration that can be quantified with a given
confidence level.
To estimate LOD and LOQ, milk samples were spiked at 8 different concentration
level ranging from 0.001 to 0.1MRL (0.001, 0.003, 0.005, 0.01, 0.025, 0.05, 0.08,
and 0.1)
Limits of detection (LODs) was calculated at a signal to noise ratio of 3 while the
LOQ value was calculated by using a signal to noise ratio of 10.
The results obtained for LODs and LODs are shown in table 3.1.
As can be seen from table 3.1, LODs ranged from 0.03 (NAFC) to 0.5 µg/kg (PER)
and LOQs from 0.1 (NAFC, PENG, CIP, DAN, and ENR) to 1.25 µg/kg.

European Masters in Quality in Analytical Laboratories
51
Table 3.1. L O D and L O Q of antibiotics studied in milk using L C-MS/MS
3.5.2. Linearity and Calibration curve (CC)
The calibration curve is the relationship between the instrument response and known
concentration of analyte [43].
Calibration curves are prepared by plotting the area ratio between the analyte and the
internal standard versus ratio of analyte concentration and the internal standard
concentration
L C-MS/MS
Antibiotic M R L L O D (µg/kg) L O Q (µg/kg)
Penicillins
AMOX 4 0.1 0.3
AMPI 4 0.1 0.3
CLOX 30 < 0.1 0.15
DICL 30 0.15 0.5
OXAC 30 < 0.1 0.15
NAFC 30 0.03 0.1
PENG 4 0.04 0.1
Cephalosporins
LEX 100 0.3 1
LON 20 0.3 1
PER 50 0.5 1.25
PIR 60 0.1 0.3
QUI 20 0.2 0.5
TIO 100 0.3 0.5
ZOL 50 0.15 0.3
Quinolones
CIP 100 < 0.1 0.1
DAN 30 0.03 0.1
ENR 100 < 0.1 0.1
FLU 50 0.05 0.15
MAR 75 0.2 0.5

European Masters in Quality in Analytical Laboratories
The linearity of the method was evaluated at eight different concentration levels in milk samples. The working range of the curve was from 0.1 to
3 MRL (0.1, 0.3, 0.5, 1, 1.5, 2, 2.5, and 3 MRL). For each level of concentration two duplicates were prepared. PIPE and PIP was used as
internal standard for Q -Lactams respectively at a concentration of 100 mg L-1.
The samples prepared for calibration curve were analysed using both techniques, LC-MS/MS and UPLC-MS/MS. Table 3.2 summarizes the
calibration curve using both techniques.
Using LC-MS/MS, the calibration curves for all analytes are linear in given range with a correlation coefficient of 0.999 with exception of
AMOX and ENR (0.990). Although good correlation coefficient was obtained using UPLC-MS/MS, the correlation coefficients are slightly
lower than LC-MS/MS.
Table 3.2 Calib ration curve of each studied analyte together with thei r correlation coefficient
Family Antibiotic L C-MS/MS r UPL C-MS/MS r
Penicillins
AMOX y = 0.383x-0.000177 0.990 y= 0.181x+ 0.000478 0.981
AMPI y = 3.22x-0.00115 0.993 y=1.48x + 0.00342 0.990
CLOX y = 0.74x-0.00144 0.995 y=0.515x+ 0.00211 0.988
DICL y = 0.727x-0.0176 0.995 y= 0.341x-0.0166 0.960
NAFC y = 5.49x+0.00881 0.992 y= 3.54x+0.192 0.985
OXAC y = 1.38x+0.00807 0.996 y= 0.589x +0.0044 0.990
PENG y = 1.96x+0.00368 0.995 y= 1.48x+0.00384 0.997

European Masters in Quality in Analytical Laboratories
Cephalosporins
LEX y = 0.506x-0.0123 0.995 y=0.16x+0.0106 0.982
LON y = 0.953x+0.00578 0.994 y=0.769x+0.0179 0.983
PIR y = 3.09x+0.00693 0.993 y=1.18x+0.142 0.984
PER y = 0.0262x+0.00196 0.993 y= 0.0103x+0.000619 0.980
QUI y = 0.431x-0.0033 0.991 y=0.114x -0.00156 0.990
TIO y = 0.407x+0.00892 0.993 y=0.116x+ 0.0136 0.990
ZOL y = 0.248x+0.0192 0.990 y=0.212 x+0.0149 0.986
Quinolones
CIP y = 1.36x-0.00526 0.992 y=1.36x+ 0.0915 0.986
DAN y = 0.185x-0.00886 0.991 y=1.1x-0.0701 0.985
ENR y = 15.2x-1.3 0.990 y= 4.05x-0.0632 0.990
FLU y = 40x+3.16 0.996 y=3.34x+0.419 0.983
MAR y = 5.65x-0.569 0.995 y=2.99x-0.189 0.986
Where y * = instrumental response ( A analyte / A IS )
x * = analyte concentration / IS concentration.

European Masters in Quality in Analytical Laboratories
54
3.5.3. Recovery (%) Study
The accuracy of the method was assessed by recovery test. The recovery of an
analytical method is defined as the parameter that measures the efficiency that
method has in the analytes extraction process. Recovery experiments are performed
by comparing the analytical result of sample in which working standard and internal
standard are added before the extraction procedure with unextracted standard in
which samples are spiked with working standard and internal standard after the SPE
procedure at the same concentration (representing 100 % recovery).
The recovery (%) is calculated through calibration curve and an external curve.
- For both calibration and external curve, 8 concentration levels between 0.1 and
3 MRL were prepared.
- For the external curve, samples are prepared using the same procedure as for
calibration samples but the only difference is working solution and internal
standard are spiked directly to the extracts after the SPE
- From the external curve equation and the area ratio between antibiotics and
internal standard obtained in the calibration curves, we have determined the
recovery of each antibiotic studied.
Table 3.3 shows the recovery for each antibiotic studied using two different
techniques. The standard error for each recovery is also shown in the same table.
Using LC-MS/MS, it can be observed that out of 19 drugs analysed 17 drugs
presented recoveries higher than 65 % with exception of AMOX (57%) and DAN
(38 %). Using UPLC-MS/MS, recovery (%) is approximately 70 % with exception of
AMOX (48%), PER (59 %) and DAN (42%).
Comparing the recoveries obtained from both techniques, it can be observed that
most of the antibiotics present differences lower than 10 %, except for NAFC, PER,
QUI and TIO. The significant difference in recovery in these antibiotics may be due
to some variation in procedure. Before we inject the sample in UPLC-MS/MS, we
pass the sample through centrifugal filter device (0.22 µm). This may be one of the
reasons behind low recovery of some analyte. The other reason may be the sample

European Masters in Quality in Analytical Laboratories
55
volume was insufficient to be injected into UPLC-MS/MS as same sample that was
finished analyzing in LC-MS/MS was injected in UPLC-MS/MS.
Table 3.3 Recovery of Antibiotic studied in M ilk samples using L C-MS/MS and
UPL C-MS/MS
L C-MS/MS UPL C-MS/MS
Family Antibiotic Recovery (%) Recovery (%)
Penicillins
AMOX 57(4) * 48(3)*
AMPI 78(2) 69(2)
CLOX 90(2) 99(4)
DICL 101(2) 100(13)
NAFC 93(3) 122(7)
OXAC 86(2) 95(3)
PENG 78(2) 88(1)
Cephalosporins
LEX 83(2) 82(4)
LON 112(2) 110(4)
PIR 117(3) 100(5)
PER 76(3) 59(3)
QUI 105(3) 94(4)
TIO 97(3) 77(3)
ZOL 112(4) 108(5)
Quinolones
CIP 67(2) 77(4)
DAN 38(2) 42(2)
ENR 69(3) 77(3)
FLU 106(3) 116(7)
MAR 86(3) 82(4)
*% Error associated with recovery (Standard error)

European Masters in Quality in Analytical Laboratories
56
3.5.4. Precision Study
The precision of the method was evaluated in terms of repeatability (single day
intraday precision) and intermediate precision (different days - interday precision).
The repeatability of an analytical method is defined as the ability of the method to
generate the same results in repeated analysis of the same sample, performed by the
same operator under the working conditions of the equipment. The procedure was
repeated on 3 different days in order to determine inter-day precision.
The intra-day and inter-day precision of the methods were evaluated at three
concentration levels (0.5 MRL, 1 MRL and 2 MRL). 5 replicates were prepared for
each concentration. To quantify the concentration of samples, calibration curve was
prepared that was injected along with the samples. Finally, the relative standard
deviation (%) of the results was calculated. The acceptance criteria for RSD are 15 %
(except for LOQ 20 %) which is based according to the FDA guidance for validation
of analytical methods. [44]
Tables 3.4 and 3.5 shows the values obtained for intra-day and inter-day repeatability
for antibiotics studied in milk using LC-MS/MS.
As can be observed from the table 3.4, the repeatability values expressed as RSD %
are lower than 15 % which is within the acceptance criteria. Similar results are
obtained in other two consecutive days.
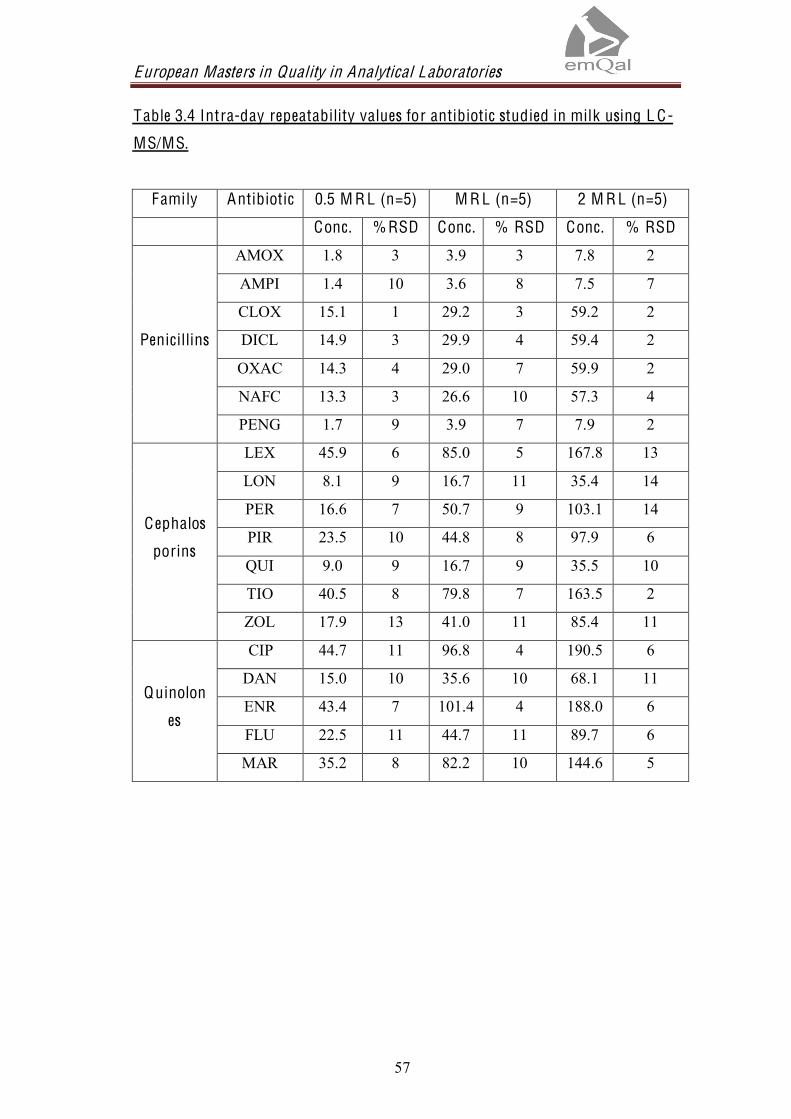
European Masters in Quality in Analytical Laboratories
57
Table 3.4 Intra-day repeatability values for antibiotic studied in milk using L C-
MS/MS.
Family Antibiotic 0.5 M R L (n=5) M R L (n=5) 2 M R L (n=5)
Conc. %RSD Conc. % RSD Conc. % RSD
Penicillins
AMOX 1.8 3 3.9 3 7.8 2
AMPI 1.4 10 3.6 8 7.5 7
CLOX 15.1 1 29.2 3 59.2 2
DICL 14.9 3 29.9 4 59.4 2
OXAC 14.3 4 29.0 7 59.9 2
NAFC 13.3 3 26.6 10 57.3 4
PENG 1.7 9 3.9 7 7.9 2
Cephalos
porins
LEX 45.9 6 85.0 5 167.8 13
LON 8.1 9 16.7 11 35.4 14
PER 16.6 7 50.7 9 103.1 14
PIR 23.5 10 44.8 8 97.9 6
QUI 9.0 9 16.7 9 35.5 10
TIO 40.5 8 79.8 7 163.5 2
ZOL 17.9 13 41.0 11 85.4 11
Quinolon
es
CIP 44.7 11 96.8 4 190.5 6
DAN 15.0 10 35.6 10 68.1 11
ENR 43.4 7 101.4 4 188.0 6
FLU 22.5 11 44.7 11 89.7 6
MAR 35.2 8 82.2 10 144.6 5

European Masters in Quality in Analytical Laboratories
58
Table 3.5 Inter-day repeatability values for antibiotic studied in milk using
L C/MS/MS
Family Antibiotic 0.5 M R L(n=15) M R L(n=15) 2 M R L(n=15)
Conc. % RSD Conc. %RSD Conc. %RSD
Penicillins
AMOX 1.6 14 3.8 10 7.2 10
AMPI 1.5 13 3.8 10 7.1 12
CLOX 14.6 7 29.0 4 60.1 10
DICL 15.0 8 29.5 7 59.1 10
OXAC 14.0 5 30.6 8 59.8 8
NAFC 12.3 10 27.4 9 53.3 11
PENG 1.7 12 3.8 6 7.9 7
Cephalosporin
LEX 48.6 8 95.2 10 189.2 10
LON 7.8 11 17.1 13 36.5 14
PER 22.7 14 47.5 13 96.9 15
PIR 22.9 13 46.8 13 90.9 10
QUI 8.6 14 17.3 15 32.0 12
TIO 39.3 11 86.3 9 158.5 8
ZOL 19.1 13 42.1 11 92.2 12
Quinolone
CIP 45.3 14 99.4 7 200.9 11
DAN 15.3 14 28.9 14 61.3 13
ENR 48.6 13 102.5 8 196.5 8
FLU 23.0 14 46.0 11 94.5 7
MAR 34.9 10 85.9 14 139.1 12
As can be observed from table 3.5 all the values are within acceptance criteria.
3.5.5. Decision Limit and Detection Capability
In accordance with the 2002/657/EC decision, the validation procedure includes the
determination of CC (Limit of decision) and CC (Capability of detection). This two
statistical limits allow to evaluate the critical concentration above which the method
reliably distinguish and quantify a substance taking into account the variability of the
method and the statistical risk to take a wrong decision [45].
European Masters in Quality in Analytical Laboratories
59
3.6.5.1. Decision limit (CC )
CC is defined as the limit at and above which it can be concluded with an error
at a sample is non- compliant [43].
3.6.5.2. Detection capability (CC )
De
the case of substances for which no permitted limit has been established, the
detection capability is the lowest concentration at which a method is able to detect
truly contaminated samples with a statistical certainty of 1
substances with an established permitted limit (MRL), this means that the detection
capability is the concentration at which the method is able to detect permitted limit
concentrations with a statistical certainty of 1 ] as in the case of antibiotics
studied.
For the measurement of CC and CC , 20 blank milk samples were spiked at the
MRL concentration and were analyzed by the corresponding calibration curves.
CC is calculated as the concentration at the MRL plus 1.64 times the corresponding
standard deviation.
In a previous work conducted in the research group in tissue of pig, we found that the
SD for all the analytes is similar to the SDMRL, so supposing SD = SDMRL,
CC parameter could be calculated as
Table 3.6 shows the values of CC and CC obtained using LC-MS/MS.
C C =C M R L +1.64x SD M R L
C C = C C +1.64x SD M R L

European Masters in Quality in Analytical Laboratories
60
Table 3.6 C C and C C obtained from L C-MS/MS
Thus when samples are analysed we can say that samples with values higher than
CC are non compliant with an error probability of .
L C-MS/MS
Family Antibiotic M R L C C ( g/kg) C C ( g/kg)
Penicillins
AMOX 4 5.0 6.1
AMPI 4 4.6 5.3
CLOX 30 33.8 37.7
DICL 30 33.5 36.9
OXAC 30 33.3 36.6
NAFC 30 33.5 37.0
PENG 4 4.52 5.04
Cephalosporins
LEX 100 109.5 119.0
LON 20 24.0 28.1
PER 50 57.3 64.6
PIR 60 67.2 74.4
QUI 20 24.5 29.0
TIO 100 109.5 119.1
ZOL 50 55.4 60.8
Quinolones
CIP 100 111.3 122.6
DAN 30 38.3 46.6
ENR 100 112.0 124.1
FLU 50 58.9 67.7
MAR 75 90.3 105.5
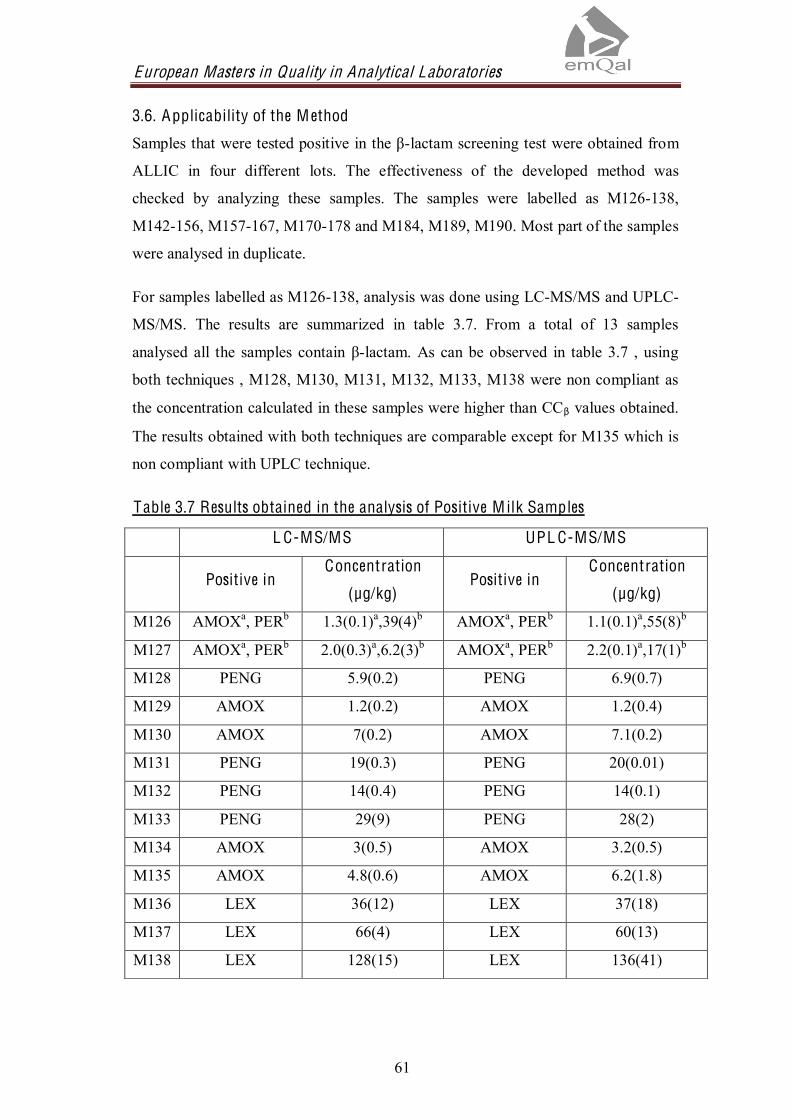
European Masters in Quality in Analytical Laboratories
61
3.6. Applicability of the M ethod
-lactam screening test were obtained from
ALLIC in four different lots. The effectiveness of the developed method was
checked by analyzing these samples. The samples were labelled as M126-138,
M142-156, M157-167, M170-178 and M184, M189, M190. Most part of the samples
were analysed in duplicate.
For samples labelled as M126-138, analysis was done using LC-MS/MS and UPLC-
MS/MS. The results are summarized in table 3.7. From a total of 13 samples
analysed all the samples contain -lactam. As can be observed in table 3.7 , using
both techniques , M128, M130, M131, M132, M133, M138 were non compliant as
the concentration calculated in these samples were higher than CC values obtained.
The results obtained with both techniques are comparable except for M135 which is
non compliant with UPLC technique.
Table 3.7 Results obtained in the analysis of Positive M ilk Samples
L C-MS/MS UPL C-MS/MS
Positive in Concentration
(µg/kg) Positive in
Concentration
(µg/kg)
M126 AMOXa, PERb 1.3(0.1)a,39(4)b AMOXa, PERb 1.1(0.1)a,55(8)b
M127 AMOXa, PERb 2.0(0.3)a,6.2(3)b AMOXa, PERb 2.2(0.1)a,17(1)b
M128 PENG 5.9(0.2) PENG 6.9(0.7)
M129 AMOX 1.2(0.2) AMOX 1.2(0.4)
M130 AMOX 7(0.2) AMOX 7.1(0.2)
M131 PENG 19(0.3) PENG 20(0.01)
M132 PENG 14(0.4) PENG 14(0.1)
M133 PENG 29(9) PENG 28(2)
M134 AMOX 3(0.5) AMOX 3.2(0.5)
M135 AMOX 4.8(0.6) AMOX 6.2(1.8)
M136 LEX 36(12) LEX 37(18)
M137 LEX 66(4) LEX 60(13)
M138 LEX 128(15) LEX 136(41)

European Masters in Quality in Analytical Laboratories
62
Figure 3.8 and 3.9 show the chromatograms obtained by LC-MS/MS and UPLC-
MS/MS for positive sample M138 that present a high concentration of LEX.
Figure 3.8 Chromatogram obtained in the analysis of non compliant sample M138
using LC-QqQ technique.
Figure 3.9 Chromatogram obtained in the analysis of non compliant sample M138
using UPLC-QqQ technique

European Masters in Quality in Analytical Laboratories
63
The results for (M142-M190) are summarised in table 3.8 with the antibiotics present
in each sample and their concentration.
Table 3.8 Results obtained in the analysis of Positive M ilk Samples
Positive in Concentration (µg/kg)
M142 AMOX 7.2(1.6)
M143 AMOX 4.7
M144 AMOX 46
M145 CLOXa, LONb 51.5 (0.9) a, 4.4 (0.2)b
M146 PIR 11.3 (0.7)
M147 PENG 3.5 (0.4)
M148 PIR 7.5(0.8)
M149 AMPIa, DICLb 2.9 (0.3)a , 2.5(0.2)b
M150 CIPa, ENRb 22.7(0.9) a,11.1b
M151 CIPa, ENRb 24.1(0.5) a,11.3(0.4)b
M154 PIR 6.3(0.6)
M155 PIR 5.6(0.2)
M156 PIR 8.4(0.6)
M157 PENG 4.1(0.3)
M158 PIR 8(0.4)
M159 PENG 1.6
M160 AMOX 19(4)
M161 AMOX 10(1)
M162 AMPIa, DICLb 6(0.02)a 6.2(0.4)b
M163 AMOXa,PERb 6.5(1.3)a,7.7(0.4)b
M164 PIR 9.6
M165 PENG 6.5
M166 PIR 22.5(0.8)
M167 PENG 1(0.05)

European Masters in Quality in Analytical Laboratories
64
M170 PENG 3.7(0.2)
M171 PIR 15(2)
M172 PENG 3.4(0.6)
M173 PENG 2.7(0.2)
M174 PENG 3.8(0.2)
M175 PENG 3.8(0.2)
M176 PENG 3.5(0.1)
M177 PENG 5.1(0.1)
M178 AMOX 1.9(0.4)
M184 PENG 14.5
M189 PENG 12.7(1.4)
M190 AMOX 42.3(4.4)
As can be observed from the table 3.8, all the samples contain at least one antibiotic.
Sample M142, M144, M145, M160, M161, M162, M163, M165, M177, M184,
M189 and M190 were non compliant with an error probability of as the
concentration calculated in these samples were higher than CC values obtained.
From the tested samples, M145 and M163 contain one penicillin and one
cephalosporin (CLOX and LON) which indicates multiple uses of -lactam. Two
samples were positive in the quinolones ENR and its metabolite CIP.
Figures 3.10 and 3.11 shows as an example the chromatogram obtained for positive
samples by LC-MS/MS, with the corresponding confirmatory chromatogram.
Figures 3.10 corresponds to a sample of AMOX with very high concentration of 42.3
µg/kg, and Figures 3.11 contains PENG with concentration of 12.7µg/kg.

European Masters in Quality in Analytical Laboratories
65
Figure 3.10 Chromatogram obtained in the analysis of non compliant sample M190
with AMOX using LC-QqQ technique.
Figure 3.11 Chromatogram obtained in the analysis of non compliant sample M189
with PENG using LC-QqQ technique
From the results obtained from table 3.7 and 3.8, we make a conclusion that AMOX
and PENG are the most common residues found in milk samples. 14 % of samples
contained AMOX and 16 % contained PENG .Other samples contain AMPI, CLOX
and LEX. The presences of these residues were quantified and confirmed .Thus the
results confirms the applicability of the method for the determination of positive
samples.


European Masters in Quality in Analytical Laboratories
67
4. Conclusions
A multi-class, multi residue method was developed for the simultaneous
determination of 19 antibiotics regulated by European legislation 2377/90/EC in cow
milk using LC-MS/MS. The method was optimised and following conclusions are
drawn.
1. Ext raction Procedure
Several studies were conducted to optimize the extraction method. Following
conclusions were drawn from the studies.
Raw milk is preferred over commercial milk for method development.
Drying method affects the recovery of some analytes. Different
recoveries were obtained for cephalosporins using two different
drying techniques (air drying or nitrogen drying). Better recoveries
are obtained with nitrogen drying so it was choosen.
For extraction of antibiotics from the milk sample it is preferred to
weigh, spike and centrifuge in order to simulate the procedure that
happens in positive samples.
2. Separation of antibiotics:
For LC-MS/MS, with the optimized gradient, and using C8 column
(150 mm x 4.6 mm, 5µm) separation of 19 antibiotics was obtained in
11 minutes.
UPLC-MS/MS technique was applied to separate antibiotics using
two different columns. It was found that with the use of Acquity
UPLC BEH shield RP 18 (50 mm x 2.1 mm, 1.7 µm particle
diameter) ,19 antibiotics can be analysed in less than 3 minutes
3. Quality Parameters:
The developed method was validated. Quality parameters proved this method
to be efficient.
LODs ranged from 0.03 (NAFC) to 0.5 µg/kg (PER).
LOQs from 0.1 (NAFC, PENG, CIP, DAN, and ENR) to 1.25 µg/kg
(PER).The LOQs obtained for each antibiotic are much lower than the
MRLs (regulation 2377/90).

European Masters in Quality in Analytical Laboratories
68
The calibration curves for all analytes are linear with a correlation
coefficient of 0.999 with exception of AMOX and ENR (0.990).
The majority of antibiotics showed recoveries higher than 65 % with
exception of AMOX (57%) and DAN (38 %).
The repeatability values expressed as RSD % are lower than 15 %
which are in accordance with FDA regulation.
4. Positive Samples:
The developed method was applied for 49 real samples supplied by ALLIC.
Among all samples analysed, 37% of the sample was found to be non-
compliant with an error probability of . AMOX and PENG was the most
common residue found. 14 % of non compliant sample contained AMOX and
16 % contained PENG.
Thus a simple and efficient method was developed and validated for simultaneous
determination of 19 antibiotics regulated by European legislation in milk samples
using LC-MS/MS.

European Masters in Quality in Analytical Laboratories
69
References
[1] Progress in analysis of residual antibacterials in food. C.Blasco;
C.M.Torres; Y.Pico. Trends in Anal. Chem. 26 (2007) 895-913.
[2] Recent applications of liquid chromatography mass spect romet ry to
residue analysis of antimicrobials in food of animal origin. S. Bogialli;
A.D.Corcia. Anal.Bioanal.Chem. 395 (2009) 947-966.
[3] Analytical st rategies for residue analysis of veterinary drugs and growth
promoting agents in food producing animals- a review. A. A M. Stolker; U.
A. TH. Brinkman. J. Chromatogr. A. 1067 (2005) 15-53.
[4] Validation of a liquid chromatography tandem mass spect rometric
method for the quantification of eight quinolones in bovine muscle, milk
and aquacultured products. N. V. Hoof; K. D. Wasch; L. Okerman; W.
Reybroeck; S. Poelmans; H. Noppe; H. D. Brabander. Anal. Chim. Act. 529
(2005) 265-272.
[5] Simple confi rmatory assay for analyzing residues of aminoglycoside
antibiotics in bovine milk: hot water extraction followed by liquid
chromatography tandem mass spect romet ry, S. Bogialli; R.Curini, A. D.
Corcia, A. Lagan;M. Mele, M. Nazzari, J. Chromatogr A. 1067 (2005) 93 100.
[6] M ulti-residue methods for confi rmatory determination of antibiotics in
milk. V. Samanidou; S. Nisyriou. J. Sep. Sci. 31 (2008) 2068-2090.
[7] Antibiotics in food: legislation and validation of analytical methodologies.
R. Companyo; M. Granados; J. Guiteras; M. D. Prat. Anal. Biochem. 395
(2009) 877-891.
[8] M echanism of antimicrobial resistance in bacteria, F. C. Tenover, American
J. of med. 119 (6A) (2006) S3-S10.
[9] Antibiotic resistance in the European Union associated with therapeutic
use of veterinary medicine, Report and qualitative risk assessment by the
committee for veterinary medicinal product, 14th July, 1999.
[10] Residue Analysis of Penici llins in Food Products of Animal O rigin by
HPL C : A Review. J. of Liquid Chroma & Related Tech., V. F. Samanidoua;
S. A. Nisyrioua; I. N. Papadoyannis, 30 (2007) 1145 1204.

European Masters in Quality in Analytical Laboratories
70
[11] The medical impact of antimicrobial use in food animals. Report of a WHO
meeting, Berlin, Germany, 13-17 October, 1997, WHO, Geneva.
[12] The Basics of clinical pharmacology. B. G. Katzung. Eigth edition, 1998.
[13] Use of liquid chromatography mass spect romet ry in the analysis of
residues of antibiotics in meat and milk. D. G. Kennedy; R. J. McCracken;
A. Cannavan; S. A. Hewitt. J. Chromatogr. A. 812 (1998) 77 98.
[14] Simultaneous determination of residual veterinary drugs in bovine,
porcine and chicken muscle using liquid chromatography coupled with
elect rospray ionization tandem mass spect rometry. R. Yamada; M. Kozono;
T. Ohmori; F. Morimatsu; M. Kitayama. Biosci. Biotechnol. Biochem 70
(2006) 54-65.
[15] M ulti class, multi residue liquid chromatography / tandem mass
spectromet ry screening and confi rmation methods for drug residues in
milk. S. B. Turnipseed; W. C. Andersen; C. M. Karbiwnyk; M. R. Madson; K.
E. Miller. Rapid Commun. Mass Spectrom. 22 (2008) 1467-1480.
[16] High throughput analysis of tet racyclines and penicillin antibiotics in
animal tissues using elect rospray tandem mass spectromet ry with selected
reaction monitoring t ransition. T. Goto; Y. Ito; S. Yamada; H. Matsumoto;
H. Oka. J Chromatogr. A. 1100 (2005) 193-199.
[17] Analysis of veterinary drug residues in shrimp: a multiclass method by
liquid chromatography quadrupole ion t rap mass spect romet ry. H. Li; P.
J. Kijak; S. B. Turnipseed; W. Cui. J. Chromatogr. B. (2006) 22-38.
[18] M ulti residue screening of veterinary drugs in egg , fish , and meat using
high resolution liquid chromatography accurate mass time of flight mass
spectromet ry. R. J. B. Peters; P. Rutgers; A. A. M. Stolker; M. W. F. Nielen.
J. Chromatogr. S. 1216 (2009) 8206-8216.
[19] M ulti-class confi rmatory method for analyzing trace levels of tetracyline
and quinolone antibiotics in pig tissues by ult ra-performance liquid
chromatography coupled with tandem mass spectromet ry. B. Shao; X. Jia;
Y. Wu; J. Hu; X. Tu; J. Zhang. Rapid Commun. Mass Spectrom. 21 (2007)
3487 3496.

European Masters in Quality in Analytical Laboratories
71
[20] Rapid multi-residue screening of antibiotics in muscle and kidney by
liquid chromatography-electrospray ionization tandem mass
spectromet ry. K. Granelli; C. Branzell. Anal. Chim. Acta. 586 (2007) 289
295.
[21] Development of M ulticlass M ethods for Drug Residues in Eggs:
Hydrophilic Solid-Phase E xtraction C leanup and L iquid
Chromatography/Tandem M ass Spectromet ry Analysis of T etracycline,
F luoroquinolones, Su -Lactam Residues. D. N. Heller; C.
B. Nochetto; N. G. Rummel; M. H. Thomas. J. Agric. Food Chem. 54 (2006)
5267-5278.
[22] Comprehensive fast multi residue screening of 150 veterinary drugs in
milk by ult ra- performance liquid chromatography coupled to time of
flight mass spect romet ry, Didier Ortelli, E.Cognard, P.Jan , P.Edder,
J.Chromatogr. B. 877 (2009) 2363-2374.
[23] Simultaneous determination of ten antibiotic residues in milk by UPL C . L.
Wang; Y. Q. Li., Chromatographia. 70 (2009) 253-258.
[24] High-throughput multiclass method for antibiotic residue analysis by
liquid chromatography tandem mass spect romet ry. J. Chico; A. Rubies; F.
Centrich; R. Companyo; M. D. Prat; M. Granados. J. Chromatogr. A. 1213
(2008) 189-199.
[25] Quantitative multiresidue method for about 100 veterinary drugs in
different meat mat rices by sub 2 - µm particulate high performance liquid
chromatography coupled to time of flight mass spectromet ry. A. Kufmann;
P. Buthcer; K. Mafen; M. Widmer. J. Chromatogr. A, 1194 (2008) 66-79.
[26] Comprehensive screening and quantification of veterinary drugs in milk
using UPL C-T O F-MS. A. A. M. Stolker; P. Rutgers; E. Oosterlink; J. J. P.
Lasaroms; R. J. B. Petersm; J. A. V. Rhijn; M. W. F. Nielen. Anal Bioanl
Chem. (2008) 2309-2322.
[27] Residue analysis of 15 penicillins and cephalosporins in bovine muscle,
kidney and milk by liquid chromatography-tandem mass spect romet ry.
M. Becker; E. Zittlau; M. Petz. Anal. Chim. Acta. 520 (2004) 19-32.
[28] http://www.fao.org/DOCREP/004/AC343E/AC343E00.HTM

European Masters in Quality in Analytical Laboratories
72
[29] Improved determination of quinolones in milk at thei r M R L levels using
L C-U V , L C-F D , L C-MS and L C-MS/MS and validation in accordance
with regulation 2002 / 657/E C . M.P.Hermo; E.Nemutlu; S.Kir; D.Barron;
J.Barbosa. Anal Chim Acta.613 (2008) 98-107.
[30] Anàlisi de residus de cefalosporines en llet de vaca per L C-MS i L C-
Alexandra Junza Martínez, Januaury 2009. Màster Experimental en Química ,
Universitat de Barcelona.
[31] Determinación e identificación de la serie de penicilinas reguladas por la
U E en alimentos de origen animal, Miriam Martínez Huélamo, October,
2008. Màster Experimental en Química , Universitat de Barcelona.
[32] M ulti - method for the determination of antibiotics of different substance
groups in milk and validation in accordance with Commission Decision
2002/657/E C . D. A. Bohm; C. S. Stachel; P. Gowik. J. Chromatogr. A. 1216
(2009) 8217-8223.
[33] M ultiresidue determination of veterinary drugs in milk by ult ra -high
performance liquid chromatography tandem mass spect romet ry. M. M.
A. Luiz; J. L. M. Vidal; R. R. Gonzalez; A. G. Frenich. J Chromatogr. A. 1205
(2008) 10-16.
[34] A confi rmatory method for the simultaneous ext raction , separation ,
identification and quantification of tetracyclines, sulphonamides,
trimethoprim and dapsone residues in muscle by ult ra high
performance liquid chromatography tandem mass spect romet ry
according to commission decision 2002/657/E C , M. Mcdonald; C. Mannion;
P. Rafter. J Chromatogr. A. 1216 (2009) 8110-8116.
[35] M ultiresidue determination of tet racyclines, sulfonamides and
chloramphenicol in bovine milk using HPL C-D A D . M. C. V. Mamani; F. G.
R. Reyes; S. Rath. Food Chem. 117 (2009) 545-552.
[36] Validation of a liquid chromatography mass spectromet ry multi residue
method for the simultaneous determination of sulfonamides, tetracyclines
European Masters in Quality in Analytical Laboratories
73
and pyrimethamine in milk. U. Koesukwiwat; S. Jayanta; N. Leepipatpiboon.
J. Chromatogr. A. 1140 (2007) 147-156.
[37] Simultaneous multi residue determination of tetracyclines and
fluoroquinolones in catfish muscle using high performance liquid
chromatography with fluorescence detection. M. J. Schneider; A. M. Darwish;
D. W. Freeman. Anal. Chim. Acta. 586 (2007) 269-274.
[38] Comparision of several ext raction techniques for multic lass analysis of
veterinary drugs in eggs using ult ra high pressure liquid chromatography
tandem mass spect rometry. A. G. Frenic; M. D. M A. Luiz; J. L. M. Vidal; R.
R. Gonzalaez. Anal. Chim. Acta. 661 (2009)150-160
[39] M ulticlass Determination and Confirmation of Antibiotic Residues in Honey
Using L C-MS/MS. M. I. Lopez; J. S. Pettis; I. B. Smith; P. S. Chu. J. Agric.
Food Chem. 56 (2008) 1553 1559.
[40] The development and validation of a multiclass liquid chromatography
tandem mass spect romet ry (L C-MS/MS) procedure for the determination of
veterinary drug residue in animal tissue using a QuE C H E RS ( Quick , E asy
, C H eap , E ffective , Rugged and Safe ) approach .G.Stubbings; T.Bigwood.
Anal. Chim. Acta. 637 (2009) 68-78.
[41] L iquid chromatography tandem mass spectromet ry for performing
confi rmatory analysis of veterinary drugs in animal-food products. A.Gentili
;D.Perret ; S.Marchese .TrAC.24 (2005) 704-732.
[42] Determination of penicillins in milk using L C-U V , L C-MS and L C-MS.
M.Martinez.Huelamo; E.Jimenez.Gamez; M.P.Hermo ; D. Barrón ; J.Barbosa
.J.Sep.Sci.32 (2009) 2385-2393.
[43] European commission decision (EC) no.657/2002 of 12 August 2002,
Off.J.Eur.Commun.L221/8 (2002).
[44] http:// www.fda.gov/cder/guidance/index.htm
[45] Comprehensive fast multi residue screening of 150 veterinary drugs in milk
by ultra- performance liquid chromatography coupled to time of flight mass
spectromet ry, D. Ortelli ; E. Cognard ; P.Jan ; P.Edder. J. Chromatogr. B. 877
(2009) 2363-2374.
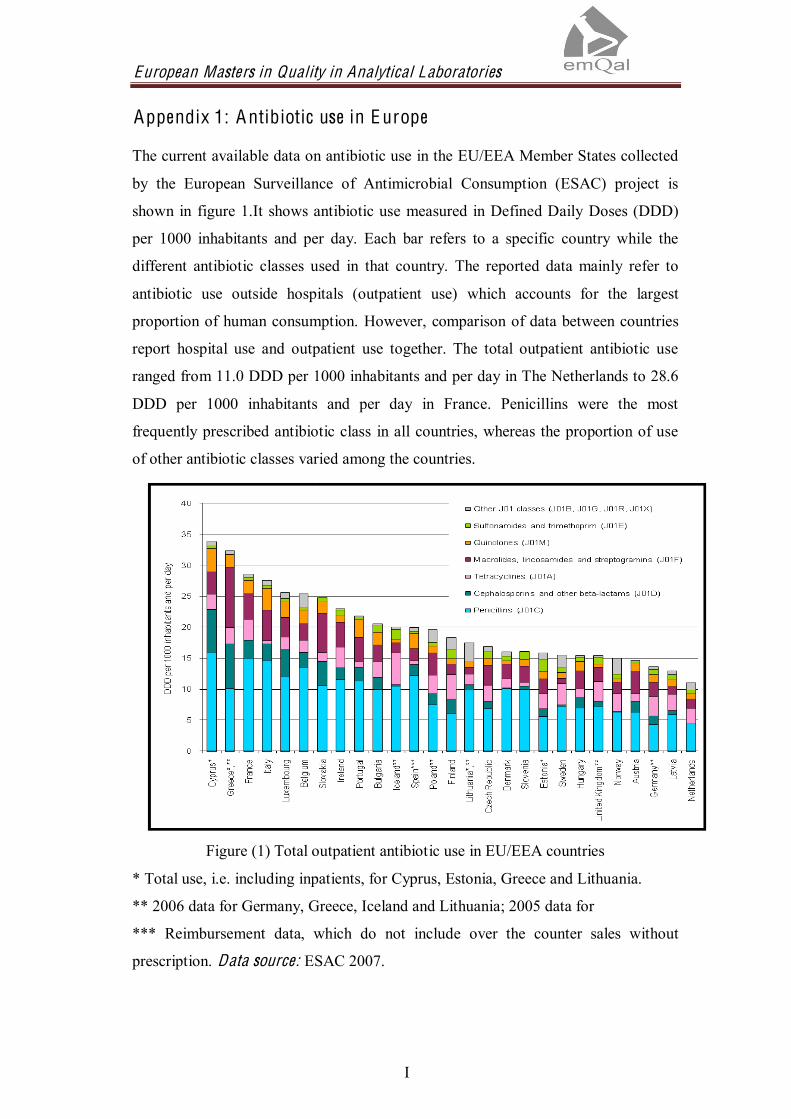
European Masters in Quality in Analytical Laboratories
I
Appendix 1: A ntibiotic use in E urope
The current available data on antibiotic use in the EU/EEA Member States collected
by the European Surveillance of Antimicrobial Consumption (ESAC) project is
shown in figure 1.It shows antibiotic use measured in Defined Daily Doses (DDD)
per 1000 inhabitants and per day. Each bar refers to a specific country while the
different antibiotic classes used in that country. The reported data mainly refer to
antibiotic use outside hospitals (outpatient use) which accounts for the largest
proportion of human consumption. However, comparison of data between countries
report hospital use and outpatient use together. The total outpatient antibiotic use
ranged from 11.0 DDD per 1000 inhabitants and per day in The Netherlands to 28.6
DDD per 1000 inhabitants and per day in France. Penicillins were the most
frequently prescribed antibiotic class in all countries, whereas the proportion of use
of other antibiotic classes varied among the countries.
Figure (1) Total outpatient antibiotic use in EU/EEA countries
* Total use, i.e. including inpatients, for Cyprus, Estonia, Greece and Lithuania.
** 2006 data for Germany, Greece, Iceland and Lithuania; 2005 data for
*** Reimbursement data, which do not include over the counter sales without
prescription. Data source: ESAC 2007.

European Masters in Quality in Analytical Laboratories
II
Appendix 2: Usage of Antibiotic in H uman and A nimals
According to a study by the European Federation of Animal Health (FEDESA), farm
animals in 1999 consumed 4,700 tonnes (35 percent) of all the antibiotics
administered in the European Union, while humans consumed 8,500 tonne (65
percent). Of the antibiotics that were given to animals, 3,900 tonne (29 percent of
total usage) were administered to help sick animals recover from disease, while 786
tonnes (6 percent of total usage) were fed to farm animals as growth promoters. The
survey estimated that the amount of antibiotics used as growth promoters had fallen
by half since 1997, when animals consumed around 1,600 tonne as feed additives.
[1]
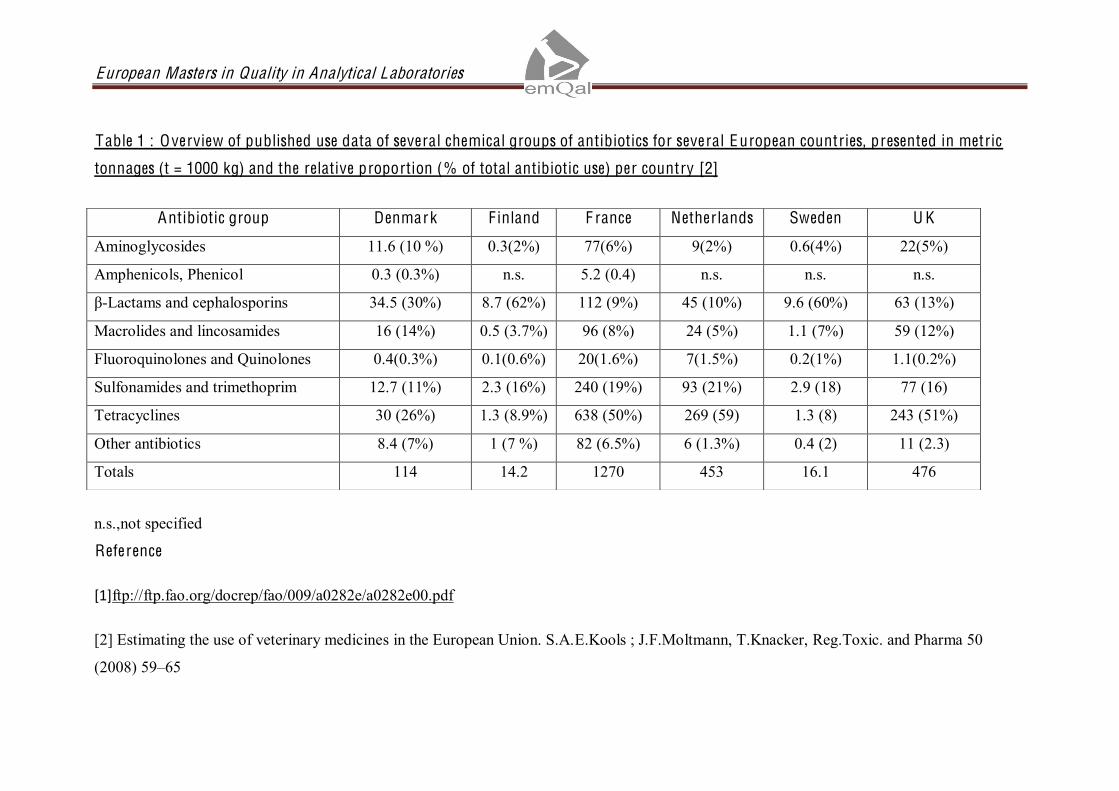
European Masters in Quality in Analytical Laboratories
Table 1 : Overview of published use data of several chemical groups of antibiotics for several European countries, presented in metric
tonnages (t = 1000 kg) and the relative proportion (% of total antibiotic use) per country [2]
n.s.,not specified
Reference
[1]ftp://ftp.fao.org/docrep/fao/009/a0282e/a0282e00.pdf
[2] Estimating the use of veterinary medicines in the European Union. S.A.E.Kools ; J.F.Moltmann, T.Knacker, Reg.Toxic. and Pharma 50
(2008) 59 65
Antibiotic group Denmark F inland F rance Netherlands Sweden U K
Aminoglycosides 11.6 (10 %) 0.3(2%) 77(6%) 9(2%) 0.6(4%) 22(5%)
Amphenicols, Phenicol 0.3 (0.3%) n.s. 5.2 (0.4) n.s. n.s. n.s.
-Lactams and cephalosporins 34.5 (30%) 8.7 (62%) 112 (9%) 45 (10%) 9.6 (60%) 63 (13%)
Macrolides and lincosamides 16 (14%) 0.5 (3.7%) 96 (8%) 24 (5%) 1.1 (7%) 59 (12%)
Fluoroquinolones and Quinolones 0.4(0.3%) 0.1(0.6%) 20(1.6%) 7(1.5%) 0.2(1%) 1.1(0.2%)
Sulfonamides and trimethoprim 12.7 (11%) 2.3 (16%) 240 (19%) 93 (21%) 2.9 (18) 77 (16)
Tetracyclines 30 (26%) 1.3 (8.9%) 638 (50%) 269 (59) 1.3 (8) 243 (51%)
Other antibiotics 8.4 (7%) 1 (7 %) 82 (6.5%) 6 (1.3%) 0.4 (2) 11 (2.3)
Totals 114 14.2 1270 453 16.1 476

European Masters in Quality in Analytical Laboratories
IV
Appendix 3: A ntibiotic Resistance in E urope
E . coli is the most frequent cause of bacteraemia by gram-negative bacteria, as well
as community and hospital-acquired urinary tract infections. The Europe-wide
increase of resistance in E. coli to all antibiotic classes under surveillance is
continuing and the speed by which important antibiotics like fluoroquinolones are
losing their activity against E. coli is alarming. This trend is highlighted by the shift
towards red which is evident comparing the maps of 2003 and 2008 (Fig. 1a and 1b).
(Note: The country colours range from green to dark red according to the frequency
of resistance).

European Masters in Quality in Analytical Laboratories
V
Staphylococcus aureus, in its methicillin-resistant form (MRSA), is the most
important cause of antibiotic-resistant healthcare-associated infections worldwide. In
2008, more countries showed decreasing MRSA proportions, thus the MRSA
problem seems to have stabilised, or even decreased for most countries.
Nevertheless, MRSA proportions are still above 25% in one third of countries (Fig.
2).
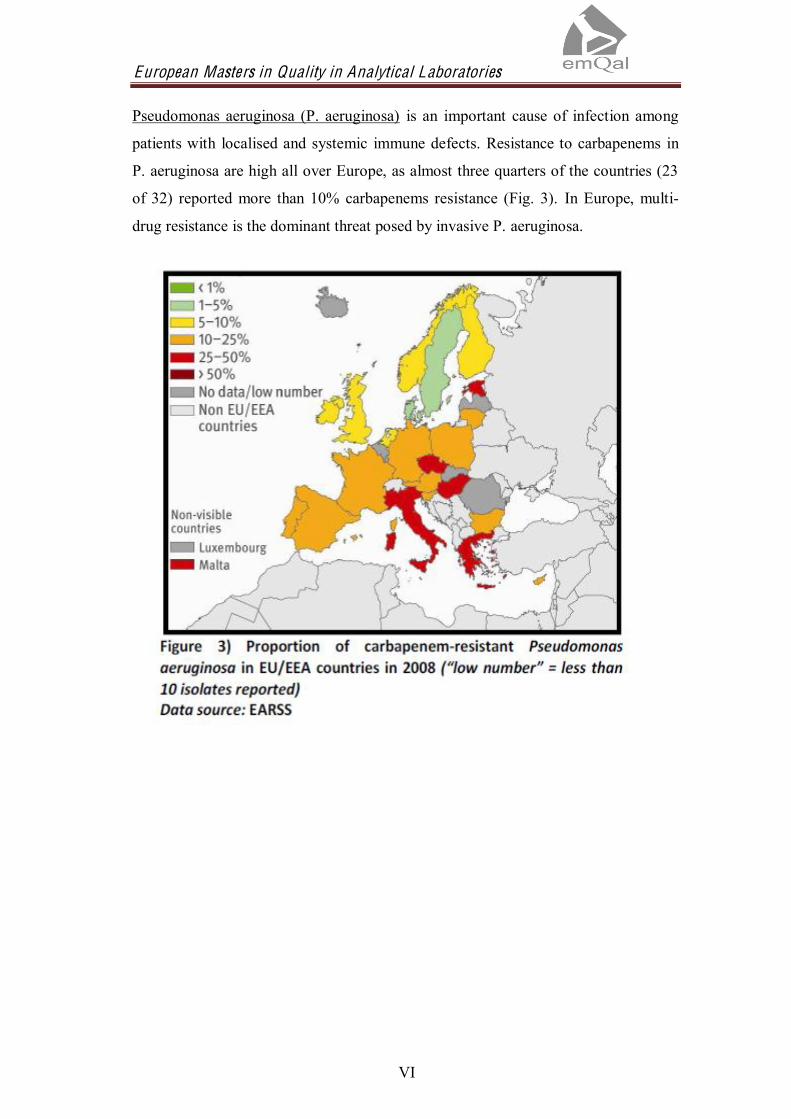
European Masters in Quality in Analytical Laboratories
VI
Pseudomonas aeruginosa (P. aeruginosa) is an important cause of infection among
patients with localised and systemic immune defects. Resistance to carbapenems in
P. aeruginosa are high all over Europe, as almost three quarters of the countries (23
of 32) reported more than 10% carbapenems resistance (Fig. 3). In Europe, multi-
drug resistance is the dominant threat posed by invasive P. aeruginosa.

European Masters in Quality in Analytical Laboratories
VII
K lebsiella pneumoniae (K . pneumoniae) is an important cause of urinary and
respiratory tractinfections, especially in individuals with impaired immune systems,
such as people with diabetes and hospitalised patients with invasive devices, such as
urinary catheters and drips. With regard to K. pneumoniae, a high frequency of
resistance to 3rd generation cephalosporins (Fig. 4), fluoroquinolones and
aminoglycosides is evident in Central and South-eastern Europe. Many of these
strains, including the most frequent one, show resistance to all the above mentioned
antibiotic classes.