demonstration assessment of light-emitting diode (led) parking
TRANSCRIPT

Demonstration Assessment of Light-Emitting Diode (LED) Parking Lot Lighting
Host Site: Walmart, Leavenworth, Kansas
Final Report prepared in support of the U.S. DOE Solid-State Lighting Technology Demonstration GATEWAY Program
Study Participants: Pacific Northwest National Laboratory U.S. Department of Energy Walmart
May 2011
Prepared for the U.S. Department of Energy by Pacific Northwest National Laboratory

Electronicwebsite a
c copies of the t http://www1.
report are alsoeere.energy.go
o available fromov/buildings/ss
m the DOE Soll/gatewaydem
lid State Lightos.html.
t s o
iing

PNNL-20379
Demonstration Assessment of Light-Emitting Diode (LED) Parking Lot Lighting in Leavenworth, KS
Final Report prepared in support of the U.S. DOE GATEWAY Solid-State Lighting Technology Demonstration Program
Study Participants: Pacific Northwest National Laboratory U.S. Department of Energy Walmart
M.A. Myer B.R. Kinzey K.J. Curry
May 2011
Prepared for the U.S. Department of Energy under Contract DE-AC05-76RL01830
Pacific Northwest National Laboratory Richland, Washington 99352

Preface
This document is a report of observations and results obtained from a lighting demonstration project conducted under the U.S. Department of Energy (DOE) GATEWAY Solid-State Lighting Demonstration Program. The program supports demonstrations of high-performance solid-state lighting (SSL) products in order to develop empirical data and experience with in-the-field applications of this advanced lighting technology. The DOE GATEWAY Demonstration Program focuses on providing a source of independent, third-party data for use in decision-making by lighting users and professionals; this data should be considered in combination with other information relevant to the particular site and application under examination. Each GATEWAY Demonstration compares SSL products against the incumbent technologies used in that location. Depending on available information and circumstances, the SSL product may also be compared to alternate lighting technologies. Though products demonstrated in the GATEWAY program have been prescreened, DOE does not endorse any commercial product or in any way guarantee that users will achieve the same results through use of these products.
iii

v
Summary
This report describes the process and results of a demonstration of solid-state lighting (SSL) technology in a commercial parking lot lighting application, under the U.S. Department of Energy (DOE) Solid-State Lighting Technology GATEWAY Demonstration Program. The parking lot is for customers and employees of a Walmart Supercenter in Leavenworth, Kansas and this installation represents the first use of the LED Parking Lot Performance Specification developed by the DOE’s Commercial Building Energy Alliance.
The application is a parking lot covering more than a half million square feet, lighted primarily by light-emitting diodes (LEDs). Metal halide wall packs were installed along the building facade. This site is new construction, so the installed baseline(s) were hypothetical designs. It was acknowledged early on that deviating from Walmart’s typical design would reduce the illuminance on the site. Walmart primarily uses 1000W pulse-start metal halide (PMH) lamps. In order to provide a comparison between both typical design and a design using conventional luminaires providing a lower illuminance, a 400W PMH design was also considered.
As mentioned already, the illuminance would be reduced by shifting from the PMH system to the LED system. The Illuminating Engineering Society of North America (IES) provides recommended minimum illuminance values for parking lots. All designs exceeded the recommended illuminance values in IES RP-20, some by a wider margin than others.
Energy savings from installing the LED system compared to the different PMH systems varied. Compared to the 1000W PMH system, the LED system would save 63 percent of the energy. However, this corresponds to a 68 percent reduction in illuminance as well. In comparison to the 400W PMH system, the LED system would save 44 percent of the energy and provide similar minimum illuminance values at the time of relamping.
The LED system cost more than either of the PMH systems when comparing initial costs. However, when the life-cycle costs from energy and maintenance were factored into the scenario, the LED system had lower costs at the end of a 10-year analysis period. The LED system had a 7.5 year payback compared to the 1000W PMH system and a 6.1 year payback versus the 400W PMH system. The costs reflect high initial cost for the LED luminaire, plus more luminaires and (subsequently) more poles for the LED system. The other major issue affecting cost effectiveness was that Leavenworth, Kansas has very low electricity costs. The melded rate for this site was $0.056 per kWh for electricity. However, if the national electricity rate of $0.1022/kWh was used the payback would change to between four and five years for the LED system.
This demonstration met the GATEWAY requirements of saving energy, matching or improving illumination, and being cost effective. The project also demonstrated that the Commercial Building Energy Alliance (CBEA) specification works in practice. Walmart appreciated having an entire site lighted by LEDs to gain more experience with the technology. Walmart is reviewing the results of the demonstration as they consider their entire real estate portfolio.


Acronyms and Abbreviations
AFG above finished grade ASHRAE American Society of Heating, Refrigerating and Air-Conditioning Engineers ANSI American National Standards Institute BLCC Building Life-Cycle Cost (software) BUG backlight, uplight, and glare CBEA Commercial Building Energy Alliance DOE U.S. Department of Energy EIA Energy Information Administration fc footcandle(s) HID high-intensity discharge IES Illuminating Engineering Society of North America K kelvin kWh kilowatt-hour(s) LCC life-cycle cost LCS Luminaire Classification System LED light-emitting diode LLF light loss factor LPD lighting power density LSI LSI Industries, Inc. lm/W lumen(s) per watt MH metal halide MWh megawatt-hour(s) PMH pulse-start metal halide REA Retailer Energy Alliance SSL solid-state lighting W watt(s)
vii

Contents
Preface .............................................................................................................................................. iii Summary ............................................................................................................................................. v
Acronyms and Abbreviations ...........................................................................................................vii 1.0 Introduction ............................................................................................................................. 1.1
2.0 Methodology............................................................................................................................ 2.1
2.1 Site Description ............................................................................................................... 2.1
2.2 Designs Considered ......................................................................................................... 2.1
2.3 Conventional Luminaires ................................................................................................ 2.2
2.3.1 “Typical Design” – 1000W Luminaires ............................................................... 2.2
2.3.2 Optional PMH Design – 400W Luminaires ......................................................... 2.3
2.4 Wall Pack Luminaires ..................................................................................................... 2.4
2.5 LED Luminaires .............................................................................................................. 2.4
2.6 Differences in Luminaire Efficacy .................................................................................. 2.5
2.6.1 Conventional Component Efficiencies ................................................................. 2.5
2.7 Installation....................................................................................................................... 2.6
2.8 Power and Energy ........................................................................................................... 2.7
2.8.1 Luminaire Power .................................................................................................. 2.7
2.8.2 Operating Hours ................................................................................................... 2.7
2.8.3 Lighting Power Density ....................................................................................... 2.7
2.8.4 Lighting System Energy Usage ............................................................................ 2.8
2.9 Illuminance ...................................................................................................................... 2.9
2.9.1 Designed/Calculated Values................................................................................. 2.9
2.9.2 Measured Values ................................................................................................ 2.10
3.0 Cost Effectiveness ................................................................................................................... 3.1
3.1 Inputs for Economic Analysis ......................................................................................... 3.1
3.1.1 Cost of Equipment ................................................................................................ 3.1
3.1.2 Cost of Electricity................................................................................................. 3.2
3.1.3 Cost of Operation ................................................................................................. 3.3
3.1.4 Discount Rate ....................................................................................................... 3.3
3.1.5 Analysis Period .................................................................................................... 3.3
3.2 Simple Payback ............................................................................................................... 3.3
3.3 Net Present Value and Life-Cycle Cost Analysis ........................................................... 3.4
3.4 Summary ......................................................................................................................... 3.4
3.4.1 1000W PMH vs. LED System ............................................................................. 3.5
3.4.2 400W PMH System vs. LED System ................................................................... 3.5
3.4.3 400W PMH vs. 1000W PMH............................................................................... 3.5
ix

4.0 Lighting Qualitative Evaluation .............................................................................................. 4.1
4.1 Owner Evaluation ............................................................................................................ 4.1
4.2 Walmart Shopper’s Survey ............................................................................................. 4.1
5.0 Discussion ................................................................................................................................ 5.1
5.1 Owner Evaluation ............................................................................................................ 5.1
5.2 Lighting Metrics .............................................................................................................. 5.1
5.3 Cost Effectiveness ........................................................................................................... 5.1
5.3.1 Atypical Costs ...................................................................................................... 5.2
6.0 Conclusions ............................................................................................................................. 6.1
6.1 Lighting Power Density .................................................................................................. 6.1
6.2 Lower Illuminance .......................................................................................................... 6.1
6.3 Other sites ........................................................................................................................ 6.1
6.4 GATEWAY Requirements ............................................................................................. 6.2
7.0 References ............................................................................................................................... 7.1
x

Figures
Figure 2.1. LSI Type V Distribution for 1000W Luminaire ..................................................................... 2.3
Figure 2.2. LSI Type II Distribution for 1000W Luminaire ..................................................................... 2.3
Figure 2.3. LSI Type V Distribution for 400W Luminaire ....................................................................... 2.3
Figure 2.4. LSI Type III Distribution for 400W Luminaire ...................................................................... 2.4
Figure 2.5. 175W PMH Wall Pack ........................................................................................................... 2.4
Figure 2.6. Type V LED Distribution ....................................................................................................... 2.5
Figure 2.7. Type III LED Distribution ...................................................................................................... 2.5
Figure 2.8. GE luminaires on top of poles ................................................................................................ 2.6
Figure 2.9. Façade during construction ..................................................................................................... 2.6
Tables
2.1. Comparison of Power and Energy Density ........................................................................................ 2.8
2.2. 1000W Typical Design Annual Energy Use ...................................................................................... 2.8
2.3. 400W Alternate Design Annual Energy Use ..................................................................................... 2.8
2.4. LED System Annual Energy Use ....................................................................................................... 2.8
2.5. 1000W Typical PMH Design Illuminance at Time of Relamping ..................................................... 2.9
2.6. 400W Optional PMH Design Illuminance at Time of Relamping ..................................................... 2.9
2.7. LED System Design Illuminance at Time of Relamping................................................................. 2.10
2.8. LED System Design Calculation of Grid ......................................................................................... 2.10
2.9. LED System Measurements from May 13, 2009 ............................................................................. 2.10
3.1. Individual Luminaire Prices ............................................................................................................... 3.2
3.2. Total Installation Costs ...................................................................................................................... 3.2
3.3. Total Electricity Costs ........................................................................................................................ 3.2
3.4. Simple Payback of Lighting Systems ................................................................................................ 3.4
3.5. Net Present Value Review of Lighting Systems ................................................................................ 3.4
5.1. LCC and Payback Comparison of Different Electricity Rates ........................................................... 5.2
xi

1.0 Introduction
This report documents the first full parking lot installation of light-emitting diode (LED) products for Walmart, which was done at a Walmart Supercenter in Leavenworth, Kansas. For years, Walmart has explored alternatives to conventional (metal halide [MH] or high-pressure sodium) lighting technologies in its parking lots as a way to save energy, improve the environmental aspects of operation, and potentially reduce maintenance costs. However, the company has approached LED luminaires cautiously pending additional research and analysis.
In 2008, the U.S. Department of Energy (DOE) formed the Retailer Energy Alliance (REA), which brings together similar types of end users to exchange information and leverage buying capacity in order to help expedite market adoption of energy efficient technologies and design practices.1 The REA encompasses several different building system subcommittees (e.g., electrical, mechanical, renewable power). A working group was formed as part of the Lighting & Electrical Subcommittee, of which Walmart is an active participant, to develop an LED parking lot specification. Version 1.2 of the LED parking lot specification was completed in June 2009 and was subsequently expanded to encompass other energy alliances across the broader Commercial Building Energy Alliance (CBEA) (EERE 2011).
With this milestone completed, Walmart agreed to install LEDs across an entire site and in the process “test drive” the CBEA specification
Walmart had already installed a few LED luminaires at their headquarters in Bentonville, Arkansas, but had never done such a large-scale installation. Walmart historically had concerns about the cost and reliability of LEDs; however, lower LED prices and the CBEA specification’s emphasis on LED reliability helped address Walmart’s concerns and justify a change in practice.
The CBEA specification differs somewhat from the traditional Walmart lighting specification, most notably in requirements for lighting power density and illuminance. Walmart’s specification does not have a power density requirement and typically focuses on average illuminance at their sites. IES RP-2098 sets minimum rather than average illuminance requirements, however, and Walmart was a proponent of using minimum illuminance requirements during the specification development process. Others in the working group agreed that minimum values should be specified in lieu of average values.
Like most retailers, Walmart typically requires much higher illuminance values than recommended in RP-20.2 In general, Walmart’s standard Supercenter parking lot lighting design uses very efficient 1000W pulse-start metal halide (PMH) luminaires and 175W PMH wall packs, together creating light levels that are twice the CBEA specification’s minimum required illuminance values. Additionally, the PMH luminaires require biennial relamping (per Walmart’s maintenance records), which results in significant maintenance costs.
1 The Retailer Energy Alliance is under the larger DOE initiative, Commercial Building Energy Alliance. Information about the REA can be found at: http://www1.eere.energy.gov/buildings/alliances/retailer_energy_alliance.html. 2 Section 2.0 of RP-20-98 states, “For example, retailers may prefer higher levels of illuminance than specified herein, to attract customers or to more strongly address perceptions of personal security needs.” Section 4.1 further expands on that statement: “Many retailers prefer even higher levels, with a specification of 10 lux (1 fc) as the minimum value.”
1.1

The Leavenworth site offered a suitable test case to see if an LED system could meet the CBEA specification requirements while being competitive with conventional systems when maintenance and energy costs were figured into the equation. For this project, Walmart selected GE Lighting’s Evolve LED pole-mounted luminaires. Because Leavenworth was a new site, the pole layout could be designed specifically for these luminaires. The typical parking area lighting design also includes wall-mounted luminaires; however, because GE did not manufacture an LED wall-mounted luminaire at the time of the installation, a PMH wall-mounted luminaire by Lithonia was used instead.
During site review it was acknowledged that matching the illuminance of the standard 1000W PMH with the LED product would be cost prohibitive. At the same time, however, the power density of the 1000W system exceeded the CBEA specification (discussed in more detail later in the report), so the previous standard Walmart system (400W PMH) was also selected for comparison. This evaluation thus includes comparisons of the LED against both the 400W system and the 1000W PMH system.
1.2

2.0 Methodology
To provide the basis of this evaluation, this section describes the site, the luminaires installed and considered for the installation, power and energy usage of the different systems considered, and the illuminance produced by each.
2.1 Site Description
The site is a newly constructed Walmart Supercenter consisting of a ~170,000 ft2 store surrounded by about 527,957 ft2 (≈12 acres) of parking and other hardscape. Approximately 833 parking spaces are available on site. Unlike many parking lots, which are paved with asphalt, the parking lot is paved with concrete.
2.2 Designs Considered
Walmart typically lights a site via pole-mounted area lighting, but in this design Walmart used more wall packs than they typically do. The designs considered included the following equipment:
“Default High-Intensity Discharge (HID) Design” included:
• 9 Type II pole-mounted luminaires with 1000W PMH lamps mounted 39 ft above finished grade (AFG)3
− 9 poles with single configuration
• 38 Type V pole-mounted luminaires with 1000W PMH lamps mounted 39 ft AFG − 10 poles with triple (3 at 90°) configuration − 4 poles with back-to-back (2 at 180°) configuration
• 22 wall-mounted luminaires with 175W PMH lamps
“Alternative HID Design” included:
• 15 Type III pole-mounted luminaires with 400W PMH lamps mounted 37.5 ft AFG − 4 poles with back-to-back (2 at 180°) configuration − 7 poles with single configuration
• 59 Type V pole-mounted luminaires with 400W PMH lamps mounted 37.5 ft AFG − 13 poles with triple (3 at 90°) configuration − 4 poles with back-to-back (2 at 180°) configuration
• 22 wall-mounted luminaires with 175W PMH
“LED Design” included:
• 12 Type III pole-mounted LED-dedicated luminaires mounted 37.5 ft AFG − 5 poles with back-to-back (2 at 180°) configuration
3 Type II distribution might be atypical for some parking lots. This distribution provided the ideal distribution for the pole layout of this design.
2.1

− 2 poles with single configuration
• 80 Type V pole-mounted LED-dedicated luminaires mounted 37.5 ft AFG − 10 poles with quad (4 at 90°) configuration − 8 poles with triple (3 at 90°) configuration − 8 poles with back-to-back (2 at 180°) configuration
• 22 wall-mounted luminaires with 175W PMH lamps
Designs for both the 1000W and the 400W systems were reviewed via computer simulation (AGi32)4 for comparison with the LED design and installation.
2.3 Conventional Luminaires
As a result of the light trespass requirements in the CBEA specification and to achieve some of the necessary illuminance/uniformity ratios, this installation required more wall-mounted luminaires than is usual for a Walmart site.
For a theoretical baseline design, conventional products from LSI Industries, Inc. (LSI) were chosen because LSI is a Walmart vendor for conventional (non-LED) equipment and has supplied luminaires for other Walmart sites. (LSI now offers LED luminaires; but at the time of the design phase of this project and analysis they did not.) The analysis of hypothetical designs did not include LED LSI luminaires to limit the overall number of possible hypothetical installations.
2.3.1 “Typical Design” – 1000W Luminaires
The LSI Type V luminaires (catalog code GFR-540-1000-PSMV-F) have a backlight, uplight, and glare (BUG) rating of B5-U3-G5.5 The ballast input power for the 1000W rated lamp is 1080W. Per the manufacturer’s catalog, the initial output of the 1000W lamp is 120,000 lumens. The luminaire efficiency is 72.2 percent, which translates to a luminaire efficacy of (120,000 initial lumens × 72.2 percent efficiency / 1080W) = 80 lumens per watt (lm/W). Figure 2.1 illustrates the intensity distribution of the luminaire.
4 AGi-32 is lighting software manufactured by Lighting Analysts (http://www.lightinganalysts.com) and is one of the lighting calculation and rendering software applications used in the lighting industry. 5 The IESNA no longer uses cutoff classifications, having replaced it with the Luminaire Classification System (LCS). LCS designates “BUG” ratings for luminaires. The CBEA specification sets limits on these BUG values.
2.2

t u
Figure 2.1. LSI Type V DDistribution ffor 1000W Luuminaire
The LLSI Type II luuminaires (cattalog code GFFR-2-1000-PSSMV-F) havee a BUG ratinng of B5-U3-GG5. The luminnaire efficienccy is 61percennt, which trannslates to a luuminaire effic cacy of 67 lm//W. Figure 2.2 illustrates the intensity distribution oof the luminaaire.
Figure 2.2. LSI Type II DDistribution ffor 1000W Luuminaire
2.3.2 Optional PMH Desiggn – 400W Luminairees
The LLSI Type V luuminaires (cattalog code GFFR-5-400-PSMMV-F) have a BUG ratingg of B5-U2-GG5. The ballasst input poweer for the 400WW lamp was aassumed to bee 454W. Per the lamp mannufacturer caatalog, the initial output of thee lamp is 42,0000 lumens. TThe luminairee efficiency iss 59 percent, wwhich translaates to a luminairre efficacy off 55 lm/W. Fiigure 2.3 illusstrates the intensity distribution of this lluminaire.
Figure 2.3. LSI Type V Distribution for 400W Luuminaire
2.3

The LLSI Type III luuminaires (caatalog code GGFR-3-400-PSSMV-F) havee a BUG ratin g of B3-U3-GG3. The luminnaire efficienccy is 53 perceent, which traanslates to a luuminaire efficcacy of 49 lmm/W. Figure 22.4 illustrates the intensity distribution oof this luminaaire.
Figure 2.4. LSSI Type III Diistribution forr 400W Lumiinaire
2.4 WWall Pack Luminairres
The wwall-mounted luminaires seelected and innstalled were manufacturedd by Lithoniaa. The Lithonnia metal haliide wall-mounnted luminairres (catalog coode WST-1755MHC-WT-2277-DBNJI-LLPI) have a BUUG rating of BB2-U1-G2. TThe ballast inpput power is 2210W for thee 175W lamp. According tto the lamp manufactuurer, the initiaal output of thhe lamp is 11,900 lumens. The luminaiire efficiency is 62 percentt, which trannslates to a luuminaire efficcacy of 32 lm//W. Figure 22.5 illustrates the intensity distribution oof the luminaire .6
FFigure 2.5. 1175W PMH WWall Pack
2.5 LEED Luminnaires
The GGE Evolve LEED Type V Seeries luminairres (catalog c ode EAM-H--S5-N-5-A-1--C-BLCK) haave a BUG ratinng of B4-U3-G2. The lumminaire efficaccy calculated from the mannufacturer’s I ES data file i s 57 lm/W (11 ,980 initial luumens / 210WW).7 Figure 2..6 illustrates tthe intensity ddistribution of the luminairre.
6 Photomettry was not avaailable for the 175W PMH wwall pack. Photoometry values uused were estimmated from photometriic file for LSI ffixture WST-1 50M-WT. 7 Per IES LLM-79-08, LEDD luminaires are measured viia absolute phootometry and thhe entire luminnaire is measurred via the apparattus. In contrasst, conventionaa aires are typicaally measured vvia relative phootometry, wherre thel (HID) lumina
2.4

Fiigure 2.6. Tyype V LED DDistribution
The GGE Evolve LEED Series Typpe III luminaiires (catalog ccode EAM-HH-W3-N-5-A-1-C-BLCK) hhave a BUG ratting of B2-U22-G2. The luuminaire effic acy calculate d from the mmanufacturer’ss IES data filee is 43 lm/W (6,6679 initial lummens/ 155W).. Figure 2.7 iillustrates the intensity disttribution of thhe luminaire.
Fiigure 2.7. Tyype III LED DDistribution
2.6 Differencees in Lumminaire Effficacy
Differrent elementss influence thee effectivenesss of the desiggn. At a funddamental leve l, inefficient luminaire s lead to inefffficient systemm design. Howwever, differeent componennts and differrent distributioons translate tto different luuminaire effic acies. Ultimaately, correct distribution ffor the given application c an be much morre important tto efficient innstallation thann overall lumminaire efficaccy.
2.6.1 Conventioonal Compponent Effiiciencies
With conventional magnetic balllast technoloogy, as rated ppower of the ssystem increaases, so typicaally does the bballast efficienncy (PowerOuut/PowerIn). FFor example, tthe 1000W baallast draws aa total of 10800W, which meeans that 8 perrcent of the tootal power is uused by the bballast. In conntrast, the 4000W ballast drraws a total of 4554W, or abouut 14 percent oof total powerr used by the ballast. PMHH lamp effica cy is similar iin that efficaacy increases with rated poower. The 4000W lamp has a lamp rated efficacy (lammp lumens / laamp rated powwer) of 105 lmm/W, while thee 1000W lammp has a lamp rated efficacyy of 112 lm/WW. When theese
luminaire aand light sourcce are tested sepparately. Wheereas relative phhotometry prodduces a fixturee efficiency vallue, data from aabsolute photo metry does nott.
2.5

two systemms are combiined, the 10000W lamp/balllast system opperates at 1033 lm/W and thhe 400W lamp/ballaast system opperates at a sliightly lower ssystem efficaccy of 93 lm/WW.
2.7 Innstallationn
The sttandard 1000W PMH ligh ting design wwould have reqquired 47 lumminaires mounnted at 39 ft AAFG on 23 polees distributedd across the site. In compaarison, the “opptional PMH design” woulld have used 774 400W lumminaires mounnted at 37.5 ftft AFG on 33 poles distribuuted across thhe site. The LLED system actually innstalled uses 92 LED lumiinaires (shownn in Figure 2..8 on top of thhe pole) mounnted 37.5 ft AAFG on 33 polees. All three designs use 222 175W walll-mounted lumminaires that supplement tthe pole-mounnted lighting. Figure 2.9 shhows the site wwith LED lumminaires durinng constructioon. The lowerr lumen packaages of the 4000W PMH systtem and the LLED system reequire both mmore luminairres and a slighhtly lower mounting height to achhieve the desirred results.
Figuure 2.8. GE lluminaires onn top of poles
Figgure 2.9. Faççade during cconstruction
Poles represent thee largest expennditure in sitee/area lightingg. Added to tthe cost of thee poles are coosts of the requirred infrastructture work succh as trenching and repavinng, and materrials and instaallation of connduit, power cabble, and the pole support b ases. The lumminaire is a reelatively smalll componentt of the overalll cost by compaarison. For thhis reason, thee usual focus iin an installattion is on limiiting the nummber of poles.
2.6

However, at this site Walmart was committed to optimizing the design for LEDs regardless of the additional poles needed.
During the site survey and illuminance measurements in May 2009, it was discovered that one pole was 13 ft from intended location. The pole was subsequently moved to the correct location.
2.8 Power and Energy
Walmart typically operates their luminaires all night and does not use any controls to reduce the lighting during this period. Therefore, a simple spot power measurement multiplied by the operating hours yields the energy usage estimates.
2.8.1 Luminaire Power
Based on manufacturer catalogs, the assumed total input power for the conventional luminaires was 1080W for the 1000W lamps, 454W for the 400W lamps, and 210W for the 175W lamps.
Manufacturer values for the Type V LED luminaire (211W) and the Type III (164W) are used in this report.
2.8.2 Operating Hours
The Walmart standard Supercenter exterior lighting system operates sunset to sunrise (11.5 hours per day), or 4200 hours per year.8
2.8.3 Lighting Power Density
Many energy codes—including ANSI/ASHRAE/IES Standard 90.1, International Energy Conservation Code, and California’s Title 24—are either setting or revising power density limits (watts per square foot) for parking lots. The CBEA specification similarly sets a power density limit to guarantee that efficient equipment is used wisely to meet the needs of the site. The CBEA specification establishes power densities by ambient lighting zone:9 (CBEA 2010)
• LZ2 – 0.05 watts per square foot
• LZ3 – 0.06 watts per square foot
• LZ4 – 0.08 watts per square foot
Because this Walmart is located near other stores, the site qualifies as ambient Lighting Zone 3, with a maximum allowable lighting power density (LPD) of 0.06 watts per square foot per the CBEA specification.
8 11.5 hours per day is from Section 4.2 of IESNA DG-13-98, Guide for the Selection of Photocontrols for Outdoor Lighting Applications. 9 See the CBEA definition of the lighting zones.
2.7

Table 2.1. Comparison of Power and Energy Density
Lighting Power Density CBEA Specification 0.06 W/ ft²
1000W Typical 0.10 W/ft² 400W Alternate 0.07 W/ ft²
Leavenworth LED Design 0.04 W/ ft²
Neither the 1000W system nor the 400W system meets the stringent LPD of the CBEA specification, even though this was one of the reasons the alternate 400W system was designed.
2.8.4 Lighting System Energy Usage
The following tables provide the power draw per luminaire type and total energy consumption of the three different lighting systems. The values reported in the tables represent catalog data rather than measured values.
Table 2.2. 1000W Typical Design Annual Energy Use
Qty Arrangement Luminaire Power (W) Total Power (W) Hours Energy (kWh) 38 Type V 1,080 41,040 4,200 172,368 9 Type II 1,080 9,720 4,200 40,824
22 Wall mounted 210 4,620 4,200 19,404 TOTAL ANNUAL ENERGY USE 232,596
Table 2.3. 400W Alternate Design Annual Energy Use
59 Single, Type V 454 26,786 4,200 111,501 15 Single, Type III 454 6,810 4,200 28,602 22 Wall mounted 210 4,620 4,200 19,404
TOTAL ANNUAL ENERGY USE 160,507
Qty Arrangement Luminaire Power (W) Total Power (W) Hours Energy (kWh)
Table 2.4. LED System Annual Energy Use
Qty Arrangement Luminaire Power (W) Total Power (W) Hours Energy (kWh) 80 Single, Type V 211 16,880 4,200 70,896 12 Single, Type III 164 1,968 4,200 8,266 22 Wall mounted 210 4,620 4,200 19,404
TOTAL ANNUAL ENERGY USE 98,565
The 1000W PMH system is expected to use 233 megawatt-hours (MWh) of energy annually, compared to the alternative 400W PMH system’s expected use of 161 MWh and the LED system’s 99 MWh. The LED system thereby uses 38 percent less electricity than the 400W system and 57 percent less than the standard 1000W system.
2.8

2.9 Illuminance
Illuminance measurements for the installed LED product were taken on May 13, 2009 by GE personnel, with Pacific Northwest National Laboratory and Walmart representatives reviewing the procedure as the values were recorded.
2.9.1 Designed/Calculated Values
Illuminance was calculated across the entire site, encompassing all of the luminaires as well as light loss factors (LLF). These calculations are summarized below.
A site of this size (>500,000 ft2) is difficult to measure in its entirety; thus, the overall site was calculated and only selected portions of it physically measured. To calibrate the actual measured values to the calculated values, smaller grids correlating to the actual measured points were calculated as well. The data related to these smaller grids can be found in Section 2.9.1.2. These values represent initial illuminance, corresponding to what was measured (i.e., initial lumens).
2.9.1.1 Entire Site Illuminance Calculations
The CBEA specification divides the parking lot into different sections, or zones (main, perimeter, front aisle, rear drive, etc.), because each zone has its own illuminance requirements. The following tables use freely available IES-format files for the products mentioned in Sections 2.3 and 2.5.
The CBEA specification required a minimum of 0.75 footcandles (fc) for this site at the time that the luminaires were replaced. Per the specification and IES guidelines, LLF was included in the calculations. For PMH luminaires, the calculations that created Table 2.5 through Table 2.7 used lamp lumen depreciation values of 0.75 for the metal halide luminaires and 0.70 for LED luminaires.10
Table 2.5. 1000W Typical PMH Design Illuminance at Time of Relamping
Section of Minimum Maximum Average Avg/Min Max/Min Parking Lot Illuminance Illuminance Illuminance
(fc) (fc) (fc) Front Aisle 3.7 8.2 6.1 1.6:1 2.2:1 Main Lot 1.7 8.2 4.6 2.7:1 4.8:1
Table 2.6. 400W Optional PMH Design Illuminance at Time of Relamping
Section of Minimum Maximum Average Avg/Min Max/Min Parking Lot Illuminance Illuminance Illuminance
(fc) (fc) (fc) Front Aisle 2.5 4.6 3.2 1.3:1 1.8:1
10 Section 6.1.4, Lumen Maintenance, of RP-20-98 states, “Each design should provide the required minimum lighting levels at time of relamping. Therefore, design should be based on the relamping program to be used.” The end of useful life for LED systems is when the light output reaches 70% of initial output, or L70. The CBEA specification requires L70 (or a lamp lumen depreciation of 0.70) to be used in the design calculations/documentation.
2.9

Main Lot 0.9 4.7 2.3 2.5:1 5.6:1
Table 2.7. LED System Design Illuminance at Time of Relamping
Section of Minimum Maximum Average Avg/Min Max/Min Parking Lot Illuminance Illuminance Illuminance
(fc) (fc) (fc) Front Aisle 1.2 1.8 1.5 1.3:1 1.5:1 Main Lot 0.8 1.9 1.3 1.6:1 2.4:1
Each system considered thus meets the CBEA specification minimum requirement of 0.75 fc at the time of the light source replacement.
2.9.1.2 Measurement Grid Calculations
To verify the design calculations, field measurements were planned. However, gathering all of those measurement points is virtually impossible. Therefore, representative grids correlating to the measurements taken in the field were calculated along with the entire site. Because multiple field measurements were taken, different calculation grids were created. Table 2.8 corresponds to the initial illuminance values calculated for the site.
Table 2.8. LED System Design Calculation of Grid
Section of Minimum Maximum Average Avg/Min Max/Min Parking Lot Illuminance Illuminance Illuminance
(fc) (fc) (fc) Front Aisle 1.9 2.7 2.3 1.2:1 1.4:1 Main Lot 1.4 1.8 1.5 1.1:1 1.3:1 Perimeter 0.8 1.1 0.9 1.1:1 1.4:1
2.9.2 Measured Values
Table 2.9 provides the summary of the field measurements.
Table 2.9. LED System Measurements from May 13, 2009
Section of Minimum Maximum Average Avg/Min Max/Min Parking Lot Illuminance Illuminance Illuminance
(fc) (fc) (fc) Front Aisle 1.6 2.5 2.1 1.3:1 1.6:1 Main Lot 0.9 1.7 1.3 1.4:1 1.8:1 Perimeter 0.4 1.2 0.7 1.2:1 1.6:1
Section 5.2 reviews why predicted values (Table 2.8) may not match exactly with the measured values (Table 2.9) in the field.
2.10

3.0 Cost Effectiveness
In this section, the economics of the LED system are compared against both HID systems—the current standard 1000W and the previous standard 400W. Simple payback, life-cycle costs (LCC), and internal rate of return are estimated. Because the 22 wall packs are consistent across all the designs and these luminaires are not pole-mounted, they are equivalent across systems and are therefore ignored in the calculations.
3.1 Inputs for Economic Analysis
The initial higher costs of LED luminaires are theoretically more than offset by reduced electricity and deferred maintenance costs over the life of the LED luminaire. Walmart expects these LED luminaires to last 10 years, so this economic analysis models the LCCs of all three Leavenworth lighting systems over that timeframe. The Building Life-Cycle Cost (BLCC) software developed by the National Institute of Standards and Technology was used to calculate the LCC for infrastructure-related energy conservation projects that have high initial costs, but save energy over the long term.11 This program was used to model the present value LCC of the three lighting designs. Each system is evaluated in terms of estimated luminaire costs, installation costs, projected 10-year maintenance costs, and projected 10-year energy costs12, and the analysis accounts for expected changes in energy prices.
3.1.1 Cost of Equipment
Walmart competitively bids out their equipment needs to vendors that can deliver products that meet Walmart’s stringent specifications at very low prices. The costs used in Table 3.1 essentially constitute what a general contractor would pay for such luminaires per manufacturer’s representatives for that area of the country. Because each of the designs used a different number of poles and different number of luminaires, Table 3.2 compares the total cost of each system as designed using the individual luminaire prices from Table 3.1.
11 This software is available for download at http://www1.eere.energy.gov/femp/information/download_blcc.html. 12 This evaluation uses representative rather than real costs for the site due to the business sensitivity of such information.
3.1

Table 3.1. Individual Luminaire Prices
Light Source
Luminaire Nominal Power
(W)
Luminaire Distribution
Luminaire Price ($)
Quantity Total Price ($)
Baseline Design
PMH PMH
1000 1000
Type II Type V
881 881
9 38
7,929 33,478
MH 175 --- 22 --- Total 41,407
Installed Design
LED LED
164 211
Type III Type V
1200 1000
12 80
14,400 80,000
MH 175 --- 22 --- Total 94,400
Alternate Design
10,275 40,415
--- 50,690
PMH 400 Type III 685 15 PMH 400 Type V 685 59 MH 175 --- 22
Total
Table 3.2. Total Installation Costs
# of Materials & Installation Total Pole Luminaires Prices Total Costs Poles Cost per Pole Cost Table 3.1 ($)
($) ($) ($) Typical Design 23 1,600 36,800 41,407 78,207 Alternate Design 33 1,600 52,800 50,690 103,490 Installed Design 33 1,600 52,800 94,400 146,800
3.1.2 Cost of Electricity
In the U.S., commercial electricity prices vary greatly by state and region. As a reference point, the U.S. Energy Information Administration (EIA) publishes the Average Retail Price of Electricity to Ultimate Customers by End-Use Sector by State (EIA 2011). The national average retail price of electricity to commercial customers in October 2009 was reported as $0.1022/kWh. The Leavenworth site’s estimated electricity cost of $0.056/kWh13 is low not just in relation to most regions of the country, but also within Kansas. In general, LEDs are likelier to be economically viable in places where electricity costs are high enough that the energy savings they generate contribute significantly to paying back the high initial costs of these luminaires.
Using the annual energy usage of the different lighting systems from Section 2.8 and the electricity rate of $0.056, the total annual energy costs of the light fixtures are shown in Table 3.3.
Table 3.3. Total Electricity Costs
Yearly Operation Cost of Electricity Annual Costs
13 Westar Energy is the energy supplier in Leavenworth, and energy costs for this report were calculated using an estimated $0.056/kWh average quote for a commercial customer with an equivalent-sized store and parking area.
3.2

(kWh) ($/kWh) ($)
Alternate PMH Design 160,507 0.056 $8,988.39 Typical PHM Design 232,596 0.056 $13,025.38
Installed LED Design 98,565 0.056 $5,519.64
3.1.3 Cost of Operation
Walmart’s estimated maintenance costs for the PMH systems includes scheduled maintenance, equipment costs (group relamp every 2 years), and unscheduled maintenance costs (the cost of labor and materials to fix a luminaire). The PMH systems cost $74 per luminaire per year to maintain. The annual per-luminaire maintenance cost for the LED system is based on estimated costs for unscheduled repairs and maintenance. Although these luminaires are not expected to need much maintenance, an estimated amount has been allocated to cover the labor and material costs associated with fixing a luminaire. The assumed maintenance cost for the LED system is $20 per luminaire per year. Since maintenance costs include more than lamp replacements, a sum of $20 was included to account for some unexplained maintenance.
3.1.4 Discount Rate
Discount is a component representing the time value of money. Walmart’s discount rate is 3.84 percent. In other analyses, per the Office of Management and Budget, DOE uses discount rates of 3 percent and 7 percent to cover the range of typical discount rates for institutions in the country. Walmart’s discount rate is in the low-end of the range, which isn’t surprising given their size, capital situation, and management practice of reviewing every cost of operation.
3.1.5 Analysis Period
Walmart negotiated a 10-year warranty with GE Lighting for the LED luminaires, in line with their plan to replace the LED luminaires in that timeframe. Thus, the life-cycle analysis period for the luminaires is also 10 years.
3.2 Simple Payback
Simple payback does not factor in the cost of the money over time. For this analysis, the total difference in initial cost of the different systems is calculated and divided by the annual savings from reduced energy and maintenance.
3.3
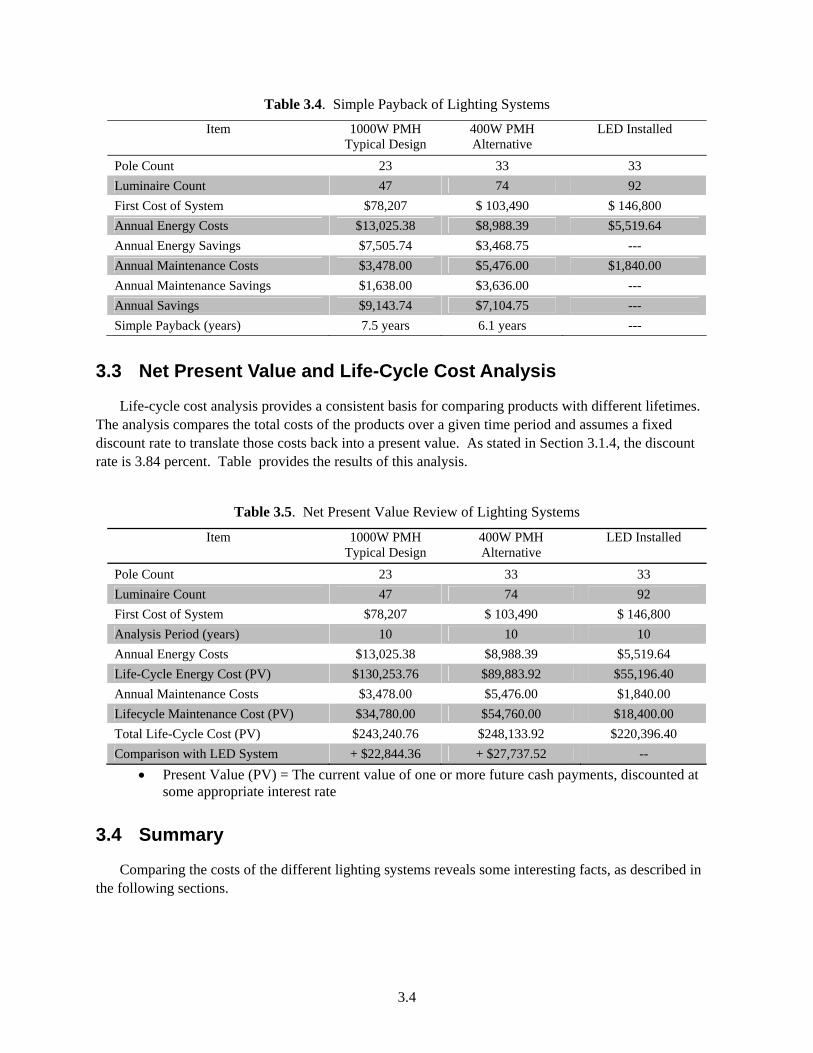
Table 3.4. Simple Payback of Lighting Systems
Item 1000W PMH 400W PMH LED Installed Typical Design Alternative
Pole Count 23 33 33 Luminaire Count 47 74 92 First Cost of System $78,207 $ 103,490 $ 146,800 Annual Energy Costs $13,025.38 $8,988.39 $5,519.64 Annual Energy Savings $7,505.74 $3,468.75 --- Annual Maintenance Costs $3,478.00 $5,476.00 $1,840.00 Annual Maintenance Savings $1,638.00 $3,636.00 --- Annual Savings $9,143.74 $7,104.75 --- Simple Payback (years) 7.5 years 6.1 years --
3.3 Net Present Value and Life-Cycle Cost Analysis
Life-cycle cost analysis provides a consistent basis for comparing products with different lifetimes. The analysis compares the total costs of the products over a given time period and assumes a fixed discount rate to translate those costs back into a present value. As stated in Section 3.1.4, the discount rate is 3.84 percent. Table provides the results of this analysis.
Table 3.5. Net Present Value Review of Lighting Systems
Item 1000W PMH 400W PMH LED Installed Typical Design Alternative
Pole Count 23 33 33 Luminaire Count 47 74 92 First Cost of System $78,207 $ 103,490 $ 146,800 Analysis Period (years) 10 10 10 Annual Energy Costs $13,025.38 $8,988.39 $5,519.64 Life-Cycle Energy Cost (PV) $130,253.76 $89,883.92 $55,196.40 Annual Maintenance Costs $3,478.00 $5,476.00 $1,840.00 Lifecycle Maintenance Cost (PV) $34,780.00 $54,760.00 $18,400.00 Total Life-Cycle Cost (PV) $243,240.76 $248,133.92 $220,396.40 Comparison with LED System + $22,844.36 + $27,737.52 -• Present Value (PV) = The current value of one or more future cash payments, discounted at
some appropriate interest rate
3.4 Summary
Comparing the costs of the different lighting systems reveals some interesting facts, as described in the following sections.
3.4

3.4.1 1000W PMH vs. LED System
Because the standard 1000W PMH system produces considerably more illuminance than the LED system, the systems are not directly equivalent. The LED system requires different pole spacing and layout and more than double the number of luminaires. However, the 1000W system provides much higher illuminance than is recommended by IES for retail parking lot applications. Energy codes and other regulations are moving toward more closely aligning lighting requirements with recommendations, so that the use of such high-wattage systems may become less common.
In any case, higher relative energy costs and maintenance costs makes the 1000W system somewhat more expensive than the LED system, by $22,844. The simple payback for the LED system occurs after 7.5 years ($146,800 (LED system initial cost) - $78,207 (1000W PMH system initial cost) / $9,144 (annual savings from LED system).
3.4.2 400W PMH System vs. LED System
The 400W PMH system and the installed LED system have similar minimum illuminance levels in the main parking lot, and both systems require 33 poles to adequately light the parking lot at a cost of $52,800. However, the LED system requires 92 luminaires to light this parking area versus the 400W system’s 74-luminaire design, thus requiring $43,310 in incremental first costs compared to the 400W system. Over the analysis period, the LED system saves a present value of $34,688 in energy costs, but energy savings alone does not offset the initial costs of the LED luminaires.
The situation changes when maintenance costs are taken into account, with the LED system saving a present value of $36,360.00 in maintenance costs over its life cycle.
In total, the overall present value LCCs of the 400W PMH system are $248,134 in contrast to the LED system total of $220,396, for a relative savings of $27,738. Simple payback for the LED system occurs 6.10 years ($146,800 (LED system initial cost) - $103,490 (400W PMH system initial cost) / $7,105 (annual savings from LED system).
3.4.3 400W PMH vs. 1000W PMH
Comparing the 400W PMH system to the incumbent 1000W PMH system reveals how fewer luminaires and poles provide notable savings. The 23-pole, 47-luminaire 1000W system has a net initial investment savings of $25,283 relative to the 33-pole, 74-luminaire 400W system, and the 400W system saves a present value of $40,370 in energy costs over the analysis period.
However, when life-cycle maintenance costs are factored in, the difference between these systems becomes less pronounced. The 400W system will cost a present value of $54,760 over the analyzed period to maintain, whereas the 1000W system costs a present value of $34,780, for a total savings of $19,980. When the initial cost of equipment, the cost of energy for the systems for 10 years, and the cost of maintenance are factored in, the 1000W system actually costs $4,893 less than the 400W PMH system. Given the higher illuminance values for less money, it is clear why the 1000W system has become the standard default design.
3.5

4.0 Lighting Qualitative Evaluation
The GATEWAY program considers user feedback on the qualitative aspects of LED lighting to be an essential component of the overall evaluation. Users are likely to resist products that don’t illuminate as well as the incumbent technology, and therefore such products are unlikely to be widely adopted regardless of the unit energy savings they offer. In addition, quantitative analysis of the measurements to the exclusion of qualitative feedback does not capture the full effect of the substitution; it disregards other aspects influencing human perception, such as whether lower illuminance is acceptable for the Walmart brand, uniformity of illumination, perceived brightness, safety and security, glare, and light trespass issues. For this evaluation, comments from different groups of people yield qualitative assessments.
4.1 Owner Evaluation
In a March 26, 2009 webcast (EERE 2009), Ralph Williams, Walmart Senior MEP Systems Engineer reported the results from several tests, retrofits, and LED evaluations that happened before the Leavenworth installation. In general, he noted that the strengths of LED lighting are uniform illumination and energy savings. The conclusions from these prior evaluations led to a corporate decision to design an entire site with LEDs.
Walmart has been highly impressed by the LEDs’ exceptional optical performance, allowing close adherence to light trespass restrictions, zoning requirements, and good neighbor policies. The Leavenworth site, for example, has residences on the east and north sides of the site that comprises light-sensitive borders.
4.2 Walmart Shopper’s Survey
Walmart conducted exit interviews on a diverse group (varying in age, gender, ethnicity, shopping alone and/or with others) of more than 40 customers, after nightfall outside their Leavenworth location and another store in Peoria, Illinois on Friday, August 7, and Sunday, August 9, 2009. The store in Peoria was lighted by traditional metal halide luminaires (although lighting was different between the two sites) and was determined to serve a similar population base as the Leavenworth site. The two surveys allowed Walmart management to evaluate both lighting systems in terms of customer preference.
Overall, shoppers at both sites were reportedly satisfied by the amount of light provided by the parking lot lighting system, despite the fact that the LED system provides significantly lower illuminance than a traditional 1000W system. However, the Leavenworth site has a concrete parking surface while Peoria has an asphalt surface. Since the parking surface influences the perception of brightness, it is difficult to determine if customers actually liked the lower illuminance from the LED system or if the surface luminance of the two systems is similar and that is what the customers were responding to. At the very least, customers appear to accept the lower lighting levels of the LED system when used with concrete pavement.
Most customers admitted they had never thought about the parking lot lighting. However, when prompted, customers provided positive feedback about both lighting systems.
4.1

5.0 Discussion
During this demonstration, many elements of the lighting system required additional analyses. Some of the analyses are new because of the LEDs (lumen depreciation) while others (reflectance, deviations from designs) are typical regardless of the light source.
5.1 Owner Evaluation
Walmart considers the installation a success. The installation met their stringent cost-effectiveness requirements and allowed them to test LEDs in a major installation. Since the installation, Walmart has installed LED luminaires at sites in both Mexico and Puerto Rico, where the electricity rate is sufficiently higher than the U.S. national average and thus further favored the cost-effectiveness. However, domestically, Walmart management has not converted to LEDs across the board. Management is not entirely sold on the lower illuminance levels; partially because lower light levels are a deviation from Walmart practice and partially because neighboring retailers often light to a higher level. Finally, parking surface is a factor in management’s decision. In another installation with similar illuminance levels, but asphalt rather than concrete, management was not as satisfied. The lower reflectance of asphalt is probably one reason for management’s dissatisfaction. Concrete is typically 30 to 40 percent reflective and asphalt is less than 30 percent reflective.
5.2 Lighting Metrics
Energy savings is a central component of both GATEWAY demonstrations and the CBEA specification, but achieving sufficient illumination is also of primary concern. Measured illuminance levels varied enough from what was expected to warrant further analysis to identify the root of the differences.
Illuminance is the amount of light falling on a surface and is easy to measure, but does not precisely correlate to what the eye sees. Exitance is the light subsequently reflected off the surface. But it is the intensity of light directed back toward the eye per unit of apparent luminous area, or luminance that is important for vision. The accurate measurement of luminance becomes complicated by the point of view (via either the person or the meter), the type of material (color and texture), the location of the light source, and the type of light source.
Walmart’s contractor chose concrete rather than asphalt at this site. Typical concrete has a higher reflectance value than asphalt, along with a smoother, more reflective texture. The higher reflectance values from concrete play as much of a role in the visibility and apparent brightness of the site as the lighting.
5.3 Cost Effectiveness
Considering the total LCCs for each of the three luminaire options, LEDs seem a more viable alternative to either of the PMH systems. The greater number of poles and fixtures needed for the 400W system along with its lower efficacy than the 1000W system results in the corresponding energy and maintenance savings being even more pronounced over the 10-year period examined.
5.1
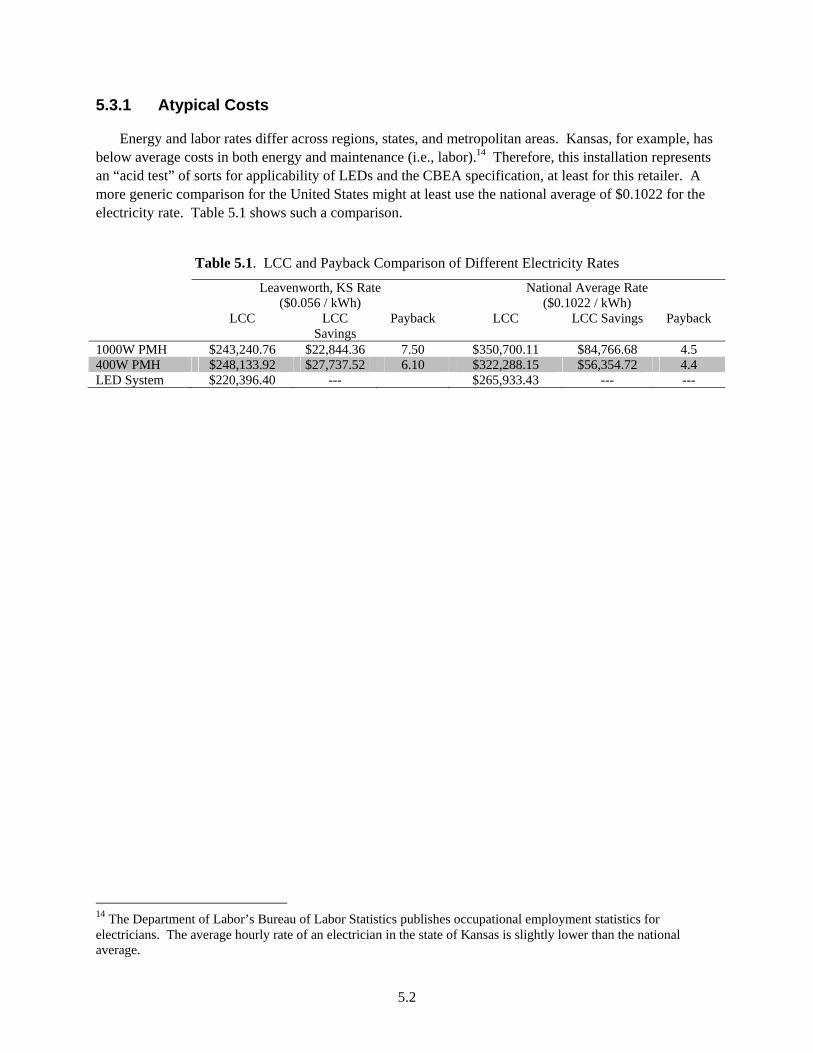
5.3.1 Atypical Costs
Energy and labor rates differ across regions, states, and metropolitan areas. Kansas, for example, has below average costs in both energy and maintenance (i.e., labor).14 Therefore, this installation represents an “acid test” of sorts for applicability of LEDs and the CBEA specification, at least for this retailer. A more generic comparison for the United States might at least use the national average of $0.1022 for the electricity rate. Table 5.1 shows such a comparison.
Table 5.1. LCC and Payback Comparison of Different Electricity Rates
Leavenworth, KS Rate National Average Rate ($0.056 / kWh) ($0.1022 / kWh)
LCC LCC Payback LCC LCC Savings Payback Savings
1000W PMH $243,240.76 $22,844.36 7.50 $350,700.11 $84,766.68 4.5 400W PMH $248,133.92 $27,737.52 6.10 $322,288.15 $56,354.72 4.4 LED System $220,396.40 --- $265,933.43 --- ---
14 The Department of Labor’s Bureau of Labor Statistics publishes occupational employment statistics for electricians. The average hourly rate of an electrician in the state of Kansas is slightly lower than the national average.
5.2

6.0 Conclusions
This demonstration involved two different activities supported by the DOE: the Commercial Building Energy Alliances and the SSL Technology GATEWAY Demonstration Program. Each program measures success differently, but both programs highlight information that is useful from a corporate standpoint.
6.1 Lighting Power Density
The CBEA specification specifies different factors to ensure energy efficient, well-lighted parking areas, but the most pertinent factor to this study is its LPD maximum limit of 0.06 watts per square foot. A typical Walmart Superstore site using 1000W luminaires would draw on the order of 0.10 watts per square foot. The alternate baseline design using 400W PMH luminaires draws 0.07 watts per square foot, almost meeting the CBEA specification. Nevertheless, neither the 1000W PMH system nor the 400W PMH system met the LPD requirements at this site, and thus were not strictly viable options for meeting the specification. The installed LED system draws about 0.04 watts per square foot, and was thus the only design of the three that satisfied the requirement.
6.2 Lower Illuminance
Illuminance was reduced by half to three-quarters of the standard 1000W design levels, bringing them much closer to RP-20 recommendations. Although this approach saves both energy and cost (particularly with LED luminaires), Walmart management has expressed concern about replicating the lower illuminance of the Leavenworth site at other sites. Lighting perception is affected by ambient conditions, and other sites may be located in more densely populated areas with more surrounding light, making the parking lot appear dim by comparison. In addition, other sites may use asphalt rather than concrete and lose some of the reflective benefit achieved in the Leavenworth location. Such concerns will only be alleviated by successfully demonstrating LED products in one or more relevant locations (see “Other Sites” below). There was no indication in this location that customers perceived the parking lot as dim, unsafe, or otherwise insufficiently illuminated.
The Portland Cement Association did a study on the influence of pavement reflectance on lighting for parking lots and found concrete to have a higher luminance than asphalt. (PCA 2005) The higher luminance resulted from concrete absorbing less light and that concrete is generally more diffuse than asphalt. Diffuse reflectance means that a point reflecting light is luminous from more viewing angles.
6.3 Other sites
Since the Leavenworth installation, Walmart has completed another site using the CBEA specification, and has more sites under construction and the design stage that all use LED luminaires. Walmart and other sites can expect to find projects more cost-effective where the electricity rate is either at or greater than the national average. Additional experience with lighting the parking lots using LED luminaires will provide more information on the effectiveness of the CBEA specification, and on whether Walmart wishes to continue using it at other sites. Walmart’s adoption of the specification corporate-wide would be a significant milestone that would encourage many others to follow suit.
6.1

6.4 GATEWAY Requirements
The GATEWAY program has three goals for demonstrations: (1) saving energy, (2) matching or improving illumination, and (3) being cost-effective relative to the incumbent or other competing technology. The LED system by far uses the least energy of the three systems considered, though as discussed it also produces the lowest average illuminance. At the same time, the LED system produced slightly more uniform illumination, no small feat given that both the 400W and 1000W PMH systems are relatively uniform themselves.
The LED system matched the 400W system in terms of minimum illuminance, though neither system matched the minimum illuminance of 1.7 fc that the 1000W PMH system provides. However, this minimum illuminance value is 8.5 times greater than recommended in RP-20-98, while the maximum illuminance values of the 1000W system are 41 times the recommended values. A significant energy savings can be accomplished by simply reducing the illumination requirements from the outset, as was done in this location, to more closely match IES recommendations. In lieu of high lighting levels, sites might consider alternatives, such as more reflective parking surfaces, use of contrast, and use of conspicuity to highlight elements, to increase perceived brightness.
The simple payback for this LED installation is 7.5 years when compared against the 1000W PMH system and 6.1 years when compared against the 400W PMH system. This may still be a longer payback than many retailers prefer, though as noted this site has atypically low electricity and labor costs. The LED system elements with the greatest influence on payback are the additional luminaires and poles needed to light the site.
The initial cost of the LED luminaires can be expected to continue to decrease, while luminaires with a greater lumen package and possibly different distributions may further reduce some of these initial costs. Over the 10-year analysis period, the LED system already achieves the lowest LCC of the three systems considered.
6.2

7.0 References
ANSI/ASHRAE/IES Standard 90.1. Energy Standard for Buildings Except Low-Rise Residential Buildings. American Society of Heating, Refrigerating and Air-Conditioning Engineers, Atlanta, GA.
CBEA – U.S. Department of Energy Commercial Building Energy Alliance. 2010. CBEA LED Site Lighting Performance Specification, Version 1.2. Washington, DC. Accessed April 28, 2011 at http://apps1.eere.energy.gov/buildings/publications/pdfs/alliances/led_site_lighting_spec_06_09.pdf
CCR - California Code of Regulations, Title 24. California Building Standards Code. State of California Office of Administrative Law, Sacramento, CA.
EERE – U.S. Department of Energy, Office of Energy Efficiency and Renewable Energy. 2009. LED Site Lighting in the Commercial Building Sector: Opportunities, Challenges, and the CBEA Performance Specification. Available at http://www1.eere.energy.gov/buildings/ssl/led_site-lighting_webinar.html (last updated July 1, 2009).
EERE – U.S. Department of Energy, Office of Energy Efficiency and Renewable Energy. 2011. LED Site (Parking Lot) Lighting Technology Specification. Last accessed on April 15, 2011 at http://www1.eere.energy.gov/buildings/alliances/parking_lot_lighting.html (last updated March 10, 2011).
EIA – U.S. Department of Energy, Energy Information Administration. 2011. Average Retail Price of Electricity to Ultimate Customers by End-Use Sector, by State. Last accessed April 15, 2011 at http://www.eia.doe.gov/cneaf/electricity/epm/table5_6_a.html (undated webpage).
ICC – International Code Council. 2009. 2009 International Energy Conservation Code. Washington, D.C.
IES LM-79-08. Electrical and Photometric Measurements of Solid-State Lighting Products. Illuminating Engineering Society of North America, New York, NY.
IESNA DG-13-98. Selection of Photocontrols for Outdoor Lighting Applications. Illuminating Engineering Society of North America, New York, NY.
IESNA RP-20-98. Lighting for Parking Facilities. Illuminating Engineering Society of North America, New York, NY.
PCA – Portland Cement Association. 2005. Influence of Pavement Reflectance on Lighting for Parking Lots. Skokie, IL.
7.1