comparison of light emitting diode and high … · comparison of light emitting diode and high...
TRANSCRIPT

LED vs HPS Comparison Report – McGill University – March 6th 2011 Page 1
Comparison of Light Emitting Diode and High Pressure Sodium Light Treatment
for Hydroponics Growth of Boston Lettuce
Final Report
By:
Mark Lefsrud Vincent Martineau Philippe Lefebvre
McGill University MacDonald Campus
Bioresource Engineering Department Date: March 6th 2011

LED vs HPS Comparison Report – McGill University – March 6th 2011 Page 2
Table of Content Table of Content ................................................................................................................. 2 Abstract ............................................................................................................................... 4 Goal..................................................................................................................................... 5 Materials and Methods........................................................................................................ 5
-Plant Culture .................................................................................................................. 5
-Experimental Design ..................................................................................................... 5
-Measurement ................................................................................................................. 5
-Harvest Method ............................................................................................................. 6
-Test Installation ............................................................................................................. 6
-Summary........................................................................................................................ 7
Results................................................................................................................................. 8 Data ................................................................................................................................... 11
Light Maps .................................................................................................................... 11
Overall Mass Comparisons ........................................................................................... 15
Power consumption........................................................................................................... 21 Discussion......................................................................................................................... 22 Observation....................................................................................................................... 23 Conclusion ........................................................................................................................ 25 Annex A............................................................................................................................ 26
-Data Tables for plant mass .......................................................................................... 26
Annex B ............................................................................................................................ 34 -Weather Data Tables – 1st replication.......................................................................... 34
-Weather Data Tables – 2nd replication......................................................................... 40
Annex C ............................................................................................................................ 46 -Weather data charts - Replication #1 – temperature charts ......................................... 46
-Weather data charts - Replication #2 – temperature charts ......................................... 52
Annex D............................................................................................................................ 58 -Weather data charts - Replication #1 – radiation charts.............................................. 58
-Weather data charts - Replication #2 – radiation charts.............................................. 64
Annex E ............................................................................................................................ 70 -Statistically significant (p>0.05) aspects and interactions........................................... 70
Annex F............................................................................................................................. 72 -Curve fits for wet plant growth cycle .......................................................................... 72
Annex G............................................................................................................................ 80 -Tables of wet and dry ratio of plant mass versus irradiation....................................... 80

LED vs HPS Comparison Report – McGill University – March 6th 2011 Page 3
Annex H............................................................................................................................ 82 -Setup in tank 38 at Hydroserre Mirabel....................................................................... 82
-Plot setup ................................................................................................................. 82 -Screen location between tank 37, 38 and 39 ........................................................... 83 -LED lighting plan .................................................................................................... 84 -HPS lighting plan..................................................................................................... 85 -Irradiance Planned by light treatment...................................................................... 86
Annex I.............................................................................................................................. 87 -Greenhouse setup......................................................................................................... 87
-Automated instruction ................................................................................................. 89
Annex J ............................................................................................................................. 90 -Power consumption measures and methods ................................................................ 90
-Tableau des lectures électriques pour lampes HPS ..................................................... 91
-Tableau des lecture des lampes LED (TI SmartLamp SL-600) .................................. 91
Annex K............................................................................................................................ 92 -Random harvesting method ......................................................................................... 92
Annex L ............................................................................................................................ 93 -Originally planned artificial light program.................................................................. 93
Annex M SamrtLamp.................................................................................................... 94 Presentation of the SmartLamp..................................................................................... 94
Technical specification ................................................................................................. 95
Reliability...................................................................................................................... 96
Extract from design review report from Hardent (2008) .......................................... 96 SmartLamp Design ................................................................................................... 98 Lamp Calibration Report ........................................................................................ 100
HPS vs SmartLamp spectrum comparison ................................................................. 105
Annexe O ........................................................................................................................ 106 -Bilan énergétique pour les serres Hydroserre Mirabel .............................................. 106
-Installation actuelle chez Hydroserre Mirabel....................................................... 106 -Remplacement avec lampes DEL chez Hydroserre Mirabel avec une densité similaire
à l’expérimentation ..................................................................................................... 107
Annexe P......................................................................................................................... 108 -Article of interrest...................................................................................................... 108
-Quantification of the Growth Response to Light Quantity of Greenhouse Grown Crops ....................................................................................................................... 108
-Optimization of Lighting Spectrum for Photosynthetic System and Productivity of
Lettuce by Using Light-emitting Diodes .................................................................... 114

LED vs HPS Comparison Report – McGill University – March 6th 2011 Page 4
Abstract Recent developments in Light Emitting Diode (LED) technology have brought the
required irradiance to a suitable level for being considered a replacement to traditional
High Pressure Sodium (HPS) lamps in hydroponics growth environments. We have
compared the effects of LED lamps made by LED Innovation Design against HPS lamps
used at HydroSerre Mirabel for the growth of Boston lettuce. The light treatments were
applied for eight and a half hours after sunset to extend the photoperiod to eighteen hours.
Wet and dry masses of plants and roots were weighed during the course of the
experiment on a weekly basis. On average, optimum HPS light treatment produced
similar masses compared to optimum LED light treatment even though the LED lamps
provided roughly half the amount of moles of light per meter2 compared to the HPS
lamps at final harvest time (average total light irradiance of 71.3 moles/m2 for HPS and
35.8 moles/m2 for LED over the four weeks of each run). There was no statistical
difference between LED and HPS optimum light treatments, regular HPS greenhouse
levels and control (no supplemental light) treatment for both wet and dry masses.
However, LED light treatments showed improved homogeneity of plant mass across the
entire area while HPS light treatment showed potential for slightly higher production in
limited areas. Dry ratios of plant mass (in grams) by artificial irradiation (in moles per
plant) normalized by the percentage of supplemental light versus total light were of 0.54g
/mol/plant and 0.0.35 g/mol/plant for both HPS experimental replication and of 0.59
g/mol/plant and 0.26 g/mol/plant for both LED experimental replication. This indicates
that while there is an intensity difference between both light treatments, plant mass
production remained similar.

LED vs HPS Comparison Report – McGill University – March 6th 2011 Page 5
Goal Determine if LED lamps can be as effective as HPS lamps for growth of Boston Head
lettuce in a hydroponics greenhouse.
Materials and Methods
Plant Culture
The Boston head lettuce was provided by Hydroserre Mirabel.
Experimental Design
The experimental design was a randomized complete block with sub blocks consisting of
four light treatment (HPS, LED, Regular greenhouse HPS level, no supplemental
artificial light Control) with two replications for HPS and LED light treatments. Sub
blocks were randomly assigned at the beginning of both experimental replications.
A total of ten plants were randomly harvested from each treatment sub block at four
different times during the experiment (day 7, 14, 21, 28). Plants were randomly selected
from each treatment and replication but the first three rows of plants on the edge were
excluded to remove the edge effect. Sixty plants were harvested during each harvest time
across all treatments.
Measurement
Three light maps based on equally spaced grids of treatment areas consisting of six by six
sample points were measured with a light sensor to provide photosynthetically active
radiation (PAR) measurements. The light maps were completed at the beginning of the

LED vs HPS Comparison Report – McGill University – March 6th 2011 Page 6
first experimental replication, at the beginning of the second replication and at the end of
the second replication. These light maps were done after sunset and at canopy level.
The photoperiod was maintained constant with sixteen hours of light and eight hours of
darkness per day. Irradiance was measured with pyranometers (Hobo, Bourne, Ma, S-
LIB-003) and quantum sensors (Hobo, Bourne, Ma, S-LIA-003) connected to data
loggers (Hobo, Bourne, Ma, U30 remote monitoring system) which logged the data for
every minute during the entire experimental replication. Data loggers were installed on
each sub block with a redundant quantum sensor per data logger. These sensors were
placed randomly on the sub block and were mounted at leaf canopy level.
Additional temperature (Hobo, Bourne, Ma, S-TMB-002) and relative humidity (Hobo,
Bourne, Ma, S-THB-008) sensors logged the surface temperature, air temperature and
relative humidity on all blocks and the water temperature was measured at the control
block.
Harvest Method
Lettuce plants were cultured and germinated according to HydroSerre Mirabel. After the
initial transplant in the experimental block, plants were grown under light treatments for
approximately 30 days. At sampling time, mass of fresh individual plant and sum of ten
plant roots were measured.
Plant and root tissues were then individually labelled, transported and dried at
MacDonald Campus McGill University according to the ASABE standard (2007).
Drying temperature was between 80 and 95 degrees Celsius and duration of drying was
no less than 72 hours, until stable mass was attained. Plant tissues were weighed again
following the fresh mass weighting procedure.
Test Installation
Spacing between experimental areas was at least twenty-eight feet with no artificial
lighting used in those buffer spaces. No experimental area was within twenty-eight feet

LED vs HPS Comparison Report – McGill University – March 6th 2011 Page 7
of the end of the pool. Neighbouring light pollution was limited by using shading cloths
on the sides of the experimental bays.
Sensors were calibrated and tested before being installed in the experimental area.
Summary
Continuous measurement (1 minute interval) of each sub block
2 quantum sensors
1 pyranometer
1 air temperature
1 relative humidity
1 surface temperature
1 water temperature (only for control sub block)
Periodic measurement
3 Light maps (beginning of each replication, end of second replication)
Plant harvest
60 plants per week, 4 weeks per experimental replication, 2 replications

LED vs HPS Comparison Report – McGill University – March 6th 2011 Page 8
Results The first experimental replication produced higher amounts of plant mass than the second
replication. As shown in table A4, the high pressure sodium (HPS) light treatment during
the first replication produced wet masses of 173.9g (std. dev. 28.8g) for the first zone and
150.2g (std. dev. 24.3g) for the second zone at the end of the fourth week. For the same
sample point, dry masses are at 9.0g (std. dev. 1.1g) and 6.3g (std. dev. 1.4g),
respectively.
The light emitting diode (LED) light treatment during the first replication produced wet
masses of 135.3g (std. dev. 25.2g) for the first zone and 138.4g (std. dev. 18.2g) for the
second zone at the end of the fourth week. For the same sample point, dry masses are at
7.6g (std. dev. 2.9g) and 7.6g (std. dev. 1.9g), respectively.
The HPS light treatment at regular greenhouse levels, for the first replication and wet
masses, produced 127.3g (std. dev. 16.5g) and dry masses of 7.1g (std. dev. 2.0g).
Plants subjected to no supplemental artificial lighting (Control) during the first
replication at the fourth week produced 118g (std. dev. 10.6g) for wet masses and 6.1g
(std. dev. 1.6g) for dry masses.
As shown in table A8, the high pressure sodium (HPS) light treatment during the second
replication produced wet masses of 66.0g (std. dev. 17.8g) for the first zone and 67.1g
(std. dev. 23.4g) for the second zone at the end of the fourth week. For the same sample
point, dry masses are at 5.1g (std. dev. 0.8g) and 4.4g (std. dev. 0.8g), respectively.
The light emitting diode (LED) light treatment during the second replication produced
wet masses of 51.8g (std. dev. 10.1g) for the first zone and 51.8g (std. dev. 16.2g) for the
second zone at the end of the fourth week. For the same sample point, dry masses are at
4.1g (std. dev. 0.5g) and 4.0g (std. dev. 0.7g), respectively.

LED vs HPS Comparison Report – McGill University – March 6th 2011 Page 9
The HPS light treatment at regular greenhouse levels, for the second replication and wet
masses, produced 77.7g (std. dev. 9.8g) and dry masses of 4.3g (std. dev. 0.5g).
Plants subjected to no supplemental artificial lighting (Control) during the second
replication at the fourth week produced 46.5g (std. dev. 11.4g) for wet masses and 3.5g
(std. dev. 0.7g) for dry masses.
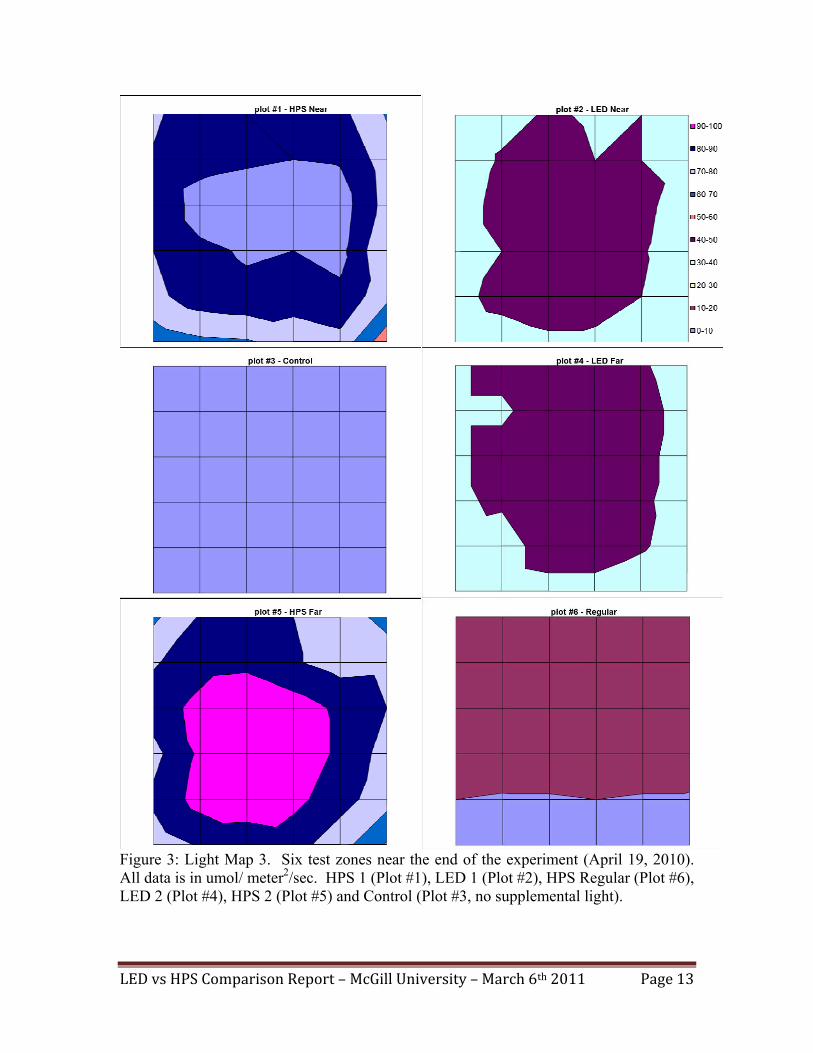
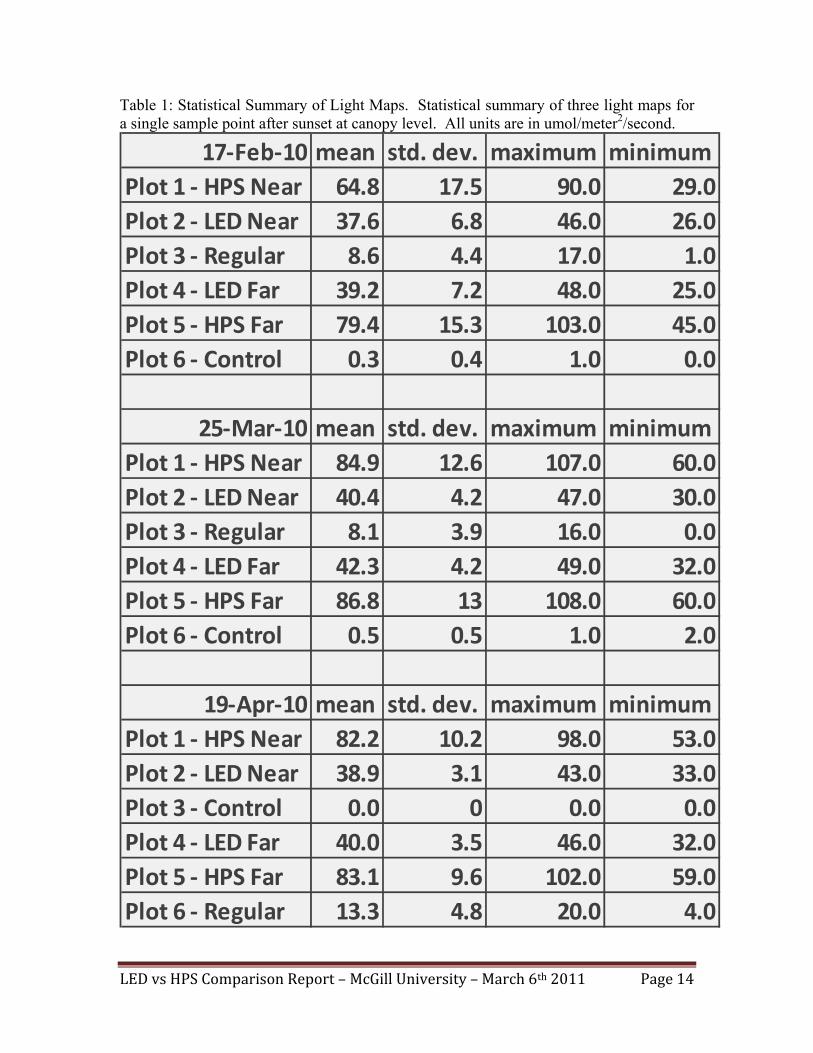
Table 1 shows that the various light maps measured before, during and after the
experimental replications are similar. The first light map performed on February 17th
shows differences in the HPS near compared to later readings. This measure may be
slightly off due to electrical problems.
Table 2 indicate that both LED and HPS light treatment achieved similar dry ratios of 0.2
g/mol/m2 for the first replication and 0.1 g/mol/m2 for the second experimental
replication.
Table 3 is similar to table 2 but is dependent on plant instead of area. Therefore, the
results are similar with dry ratios of 0.54 g/mol/plant for HPS and 0.59 g/mol/plant for
LED for the first experimental replication. Dry ratios are also similar for the second
replication with values of 0.35 g/mol/plant for HPS and 0.26 g/mol/plant for LED light
treatment.
Table 4 shows that the modified dry ratio, which accounts for the mass produced in
excess of the control mass, is slightly higher for LED (0.05 g/mol/m2) than for HPS (0.02
g/mol/m2) for the first run while the opposite is true for the second experimental
replication with values of 0.01 g/mol/m2 for LED and 0.02 g/mol/m2 for HPS light
treatment.
Table 5 shows similar modified ratios based on plants. The dry ratios for LED (1.17
g/mol/plant) and for HPS (0.51 g/mol/plant) show an advantage during the first run while
the opposite situation holds for the second experimental replication with values of 0.35

LED vs HPS Comparison Report – McGill University – March 6th 2011 Page 10
g/mol/plant for LED and 0.44 g/mol/plant for HPS light treatment. Regular light
treatment yielded the highest ratio for both experimental replication with 1.95 g/mol/plant
and 1.56 g/mol/plant, respectively.
Statistical analysis was completed on the light maps (figure 1,2 and 3) and statistical
significance was found between light treatments, light by time and light by time by
replication. This indicates that there was in fact a difference between all the light
treatments.
Similarly, statistical analysis was completed on plant mass data. The wet masses showed
a run by week interaction while the dry masses had a statistically significant change
between each week. This means that the plants were growing from week to week in a
statistically significant way. Root masses followed the trends of the leaf masses for all
replications and no statistical significance was measured. Further analysis were
performed on subsets of the mass and light maps data and can be found in annex E and
annex F.
Annex E contains the list of statistically significant interactions for wet and dry masses,
separated by light treatments, weeks and replications followed by light treatments. Most
of the interactions by individual light treatments are between weeks, which indicate that
light treatment replications were statistically similar. Annex F contains plots of plant
growth for each light treatments and replications with a quadratic curve fit. This section
also contains tables of the parameters of the quadratic equation with the form “constant +
B1 * X + B2 * X2”. All of the curve fits have R2 values between 0.797 and 0.975.

LED vs HPS Comparison Report – McGill University – March 6th 2011 Page 11
Data
Light Maps
Figure 1: Light Map 1. Six test zones at the beginning of the experiment (February 17, 2010). All data is in umol/ meter2/sec. HPS 1 (Plot #1), LED 1 (Plot #2), HPS Regular (Plot #3), LED 2 (Plot #4), HPS 2 (Plot #5) and Control (Plot #6, no supplemental light).

LED vs HPS Comparison Report – McGill University – March 6th 2011 Page 12
Figure 2: Light Map 2. Six test zones in between replications of the experiment (March 25th, 2010). All data is in umol/ meter2/sec. HPS 1 (Plot #1), LED 1 (Plot #2), HPS Regular (Plot #3), LED 2 (Plot #4), HPS 2 (Plot #5) and Control (Plot #6, no supplemental light).
LED vs HPS Comparison Report – McGill University – March 6th 2011 Page 13
Figure 3: Light Map 3. Six test zones near the end of the experiment (April 19, 2010). All data is in umol/ meter2/sec. HPS 1 (Plot #1), LED 1 (Plot #2), HPS Regular (Plot #6), LED 2 (Plot #4), HPS 2 (Plot #5) and Control (Plot #3, no supplemental light).
LED vs HPS Comparison Report – McGill University – March 6th 2011 Page 14
Table 1: Statistical Summary of Light Maps. Statistical summary of three light maps for a single sample point after sunset at canopy level. All units are in umol/meter2/second.
17‐Feb‐10 mean std. dev. maximum minimumPlot 1 ‐ HPS Near 64.8 17.5 90.0 29.0Plot 2 ‐ LED Near 37.6 6.8 46.0 26.0Plot 3 ‐ Regular 8.6 4.4 17.0 1.0Plot 4 ‐ LED Far 39.2 7.2 48.0 25.0Plot 5 ‐ HPS Far 79.4 15.3 103.0 45.0Plot 6 ‐ Control 0.3 0.4 1.0 0.0
25‐Mar‐10 mean std. dev. maximum minimumPlot 1 ‐ HPS Near 84.9 12.6 107.0 60.0Plot 2 ‐ LED Near 40.4 4.2 47.0 30.0Plot 3 ‐ Regular 8.1 3.9 16.0 0.0Plot 4 ‐ LED Far 42.3 4.2 49.0 32.0Plot 5 ‐ HPS Far 86.8 13 108.0 60.0Plot 6 ‐ Control 0.5 0.5 1.0 2.0
19‐Apr‐10 mean std. dev. maximum minimumPlot 1 ‐ HPS Near 82.2 10.2 98.0 53.0Plot 2 ‐ LED Near 38.9 3.1 43.0 33.0Plot 3 ‐ Control 0.0 0 0.0 0.0Plot 4 ‐ LED Far 40.0 3.5 46.0 32.0Plot 5 ‐ HPS Far 83.1 9.6 102.0 59.0Plot 6 ‐ Regular 13.3 4.8 20.0 4.0

LED vs HPS Comparison Report – McGill University – March 6th 2011 Page 15
Overall Mass Comparisons
Figure 4: Overall Mean Wet Mass Comparison. Mean wet mass with standard deviation for six light treatments over four weeks with two replications (top and bottom figures). Data tables used to create this graph are available in annex. A. HPS – High pressure sodium; LED – light emitting diode; R1 – regular greenhouse HPS levels; CTRL – control: no supplemental artificial lighting.
B.
A.

LED vs HPS Comparison Report – McGill University – March 6th 2011 Page 16
Figure 5: Overall Mean Dry Mass Comparison. Mean dry mass with standard deviation for six light treatments over four weeks with two replications (top and bottom figures). Data tables used to create this graph are available in annex. HPS – High pressure sodium; LED – light emitting diode; R1 – regular greenhouse HPS levels; CTRL – control: no supplemental artificial lighting.
A.
B.

LED vs HPS Comparison Report – McGill University – March 6th 2011 Page 17
Table 2: Normalized Ratio of Plant Mass versus Artificial Light per meter2. Wet and dry plant mass in grams versus artificial light in moles per meter2; normalized by percentage of supplemental light versus total light. Supplemental light only wet ratio per percent dry ratio per percent supl light/total light
percentageHPS near ‐ run 1 0.52 0.03 22.7%HPS far ‐ run 1 0.42 0.02 19.6%HPS average ‐ run 1 0.47 0.02 21.1%
HPS near ‐ run 2 0.24 0.02 21.7%HPS far ‐ run 2 0.17 0.01 20.1%HPS average ‐ run 2 0.20 0.01 20.9%
LED near ‐ run 1 0.51 0.03 10.9%LED far ‐ run 1 0.39 0.02 10.7%LED average ‐ run 1 0.45 0.02 10.8%
LED near ‐ run 2 0.15 0.01 11.6%LED far ‐ run 2 0.14 0.01 12.0%LED average ‐ run 2 0.14 0.01 11.8%
Regular ‐ run 1 0.48 0.03 4.8%Regular ‐ run 2 0.25 0.01 4.2%
Control ‐ run 1 0.36 0.02 0.3%Control ‐ run 2 0.13 0.01 1.1%
(grams/moles of light/m2)*percent of total light

LED vs HPS Comparison Report – McGill University – March 6th 2011 Page 18
Table 3: Normalized Ratio of Plant Mass versus Artificial Light per plant. Wet and dry plant mass in grams versus artificial light in moles per plant; normalized by percentage of supplemental light versus total light. Supplemental light only wet ratio per percent dry ratio per percent supl light/total light
percentageHPS near ‐ run 1 12.69 0.65 22.7%HPS far ‐ run 1 10.18 0.43 19.6%HPS average ‐ run 1 11.41 0.54 21.1%
HPS near ‐ run 2 5.93 0.45 21.7%HPS far ‐ run 2 4.02 0.26 20.1%HPS average ‐ run 2 4.95 0.35 20.9%
LED near ‐ run 1 12.42 0.68 10.9%LED far ‐ run 1 9.53 0.49 10.7%LED average ‐ run 1 10.96 0.59 10.8%
LED near ‐ run 2 3.58 0.28 11.6%LED far ‐ run 2 3.32 0.25 12.0%LED average ‐ run 2 3.45 0.26 11.8%
Regular ‐ run 1 11.56 0.65 4.8%Regular ‐ run 2 6.13 0.34 4.2%
Control ‐ run 1 8.74 0.45 0.3%Control ‐ run 2 3.04 0.23 1.1%
(grams/moles of light/plant)*percent of total light

LED vs HPS Comparison Report – McGill University – March 6th 2011 Page 19
Table 4: Ratio of Plant Mass minus Control Plant Mass by Artificial Light per Area. Wet and dry modified plant mass (average plant mass minus control plant mass, in grams) divided by irradiation per area (in moles/m2).
Suppl. Light Only Modified Wet ratio Modified Dry ratiograms/moles/m2 grams/moles/m2
Average HPS run 1 0.61 0.02Average HPS run 2 0.29 0.02
Average LED run 1 0.61 0.05Average LED run 2 0.13 0.01
Regular run 1 0.74 0.08Regular run 2 2.41 0.06
(Average Plant Mass ‐ Control Mass) / Irradiation Per Area
Table 5: Ratio of Plant Mass minus Control Plant Mass by Artificial Light per Plant. Wet and dry modified plant mass (average plant mass minus control plant mass, in grams) divided by irradiation per plant (in moles/plant).
Suppl. Light Only Modified Wet ratio Modified Dry ratiograms/moles/plant grams/moles/plant
Average HPS run 1 14.70 0.51Average HPS run 2 6.93 0.44
Average LED run 1 14.85 1.17Average LED run 2 3.14 0.35
Regular run 1 17.82 1.95Regular run 2 58.48 1.56
(Average Plant Mass ‐ Control Mass) / Irradiation Per Plant

LED vs HPS Comparison Report – McGill University – March 6th 2011 Page 20
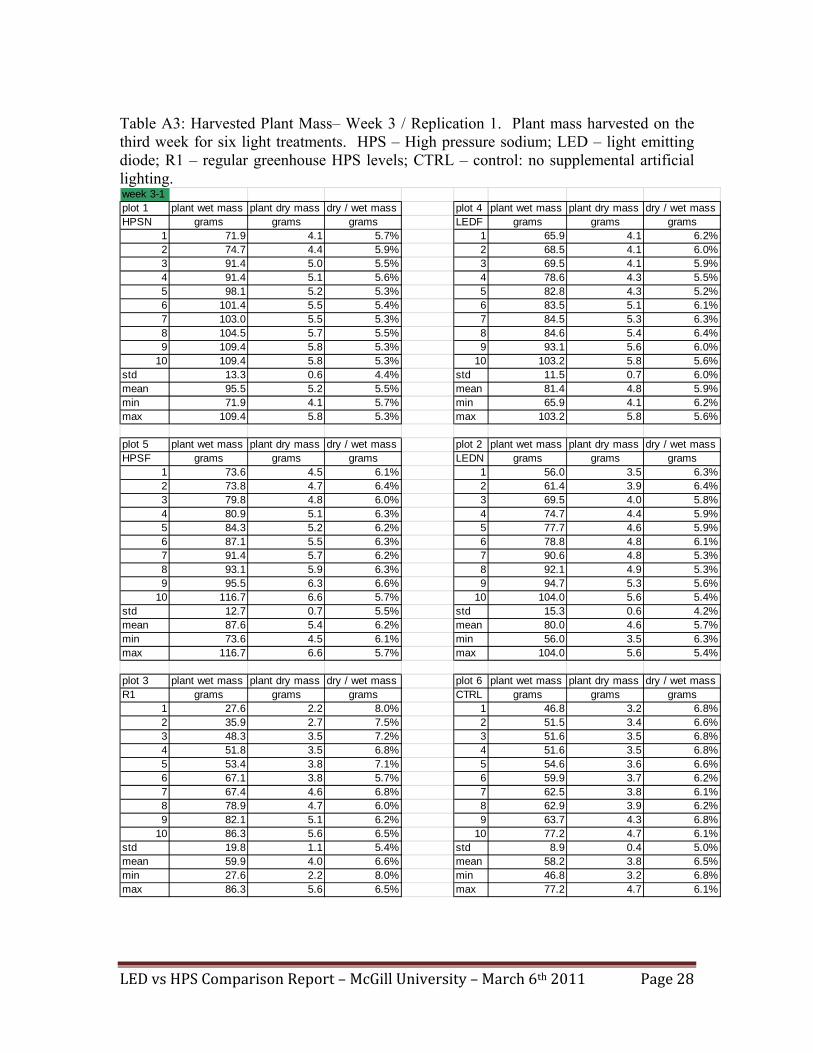
Table 6: Comparison Between Week 3 – Replication 1 And Week 4 – Replication 2. Comparison of wet and dry masses between two similar sampling points; typical of the final harvesting day. All masses in grams.
Week 3 ‐ Rep 1 HPS Near LED Near Regular LED Far HPS Far ControlMean 95.5 80.0 59.9 81.4 87.6 58.2Std. Dev. 13.3 15.3 19.8 11.5 12.7 8.9Maximum 109.4 104.0 86.3 103.2 116.7 77.2Minimum 71.9 56.0 27.6 65.9 73.6 46.8Week 4 ‐ Rep 2 HPS Near LED Near Regular LED Far HPS Far ControlMean 66.0 51.6 77.7 51.8 67.1 46.5Std. Dev. 17.8 16.2 9.8 10.1 23.4 11.1Maximum 105.0 84.9 92.5 68.5 104.8 64.8Minimum 42.8 34.0 66.8 39.2 38.7 32.7
Week 3 ‐ Rep 1 HPS Near LED Near Regular LED Far HPS Far ControlMean 5.1 4.0 4.3 4.1 4.4 3.5Std. Dev. 0.8 0.7 0.5 0.5 0.8 0.7Maximum 6.8 5.1 5.4 5.1 5.7 4.3Minimum 4.0 2.9 3.7 3.3 3.6 2.1Week 4 ‐ Rep 2 HPS Near LED Near Regular LED Far HPS Far ControlMean 5.2 4.6 4.0 4.8 5.4 3.8Std. Dev. 0.6 0.6 1.1 0.7 0.7 0.4Maximum 5.8 5.6 5.6 5.8 6.6 4.7Minimum 4.1 3.5 2.2 4.1 4.5 3.2
Dry Mass (grams)
Wet Mass (grams)

LED vs HPS Comparison Report – McGill University – March 6th 2011 Page 21
Power consumption In designing the experimental setup, the lighting plan with the LED lamps has been
developed to provide a minimum of 10% of artificial lighting as evenly as possible across
the plots. Holding accurate data on light dispersion, it was determined that an amount of
24 LED lamps were required. While according to data available for HPS lamps it was
determined that 18 lights were needed. Table 7 summarizes the average consumption for
each lamp, total consumption per plot and the consumption per square meter. Whereas
production of both treatments were statistically identical, and according to the
experimental setup completed, the LED lamps provide energy savings of at least 33.8%.
Table 8 shows that one Watt of LED light produced by mètre2 0.019 g of dry matter
whereas one watt of HPS light produced by metre2 0.013 g of dry matter.
Table 7: Power Consumption from LED and HPS lamps.
Power
consumption
per unit
Number
of lamps
per plot
Power
consumption per
plot
Power
consumption
Power savings
compared to
HPS
Units Watts # Watts W/m2 %
LED 319 24 7656 81.8 33.8%
HPS 642 18 11556 123.5 0.0%
Regular HPS 642 4 2568 27.4 22.2%
Control 0 0 0 0.0 N/A
Table 8: Dry Matter versus Power Consumption
Power Consumption Average Dry Mass Average Dry Mass per Power Consumption
Unit W/m2 g/m2 g/W/m2
LED 81.8 114.8 0.019 HPS 123.5 151.4 0.013
Regular HPS 27.4 138.1 0.054 Control 0.0 116.3 N/A

LED vs HPS Comparison Report – McGill University – March 6th 2011 Page 22
Discussion Both figures 4 and 5 show similar results as for the homogeneity of the light treatment
replications. While overall plant mass production differs, both sets of replication show
LED treatments very similar. HPS light treatment is farther apart during the fourth week
of the first trial. This is slightly different from the grouped results seen in the second
trial. It is arguable that the second trial seems about ten days late on the first trial.
Therefore, comparing the third week of the first trial with the fourth week of the second
trial seems to indicate that HPS light treatment replications are also similar. Further
statistical analysis of those two weeks shows no statistical differences between them.
The relevant masses are presented in table 6.
The regular treatment seems to pull ahead in the wet mass comparison but it is similar to
both HPS and LED results in the dry mass comparison. This could be due to a number of
factors which include randomness of selection of individual plants and slightly more
advantageous environmental conditions for the sampled plants. In fact, a partial shading
mechanism (shade cloth) was employed to reduce the incoming solar radiation during
peak hours and this could have affected narrow strips of plants and created a very
localized effect.
Figure 5 shows a larger difference between average dry masses for HPS light treatments
than for LED light treatments. This effect is seen in both experimental replications. This
seems to indicate that while HPS light treatment has the potential to produce higher
amounts of plant mass, it can also increase the variability in production. Several factors
may come into play. HPS Near, first replication, had slightly more elevated temperatures
and less humidity than HPS Far, second replication. Also, second replication was
subjected to freezing air temperatures during at least one sample point.
One of the impacts of HPS light on the plant is a localized hot spot. This can be
potentially harmful to the plants because temperature can rise and heat damage can be
caused. While on the subject of heat damage, it seems that surface temperatures of up to
LED vs HPS Comparison Report – McGill University – March 6th 2011 Page 23
47 degrees Celsius were reached on the LED plots during the second trial. In fact, the
average LED surface temperatures were higher than the average HPS surface
temperatures for the second replication during the hours when the LED lamps were not
operational. It is important to note that this issue was not as critical during the first
experimental replication. It is somewhat difficult to determine if this was due to fan
placement, sensor placement, physical location on the test plots or a combination of those
factors compounded by the stronger sun impact in the month of March compared to the
month of February.
Table 2, 3, 4, 5 and Annex G show the impact of artificial light on plant mass. HPS light
treatment gives twice as much light than LED light treatment for equivalent produced
mass, which results in a lower ratio as seen in Annex G. When normalized with the ratio
of artificial light versus total light, to show the actual impact of artificial light on plant
mass (table 2 and 3), LED and HPS light treatments have a similar impact on plant dry
matter production. However, it is also shown that the regular light schedule is the highest
ratio, indicating that large amounts of supplemental light from both HPS and LED light
treatments are not required to obtain the best production of plant mass per light input.
Table 4 and 5 are slightly different than the other tables because they take into account
only the difference in plant mass between light treatments and control versus the
supplemental light. This methodology shows slightly different results, mainly that the
average of LED light treatments is slightly ahead on the first run but twice as low on the
second run when compared to the average of HPS light treatments.
Observation At the start of the second replication, visible yellow spots occurred on the entire lettuce
population and stunted growth ensued for the rest of the experiment. There was a
technical issue with the refilling of the water tank that prevented proper nutrient balance
from being attained at the start of experimental replication two.

LED vs HPS Comparison Report – McGill University – March 6th 2011 Page 24
We were also informed that a controller unit closed the lights for the entire experiment
area after a certain threshold of solar radiation was reached for three days in the first
replication. A similar cut-off also happened during the second replication for four
consecutive days. These two periods of no light may have had a similar impact on plant
growth and should therefore be have limited impact on the interpretation of data.

LED vs HPS Comparison Report – McGill University – March 6th 2011 Page 25
Conclusion This experiment can be interpreted in two ways. Firstly, if the grower wants to maximize
production of plant mass with little regards to initial costs, LED light treatment is a good
choice for high plant mass production versus low light level inputs, especially
considering the high homogeneity of the crop across the plot. Secondly, if the grower
wants to maximize profitability at the expense of maximal levels of production, it is
recommended to use limited supplemental light treatments based on transient weather
conditions. This choice should be based on economic factors such as initial investment
cost, return on investment and market conditions.
In conclusion, this experiment has shown that both HPS and LED light treatments have
the potential to produce adequate Boston lettuce. While HPS produces more moles of
light per time period when compared to LED lights, the impact on dry plant mass
production is very limited, yet still important. Clear gains can be made using some levels
of supplemental light to prolong the photoperiod of the plant. Therefore, varying levels
of additional light intensity can be explored to provide the best economic scenario with
little fluctuation expected in final plant mass productivity. This should be of particular
interest to producers subjected to tiered electrical costs based on time of the day or other
similar constraints.

LED vs HPS Comparison Report – McGill University – March 6th 2011 Page 26
Annex A
Data Tables for plant mass Table A1: Harvested Plant Mass– Week 1 / Replication 1. Plant mass harvested on the first week for six light treatments. HPS – High pressure sodium; LED – light emitting diode; R1 – regular greenhouse HPS levels; CTRL – control: no supplemental artificial lighting. week 1-1plot 1 plant wet mass plant dry mass root wet mass dry / wet mass plot 4 plant wet mass plant dry mass root wet mass dry / wet massHPSN grams grams grams grams LEDF grams grams grams grams
1 11.4 0.9 23.8 7.9% 1 8.2 0.7 19.3 8.5%2 11.7 0.9 24.6 7.7% 2 9.2 0.7 21.8 7.6%3 12.2 1.0 25.2 8.2% 3 9.6 0.8 22.7 8.3%4 12.3 1.0 25.6 8.1% 4 10.7 0.9 23.3 8.4%5 13.4 1.1 25.9 8.2% 5 11.9 1.0 23.4 8.4%6 13.9 1.1 26.5 7.9% 6 13.9 1.1 23.6 7.9%7 14.1 1.2 26.5 8.5% 7 14.6 1.1 25.0 7.5%8 14.3 1.2 27.0 8.4% 8 15.1 1.1 25.2 7.3%9 15.0 1.2 29.2 8.0% 9 16.0 1.2 25.3 7.5%
10 15.2 1.3 29.2 8.6% 10 20.1 1.6 26.8 8.0%std 1.4 0.1 1.8 10.0% std 3.7 0.3 2.1 7.3%mean 13.4 1.1 26.4 8.2% mean 12.9 1.0 23.6 7.9%min 11.4 0.9 23.8 7.9% min 8.2 0.7 19.3 8.5%max 15.2 1.3 29.2 8.6% max 20.1 1.6 26.8 8.0%
plot 5 plant wet mass plant dry mass root wet mass dry / wet mass plot 2 plant wet mass plant dry mass root wet mass dry / wet massHPSF grams grams grams grams LEDN grams grams grams grams
1 10.6 1.0 20.4 9.4% 1 13.0 0.9 22.3 6.9%2 10.6 1.0 22.3 9.4% 2 13.6 1.0 23.6 7.4%3 10.9 1.1 22.7 10.1% 3 13.7 1.1 24.7 8.0%4 12.4 1.1 24.0 8.9% 4 14.0 1.1 24.8 7.9%5 12.8 1.1 24.0 8.6% 5 14.5 1.1 25.8 7.6%6 13.2 1.1 24.2 8.3% 6 14.7 1.1 26.3 7.5%7 14.1 1.1 25.6 7.8% 7 16.5 1.2 27.2 7.3%8 14.3 1.2 25.7 8.4% 8 18.1 1.3 27.2 7.2%9 14.4 1.2 25.8 8.3% 9 19.6 1.5 27.5 7.7%
10 14.5 1.2 25.9 8.3% 10 21.5 1.6 30.0 7.4%std 1.6 0.1 1.8 4.6% std 2.9 0.2 2.2 7.5%mean 12.8 1.1 24.1 8.7% mean 15.9 1.2 25.9 7.5%min 10.6 1.0 20.4 9.4% min 13.0 0.9 22.3 6.9%max 14.5 1.2 25.9 8.3% max 21.5 1.6 30.0 7.4%
plot 3 plant wet mass plant dry mass root wet mass dry / wet mass plot 6 plant wet mass plant dry mass root wet mass dry / wet massR1 grams grams grams grams CTRL grams grams grams grams
1 12.9 0.9 21.9 7.0% 1 9.6 0.7 22.2 7.3%2 13.0 0.9 23.8 6.9% 2 9.8 0.7 22.3 7.1%3 13.0 1.0 24.3 7.7% 3 10.5 0.7 22.5 6.7%4 14.1 1.0 24.6 7.1% 4 10.9 0.8 22.5 7.3%5 14.4 1.1 24.7 7.6% 5 10.9 0.8 22.7 7.3%6 15.3 1.1 25.6 7.2% 6 11.0 0.8 23.2 7.3%7 16.2 1.2 26.5 7.4% 7 11.5 0.8 23.5 7.0%8 16.5 1.2 27.3 7.3% 8 11.6 0.9 23.8 7.8%9 17.8 1.2 27.3 6.7% 9 12.6 0.9 24.8 7.1%
10 20.7 1.6 27.6 7.7% 10 14.7 1.1 25.9 7.5%std 2.5 0.2 1.8 8.2% std 1.5 0.1 1.2 8.3%mean 15.4 1.1 25.4 7.3% mean 11.3 0.8 23.3 7.3%min 12.9 0.9 21.9 7.0% min 9.6 0.7 22.2 7.3%max 20.7 1.6 27.6 7.7% max 14.7 1.1 25.9 7.5%

LED vs HPS Comparison Report – McGill University – March 6th 2011 Page 27
Table A2: Harvested Plant Mass– Week 2 / Replication 1. Plant mass harvested on the second week for six light treatments. HPS – High pressure sodium; LED – light emitting diode; R1 – regular greenhouse HPS levels; CTRL – control: no supplemental artificial lighting. week 2-1plot 1 plant wet mass plant dry mass dry / wet mass plot 4 plant wet mass plant dry mass dry / wet massHPSN grams grams grams LEDF grams grams grams
1 23.1 3.4 14.7% 1 21.7 1.8 8.3%2 27.0 2.9 10.7% 2 23.8 3.0 12.6%3 27.8 3.2 11.5% 3 30.9 2.8 9.1%4 32.4 2.9 9.0% 4 32.4 3.0 9.3%5 33.8 2.9 8.6% 5 33.9 2.8 8.3%6 33.9 3.2 9.4% 6 34.1 1.7 5.0%7 34.6 3.3 9.5% 7 35.0 2.7 7.7%8 41.0 3.7 9.0% 8 35.2 2.5 7.1%9 42.2 2.9 6.9% 9 36.5 2.8 7.7%
10 46.3 2.9 6.3% 10 37.7 2.5 6.6%std 7.3 0.3 3.8% std 5.3 0.5 8.6%mean 34.2 3.1 9.1% mean 32.1 2.6 8.0%min 23.1 2.9 12.6% min 21.7 1.7 7.8%max 46.3 3.7 8.0% max 37.7 3.0 8.0%
plot 5 plant wet mass plant dry mass dry / wet mass plot 2 plant wet mass plant dry mass dry / wet massHPSF grams grams grams LEDN grams grams grams
1 17.2 2.9 16.9% 1 36.3 2.5 6.9%2 27.8 2.8 10.1% 2 37.1 3.4 9.2%3 28.7 2.8 9.8% 3 38.0 2.3 6.1%4 34.8 2.3 6.6% 4 38.6 2.9 7.5%5 35.3 3.4 9.6% 5 41.1 2.6 6.3%6 38.0 3.5 9.2% 6 41.4 3.4 8.2%7 38.1 2.3 6.0% 7 42.1 2.0 4.8%8 38.6 1.4 3.6% 8 43.6 2.6 6.0%9 39.5 3.5 8.9% 9 45.2 2.1 4.6%
10 43.1 3.2 7.4% 10 45.5 2.9 6.4%std 7.6 0.7 8.8% std 3.3 0.5 14.7%mean 34.1 2.8 8.2% mean 40.9 2.7 6.5%min 17.2 1.4 8.1% min 36.3 2.0 5.5%max 43.1 3.5 8.1% max 45.5 3.4 7.5%
plot 3 plant wet mass plant dry mass dry / wet mass plot 6 plant wet mass plant dry mass dry / wet massR1 grams grams grams CTRL grams grams grams
1 19.1 3.4 17.8% 1 20.3 1.8 8.9%2 21.2 3.3 15.6% 2 20.7 1.9 9.2%3 24.8 2.2 8.9% 3 21.0 1.9 9.0%4 26.0 2.6 10.0% 4 22.7 1.9 8.4%5 28.7 2.2 7.7% 5 22.8 1.5 6.6%6 29.5 1.5 5.1% 6 23.7 1.7 7.2%7 32.8 2.4 7.3% 7 23.8 1.6 6.7%8 33.5 1.8 5.4% 8 25.1 1.5 6.0%9 43.6 2.1 4.8% 9 25.4 1.6 6.3%
10 45.1 2.4 5.3% 10 27.6 2.1 7.6%std 8.6 0.6 6.9% std 2.3 0.2 8.7%mean 30.4 2.4 7.9% mean 23.3 1.8 7.5%min 19.1 1.5 7.9% min 20.3 1.5 7.4%max 45.1 3.4 7.5% max 27.6 2.1 7.6%
LED vs HPS Comparison Report – McGill University – March 6th 2011 Page 28
Table A3: Harvested Plant Mass– Week 3 / Replication 1. Plant mass harvested on the third week for six light treatments. HPS – High pressure sodium; LED – light emitting diode; R1 – regular greenhouse HPS levels; CTRL – control: no supplemental artificial lighting. week 3-1plot 1 plant wet mass plant dry mass dry / wet mass plot 4 plant wet mass plant dry mass dry / wet massHPSN grams grams grams LEDF grams grams grams
1 71.9 4.1 5.7% 1 65.9 4.1 6.2%2 74.7 4.4 5.9% 2 68.5 4.1 6.0%3 91.4 5.0 5.5% 3 69.5 4.1 5.9%4 91.4 5.1 5.6% 4 78.6 4.3 5.5%5 98.1 5.2 5.3% 5 82.8 4.3 5.2%6 101.4 5.5 5.4% 6 83.5 5.1 6.1%7 103.0 5.5 5.3% 7 84.5 5.3 6.3%8 104.5 5.7 5.5% 8 84.6 5.4 6.4%9 109.4 5.8 5.3% 9 93.1 5.6 6.0%
10 109.4 5.8 5.3% 10 103.2 5.8 5.6%std 13.3 0.6 4.4% std 11.5 0.7 6.0%mean 95.5 5.2 5.5% mean 81.4 4.8 5.9%min 71.9 4.1 5.7% min 65.9 4.1 6.2%max 109.4 5.8 5.3% max 103.2 5.8 5.6%
plot 5 plant wet mass plant dry mass dry / wet mass plot 2 plant wet mass plant dry mass dry / wet massHPSF grams grams grams LEDN grams grams grams
1 73.6 4.5 6.1% 1 56.0 3.5 6.3%2 73.8 4.7 6.4% 2 61.4 3.9 6.4%3 79.8 4.8 6.0% 3 69.5 4.0 5.8%4 80.9 5.1 6.3% 4 74.7 4.4 5.9%5 84.3 5.2 6.2% 5 77.7 4.6 5.9%6 87.1 5.5 6.3% 6 78.8 4.8 6.1%7 91.4 5.7 6.2% 7 90.6 4.8 5.3%8 93.1 5.9 6.3% 8 92.1 4.9 5.3%9 95.5 6.3 6.6% 9 94.7 5.3 5.6%
10 116.7 6.6 5.7% 10 104.0 5.6 5.4%std 12.7 0.7 5.5% std 15.3 0.6 4.2%mean 87.6 5.4 6.2% mean 80.0 4.6 5.7%min 73.6 4.5 6.1% min 56.0 3.5 6.3%max 116.7 6.6 5.7% max 104.0 5.6 5.4%
plot 3 plant wet mass plant dry mass dry / wet mass plot 6 plant wet mass plant dry mass dry / wet massR1 grams grams grams CTRL grams grams grams
1 27.6 2.2 8.0% 1 46.8 3.2 6.8%2 35.9 2.7 7.5% 2 51.5 3.4 6.6%3 48.3 3.5 7.2% 3 51.6 3.5 6.8%4 51.8 3.5 6.8% 4 51.6 3.5 6.8%5 53.4 3.8 7.1% 5 54.6 3.6 6.6%6 67.1 3.8 5.7% 6 59.9 3.7 6.2%7 67.4 4.6 6.8% 7 62.5 3.8 6.1%8 78.9 4.7 6.0% 8 62.9 3.9 6.2%9 82.1 5.1 6.2% 9 63.7 4.3 6.8%
10 86.3 5.6 6.5% 10 77.2 4.7 6.1%std 19.8 1.1 5.4% std 8.9 0.4 5.0%mean 59.9 4.0 6.6% mean 58.2 3.8 6.5%min 27.6 2.2 8.0% min 46.8 3.2 6.8%max 86.3 5.6 6.5% max 77.2 4.7 6.1%

LED vs HPS Comparison Report – McGill University – March 6th 2011 Page 29
Table A4: Harvested Plant Mass– Week 4 / Replication 1. Plant mass harvested on the fourth week for six light treatments. HPS – High pressure sodium; LED – light emitting diode; R1 – regular greenhouse HPS levels; CTRL – control: no supplemental artificial lighting. week 4-1plot 1 plant wet mass plant dry mass dry / wet mass plot 4 plant wet mass plant dry mass dry / wet massHPSN grams grams grams LEDF grams grams grams
1 129.6 7.3 5.6% 1 76.8 4.5 5.9%2 133.6 7.3 5.5% 2 119.7 5.5 4.6%3 153.9 7.9 5.1% 3 131.3 6.2 4.7%4 156.2 8.3 5.3% 4 133.1 6.2 4.7%5 180.9 9.5 5.3% 5 133.4 6.9 5.2%6 183.8 9.5 5.2% 6 137.4 7.0 5.1%7 189.9 9.6 5.1% 7 146.4 7.2 4.9%8 196.0 9.8 5.0% 8 148.3 7.9 5.3%9 207.3 10.0 4.8% 9 154.7 9.9 6.4%
10 207.6 10.3 5.0% 10 172.3 14.7 8.5%std 28.8 1.1 4.0% std 25.2 2.9 11.4%mean 173.9 9.0 5.1% mean 135.3 7.6 5.6%min 129.6 7.3 5.6% min 76.8 4.5 5.9%max 207.6 10.3 5.0% max 172.3 14.7 8.5%
plot 5 plant wet mass plant dry mass dry / wet mass plot 2 plant wet mass plant dry mass dry / wet massHPSF grams grams grams LEDN grams grams grams
1 116.8 4.7 4.0% 1 103.2 5.7 5.5%2 128.1 4.9 3.8% 2 118.7 6.1 5.1%3 131.9 5.0 3.8% 3 126.2 6.2 4.9%4 134.1 6.0 4.5% 4 137.4 6.6 4.8%5 134.8 6.1 4.5% 5 137.8 6.8 4.9%6 152.7 6.2 4.1% 6 142.8 7.3 5.1%7 164.9 6.7 4.1% 7 147.6 8.2 5.6%8 175.6 6.9 3.9% 8 150.8 8.2 5.4%9 177.5 7.3 4.1% 9 155.7 8.3 5.3%
10 185.7 9.4 5.1% 10 163.6 12.4 7.6%std 24.3 1.4 5.7% std 18.2 1.9 10.7%mean 150.2 6.3 4.2% mean 138.4 7.6 5.5%min 116.8 4.7 4.0% min 103.2 5.7 5.5%max 185.7 9.4 5.1% max 163.6 12.4 7.6%
plot 3 plant wet mass plant dry mass dry / wet mass plot 6 plant wet mass plant dry mass dry / wet massR1 grams grams grams CTRL grams grams grams
1 96.6 5.1 5.3% 1 102.6 4.5 4.4%2 112.5 5.7 5.1% 2 102.9 4.8 4.7%3 114.7 6.0 5.2% 3 111.6 5.0 4.5%4 121.8 6.3 5.2% 4 115.0 5.4 4.7%5 128.1 6.4 5.0% 5 115.5 5.6 4.8%6 130.3 6.8 5.2% 6 117.9 6.1 5.2%7 133.7 6.8 5.1% 7 125.6 6.3 5.0%8 138.2 7.8 5.6% 8 126.5 6.3 5.0%9 146.6 8.0 5.5% 9 129.2 6.7 5.2%
10 150.7 12.3 8.2% 10 133.2 10.3 7.7%std 16.5 2.0 12.3% std 10.6 1.6 15.5%mean 127.3 7.1 5.6% mean 118.0 6.1 5.2%min 96.6 5.1 5.3% min 102.6 4.5 4.4%max 150.7 12.3 8.2% max 133.2 10.3 7.7%

LED vs HPS Comparison Report – McGill University – March 6th 2011 Page 30
Table A5: Harvested Plant Mass– Week 1 / Replication 2. Plant mass harvested on the fifth week for six light treatments. HPS – High pressure sodium; LED – light emitting diode; R1 – regular greenhouse HPS levels; CTRL – control: no supplemental artificial lighting. week 1-2plot 1 plant wet mass plant dry mass dry / wet mass plot 4 plant wet mass plant dry mass dry / wet massHPSN grams grams grams LEDF grams grams grams
1 5.1 0.8 15.7% 1 4.5 0.7 15.6%2 5.2 0.8 15.4% 2 4.9 0.7 14.3%3 5.3 0.8 15.1% 3 5.4 0.8 14.8%4 5.6 0.8 14.3% 4 5.4 0.8 14.8%5 6.3 0.9 14.3% 5 6.4 0.9 14.1%6 6.5 0.9 13.8% 6 6.8 0.9 13.2%7 6.7 0.9 13.4% 7 7.3 1.0 13.7%8 7.4 1.0 13.5% 8 7.8 1.0 12.8%9 8.7 1.2 13.8% 9 7.8 1.0 12.8%
10 9.3 1.4 15.1% 10 8.6 1.1 12.8%std 1.5 0.2 13.7% std 1.4 0.1 9.8%mean 6.6 1.0 14.4% mean 6.5 0.9 13.7%min 5.1 0.8 15.7% min 4.5 0.7 15.6%max 9.3 1.4 15.1% max 8.6 1.1 12.8%
plot 5 plant wet mass plant dry mass dry / wet mass plot 2 plant wet mass plant dry mass dry / wet massHPSF grams grams grams LEDN grams grams grams
1 5.6 0.8 14.3% 1 5.8 0.8 13.8%2 5.8 0.8 13.8% 2 6.1 0.8 13.1%3 6.4 0.8 12.5% 3 6.6 0.8 12.1%4 6.7 0.8 11.9% 4 6.9 1.0 14.5%5 6.7 0.9 13.4% 5 7.1 1.0 14.1%6 6.8 0.9 13.2% 6 7.5 1.1 14.7%7 7.0 0.9 12.9% 7 7.7 1.1 14.3%8 7.3 0.9 12.3% 8 7.8 1.1 14.1%9 7.7 1.0 13.0% 9 8.8 1.2 13.6%
10 8.6 1.1 12.8% 10 11.2 1.5 13.4%std 0.9 0.1 11.3% std 1.6 0.2 14.0%mean 6.9 0.9 13.0% mean 7.6 1.0 13.8%min 5.6 0.8 14.3% min 5.8 0.8 13.8%max 8.6 1.1 12.8% max 11.2 1.5 13.4%
plot 3 plant wet mass plant dry mass dry / wet mass plot 6 plant wet mass plant dry mass dry / wet massR1 grams grams grams CTRL grams grams grams
1 4.9 0.5 10.2% 1 5.4 0.5 9.3%2 5.2 0.6 11.5% 2 5.5 0.6 10.9%3 5.5 0.6 10.9% 3 5.6 0.6 10.7%4 5.7 0.6 10.5% 4 5.9 0.6 10.2%5 5.7 0.6 10.5% 5 6.1 0.7 11.5%6 6.4 0.7 10.9% 6 6.2 0.7 11.3%7 6.6 0.8 12.1% 7 6.7 0.7 10.4%8 7.0 0.8 11.4% 8 7.1 0.8 11.3%9 7.3 0.8 11.0% 9 7.7 0.9 11.7%
10 7.5 0.9 12.0% 10 7.7 0.9 11.7%std 0.9 0.1 14.2% std 0.9 0.1 15.4%mean 6.2 0.7 11.2% mean 6.4 0.7 11.0%min 4.9 0.5 10.2% min 5.4 0.5 9.3%max 7.5 0.9 12.0% max 7.7 0.9 11.7%

LED vs HPS Comparison Report – McGill University – March 6th 2011 Page 31
Table A6: Harvested Plant Mass– Week 2 / Replication 2. Plant mass harvested on the sixth week for six light treatments. HPS – High pressure sodium; LED – light emitting diode; R1 – regular greenhouse HPS levels; CTRL – control: no supplemental artificial lighting. week 2-2plot 1 plant wet mass plant dry mass dry / wet mass plot 4 plant wet mass plant dry mass dry / wet massHPSN grams grams grams LEDF grams grams grams
1 12.6 1.3 10.3% 1 11.6 1.4 12.1%2 12.8 1.5 11.7% 2 13.7 1.4 10.2%3 14.9 1.6 10.7% 3 14.2 1.5 10.6%4 15.6 1.6 10.3% 4 14.2 1.6 11.3%5 16.3 1.7 10.4% 5 15.0 1.6 10.7%6 16.5 1.8 10.9% 6 15.1 1.6 10.6%7 20.1 2.1 10.4% 7 15.2 1.6 10.5%8 21.3 2.1 9.9% 8 15.8 1.6 10.1%9 22.0 2.2 10.0% 9 18.9 1.9 10.1%
10 24.8 2.4 9.7% 10 31.9 2.7 8.5%std 4.1 0.4 8.6% std 5.7 0.4 6.7%mean 17.7 1.8 10.3% mean 16.6 1.7 10.2%min 12.6 1.3 10.3% min 11.6 1.4 12.1%max 24.8 2.4 9.7% max 31.9 2.7 8.5%
plot 5 plant wet mass plant dry mass dry / wet mass plot 2 plant wet mass plant dry mass dry / wet massHPSF grams grams grams LEDN grams grams grams
1 13.5 1.4 10.4% 1 9.6 1.0 10.4%2 13.8 1.5 10.9% 2 12.2 1.4 11.5%3 14.2 1.5 10.6% 3 13.8 1.5 10.9%4 14.9 1.5 10.1% 4 14.0 1.5 10.7%5 15.0 1.6 10.7% 5 14.1 1.5 10.6%6 16.3 1.7 10.4% 6 15.9 1.5 9.4%7 17.0 1.7 10.0% 7 15.9 1.5 9.4%8 18.0 1.7 9.4% 8 17.0 1.6 9.4%9 19.1 1.9 9.9% 9 17.3 1.7 9.8%
10 24.0 2.2 9.2% 10 20.2 1.9 9.4%std 3.2 0.2 7.4% std 2.9 0.2 7.7%mean 16.6 1.7 10.1% mean 15.0 1.5 10.1%min 13.5 1.4 10.4% min 9.6 1.0 10.4%max 24.0 2.2 9.2% max 20.2 1.9 9.4%
plot 3 plant wet mass plant dry mass dry / wet mass plot 6 plant wet mass plant dry mass dry / wet massR1 grams grams grams CTRL grams grams grams
1 13.2 1.1 8.3% 1 12.9 1.1 8.5%2 14.0 1.1 7.9% 2 13.0 1.1 8.5%3 14.6 1.2 8.2% 3 13.2 1.1 8.3%4 15.0 1.3 8.7% 4 13.2 1.1 8.3%5 15.5 1.3 8.4% 5 13.5 1.1 8.1%6 15.6 1.4 9.0% 6 13.6 1.1 8.1%7 16.7 1.4 8.4% 7 13.6 1.2 8.8%8 18.7 1.4 7.5% 8 14.2 1.2 8.5%9 19.8 1.5 7.6% 9 15.7 1.3 8.3%
10 19.9 1.5 7.5% 10 23.3 1.9 8.2%std 2.4 0.1 6.2% std 3.2 0.2 7.9%mean 16.3 1.3 8.1% mean 14.6 1.2 8.3%min 13.2 1.1 8.3% min 12.9 1.1 8.5%max 19.9 1.5 7.5% max 23.3 1.9 8.2%

LED vs HPS Comparison Report – McGill University – March 6th 2011 Page 32
Table A7: Harvested Plant Mass– Week 3 / Replication 2. Plant mass harvested on the seventh week for six light treatments. HPS – High pressure sodium; LED – light emitting diode; R1 – regular greenhouse HPS levels; CTRL – control: no supplemental artificial lighting. week 3-2plot 1 plant wet mass plant dry mass dry / wet mass plot 4 plant wet mass plant dry mass dry / wet massHPSN grams grams grams LEDF grams grams grams
1 22.5 2.3 10.2% 1 20.6 2.3 11.2%2 24.6 2.5 10.2% 2 22.4 2.6 11.6%3 26.3 2.7 10.3% 3 24.3 2.7 11.1%4 29.4 2.9 9.9% 4 25.7 2.7 10.5%5 31.8 3.0 9.4% 5 27.2 2.9 10.7%6 32.4 3.0 9.3% 6 28.7 3.1 10.8%7 37.0 3.1 8.4% 7 30.4 3.2 10.5%8 38.8 3.2 8.2% 8 33.2 3.2 9.6%9 48.8 3.8 7.8% 9 33.4 3.2 9.6%
10 56.8 4.2 7.4% 10 42.6 3.8 8.9%std 10.9 0.6 5.2% std 6.4 0.4 6.5%mean 34.8 3.1 8.8% mean 28.9 3.0 10.3%min 22.5 2.3 10.2% min 20.6 2.3 11.2%max 56.8 4.2 7.4% max 42.6 3.8 8.9%
plot 5 plant wet mass plant dry mass dry / wet mass plot 2 plant wet mass plant dry mass dry / wet massHPSF grams grams grams LEDN grams grams grams
1 19.1 2.5 13.1% 1 24.5 2.6 10.6%2 21.2 2.5 11.8% 2 25.6 2.6 10.2%3 25.6 2.7 10.5% 3 29.5 2.6 8.8%4 27.1 2.9 10.7% 4 29.5 2.6 8.8%5 35.3 3.0 8.5% 5 30.8 2.7 8.8%6 39.2 3.0 7.7% 6 32.1 2.9 9.0%7 39.6 3.1 7.8% 7 33.5 2.9 8.7%8 39.6 3.3 8.3% 8 34.1 2.9 8.5%9 49.9 3.6 7.2% 9 41.3 3.1 7.5%
10 56.6 4.4 7.8% 10 43.7 3.4 7.8%std 12.2 0.6 4.7% std 6.1 0.3 4.3%mean 35.3 3.1 8.8% mean 32.5 2.8 8.7%min 19.1 2.5 13.1% min 24.5 2.6 10.6%max 56.6 4.4 7.8% max 43.7 3.4 7.8%
plot 3 plant wet mass plant dry mass dry / wet mass plot 6 plant wet mass plant dry mass dry / wet massR1 grams grams grams CTRL grams grams grams
1 27.8 2.2 7.9% 1 19.5 2.1 10.8%2 28.4 2.3 8.1% 2 19.8 2.1 10.6%3 28.6 2.4 8.4% 3 20.2 2.5 12.4%4 30.9 2.5 8.1% 4 24.0 2.5 10.4%5 33.8 2.5 7.4% 5 26.8 2.7 10.1%6 35.7 2.7 7.6% 6 28.0 2.7 9.6%7 37.4 2.8 7.5% 7 28.4 2.8 9.9%8 40.6 2.8 6.9% 8 30.1 2.8 9.3%9 41.2 3.1 7.5% 9 32.3 2.8 8.7%
10 45.7 3.4 7.4% 10 35.4 2.9 8.2%std 6.2 0.4 6.0% std 5.5 0.3 5.3%mean 35.0 2.7 7.6% mean 26.5 2.6 9.8%min 27.8 2.2 7.9% min 19.5 2.1 10.8%max 45.7 3.4 7.4% max 35.4 2.9 8.2%

LED vs HPS Comparison Report – McGill University – March 6th 2011 Page 33
Table A8: Harvested Plant Mass– Week 4 / Replication 2. Plant mass harvested on the eighth week for six light treatments. HPS – High pressure sodium; LED – light emitting diode; R1 – regular greenhouse HPS levels; CTRL – control: no supplemental artificial lighting. week 4-2plot 1 plant wet mass plant dry mass dry / wet mass plot 4 plant wet mass plant dry mass dry / wet massHPSN grams grams grams LEDF grams grams grams
1 42.8 4.0 9.3% 1 39.2 3.3 8.4%2 51.4 4.1 8.0% 2 41.7 3.7 8.9%3 52.0 4.3 8.3% 3 46.6 3.8 8.2%4 54.6 4.6 8.4% 4 47.8 3.8 7.9%5 65.0 5.2 8.0% 5 48.0 3.9 8.1%6 68.1 5.2 7.6% 6 48.5 4.1 8.5%7 69.0 5.3 7.7% 7 50.9 4.2 8.3%8 71.7 5.3 7.4% 8 59.4 4.5 7.6%9 80.1 5.7 7.1% 9 67.8 4.6 6.8%
10 105.0 6.8 6.5% 10 68.5 5.1 7.4%std 17.8 0.8 4.8% std 10.1 0.5 5.1%mean 66.0 5.1 7.7% mean 51.8 4.1 7.9%min 42.8 4.0 9.3% min 39.2 3.3 8.4%max 105.0 6.8 6.5% max 68.5 5.1 7.4%
plot 5 plant wet mass plant dry mass dry / wet mass plot 2 plant wet mass plant dry mass dry / wet massHPSF grams grams grams LEDN grams grams grams
1 38.7 3.6 9.3% 1 34.0 2.9 8.5%2 42.0 3.6 8.6% 2 36.4 3.0 8.2%3 49.6 3.7 7.5% 3 38.0 3.3 8.7%4 52.3 3.8 7.3% 4 43.4 3.7 8.5%5 55.7 4.0 7.2% 5 45.4 4.1 9.0%6 68.5 4.4 6.4% 6 50.1 4.2 8.4%7 76.6 4.5 5.9% 7 54.9 4.3 7.8%8 82.8 5.1 6.2% 8 62.0 4.5 7.3%9 99.6 5.2 5.2% 9 69.0 4.7 6.8%
10 104.8 5.7 5.4% 10 84.9 5.1 6.0%std 23.4 0.8 3.2% std 16.2 0.7 4.5%mean 67.1 4.4 6.5% mean 51.8 4.0 7.7%min 38.7 3.6 9.3% min 34.0 2.9 8.5%max 104.8 5.7 5.4% max 84.9 5.1 6.0%
plot 3 plant wet mass plant dry mass dry / wet mass plot 6 plant wet mass plant dry mass dry / wet massR1 grams grams grams CTRL grams grams grams
1 66.8 3.7 5.5% 1 32.7 2.1 6.4%2 69.0 3.9 5.7% 2 33.9 3.1 9.1%3 70.7 4.0 5.7% 3 34.9 3.1 8.9%4 71.2 4.1 5.8% 4 35.4 3.1 8.8%5 73.0 4.1 5.6% 5 50.2 3.3 6.6%6 75.8 4.2 5.5% 6 52.0 3.7 7.1%7 76.7 4.3 5.6% 7 52.0 3.7 7.1%8 89.1 4.4 4.9% 8 52.6 3.8 7.2%9 92.1 4.7 5.1% 9 56.9 4.3 7.6%
10 92.5 5.4 5.8% 10 64.8 4.3 6.6%std 9.8 0.5 4.9% std 11.4 0.7 5.8%mean 77.7 4.3 5.5% mean 46.5 3.5 7.4%min 66.8 3.7 5.5% min 32.7 2.1 6.4%max 92.5 5.4 5.8% max 64.8 4.3 6.6%

LED vs HPS Comparison Report – McGill University – March 6th 2011 Page 34
Annex B
Weather Data Tables – 1st replication Table B1: HPS Near - Condensed Weather Data – 1st replication. Weather data accumulated and summed for the first high-pressure sodium light treatment replication during the first experiment replication. [Herbie ‐ plot 1] ‐ HPS neartotal mean std. dev. max min sum Fraction
Surface Temp, °C 13.87 5.45 35.58 5.26
Solar Radiation, W/m² 78.88 106.56 614.40 0.60 3167626.10 100.0%
PAR #1, umol/m2/sec 137.28 143.07 1436.20 1.20
moles of light / m2 330.78 100.0%
PAR #2, umol/m2/sec 138.09 147.69 1318.70 1.20
moles of light / m2 332.73 100.0%
Air Temp, °C 11.92 4.97 29.34 1.15
RH, % 80.70 14.71 98.40 22.00
sunlight only mean std. dev. max min sum
Surface Temp, °C 14.61 6.28 35.58 5.26
Solar Radiation, W/m² 96.85 122.35 614.40 0.60 2747577.50 86.7%
PAR #1, umol/m2/sec 150.17 168.13 1436.20 1.20
moles of light / m2 255.61 77.3%
PAR #2, umol/m2/sec 151.11 173.87 1318.70 1.20
moles of light / m2 257.21 77.3%
Air Temp, °C 12.82 5.57 29.34 1.15
RH, % 79.02 16.98 98.40 22.00
HPS only mean std. dev. max min sum
Surface Temp, °C 12.11 1.43 18.06 7.59
Solar Radiation, W/m² 35.64 2.87 48.10 9.40 420184.20 13.3%
PAR #1, umol/m2/sec 106.25 18.36 146.20 8.70
moles of light / m2 75.16 22.7%
PAR #2, umol/m2/sec 106.86 16.61 141.20 6.20
moles of light / m2 75.60 22.7%
Air Temp, °C 9.76 1.74 16.92 5.08
RH, % 84.74 4.54 93.50 69.70
LED vs HPS Comparison Report – McGill University – March 6th 2011 Page 35
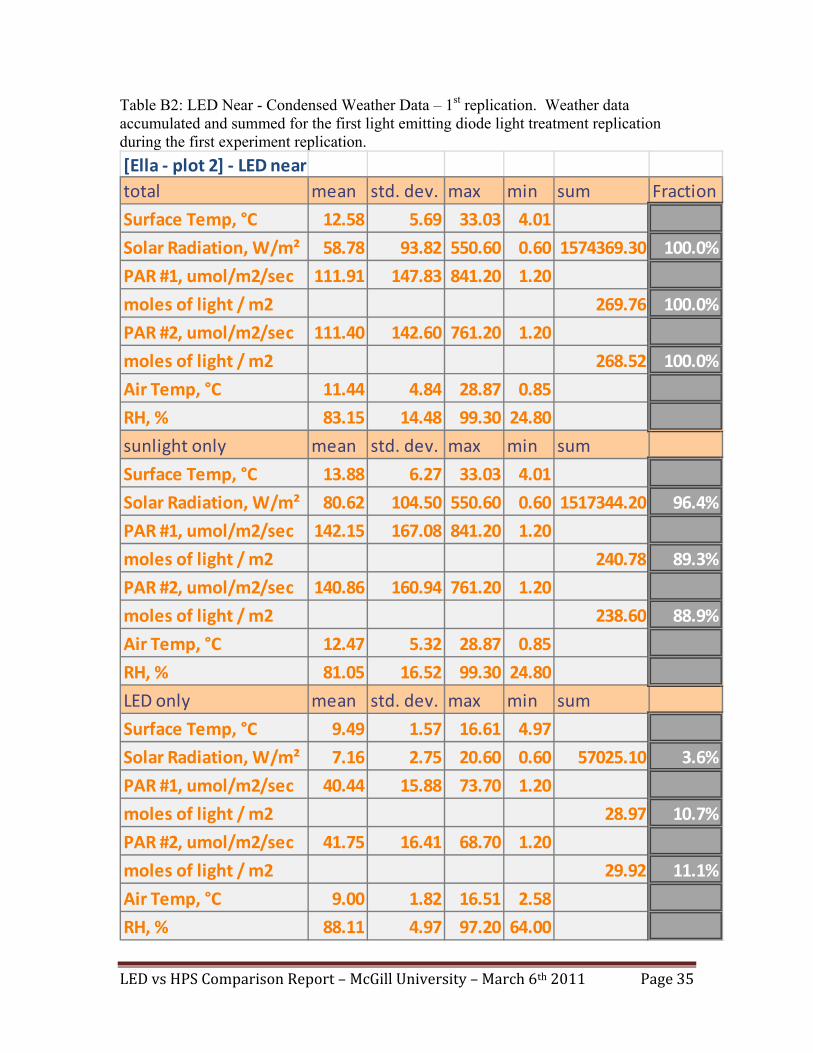
Table B2: LED Near - Condensed Weather Data – 1st replication. Weather data accumulated and summed for the first light emitting diode light treatment replication during the first experiment replication. [Ella ‐ plot 2] ‐ LED neartotal mean std. dev. max min sum Fraction
Surface Temp, °C 12.58 5.69 33.03 4.01
Solar Radiation, W/m² 58.78 93.82 550.60 0.60 1574369.30 100.0%
PAR #1, umol/m2/sec 111.91 147.83 841.20 1.20
moles of light / m2 269.76 100.0%
PAR #2, umol/m2/sec 111.40 142.60 761.20 1.20
moles of light / m2 268.52 100.0%
Air Temp, °C 11.44 4.84 28.87 0.85
RH, % 83.15 14.48 99.30 24.80
sunlight only mean std. dev. max min sum
Surface Temp, °C 13.88 6.27 33.03 4.01
Solar Radiation, W/m² 80.62 104.50 550.60 0.60 1517344.20 96.4%
PAR #1, umol/m2/sec 142.15 167.08 841.20 1.20
moles of light / m2 240.78 89.3%
PAR #2, umol/m2/sec 140.86 160.94 761.20 1.20
moles of light / m2 238.60 88.9%
Air Temp, °C 12.47 5.32 28.87 0.85
RH, % 81.05 16.52 99.30 24.80
LED only mean std. dev. max min sum
Surface Temp, °C 9.49 1.57 16.61 4.97
Solar Radiation, W/m² 7.16 2.75 20.60 0.60 57025.10 3.6%
PAR #1, umol/m2/sec 40.44 15.88 73.70 1.20
moles of light / m2 28.97 10.7%
PAR #2, umol/m2/sec 41.75 16.41 68.70 1.20
moles of light / m2 29.92 11.1%
Air Temp, °C 9.00 1.82 16.51 2.58
RH, % 88.11 4.97 97.20 64.00

LED vs HPS Comparison Report – McGill University – March 6th 2011 Page 36
Table B3: Regular - Condensed Weather Data – 1st replication. Weather data accumulated and summed for the regular high-pressure sodium light treatment during the first experiment replication. [Ray ‐ plot 3] ‐ Regulartotal mean std. dev. max min sum Fraction
Surface Temp, °C 12.95 6.21 34.57 2.85
Solar Radiation, W/m² 71.15 114.71 650.60 0.60 2858601.10 100.0%
PAR #1, umol/m2/sec 106.32 159.30 818.70 1.20
moles of light / m2 256.31 100.1%
PAR #2, umol/m2/sec 115.73 172.91 891.20 1.20
moles of light / m2 278.99 100.1%
Air Temp, °C 14.36 4.88 32.28 3.25
RH, % 83.03 14.71 99.70 23.10
sunlight only mean std. dev. max min sum
Surface Temp, °C 14.19 6.90 34.57 2.85
Solar Radiation, W/m² 96.39 126.94 650.60 0.60 2774549.30 97.1%
PAR #1, umol/m2/sec 141.56 176.75 2553.70 1.20
moles of light / m2 244.48 95.4%
PAR #2, umol/m2/sec 153.89 191.80 2553.70 1.20
moles of light / m2 265.78 95.3%
Air Temp, °C 15.27 5.40 32.28 3.25
RH, % 80.85 16.65 99.70 23.10
HPS only mean std. dev. max min sum
Surface Temp, °C 9.83 1.58 16.80 6.81
Solar Radiation, W/m² 7.39 3.59 26.90 0.60 84222.40 2.9%
PAR #1, umol/m2/sec 17.53 8.64 53.70 1.20
moles of light / m2 11.98 4.7%
PAR #2, umol/m2/sec 19.55 9.48 58.70 1.20
moles of light / m2 13.37 4.8%
Air Temp, °C 12.07 1.74 19.67 7.82
RH, % 88.55 4.57 97.30 64.70

LED vs HPS Comparison Report – McGill University – March 6th 2011 Page 37
Table B4: LED Far - Condensed Weather Data – 1st replication. Weather data accumulated and summed for the second light emitting diode light treatment replication during the first experiment replication. [Duke ‐ plot 4] ‐ LED fartotal mean std. dev. max min sum Fraction
Surface Temp, °C 12.62 5.60 31.92 2.96
Solar Radiation, W/m² 59.02 93.28 559.40 0.60 2371654.40 100.0%
PAR #1, umol/m2/sec 129.10 162.97 851.20 1.20
moles of light / m2 311.26 100.0%
PAR #2, umol/m2/sec 119.94 159.14 1516.20 1.20
moles of light / m2 289.18 100.0%
Air Temp, °C 11.44 5.03 28.20 0.05
RH, % 83.01 14.77 99.60 24.30
sunlight only mean std. dev. max min sum
Surface Temp, °C 13.72 6.20 31.92 2.96
Solar Radiation, W/m² 79.43 103.31 559.40 0.60 2286705.30 96.4%
PAR #1, umol/m2/sec 160.35 183.04 851.20 1.20
moles of light / m2 276.97 89.0%
PAR #2, umol/m2/sec 150.09 179.03 1516.20 1.20
moles of light / m2 259.24 89.6%
Air Temp, °C 12.38 5.55 28.20 0.05
RH, % 80.81 16.69 99.60 24.30
LED only mean std. dev. max min sum
Surface Temp, °C 9.84 1.60 16.75 6.51
Solar Radiation, W/m² 7.45 2.66 24.40 0.60 84949.10 3.6%
PAR #1, umol/m2/sec 50.15 17.72 81.20 1.20
moles of light / m2 34.29 11.0%
PAR #2, umol/m2/sec 43.78 15.45 68.70 1.20
moles of light / m2 29.93 10.4%
Air Temp, °C 9.07 1.88 16.61 5.00
RH, % 88.57 4.82 97.00 63.90

LED vs HPS Comparison Report – McGill University – March 6th 2011 Page 38
Table B5: HPS Far - Condensed Weather Data – 1st replication. Weather data accumulated and summed for the second high-pressure sodium light treatment replication during the first experiment replication. [Aretha ‐ plot 5] ‐ HPS fartotal mean std. dev. max min sum Fraction
Surface Temp, °C 13.49 5.35 32.07 3.70
Solar Radiation, W/m² 66.63 85.88 498.10 0.60 2677940.90 100.0%
PAR #1, umol/m2/sec 156.50 164.25 853.70 1.20
moles of light / m2 377.38 100.0%
PAR #2, umol/m2/sec 139.99 148.04 821.20 1.20
moles of light / m2 337.57 100.0%
Air Temp, °C 11.65 5.03 28.67 ‐0.28
RH, % 82.89 14.43 100.00 23.90
sunlight only mean std. dev. max min sum
Surface Temp, °C 14.21 6.08 32.07 3.70
Solar Radiation, W/m² 81.67 97.20 498.10 0.60 2351617.30 87.8%
PAR #1, umol/m2/sec 175.70 188.99 853.70 1.20
moles of light / m2 303.53 80.4%
PAR #2, umol/m2/sec 157.22 170.15 821.20 1.20
moles of light / m2 271.60 80.5%
Air Temp, °C 12.47 5.61 28.67 ‐0.28
RH, % 81.23 16.49 100.00 23.90
HPS only mean std. dev. max min sum
Surface Temp, °C 11.69 1.76 18.63 6.94
Solar Radiation, W/m² 28.63 11.01 49.40 0.60 326323.60 12.2%
PAR #1, umol/m2/sec 108.01 40.12 158.70 1.20
moles of light / m2 73.85 19.6%
PAR #2, umol/m2/sec 96.48 38.67 153.70 1.20
moles of light / m2 65.97 19.5%
Air Temp, °C 9.56 1.93 17.51 5.05
RH, % 87.09 4.74 96.90 63.70

LED vs HPS Comparison Report – McGill University – March 6th 2011 Page 39
Table B6: Control - Condensed Weather Data – 1st replication. Weather data accumulated and summed for the control (no additional artificial light) treatment during the first experiment replication. [John ‐ plot 6] ‐ Controltotal mean std. dev. max min sum Fraction
Water Temp, °C 15.90 0.57 23.59 14.41
Solar Radiation, W/m² 61.88 102.14 520.60 0.60 2446191.30 100.0%
PAR #1, umol/m2/sec 131.11 215.27 1808.70 1.20
moles of light / m2 310.99 100.0%
Air Temp, °C 11.47 5.05 28.35 ‐0.54
RH, % 84.98 14.24 100.00 26.10
sunlight only mean std. dev. max min sum
Water Temp, °C 15.85 0.56 23.59 14.41
Solar Radiation, W/m² 86.14 111.81 520.60 0.60 2437724.80 99.7%
PAR #1, umol/m2/sec 182.57 235.40 1808.70 1.20
moles of light / m2 310.01 99.7%
Air Temp, °C 12.43 5.53 28.35 ‐0.54
RH, % 82.78 16.00 100.00 26.10
HPS only mean std. dev. max min sum
Water Temp, °C 16.05 0.54 17.03 14.84
Solar Radiation, W/m² 0.75 1.14 18.10 0.60 8466.50 0.3%
PAR #1, umol/m2/sec 1.46 1.97 31.20 1.20
moles of light / m2 0.98 0.3%
Air Temp, °C 9.05 2.14 17.27 3.70
RH, % 90.50 5.14 99.80 65.40

LED vs HPS Comparison Report – McGill University – March 6th 2011 Page 40
Weather Data Tables – 2nd replication Table B7: HPS Near - Condensed Weather Data – 2nd replication. Weather data accumulated and summed for the first high-pressure sodium light treatment replication during the second experiment replication. [Duke ‐ plot 1] ‐ HPS Neartotal mean min max std. dev. sum Fraction
Surface Temp, °C 14.60 2.98 37.70 6.43
Solar Radiation, W/m² 79.09 0.60 721.90 91.97 2365937.60 100.0%
PAR #1, uE 151.46 1.20 1366.20 142.29
moles of light / m2 271.85 100.0%
PAR #2, uE 149.00 1.20 1393.70 144.12
moles of light / m2 267.44 100.0%
Air Temp, °C 12.85 0.83 32.74 5.73
RH, % 73.44 15.30 97.90 21.64
sunlight only mean min max std. dev. sum
Surface Temp, °C 15.99 2.98 37.70 7.18
Solar Radiation, W/m² 106.72 0.60 721.90 103.59 2074094.80 87.7%
PAR #1, uE 182.34 1.20 1366.20 164.87
moles of light / m2 212.63 78.2%
PAR #2, uE 179.70 1.20 1393.70 167.48
moles of light / m2 209.55 78.4%
Air Temp, °C 14.08 0.83 32.74 6.25
RH, % 69.29 15.30 97.90 23.87
HPS only mean min max std. dev. sum
Surface Temp, °C 12.00 3.54 25.19 3.48
Solar Radiation, W/m² 27.85 0.60 79.40 14.27 291842.80 12.3%
PAR #1, uE 94.18 1.20 201.20 48.32
moles of light / m2 59.22 21.8%
PAR #2, uE 92.07 1.20 208.70 47.78
moles of light / m2 57.89 21.6%
Air Temp, °C 10.57 1.45 25.14 3.65
RH, % 81.45 19.70 96.80 13.27

LED vs HPS Comparison Report – McGill University – March 6th 2011 Page 41
Table B8: LED Near - Condensed Weather Data – 2nd replication. Weather data accumulated and summed for the first light emitting diode light treatment replication during the second experiment replication. [Ray ‐ plot 2] ‐ LED NearTotal mean min max std. dev. sum Fraction
Surface Temp, °C 15.04 1.94 46.32 8.24
Solar Radiation, W/m² 77.60 0.60 908.10 122.10 3094310.50 100.0%
PAR #1, uE 136.41 1.20 1288.70 151.91
moles of light / m2 326.37 100.0%
PAR #2, uE 158.57 1.20 1751.20 210.26
moles of light / m2 379.39 100.0%
Air Temp, °C 15.61 3.09 36.20 5.42
RH, % 76.78 16.20 99.70 22.01
Sunlight only mean min max std. dev. sum
Surface Temp, °C 17.31 1.94 46.32 9.21
Solar Radiation, W/m² 114.92 0.60 908.10 137.82 2972612.50 96.1%
PAR #1, uE 183.94 1.20 1288.70 169.99
moles of light / m2 285.47 87.5%
PAR #2, uE 218.47 1.20 1751.20 240.21
moles of light / m2 339.07 89.4%
Air Temp, °C 16.84 3.09 36.20 5.94
RH, % 71.95 16.20 99.70 24.32
LED only mean min max std. dev. sum
Surface Temp, °C 10.87 2.64 24.22 3.10
Solar Radiation, W/m² 8.74 0.60 69.40 6.95 122458.20 4.0%
PAR #1, uE 48.74 1.20 153.70 21.49
moles of light / m2 40.97 12.6%
PAR #2, uE 48.05 1.20 143.70 20.96
moles of light / m2 40.39 10.6%
Air Temp, °C 13.35 4.04 27.75 3.24
RH, % 85.66 21.30 97.80 12.84

LED vs HPS Comparison Report – McGill University – March 6th 2011 Page 42
Table B9: Control - Condensed Weather Data – 2nd replication. Weather data accumulated and summed for the control (no additional artificial light) treatment during the second experiment replication. [John ‐ plot 3] ‐ Controltotal mean min max std. dev. sum Fraction
Water Temp, °C 14.73 11.20 16.01 0.50
Solar Radiation, W/m² 69.53 0.60 715.60 101.66 2727804.10 100.0%
PAR #1, uE 159.67 1.20 1698.70 238.54
moles of light / m2 300.13 100.0%
Air Temp, °C 12.75 0.25 32.12 5.54
RH, % 76.98 19.10 99.40 21.53
sunlight only mean min max std. dev. sum
Water Temp, °C 14.66 13.88 15.96 0.48
Solar Radiation, W/m² 105.81 0.60 715.60 110.27 2692804.90 98.7%
PAR #1, uE 243.48 1.20 1698.70 260.06
moles of light / m2 296.05 98.6%
Air Temp, °C 14.02 0.25 32.12 6.06
RH, % 72.38 19.10 99.40 23.73
HPS only mean min max std. dev. sum
Water Temp, °C 14.87 11.20 16.01 0.49
Solar Radiation, W/m² 2.54 0.60 65.60 6.98 34999.20 1.3%
PAR #1, uE 4.93 1.20 116.20 13.25
moles of light / m2 4.08 1.4%
Air Temp, °C 10.41 1.07 24.58 3.32
RH, % 85.49 22.60 97.70 12.95

LED vs HPS Comparison Report – McGill University – March 6th 2011 Page 43
Table B10: LED Far - Condensed Weather Data – 2nd replication. Weather data accumulated and summed for the second light emitting diode light treatment replication during the second experiment replication. [Herbie ‐ plot 4] ‐ LED fartotal mean min max std. dev. sum Fraction
Surface Temp, °C 13.74 2.53 41.07 6.09
Solar Radiation, W/m² 70.42 0.60 698.10 92.10 2809364.80 100.0%
PAR #1, uE 134.74 1.20 1121.20 159.55
moles of light / m2 322.50 100.0%
PAR #2, uE 149.99 1.20 1316.20 189.21
moles of light / m2 359.01 100.0%
Air Temp, °C 12.74 ‐0.03 32.38 5.54
RH, % 76.35 18.30 99.60 21.66
sunlight only mean min max std. dev. sum
Surface Temp, °C 15.26 2.53 41.07 6.76
Solar Radiation, W/m² 103.45 0.60 698.10 99.72 2677103.90 95.3%
PAR #1, uE 181.63 1.20 1121.20 180.92
moles of light / m2 282.02 87.4%
PAR #2, uE 204.74 1.20 1316.20 215.43
moles of light / m2 317.91 88.6%
Air Temp, °C 13.99 ‐0.03 32.38 6.07
RH, % 71.77 18.30 99.60 23.90
LED only mean min max std. dev. sum
Surface Temp, °C 10.94 3.56 24.22 3.04
Solar Radiation, W/m² 9.44 0.60 74.40 7.25 132260.90 4.7%
PAR #1, uE 48.15 1.20 158.70 21.33
moles of light / m2 40.48 12.6%
PAR #2, uE 48.88 1.20 146.20 21.16
moles of light / m2 41.10 11.4%
Air Temp, °C 10.44 0.69 24.56 3.34
RH, % 84.80 20.30 97.80 13.06
LED vs HPS Comparison Report – McGill University – March 6th 2011 Page 44
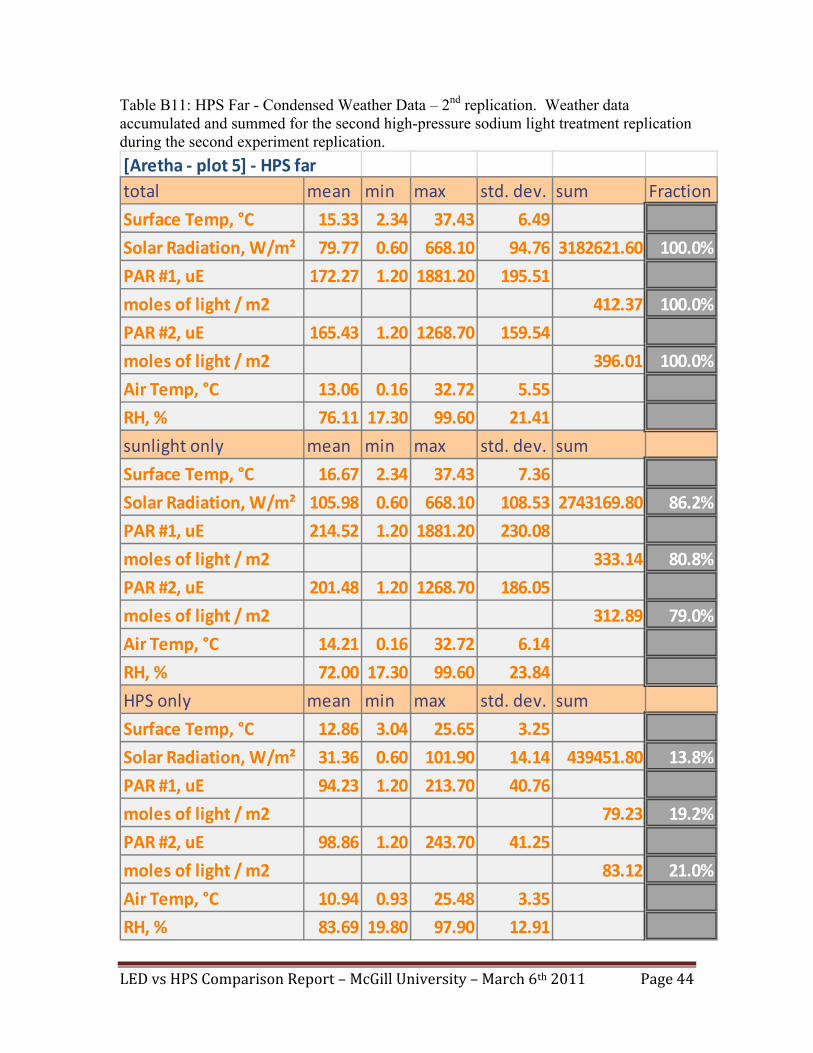
Table B11: HPS Far - Condensed Weather Data – 2nd replication. Weather data accumulated and summed for the second high-pressure sodium light treatment replication during the second experiment replication. [Aretha ‐ plot 5] ‐ HPS fartotal mean min max std. dev. sum Fraction
Surface Temp, °C 15.33 2.34 37.43 6.49
Solar Radiation, W/m² 79.77 0.60 668.10 94.76 3182621.60 100.0%
PAR #1, uE 172.27 1.20 1881.20 195.51
moles of light / m2 412.37 100.0%
PAR #2, uE 165.43 1.20 1268.70 159.54
moles of light / m2 396.01 100.0%
Air Temp, °C 13.06 0.16 32.72 5.55
RH, % 76.11 17.30 99.60 21.41
sunlight only mean min max std. dev. sum
Surface Temp, °C 16.67 2.34 37.43 7.36
Solar Radiation, W/m² 105.98 0.60 668.10 108.53 2743169.80 86.2%
PAR #1, uE 214.52 1.20 1881.20 230.08
moles of light / m2 333.14 80.8%
PAR #2, uE 201.48 1.20 1268.70 186.05
moles of light / m2 312.89 79.0%
Air Temp, °C 14.21 0.16 32.72 6.14
RH, % 72.00 17.30 99.60 23.84
HPS only mean min max std. dev. sum
Surface Temp, °C 12.86 3.04 25.65 3.25
Solar Radiation, W/m² 31.36 0.60 101.90 14.14 439451.80 13.8%
PAR #1, uE 94.23 1.20 213.70 40.76
moles of light / m2 79.23 19.2%
PAR #2, uE 98.86 1.20 243.70 41.25
moles of light / m2 83.12 21.0%
Air Temp, °C 10.94 0.93 25.48 3.35
RH, % 83.69 19.80 97.90 12.91

LED vs HPS Comparison Report – McGill University – March 6th 2011 Page 45
Table B12: Regular - Condensed Weather Data – 2nd replication. Weather data accumulated and summed for the regular high-pressure sodium light treatment during the second experiment replication. [Ella + Louis ‐ plot 6] ‐ Regulartotal mean min max standard sum
Surface Temp, °C 13.97 4.66 32.59 5.52
Solar Radiation, W/m² 67.87 0.60 683.10 90.59 2708262.40 100.0%
PAR #1, umol/m2/sec 131.46 1.20 1233.70 187.74
moles of light 0.01 0.00 0.07 0.01 314.72 100.0%
PAR #2, umol/m2/sec 125.48 1.20 1118.70 178.16
moles of light 0.01 0.00 0.07 0.01 300.42 100.0%
Air Temp, °C 12.81 3.27 26.11 4.62
RH, % 77.00 19.10 99.80 19.15
sunlight only mean min max standard sum
Surface Temp, °C 15.60 4.66 32.59 6.11
Solar Radiation, W/m² 101.13 0.60 683.10 97.29 2618144.50 96.7%
PAR #1, umol/m2/sec 195.04 1.20 1233.70 206.71
moles of light 0.01 0.00 0.07 0.01 302.95 96.3%
PAR #2, umol/m2/sec 184.36 1.20 1118.70 197.36
moles of light 0.01 0.00 0.07 0.01 286.37 95.3%
Air Temp, °C 14.00 3.27 26.11 5.14
RH, % 72.94 19.10 99.80 21.12
HPS only mean min max standard sum
Surface Temp, °C 10.98 6.10 17.63 2.01
Solar Radiation, W/m² 6.43 0.60 74.40 7.78 90117.90 3.3%
PAR #1, umol/m2/sec 14.00 3.70 121.20 12.64
moles of light 0.00 0.00 0.01 0.00 11.77 3.7%
PAR #2, umol/m2/sec 16.71 3.70 138.70 13.70
moles of light 0.00 0.00 0.01 0.00 14.05 4.7%
Air Temp, °C 10.60 5.41 17.89 2.11
RH, % 84.49 33.90 97.30 11.59

LED vs HPS Comparison Report – McGill University – March 6th 2011 Page 46
Annex C
Weather data charts Replication #1 – temperature charts
Figure C1: [Herbie - plot 1] - HPS Near Historical Weather Data. Weather data over four weeks for first high pressure sodium light treatment replication during the first experiment replication. Surface and air temperatures in degree celcius; relative humidity in percentage.

LED vs HPS Comparison Report – McGill University – March 6th 2011 Page 47
Figure C2: [Ella - plot 2] - LED near Historical Weather Data. Weather data over four weeks for first light emitting diode light treatment replication during the first experiment replication. Surface and air temperatures in degree celcius; relative humidity in percentage.

LED vs HPS Comparison Report – McGill University – March 6th 2011 Page 48
Figure C3: [Ray - plot 3] – Regular Historical Weather Data. Weather data over four weeks for the regular high pressure sodium light treatment during the first experiment replication. Surface and air temperatures in degree celcius; relative humidity in percentage.

LED vs HPS Comparison Report – McGill University – March 6th 2011 Page 49
Figure C4: [Duke - plot 4] - LED far Historical Weather Data. Weather data over four weeks for second light emitting diode light treatment replication during the first experiment replication. Surface and air temperatures in degree celcius; relative humidity in percentage.

LED vs HPS Comparison Report – McGill University – March 6th 2011 Page 50
Figure C5: [Aretha - plot 5] - HPS far Historical Weather Data. Weather data over four weeks for second high pressure sodium light treatment replication during the first experiment replication. Surface and air temperatures in degree celcius; relative humidity in percentage.
LED vs HPS Comparison Report – McGill University – March 6th 2011 Page 51
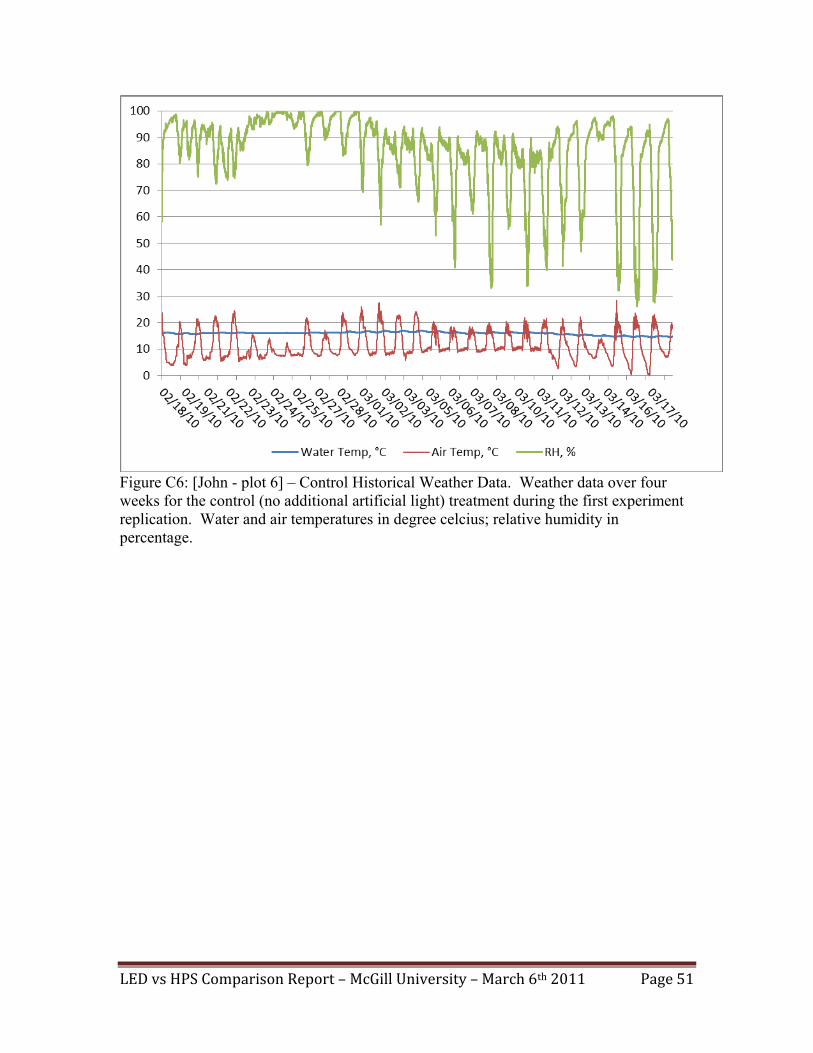
Figure C6: [John - plot 6] – Control Historical Weather Data. Weather data over four weeks for the control (no additional artificial light) treatment during the first experiment replication. Water and air temperatures in degree celcius; relative humidity in percentage.

LED vs HPS Comparison Report – McGill University – March 6th 2011 Page 52
Weather data charts Replication #2 – temperature charts
Figure C7: [Duke - plot 1] - HPS Near Historical Weather Data. Weather data over four weeks for first high pressure sodium light treatment replication during the second experiment replication. Surface and air temperatures in degree celcius; relative humidity in percentage.
LED vs HPS Comparison Report – McGill University – March 6th 2011 Page 53
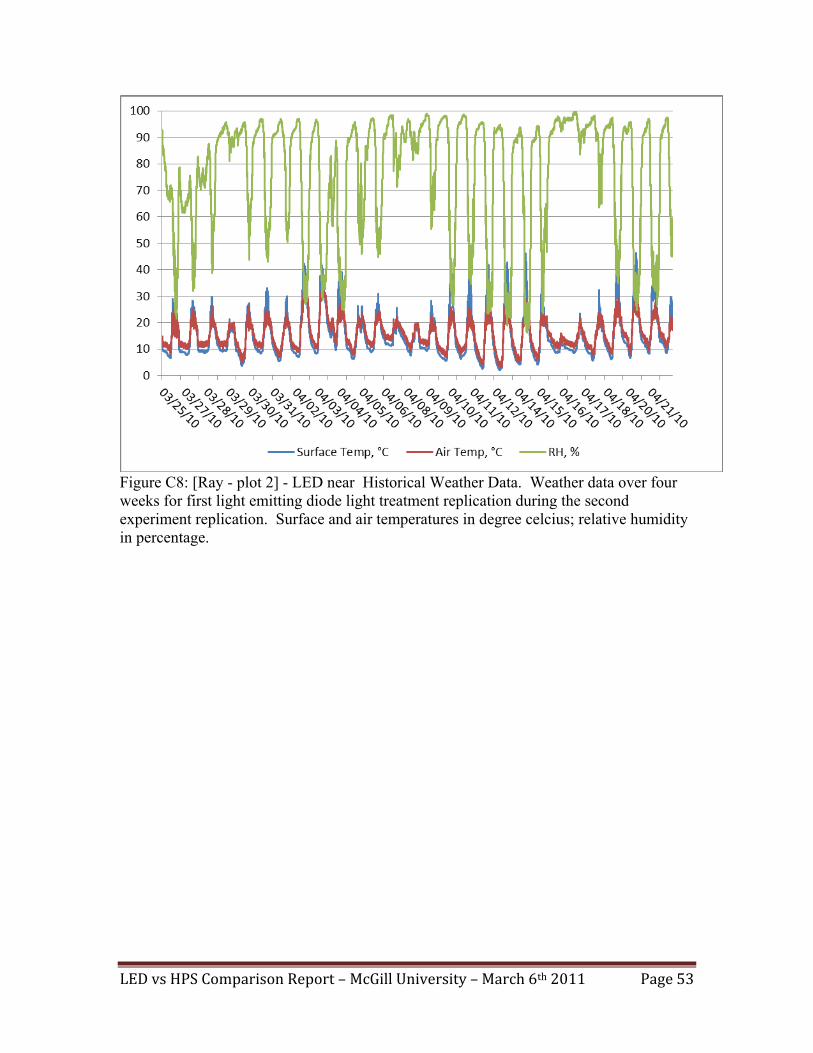
Figure C8: [Ray - plot 2] - LED near Historical Weather Data. Weather data over four weeks for first light emitting diode light treatment replication during the second experiment replication. Surface and air temperatures in degree celcius; relative humidity in percentage.

LED vs HPS Comparison Report – McGill University – March 6th 2011 Page 54
Figure C9: [John - plot 3] - Control Historical Weather Data. Weather data over four weeks for the control (no additional artificial light) treatment during the second experiment replication. Surface and air temperatures in degree celcius; relative humidity in percentage.
LED vs HPS Comparison Report – McGill University – March 6th 2011 Page 55
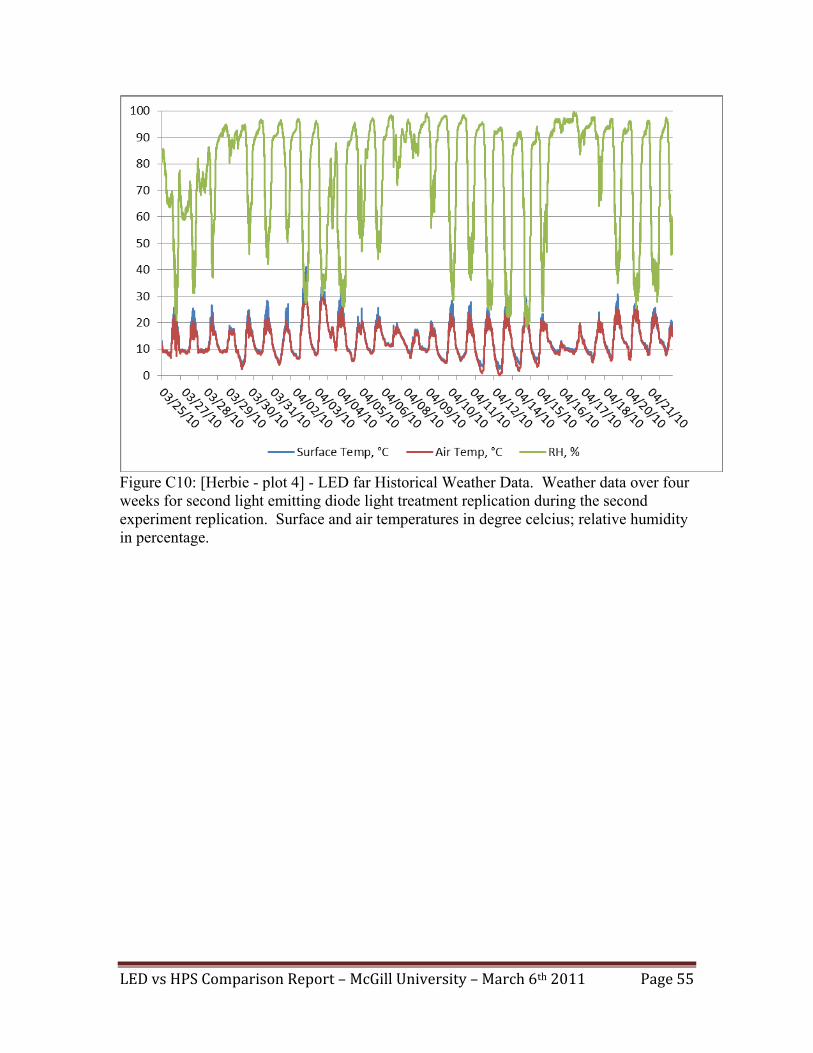
Figure C10: [Herbie - plot 4] - LED far Historical Weather Data. Weather data over four weeks for second light emitting diode light treatment replication during the second experiment replication. Surface and air temperatures in degree celcius; relative humidity in percentage.

LED vs HPS Comparison Report – McGill University – March 6th 2011 Page 56
Figure C11: [Aretha - plot 5] - HPS far Historical Weather Data. Weather data over four weeks for second high pressure sodium light treatment replication during the second experiment replication. Surface and air temperatures in degree celcius; relative humidity in percentage.

LED vs HPS Comparison Report – McGill University – March 6th 2011 Page 57
Figure C12: [Ella+Louis - plot 6] - Regular Historical Weather Data. Weather data over four weeks for the regular high pressure sodium light treatment during the second experiment replication. Surface and air temperatures in degree celcius; relative humidity in percentage.

LED vs HPS Comparison Report – McGill University – March 6th 2011 Page 58
Annex D
Weather data charts Replication #1 – radiation charts
Figure D1: [Herbie - plot 1] - HPS Near Historical Radiation Data. Radiation data over four weeks for first high pressure sodium light treatment replication during the first experiment replication. Solar radiation in watts per squared meters; Photosynthetically Active Radiation in micro-moles per meter2per second.

LED vs HPS Comparison Report – McGill University – March 6th 2011 Page 59
Figure D2: [Ella - plot 2] - LED near Historical Radiation Data. Radiation data over four weeks for first light emitting diode light treatment replication during the first experiment replication. Solar radiation in watts per squared meters; Photosynthetically Active Radiation in micro-moles per meter2per second..

LED vs HPS Comparison Report – McGill University – March 6th 2011 Page 60
Figure D3: [Ray - plot 3] – Regular Historical Radiation Data. Radiation data over four weeks for the regular high pressure sodium light treatment during the first experiment replication. Solar radiation in watts per squared meters; Photosynthetically Active Radiation in micro-moles per meter2per second.

LED vs HPS Comparison Report – McGill University – March 6th 2011 Page 61
Figure D4: [Duke - plot 4] - LED far Historical Radiation Data. Radiation data over four weeks for second light emitting diode light treatment replication during the first experiment replication. Solar radiation in watts per squared meters; Photosynthetically Active Radiation in micro-moles per meter2per second.

LED vs HPS Comparison Report – McGill University – March 6th 2011 Page 62
Figure D5: [Aretha - plot 5] - HPS far Historical Radiation Data. Radiation data over four weeks for second high pressure sodium light treatment replication during the first experiment replication. Solar radiation in watts per squared meters; Photosynthetically Active Radiation in micro-moles per meter2per second.

LED vs HPS Comparison Report – McGill University – March 6th 2011 Page 63
Figure D6: [John - plot 6] – Control Historical Radiation Data. Radiation data over four weeks for the control (no additional artificial light) treatment during the first experiment replication. Solar radiation in watts per squared meters; Photosynthetically Active Radiation in micro-moles per meter2per second.
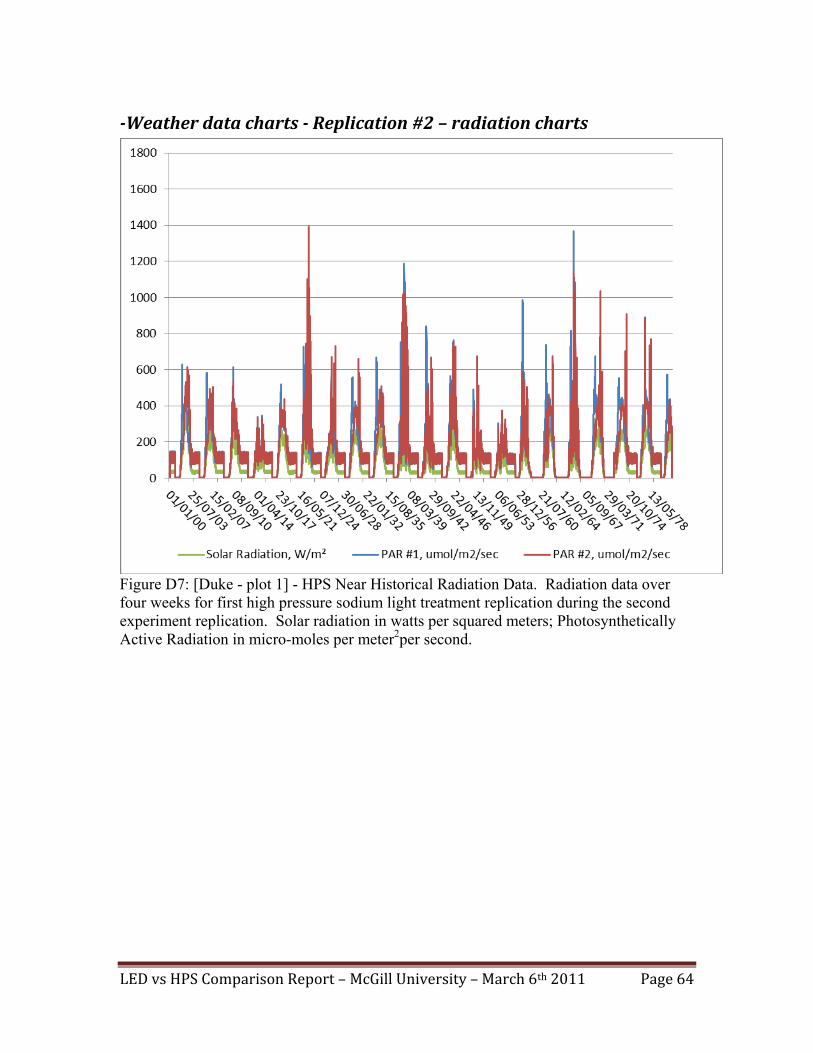
LED vs HPS Comparison Report – McGill University – March 6th 2011 Page 64
Weather data charts Replication #2 – radiation charts
Figure D7: [Duke - plot 1] - HPS Near Historical Radiation Data. Radiation data over four weeks for first high pressure sodium light treatment replication during the second experiment replication. Solar radiation in watts per squared meters; Photosynthetically Active Radiation in micro-moles per meter2per second.

LED vs HPS Comparison Report – McGill University – March 6th 2011 Page 65
Figure D8: [Ray - plot 2] - LED near Historical Radiation Data. Radiation data over four weeks for first light emitting diode light treatment replication during the second experiment replication. Solar radiation in watts per squared meters; Photosynthetically Active Radiation in micro-moles per meter2per second.

LED vs HPS Comparison Report – McGill University – March 6th 2011 Page 66
Figure D9: [John - plot 3] - Control Historical Radiation Data. Radiation data over four weeks for the control (no additional artificial light) treatment during the second experiment replication. Solar radiation in watts per squared meters; Photosynthetically Active Radiation in micro-moles per meter2per second.

LED vs HPS Comparison Report – McGill University – March 6th 2011 Page 67
Figure D10: [Herbie - plot 4] - LED far Historical Radiation Data. Radiation data over four weeks for second light emitting diode light treatment replication during the second experiment replication. Solar radiation in watts per squared meters; Photosynthetically Active Radiation in micro-moles per meter2per second.
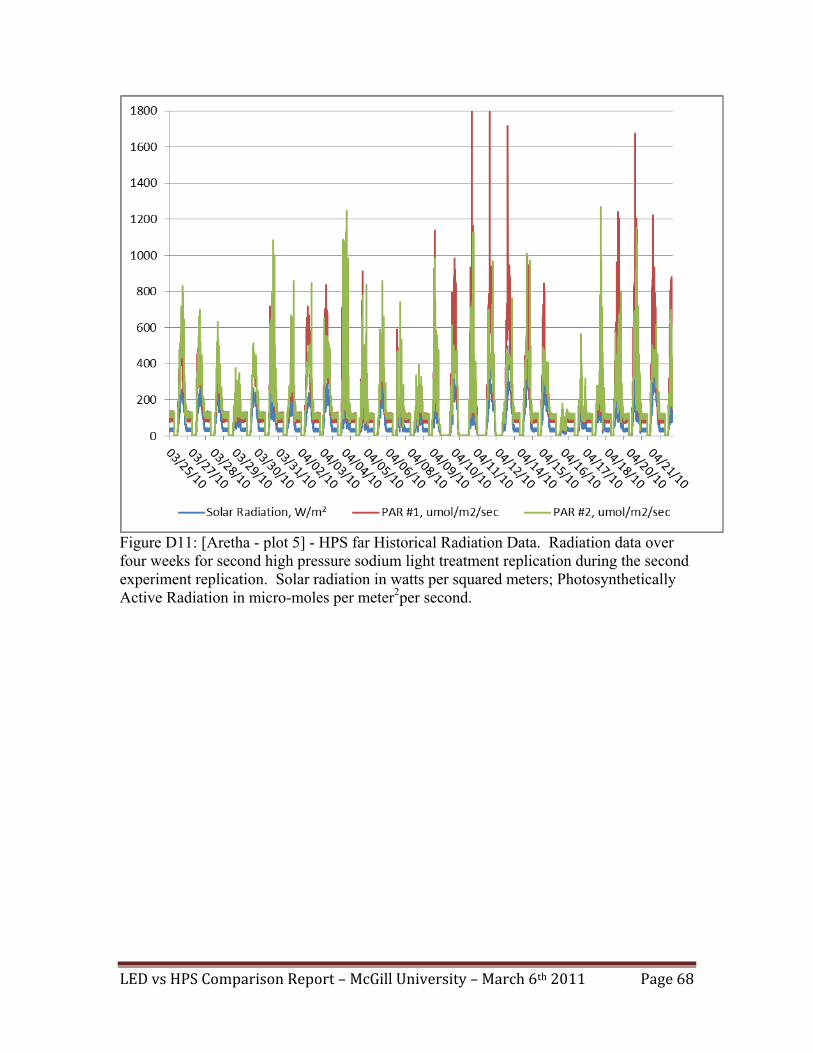
LED vs HPS Comparison Report – McGill University – March 6th 2011 Page 68
Figure D11: [Aretha - plot 5] - HPS far Historical Radiation Data. Radiation data over four weeks for second high pressure sodium light treatment replication during the second experiment replication. Solar radiation in watts per squared meters; Photosynthetically Active Radiation in micro-moles per meter2per second.

LED vs HPS Comparison Report – McGill University – March 6th 2011 Page 69
Figure D12: [Ella+Louis - plot 6] - Regular Historical Radiation Data. Radiation data over four weeks for the regular high pressure sodium light treatment during the second experiment replication. Solar radiation in watts per squared meters; Photosynthetically Active Radiation in micro-moles per meter2per second.

LED vs HPS Comparison Report – McGill University – March 6th 2011 Page 70
Annex E
Statistically significant (p>0.05) aspects and interactions -Overall dataset for plant masses: Overall masses - wet: run * week Overall masses - dry: week -Separated by runs: 1st run only – wet: week 1st run only – dry: light * replication * week 2nd run only – wet: week, week*light 2nd run only – dry: week -Separated by runs, then light treatments: 1st run – LED only – wet: week 1st run – LED only – dry: week 1st run – HPS only – wet: week 1st run – HPS only – dry: week, week*replication 1st run – Control only – wet: week 1st run – Control only – dry: week 1st run – Regular only – wet: week 1st run – Regular only – dry: week 2nd run – LED only – wet: week 2nd run – LED only – dry: week 2nd run – HPS only – wet: week 2nd run – HPS only – dry: week 2nd run – Control only – wet: week 2nd run – Control only – dry: week 2nd run – Regular only – wet: week 2nd run – Regular only – dry: week -Separated by weeks 1st week only – wet: run 1st week only – dry: nothing 2nd week only – wet: run*light*replication

LED vs HPS Comparison Report – McGill University – March 6th 2011 Page 71
2nd week only – dry: run 3rd week only – wet: run 3rd week only – dry: run 4th week only – wet: run 4th week only – dry: nothing -LED versus HPS light treatment over both runs and both replication: Wet: nothing Dry: week LED versus HPS light treatment over 1st run and both replication: Wet: week Dry: week*light*replication LED versus HPS light treatment over 2nd run and both replication: Wet: week, week*light Dry: week -Overall dataset for light maps: Total: light, light*time, light*time*replication -Separated by runs only: 1st run only: light*replication 2nd run only: light, replication 3rd run only: light -Separated by light treatments over all runs LED only: time, replication HPS only: time*replication Control only: time Regular only: time

LED vs HPS Comparison Report – McGill University – March 6th 2011 Page 72
Annex F
Curve fits for wet plant growth cycle
Equation Model Summary Parameter EstimatesR Square F df1 df2 Sig. Constant b1 b2
Quadratic 0.93 512.622 2 77 0 6.866 ‐1.47 8.524
Model Summary and Parameter Estimates
Figure F1: Quadratic Curve Fit Of Wet Masses Versus Sampling Weeks For LED Light Treatment – 1st Replication. Quadratic curve fit for wet masses under LED light treatment with table describing the parameters of the quadratic equation.

LED vs HPS Comparison Report – McGill University – March 6th 2011 Page 73
Equation Model Summary Parameter EstimatesR Square F df1 df2 Sig. Constant b1 b2
Quadratic 0.837 197.63 2 77 0 4.51 ‐0.584 3.103
Model Summary and Parameter Estimates
Figure F2: Quadratic Curve Fit Of Wet Masses Versus Sampling Weeks For LED Light Treatment – 2nd Replication. Quadratic curve fit for wet masses under LED light treatment with table describing the parameters of the quadratic equation.

LED vs HPS Comparison Report – McGill University – March 6th 2011 Page 74
Equation Model Summary Parameter EstimatesR Square F df1 df2 Sig. Constant b1 b2
Quadratic 0.929 500.949 2 77 0 10.847 ‐11.29 12.35
Model Summary and Parameter Estimates
Figure F3: Quadratic Curve Fit Of Wet Masses Versus Sampling Weeks For HPS Light Treatment – 1st Replication. Quadratic curve fit for wet masses under HPS light treatment with table describing the parameters of the quadratic equation.

LED vs HPS Comparison Report – McGill University – March 6th 2011 Page 75
Equation Model Summary Parameter EstimatesR Square F df1 df2 Sig. Constant b1 b2
Quadratic 0.797 151.019 2 77 0 8.339 ‐6.565 5.259
Model Summary and Parameter Estimates
Figure F4: Quadratic Curve Fit Of Wet Masses Versus Sampling Weeks For HPS Light Treatment – 2nd Replication. Quadratic curve fit for wet masses under HPS light treatment with table describing the parameters of the quadratic equation.

LED vs HPS Comparison Report – McGill University – March 6th 2011 Page 76
Equation Model Summary Parameter EstimatesR Square F df1 df2 Sig. Constant b1 b2
Quadratic 0.913 195.336 2 37 0 32.445 ‐28.976 13.1
Model Summary and Parameter Estimates
Figure F5: Quadratic Curve Fit Of Wet Masses Versus Sampling Weeks For Regular HPS Light Treatment – 1st Replication. Quadratic curve fit for wet masses under regular HPS light treatment with table describing the parameters of the quadratic equation.

LED vs HPS Comparison Report – McGill University – March 6th 2011 Page 77
Equation Model Summary Parameter EstimatesR Square F df1 df2 Sig. Constant b1 b2
Quadratic 0.955 396.899 2 37 0 16.185 ‐17.376 8.14
Model Summary and Parameter Estimates
Figure F6: Quadratic Curve Fit Of Wet Masses Versus Sampling Weeks For Regular HPS Light Treatment – 2nd Replication. Quadratic curve fit for wet masses under regular HPS light treatment with table describing the parameters of the quadratic equation.

LED vs HPS Comparison Report – McGill University – March 6th 2011 Page 78
Equation Model Summary Parameter EstimatesR Square F df1 df2 Sig. Constant b1 b2
Quadratic 0.975 711.299 2 37 0 23.677 ‐24.213 11.94
Model Summary and Parameter Estimates
Figure F7: Quadratic Curve Fit Of Wet Masses Versus Sampling Weeks For Control Light Treatment – 1st Replication. Quadratic curve fit for wet masses under control light treatment with table describing the parameters of the quadratic equation.

LED vs HPS Comparison Report – McGill University – March 6th 2011 Page 79
Equation Model Summary Parameter EstimatesR Square F df1 df2 Sig. Constant b1 b2
Quadratic 0.855 109.308 2 37 0 5.255 ‐1.597 2.965
Model Summary and Parameter Estimates
Figure F6: Quadratic Curve Fit Of Wet Masses Versus Sampling Weeks For Control Light Treatment – 2nd Replication. Quadratic curve fit for wet masses under control light treatment with table describing the parameters of the quadratic equation.

LED vs HPS Comparison Report – McGill University – March 6th 2011 Page 80
Annex G
Tables of wet and dry ratio of plant mass versus irradiation Table G1: Ratio of Plant Mass versus Artificial Light per meter2. Wet and dry plant mass in grams versus artificial light in moles per meter2. Supplemental light only wet ratio dry ratio supl light/total light
percentageHPS near ‐ run 1 2.31 0.12 22.7%HPS far ‐ run 1 2.15 0.09 19.6%HPS average ‐ run 1 2.23 0.10 21.1%
HPS near ‐ run 2 1.13 0.09 21.7%HPS far ‐ run 2 0.83 0.05 20.1%HPS average ‐ run 2 0.98 0.07 20.9%
LED near ‐ run 1 4.70 0.26 10.9%LED far ‐ run 1 3.67 0.19 10.7%LED average ‐ run 1 4.19 0.22 10.8%
LED near ‐ run 2 1.27 0.10 11.6%LED far ‐ run 2 1.14 0.08 12.0%LED average ‐ run 2 1.21 0.09 11.8%
Regular ‐ run 1 10.04 0.56 4.8%Regular ‐ run 2 6.02 0.33 4.2%
Control ‐ run 1 120.23 6.22 0.3%Control ‐ run 2 11.41 0.85 1.1%
grams/moles of light/m2
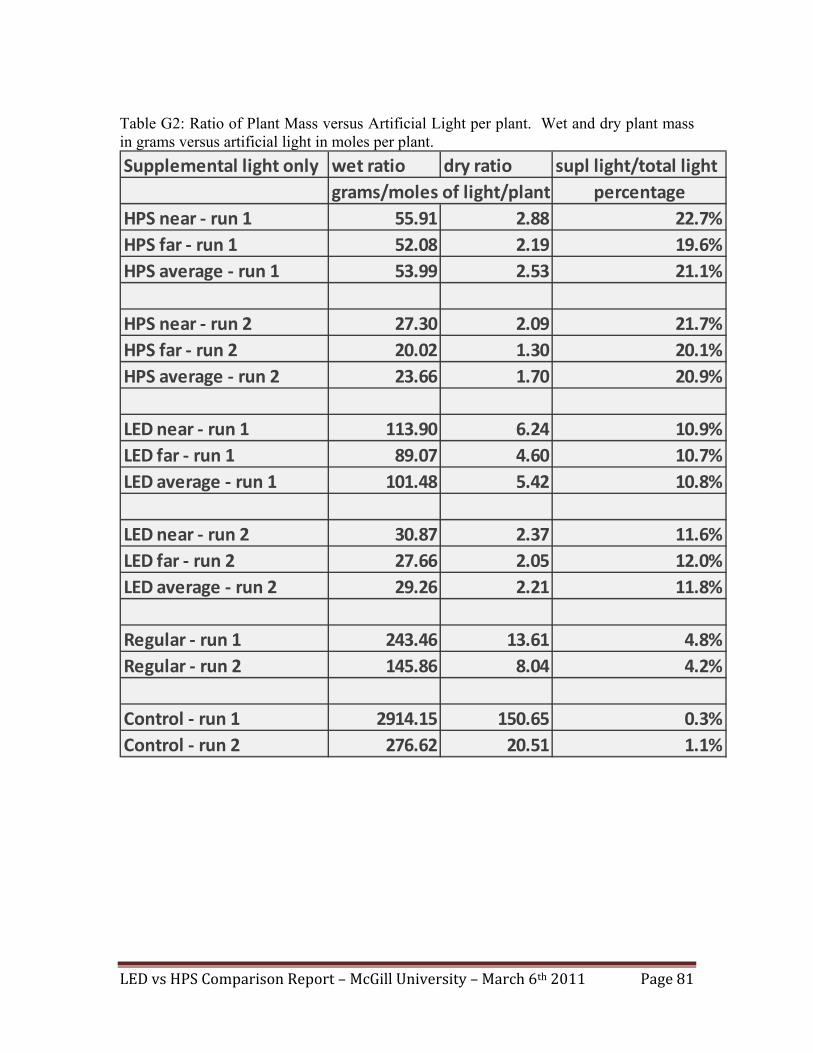
LED vs HPS Comparison Report – McGill University – March 6th 2011 Page 81
Table G2: Ratio of Plant Mass versus Artificial Light per plant. Wet and dry plant mass in grams versus artificial light in moles per plant. Supplemental light only wet ratio dry ratio supl light/total light
percentageHPS near ‐ run 1 55.91 2.88 22.7%HPS far ‐ run 1 52.08 2.19 19.6%HPS average ‐ run 1 53.99 2.53 21.1%
HPS near ‐ run 2 27.30 2.09 21.7%HPS far ‐ run 2 20.02 1.30 20.1%HPS average ‐ run 2 23.66 1.70 20.9%
LED near ‐ run 1 113.90 6.24 10.9%LED far ‐ run 1 89.07 4.60 10.7%LED average ‐ run 1 101.48 5.42 10.8%
LED near ‐ run 2 30.87 2.37 11.6%LED far ‐ run 2 27.66 2.05 12.0%LED average ‐ run 2 29.26 2.21 11.8%
Regular ‐ run 1 243.46 13.61 4.8%Regular ‐ run 2 145.86 8.04 4.2%
Control ‐ run 1 2914.15 150.65 0.3%Control ‐ run 2 276.62 20.51 1.1%
grams/moles of light/plant
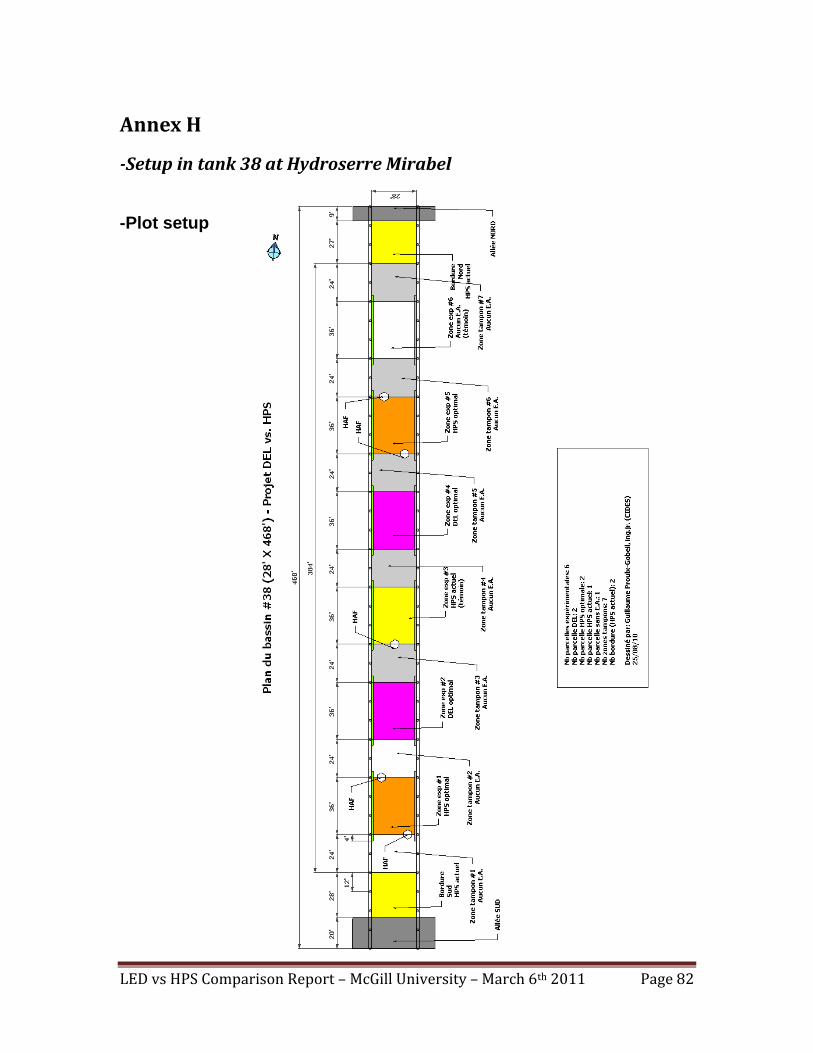
LED vs HPS Comparison Report – McGill University – March 6th 2011 Page 82
Annex H
Setup in tank 38 at Hydroserre Mirabel
-Plot setup

LED vs HPS Comparison Report – McGill University – March 6th 2011 Page 83
-Screen location between tank 37, 38 and 39
‐Les plastiques entre les bassins 37 et 38 et également entre les bassins 38 et 39 devront être opaque et blanc.
‐Les plastiques doivent être installés sur les côtés des zones expérimentales et dépasser de 4’ de chaque côté de la zone expérimentale

LED vs HPS Comparison Report – McGill University – March 6th 2011 Page 84
-LED lighting plan

LED vs HPS Comparison Report – McGill University – March 6th 2011 Page 85
-HPS lighting plan
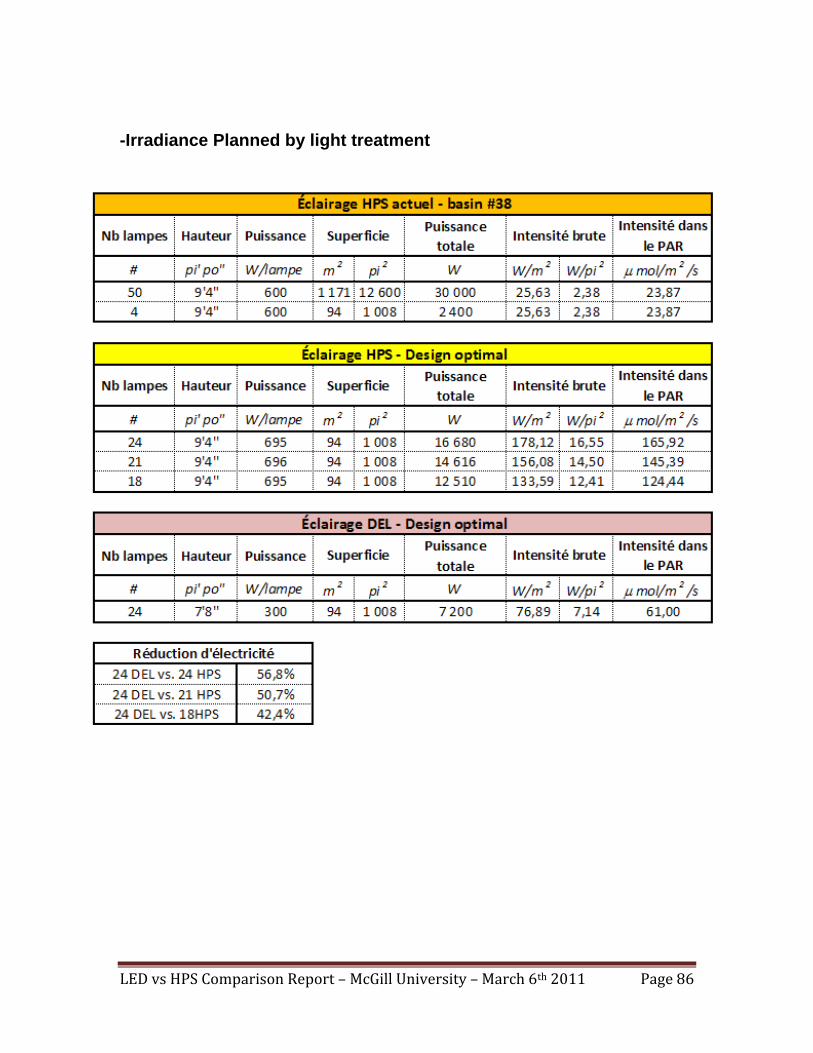
LED vs HPS Comparison Report – McGill University – March 6th 2011 Page 86
-Irradiance Planned by light treatment

LED vs HPS Comparison Report – McGill University – March 6th 2011 Page 87
Annex I
Greenhouse setup
Description Donnée • Systèmes de chauffage de l’eau • Échangeur de chaleur
entre l’eau du bassin et le chauffe eau
• Emplacement des systèmes de chauffage de l’air ambiant
• Tuyau radian de chaque côté de chaque bassin
• Forme et superficie des lampes HPS et DEL
• Carré 14in x 14in
o HPS • Réflecteur carré de 11.5po x 11.5 po
• Ballast 15po x 7po
o LED • Carré, 14 po x 14 po
• Age et nombre d’heur d’utilisation :
•
o Ballast o Janvier 2000
o Environ 12 300 heures
o Ampoules HPS o Neuve
o Lampe DEL o Neuve -10hrs
• Recette spectrale des lampes DEL (graphique)
• Voir graphique
• Positionnement des points de jonction de fermeture des rideaux et les points d’ouverture maximale
• Voir document joint
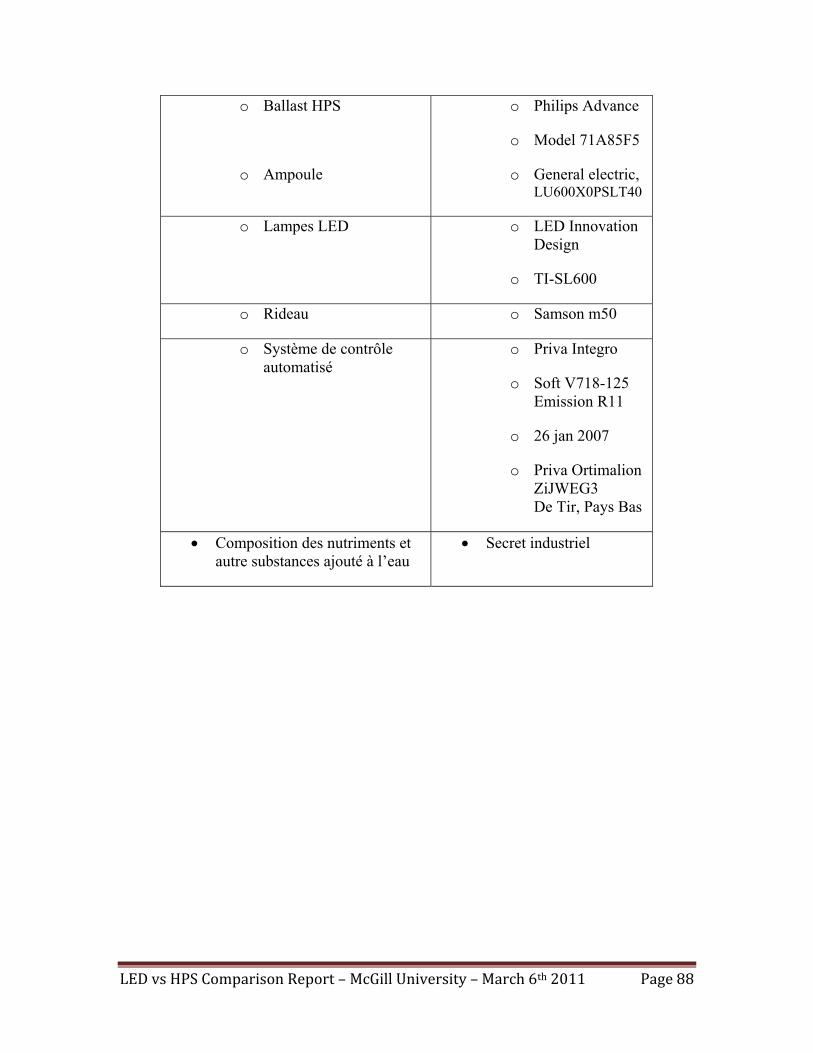
LED vs HPS Comparison Report – McGill University – March 6th 2011 Page 88
o Ballast HPS
o Ampoule
o Philips Advance
o Model 71A85F5
o General electric, LU600X0PSLT40
o Lampes LED o LED Innovation Design
o TI-SL600
o Rideau o Samson m50
o Système de contrôle automatisé
o Priva Integro
o Soft V718-125 Emission R11
o 26 jan 2007
o Priva Ortimalion ZiJWEG3 De Tir, Pays Bas
• Composition des nutriments et autre substances ajouté à l’eau
• Secret industriel

LED vs HPS Comparison Report – McGill University – March 6th 2011 Page 89
Automated instruction
Description Planifié Exécuté • Rideau et stage
d’ouverture • • Fermé après le couché du
soleil. • Programme ombrageant
o 500W/m2 @ 50% o 550W/m2 @ 50% de 50% o 600W/ m2 @60% de 50% o 650W/ m2 @ 75% de 50% o 700W/ m2 @ 100 de 50%
• HAF et stage • • En fonction lorsque les
lampes sont allumé • Consigne de
l’éclairage • Ouverture 2.5h avant
le couché du soleil, fermeture 8h après
• Ouverture 2.5h avant le couché du soleil, fermeture 8h après
• Comment était calculé voir interprété par le système le couché du soleil
• • Consigne selon les tables de système Priva
• Consigne CO2 • • De 05h à 03h entre 300 et 1200 ppm selon la table du couché et du levée du soleil incorporé au logiciel
o Eau • • Constant à 16ºC en hiver jusqu’à la fermeture des bouilloires

LED vs HPS Comparison Report – McGill University – March 6th 2011 Page 90
Annex J
Power consumption measures and methods Les mesures ont été faites utilisant un montage permettant d’ouvrir le circuit et y insérer
deux multimètres afin de lire simultanément le courant et la tension.
• Un multimètre MTP model 2325 a été utilisé afin de lire la tension. Installé sur
l’échelle de 700V AC le multimètre a résolution de 1V avec une précision de
1,2% et une impédance de 10MΩ.
• Le courant est mesuré à l’aide d’un multimètre Fluke 179 (True RMS multieter),
sur la position des ampères AC en mode de sélection d’échelle automatique avec
une résolution de 0,001A sur l’échelle de 1 à 6 A avec une précision de 1,5% à
37mV/A.
Les appareils de mesures ont été branchés puis l’alimentation électrique a été activée afin
de mettre les lampes sous tensions. Pour les lampes HPS, la tension ainsi que le courant
ont été notés à tous les 5 minutes pour une période maximale de 40 minutes afin d’utiliser
une lecture seulement une fois la lampe stabilisée.
La première lampe LED a été selon le même échantillonnage que les lampes HPS
cependant, puisqu’il n’y avait pratiquement aucune variation de courant, pour la
deuxième lampe seul une lecture prise.

LED vs HPS Comparison Report – McGill University – March 6th 2011 Page 91
Tableau des lectures électriques pour lampes HPS HPS 1 HPS 2
Temps /min Amp Volt Watt Temps Amp Volt Watt
0 1,489 343 510,727 0 1,466 345 505,770 5 - 343 - 5 1,556 345 536,820
10 - 343 - 10 1,675 345 577,875 15 1,943 343 666,449 15 1,875 345 646,875 20 1,950 343 668,850 20 1,879 345 648,255 25 1,955 343 670,565 25 1,881 345 648,945 30 1,947 343 667,821 30 1,860 345 641,700 35 1,945 343 667,135 35 1,870 345 645,150 40 1,946 343 667,478 40 1,871 345 645,495
HPS 3 HPS 4 Temps /
min Amp Volt Watt Temps /
min Amp Volt Watt 0 1,487 343 510,041 0 1,472 345 507,840 5 1,556 343 533,708 5 1,620 345 558,900
10 1,632 343 559,776 10 1,691 345 583,395 15 1,843 343 632,149 15 1,851 345 638,595 20 1,857 343 636,951 20 1,856 345 640,320 25 1,863 343 639,009 25 1,859 345 641,355 30 1,869 343 641,067 30 1,856 345 640,320 35 1,865 343 639,695 35 1,857 345 640,665 40 1,866 343 640,038 40 1,862 345 642,390
Tableau des lecture des lampes LED (TI SmartLamp SL600)
LED 1 LED 2 Temps /
min Amp Volt Watt Temps /
min Amp Volt Watt 0 1,682 $ 189,300 $ 318,40 $ 0 1,69 189,40 320,095 1,676 $ 189,700 $ 317,94 $ 5 1,69 190,10 321,27
10 1,672 $ 189,900 $ 317,51 $ 10 1,68 189,80 318,8615 1,674 $ 189,900 $ 317,89 $ 15 1,69 189,70 320,5920 1,672 $ 189,900 $ 317,51 $ 20 1,67 189,90 317,1325 1,672 $ 190,100 $ 317,85 $ 25 1,68 190,00 319,2030 1,672 $ 189,900 $ 317,51 $ 30 1,67 190,10 317,4735 1,672 $ 190,000 $ 317,68 $ 35 1,68 190,10 319,3740 1,672 $ 189,900 $ 317,51 $ 40 1,70 189,90 322,07

LED vs HPS Comparison Report – McGill University – March 6th 2011 Page 92
Annex K
Random harvesting method
Méthode par adresse et plant fixe sur la plaque Nombre de 3 lignes (fixe)Line row 1 row 2 row 3 row 4 row 5 row 6 row 7
1o o o o o o o o o o o o o o
o o o o
o o o o o o o o o o o o o o
o o o o
o o o o o o o o o o o o o o
o o o o
o o o o o o o o o o o o o o
o o o o
o o o o o o o o o o o o o o
o o o o
o o o o o o o o o o o o o o
o o o o
o o o o o o o o o o o o o o
o o o o
2o o o o o o o o o o o o o o
o o o o
o o o o o o o o o o o o o o
o o o o
o o o o o o o o o o o o o o
o o o o
o o o o o o o o o o o o o o
o o o o
o o o o o o o o o o o o o o
o o o o
o o o o o o o o o o o o o o
o o o o
o o o o o o o o o o o o o o
o o o o
3o o o o o o o o o o o o o o
o o o o
o o o o X o o o o o o o o o
o o o o
o o o o o o o o o o o o o o
o o o o
o o o o X o o o o o o o o o
o o o o
o o o o X o o o o o o o o o
o o o o
o o o o X o o o o o o o o o
o o o o
o o o o o o o o o o o o o o
o o o o 30-60-90
4o o o o o o o o o o o o o o
o o o o
o o o o o o o o o o o o o o
o o o o
o o o o o o o o o o o o o o
o o o o
o o o o o o o o o o o o o o
o o o o
o o o o o o o o o o o o o o
o o o o
o o o o o o o o o o o o o o
o o o o
o o o o o o o o o o o o o o
o o o o 120-150-180
5o o o o o o o o o o o o o o
o o o o
o o o o o o o o o o o o o o
o o o o
o o o o o o o o o o o o o o
o o o o
o o o o o o o o o o o o o o
o o o o
o o o o o o o o o o o o o o
o o o o
o o o o o o o o o o o o o o
o o o o
o o o o o o o o o o o o o o
o o o o 210-240-270
6o o o o o o o o o o o o o o
o o o o
o o o o o o o o o o o o o o
o o o o
o o o o o o o o o o o o o o
o o o o
o o o o o o o o o o o o o o
o o o o
o o o o o o o o o o o o o o
o o o o
o o o o o o o o o o o o o o
o o o o
o o o o o o o o o o o o o o
o o o o 300-330-360
7o o o o o o o o o o o o o o
o o o o
o o o o o o o o o o o o o o
o o o o
o o o o o o o o o o o o o o
o o o o
o o o o o o o o o o o o o o
o o o o
o o o o o o o o o o o o o o
o o o o
o o o o o o o o o o o o o o
o o o o
o o o o o o o o o o o o o o
o o o o 390-420-450
8o o o o o o o o o o o o o o
o o o o
o o o o o o o o o o o o o o
o o o o
o o o o o o o o o o o o o o
o o o o
o o o o o o o o o o o o o o
o o o o
o o o o o o o o o o o o o o
o o o o
o o o o o o o o o o o o o o
o o o o
o o o o o o o o o o o o o o
o o o o
9o o o o o o o o o o o o o o
o o o o
o o o o o o o o o o o o o o
o o o o
o o o o o o o o o o o o o o
o o o o
o o o o o o o o o o o o o o
o o o o
o o o o o o o o o o o o o o
o o o o
o o o o o o o o o o o o o o
o o o o
o o o o o o o o o o o o o o
o o o o
10o o o o o o o o o o o o o o
o o o o
o o o o X o o o o o o o o o
o o o o
o o o o X o o o o o o o o o
o o o o
o o o o o o o o o o o o o o
o o o o
o o o o o o o o o o o o o o
o o o o
o o o o X o o o o o o o o o
o o o o
o o o o o o o o o o o o o o
o o o o
11o o o o o o o o o o o o o o
o o o o
o o o o o o o o o o o o o o
o o o o
o o o o o o o o o o o o o o
o o o o
o o o o o o o o o o o o o o
o o o o
o o o o o o o o o o o o o o
o o o o
o o o o o o o o o o o o o o
o o o o
o o o o o o o o o o o o o o
o o o o
12o o o o o o o o o o o o o o
o o o o
o o o o o o o o o o o o o o
o o o o
o o o o o o o o o o o o o o
o o o o
o o o o o o o o o o o o o o
o o o o
o o o o o o o o o o o o o o
o o o o
o o o o o o o o o o o o o o
o o o o
o o o o o o o o o o o o o o
o o o o
13o o o o o o o o o o o o o o
o o o o
o o o o o o o o o o o o o o
o o o o
o o o o o o o o o o o o o o
o o o o
o o o o o o o o o o o o o o
o o o o
o o o o o o o o o o o o o o
o o o o
o o o o o o o o o o o o o o
o o o o
o o o o o o o o o o o o o o
o o o o
14o o o o o o o o o o o o o o
o o o o
o o o o o o o o o o o o o o
o o o o
o o o o X o o o o o o o o o
o o o o
o o o o X o o o o o o o o o
o o o o
o o o o X o o o o o o o o o
o o o o
o o o o o o o o o o o o o o
o o o o
o o o o o o o o o o o o o o
o o o o
15o o o o o o o o o o o o o o
o o o o
o o o o o o o o o o o o o o
o o o o
o o o o o o o o o o o o o o
o o o o
o o o o o o o o o o o o o o
o o o o
o o o o o o o o o o o o o o
o o o o
o o o o o o o o o o o o o o
o o o o
o o o o o o o o o o o o o o
o o o o
16o o o o o o o o o o o o o o
o o o o
o o o o o o o o o o o o o o
o o o o
o o o o o o o o o o o o o o
o o o o
o o o o o o o o o o o o o o
o o o o
o o o o o o o o o o o o o o
o o o o
o o o o o o o o o o o o o o
o o o o
o o o o o o o o o o o o o o
o o o o
17o o o o o o o o o o o o o o
o o o o
o o o o o o o o o o o o o o
o o o o
o o o o o o o o o o o o o o
o o o o
o o o o o o o o o o o o o o
o o o o
o o o o o o o o o o o o o o
o o o o
o o o o o o o o o o o o o o
o o o o
o o o o o o o o o o o o o o
o o o o
18o o o o o o o o o o o o o o
o o o o
o o o o o o o o o o o o o o
o o o o
o o o o o o o o o o o o o o
o o o o
o o o o o o o o o o o o o o
o o o o
o o o o o o o o o o o o o o
o o o o
o o o o o o o o o o o o o o
o o o o
o o o o o o o o o o o o o o
o o o o
When an hole is encountred or a sick plant just move two plants at northPlant number on the plate (1) #NOM? 5
Lines (3) #NOM? #NOM? #NOM? 10 3 14row 1 #NOM? #NOM? #NOM? 3 4 3row 2 #NOM? #NOM? #NOM? 6 5 4row 3 #NOM? #NOM? #NOM? 2 6 5row 4 #NOM? 2

LED vs HPS Comparison Report – McGill University – March 6th 2011 Page 93
Annex L
Originally planned artificial light program
Couché du soleil 16:40:00 Fin de E.A. 01:10 Sans éclairage 6 h 21Durée du jour 9:09:00 Levé du soleil 07:31 Éclairage naturel seulement 7 h 09Durée de l'éclairage 10:30:00 Début E.A. 14:40 E.Nat + E.A. 2 h 00Photopériode 18:30:00 Couché du soleil 16:40 Éclairage artificiel seulement 8 h 30Éclairage avant couché du soleil 2:00:00 Fin de E.A. 01:10
Début éclairage 14:40:00
25:10:001:10:00
Fin de E.A. 01:50 Sans éclairage 5 h 10Couché du soleil 17:20:00 Levé du soleil 07:00 Éclairage naturel seulement 8 h 20Durée du jour 10:22:00 Début E.A. 15:20 E.Nat + E.A. 2 h 00Durée de l'éclairage 10:30:00 Couché du soleil 17:20 Éclairage artificiel seulement 8 h 30
Photopériode 18:30:00 Fin de E.A. 01:50Éclairage avant couché du soleil 2:00:00Début éclairage 15:20:00
25:50:001:50:00
Janvier (exemple basé sur la moyenne du mois)
Février (exemple basé sur la moyenne du mois)
Programme d'éclairage #1
Fin éclairage
L'éclairage artificiel débute toujours 2 heures avant le coucher du soleil et sa durée est fixe 10:30 pour chacun des lots (janvier et février)
Fin éclairage
Janvier
Février
Horaire d'éclairage Durée d'éclairage
Horaire d'éclairage Durée d'éclairage

LED vs HPS Comparison Report – McGill University – March 6th 2011 Page 94
Annex M SamrtLamp
Presentation of the SmartLamp

LED vs HPS Comparison Report – McGill University – March 6th 2011 Page 95
Technical specification

LED vs HPS Comparison Report – McGill University – March 6th 2011 Page 96
Reliability
Extract from design review report from Hardent (2008)

LED vs HPS Comparison Report – McGill University – March 6th 2011 Page 97

LED vs HPS Comparison Report – McGill University – March 6th 2011 Page 98
SmartLamp Design SmartLamp are designed with : Philips LUXEON Rebel LED 640 nm red AllnGap jonc 450 nm bleu InGaN Cool White Edison Opto – Federal 400 nm UV royal bleu InGaN 735 nm IR Power Supply Power factor input 90 to 240 V AC to 400 V DC Constant current driver : 2 string of 400 V DC for all LED at 600 mA for LUXEON LED and 350 mA for IR and UV LED. Thermal imagery Power factor Constant Current driver

LED vs HPS Comparison Report – McGill University – March 6th 2011 Page 99
LED
Life time based on a junction temperature of 67º C for 60 000 hrs

LED vs HPS Comparison Report – McGill University – March 6th 2011 Page 100
Lamp Calibration Report

LED vs HPS Comparison Report – McGill University – March 6th 2011 Page 101

LED vs HPS Comparison Report – McGill University – March 6th 2011 Page 102

LED vs HPS Comparison Report – McGill University – March 6th 2011 Page 103

LED vs HPS Comparison Report – McGill University – March 6th 2011 Page 104

LED vs HPS Comparison Report – McGill University – March 6th 2011 Page 105
Annex N
HPS vs SmartLamp spectrum comparison Light irradiance from HPS 600
Area under the curve : 238 W/m2 (between 400nm and 700nm) Light irradiance from SmartLamp TI-SL600
Area under the curve : 78 W/m2 (between 400nm and 700nm)

LED vs HPS Comparison Report – McGill University – March 6th 2011 Page 106
Coût pour l'éclairage artificiel par année
Nb jour / moisEnsoleilment / jour
Nb Heure d'ut ilisat ion / jour
Photopériode totale
Puissance Consom Consom / mois redevance Coût 30 kW/h kW supp
Coût de la puissance Total
kW/h kW/h $ $ $ $Octobre 31 11 8,5 19,5 2 840,42 748 450,67 12,60 1,64 56 206,39 3 515,93 59 736,55Novembre 30 9,5 8,5 18 2 840,42 724 307,10 12,19 1,64 54 393,21 3 515,93 57 922,97Décembre 31 8,8 8,5 17,3 2 840,42 748 450,67 12,60 1,64 56 206,39 17 328,51 73 549,13Janvier 31 9,1 8,5 17,6 2 840,42 748 450,67 12,60 1,64 56 206,39 17 328,51 73 549,13Février 28 10,4 8,5 18,9 2 840,42 676 019,96 11,38 1,64 50 766,85 17 328,51 68 108,37Mars 31 11,9 8,5 20,4 2 840,42 748 450,67 12,60 1,64 56 206,39 17 328,51 73 549,13Total 182 60,7 51 111,7 17 042,52 4 394 129,74 73,96 9,81 329 985,63 76 345,89 406 415,2938% Considéré contribution au chauffage
Annexe O
Bilan énergétique pour les serres Hydroserre Mirabel
-Installation actuelle chez Hydroserre Mirabel Lampes dans l'installation actuelle
Nbrs de lampes Unité Qtée600 W 1200400 W 4814
Consommation HPS 2840,42 Tarification $Tarif électricité kWh 30 kW/h 0,0545Tarif électricité kWh supplémentaire 0,0751Au-delà 50kW 501er dec- 31 mars Hiver 6,211 avl -30 nov Été 1,26Nbr d'heures d'éclairage 8Redevance 0,4064 Consommation en chauffage
1 700 000 m2 gas naturel 19 000 l propane
16 000 000 kW électricité

LED vs HPS Comparison Report – McGill University – March 6th 2011 Page 107
Remplacement avec lampes DEL chez Hydroserre Mirabel avec une densité similaire à l’expérimentation Superficie et éclairage
Qtée Superficie couverte Unité
618 994 pi2
18 1 008 pi2
11 053 ch7 096 324 W
24 1 008 pi2
14 738 ch4 701 407 W
Nbr LED pour la superficie total à éclairerConsommation LED instantanné
Descript ion
Superficie total à éclairerLampes HPSNbr HPS pour la superficie totale à éclairéConsommation HPS instantannéLampes LED
Tarification
$0,05450,0751
50Hiver 6,21Été 1,26
80,4064
1 avl -30 novNbr d'heures d'éclairageRedevance
Tarif électricité kWh 30 kW/hTarif électricité kWh supplémentaireAu-delà 50kW1er dec- 31 mars
Nb jour / mois Soleil / jour
Nb Heure d'utilisation
/ jourPhotopériode
totale Puissance Consom redevanceCoût 30
kW/h kW suppCoût de la puissance Total
kW/h $ $ $ $
Octobre 31 11 8 19 7 096 324 12,60 1,64 132 167 614,31 8 941 305,33 141 108 933,88Novembre 30 9,5 8 17,5 7 096 324 12,19 1,64 127 904 142,81 8 941 305,33 136 845 461,97Décembre 31 8,8 8 16,8 7 096 324 12,60 1,64 132 167 614,31 44 067 861,98 176 235 490,53Janvier 31 9,1 8 17,1 7 096 324 12,60 1,64 132 167 614,31 44 067 861,98 176 235 490,53Février 28 10,4 8 18,4 7 096 324 11,38 1,64 119 377 199,81 44 067 861,98 163 445 074,80Mars 31 11,9 8 19,9 7 096 324 12,60 1,64 132 167 614,31 44 067 861,98 176 235 490,53Total 182 60,7 48 108,7 42 577 944 73,96 9,81 775 951 799,87 194 154 058,59 970 105 942,24
kW/h $ $ $ $
Octobre 31 11 8 19 4 701 406,81 12,60 1,64 87 562 759,29 5 923 709,58 93 486 483,11Novembre 30 9,5 8 17,5 4 701 406,81 12,19 1,64 84 738 154,08 5 923 709,58 90 661 877,49Décembre 31 8,8 8 16,8 4 701 406,81 12,60 1,64 87 562 759,29 29 195 425,79 116 758 199,31Janvier 31 9,1 8 17,1 4 701 406,81 12,60 1,64 87 562 759,29 29 195 425,79 116 758 199,31Février 28 10,4 8 18,4 4 701 406,81 11,38 1,64 79 088 943,66 29 195 425,79 108 284 382,46Mars 31 11,9 8 19,9 4 701 406,81 12,60 1,64 87 562 759,29 29 195 425,79 116 758 199,31Total 182 60,7 48 108,7 28 208 440,86 73,96 9,81 514 078 134,91 128 629 122,31 642 707 341,00
Différence 14 369 503,57 261 873 664,95 65 524 936,29 327 398 601,24% 33,75% 33,75% 33,75% 33,75%
3 486 999 533,3333,75%
Calcul de la consommation pour des lampes HPS
Calcul de la consommation pour des lampes DEL
Économie des lampes au DEL sur les lampes HPS
1 165 948 888,761 053 115 125,331 165 948 888,766 845 248 314,67
kW/h1 165 948 888,761 128 337 634,291 165 948 888,76
1 759 888 369,711 589 576 592,001 759 888 369,71
10 332 247 848,00
kW/h1 759 888 369,711 703 117 777,141 759 888 369,71
Consom / mois

LED vs HPS Comparison Report – McGill University – March 6th 2011 Page 108
Annexe P
Article of interrest
-Quantification of the Growth Response to Light Quantity of Greenhouse Grown Crops
L.F.M. Marcelis, A.G.M. Broekhuijsen E.M.F.M. Nijs and M.G.M. Raaphorst and E. Meinen PPO Applied Plant Research Plant Research International P.O. Box 8, 2670 AA Naaldwijk P.O. Box 16, 6700 AA Wageningen The Netherlands The Netherlands
Keywords: radiation, growth, yield, vegetables, flowers
Abstract Growers have often assumed that a 1% increment in light results in a 1%yield increase. In this study, this rule of thumb has been evaluated for a number of reenhouse grown crops: fruit vegetables (cucumber, tomato, sweet pepper), soil grown vegetables (lettuce, radish), cut flowers (rose, chrysanthemum), bulb flowers (freesia, lily), flowering pot plants (poinsettia, Kalanchoe), and non-flowering pot plants (Ficus, Dracaena). A literature survey was first carried out on the effects of light on growth, dry matter production and partitioning, dry matter content and harvestable yield. Subsequently, yield data for cucumber, poinsettia and rose from commercial growers were analysed. Finally, growers were interviewed to assess their crop management in relation to the available light. For most crops a 1% light increment results in 0.5 to 1% increase in harvestable product. As a rule of the thumb the following values may be used: 0.8-1% for soil grown vegetables, 0.7-1% for fruit vegetables, 0.6-1% for cut flowers, 0.25-1.25 for bulb flowers, 0.5-1% for flowering pot plants and 0.65% for non-flowering pot plants. These are average values, which depend on several factors. For instance, the relative effect of light on growth is greater at lower light levels, at higher CO2 concentrations and at higher temperatures. Consequently, the relative effect is larger in winter than in summertime. The effect of light on growth also depends on the duration and moment that the light level is changed. Besides a positive effect on yield quantity, light usually has a positive effect on quality as well. Light should not be considered as a separate growth factor in greenhouse horticulture, as it forms an integral part of the total farm management. Many growers, for instance, choose a higher temperature and adapt their plant density and cultivar choice when the light level is increased.

LED vs HPS Comparison Report – McGill University – March 6th 2011 Page 109
INTRODUCTION The growth rate of a crop largely depends on the radiation it receives. Considering a given solar radiation, the grower has several options to increase the amount of incident light on a crop, such as building a greenhouse with high light transmissivity, or using assimilation light. On the other hand, the use of some measures such as screens may reduce the amount of incident light on the crop.
In order to judge whether a measure affecting the light intensity is profitable, the grower needs to estimate its effect on production. For more than 20 years Dutch growers have usually taken a 1% additional light results in 1% additional growth and production as a rule of thumb. For cut flowers and pot plants there are indications that effects of light on production are less strong than in vegetable crops; for these crops 1% additional light it is often assumed to result in 0.5% additional growth and production.
Light is the driving force for photosynthesis, while it may also affect plant development, morphology, dry matter partitioning and water content. Despite the assumed proportionality between light and production, it is well known that leaf photosynthesis shows a non-linear relation to light. Moreover, effects of light are affected by many other factors, e.g. CO2 concentration, temperature and leaf area index.
In this study, the 1% rule of thumb has been evaluated for a number of greenhouse grown crops. The following groups of crops were studied: fruit vegetables, soil grown vegetables, cut flowers, bulb flowers, flowering pot plants, and non-flowering pot plants. A literature survey was first carried out on the effects of light on growth, dry matter production and partitioning, dry matter content and harvestable yield. Subsequently, yield data for cucumber, poinsettia and rose from commercial growers were analysed. Finally, growers were interviewed to assess their crop management in relation to the available light.
RESULTS AND DISCUSSION
Literature Survey Although the results of about 100 publications were analysed, the scope of this paper does not allow the citation of all these references.
The cumulative production or plant weight is often plotted against cumulative radiation. In many cases this results in a linear relationship starting at the origin, which indicates that 1% additional light results in 1% additional growth. However, plotting cumulative values against each other did not appear to be sufficiently accurate to estimate the effects of 1% additional light (e.g. see Demetriades-Shah et al., 1994).
Soil grown Vegetables (Lettuce, Radish)
A 1% decrease in radiation leads to a reduction in both the fresh and dry weight of lettuce heads by about 0.8% (e.g. De Pinheiro Henriques and Marcelis, 2000). The formation of radish tubers is strongly dependent on radiation. The effects of light are stronger on tuber weight than on sprout weight, and consequently, the shoot/tuber ratio increases at low light (Marcelis et al., 1997). Light in the final stage of tuber development has a stronger effect on the final tuber weight than light during the initial phase of the crop (Marcelis,

LED vs HPS Comparison Report – McGill University – March 6th 2011 Page 110
unpublished data). Effects of a 1% difference in light on the production of radish vary from 0.6 to 1.4, thus an average reduction of 1% seems reasonable.
Fruit Vegetables (Cucumber, Tomato, Sweet Pepper)
The literature on fruit vegetables yields interactions between the effects of light and other growth conditions (e.g. Nilwik, 1981; De Koning, 1989; Heuvelink, 1995; Cockshull et al., 1992). The effect of a reduction in radiation during a prolonged period has a relative stronger effect on cucumber yield than duration during a short period, due to changes in dry matter partitioning and water content (Marcelis, 1993). Furthermore, the relative effect of radiation decreases at low temperatures, low CO2 concentrations and at high light levels. The reduction in cucumber yield due to 1% less radiation varied in most 1ases between 0.6 and 1.2%, for tomato between 0.6 and 1.1%, while in sweet pepper it varied between 0.8 and 1.3%. These data seem to indicate that pepper is slightly more sensitive to light than are tomato and cucumber, but the data on sweet pepper were too limited to draw strong conclusions. For fruit vegetables in general, a 1% light reduction leads to an average yield reduction in the range of 0.8 to 1%.
Cut Flowers (Rose, Chrysanthemum)
A decrease in radiation results in less shoots, lower shoot weights and less quality in rose (e.g. Zieslin and Mor, 1990; Gislerød and Mortensen, 1997; Kim and Lee, 2002). Furthermore, flower buds may abort at low radiation levels, resulting in blind shoots. A reduction of 1% radiation reduced yield between 0.4 and 1.2%, but in most cases it was in between 0.8 and 1.0%. The effects of light in winter can be greater, but at high light levels the effects can be substantially smaller. In chrysanthemum, the effects of a 1% reduction in radiation led to yield reductions varying between 0.3 and 1.0%, but in most cases a yield reduction of 0.6% fitted reasonably with the observations (e.g. Lee et al., 2003). Quality is a much more important item in cut flowers than in vegetables, and quality usually is reduced by lowering the radiation. However, there is little quantitative information on these quality effects.
Bulb Flowers (Freesia, Lily)
The fresh weight of freesia shoots is reduced by 0.1 to 0.5% by a 1% light reduction, while the number of shoots decreased by 0.0 to 1.2%. Consequently, total fresh 99 weight production was reduced by 0-1.7% by 1% light reduction. These data were based on summer experiments. In winter the effects of light are likely to be stronger. In lily a 1% light reduction resulted in dry weight reductions of 0 to 1.4% and for bulb flowers the number of available data were too limited to draw general conclusions.
Flowering Pot Plants (Poinsettia, Kalanchoe)
There are only very few quantitative data available on the effects of light on growth of flowering pot plants. A decrease of 0.8-1% dry weight at 1% light reduction was found for Kalanchoe (e.g. Gislerød et al., 1989; Mortensen, 1994; Carvalho et al.,2005). In flowering pot plants other factors like plant morphology, leaf colour and shelf life are more important for the grower than weight, and light also has clear effects on these quality aspects. Some examples are that the number of flowers decrease at low radiation (e.g. Carvalho et al., 2005), while leaves may become pale at high light levels (e.g. Andersson, 1994).

LED vs HPS Comparison Report – McGill University – March 6th 2011 Page 111
Non-flowering Pot Plants (Ficus, Dracaena)
In non-flowering pot plants as well, quality is more important for the grower than plant weight. High radiation may have negative effects on leaf colour in Dracaena. Literature data for Ficus benjamina and Dracaena indicate on average a 0.65% reduction in plant weight (fresh and dry) at 1% reduction in light (e.g. Mortensen & Grimstad, 1990; Sarracino et al., 1992).
Analysis of Data from Commercial Growers A data set for cucumber was used with weekly values of harvested weight and the climate conditions of 14 growers during the period January 1996 to May 1997. The relative effect of radiation clearly depended on the radiation level (Figs. 1, 2). At the lowest radiation levels the effect of 1% light reduction on yield was much higher than 1%. At 3500 J cm-2 week-1 solar radiation (typical for February in Holland) this percentage was 1%, while at radiation levels higher than 10,000 J cm-2 week-1 it was about 0.5%. Averaged over the whole year 1% light reduction resulted in about 0.7% yield reduction. Note that in contrast to most of the literature data, other climate variables changed in these growers’ data, together with the radiation. The temperature was often higher and the CO2 concentration was lower at higher radiation. Regression analyses indicated that the effect of 1% additional light on yield would have been 0.9% if there were no negative correlations between radiation and CO2 concentration.
The monthly production values for rose during October, November, December from 40 growers were available. Differences in the light level were mainly due to differences in supplemental lighting. The relation between production and radiation showed a lot of variation, indicating that many more factors than light affect the production rate.
Production values for poinsettia for three periods (5-7 weeks per period) during September to December of 33 growers were available. Differences in light level were due to variation in natural light, transmissivity of the greenhouse and screens. These data showed that 1% additional light resulted in an increase in growth by 0.5-0.7%.
Interviews of Growers Dutch growers of lettuce, cucumber, rose, freesia, poinsettia and Ficus (3 growers per crop species) were asked about their expectations concerning additional light on crop performance, and in what way the light levels might affect their (crop) management. Almost all growers think it is important to have high light levels in their greenhouses. All are convinced that the relative effect of light is larger in winter than in summer. However, the opinions varied quite a bit about the magnitude of the light effect on yield. In some crops screens are closed in the summer time, or the greenhouse is whitewashed at high radiation levels. This is mainly done to prevent too high temperatures. Growers stress that besides the quantity of the yield, product quality largely depends on the radiation level. This holds for all crops, despite the fact that each crop has different quality aspects.
Most growers adapt their crop management to the amount of incoming light. Many growers increase plant density and temperature when light levels increase and choose a different variety. The interviews clearly stated that light should not be considered as a separate growth factor, but that it forms an integral part of the total farm management.

LED vs HPS Comparison Report – McGill University – March 6th 2011 Page 112
CONCLUSIONS This study aimed to evaluate the rule of thumb that a 1% light increment results in a 1% yield increase. For most crops a 1% light increment results in a 0.5 to 1% increase in harvestable product. The average yield increases with increasing light levels for the different crops are summarised in Table 1. These values on yield increase may be used as a rule of thumb. However, it should be noted that these values only indicate quantitative effects on yield but not on product quality, while quality usually increases with increasing light level. Furthermore, the values presented in Table 1 are average values and depend on several factors. The relative effect of light on growth for instance, increases at lower light levels, higher CO2 concentration and higher temperatures. Consequently, the relative effect is larger in winter than in the summer. The values are probably a few tenths of a per cent higher in the winter and a few tenths of a per cent lower in the summer compared to the average values for the whole year. Despite the fact that effects of light in summer are smaller than in winter, this study also revealed that even in summer additional light usually has a positive effect on production. However, under some conditions, additional light is not desired (especially pot plants). However, this is mainly because additional light results in an undesired increase in temperature. The effect of light on growth also depends on the duration and moment that the light level is changed.
Many climate conditions change in greenhouses when the light intensity changes. Especially the negative correlation between CO2 concentration and radiation may result in a reduction of the positive effects of light on growth.
Lighting in the greenhouse should not be considered as a separate growth factor as it forms an integral part of the total farm management. Many growers for instance, adapt their plant density, cultivar choice and choose a higher temperature when light level is increased.
ACKNOWLEDGEMENTS The authors acknowledge the financial support of the Commodity Board for Horticulture and the Ministry of Agriculture, Nature and Food Quality. They thank Dr Th. Dueck for his valuable comments on the manuscript.
Literature Cited Andersson, N.E. 1994. Effects of duration of shading on growth and development of flowering pot plants. Acta Agric. Scan.. Section B, Soil Plant Sci. 44: 244-247.
Carvalho, S.M.P., Wuillai, S.E. and Heuvelink, E. 2005. Combined effects of light and temperature on product quality of Kalanchoe blossfeldiana Acta Hort. (in press)
Cockshull, K.E., Graves, C.J. and Cave, R.J. 1992. The influence of shading on yield of glasshouse tomatoes. J. Hort. Sci. 67: 11-24.
De Koning, A.N.M. 1989. Development and growth of a commercially grown tomato crop. (Traduction par Philippe Lefebvre)
Regulation of growth at steadystate nitrogen nutrition in lettuce (Lactuca sativa L.): interactive effects of nitrogen and irradiance. Ann. Bot. 86: 1073-1080.

LED vs HPS Comparison Report – McGill University – March 6th 2011 Page 113
Demitriades-Shah, T.H., Fuchs, M., Kanemasu, E.T. and Flitcroft, I.D. 1994. Further discussions on the relationship between cumulated intercepted solar radiation and crop growth. Agric. For. Meteor. 68: 231-242.
Gislerød, H.R., Eidsten, I.M. and Mortensen, L.M. 1989. The interaction of daily lighting period and light intensity on growth of some greenhouse plants. Sci. Hort. 38: 3-4.
Gislerød, H.R. and Mortensen, L.M. 1997. Effects of light intensity on growth and quality of cut roses. Acta Hort. 418: 25-31.
Heuvelink, E. 1995. Growth, development and yield of a tomato crop: periodic destructive measurements in a greenhouse. Sci. Hort. 61: 77-99.
Kim, W.S. and Lee, J.S. 2002. Evaluation of photosynthate accumulation and distribution and radiation use efficiency in roses in relation to irradiance and night temperature. Acta Hort. 593: 129 – 136.
Lee, J.H, Goudriaan, J. and Challa, H. 2003. Using the expolineair growth equation for modelling crop growth in year-round cut chrysanthemum. Ann. Bot. 92: 697-708.
Marcelis, L.F.M. 1993. Fruit growth and biomass allocation to the fruits in cucumber. 2. Effect of irradiance. Sci. Hort. 54(2): 123-130.
Marcelis, L.F.M., Heuvelink, E. and Van Dijk, D. 1997. Pithiness and growth of radish tubers as affected by irradiance and plant density. Ann Bot. 79: 397-402.
Mortensen, L.M. 1994. Effects of day/night temperature variations on growth, morphogenesis and flowering of Kalanchoe blossfeldiana v. Poelln. at different CO2
concentrations, daylengths and photon flux densities. Sci. Hort. 59: 3-4.
Mortensen, L.M. and Grimstad, S.O. 1990. The effect of lighting period and photon flux density on growth of six foliage plants. Sci. Hort. 41: 337-342.
Nilwik, H.J.M. 1981. Growth analysis of sweet pepper (Capsicum annuum L.). II Interacting effects of irradiance, temperature and plant age in controlled conditions. Ann.Bot. 48: 137-145.
Sarracino, J.M., Merritt, R. and Chin, C.K. 1992. Morphological and physiological characteristics of Leea coccinia and Leea rubra in response to light flux. HortSci. 27: 400-403.
Zieslin, N. and Mor, Y. 1990. Light on roses. A review. Sci. hort. 43: 1-14.

LED vs HPS Comparison Report – McGill University – March 6th 2011 Page 114
Optimization of Lighting Spectrum for Photosynthetic System and Productivity of Lettuce by Using Lightemitting Diodes A. Brazaitytė, R. Ulinskaitė, P. Duchovskis, G. Tamulaitis, Z. Bliznikas and
G. Samuolienė, J. B. Šikšnianienė, A. Žukauskas J. Jankauskienė, G. Šabajevienė, Institute of Materials Science and K. Baranauskis and G. Stanienė Applied Research, Vilnius University Lithuanian Institute of Horticulture, Babtai, Sauletekio al. 9-III, LT-10222 Vilnius LT-54333 Kaunas district Lithuania Lithuania
Keywords: chlorophylls, growth, stomata, photosynthesis, photosynthesis productivity
Abstract Impact of controlled illumination spectrum on photosynthetic system and productivity of lettuce (Lactuca sativa L. cv. Grand Rapids) grown in phytotron was investigated. The variable-spectrum lighting modules were designed using four types of high-power light-emitting diodes (LEDs) with emission peaked in red at the wavelengths of 660 nm and 640 nm, in blue at 455 nm, and in far-red at 735 nm. Biometric characteristics, pigments content and photosynthesis intensity in lettuce grown under eight different light irradiance were measured and compared. A corresponding experiment under a conventional high-pressure sodium lamp was also performed for reference. The treatments were carried out under photoperiod of 14 h and 21/15°C (day/night) temperature. Lettuce was grown for 29 days after sowing in a phytotron chamber. Stomata size of lettuce grown under LED was larger than that of the plants growing under high-pressure sodium lamp. The lowest number and largest size of stomata were observed under light without the red component, peaked at 660 nm. Elimination of the blue component (455 nm) resulted in an enhancement of fresh mass production and increased leaf area, but the photosynthetic productivity did not show similar effect. The chlorophylls content in lettuce leaves was high during the entire growth period, but strongly decreased at the end of the treatment without blue light. The photosynthesis in lettuce leaves was most intensive under irradiance without the far-red component (735 nm). We conclude that productivity of lettuce can be optimized by adjusting the light spectrum and flux density.
INTRODUCTION Spectral quality affects various physiological processes in plants. Red light is important for the development of the photosynthetic apparatus (Saebo et al., 1995). Blue light has effect on the formation of chlorophyll, stomata opening and photomorphogenesis (Senger, 1982; Dougher and Bugbee, 1998; Schuerger et al., 1997; Heo et al., 2002). Lighting with a fixed spectrum is neither spectrally optimal nor energetically effective and remains probably the most conservative technological factor in plant cultivation. Recently developed high-brightness light emitting diodes (LEDs) ground the future lighting technology (solid-state lighting). These optoelectronic devices feature high radiant efficiency, longevity, relatively narrow emission spectra and small switching time

LED vs HPS Comparison Report – McGill University – March 6th 2011 Page 115
and contain no mercury as most conventional light sources do. Using the new-generation light sources offers tremendous untapped reserves in increasing of the efficiency of photophysiological processes in plants, accelerating of the selection cycles, improving of quality of vegetable food, saving of energy resources, and elimination of the impact of mercury on the environment (Bula et al., 1991; Žukauskas et al., 2002).
Lettuce is an important greenhouse vegetable, intensively grown during the seasons of low solar irradiation. The supplementation by artificial light is relatively expensive. Therefore the search for alternative lighting sources is highly important. LED based lighting presented herein might result in accelerated growth and increased quality of lettuce and other similar vegetables.
The aim of the present study is to determine the spectrum of light that is optimal for growth, photosynthetic system and productivity of lettuce.
MATERIALS AND METHODS Lettuce was grown in growth chambers in peat substrate (pH 6.0–6.5) prepared with fertilizes PG MIX (NPK 14-16-18; 1.3 kg/m3). All experiments were carried out under 14 h photoperiod and 21/15°C (day/night) temperature. LED-based lighting facility for plant cultivation under different spectral composition was designed using high-power LEDs with the useful light emitting area of 0.22 m2. Four types of LEDs were used: 6 LEDs LuxeonTM type LXHL-LR3C (peak wavelength λ = 455 nm) and 100 LEDs LuxeonTM
type LXHL-MD1D (λ = 640 nm) of LUMILEDS LIGHTING, USA, and 9 LEDs L660-66-60 (λ = 660 nm) and 22 LEDs L735- 05-AU of EPITEX, Japan (λ = 735 nm). The spectral and circadian characteristics for all experiments are presented in Table 1.
For comparison, the plants were growing under of high-pressure sodium lamps SON-T-Agro (PHILIPS).
Leaf area of lettuce was measured by a CI-202 Leaf Area Meter (CID Inc., USA). Photosynthesis intensity was measured using a CI-310 Portable Photosynthesis System (CID Inc., USA). The content of chlorophylls was determined in 100% acetone extract using a spectrophotometer Genesys 6 (ThermoSpectronic, USA). Samples were taken from the 2nd or 3rd fully expanded shoot leaves. The dry weight of lettuce leaves was estimated after drying at the temperature of 105°C. For stomata measurements, the epidermal layer was removed and examined by means of optical microscopy. Stomata were counted on the lower leaf side in 10 visual fields of 0.17 mm2; the average lengthwas determined from 30 stomata. All measurements were performed at the end of experiments, except the chlorophyll content that was determined 4 times during each experiment.
RESULTS Elimination of the blue component (455 nm) resulted in an enhancement of the fresh mass production and in an increase of leaf area (Fig. 1), while elimination of far-red component (735 nm) decreased both the indices. In general, irradiation by the 735 nm component at night had a tendency to decrease the fresh mass production compared to treatments without nocturnal break.
The highest photosynthetic productivity was observed in EXP 2, where 735 nm component was applied for 1 h at night. In contrast, the lowest values were observed in
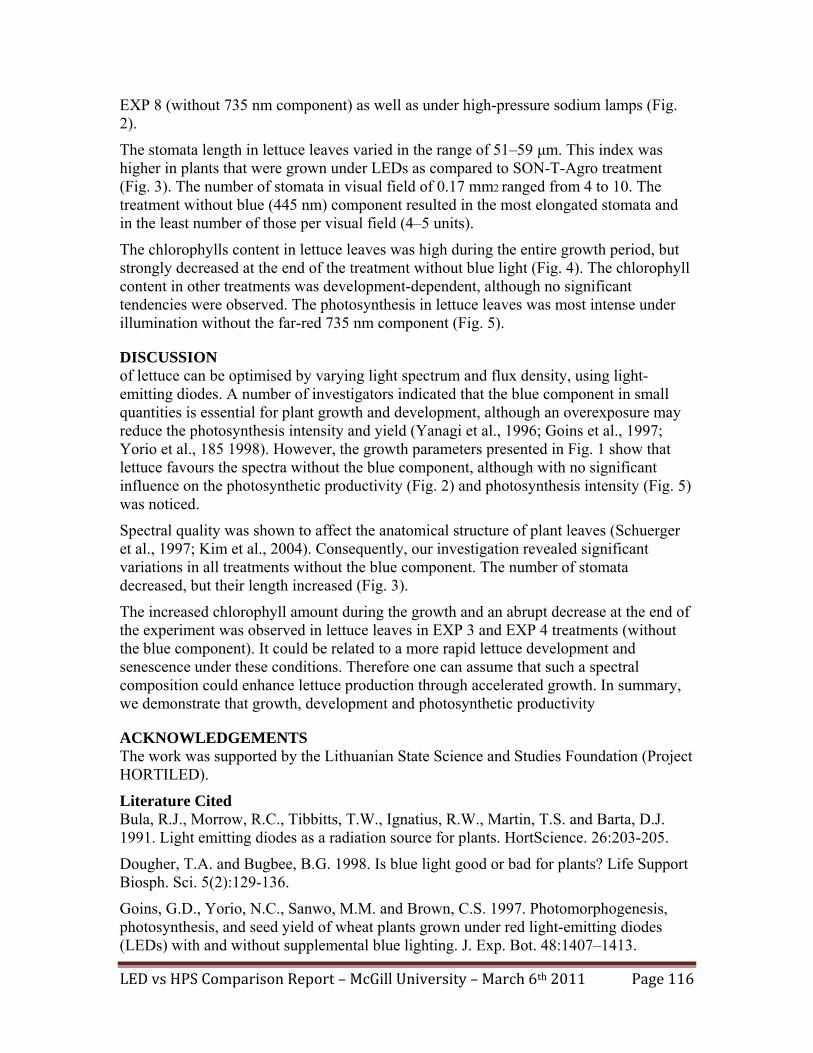
LED vs HPS Comparison Report – McGill University – March 6th 2011 Page 116
EXP 8 (without 735 nm component) as well as under high-pressure sodium lamps (Fig. 2).
The stomata length in lettuce leaves varied in the range of 51–59 μm. This index was higher in plants that were grown under LEDs as compared to SON-T-Agro treatment (Fig. 3). The number of stomata in visual field of 0.17 mm2 ranged from 4 to 10. The treatment without blue (445 nm) component resulted in the most elongated stomata and in the least number of those per visual field (4–5 units).
The chlorophylls content in lettuce leaves was high during the entire growth period, but strongly decreased at the end of the treatment without blue light (Fig. 4). The chlorophyll content in other treatments was development-dependent, although no significant tendencies were observed. The photosynthesis in lettuce leaves was most intense under illumination without the far-red 735 nm component (Fig. 5).
DISCUSSION of lettuce can be optimised by varying light spectrum and flux density, using light-emitting diodes. A number of investigators indicated that the blue component in small quantities is essential for plant growth and development, although an overexposure may reduce the photosynthesis intensity and yield (Yanagi et al., 1996; Goins et al., 1997; Yorio et al., 185 1998). However, the growth parameters presented in Fig. 1 show that lettuce favours the spectra without the blue component, although with no significant influence on the photosynthetic productivity (Fig. 2) and photosynthesis intensity (Fig. 5) was noticed.
Spectral quality was shown to affect the anatomical structure of plant leaves (Schuerger et al., 1997; Kim et al., 2004). Consequently, our investigation revealed significant variations in all treatments without the blue component. The number of stomata decreased, but their length increased (Fig. 3).
The increased chlorophyll amount during the growth and an abrupt decrease at the end of the experiment was observed in lettuce leaves in EXP 3 and EXP 4 treatments (without the blue component). It could be related to a more rapid lettuce development and senescence under these conditions. Therefore one can assume that such a spectral composition could enhance lettuce production through accelerated growth. In summary, we demonstrate that growth, development and photosynthetic productivity
ACKNOWLEDGEMENTS The work was supported by the Lithuanian State Science and Studies Foundation (Project HORTILED).
Literature Cited Bula, R.J., Morrow, R.C., Tibbitts, T.W., Ignatius, R.W., Martin, T.S. and Barta, D.J. 1991. Light emitting diodes as a radiation source for plants. HortScience. 26:203-205.
Dougher, T.A. and Bugbee, B.G. 1998. Is blue light good or bad for plants? Life Support Biosph. Sci. 5(2):129-136.
Goins, G.D., Yorio, N.C., Sanwo, M.M. and Brown, C.S. 1997. Photomorphogenesis, photosynthesis, and seed yield of wheat plants grown under red light-emitting diodes (LEDs) with and without supplemental blue lighting. J. Exp. Bot. 48:1407–1413.

LED vs HPS Comparison Report – McGill University – March 6th 2011 Page 117
Heo, J., Lee, Ch., Chakrabarty, D. and Paek, K. 2002. Growth responses of marigold and salvia bedding plants as affected by monochromic ar mixture radiation provided by light-emitting diode (LED). Plant Growth Regulation. 38:225-230.
Kim, H., Goins, G.D., Wheeler, R.M. and Sager, J.C. 2004. Stomatal conductance of lettuce grown under or exposed to different light qualities. Annals of Botany. 94:691-697.
Saebo, A., Krekling, T. and Appelgren, M. 1995. Light quality affects photosynthesis and leaf anatomy of brich plantlets in vitro. Plant Cell, Tissue and Organ Culture. 41:177-185.
Schuerger, A.C., Brown, C.S. and Stryjewski, E.C. 1997. Anatomical features of pepper plants (Capsicum annuum L.) grown under red light-emitting diodes supplemented with blue or far-red light. Annals of Botany. 79:273-282.
Senger, H. 1982. The effect of blue light on plants and microorganisms. Phytochem.Photobiol. 35:911-920.
Yanagi, T., Okamoto, K. and Takita, S. 1996. Effects of blue, red, and blue/red lights of two different PPF levels on growth and morphohenesis of lettuce plants. Acta Hort. 440:117-122.
Yorio, N.C., Wheeler, R.M., Goins, G.D., Sanwo-Lewandowski, M.M., Mackowiak, C.L., Brown, C.S., Sager, J.C. and Stutte, G.W. 1998. Blue light requirements for crop plants used in bioregegenerative life support systems. Life Support Biosph Sci. 5(2):119-128.
Žukauskas, A., Shur, M. S. and Gaska, R. 2002. Intruduction to Solid State Lighting.: Willey, New York.