demographic history of indigenous populations in mesoamerica
TRANSCRIPT
RESEARCH ARTICLE
Demographic History of IndigenousPopulations in Mesoamerica Based onmtDNA Sequence DataAntonio González-Martín1, Amaya Gorostiza1,2, Lucía Regalado-Liu1, Sergio Arroyo-Peña1, Sergio Tirado1, Ismael Nuño-Arana3, Rodrigo Rubi-Castellanos4, Karla Sandoval5,Michael D. Coble6¤, Héctor Rangel-Villalobos3*
1 Departamento de Zoología y Antropología Física, Facultad de Biología, Universidad Complutense deMadrid, Madrid, Spain, 2 Laboratorio de Identificación Genética, GENOMICA S.A.U., Grupo Zeltia, ParqueEmpresarial Alvento, Calle Vía de los Poblados 1, Edificio B 1ª Planta, 28033, Madrid, Spain, 3 Instituto deInvestigación en Genética Molecular, Centro Universitario de la Ciénega, Universidad de Guadalajara,Ocotlán, Jalisco, Mexico, 4 Laboratorio de Genética, Centro de Investigaciones Regionales Hideyo Noguchi,Universidad Autónoma de Yucatán (UADY), Mérida, Yucatán, Mexico, 5 Department of Genetics, StanfordUniversity School of Medicine, Stanford, California, United States of America, 6 American Registry ofPathology, Armed Forces DNA Identification Laboratory, Dover, Delaware, United States of America
¤ Current address: Applied Genetics Group, National Institute of Standards and Technology, Gaithersburg,Maryland, United States of America* [email protected]
AbstractThe genetic characterization of Native American groups provides insights into their history
and demographic events. We sequenced the mitochondrial D-loop region (control region) of
520 samples from eight Mexican indigenous groups. In addition to an analysis of the genetic
diversity, structure and genetic relationship between 28 Native American populations, we
applied Bayesian skyline methodology for a deeper insight into the history of Mesoamerica.
AMOVA tests applying cultural, linguistic and geographic criteria were performed. MDS
plots showed a central cluster of Oaxaca and Maya populations, whereas those from the
North and West were located on the periphery. Demographic reconstruction indicates
higher values of the effective number of breeding females (Nef) in Central Mesoamerica
during the Preclassic period, whereas this pattern moves toward the Classic period for
groups in the North and West. Conversely, Nef minimum values are distributed either in the
Lithic period (i.e. founder effects) or in recent periods (i.e. population declines). The
Mesomerican regions showed differences in population fluctuation as indicated by the maxi-
mum Inter-Generational Rate (IGRmax): i) Center-South from the lithic period until the Pre-
classic; ii) West from the beginning of the Preclassic period until early Classic; iii) North
characterized by a wide range of temporal variation from the Lithic to the Preclassic. Our
findings are consistent with the genetic variations observed between central, South and
Southeast Mesoamerica and the North-West region that are related to differences in genetic
drift, structure, and temporal survival strategies (agriculture versus hunter-gathering,respectively). Interestingly, although the European contact had a major negative
PLOSONE | DOI:10.1371/journal.pone.0131791 August 20, 2015 1 / 24
OPEN ACCESS
Citation: González-Martín A, Gorostiza A, Regalado-Liu L, Arroyo-Peña S, Tirado S, Nuño-Arana I, et al.(2015) Demographic History of IndigenousPopulations in Mesoamerica Based on mtDNASequence Data. PLoS ONE 10(8): e0131791.doi:10.1371/journal.pone.0131791
Editor: Alessandro Achilli, University of Perugia,ITALY
Received: January 19, 2015
Accepted: June 8, 2015
Published: August 20, 2015
Copyright: This is an open access article, free of allcopyright, and may be freely reproduced, distributed,transmitted, modified, built upon, or otherwise usedby anyone for any lawful purpose. The work is madeavailable under the Creative Commons CC0 publicdomain dedication.
Data Availability Statement: All relevant data arewithin the paper and its Supporting Information files.
Funding: This work was supported by CONACyT-México, grant 129693 to HRV (http://www.conacyt.mx/) for anthropological study design; NationalInstitute of Justice (http://www.nij.gov/), InterAgencyagreement 2005-DN-R-086 to MDC for GlobalmtDNA Databasing Project; and Ministerio deEconomia y Competitividad, España (http://www.mineco.gob.es/), Project HAR2010-21063 to AGM forstudy design and analysis.
demographic impact, we detect a previous decline in Mesoamerica that had begun a few
hundred years before.
IntroductionThe peopling of the NewWorld is still a controversial debate today. In fact, there is no consen-sus on whether the first settlers arrived in one [1,2] or several migration waves [3, 4]. Neverthe-less, most recent research based on genetic data supports the view that the NewWorld waspeopled across the Bering Strait about 18,000 years before the present (ybp) [5]. Some authorspropose two routes for a rapid human expansion across the continent, one coastal and theother inland; although other alternative routes have been proposed [6–8]. The hypothesis forthe human colonization of America is largely based on the study of mitochondrial DNA(mtDNA) which, from the very first studies, has shown that extant Native American popula-tions exhibit six mtDNA different haplogroups (hgs). These can be classified into the followingautochthonous hgs: A2, B2, C1, D1, D4h3, and X2a [9]. The fact that these lineages arerestricted to a specific geographical area allows us to reconstruct the micro-evolutionary his-tory of Mesoamerica and bordering areas.
Current mtDNA studies in the new continent have focused on two new lines of research.On the one hand, the genetic characterization of skeletal remains using ancient DNA tech-niques provides information on the composition and genetic structure of pre-Columbian pop-ulations [10–13]. On the other hand, the complete sequencing of mitochondrial genomesallows for a greater analytical and interpretative depth of genetic information [14–17].
According to Kirchhoff [18], Mesoamerica is defined as neither a geographic region nor asocio-political unit, but rather, as an area occupied by populations that share cultural charac-teristics. It is also considered that at its peak the northern limit overlapped with the southernfrontier of southwestern North America [19, 20].
Considering cultural, geographical and historical criteria, Mesoamerica can be divided intodifferent cultural areas [21–24]. In this paper seven clusters have been considered [25–32] inline with those used by other authors to reconstruct the history of Mesoamerica [33,34]. Thepeoples who share these areas have common elements although they do not necessarily consti-tute a single ethnic group, in fact, in many cases, they do not even share the same language.Within these areas, and even between them, interactions and migrations occurred as a conse-quence of geographical proximity [35, 36], trade [37, 38] and pre-hispanic politics [39, 40].
In this paper these seven regions have been used to present a systematic classification of theresults and as a starting point to explore the possible existence of genetic structure in the region.
It is necessary to clarify that, although the work is focused on Mesoamerica, some northernpopulations come from Aridoamerica. This is an arid region north of Mesoamerica covering aterritory that is distributed between northern Mexico and southern USA, traditionally inhab-ited by nomadic or seminomadic peoples [27].
Another important aspect concerning Mesoamerica is its chronological classificationaccording to archaeological data. In brief, it can be classified into five periods [19,23,41]. Thechronology begins with the archaic period or lithic stage (15000–2500 ybp) characterized bythe first evidence of a human presence. In the Preclassic period between 2500 ybp-150/200years after present (yap), the settling of Mesoamerica gathered pace and the use of agricultureand pottery began. In the immediate aftermath, or Classic (150 / 200–900 yap) period, inten-sive agriculture was developed and an increase in the number of large population centers is
History and Demography of Mesoamerica Based on mtDNA Sequence Data
PLOS ONE | DOI:10.1371/journal.pone.0131791 August 20, 2015 2 / 24
Competing Interests: The authors have declaredthat no competing interests exist.
detected. In the following period, known as Postclassic (900–1521 yap), numerous movementsof population occur accompanied by a wide diffusion of cultural elements. This period endswith the arrival of the Europeans and the beginning of the colonial period (1951 yap-present)[42,43].
Some of the most representative American cultures flourished in Mesoamerica, for examplethe Aztecs and Mayas, in addition to numerous indigenous groups, some of whom are thedescendants of those ancient cultures. These populations emerged in a homogeneous patternof rituals, politics and architecture, and shared a similar lifestyle based upon agriculture, as wellas a similar social and commercial organization. This relative cultural homogeneity is also sup-ported by the archaeological and anthropological data [32].
Studies based on the genetic variations in native Mexican populations demonstrate thatthere is a high degree of differentiation between populations and a paternal heterogeneity cor-related with geography [33,44]. However, the maternal lineages do not display significant pop-ulation structure in relation to linguistic criteria, suggesting that genetic divergence predateslinguistic diversification in Mexico [45].
In recent years, great efforts have been made to reconstruct the history and genetic relation-ships between human groups [46]. Among these advances stands out the development of soft-ware that makes it possible to reconstruct human population history using mtDNA sequences[17]. In the present work, we studied the genetic structure, diversity and genetic relationship ofsome indigenous groups fromMesoamerica applying the Bayesian skyline methodology [47].We aimed to reconstruct the genetic and demographic history of these groups in the context ofother indigenous peoples inhabiting the neighboring regions. For this purpose, the mitochon-drial D-loop region of 520 samples from eight Mexican indigenous groups was sequenced (fivefrom the Maya region and three from the West of Mexico). For a deeper insight into Meso-american history, the results have been compared with other populations fromMesoamericaand Aridoamerica. The 28 native Mexican populations represent 19 indigenous groups andfive of the seven Mesoamerican cultural areas, including the Aridoamerican region.
Material and Methods
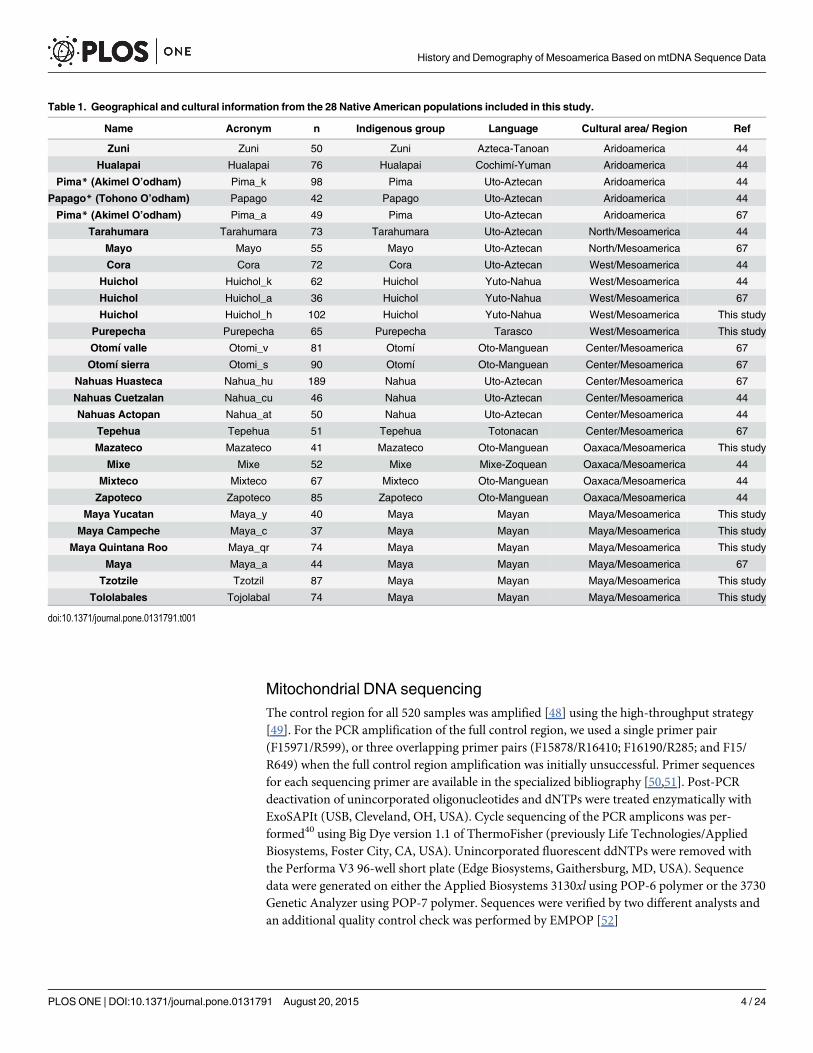
Population samplingThe mtDNA control region of 520 individuals representing eight Mexican indigenous groupswas sequenced. Five of the groups were of Maya filiation: Yucatan Maya (n = 40), QuintanaRoo Maya (n = 74), Campeche Maya (n = 37), as well as Tojolabal (n = 74) and Tzotzil (n = 87)groups from Chiapas. The other three indigenous groups are Mazateco from Oaxaca (n = 41),Purepecha fromMichoacán (n = 65), and Huichol from Nayarit (n = 102) (Table 1, Fig 1).
Throughout the text, different synonymous terms are used to refer to the populations stud-ied. Native American refers to native populations but not necessarily fromMesoamerica. Theterms native and indigenous are used interchangeably to refer to the Amerindian populations.Moreover, Native Mexican includes populations currently distributed in Mexican territorywhich may belong to either Mesoamerica or Aridoamerica. Whenever we refer to mestizo-andtherefore non-indigenous- populations, this is specified in the text.
DNA was extracted from fresh-blood samples by means of the salting-out method. Prior totheir inclusion in our study, all volunteers signed an informed consent form according to theethical guidelines of the Helsinki Declaration. This work was approved by the Research EthicsCommittee of the CUCiénega, Universidad de Guadalajara, as part of the project “Comprehen-sive approach of genetic anthropology of the Mexican populations based on mtDNA, STRsand Y-chromosome” (CONACyT-Mexico, grant N° 129693).
History and Demography of Mesoamerica Based on mtDNA Sequence Data
PLOS ONE | DOI:10.1371/journal.pone.0131791 August 20, 2015 3 / 24
Mitochondrial DNA sequencingThe control region for all 520 samples was amplified [48] using the high-throughput strategy[49]. For the PCR amplification of the full control region, we used a single primer pair(F15971/R599), or three overlapping primer pairs (F15878/R16410; F16190/R285; and F15/R649) when the full control region amplification was initially unsuccessful. Primer sequencesfor each sequencing primer are available in the specialized bibliography [50,51]. Post-PCRdeactivation of unincorporated oligonucleotides and dNTPs were treated enzymatically withExoSAPIt (USB, Cleveland, OH, USA). Cycle sequencing of the PCR amplicons was per-formed40 using Big Dye version 1.1 of ThermoFisher (previously Life Technologies/AppliedBiosystems, Foster City, CA, USA). Unincorporated fluorescent ddNTPs were removed withthe Performa V3 96-well short plate (Edge Biosystems, Gaithersburg, MD, USA). Sequencedata were generated on either the Applied Biosystems 3130xl using POP-6 polymer or the 3730Genetic Analyzer using POP-7 polymer. Sequences were verified by two different analysts andan additional quality control check was performed by EMPOP [52]
Table 1. Geographical and cultural information from the 28 Native American populations included in this study.
Name Acronym n Indigenous group Language Cultural area/ Region Ref
Zuni Zuni 50 Zuni Azteca-Tanoan Aridoamerica 44
Hualapai Hualapai 76 Hualapai Cochimí-Yuman Aridoamerica 44
Pima* (Akimel O’odham) Pima_k 98 Pima Uto-Aztecan Aridoamerica 44
Papago* (Tohono O’odham) Papago 42 Papago Uto-Aztecan Aridoamerica 44
Pima* (Akimel O’odham) Pima_a 49 Pima Uto-Aztecan Aridoamerica 67
Tarahumara Tarahumara 73 Tarahumara Uto-Aztecan North/Mesoamerica 44
Mayo Mayo 55 Mayo Uto-Aztecan North/Mesoamerica 67
Cora Cora 72 Cora Uto-Aztecan West/Mesoamerica 44
Huichol Huichol_k 62 Huichol Yuto-Nahua West/Mesoamerica 44
Huichol Huichol_a 36 Huichol Yuto-Nahua West/Mesoamerica 67
Huichol Huichol_h 102 Huichol Yuto-Nahua West/Mesoamerica This study
Purepecha Purepecha 65 Purepecha Tarasco West/Mesoamerica This study
Otomí valle Otomi_v 81 Otomí Oto-Manguean Center/Mesoamerica 67
Otomí sierra Otomi_s 90 Otomí Oto-Manguean Center/Mesoamerica 67
Nahuas Huasteca Nahua_hu 189 Nahua Uto-Aztecan Center/Mesoamerica 67
Nahuas Cuetzalan Nahua_cu 46 Nahua Uto-Aztecan Center/Mesoamerica 44
Nahuas Actopan Nahua_at 50 Nahua Uto-Aztecan Center/Mesoamerica 44
Tepehua Tepehua 51 Tepehua Totonacan Center/Mesoamerica 67
Mazateco Mazateco 41 Mazateco Oto-Manguean Oaxaca/Mesoamerica This study
Mixe Mixe 52 Mixe Mixe-Zoquean Oaxaca/Mesoamerica 44
Mixteco Mixteco 67 Mixteco Oto-Manguean Oaxaca/Mesoamerica 44
Zapoteco Zapoteco 85 Zapoteco Oto-Manguean Oaxaca/Mesoamerica 44
Maya Yucatan Maya_y 40 Maya Mayan Maya/Mesoamerica This study
Maya Campeche Maya_c 37 Maya Mayan Maya/Mesoamerica This study
Maya Quintana Roo Maya_qr 74 Maya Mayan Maya/Mesoamerica This study
Maya Maya_a 44 Maya Mayan Maya/Mesoamerica 67
Tzotzile Tzotzil 87 Maya Mayan Maya/Mesoamerica This study
Tololabales Tojolabal 74 Maya Mayan Maya/Mesoamerica This study
doi:10.1371/journal.pone.0131791.t001
History and Demography of Mesoamerica Based on mtDNA Sequence Data
PLOS ONE | DOI:10.1371/journal.pone.0131791 August 20, 2015 4 / 24
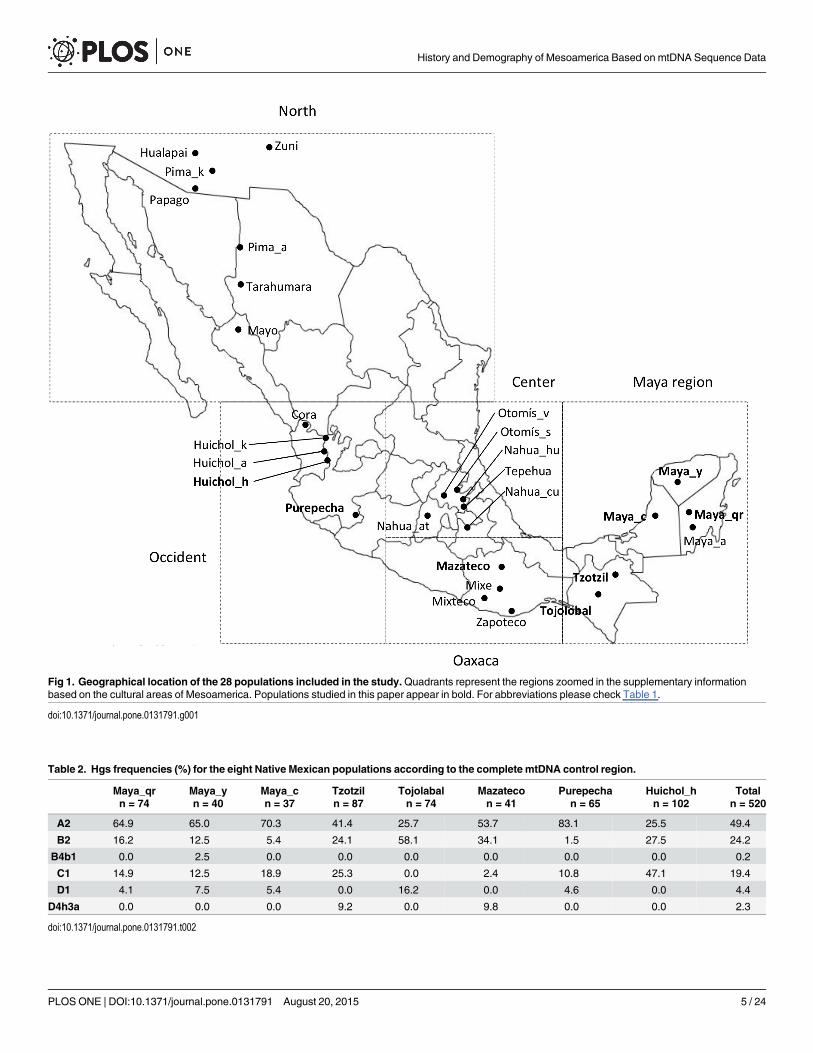
Fig 1. Geographical location of the 28 populations included in the study.Quadrants represent the regions zoomed in the supplementary informationbased on the cultural areas of Mesoamerica. Populations studied in this paper appear in bold. For abbreviations please check Table 1.
doi:10.1371/journal.pone.0131791.g001
Table 2. Hgs frequencies (%) for the eight Native Mexican populations according to the complete mtDNA control region.
Maya_qr Maya_y Maya_c Tzotzil Tojolabal Mazateco Purepecha Huichol_h Totaln = 74 n = 40 n = 37 n = 87 n = 74 n = 41 n = 65 n = 102 n = 520
A2 64.9 65.0 70.3 41.4 25.7 53.7 83.1 25.5 49.4
B2 16.2 12.5 5.4 24.1 58.1 34.1 1.5 27.5 24.2
B4b1 0.0 2.5 0.0 0.0 0.0 0.0 0.0 0.0 0.2
C1 14.9 12.5 18.9 25.3 0.0 2.4 10.8 47.1 19.4
D1 4.1 7.5 5.4 0.0 16.2 0.0 4.6 0.0 4.4
D4h3a 0.0 0.0 0.0 9.2 0.0 9.8 0.0 0.0 2.3
doi:10.1371/journal.pone.0131791.t002
History and Demography of Mesoamerica Based on mtDNA Sequence Data
PLOS ONE | DOI:10.1371/journal.pone.0131791 August 20, 2015 5 / 24

Data analysisThe mtDNA sequences were aligned with Sequencher version 4.8 (GeneCodes, Ann Arbor,MI). For diagnostic purposes, hgs were identified based on polymorphic sites and using differ-ent online resources (MitoTool, http://www.mitotool.org/index.html); absolute frequencieswere obtained by means of the gene counting method (Table 2). Statistical analyses were car-ried out using DNAsp and Arlequin v3.1, including different diversity estimators [53,54]: hap-lotype number (k), polymorphic sites (s), haplotype diversity (Ĥ), nucleotide diversity (π),average pairwise differences (θ) and tests of neutral selection such as Tajima´D (D) and Fu´stest (FS). The genetic relationships between the eight study populations were evaluated bymeans of the pairwise differences (Table A in S1 File) and FST genetic distances Analyses ofMolecular Variance (AMOVAs) applying different population clustering criteria were also per-formed, as indicated in the tables of the results section (Table B in S1 File).
The results were compared with 20 populations fromMesoamerica or nearby regions(Table 1, Fig 1). The global study for the 28 populations was based on the FST calculation(Table C in S1 File) and its subsequent performance in a multidimensional scaling plot (MDS)(Fig 2). AMOVAs for different grouping criteria (Table D in S1 File) and a Mantel test were alsoperformed to determine the correlation between FST and geographic matrices. Finally, the num-ber of shared haplotypes based on HVRI among the 28 stocks was calculated (Table E in S1 File).
Evolutionary and demographic analysisTo analyze potential population size changes over time, we calculated a Bayesian skyline plot(BSP) using Bayesian Evolutionary Analysis Sampling Trees (BEAST 7.1) [55]. Estimationswere carried out assuming the HKY+G evolutionary model, a long-normal relaxed molecularclock with a mean substitution rate of 3,02x10⁻⁷ mutation/site/year for the non-coding region[56]. For a detailed review of the choice of mutation rate, we used the research of Saint Pierreand colleagues [57].
Fig 2. MDS plot representing Fst distances between Native American groups based onmtDNAD-loop region. Bold letters denote the indigenousgroups studied herein. a) MDS plot for eight Native Mexican groups; b) MDS plot for 28 Native American groups. Colors indicate the cultural regions to whichthe populations belong: green, Maya region; blue, North; red, West; yellow, Center; and purple, Oaxaca. Bold letters indicate Mexican indigenous groupsincluded in this study.
doi:10.1371/journal.pone.0131791.g002
History and Demography of Mesoamerica Based on mtDNA Sequence Data
PLOS ONE | DOI:10.1371/journal.pone.0131791 August 20, 2015 6 / 24
The scaled effective population size was converted to Nef, assuming a generation time of 25years. Importantly, an assumption about the mutation rate and the generation time will onlyaffect the scale of the Bayesian skyline plot, but not its shape [58]. To assess the effect that sam-ple size had on the construction of the skyline, different sequences were randomly selected toreach the total maximum value for each population (Figure A in S2 File.). For all the analyses,Markov Chain Monte Carlo (MCMC) samples were based on 60,000,000 iterations. Genealo-gies and model parameters were sampled every 1,000 iterations thereafter.
The use of the mtDNA control region for reconstructing demographic history by means ofBSP is, in certain circumstances, very suitable. The BSP is fundamentally based on coalescencetheory, which includes most of the properties that the BSP must meet. One of the most impor-tant is the selection and representativeness of the sample; the samples should ideally be obtainedfrom individuals that have been randomly sampled from a panmictic population. In fact, thebalanced sampling strategy whereby samples are distributed across several populations providesthe best scheme for inferring demographic change over a typical time scale [59]. Sample selec-tion should be carefully considered in relation to the population structure before BSP analysesare carried out. The samples presented here have been selected to fulfill this requirement.
Another essential aspect which is not usually taken into account when applying BSP is thepossible existence of population sub-structure [60–62], since this directly influences the con-struction of the demographic model [63–66]. This work represents, in this sense, an advantage,since the samples come from a geographical region which provides valuable information abouttheir genetic structure [33, 44, 45, 67].
Generally, however, increasing the amount of information in the alignment, either byincreasing sequence length or by focusing on variable regions, will improve the precision ofphylogenetic estimation of the genealogy.
In fact, like the mitogenomes, methodologically the control region is treated as if it were asingle locus [68], providing enough information to reconstruct the demographic history ofhuman populations [69]. In addition, the control region meets other important principles thatmake it suitable for BSP studies; it presents intraindividual variation and is not subject to selec-tive pressure. On this last point, it should be noted that the effect of selection is to shift the dis-tribution of mutations in the genealogy. For example, purifying selection leads to an excess ofmutations near the tips of the genealogy [70,71].
One of the potential problems in using the control region is that certain drawbacks such ashaving a greater quantity of hotspots can alter the phylogenies and overestimate divergencetimes [72]. This problem can be resolved, however, especially when studying recent popula-tions like the aboriginal Amerindians, by applying a mutation rate concordant with the evolu-tionary process, in this case mutation rates closer to those of pedigrees than phylogenies [57].
In addition, some other independent papers validate the use of the control region as a toolwith which to reconstruct the demographic history of populations. One of these studies con-ducted on South American native populations provides results that largely coincide with ourknowledge of the history of Amerindian populations [57]. In another study, the authors com-pared the results using complete mitogenomes and their control regions and found no differencesbetween the BSPs [73]. Finally, a study comparing the BSPs generated from a few mitogenomes[74] with those created from a larger number of control regions from the same geographical areabut from different populations [75], showed that both were practically the same.
A final point to note is that the control region has also been used to test correlations betweendemographic and paleoclimatic events [65,76], examining the factors driving past populationdynamics [55,77,78], and tracing the transmission and spread of viruses [73,79].
The skyline results, represented by the median values, are shown in graphs for culturalregions: North, West, Central, Oaxaca and Maya region (Fig 3). Different scales were used and
History and Demography of Mesoamerica Based on mtDNA Sequence Data
PLOS ONE | DOI:10.1371/journal.pone.0131791 August 20, 2015 7 / 24
Bayesian confidence intervals were omitted in order to compare population variations betweenindigenous groups. The skyline plot including the confidence intervals for each group in all cul-tural areas is represented in Figure B in S2 File.
Both maximum and minimum periods for Mesoamerica were represented in order to sim-plify the demographic history comparison between different groups (Fig 4). Maximum andminimum Nef values for each group can be found in Table F in S1 File. From the Nef genera-tion estimation, demographic inter-generational growth rates (IGR) were calculated as follows:IGR = ((Nef n—Nef n-1) / Nef n-1)�100
Nefn and Nefn-1 being the effective number of breeding females for a particular period andfor the previous one, respectively. These calculations were performed for the 28 groups. Thetime evolution of the IGR for each of the 28 indigenous populations grouped by cultural area isshown in Figure C in S2 File.
The time distribution of the maximum and minimum IGR values (IGRmax and IGRmin)by Mesoamerican periods is presented in Fig 5. Detailed information on these data is presentedin Table G in S1 File. From the point of view of the demographic development of the popula-tion and its interaction with the environment, it is important to determine when the values arereversed, i.e. at what point in the history of Mesoamerica the native groups gained or lost popu-lation. These inversion periods are represented in Figure D in S2 File. Note that the IGR valuesexperiment intense fluctuations over time, especially in populations with small sizes. Therefore,the period in which the inversion occurred has been considered to be the one in which therates have equal values, whether negative or positive.
ResultsWe obtained the polymorphic sites in the mtDNA hypervariable regions I and II (HVRI andHVRII) detected in the 520 individuals from eight Native Mexican populations (Table A in S3File). These complete mtDNA sequences will be available at EMPOP database (www.empop.org). In addition, 20 Mesoamerican populations were included in the global analyses. The geo-graphic, cultural and linguistic information of the total population sample is shown in Fig 1and Table 1.
The most common hg in the eight Mesoamerican populations was A2 (n = 257, 49.4%), fol-lowed by B2 (n = 126, 24.2%), C1 (n = 101, 19.4%) and D1 (n = 23, 4.4%), with significantintergroup variations (Table 2). Tojolabales present an increased B2 hg frequency (58.1%) anda total absence of hg C1. However, the most important deviation was observed in Huicholes,with a high proportion of C1 (47.1%) and absence of hg D1 (Χ2 = 45.518; p = 0.000). Completesequencing of the control region allows us to determine the most important sub-haplogroups(subhgs), for example D4h3a and B4b1. D4h3a was found in twelve individuals (2.3%), eight inTzotziles (9.2%) and four in Mazatecos (9.8%). Conversely, the subhg B4b1 was detected onlyin Mayas from the Yucatan (Table 2). Four African hgs were detected (data not shown), indi-cating small African maternal admixtures in Maya_y (2.44%), Tzotzil (1.14%) and Purepecha(2.98%). Due to the focus of anthropological studies on haplogroups of Native American line-age, the African hgs were omitted in all statistical analyses.
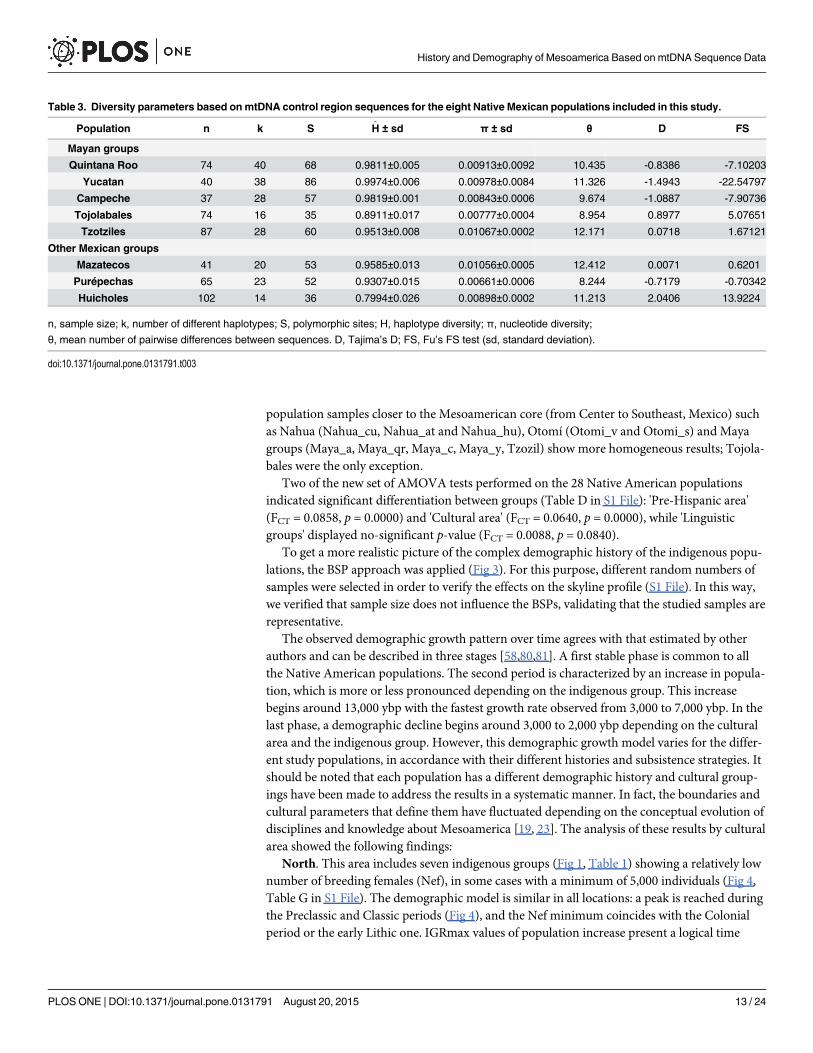
The highest genetic diversity rate (Ĥ) was detected in Mayan populations from the YucatanPeninsula (Ĥ = 0.9974 ± 0.006), and the lowest in Tojolobal (Ĥ = 0.8911 ± 0.017) and Hui-chol_h (Ĥ = 0.7994 ± 0.026) (Table 3). However, using the nucleotide diversity index (π), thispattern changes, with the Native Mexican groups Mazateco (π = 0.01056 ± 0.0005) and Tzotzil(π = 0.01067 ± 0.0002) having the highest values. In contrast, Tojolabales present the lowestvalues for all genetic diversity indices. On the other hand, negative values were observed in theneutrality test (Tajima's D and Fu's FS) for the populations from the Yucatan Peninsula
History and Demography of Mesoamerica Based on mtDNA Sequence Data
PLOS ONE | DOI:10.1371/journal.pone.0131791 August 20, 2015 8 / 24

Fig 3. Skyline plot for the 28 populations grouped in the five cultural regions.North, West, Central, Oaxaca and Maya.
doi:10.1371/journal.pone.0131791.g003
History and Demography of Mesoamerica Based on mtDNA Sequence Data
PLOS ONE | DOI:10.1371/journal.pone.0131791 August 20, 2015 9 / 24

Fig 4. Time distribution (bottom) of the maximum (green points) andminimumNef values (red points) by Mesoamerican periods (top) forpopulations clustered in cultural areas. The vertical red stripe indicates periods before 8,000 ybp.
doi:10.1371/journal.pone.0131791.g004
History and Demography of Mesoamerica Based on mtDNA Sequence Data
PLOS ONE | DOI:10.1371/journal.pone.0131791 August 20, 2015 10 / 24
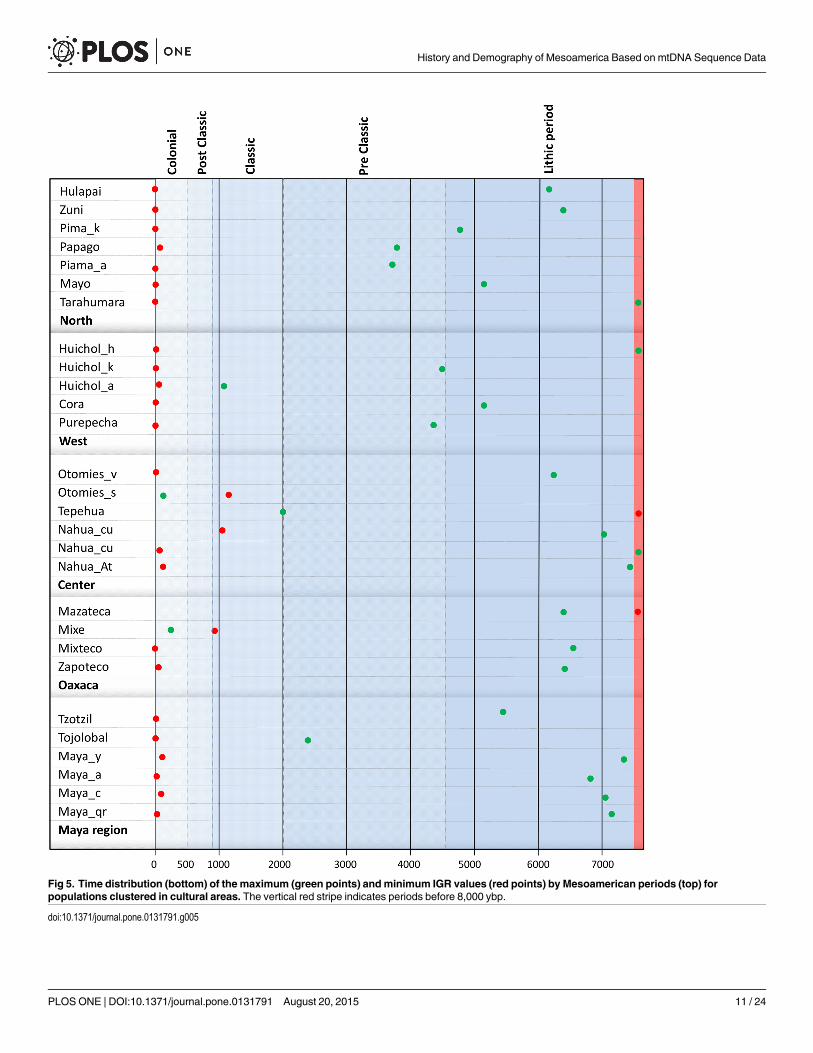
Fig 5. Time distribution (bottom) of the maximum (green points) andminimum IGR values (red points) by Mesoamerican periods (top) forpopulations clustered in cultural areas. The vertical red stripe indicates periods before 8,000 ybp.
doi:10.1371/journal.pone.0131791.g005
History and Demography of Mesoamerica Based on mtDNA Sequence Data
PLOS ONE | DOI:10.1371/journal.pone.0131791 August 20, 2015 11 / 24

(Maya_qr, Maya_y and Maya_c) and Purepecha, indicating a relatively recent populationgrowth. We must remember that for a population fall coming after a population expansion, thesign of the Tajima’s D value depends on the timing and degree of these events although it is dif-ficult to place in time.
The only populations with no significant differences, expressed by corrected average pair-wise differences, are those from the Yucatan Peninsula (Table B in S1 File). Genetic distancesbetween the eight populations included in this study were represented in an MDS plot (Fig 2a).Two results in particular should be noted: i) the existence of a cluster formed by the Mayanpopulations from the Yucatan Peninsula (Maya_y, Maya_c and Maya_qr) and the otherslightly remote Mayan populations, especially Tojolobals; and ii) the nearest population to theMayan ones is the Mazatec, lending support to the idea of continuity between genetics andgeography. The lowland western populations (Purepecha and Huichol_h) are not groupedtogether; in fact, Purepecha have more affinity with Mayans than with Huichol_h, who are farfrom the cluster (Fig 2a).
We performed some AMOVA tests for the eight Mesoamerican populations according todifferent clustering criteria (Table B in S1). The results were not significant when Mayan popu-lations were compared with the rest (FCT = 0.0125, p = 0.1368). However, significant resultswere found when the same cluster (Culture II) was divided into two Mayan population groups:those from the Yucatan Peninsula and the rest (FCT = 0.0037, p = 0.0161). We also obtainedsignificant results in the clusters 'Culture Area' (FCT = 0.0062, p = 0.0148) and 'Language' (FCT= 0.0480, p = 0.0098). A second set of analyses was then undertaken using these eight Mexicanindigenous populations and a further 20 Native American groups. The latter came from thesame geographical area and/or cultural background. The first step in this analysis was to calcu-late FST genetic distances (Table C in S1 File) and an MDS representation (Fig 2b). Most of theNahua, Otomi, Maya and Oaxaca populations, the most representative Mesoamerican cultures,are grouped into a central cluster, indicating a large genetic homogeneity. Some groups lie out-side this distribution, and although most of them are of northern origin (Hualapai, Zuni,Pimas_a, Huichol_h, Huichol_k, and Tarahumara), three belong to Mesoamerica (Tojolabal,Mixe and Purepecha). If we compare the position of the populations in the MDS withĤ values,the graph becomes particularly interesting. In fact, the Euclidean distance of each populationfrom the coordinates of the center is negatively correlated withĤ (r = −0.985, p<0.0001),which is an indication that the populations at the periphery of the distribution are those withless diversity. Thus, the MDS reflects not only inter-population genetic relationships, but alsothe genetic diversity of the populations. This latter parameter is related to demographic historyand shows the effects of genetic drift. Moreover, the Mantel test, contrasting the FST distancematrix and the geographical distances between the 28 Native American groups, showed a sig-nificant correlation (r = 0.207, p = 0.0003).
In order to estimate the relationship between populations, shared haplotypes from hyper-variable region I (HVR I) were calculated (Table E in S1 File). The largest number of sharedvariants was detected between Otomí_v and Otomí_s (14); and between Nahua_hu and Otomígroups (14 and 13), as well as between Nahua_hu and Nahua_cu (10), Zapotec (9), and Mayangroups from the Yucatan Peninsula: Maya_qr (9), Maya_y (8), and Maya_c (8). The detectedvalue between Pima_k and Papago (10), and between Nahua_at and Otomí groups (8 for both)is interesting. High values were also observed between the Yucatan Peninsula groups: Maya_cwith Maya_y (9), and Maya_c with Maya_qr (8).
It is worth noting that different research teams have observed quite different values for thesame indigenous group. For example, in the literature there is a pronounced range of observedvalues for the Huichol (represented by Huichol_k, Huichol_h and Huichol_a) and Pimagroups (Pima_k and Pima_a) from western and northern regions, respectively. Conversely,
History and Demography of Mesoamerica Based on mtDNA Sequence Data
PLOS ONE | DOI:10.1371/journal.pone.0131791 August 20, 2015 12 / 24
population samples closer to the Mesoamerican core (from Center to Southeast, Mexico) suchas Nahua (Nahua_cu, Nahua_at and Nahua_hu), Otomí (Otomi_v and Otomi_s) and Mayagroups (Maya_a, Maya_qr, Maya_c, Maya_y, Tzozil) show more homogeneous results; Tojola-bales were the only exception.
Two of the new set of AMOVA tests performed on the 28 Native American populationsindicated significant differentiation between groups (Table D in S1 File): 'Pre-Hispanic area'(FCT = 0.0858, p = 0.0000) and 'Cultural area' (FCT = 0.0640, p = 0.0000), while 'Linguisticgroups' displayed no-significant p-value (FCT = 0.0088, p = 0.0840).
To get a more realistic picture of the complex demographic history of the indigenous popu-lations, the BSP approach was applied (Fig 3). For this purpose, different random numbers ofsamples were selected in order to verify the effects on the skyline profile (S1 File). In this way,we verified that sample size does not influence the BSPs, validating that the studied samples arerepresentative.
The observed demographic growth pattern over time agrees with that estimated by otherauthors and can be described in three stages [58,80,81]. A first stable phase is common to allthe Native American populations. The second period is characterized by an increase in popula-tion, which is more or less pronounced depending on the indigenous group. This increasebegins around 13,000 ybp with the fastest growth rate observed from 3,000 to 7,000 ybp. In thelast phase, a demographic decline begins around 3,000 to 2,000 ybp depending on the culturalarea and the indigenous group. However, this demographic growth model varies for the differ-ent study populations, in accordance with their different histories and subsistence strategies. Itshould be noted that each population has a different demographic history and cultural group-ings have been made to address the results in a systematic manner. In fact, the boundaries andcultural parameters that define them have fluctuated depending on the conceptual evolution ofdisciplines and knowledge about Mesoamerica [19, 23]. The analysis of these results by culturalarea showed the following findings:
North. This area includes seven indigenous groups (Fig 1, Table 1) showing a relatively lownumber of breeding females (Nef), in some cases with a minimum of 5,000 individuals (Fig 4,Table G in S1 File). The demographic model is similar in all locations: a peak is reached duringthe Preclassic and Classic periods (Fig 4), and the Nef minimum coincides with the Colonialperiod or the early Lithic one. IGRmax values of population increase present a logical time
Table 3. Diversity parameters based onmtDNA control region sequences for the eight Native Mexican populations included in this study.
Population n k S H ± sd π ± sd θ D FS
Mayan groups
Quintana Roo 74 40 68 0.9811±0.005 0.00913±0.0092 10.435 -0.8386 -7.10203
Yucatan 40 38 86 0.9974±0.006 0.00978±0.0084 11.326 -1.4943 -22.54797
Campeche 37 28 57 0.9819±0.001 0.00843±0.0006 9.674 -1.0887 -7.90736
Tojolabales 74 16 35 0.8911±0.017 0.00777±0.0004 8.954 0.8977 5.07651
Tzotziles 87 28 60 0.9513±0.008 0.01067±0.0002 12.171 0.0718 1.67121
Other Mexican groups
Mazatecos 41 20 53 0.9585±0.013 0.01056±0.0005 12.412 0.0071 0.6201
Purépechas 65 23 52 0.9307±0.015 0.00661±0.0006 8.244 -0.7179 -0.70342
Huicholes 102 14 36 0.7994±0.026 0.00898±0.0002 11.213 2.0406 13.9224
n, sample size; k, number of different haplotypes; S, polymorphic sites; H, haplotype diversity; π, nucleotide diversity;
θ, mean number of pairwise differences between sequences. D, Tajima’s D; FS, Fu’s FS test (sd, standard deviation).
doi:10.1371/journal.pone.0131791.t003
History and Demography of Mesoamerica Based on mtDNA Sequence Data
PLOS ONE | DOI:10.1371/journal.pone.0131791 August 20, 2015 13 / 24
lapse with respect to the maximum Nef, and are detected in the Lithic and Preclassic periods(Fig 5). Despite some uniformity, Hualapai, Tarahumara and Zuni are rather different to thegeneral demographic growth model. This uniqueness can be seen in the periods in which theinversion of the IGR trend occurs (Figure C and Figure D in S2 File, Table G in S1 File), in thePreclassic period for these populations and in the Classic one for the rest.
West. The demographic behavior of the five populations is very heterogeneous, particularlythat of the Huichol_a and Cora. The former maintain positive IGRs until the present and reachrelatively high population sizes (Nef = 125,000; 100 years ago) (Figs 4 and 5). This difference inthe IGR values, compared with those of other populations of the same filiation (Huichol_h andHuichol_k), reflects the historical differences among Huichol communities. Furthermore, theCora group maintains a constant IGR value, implying that it has had a higher population thanthe rest of the western indigenous groups.
Center. In this region, the majority of the groups have high population sizes, with the excep-tion of the Tepehua who show a maximum Nef of 31,302 individuals, compared with the255,025 individuals for Nahuas_hu (Table F in S1 File). Most of these populations have maxi-mum IGR values during the lithic period (Fig 5). It is important to highlight the similar sky-lines of the Otomí_s and Nahua_hu, both with different linguistic affiliations but sharing thesame geographical space (Fig 3).
Oaxaca. In this cultural region the demographic model is similar for all four populations,with maximum IGR values for the Lithic period and maximum population sizes in the Preclas-sic period during which the change is also detected (Figs 4 and 5). The exception to this modelis the Mixe group, which shows minimum Nef values in the Classic period and maximum val-ues in the Colonial one.
Mayan. A very different skyline is found for this region, with Tojolabales and Maya_y (Figs4 and 5) showing the most divergent demographic history. The former have maintained dis-crete population sizes (maximum Nef of 16,406 in the late-Classic period), while the lattershow constant growth rates over time, with a peak at the end of the Postclassic period(Nef = 522,057).
DiscussionDespite the numerous studies that have been carried out regarding Mesoamerican indigenousgroups, there are still doubts about their origins, genetic relationships and, above all, theirdemographic history. This paper analyses the phylogeographic and demographic history ofeight Mesoamerican indigenous groups, five of Mayan descent and three from western Mexico.
The complete mitochondrial D-loop region of 520 Native Mexican individuals wassequenced, and different population indices were calculated, comparing them to 20 indigenouspopulations from neighboring regions. To our knowledge, this is the first time the Bayesian sta-tistical method has been successfully applied to the D-loop region in order to reconstruct thedemographic history of each of the Mexican indigenous groups (other authors have generallyfocused on macro-regions). In some cases the results were pooled by cultural region in order tofacilitate a comparative analysis.
The 520 samples analyzed herein belong to one of the six Pan American hgs, confirming thecommon origin and close relationship between Native Mexican groups. This contrasts with thehypothesis formulated in other studies supporting the idea of a dual origin for Mesoamericanpopulations [17].
The small African admixture found in three Mexican indigenous groups (< 3%) is in agree-ment with previous results based on both mtDNA [67] and autosomal markers [82,83]. Theseresults suggest that Post Columbian maternal gene flow toward Mexican indigenous
History and Demography of Mesoamerica Based on mtDNA Sequence Data
PLOS ONE | DOI:10.1371/journal.pone.0131791 August 20, 2015 14 / 24
communities preferentially has involved women of African and Native American origins dueto social constraints.
Some authors have described a pattern in the mtDNA frequency distribution in NorthAmerica that consists of a north-south gradient for hgA2, a south-north gradient for hgC1 andhgD1, and a lack of distribution for hgB2 [84, 85]. According to this proposal, the expected fre-quencies in Mesoamerica should be a high proportion of A2 and B2 and a lower presence of C1and D1 [86]. In general our results agree with this model. However, when an analysis is madeon a smaller geographical scale, this model is not observed. This result can be directly related toa phenomenon described in many human populations, that is, female mobility is mainly lim-ited to small or medium distances [87].
Six hgs have been described in this paper (A2, B2, B4b1, C1, D1 and D4h3a) and, asexpected, haplogroup X2a has not been detected. This result is not surprising, however, sinceits distribution is typically restricted to northeastern North America [88]. It is important toremember that the presence of this variant marks a possible continental route of expansion inthe North American sub-continent.
D4h3 is a founder haplotype with an early presence in Native Americans [10, 12], and it isalso considered a distinctive variant marking the Pacific human expansion into the new conti-nent [7]. Although five of the eight populations studied herein are located on the Pacific coast,this variant has only been detected in two inland groups, Mazateco and Tzotzil (Fig 1, Table 2).The absence of D4h3 in other Native American populations could be explained by genetic drifteffects, given the low frequency (2.3%) of this haplotype in Mesoamerican indigenous groups.Another possibility implies that after crossing the narrowest region of Mesoamerica, the Isth-mus of Tehuantepec, the route of human expansion changed direction diagonally into the con-tinent in order to avoid the coastal foothills of the current state of Chiapas. This hypothesis,supported by some researchers [89], seems to be the most plausible explanation since the oldestMayan settlements were located in the southeast of the state of Chiapas [90]. This model ofexpansion would therefore imply an initial inward movement into the Mayan region, explain-ing the presence of D4h3 in Mazatec and Tzotzil populations, followed by a second expansionto the coast and the subsequent disappearance of the haplotype due to genetic drift effects.
Although the B4b1 subhg is a clade initially defined exclusively for southeast Asian popula-tions [91], it has recently been detected in America in one Quechua sample (Chile). The mostplausible hypothesis for its presence in the Yucatan Peninsula is that this clade traveled alongPacific trade routes established by the Europeans. Although in a previous study, Eurasian hgswere not observed in Mexican Mestizos from the Center to the Southeast [92], 1.4% of Asianand non-Amerindian genomic ancestry has been described in the Yucatan region [93].
Our results show a colonization model characterized by a certain basal homogeneity com-mon to all populations, but with differences in terms of cultural sub-regions [89]. The processthat explains this model would begin with the arrival to Mesoamerica of populations composedof a single genetic pool and distributed to new colonized regions. The significant correlationbetween geography and FST shows the importance that geography had in population differenti-ation. In this context, indigenous populations started differentiating within and between cul-tural areas, which favored the important linguistic and cultural diversity nowadays found inthe region. The fixation indices calculated for the eight populations support this approach,yielding significant values mainly between populations of different cultural areas. Although nostudies analyze this phenomenon in earlier periods, the studies carried out for the Classic andPostclassic period support the idea that population movements took place primarily withinthese cultural areas and were influenced by geography, trade and politics [39,40,94]. Trade,which stimulated migration and contact between human groups within and between cultural
History and Demography of Mesoamerica Based on mtDNA Sequence Data
PLOS ONE | DOI:10.1371/journal.pone.0131791 August 20, 2015 15 / 24
areas, is a factor that can largely explain the genetic structure of Mesoamerica expressed in thegenetic homogeneity for the central area, Oaxaca and the Maya region.
The study of the influence of language also supports this idea; initially, at a micro-geo-graphic level, language had an important role as a genetic barrier as suggested by the significantAMOVA results of the eight populations. However, the importance of this cultural componentis diluted when the study region is expanded. These results are consistent with the hypothesisclaiming that genetic differentiation in Native American groups occurred before the linguisticdifferentiation [45].
A second crucial event, which had important consequences in the population, was the adop-tion of agriculture. The development of maize domestication (Zea mays), and courgette(Cucurbita pepo), bean (Phaseolus vulgaris) and pepper (Capsicum annuum) crops led to amore sedentary lifestyle, an increase in social and urban complexity and the development oftrade and migration routes. These trade-associated migrations were mainly performed withinthe same cultural areas and, on a second level, between areas [34,94]. This process is reflectedin the AMOVA results, in which cultural areas significantly explain population stratification.This sub-structure can be seen in the MDS plots (Fig 2b), with a central cluster formed largelyby the Oaxaca and Maya populations of the Center region.
Populations in the North andWest regions, as well as exceptions from the Mayan regionand Oaxaca, are distributed on the outskirts of this central cluster. The distribution of northernpopulations is consistent with the existence of a genetic barrier between the North region andMesoamerica [67]. Differentiation between these two regions is justified by different survivalstrategies practiced by indigenous groups on both sides of this hypothetical barrier. The north-ern populations, hunter-gatherers until a few generations ago, remained small in size andunderwent intense genetic drift effects. These characteristics, together with limited contactwith other populations [95] as a consequence of geographical barriers, such as the mountainsand canyons of the Sierra Madre, facilitated their low diversity and a high genetic differentia-tion relative to other Mesoamerican groups. In this sense, it is interesting to note the intermedi-ate position of Mayo, Cora and Tarahumara between both regions (Fig 2b).
Populations that are not from the North but are located on the periphery of the main group,probably have low genetic diversity due to other circumstances. Northern populations havealmost no hgs shared with other groups, suggesting a process of differentiation and past isola-tion. The Huichol_h, Huichol_k, Mixe and Tojolabales show low diversity but share hgs withother groups from their area and from other cultural regions. The behavior of these groups sug-gests that the isolation process occurred in more recent times. Another possible explanation forthe shared hgs of these populations could be recent gene flow, as suggested by some studiesbased on GWAS [33]. Other studies corroborate the idea of the importance of trade and poli-tics, especially in the Postclassic period, in shaping the current genetic structure of Mesoamer-ica [34]. These studies mostly suggest contact between Mayan populations and the central-eastern region of Mesoamerica, as well as a migration route between the Center and the West.These migrations probably of little importance quantitatively, however, since otherwise, as wellas having shared hgs indicating a common ancestry, increased levels of diversity should also bedetected.
Within the context of population genetics, demographic history studies are essential inorder to obtain a specific reconstruction of the history of indigenous groups. In addition to esti-mating Nef per generation, IGRs were calculated to reconstruct population fluctuations indetail. Population reconstruction using Bayesian methods interprets demographic growth asthe adaptive reflection of the populations; colonization of new ecosystems with resources andwithout competition and/or improvements in how they are exploited [58,81,82].
History and Demography of Mesoamerica Based on mtDNA Sequence Data
PLOS ONE | DOI:10.1371/journal.pone.0131791 August 20, 2015 16 / 24
In general, most of the indigenous cultural groups from south and southeast areas, such asOaxaca and the Mayas, show high values of Nef in the Preclassical period, with some excep-tions such as Maya_y, Tojolobales, and Tepehuas. During that time, Mesoamerican societiesadopted an agriculture lifestyle as a survival strategy and thereby no longer required a nomadicexistence to search for food and other resources, resulting in an increase in the social complex-ity and population density. The latter is interesting because the population growth detected inthe present work has been corroborated by independent studies [96]. These peaks tend tomove towards the Classic period in western groups and especially in those from the Northregion. The maximum population in the West coincides with the development of the Teuchi-tlán or Tumbas de Tiro tradition (2,400–1,800 ybp), whereas results for the North are relatedto population expansion fromMesoamerica toward the north [97]. In all cases, the maximumdemographic values do not coincide with the period of greatest splendor of Mesoamerican cul-tures, but rather are found in preceding periods.
On the other hand, Nef minimum values are distributed in either the Lithic period, possiblyrepresenting the founder effect, or in recent periods, reflecting the population decline sufferedin many Mexican indigenous groups that has continued until today. In order to measure inreal time the adaptive level of populations, the IGR has to be estimated, with Nef the conse-quence of the accumulation of positive or negative values of these rates over a specific period.Although it is virtually impossible to conduct a systematic analysis of the behavior of IGRs byindigenous group, the detailed IGR evolution is shown (Figure C in S2 File). The interpretationis focused on IGRmax and IGRmin as well as periods in which there was a change in trend.
IGRmax values are found in general during the Lithic period, and the positive trend contin-ues until the Preclassic. After this period, the values decrease and are negative, reaching thecurrent IGRmin. This model is valid for groups from cultural regions of central, southern andsoutheastern Mesoamerica, whereas in the West and North regions maximum Nef values andfluctuations over time are detected. In the West region, IGRmax is reached at the beginning ofthe Preclassic and the inversion occurs at the end of this period and the early Classic. In theNorth, IGRmax values show a wide range of temporal variation from the Lithic to the Preclas-sic, with the inversion at the end of the Preclassic or early Classic (Figure D in S2 File andTable G in S1 File).
The information provided by the IGRs generates some interesting conclusions. The first isthat Mesoamerican populations quickly adapted to their environment in the early stages of col-onization. Moreover, this growth was more or less stable throughout their history until periodsprior to the splendor of the Mesoamerican cultures; after that, they began a slow and steadydecline in population. This early population growth coincides with the beginning of agricultureand a sedentary lifestyle [24]. In fact, the timing difference detected between the West and therest of Mesoamerica could be related to the onset of agriculture dated between 3,650–3,250 ybp[98] (Capacha culture) in the West [99] and 8,240 ybp, 6,208 ybp and 5,090 ybp for Oaxaca,the Center and the Maya region, respectively [100].
Another interesting question is the growth model for the northern groups, which clearlyreflects their hunter-gatherer strategy: old IGRmax, dating back to the lithic period, and rela-tively low values of IGR that maintain discrete population increases.
One of the advantages of having different populations representing the same native group isthat one can approach the study of intragroup internal structure. The analysis of shared hgsreveals that populations of the same group tend to share hgs, an indication of consistency.However, their distribution in the MDS and demographic behavior suggests two models. Thefirst is a fairly homogeneous model, which is represented by the inherited stocks of large cul-tures of central Mesoamerica: Mayan, Aztec and the Otomi, including the western Purepechagroup. The genetic and demographic similarities detected among Otomi and Nahua from the
History and Demography of Mesoamerica Based on mtDNA Sequence Data
PLOS ONE | DOI:10.1371/journal.pone.0131791 August 20, 2015 17 / 24
Sierra Madre Oriental are an interesting result. This coincidence, even for culturally differentgroups, reflects a constant gene flow between both groups favored by geographical proximityand corroborated by the high number of shared haplogroups.
A second model is represented by northern groups, such as Huicholes and Pimas, who havea heterogeneous demographic behavior. That is, the development of large cultures involvesgenetic homogeneity; conversely, less cohesive cultures show variations in their demographicpatterns pointing to periods of isolation and independence among communities presumablyfrom the same indigenous group. Huichol are a particularly interesting group. Ethnographicand ethnohistorical studies indicate the possibility that Huichols derive from various groupswho settled in the Sierra Madre Occidental [101,102]. The detected heterogeneity for thisgroup could be a reflection of this story, in fact, mtDNA [67] and Y chromosome studies [103]confirm the dual origin of this group.
A final point to note is that, although the arrival of Europeans had a major impact on thedemography of indigenous population (the negative IGRmax values are detected after the con-tact), the demographic decline began in Mesoamerica a few hundred years before. This resultcan be contrasted with paleo-climatic studies conducted in both Mesoamerica and the Mayanregion. In Mesoamerica it has been suggested that during the middle Holocene weather condi-tions were relatively stable, but that a dry period began about 5,800 ybp [104]. These datescoincide with the periods estimated using Bayesian statistics in which the IGRs begin to declineand eventually turn negative. Regarding the Mayas region, it is estimated that the collapse ofthis culture occurred in the years 1,110 to 1,200 [96], which practically coincides with the val-ues detected for the demographic decline of the Yucatan Mayas (625 ybp).
In summary, our study–applying for the first time Bayesian skyline methodology to mito-chondrial D-loop sequences–highlights the demographic changes that took place over timeand in different geographical areas of Mesoamerica. These were the result of the complex inter-relationship between geography, subsistence strategies, social structure and culture.
Supporting InformationS1 File. Table A. Genetic differentiation among the Mesoamerican populations studiedherein. Corrected pairwise differences average (below diagonal) and p-values (above diagonal),among the eight Mexican Native populations based on the control region of mtDNAsequences.Table B. Population structure among the eight Mesoamerican populations studied herein.AMOVA based on historic, geographic, cultural and linguistic criteria for the eight indigenouspopulations studied herein.Table C. Genetic differentiation among 28 Native American populations. FST valuesbetween the 28 Native American populations based on the control region of mtDNAsequences.Table D. Population structure among Native American populations based on different cri-teria. AMOVA based on historic, geographic, cultural and linguistic and criteria among 28Native American populations included in this study.Table E. Genetic relationships based on shared haplotypes between Native American popu-lations. Number of shared haplotypes between the 28 Native American populations based onHVRI dataTable F. Estimates of Nef values for each of the Native American groups studied herein.Female effective population size (Nef) and corresponding maximum and minimum estimatedfor the studied Native American populations based on mitochondrial control region data.Table G. Demographic and temporary parameters estimated in the Native American
History and Demography of Mesoamerica Based on mtDNA Sequence Data
PLOS ONE | DOI:10.1371/journal.pone.0131791 August 20, 2015 18 / 24
groups studied herein. Temporary distribution of female effective population size (Nef), inter-generational growth rates (IGR) with maximum and minimum values, and period in which theIGR trend inversion occurred (major demographic changes) estimated in the Native Americangroups studied herein based on mitochondrial control region data.</SI_Caption>(PDF)
S2 File. Figure A. Bayesian skyline plot based on random samples from the 28 studiedindigenous populations. A different number of samples were randomly selected to determinethat sample size has no effect on the demographic profile.Figure B. The 28 studied indigenous populations grouped by cultural areas. The Nefmedian value is represented in the Bayesian skyline plot including confidence intervals.Figure C. IGR values temporary evolution for each indigenous group grouped by culturalareas. The Y-axis represents IGR percentage value and X-axis time in ybp.Figure D. Temporary distribution (bottom) according to Mesoamerican periods (top) inwhich the trend inversion occurred. The vertical red stripe indicates periods previous to 8,000ybp.</SI_Caption>(PDF)
S3 File. Table A. Polymorphic sites in mtDNA hypervariable regions I and II (HVRI yHVRII) defining Native American haplogroups detected in eight Mexican indigenous pop-ulations. Absolute frequencies observed in each Mexican population studied herein are pre-sented.(XLSX)
AcknowledgmentsWe thank all the indigenous volunteers who participated in this study. The authors are alsograteful to Jessica Saunier, Melissa Scheible, Jodi Irwin, and numerous individuals past andpresent in the AFDIL Research/Emerging Technologies section for data generation and review.We also thank Dr. Walther Parson (GMI; Innsbruck, Austria) and EMPOP for the quality con-trol review of the data. All sequence data will be submitted to the EMPOP database (www.empop.org) upon acceptance of this publication. The opinions or assertions presented hereaf-ter are the private views of the authors and should not be construed as official or as reflectingthe views of the Department of Defense, its branches, the US Army Medical Research andMateriel Command or the Armed Forces Medical Examiner System, or the U.S. Department ofJustice. Certain commercial equipment, instruments and materials are identified in order tospecify experimental procedures as completely as possible. In no case does such identificationimply a recommendation or endorsement by the National Institute of Standards and Technol-ogy nor does it imply that any of the materials, instruments or equipment identified are neces-sarily the best available for the purpose.
Author ContributionsConceived and designed the experiments: AGMHRVMDC. Performed the experiments: RRCINA LRL SAP ST. Analyzed the data: AGM LRL SAP ST HRV KS. Contributed reagents/mate-rials/analysis tools: HRVMDC AGM. Wrote the paper: AGM AG HRVMDC RRC. Popula-tion sampling and DNA extraction process: HRV RRC INA.
References1. O’Rourke DH, Raff JA. The human genetic history of the Americas: the final frontier. Curr Biol. 2010;
20: R202–7. doi: 10.1016/j.cub.2009.11.051 PMID: 20178768
History and Demography of Mesoamerica Based on mtDNA Sequence Data
PLOS ONE | DOI:10.1371/journal.pone.0131791 August 20, 2015 19 / 24
2. Goebel T, Waters MR, O'Rourke DH. The late Pleistocene dispersal of modern humans in the Ameri-cas. Science. 2009; 319(5869): 1497–1502.
3. Achilli A, Perego UA, Lancioni H, Olivieri A, Gandini F, Kashani B et al. Reconciling migration modelsto the Americas with the variation of North American native mitogenomes. Proc Natl Acad Sci USA.2013; 110(35): 14308–14313. doi: 10.1073/pnas.1306290110 PMID: 23940335
4. Reich D, Patterson N, Campbell D, Tandon A, Mazieres S, Ray N et al. Reconstructing Native Ameri-can population history. Nature. 2012; 488(7411): 370–374. doi: 10.1038/nature11258 PMID:22801491
5. Tamm ET, Kivisild T, Reidla M, Metspalu M, Smith DG, Mulligan C et al. Beringian standstill andspread of Native American founders. PLoS ONE. 2007; 2: e829. PMID: 17786201
6. Bodner M, Perego UA, Huber G, Fend L, Rock AW, Zimmermann B et al. Rapid coastal spread of firstAmericans: novel insights from South America’s Southern cone mitochondrial genomes. GenomeRes. 2012; 22: 811–820. doi: 10.1101/gr.131722.111 PMID: 22333566
7. Perego UA, Achilli A, Angerhofer N, Accetturo M, Pala M, Olivieri A et al. Distinctive Paleo-Indianmigration routes from Beringia marked by two rare mtDNA haplogroups. Curr Biol. 2009; 19: 1–8. doi:10.1016/j.cub.2008.11.058 PMID: 19135370
8. Dillehay TD. Probing deeper into first American studies. Proc Natl Acad Sci USA. 2009; 106(4): 971–978. doi: 10.1073/pnas.0808424106 PMID: 19164556
9. Bandelt HJ, Herrnstadt C, Yao YG, Kong QP, Kivisild T, Rengo C et al. Identification of Native Ameri-can founder mtDNAs through the analysis of complete mtDNA sequences: Some caveats. Ann HumGenet. 2003; 67: 512–524. PMID: 14641239
10. Rasmussen M, Anzick SL, Waters MR, Skoglund P, DeGiorgio M, Stafford TW et al. The genome of aLate Pleistocene human from a Clovis burial site in western Montana. Nature. 2014; 506: 225–229.doi: 10.1038/nature13025 PMID: 24522598
11. Raff JA, Bolnick DA. Palaeogenomics: Genetic roots of the first Americans. Nature. 2014; 506: 162–163. doi: 10.1038/506162a PMID: 24522593
12. Kemp BM, Malhi RS, McDonough J, Bolnick DA, Eshleman JA, Rickards O et al. Genetic analysis ofearly holocene skeletal remains from Alaska and its implications for the settlement of the Americas.Am J Phys Anthropol. 2007; 132: 605–621. PMID: 17243155
13. Chatters JC, Kennett DJ, Asmerom Y, Kemp BM, Polyak V, Blank AN et al. Late Pleistocene humanskeleton and mtDNA link Paleoamericans and modern Native Americans. Science. 2014; 344(6185):750–754. doi: 10.1126/science.1252619 PMID: 24833392
14. Malhi RS, Cybulski JS, Tito RY, Johnson J, Harry H, Dan C. Brief communication: mitochondrial hap-lotype C4c confirmed as a founding genome in the Americas. Am J Phys Anthropol. 2010; 141: 494–497. doi: 10.1002/ajpa.21238 PMID: 20027611
15. Perego UA, Angerhofer N, Pala M, Olivieri A, Lancioni H, Kashani BH et al. The initial peopling of theAmericas: a growing number of founding mitochondrial genomes from Beringia. Genome Res. 2010;20: 1174–1179. doi: 10.1101/gr.109231.110 PMID: 20587512
16. Kumar S, Bellis C, Zlojutro M, Melton P E, Blangero J, Curran J. Large scale mitochondrial sequenc-ing in Mexican Americans suggests a reappraisal of Native American origins. BMC Evol Biol. 2012;11: 293.
17. Mizuno F, Gojobori J, Wang L, Onishi K, Sugiyama S, Granados J et al. Complete mitogenome analy-sis of indigenous populations in Mexico: its relevance for the origin of Mesoamericans. J HumGenet.2014; 59(7): 359–367. doi: 10.1038/jhg.2014.35 PMID: 24804703
18. Kirchhoff P. Mesoamerica: its geographic limits ethnic composition and cultural characteristics. Illi-nois: The Free Press Publishers; 1952.
19. Carmack RM, Gossen GH, Gasco J. The legacy of Mesoamérica: history and culture of a NativeAmerican civilization. Nueva Jersey: Prentice Hall; 1996.
20. Creamer W. Mesoamerica as a Concept: An archeological view from Central America. Lat Am ResRev. 1987; 22(1): 35–62.
21. Blanto RE, Kowalewski SA, Feinman GM, Finsten LM. A comparison of change in three regions.Cambridge: Cambridge University Press; 1981.
22. Cambell LC, Kaufman T, Smith-Stark T. Meso-america as a Linguistic Area. Language. 1986; 62(3):530–570.
23. Coe MD. Mexico: from the Olmecs to the Aztecs. New York: Thames and Hudson; 1996
24. López-Austin A, López Luján L. Mexico’s Indigenous Past. Oklahoma: University of OklahomaPress; 2001.
History and Demography of Mesoamerica Based on mtDNA Sequence Data
PLOS ONE | DOI:10.1371/journal.pone.0131791 August 20, 2015 20 / 24
25. FAMSI-LACMA. Foundation for the Advancement of Mesoamerica Studies-Los Angeles CountyMuseum of Art. Available: http://www.famsi.org
26. Trigger BG. Archaeology and the image of the American Indian. Am Antiqu. 1980; 45(4): 662–676.
27. Kroeber A. Cultural and natural areas of native North America. Berkeley: University of CaliforniaPress; 1947.
28. Adams REW. Prehistoric mesoamerica. Oklahoma: University of Oklahoma; 1996.
29. Sanders WT. Mesoamerica: the evolution of a civilization. Nueva York: Random house; 1968.
30. Aguilar-Moreno M. A Handbook to life in the Aztec world. Oxford: Oxford University Press; 2004.
31. Kirchhoff P. Mesoamérica: sus límites geográficos composición étnica y caracteres culturales. ActaAmericana. 1943; 1: 92–107.
32. Duverger C. El primer mestizaje, la clave para entender el pasado mesoamericano. México: Ed Tau-rus; 2007.
33. Moreno-Estrada A, Gignoux CR, Fernández-López JC, Zakharia F, Sikora M, Contreras AV et al. Thegenetics of Mexico recapitulates Native American substructure and affects biomedical traits. Science.2014; 344(6189): 1280–1285. doi: 10.1126/science.1251688 PMID: 24926019
34. Ragsdale CS, Edgar HJH. Cultural interaction and biological distance in PostClassic period Mexico.Am J Phys Anthropol. 2015. doi: 10.1002/ajpa.22701
35. Solanes Carraro MC, Vela E. Atlas del México prehispánico. Arqueología Mexicana, 2005.
36. Manzanilla L, López Luján L. Atlas Histórico de Mesoamérica. Mexico: Larousse; 1989
37. Smith ME, Berdan FF. PostClassic Mesoamerican World system. Curr Anthropol. 2000; 41:283.PMID: 10702149
38. Smith ME. The Aztec empire and the Mesoamerican world system. In: Alcock SE, D’Altroy DN, Morri-son KD, Sinopoli CM editors. Empires: comparative perspective from archaeology and history. Cam-brigde: Cambridge University Press; 2001. pp. 128–154
39. Melgar Tisoc ER. Una Relectura del comercio de la Turquesa: entre yacimientos, talleres y consumi-dores. Caminos y Mercados de Mexico. México: Universidad Autonoma de Mexico; 2010.
40. McGuire RH. Mesoamerica and the Southwest/Northwest. In: Nichols, Pool CA, editors. The oxfordhandbook of Mesoamerican archaeology. Oxford: Oxford University Press; 2012. pp. 513–524.
41. Wauchope R. Handbook of Middle American Indians. Austin: University of Texas Press; 1964.
42. West CR, Augelli JP. Middle America: Its Lands and Peoples. New York: Prentice Hall; 1989.
43. Weaver MP. The Aztecs, Maya, and Their Predecessors: Archaeology of Mesoamerica. San Diego:Academic Press; 1993.
44. Kemp BM, González-Oliver A, Malhi RS, Monroe C, Schroeder KB, McDonough J et al. Evaluatingthe farming/language dispersal hypothesis with genetic variation exhibited by populations in theSouthwest and Mesoamerica. Proc Natl Acad Sci USA. 2010; 107: 6759–6764. doi: 10.1073/pnas.0905753107 PMID: 20351276
45. Sandoval K, Buentello-Malo L, Peñaloza-Espinosa R, Avelino H, Salas A, Calafell F et al. Linguisticand maternal genetic diversity are not correlated in Native Mexicans. HumGenet. 2009; 126: 521–531. doi: 10.1007/s00439-009-0693-y PMID: 19495796
46. Henn BM, Cavalli-Sforza LL, FeldmanMW. The great human expansion. Proc Natl Acad Sci USA.2012; 109(44): 17758–17764 doi: 10.1073/pnas.1212380109 PMID: 23077256
47. Gronau I, Hubisz MJ, Gulko B, Danko CG, Siepel A. Bayesian inference of ancient human demogra-phy from individual genome sequences. Nat Genet. 2011; 43(10): 1031–1034. doi: 10.1038/ng.937PMID: 21926973
48. Tillmar AO, Coble MD, Wallerström T, Homlund G. Homogeneity in mitochondrial DNA control regionsequences in Swedish subpopulations. Int J Legal Med. 2010; 124: 91–98. doi: 10.1007/s00414-009-0354-7 PMID: 19590886
49. Irwin JA, Saunier JL, Strouss KM, Sturk KA, Diegoli TM, Just RS et al. Development and expansion ofhigh-quality control region databases to improve forensic mtDNA evidence interpretation. ForensicSci Int Genet. 2007; 1: 154–157. doi: 10.1016/j.fsigen.2007.01.019 PMID: 19083747
50. Edson SM, Ross JP, Coble MD, Parsons TJ, Barritt SM. Naming the dead—Confronting the realitiesof rapid identification of degraded skeletal remains. Forensic Sci Rev. 2004; 16: 64–89.
51. Brandstätter A, Peterson CT, Irwin JA, Mpoke S, Koech DK, ParsonW et al. Mitochondrial DNA con-trol region sequences from Nairobi (Kenya): inferring phylogenetic parameters for the establishmentof a forensic database. Int J Legal Med. 2004; 118: 294–306. PMID: 15248073
History and Demography of Mesoamerica Based on mtDNA Sequence Data
PLOS ONE | DOI:10.1371/journal.pone.0131791 August 20, 2015 21 / 24
52. Brandstätter A, Niederstätter H, Pavlic M, Grubwieser P, ParsonW. Generating population data forthe EMPOP database—an overview of the mtDNA sequencing and data evaluation processes con-sidering 273 Austrian control region sequences as example. Forensic Sci Int. 2007; 166: 164–175.PMID: 16829006
53. Librado P, Rozas J. DNAsp v5: A software for comprehensive analysis of DNA polymorphism data.Bioinformatics. 2009; 25:1451–1452. doi: 10.1093/bioinformatics/btp187 PMID: 19346325
54. Excoffier L, Lischer HEL. Arlequin suite ver. 3.5: A new series of programs to perform populationgenetics analyses under Linux andWindows. Mol Ecol Resour. 2010; 10: 564–567. doi: 10.1111/j.1755-0998.2010.02847.x PMID: 21565059
55. Atkinson QD, Gray RD, Drummond AJ. mtDNA variation predicts population size in humans andreveals a major southern Asian chapter in human prehistory. Mol Biol Evol. 2008; 25: 468–474. PMID:18093996
56. Endicott P, Ho SYW. A Bayesian Evaluation of Human Mitochondrial Substitution Rates. Am J HumGenet. 2008; 82: 895–902. doi: 10.1016/j.ajhg.2008.01.019 PMID: 18371929
57. de Saint Pierre M, Gandini F, Perego UA, Bodner M, Gómez-Carballa A, Corach D et al. Arrival ofPaleo-Indians to the southern cone of South America: new clues frommitogenomes. PLoS One.2012; 7(12):e51311. doi: 10.1371/journal.pone.0051311 PMID: 23240014
58. O’Fallon BD, Fehren-Schmitz L. Native Americans experienced a strong population bottleneck coinci-dent with European contact. Proc Natl Acad Sci USA. 2011; 108: 20444–20448. doi: 10.1073/pnas.1112563108 PMID: 22143784
59. Heller R, Chikhi L, Siegismund HR. The confounding effect of population structure on Bayesian Sky-line Plot inferences of demographic history. PLoS ONE. 2013; 8(5): e62992. doi: 10.1371/journal.pone.0062992 PMID: 23667558
60. Miller HC, Moore JA, Allendorf FW, Daugherty CH. The evolutionary rate of tuatara revisited. TrendsGenet. 2009; 25:13–15. doi: 10.1016/j.tig.2008.09.007 PMID: 18976831
61. Subramanian S. Temporal trails of natural selection in humanmitogenomes. Mol Biol Evol. 2009;26:715–717. doi: 10.1093/molbev/msp005 PMID: 19150805
62. Subramanian S, Hay JM, Mohandesan E, Millar CD, Lambert DM. Molecular and morphological evo-lution in tuatara are decoupled. Trends Genet. 2009; 25:16–18.
63. Strimmer K, Pybus OG. Exploring the demographic history of DNA sequences using the generalizedskyline plot. Mol Biol Evol. 2001; 18:2298–2305. PMID: 11719579
64. Pannell JR. Coalescence in a metapopulation with recurrent local extinction and recolonization. Evo-lution. 2003; 57: 949–961. PMID: 12836814
65. Drummond AJ, Rambaut A, Shapiro B, Pybus OG. Bayesian coalescent inference of past populationdynamics frommolecular sequences. Mol Biol Evolution. 2005; 22:1185–1192.
66. Navascués M, Emerson BC. Elevated substitution rate estimates from ancient DNA: model violationand bias of Bayesian methods. Mol Ecol. 2009; 18:4390–4397. doi: 10.1111/j.1365-294X.2009.04333.x PMID: 19735451
67. Gorostiza A, Acunha-Alonzo V, Regalado-Liu L, Tirado S, Granados J, Samano D et al. Reconstruct-ing the History of Mesoamerican Populations through the Study of the Mitochondrial DNA ControlRegion. PLoS ONE. 2012; 7(9): e44666. doi: 10.1371/journal.pone.0044666 PMID: 23028577
68. Ho SYW, Shapiro B. Skyline-plot methods for estimating demographic history from nucleotidesequences. Mol Ecol Resour. 2011; 11: 423–434. doi: 10.1111/j.1755-0998.2011.02988.x PMID:21481200
69. Heled J, Drummond AJ. Bayesian inference of population size history frommultiple loci. BMC EvolBiol. 2008; 8:289. doi: 10.1186/1471-2148-8-289 PMID: 18947398
70. Fu YX, Li WH. Statistical test of neutrality of mutations. Genetics. 1993; 133:693–709. PMID:8454210
71. Williamson S, Orive ME. The genealogy of a sequence subject to purifying selection at multiple sites.Mol Biol Evol. 2002; 19: 1376–1384. PMID: 12140250
72. Soares P, Ermini L, Thomson N, Mormina M, Rito T, Röhl A et al. Correcting for purifying selection: animproved human mitochondrial molecular clock. Am J HumGenet. 2009; 84: 740–759. doi: 10.1016/j.ajhg.2009.05.001 PMID: 19500773
73. Kitchen A, Miyamoto MM, Mulligan CJ. A Three-Stage colonizacion model for the peopling of theAmericas. PLoS ONE. 2008; 3(2): e1596. doi: 10.1371/journal.pone.0001596 PMID: 18270583
74. Gunnarsdóttir ED, Li M, Bauchet M, Finstermeier K, Stoneking M. High-throughput sequencing ofcomplete humanmtDNA genomes from the Philippines. Genome Res. 2011; 21(1): 1–11. doi: 10.1101/gr.107615.110 PMID: 21147912
History and Demography of Mesoamerica Based on mtDNA Sequence Data
PLOS ONE | DOI:10.1371/journal.pone.0131791 August 20, 2015 22 / 24
75. Guillot EG. Climate change influenced female population sizes through time across the IndonesianArchipelago. Hum Biol. 2013; 85(1–3): 135–152. PMID: 24297223
76. Campos PF, Willerslev E, Sher A, Orlando L, Axelsson E, Tikhonov A et al. Ancient DNA analysesexclude humans as the driving force behind late Pleistocene musk ox (Ovibos moschatus) populationdynamics. Proc Natl Acad Scien USA. 2010; 107: 5675–5680.
77. Finlay EK, Gaillard C, Vahidi SM, Mirhoseini SZ, Jianlin H, Qi XB et al. Bayesian inference of popula-tion expansions in domestic bovines. Biol Lett. 2007; 3: 449–452. PMID: 17535790
78. Stiller M, Baryshnikov G, Bocherens H, Grandal d'Anglade A, Hilpert B, Münzel SC et al. Witheringaway –25 000 years of genetic decline preceded cave bear extinction. Mol Biol Evol. 2010; 27: 975–978. doi: 10.1093/molbev/msq083 PMID: 20335279
79. Magiorkinis G, Magiorkinis E, Paraskevis D, Ho SY, Shapido B, Pybus OG et al. The global spread ofhepatitis C virus 1a and 1b: a phylodynamic and phylogeographic analysis. PLoS Medicine. 2009; 6:e1000198. doi: 10.1371/journal.pmed.1000198 PMID: 20041120
80. Fagundes NJ, Kanitz R, Bonatto SL. A reevaluation of the Native American mtDNA genome diversityand its bearing on the models of early colonization of Beringia. PLoS One. 2008; 3(9): e3157. doi: 10.1371/journal.pone.0003157 PMID: 18797501
81. Fagundes NJ, Kanitz R, Eckert R, Valls AC, Bogo MR, Salzano FM et al. Mitochondrial populationgenomics supports a single pre-Clovis origin with a coastal route for the peopling of the Americas. AmJ HumGenet. 2008; 82(3): 583–592. doi: 10.1016/j.ajhg.2007.11.013 PMID: 18313026
82. Pickrell JK, Pritchard JK. Inference of population splits and mixtures from Genome-Wide allele fre-quency data. PLoS Genetics. 2012; 8: e1002967. doi: 10.1371/journal.pgen.1002967 PMID:23166502
83. Rosenberg NA, Pritchard JK, Weber JL, Cann HM, Kidd KK, Zhivotovsky LA et al. Genetic structure ofhuman populations. Science. 2002; 298: 2381–2385. PMID: 12493913
84. Malhi RS, Schultz BA, Smith DG. Distribution of mitochondrial DNA lineages among Native Americantribes of Northeastern North America. Hum Biol. 2001; 73(1): 17–55. PMID: 11332644
85. Malhi RS, Eshleman JA, Greenberg JA, Weiss DA, Schultz Shook BA, Kaestle FA et al. The structureof diversity within NewWorld mitochondrial DNA haplogroups: implications for the prehistory of NorthAmerica. Am J HumGenet. 2002; 70(4): 905–919. PMID: 11845406
86. Shields GF, Schmiechen AM, Frazier BL, Redd A, Voevoda MI, Reed JK et al. mtDNA sequencessuggest a recent evolutionary divergence for Beringian and northern North American populations. AmJ HumGenet. 1993; 53(3): 549–562. PMID: 8352271
87. Lippold S, Xu H, Ko A, Li M, Renaud G, Butthof A et al. Human paternal and maternal demographichistories: insights from high-resolution Y chromosome and mtDNA sequences. Investig Genet. 2014;5:13. doi: 10.1186/2041-2223-5-13 PMID: 25254093
88. Reidla M, Kivisild T, Metspalu E, Kaldman K, Tambets K, Tolk HV et al. Origin and diffusion of mtDNAhaplogroup X. Am J HumGenet. 2003; 73: 1178–1190. PMID: 14574647
89. Wang S, Lewis CM, JakobssonM, Ramachandran S, Ray N, Bediya G et al. Genetic variation andpopulation structure in Native Americans. PLoS Genet. 2007; 3(11): e185. PMID: 18039031
90. Clark J, Hansen RD, Pérez Suárez T. La zona maya en el preclásico. In Manzanilla, López Luján L.,editors. Historia antigua de México Vol I. El México antiguo, sus áreas culturales, los orígenes y elhorizonte Preclásico. México: INAH-UNAM; 2000. pp. 437–510
91. Derenko M, Malyarchuk B, Denisova G, Perkova M, Rogalla U, Grzybowski T et al. Complete Mito-chondrial DNA Analysis of Eastern Eurasian Haplogroups Rarely Found in Populations of NorthernAsia and Eastern Europe. PLoS ONE. 2011; 7(2): e32179
92. Martínez-Cortés G, Haro-Guerrero JO, Salazar-Flores J, Rubi-Castellanos R, Velarde-Félix JS,Muñoz-Valle JF et al. Maternal admixture and population structure in Mexican-Mestizos based onmtSNPs. Am J Phys Anthrop. 2013; 151(4):526–37. doi: 10.1002/ajpa.22293 PMID: 23754474
93. Silva-Zolezzi I, Hidalgo-Miranda A, Estrada-Gil J, Fernández-Lopez JC, Uribe-Figueroa L, ContrerasA et al. Analysis of genomic diversity in Mexican Mestizo populations to develop genomic medicine inMexico. Proc Natl Acad Sci USA. 2009; 106(21): 8611–8616. doi: 10.1073/pnas.0903045106 PMID:19433783
94. Smith ME, Berdan FF. The PostClassic Mesoamerican world. 1st ed. Salt Lake City: University ofUtah Press; 2003.
95. González-José R, Martínez-Abadías N, González-Martín A, Bautista-Martínez J, Gómez-Valdés J,Quinto M et al. Detection of a population replacement at the Classic-PostClassic transition in Mexico.Proc Biol Sci. 2007; 274(1610): 681–688. PMID: 17254992
History and Demography of Mesoamerica Based on mtDNA Sequence Data
PLOS ONE | DOI:10.1371/journal.pone.0131791 August 20, 2015 23 / 24
96. Kennett DJ, Breitenbach SF, Aquino VV, Asmerom Y, Awe J, Baldini J et al. Development and disinte-gration of Maya political systems in response to climate change. Science. 2012; 338(6108): 788–791.doi: 10.1126/science.1226299 PMID: 23139330
97. Townsend R. Ancient West Mexico: Art and Archaeology of the Unknown Past. New York: Thames& Hudson; 1998.
98. Evans ST, Webster DL. Archaeology of Ancient Mexico and Central America. New York: GarlandPublished; 2001.
99. Kelly IT. Ceramic sequence in Colima: Capacha, and early phase. Tucson: Anthropological papersof the University of Arizona; 1980.
100. Blake M. Dating the initial spread of Zea mays. In Staller JE, Tykot RH, editors Histories of maize.San Diego: Academic Press; 2006. pp. 55–68.
101. Schaefer SB, Stacy B, Furst PT. People of the Peyote. Huichol Indian History, Religion, and Survival.Albuquerque: University of NewMexico Press; 1996.
102. Neurath J. Huicholes. Pueblos Indígenas del México Contemporáneo. Mexico: CONADEPI; 2003.
103. Páez-Riberos LA, Muñoz-Valle JF, Figuera LE, Nuño-Arana I, Sandoval-Ramírez L, González-MartínA et al. Y-linked haplotypes in Amerindian chromosomes fromMexican populations: genetic evidenceto the dual origin of the Huichol tribe. Leg Med. 2006; 8(4): 220–225.
104. Voorhies B, Metcalfe SE. Culture and climate in Mesoamerica during the Middle Holocene. In: Ander-son D, Maasch KA, Sandweiss DH, editors. Climate Change and Cultural Dynamics. San Diego: AGlobal Perspective on Mid-Holocene Transitions; 2007. pp. 157–187.
History and Demography of Mesoamerica Based on mtDNA Sequence Data
PLOS ONE | DOI:10.1371/journal.pone.0131791 August 20, 2015 24 / 24