democratic republic of congo systematic country diagnostic
TRANSCRIPT
Report No. 112733-ZR
Democratic Republic of Congo
Systematic Country Diagnostic
Policy Priorities for Poverty Reduction and Shared Prosperity in
a Post-Conflict Country and Fragile State
March 2018
Africa Region
Document of the World Bank
Pub
lic D
iscl
osur
e A
utho
rized
Pub
lic D
iscl
osur
e A
utho
rized
Pub
lic D
iscl
osur
e A
utho
rized
Pub
lic D
iscl
osur
e A
utho
rized
IDA (International
Development Association)
IFC (International
Finance Corporation)
MIGA (Multilateral
Investment
Guaranty Agency)
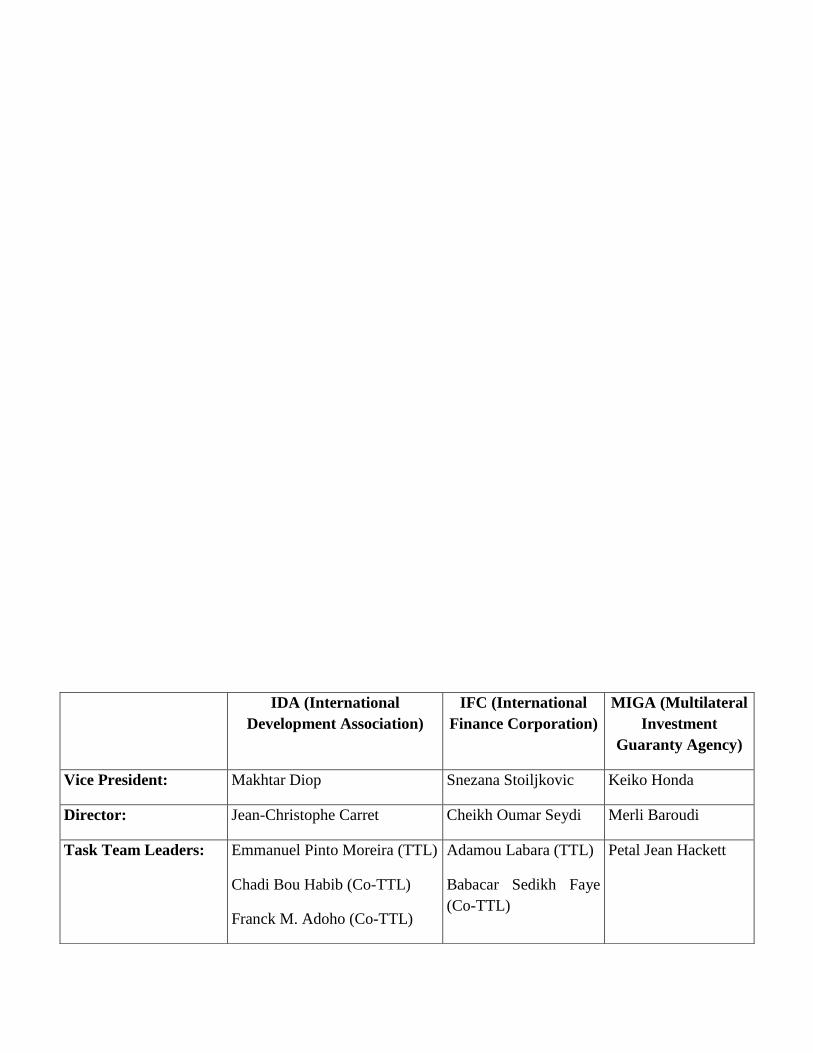
Vice President: Makhtar Diop Snezana Stoiljkovic Keiko Honda
Director: Jean-Christophe Carret Cheikh Oumar Seydi Merli Baroudi
Task Team Leaders:
Emmanuel Pinto Moreira (TTL)
Chadi Bou Habib (Co-TTL)
Franck M. Adoho (Co-TTL)
Adamou Labara (TTL)
Babacar Sedikh Faye
(Co-TTL)
Petal Jean Hackett
This report was prepared by a World Bank Group team led by Emmanuel Pinto Moreira (Lead
Economist and Program leader EFI (Equitable Growth, Finance, and Institutions), and TTL (Task
Team Leader), including Adamou Labara (Country Manager and TTL), Babacar Sedikh Faye
(Resident Representative and Co-TTL), Franck M. Adoho (Senior Economist and Co-TTL), Chadi
Bou-Habib (Lead Economist and Program leader EFI, and Co-TTL), Laurent Debroux (Program
Leader), Luc Laviolette (Program Leader), Andreas Schiessler (Lead Transport Specialist),
Alexandre Dossou (Senior Transport Specialist), Jerome Bezzina (Senior Regulatory Economist),
Malcolm Cosgroves-Davies (Lead Energy Specialist), Pedro Sanchez (Lead Energy Specialist),
Manuel Luengo (Senior Energy Specialist), Anas Benbarka (Senior Energy Specialist), Jose Peres
Caceres (Energy Specialist), Alain Ouedraogo (Energy Specialist), Francisco Igualada (Senior
Mining Specialist), Rachel Perks (Senior Mining Specialist), Marie-Laure Lajaunie (Lead Water
Resource Management Specialist), Pierre Boulenger (Senior Water and Sanitation Specialist),
Madio Fall (Senior Water and Sanitation Specialist), Aude-Sophie Rodella (Senior Economist),
Maximilian Hirn (Economist), Douglas Graham (Senior Environmental Specialist), Daniela
Goehler (Senior Carbon Finance Specialist), Laurent Valiergue (Senior Forestry Specialist), Julian
Lee (Environmental Specialist), Loic Braune (Natural Resources Management Specialist), Esther
Naikal (Economist), Nora Kaoues (Senior Agriculture Economist), Diego Arias (Lead Agriculture
Economist ), Amadou Oumar Ba (Senior Agricultural Specialist), Sara Mbago (Senior Agriculture
Economist), Joanne Gaskell (Agriculture Economist), Sylvie Debomy (Lead Urban Development
Specialist), Mahine Diop (Senior Municipal Engineer), Christian Vang Eghoff (Urban Specialist),
Dina Ranarifidy (Urban Specialist), Jean-Baptiste Migraine (Senior Disaster Risk Management
Specialist), André Teyssier (Senior Land Administration Specialist), Maurizia Tovo (Lead Social
Protection Specialist), Maria Amelina (Senior Social Development Specialist), Lucienne M'Baipor
(Senior Social Development Specialist), Patricia Fernandes (Senior Social Development
Specialist), Pia Peeters (Senior Social Development Specialist), Benjamin Burckhart (Social
Development Specialist), Louise Mvono (Senior Education Specialist), Waly Wane (Senior
Economist), Christophe Rockmore (Senior Economist), Dung-Kim Pham (Senior Operations
Officer), Diego Martin (Senior Operations Officer), Hadia Samaha (Senior Operations Officer),
Serdar Yilmaz (Lead Public Sector Management Specialist), Saidou Diop (Senior Financial
Management Specialist), Jean-Mabi Mulumba (Senior Public Sector Specialist), Shomikho Raha
(Senior Public Sector Specialist), Denis Tshibombi Leta (Governance Specialist), Philippe M.
Aguera (Senior Financial Sector Specialist), Alain Tienmfoltien Traore (Senior Private Sector
Specialist), Milaine Rossanaly (Private Sector Specialist), Arthur Mambou (Senior Investment
Officer), Olufunso Ayomide Fasetire (Investment Officer), Richard Kasenga (Investment Officer),
Frank Douamba (Chief Program Manager), Sylvia Zulu (Principal Operations Officer), Markus
Scheuermaier (Senior Operations Officer); Marina Diagou (Associate Investment Officer),
Gcinisizwe Mdluli (Associate Operations Officer), Moise Tshimenga Tshibangu (Economist),
Ephraim Kebede (Consultant), Bertrand Murguet (Consultant), Jean-Philippe Mukuaki
(Consultant), Hugo De Vries (Consultant).
The team received guidance from Country Director Ahmadou Moustapha Ndiaye, Director Cheikh
Oumar Seydi, Country Program Coordinator Yisgedullish Amde, and Senior Operations Officer
Matthias Cinyabuguma. Amina Adele Temanda (Program Assistant) and Balume Alpha Abonabo
(Team Assistant) provided logistical support and Oscar Parlback proofread and edited the
document. JPD Systems translated the document from English to French.
Abbreviations and Acronyms
ANS Adjusted Net Savings
ANSER
National Rural Energy Service Agency (Agence Nationale de Service
Energétique Rural) ARCA
Insurance Supervision and Regulation Authority (Autorité de Régulation et
de Contrôle des Assurances) ARE Electricity Regulatory Agency (Agence de Régulation de l’Electricité) ARMP
Procurement Regulation Authority (Autorité de Régulation des Marchés
Publics) ASM Artisanal and Small-Scale Mining BCC Central Bank of the Congo (Banque Centrale du Congo) BDS Business Development Services BTI Bertelsmann Transformation Index CAB Current Account Balance CDF Congolese Franc
CVM Sea transportation SOE (Congolaise des Voies Maritimes)
DHS Demographic and Health Survey
DRC Democratic Republic of the Congo EITI Extractive Industries Transparency Initiative FDI Foreign Direct Investment FORNET Forensic Offender Rehabilitation
FSI Fragile States Index Gécamines Copper Mining SOE (Générale des Carrières et des Mines)
GBV Gender Based Violence
GDP Gross Domestic Product GNDI Gross National Disposable Income HDI Human Development Index
HIPC Heavily Indebted Poor Countries ICCN Institut Congolais pour la Conservation de la Nature
ICT Information and Communications Technology
IDMC Internal Displacement Monitoring Center
IDP Internally Displaced Person IIAG Ibrahim Index of African Governance IMF International Monetary Fund
IPV Intimate Partner Violence
MFM Macroeconomic and Fiscal Management
MONUSCO
United Nations Organization Stabilization Mission in the Democratic
Republic of the Congo (Mission de l'Organisation des Nations unies pour la
stabilisation en République démocratique du Congo) MSME Micro, Small and Medium Enterprise NDC Nationally Determined Contribution
NGOs Non-Government Organizations
NRC Norwegian Refugee Council
NSS National Statistical System
PA Protected Area
PER Public Expenditures Review
PEMFAR Public Expenditures Management and Financial Accountability Review
PIP Public Investment Program
PPP Public-Private Partnership PRSP Poverty Reduction Strategy Paper PTSD Post-Traumatic Stress Disorder
REDD+ Reducing Emissions from Deforestation and forest Degradation Regideso Urban Water SOE (Régie de distribution d’eau)
SAEMAPE
Artisanale and Small-Scale Mining Support Service (Service d’Assistance et
d’Encadrement de l’Exploitation Minière Artisanale et à Petite Echelle) SCD Systemic Country Diagnostic SCTP Transportation and Ports SOE (Société Commerciale des Transports et des
Ports)
SME Small and Medium-sized Enterprise SNEL National Electricity Company (Société Nationale d’Electricité) SOE State-Owned Enterprise
Sqkm Square Kilometer
TFR Total Fertility Rate
3Ts Tin, Tantalum, and Tungsten
TVET Technical and Vocational Education and Training U5MR Under-5 Mortality Rate
UN United Nations
UNESCO UN Educational, Scientific and Cultural Organization
UNHCR United Nations High Commission for Refugees
UN WPP United Nations World Population Prospects
VAT Value-Added Tax WBG World Bank Group WDI Worldwide Development Indicators
WDR World Development Report WGI Worldwide Governance Indicators
Table of Contents
Preamble ......................................................................................................................................... i
Executive Summary ...................................................................................................................... 1
Chapter 1. Progress amid Vulnerabilities, Risks, and Uncertainties ..................................... 13
1.1. Historical Perspective and Current Political and Security Context, 1960–2016 ............................................. 13
1.2. Recent Economic Developments, 2010–17 ....................................................................................................... 16
1.3. Facing New Challenges and Risks in a Rapidly Changing Global Economy .................................................. 21
Chapter 2. Reducing Poverty and Sharing Prosperity ............................................................ 23
2.1. The Dynamics of Poverty and Inequality ......................................................................................................... 23
2.2. The Dynamics of Poverty: A Macro Decomposition Perspective ..................................................................... 27
2.3. The Dynamics of Poverty: A Micro Decomposition Perspective ...................................................................... 28
2.4. Rural poverty, agriculture, risks, and vulnerability ......................................................................................... 30
2.5. Educational Attainment and Poverty ................................................................................................................ 31
Chapter 3. Political Instability and Governance Failures: The Challenge of Extractive
Political Institutions .................................................................................................................... 33
3.1 Persistent Weaknesses in Governance Indicators ...................................................................................... 33
3.2 Weak Governance Has Far-Reaching Consequences ................................................................................ 36
3.3 Symptoms of Weak Governance in Fiscal Management and Public Administration ................................. 38
Chapter 4. The Challenge: Making Growth Sustainable and Inclusive ................................ 40
4.1. Growth: Catching Up Without Inclusiveness ................................................................................................... 40
4.2. The Missing Link in the Growth-Poverty Nexus ............................................................................................... 41
4.3. The Binding Constraints to Inclusive and Sustainable Growth ........................................................................ 42
4.4. The Challenges of Making Public Policies Inclusive of Growth ...................................................................... 47
Chapter 5. Physical, Natural, and Human Capital .................................................................. 49
5.1. Physical Capital: Progresses and Challenges ................................................................................................. 49
5.1.1. Transport ................................................................................................................................................... 49 5.1.2. Power ........................................................................................................................................................ 51 5.1.3. Water Supply and Sanitation ..................................................................................................................... 51 5.1.4. Telecommunications ................................................................................................................................. 52 5.1.5. Urban Development .................................................................................................................................. 54 5.1.6. Land Administration ................................................................................................................................. 55
5.2. Natural Capital: Dealing with Abundance ....................................................................................................... 55
5.2.1. Oil and Gas ............................................................................................................................................... 55 5.2.2. Mining ....................................................................................................................................................... 56 5.2.3. Agriculture and Agribusiness .................................................................................................................... 58
5.2.4. Forests and Biodiversity............................................................................................................................ 59 5.2.5. Climate Change ......................................................................................................................................... 59
5.3. Human Capital: Progress amid Fragility ........................................................................................................ 60
5.3.1. Demographic Trends ................................................................................................................................. 60 5.3.2. Malnutrition .............................................................................................................................................. 62 5.3.3. Health ........................................................................................................................................................ 63 5.3.4. Education .................................................................................................................................................. 64 5.3.5. Employment .............................................................................................................................................. 65 5.3.6. Identification ............................................................................................................................................. 66 5.3.7. Gender ....................................................................................................................................................... 67 5.3.8. Forced Displacement ................................................................................................................................ 70
Chapter 6. The Challenges Facing the Private Sector ............................................................. 72
6.1. Lack of Effective Implementation of Reforms ................................................................................................... 72
6.2. Weak Commercial Legal System ...................................................................................................................... 73
6.3. Weak Financial Infrastructure and Regulation ................................................................................................ 73
6.4. Shortage of Skills on the Labor Market ............................................................................................................ 74
6.5. Narrow Market of Business Development Services (BDS) ............................................................................... 75
6.6. Difficult Access to Markets ............................................................................................................................... 75
Chapter 7. Building Resilience and Credibility into the Macroeconomic Framework ........ 78
7.1. Enhancing Fiscal Policy and Creating Fiscal Space ....................................................................................... 78
7.2. Strengthening Monetary Policy to Deliver Low Inflation ................................................................................ 80
7.3. Pursuing Macroprudential and Countercyclical Policies to Build Resilience ................................................. 81
7.4. Maintaining Exchange-Rate Stability ............................................................................................................... 81
7.5. Dedollarize the Economy to Manage Shocks and Vulnerabilities .................................................................... 82
7.6. Diversifying the Economy to Build Resilience and Sustained Growth ............................................................. 83
Chapter 8. Building Institutions and Better Governance ....................................................... 84
8.1. Supporting Inclusive Institutions and Organizations ................................................................................. 84
8.2. Supporting the Less Powerful .................................................................................................................... 85
8.3. Approaches, Interventions, and Tools for Supporting Inclusive Institutions and Organizations and the Less
Powerful .................................................................................................................................................................. 87
Chapter 9. Leveraging Infrastructure, Natural Resources, and Agriculture ....................... 88
9.1. Rebuilding Infrastructure to Establish Resilience and Sustain Inclusive Growth ............................................ 88
9.1.1. Transport: Accelerating Governance Reform and Investment .................................................................. 88 9.1.2. Power: Accelerating Governance Reform and Investment ....................................................................... 89 9.1.3. Water and Sanitation: Revamping the Reform Agenda ............................................................................ 90 9.1.4. Information and Communications Technology (ICT): Accelerating Reform ........................................... 91 9.1.5. Managing Cities for Urban Development and Poverty Reduction ............................................................ 92 9.1.6. Land Administration ................................................................................................................................. 92
9.2. Managing Natural Resources More Sustainably and Boosting Agribusiness .................................................. 93
9.2.1. Oil and Gas ............................................................................................................................................... 93 9.2.2. Mining ....................................................................................................................................................... 94 9.2.3. Agriculture and Agribusiness .................................................................................................................... 95 9.2.4. Forests and Biodiversity............................................................................................................................ 96 9.2.5. Climate Change: Adaptation and Mitigation ............................................................................................ 97
Chapter 10. Resilience and Sustainable Growth through Human Capital ........................... 98
10.1. Establishing the Preconditions for a Demographic Dividend ........................................................................ 98
10.2. Laying the Foundation for Future Productivity through Improved Nutrition ................................................ 99
10.3. Raising Access to Good-Quality Health Care Services ................................................................................ 100
10.4. Education for Employability and to Harness the Demographic Dividend ................................................... 101
10.5. Broadening the Benefits of Growth through Support for Employment ......................................................... 103
10.6. Building a Safety Net System to Foster Resilience and Consolidate the Benefits of Human Development .. 104
10.7. Modernizing the National Identity System .................................................................................................... 106
10.8. Reforms to Enhance the Role of Women in Building the Future .................................................................. 107
10.9. Addressing the Impact of Conflict ................................................................................................................ 108
Chapter 11. Leveraging the Private Sector: The Role of Investment Climate Reforms and
Institutions that Support Markets ........................................................................................... 111
11.1. Going Beyond Formal Policy Reforms: Effective Implementation of Reforms and Stronger Governance to
Boost Greater Productive Investments .................................................................................................................. 111
11.2. Strengthening the Commercial Legal System to Protect Property, Business, and Contracts Rights............ 111
11.3. Enhancing Financial Infrastructure and Regulation to Scale-Up Business Access to Financial Services .. 112
11.4. Addressing the Shortage of Skills by Building a Relevant Education Curriculum and a Stronger Labor Market
114
11.5. Expanding the Market of Business Development Services (BDS) Providers to Support Entrepreneurs ...... 115
11.6. Facilitating Access to Markets ..................................................................................................................... 115
11.7. The Impact of Security and Macroeconomic Stability on Private Investments and Private Sector Behavior
116
ANNEXES ................................................................................................................................. 117
Annex A. Drivers of conflict in the DRC and the Great Lakes region ................................ 117
Annex B. Migration, structural transformation, informality, and the shift of labor out of
agriculture and artisanal mining ............................................................................................. 121
Annex C. The discrepancy between the dynamics of Gross Domestic Product (GDP) and the
Gross National Disposable Income (GNDI) ............................................................................ 124
Annex D. The challenges and the dividends of demographic transition. ............................. 126
Annex E. The government’s policy response to the crisis: the 28 measures ....................... 128
Annex F. Macroprudential policies and preparing for downturns: the examples of Czech
Republic, Peru, and Kenya ...................................................................................................... 131
Annex G. Dedollarization: lessons learned (based on analysis by Fischer, Lundren and
Jahjah 2013) .............................................................................................................................. 132
Annex H. Governance and institutional challenges through sector lenses .......................... 135
Annex I. SCD priorities and gender impact. .......................................................................... 140
Annex J. Challenges facing the development of the oil and gas sector in the DRC ............ 141
Annex K. Framework for statistical development in the DRC ............................................. 143
Annex L: Toward ending extreme poverty by 2030? ............................................................ 146
References .................................................................................................................................. 148
Figures
Figure 1.1 Growth Performance by Country Groups (selected countries), 1995-2015 ............................................... 17
Figure 1.2 Structure of GDP and Sectoral Contributions to Growth, 2011–15 (% of Total) ....................................... 17
Figure 1.3 Effective Tax Rate on Extractives, Mining Sector (Left Axis) and Oil Sector (Right Axis) ..................... 19
Figure 2.1 Changes in Extreme Poverty across the DRC, 2005–13 ............................................................................ 23
Figure 2.2 Poverty Incidence, by Former First-Level Local Administrative Unit, 2012 ............................................. 25
Figure 2.3 Type of Employment by Welfare Quintile and Residence, 2012 ............................................................... 27
Figure 2.4 The Main Drivers of Poverty Reduction, 2005–12 .................................................................................... 28
Figure 2.5 Change in the Share of Workers in the Mining Sector, by First-Level Local Administrative Unit, 2005–12
..................................................................................................................................................................................... 29
Figure 2.6 Poverty Incidence and Food Poverty, by Rural Livelihood Zone, 2012 .................................................... 30
Figure 3.1 Worldwide Governance Indicators for the DRC 2005–15 ......................................................................... 34
Figure 3.2 Comparative 2015 Worldwide Governance Indicator in Sub-Saharan Africa ........................................... 35
Figure 3.3 Bertelsmann Transformation Index Report (BTI), DRC 2006–16 ............................................................. 35
Figure 4.1 DRC ANS 2015 .......................................................................................................................................... 45
Figure 4.2 ANS Trend from 2005 to 2015 ................................................................................................................... 46
Figure 5.1 Information and Communications Technology .......................................................................................... 53
Figure 5.2 Projection of Demographic Trends in the DRC by 2050 ........................................................................... 61
Figure 7.1 Income Seigniorage in the DRC and Peru (% of GDP) .............................................................................. 82
Figure 7.2 Foreign Currency Deposits as a percent of Total Deposits between 2001 and 2012 .................................. 82
Figure 10.1 The Cycle of Poverty and Malnutrition .................................................................................................... 99
Figure 10.2 Annual Investment and Benefits in Addressing Malnutrition ................................................................ 100
Tables Table 4.1 Institutions and the Cost of Business: Indicators for the DRC and Selected Comparator Countries ........... 43
Table 10.1 Policies to Reap the First Demographic Dividend ..................................................................................... 99
Boxes Box 3.1 Political Developments in the DRC since 2013 ............................................................................................. 39
Box 11.1 Accompanying the Informal Sector: Entrepreneurship to Reduce Poverty ................................................ 114
i
Preamble
i. The need to conduct a Systematic Country Diagnostic (SCD) for the Democratic
Republic of Congo (DRC) rests on the fundamental thrust that the DRC is emerging from a
period of protracted wars and political instability that has destroyed the country’s economic
and social foundations. It thus becomes important to acknowledge that the DRC is still a post-
conflict and fragile state.
ii. Analyzing development issues in such an environment requires an appropriate
framework that will help in designing the best solutions to complex development challenges.
The team considers that the framework developed in the World Development Report (WDR) 2011,
Conflict, Security, and Development, is the most suited to addressing development challenges in
the DRC. However, other reports are also explored to complement the analysis and the policy
prescriptions of the WDR 2011. This SCD will also use the wealth of knowledge available within
and outside the World Bank Group (WBG).
iii. This approach, along the lines of the WDR 2011, recognizes: (i) the need for selectivity
and identifying priority development challenges in the country; (ii) the difficulty in finding
impactful and well targeted development solutions in a post-conflict country and a fragile state
with a rapidly growing population; (iii) the need for delivering in the short-term quick wins to the
population to buy peace and restore confidence, while building institutions in the long term; (iv)
the hard task of finding the right sequencing of policy interventions in a country facing
multifaceted development challenges; and (v) the need to persevere, as the effects of these
interventions will take time, and, as the WDR 2011 states: “one should not expect too much too
soon.”1
iv. Prioritizing means that the SCD identifies the most binding constraints for sustaining
high growth. In a country with tremendous development needs, such as the DRC, every constraint
may hamper development. Every development issue is important, ranging from macroeconomic
stability, to institutions and governance, to infrastructure development, to agricultural
development, to demographic dividend, to human development, to private sector development, to
climate change. Hence singling out those issues with maximum impact on the DRC’s development
is a hard task. Therefore, the SCD makes choices, focusing on areas where the constraints seem to
be the most binding.
v. The SCD puts an emphasis on revenue mobilization, institutions, governance, and
infrastructure as fundamental to development in the DRC. In this regard, the report argues that
political instability, weak state institutions, elite capture, and predation explain the persistent
poverty among the Congolese people, despite the country’s enviable natural resource wealth.
Dysfunctional institutions lead to weak governance and undermine the ability of the government
to put in place policies and administrations able to manage public finances, including mobilizing
domestic revenues. The lack of resources prevents the strengthening of those same institutions and
administrations, and the development of economic and social infrastructure. Putting DRC on a
1 World Bank Group 2011. World Development Report.
ii
long-term sustainable development path requires substituting the vicious circle with a virtuous one
involving the same elements.
vi. Making choices implies making trade-offs between competing priorities, conflicting
policy actions, and short- versus long-term development objectives. Selection bias may occur
while deciding which issues are the most relevant. To prevent this, the team consulted with the
country team (October 2015). WBG units and individuals actively participated in meetings to frame
the issues covered in this SCD. A series of wide consultations was subsequently organized,
including with government counterparts, civil society, the private sector, academicians, women,
and youth. The production of the report involved all global practices and government counterparts,
and the draft report was discussed at a country team meeting in December 2016. All this provided
assurance to the team that the relevant topics and issues were covered.
vii. The SCD rests on the fundamental thrust that business as usual is not an option for a
country which will have the world’s 11th largest population in 2050. While the population of
DRC amounts to around 1 percent of world’s population, the country is home to 7.2 percent and
14.3 percent of the world and Sub-Saharan African population living in extreme poverty,2
respectively. Microsimulation results suggest that, if the DRC continues on its current path with a
moderate inequality, and similar per-capita GDP growth patterns, one in two or approximately 60
million Congolese will still be living in extreme poverty in 2030. The SCD also acknowledges that
no one-size-fits-all solution would be applicable or provide the best policy solutions in a big
country like the DRC. The SCD’s policy recommendations attempt to be specific and to propose
solutions that DRC policy makers can implement within the country’s limited capacity.
Implementation of some of these policy measures, in particular those related to governance and
the law, will take time to be put in place and become a shared value among the people of Congo.
As Gordon Brown, the former prime minister of the United Kingdom, observed, “In establishing
the rule of law, the first five centuries are always the hardest.”
viii. The priorities identified in the SCD are in line with the analysis of the poverty
assessment, the economic updates, the Public Expenditures Management and financial
Accountability Review (PEMFAR), sectoral Public Expenditures Reviews (PER), and the
2016 Performance Learning Review. The recommended policy actions focus on the most
significant transformative factors of the economy which will help sustain strong growth rates and
make good progress towards the twin goals of poverty reduction and shared prosperity in the DRC
by 2030.
ix. Despite the numerous interactions with the country team and all stakeholders
involved in the preparation of the SCD, this report cannot cover all the issues raised.
Knowledge gaps exist, and there are five areas where additional thinking and analysis are required:
a. Macroeconomic Analysis. Tension arose between short-term macroeconomic analysis,
mainly related to the current crisis facing the DRC, and the country’s long-term development
trends. The decision was to focus on structural and long-term issues while providing some
highlights on the recent economic developments. More work needs to be done on the current
2The DRC is the second country in Sub-Saharan Africa with more people living in extreme poverty, after Nigeria.
There are as many people living in extreme poverty in the DRC as there are in Tanzania, Ethiopia, and Madagascar
combined.
iii
macroeconomic situation of the DRC. The fourth edition of the DRC’s economic update,
completed by the end of 2016, provides such analysis. In addition, the macroeconomic and fiscal
management (MFM) team is looking to the multisector implications of the current crisis.
b. Poverty Analysis and Trends. The SCD uses the 2005 and 2012 household surveys to
analyze the poverty trends and drivers of poverty reduction in the DRC. Although it would have
been interesting to use recent data, we believe that the root causes of poverty in the DRC have not
changed since 2012. However, the poverty team is currently conducting additional analysis to
identify relevant instruments to enhance poverty alleviation policies in the DRC. First, poverty
maps are being developed and will help improve the geographic targeting of poverty-focused
development programs. Second, given the high urban poverty rate and the rapid urbanization in
the country, a new survey is being developed, and aims at providing evidences to understand living
standards in urban areas, particularly in Kinshasa. Finally, different tools that will help analyze
poverty and distributional impacts of macroeconomic shocks are being developped.
c. Decentralization and Economic Development. The DRC is a very large country, and
decentralization provides the potential to bring development closer to people. The recent increase
from 11 to 26 provinces has created additional challenges to assess the impact of decentralization
on the DRC’s economic development. While the SCD does not cover decentralization, this
knowledge gap is being filled by the subnational economic analysis that the World Bank team is
conducting. In 2016, the World Bank widely disseminated to the provincial authorities a recent
report on the potential and challenges of economic development in Kongo-Central. This work is
being extended to other provinces and will complement the SCD and fill the knowledge gap.
d. Political Instability, Transition, and Development. The current political transition is
putting a toll on the country’s development prospects. Analyzing the different scenarios of the
transition and their possible outcomes would have been a valuable addition to the SCD. The
Country Partnership Framework (CPF) under preparation will provide the opportunity to frame
the issue of political instability and the challenging transition and its consequences on the DRC’s
development prospects.
e. Data Challenges for Evidence-Based Policy Design and Monitoring. Statistical
infrastructure is dramatically lacking. The country has not undertaken a population and housing
census since 1984, has not organized an agricultural census since 1974, and is yet to organize a
business census. The lack of quality data on industrial and agricultural production makes estimates
of macroeconomic aggregates unreliable. The absence of population data affects much of the
statistical system and reduces the credibility of development planning and management. It affects
the accuracy of statistics that incorporate population dimensions, ranging from macroeconomic
statistics (such as GDP per capita) to service access rates. Nevertheless, much effort is being made
by the government, World Bank, and other development partners to improve statistics. For
example, the Statistics Development Project approved by the World Bank in August 2015,
provides support to the government’s ongoing efforts at rebuilding the DRC’s statistical capacity
focusing on longer term while also addressing critical data needs. To address immediate data
needs, the project supports development of basic infrastructure for statistical operations
(cartography of population census, households’ surveys, etc.) to ensure statistics are produced in
compliance with international standards. Addressing data challenges in the DRC will require a
long-term and holistic approach, which must go beyond a one-off project.
1
Executive Summary
1. The DRC is a classic example of the paradox of plenty, since the country is extremely
rich in natural resources while its population is extremely poor. DRC has tremendous
endowments in natural resources. It is the largest country in Sub-Saharan Africa (SSA) with a total
surface area of about 234 million hectares (equivalent to the size of Western Europe). Its
population, estimated at 77 million inhabitants, is the third largest in Africa after Nigeria and
Ethiopia. The Congo Basin is Africa’s largest contiguous forest and the second largest rain forest
in the world, while the country’s mineral endowments fare among the richest and most diverse in
the world and include vast deposits of copper, cobalt, coltan, diamonds, gold, tin, iron ore, zinc,
and oil.3 The production of copper stood at 1 million tons in 2015, making the DRC the largest
copper producer in Africa ahead of Zambia. The country accounts for about 16 percent of the
world’s total production of diamonds, and its oil potential remains largely untapped. In addition to
its mineral wealth, the DRC is also blessed with huge agricultural potential. It has about 80 million
hectares of arable non forest land, of which only 10 percent is currently under cultivation. If these
potentials were properly exploited, the country could go from a net food importer to a net food
exporter.4
2. Yet the country is among the poorest in the world, and it did not achieve any of the
Millennium Development Goals (MDGs) by 2015. Poverty in the DRC remains pervasive, and
greater than the Sub-Saharan African average. About two-thirds of the population lives below the
poverty line. Chapter 2 of the SCD shows that between 2005 and 2012 the proportion of people
living below the poverty line declined from 69.3 percent to 64 percent, respectively. Yet the
number of poor increased by 7 million. Almost 14 per cent, or one out of six people living in
extreme poverty in Sub-Saharan Africa live in the DRC. The slight reduction in poverty was not
shared across regions. Indeed, all poverty indicators improved in the provinces of North Kivu and
Orientale, including a reduction in poverty incidence and in the number of people living below the
poverty line. In parallel, living standards worsened in Maniema and the two Kasaïs, where poverty
incidence increased between 2005 and 2012. In the latter case, there is a strong correlation between
the rise in poverty and the collapse in mining employment, especially in artisanal and small-scale
mining (ASM). Some groups are particularly vulnerable, notably children, people living with
disabilities, displaced populations, women, the elderly, and indigenous people, and require social
protection programs. Widows and female-headed households are more generally vulnerable and
demonstrate higher incidences of poverty and extreme poverty, in part due to loss in assets and
resources connected to men, including land and labor. If the current demographic and economic
trends were to continue, the number of poor may increase by 8 million by 2030. Per capita GDP
in constant 2010 US$ was estimated at 387 for 2016. This is about 40 percent of its value in 1970.
3. Demographic trends, reinforced by gender discrimination and lack of social policies,
contributed to maintaining poverty at relatively high levels. The fertility rate was 6.6 children
per woman in 2014, up from 6.3 in 2010 (Demographic and Health Survey - DHS 2014). Over the
3 World Bank Group 2013. DRC: Country Assistance Strategy. Washington, DC; Natural Resource Governance
Institute (NRGI) 2015. Country Strategy Note: Democratic Republic of Congo. 4 World Bank Group 2012. Country Economic Memorandum (CEM): Resilience of an African Giant: Boosting
Growth and Development in the Democratic Republic of Congo. Washington, DC.
2
next 20–25 years, the population is expected to double, posing further challenges to the DRC’s
already low human development indicators. Social indicators in areas such as education, health,
access to water, and infant mortality showed some improvement since 2010. However, they remain
unsatisfactory, and inequality in access to education, health, and basic infrastructure is widespread.
Gender inequality drives the negative dynamics of high fertility, high dependency, and the
preponderance of youth in the overall population. Women face unequal treatment with respect to
labor force participation, land tenure, and property ownership, as well as with political
representation. Sexual and gender-based violence (GBV) has spread into a wider social
phenomenon, and represents a significant barrier to women’s full engagement in social and
economic life. Around 52 percent of women have experienced physical violence since the age of
15, and 27 percent have experienced sexual violence; of which 16 percent occurred in the last 12
months (DHS 2014). Despite high levels of vulnerability and the existence of large groups with
specific special needs, the DRC has no national social protection system to provide targeted
support to the poorest and most vulnerable.
4. The poor state of infrastructure is a major constraint on sustainable and inclusive
growth in the country.5 Despite some improvements, such as increase in urban water production
by 30 percent between 2006 and 2013 and in electricity supply by 28 percent between 2007 and
2014, the country ranks at the bottom in almost all measures of infrastructure coverage, even by
Sub-Saharan African standards.6 Gaps are particularly large in road transport, electricity supply,
and access to improved water sources.7 The country is almost entirely landlocked, and the bad
conditions of transportation infrastructure aggravate geographical isolation and the social and
economic inequalities across provinces and between urban and rural areas. One of the greatest
infrastructure challenges is power generation. Only 15 percent of the population has access to
electricity, and firms consider the supply of electricity to be a major constraint. In addition, there
are issues of the reliability of energy distribution. Power shortages occur an average 10 days a
month. The Internet penetration rate is only 1.7 users per 100 inhabitants, and the country is behind
most regional counterparts in access to the Internet and fixed or mobile phone services. Access to
improved water sources stands at 52.4 percent nationwide (81.1 percent in urban areas and only
31.2 percent in rural areas), while access to improved sanitary facilities is at 28.7 percent.
Why is poverty, inequality, and vulnerability so widespread in a country with such a wide
endowment in natural resources?
5. Political instability, poor governance, and weak state institutions are the main factors
that explain the persistent poverty of the Congolese population. The DRC is a post-conflict
and fragile country with a rapidly growing population. The turbulent history of the country along
with weak governance has severely limited the ability of successive governments to establish
stable institutions and to improve the living standard of the population. For most of the 57 years
following independence in June 1960, transfers of power were the result of assassinations or coups.
The first elected prime minister was overthrown and assassinated after only 10 weeks in office.
Following independence, the Kasai and Katanga provinces sought to break away as independent
states. The country lived through a two-phase war in the 1990s (1996–1997 and 1998–2002) which
claimed millions of lives and had devastating effects on physical and social infrastructure. While 5 CEM vol. (3) 2012. 6 World Bank WDI database. 7 See Foster and Benitez (2010).
3
the war officially ended with the signing of the all-inclusive, Sun City peace agreement in 2002,
the country is still suffering from the impact of that war. Violence and fear of violence remain
facts of life in the DRC.
6. This prolonged political instability has also prevented the emergence of a stable
coalition of elites. The lack of such a coalition prevented the country from establishing inclusive
and strong institutions to buttress a credible development plan and to deliver economic growth.
Elites fail to agree on the strategic objective of providing peace, security, and prosperity for all
and, even if they do so, they still diverge on the appropriate implementation mechanisms. The
current erratic evolution of the political situation is the obvious manifestation of crumbling state
institutions, defined by the absence of checks and balances, elite capture, and the high level of
corruption. Consensus failure, lack of stable coalitions, and poor governance and weak institutions
have resulted in the deficiency of commitment of government officials, the weak coordination of
public policies, and poor cooperation with international agencies. As the WDR 2017 on
Governance and the Law could have pointed out in the context of the DRC, the lack of
commitment, coordination, and cooperation (the three Cs) in a context of weak capacity (the fourth
C) has led to the implementation of ineffective public policies.
7. Furthermore, elite capture leads to a diversion of resources for the benefit of political
and socioeconomic elites.8 Capture manifests itself in a system that tends to distort decision-
making in favor of some individuals or groups in both the public and private sectors. One aspect
of capture is that of the regulatory, legal, and executive processes. For example, Parliament was
unable to discuss the amendments to the mining code, although the government approved and
transferred them to the chamber (since March 2015). Among other objectives, the amendments
aim to change rent distribution in the sector in favor of the DRC. Only a recent change in dynamics
within the elite, motivated by the dire fiscal and economic situation, led to the start of the
discussion of the amendments in September of 2017, and to the adoption of a new code. Despite
many efforts, including the publication of several contracts9 and Extractive Industries
Transparency Initiative (EITI) compliance,10 opacities remain in the management of the value
chain of extractive industries, ranging from contract adjudication to monitoring operations,
collection, and management of revenues.11 This has been highlighted by both the Carter Center,12
8 The Sentry’s Country Profile stresses that capture of the DRC’s wealth involves domestic, regional, and international
actors: the wealth of the country has been plundered by elites in Congo, Rwanda, Uganda, and other neighboring
countries, and elsewhere. The report further states, even industrialized concessions engage in practices that result in
the loss of billions of dollars for the Congolese Treasury, and, Multinational companies have also been reported to use
bribery and other corrupt practices as part of their regular business operations. https://thesentry.org/wp-
content/uploads/2015/07/19103553/Country-Brief_DRC.pdf. 9 See Ministry of Mining. http://mines-rdc.cd/fr/index.php/contrats-des-ressources-naturelles/contrats-miniers. 10 See ITIE-RDC. http://www.itierdc.net/. 11 For example, although the DRC has joined the EITI’s beneficial ownership disclosure program, which requires
disclosure of the beneficial ownership for oil, gas, and mining companies, a recent evaluation report notes that there
are major challenges in obtaining beneficial ownership disclosures. This is due to the lack of legal requirements for
extractive companies to report their beneficial owners. See the evaluation report at
https://eiti.org/sites/default/files/documents/evaluation_report.pdf. 12 Carter Center Urges DRC, Freeport, and Lundin to Publish Revised TFM Contract and Disclose Payments to DRC
State-owned Miner Gécamines. January 19, 2017. https://www.cartercenter.org/news/pr/drc-011917.html
4
Global Witness,13 EITI,14 and the Africa Progress Panel.15 Another example is the legally approved
base salary of parliamentarians, which in the DRC is between 150 and 200 times per capita GDP
(70 times in Nigeria, 20 times in Rwanda, 3 times in the USA).16 In addition, multiple exemptions
are weakening the tax system. In summary, the DRC is in a situation where political connections
are used to divert resources, and, in return, these resources are used to perpetuate political and
social dominances.
8. Elite capture leads to corruption at all levels, which takes a heavy toll on public
service capacity to deliver key services.17 Corruption continues to hamper the DRC’s
development prospects. Elite capture, uncertainties, and repeated conflicts led to the development
of corruption practices at various levels of governing bodies and public administration. Political
turmoil that has lasted for decades in the absence of a strong executive system able to impose
effective sanctions has worsened the situation. At the lower levels, the problem is compounded by
the extremely low levels of government employees’ salaries and irregular payment. The consensus
is that unless decisive action is taken in this area the DRC may not be able to break the current
cycle of corruption, thus further widening the path to fragile institutions and increased poverty.
9. The country’s weak institutions failed to build the foundations of a resilient economy
and absorb external shocks, hence exposing the society to cycles of violence and
impoverishment. As a result, the country’s heavy dependence on natural resources makes it highly
vulnerable to external shocks. As WDR 2011 could have pointed out in the case of the DRC:
“Countries with weak institutions are disproportionately vulnerable to external shocks.” Between
1960 and 1980, the country experienced relative prosperity due to high copper and other
commodity prices.18 Per capita GDP in constant 2010 US$ was estimated at 1016 in 1970 and 804
in 1980. However, prevailing policies became unsustainable when commodity prices collapsed in
the 1980s. In fact, it is believed that the war of the 1990s was the result of the inability of both
corporate and public institutions to absorb the commodity price shock. In other words, there were
no effective mechanisms for coping with the uncertainty and volatility associated with resource
revenues. Per capita GDP in constant 2010 US$ fell drastically from 668 in 1990 to 276 in 2000.
This dramatic reduction in the average living standard was the result of the war combined with an
inadequate policy framework. This outcome is consistent with the findings of the 2 WDR 2011,
which states: “The effects of violence are long-lasting. For countries that have gone through civil
13 November 15, 2016. Congo signs over potential $880m of royalties in Glencore project to offshore company
belonging to friend of Congolese President. https://www.globalwitness.org/en/press-releases/congo-signs-over-
potential-880m-royalties-glencore-project-offshore-company-belonging-friend-congolese-president/. 14 EITI 2015, Section 7. https://drive.google.com/file/d/0B1C1Aj5TqAgvcHVfTks2dWZudDQ/view; and EITI 2014,
paragraph 4.3.6. http://www.itierdc.net/wp-content/uploads/2016/03/rapport-ITIE-RDC-2014-Final-signé.pdf. 15 Between 2010 and 2012, the DRC lost at least US$ 1.36 billion in revenues from the underpricing of mining assets
sold to offshore companies; Africa Progress Report 2013:55. http://www.africaprogresspanel.org/wp-
content/uploads/2013/08/2013_APR_Equity_in_Extractives_25062013_ENG_HR.pdf. 16 October 24, 2012. “RDC: pauvres députés!,” Jeune Afrique. http://www.jeuneafrique.com/139553/politique/rdc-
pauvres-d-put-s/; October 3, 2016. “Africa: How Ugandan MPs' Pay Compares With Counterparts' Worldwide.” The
Observer (Kampala). http://allafrica.com/stories/201610030730.html; see Inter-Parliamentary Union’s Survey of
Parliamentary Salaries and Allowances at
http://www.asgp.co/sites/default/files/documents/UQRDHUMQZLGUSEVKDUFLUIVVNFEEMD.pdf. 17 According to a 2014 Transparency International report, corruption permeates all levels of the state apparatus,
involving a wide range of state officials, ranging from low-ranking civil servants to the highest members of
government. http://www.transparency.org/files/content/corruptionqas/Country_Profile_DRC_2014.pdf 18 CEM 2012.
5
war, recovering to original growth paths takes an average of 14 years of peace. Until 1990, Burkina
Faso and Burundi had similar incomes and growth paths. With the onset of civil war in Burundi,
real income declined to 1970 levels.”
10. Macroeconomic performance improved until mid-2015, reflecting the outcome of
reforms (good policies), yet did so in a context of a commodity price super cycle (good luck)
and massive aid flows (good policies and good luck). While inflation was above 500 percent in
2001, it did drop to single digits by 2010. The dollarization of the economy meant that these wide
swings in inflation also translated into significant movements of the exchange rate. Until 2015,
inflation remained below the medium-term target of 3.5 percent set by the authorities. Average
inflation was 1.2 percent in 2014 and 0.7 percent in 2015. Low inflation was driven by
improvements in monetary and budgetary policies. Starting in 2009, there has been a slowdown in
the growth of money supply. The budget deficit has been reduced significantly, and authorities
have stuck to their commitment to the fiscal anchor by not financing budget deficits through the
central bank. The fiscal position showed a small surplus in 2014.
11. This enhanced macroeconomic performance was also marked by strong economic
growth in a post-conflict country struggling to rebuild its destroyed infrastructure. Between
2002 and 2008, the rate of economic growth ranged from 5.6 to 6.2 percent. This growth
performance was driven mainly by developments in trade, the mining sectors, and massive
investments in infrastructure. Although the economy experienced a setback in 2009 when the
growth rate stood at 2.8 percent due to the international financial crisis, it grew at 9.5 percent in
2014, driven by copper production and the service sector (including telecommunications, trade,
and transport),19 and growth averaged 7.5 percent in 2010–15.
12. However, the strong macroeconomic performance failed to translate into significant
reduction in poverty and inequality. The Gini index improved slightly from 38 in 2005 to 35 in
2012, but large portions of the population remain trapped in extreme poverty with often no hope
that their living conditions will improve in the near future. Lack of job opportunities for youth
together with the existence of a large youth bulge not sufficiently skilled to enter the labor market
have moved thousands of young Congolese into the streets, feeding pockets of violence. Thus, the
high rates of youth unemployment and underemployment in the country are a key indication that
the growth of recent years has not been inclusive; this lack could lead to more social unrest in a
context of a post-conflict and fragile state. Moreover, the population age-structure of the DRC is
highly concentrated in dependent children (45 percent of the population is under 15 years of age),
which may negatively impact prospects for moving Congolese out of the poverty trap and
improving the country’s human development indicators.
Why the recent economic performance did not benefit more the people of Congo?
13. Several factors have prevented the Congolese people from benefiting from the
country’s recent growth performance. First, the high growth experienced in the past decade
in the DRC was a catch-up effect rather than a dynamic growth path. This is typical of post-
conflict countries struggling to rebuild devastated infrastructures. Periods following the end of a
conflict present economic opportunities, as discussed in detail by Collier (2009). For example, in
19 World Bank 2015.
6
post-conflict periods, one may observe high returns to investment in infrastructure following the
destruction caused by war, and high potential for growth in commodity exports and resource
extraction. Despite the conventional wisdom that suggests that reconstruction efforts after social
turmoil lead to more rapid growth, the growth is not usually complemented by great social progress
(Cerra and Saxena 2008). As Collier and Hoeffler (2002, 2) point out: “The economic
circumstances of post conflict societies are distinctive in several respects. Typically, opportunities
for recovery enable a phase when growth is supranormal. The need to restore infrastructure,
juxtaposed against the collapse of revenue, tend to make aid unusually productive.”20
14. Second, the link between growth and poverty is weak in the DRC, and high economic
growth did not translate into significant poverty reduction. The sources of growth, mainly
dominated by the mining sector, do not generally lend themselves to inclusiveness. Indeed, at the
climax of the commodities cycle, the growth of per capita GDP averaged 4.2 percent in 2010–14,
while per capita Gross National Disposable Income (GNDI) averaged 2.7 percent. This was due
to the rapidly increasing factor of income payments to the rest of the world to remunerate
increasing foreign direct investments in extractives. In addition, structural transformation was
inadequate or nonexistent, and efforts to build productive capacity and create countrywide job
opportunities were insufficient. Moreover, the weak backward and forward links of the mining
sector with the rest of the economy is not conducive to inclusive growth. Finally, though
agricultural production has increased considerably, productivity in agriculture, which is the main
reservoir of job creation, is still low.
15. Third, the policies that have been implemented were primarily aimed at stabilizing
the economy, rather than making growth inclusive. Indeed, several binding constraints to
sustainable and inclusive growth are still in place, including weak governance and institutions,
limited access to basic infrastructure, lack of financial infrastructure and financial inclusion, low
human capital endowment, gender bias, and a business climate that is not conducive to private-
sector-led growth.
16. Fourth, the government failed to make the needed investments to share the returns
of the recent growth with the poor. Investment in the provision of good quality social services
(health and education) remains abysmally low. For example, the DRC’s health expenditure stands
at one tenth of the Sub-Saharan African average. Moreover, the lack of efficiency of the resources
invested has resulted in public investment programs (PIPs) not directed to the poor. Issues in the
selection, execution, monitoring, and evaluation of government projects are the main causes of
PIP inefficiency in the DRC.
17. The sheer number of challenges facing the DRC is not insurmountable. Development
processes are cumulative, with success in one area opening up opportunities in others. Yet the
DRC is still a post-conflict country and a fragile state within a complex socioeconomic and
political context. Building on the findings of the WDR 2011, the policy prescriptions of the SCD
account for the fact that in such an environment, building resilience and delivering peace and
security to the Congolese people takes time and requires persistence.
20 Collier, Paul and Anke Hoeffler. 2002. Aid, Policy, and Growth in Post-conflict Societies. Policy Research Working
Paper 2902. Washington, DC: World Bank.
7
18. Yet the current and projected poverty and inequality trends call for urgent action
(quick wins) to provide short-term solutions to urgent needs of the Congolese people while
designing medium- and long-term policies to put the DRC on the path for high growth and
sustainable development. Moreover, pronounced gender disparities call for specific and quick
actions. The cost of doing nothing today or continuing a business-as-usual approach is high, and
may result in increasing poverty and inequality trends in a post-conflict country facing external
headwinds.
19. Gender disparities in the DRC are among the worst in the region, as measured by
various indexes (UNDP 2012 and 2016). Despite important gains in areas such as health and
education, and policies and laws that address gender equality, persistent sociocultural disparities
restrict women’s social status and exclude their participation in political and public decision-
making. The new family code (2016) removed several discriminatory provisions, such as needing
a husband’s permission to sign a contract, register land or company, or even work outside the
home, and increased the minimum age of marriage for girls from 15 to 18. Much more remains to
be done to ensure the new laws are enforced. Women’s participation in politics is limited and they
currently occupy about 8 percent of parliamentary seats in both the National Assembly and in the
Senate, compared with an average of 20.6 percent among low-income countries. Key constraints
include social and cultural norms, lack of education and economic resources, and power structures
perpetuating male dominance.
What are the areas chosen as emerging priorities and what is the right sequencing of policy
actions?
20. The report identifies five major emerging opportunities and priority areas where
policy actions could provide quick wins and build cumulative and virtuous cycles to sustain
inclusive growth and foster resilience and shared prosperity over the next decade: (1)
building the resilience of the macroeconomic framework; (2) building inclusive institutions and
strengthening governance; (3) leveraging natural resources, infrastructure, and agriculture; (4)
building human capital; and (5) leveraging the private sector by effectively implementing
investment climate reforms, and strengthening institutions that support markets.
21. The choice of areas as emerging priorities rests on their importance for restoring
peace and security, and on the dynamic interaction between these areas. As WDR 2011 states,
in a post-conflict country, it is an utmost priority for government to reestablish its credibility. In
the DRC, this involves finding quick wins to buy peace and restore hope to the Congolese poor.
In addition, the dynamic interaction between these priority areas will create cumulative and
virtuous cycles to sustain growth and foster resilience and prosperity over the next decade. Better
policies, governance, and institutions in natural resources and extractives would help in mobilizing
more revenues. This would provide both the fiscal and foreign exchange buffers needed for
macroeconomic stability. Better revenue mobilization would also provide sustainable funding for
mutually reinforcing infrastructure and social projects. Chapter 10 argues that promoting human
development through enhanced quality of education will provide needed skills for jobs, improve
labor productivity, and favor private sector-led growth. Meanwhile, investing in infrastructure will
help close the DRC’s infrastructure gap and lower unit costs to the benefit of private sector activity.
In addition, investment in infrastructure will favor human development in the DRC. For instance,
8
improved access to electricity and clean water will enhance living standards and improve health
indicators.
22. These priority areas are those where policy actions have borne fruit in countries that
have grown fast after the post-war period. Indeed, according to the World Bank Growth
Commission Report (2008), since 1950, 13 economies have grown at an average rate of 7 percent
a year or more for 25 years or longer. The commission argues that a close look at the 13 cases
reveals five striking points of resemblance: (i) they took full advantage of the global economy; (ii)
they maintained macroeconomic stability; (iii) they mustered high rates of savings and investment;
(iv) they built market institutions able to allocate resources efficiently; and (v) they had committed,
credible, and capable governments.21 All these striking points of resemblance are identified as
priority areas for policy interventions in the SCD.
23. Finally, these priority areas are consistent with the objectives the World Bank
Strategy for Africa. This strategy focuses on four objectives: (i) increase the effectiveness of the
state at the center and at decentralized levels and improve good governance while strengthening
the development impact of World Bank operations; (ii) boost the competitiveness of the economy
by accelerating private sector-led growth that will create jobs; (iii) improve social service delivery
to raise human development indicators; and (iv) address the development deficits contributing to
fragility and conflicts in the DRC's eastern provinces. Gender and climate change are treated as
cross-cutting issues and are addressed through the above four strategic objectives as relevant.
24. The SCD does not downplay the difficulty of moving simultaneously on many fronts.
It also acknowledges that some proposed policy actions may take time to bear fruit. The SCD thus
proposes to focus each area of intervention on policy actions that are quick wins, which could bear
fruit in the near future to buy peace and bring security to the Congolese poor, given the urgency
of the situation, and feasible to account for the country’s limited capacity, while building
institutions/systems in the medium- and long-term. The following describes the focus and
sequencing of policy actions to sustain growth, build resilience, and share prosperity in the DRC
over the next decades.
• Building the resilience of the macroeconomic framework. The SCD argues that
building the resilience of the macroeconomic framework is priority number one for the DRC
(Chapter 7) in order to preserve the socioeconomic gains achieved up to mid-2015, and restore
peace and security for the Congolese people. Enhancing fiscal policy through a rebalancing of
government spending toward social sectors and productive infrastructure, and creating fiscal space
through enhanced domestic revenue mobilization, are critical to finance the DRC’s development
goals and build a resilient macroeconomic framework favorable to the poor and conducive to
private sector-led growth. The government should also strengthen monetary policy to recover
permanent price stability, which primarily benefits the poor. Pursuing macroprudential and
countercyclical policies would reinforce the ailing banking and financial sector to the benefit of
the poor, who are currently excluded from the financial sector services. Restoring exchange rate
stability first, then gradually dedollarizing the economy are critical to strengthening
macroeconomic resilience. In the longer term, building resilience and sustaining high growth rates
21
The 13 countries are: Botswana, Brazil, China, Hong Kong (China), Indonesia, Japan, Republic of Korea, Malaysia,
Malta, Oman, Singapore, Taiwan (China), and Thailand.
9
to significantly reduce poverty and inequality will depend on the diversification of the economy,
and in particular that of exports. The high level of exports (35 percent), and the concentration of
exports by market (40 percent to China) and product (90 percent oil and mining) expose the
economy to the volatility of commodity prices, and to swings in the GDP of trading partners.
Hence, reducing these vulnerabilities requires both geographical and product diversification.
Diversification could be realized along the value chain in mining, agriculture, manufacturing,
services, and trade in general, provided the country improves its investment climate.
• Building inclusive institutions and strengthening governance. Improving the
government’s effectiveness is a critical condition for the DRC to lever its exceptional resource
endowment for long-term, sustainable growth and poverty reduction (Chapter 8). Three areas
where policy actions and donors’ interventions to improve governance and institutions would
strengthen the economic resilience and favor growth and poverty reduction are: (i) supporting
inclusive institutions and organizations, including cooperatives and non-government organizations
(NGOs); (ii) strengthening and empowering the population, especially the poorest and the
vulnerable, to promote transparency and accountability; and (iii) strengthening legal and
regulatory frameworks. The above areas of intervention are valid at the national and subnational
level, and the success of decentralization depends largely on the ability of the government and
donors to address them at the local level. To become effective, development interventions in the
DRC will have to factor in various political, social, cultural, and economic caveats.
• Leveraging natural resources, agriculture, and infrastructure. The SCD argues that
the DRC’s exceptional natural resources have the potential to generate better jobs and income.
Improving the governance of the natural resources sector is key for the DRC’s economic and social
development. Implementing the mining code (a quick action) would provide signal on the
willingness of the government to improve the governance of natural resources and create the
necessary conditions for big wins on various time horizons, including in terms of additional
domestic revenues from extractives. Together with improved infrastructure and agriculture, they
can be leveraged to build resilience and sustain inclusive growth (Chapter 9). Accelerating
governance reforms and investment in transport, power, water and sanitation, and information and
communication technology would ensure that infrastructure plays a key role in facilitating private-
sector development, and boosting inclusive and sustained growth.
• Building human capital. The SCD argues that building long-term resilience and
sustained economic growth requires the country to increase the stock and quality of human
capital (Chapter 10). It recommends that government policies focus on: (i) modernizing the
national identity system; (ii) establishing the preconditions for an eventual demographic dividend;
(iii) laying the foundation for future productivity through improved nutrition; (iv) improving the
quality of education for employability; (v) empowering women and providing them with the means
and opportunity to contribute to and benefit from the development of the country; (vi) increasing
access to good-quality health services to build human capital; (vii) building a safety net system to
consolidate the benefits of investments in human development and foster household resilience;
(viii) broadening the benefits of growth through measures to support youth employment; and (ix)
addressing the human impact of conflict.
• Leveraging the private sector by implementing investment climate reforms and
strengthening institutions that support markets (Chapter 11). Despite its huge potential and
10
vast natural resources, the DRC is struggling to attract long-term responsible private investment
in sectors where capital and expertise are mostly needed (agribusiness, infrastructure, and
manufacturing). Nurturing local entrepreneurship, and growing sustainable and thriving small and
medium-sized enterprises (SMEs) seem out-of-reach. Moving forward, the DRC would need: (i)
to reduce uncertainty over laws and regulations and strengthen the institutions tasked with
enforcing them; (ii) go beyond the simple introduction of formal policy reforms to ensure their
effective implementation, including outside major urban centers; (iii) build and strengthen
institutions that support markets and promote the formalization of businesses; and (iv) further
reduce risks for entrepreneurs, both physical, political, and macroeconomic. Strong market-
supporting institutions, including a well-regulated and inclusive financial sector, and reduced
uncertainty would reassure businesses to take a longer-term view and accept more risk in priority
sectors. Only then could the role of entrepreneurship, skills, and competitiveness prevail in
ensuring business success, as opposed to a reliance on networks (social, political, and other
connections) and/or bribery.
25. The SCD acknowledges that actions to reap a demographic dividend from the DRC’s
high population growth may enhance the prospects of the policy actions in these emerging
and priority areas to produce virtuous and dynamic growth cycles. The demographic dividend
refers to potential accelerated economic growth made possible by opportunities created by changes
in the age structure of a population. A first dividend may be captured as the demographic transition
speeds up, and the population age structure becomes more concentrated around the working age.
A population with a greater share of people at working age tends to deliver higher per capita
growth, if those people are employable and if there is strong labor demand. The second phase
occurs later if households are able to increase savings because there are fewer dependent children,
more disposable income, and better prospects for longer lives. It is possible for the DRC to reap
the full benefits of this demographic dividend, move the Congolese people out of the poverty trap,
build resilience, and put the country on a sustained growth and development path.
26. The following diagram summarizes the interactions at play as identified through the
SCD. The starting point for the DRC to move toward a sustainable development path would be
the improvement of domestic revenue mobilization in general and from extractives in particular.
This requires policy and administrative reforms in revenue mobilization and in extractive
industries. Revenues will be used to remove infrastructure bottlenecks, improve human capital
accumulation, and strengthen the public administration by providing the resources it needs to
operate. Improved physical infrastructure and human capital will boost the private sector and
enhance social indicators leading to shared prosperity, poverty reduction, and overall stability. A
dynamic and striving private sector will in turn engage in partnerships with the government and
will also be contributing more revenues to the budget. Improved human capital in social sectors
(health and education) will in turn help further enhancing of human capital and social indicators.
The overall outcome will depend on institutional frameworks and processes—hence the
importance of governance and institutional reforms, including at sector level (see Annex H)—and
on the strengths of positive spillovers between various sectors and indicators.
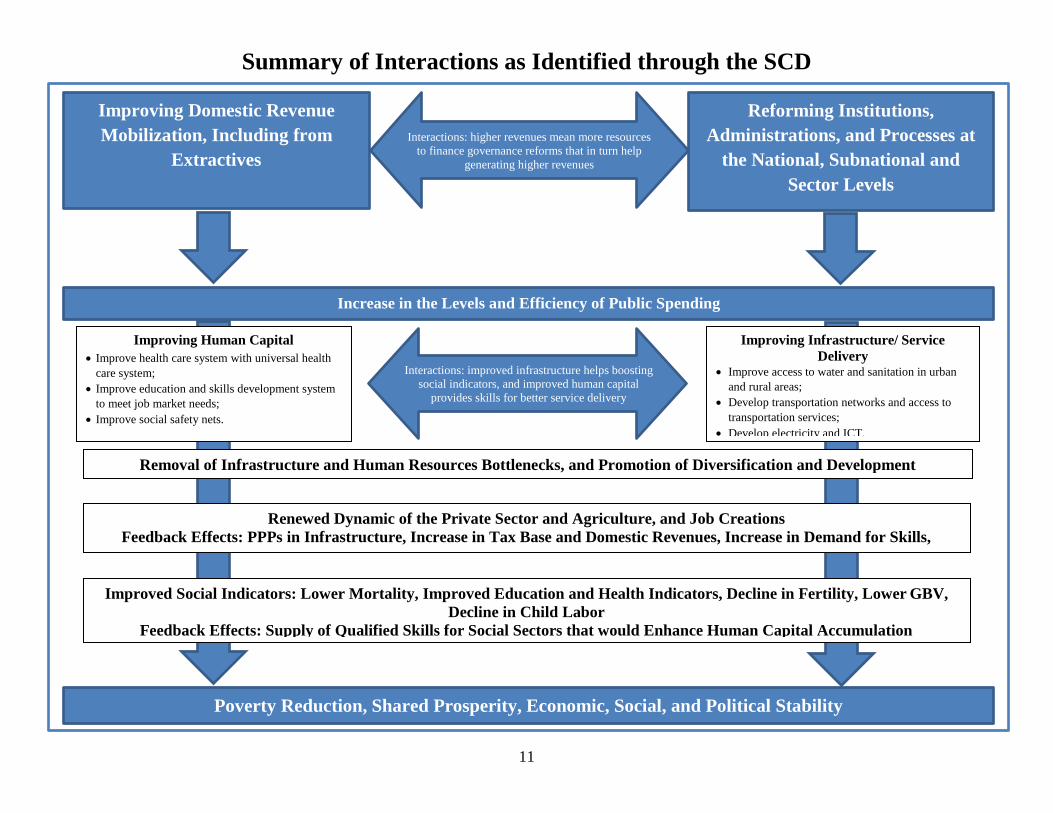
Summary of Interactions as Identified through the SCD
11
Improving Domestic Revenue
Mobilization, Including from
Extractives
Increase in the Levels and Efficiency of Public Spending
Improving Infrastructure/ Service
Delivery • Improve access to water and sanitation in urban
and rural areas;
• Develop transportation networks and access to
transportation services;
• Develop electricity and ICT.
Removal of Infrastructure and Human Resources Bottlenecks, and Promotion of Diversification and Development
Poverty Reduction, Shared Prosperity, Economic, Social, and Political Stability
Improving Human Capital
• Improve health care system with universal health
care system;
• Improve education and skills development system
to meet job market needs;
• Improve social safety nets.
Renewed Dynamic of the Private Sector and Agriculture, and Job Creations
Feedback Effects: PPPs in Infrastructure, Increase in Tax Base and Domestic Revenues, Increase in Demand for Skills,
Improved Social Indicators: Lower Mortality, Improved Education and Health Indicators, Decline in Fertility, Lower GBV,
Decline in Child Labor
Feedback Effects: Supply of Qualified Skills for Social Sectors that would Enhance Human Capital Accumulation
Reforming Institutions,
Administrations, and Processes at
the National, Subnational and
Sector Levels
Interactions: higher revenues mean more resources
to finance governance reforms that in turn help
generating higher revenues
Interactions: improved infrastructure helps boosting
social indicators, and improved human capital
provides skills for better service delivery
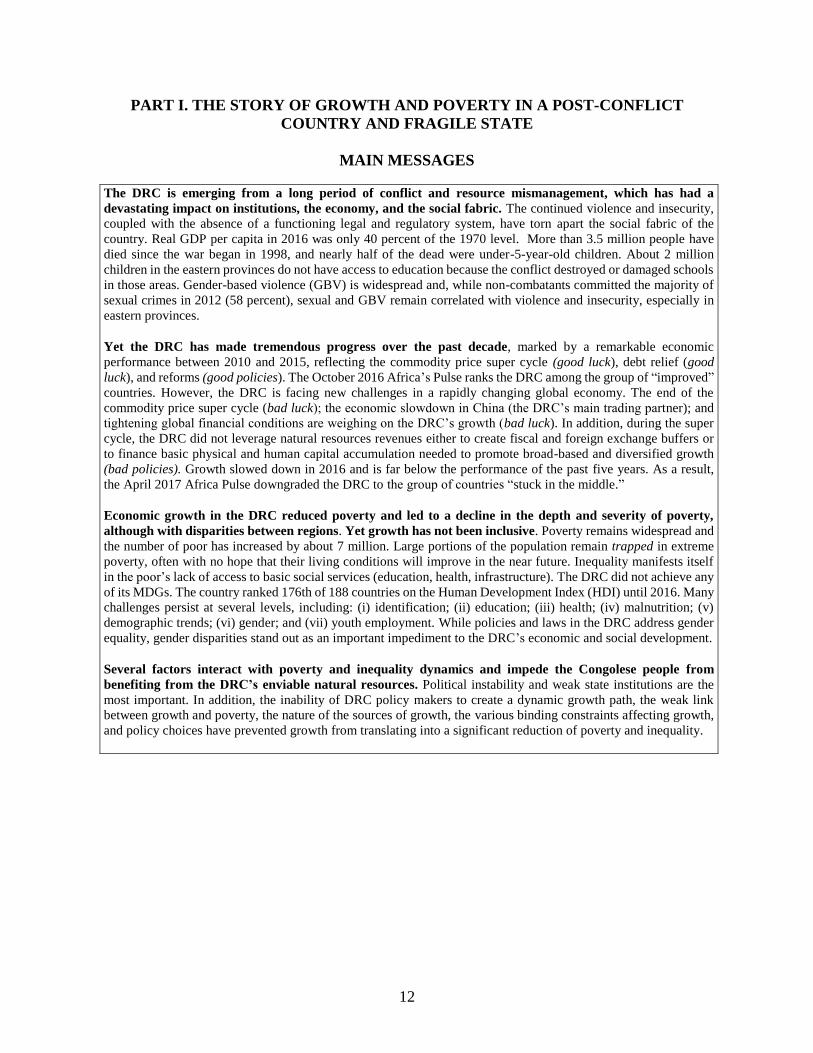
12
PART I. THE STORY OF GROWTH AND POVERTY IN A POST-CONFLICT
COUNTRY AND FRAGILE STATE
MAIN MESSAGES
The DRC is emerging from a long period of conflict and resource mismanagement, which has had a
devastating impact on institutions, the economy, and the social fabric. The continued violence and insecurity,
coupled with the absence of a functioning legal and regulatory system, have torn apart the social fabric of the
country. Real GDP per capita in 2016 was only 40 percent of the 1970 level. More than 3.5 million people have
died since the war began in 1998, and nearly half of the dead were under-5-year-old children. About 2 million
children in the eastern provinces do not have access to education because the conflict destroyed or damaged schools
in those areas. Gender-based violence (GBV) is widespread and, while non-combatants committed the majority of
sexual crimes in 2012 (58 percent), sexual and GBV remain correlated with violence and insecurity, especially in
eastern provinces.
Yet the DRC has made tremendous progress over the past decade, marked by a remarkable economic
performance between 2010 and 2015, reflecting the commodity price super cycle (good luck), debt relief (good
luck), and reforms (good policies). The October 2016 Africa’s Pulse ranks the DRC among the group of “improved”
countries. However, the DRC is facing new challenges in a rapidly changing global economy. The end of the
commodity price super cycle (bad luck); the economic slowdown in China (the DRC’s main trading partner); and
tightening global financial conditions are weighing on the DRC’s growth (bad luck). In addition, during the super
cycle, the DRC did not leverage natural resources revenues either to create fiscal and foreign exchange buffers or
to finance basic physical and human capital accumulation needed to promote broad-based and diversified growth
(bad policies). Growth slowed down in 2016 and is far below the performance of the past five years. As a result,
the April 2017 Africa Pulse downgraded the DRC to the group of countries “stuck in the middle.”
Economic growth in the DRC reduced poverty and led to a decline in the depth and severity of poverty,
although with disparities between regions. Yet growth has not been inclusive. Poverty remains widespread and
the number of poor has increased by about 7 million. Large portions of the population remain trapped in extreme
poverty, often with no hope that their living conditions will improve in the near future. Inequality manifests itself
in the poor’s lack of access to basic social services (education, health, infrastructure). The DRC did not achieve any
of its MDGs. The country ranked 176th of 188 countries on the Human Development Index (HDI) until 2016. Many
challenges persist at several levels, including: (i) identification; (ii) education; (iii) health; (iv) malnutrition; (v)
demographic trends; (vi) gender; and (vii) youth employment. While policies and laws in the DRC address gender
equality, gender disparities stand out as an important impediment to the DRC’s economic and social development.
Several factors interact with poverty and inequality dynamics and impede the Congolese people from
benefiting from the DRC’s enviable natural resources. Political instability and weak state institutions are the
most important. In addition, the inability of DRC policy makers to create a dynamic growth path, the weak link
between growth and poverty, the nature of the sources of growth, the various binding constraints affecting growth,
and policy choices have prevented growth from translating into a significant reduction of poverty and inequality.
13
Chapter 1. Progress amid Vulnerabilities, Risks, and Uncertainties
27. The DRC is emerging from a long period of conflict and mismanagement, which has
had a devastating impact on institutions, the economy, and the social fabric. To understand
the country’s economic achievements and the implications for development prospects, this chapter
considers three dimensions of development: (1) the historical perspective, focused on the legacy
of decades of economic mismanagement and persistent fragility and conflict; (2) the
socioeconomic progress until 2015; (3) the enormous challenges remaining and the many risks and
uncertainties ahead.
28. The country is fragile and vulnerable to shocks, which affects the investment climate
and the competitiveness of the economy. While the GDP steadily increased starting in 2010, the
country’s Fragile States Index (FSI) score has not significantly improved. According to the 2017
FSI, the DRC is a very fragile state if the social, economic, political, and security pressures that
contribute to the risk of fragility are taken into account.22 The DRC was ranked the seventh most
fragile among 178 countries and labeled a high alert state. Similarly, the country remains
vulnerable to structural and exogenous shocks.
1.1. Historical Perspective and Current Political and Security Context, 1960–2016
29. The DRC has a turbulent colonial and postcolonial history, marked by secessions,
authoritarianism, and plunder. Immediately after the country gained its independence on June
30, 1960, the provinces of diamond-rich Kasaï and copper-rich Katanga attempted to break away.
The first elected government of Patrice Lumumba was in power for less than three months. United
Nations (UN) and Congolese government forces succeeded in recapturing the breakaway
provinces of Kasaï (in December 1961) and Katanga (in January 1963). In 1965, Colonel Joseph
Mobutu (Mobutu Sese Seko) seized control of the country and declared himself president for five
years. Mobutu quickly consolidated power and was elected unopposed as president in 1970. He
introduced a 10-year development plan, launched in association with a proclamation of
transforming the DRC into an industrial country. Three years later, Mobuto initiated the
Zaïrianization policy, and nationalized foreign-owned enterprises. The policy of Radicalization
succeeded to Zaïrianization and resulted in a concentration of the country’s resources into the
hands of Mobutu and his associates. These policies had disastrous effects on the economy through
poor agricultural production, hyperinflation, unemployment, and shortages in basic goods.23
30. At the beginning of the 1990s, the country engaged in a major war with devastating
humanitarian consequences. Persistent looting in Kinshasa by the army in 1991 and 1993, and
Mobutu’s inability to halt the collapse in public services weakened the government, damaged
private investments, and destroyed the little production capacity that existed in the country. Social
and political tensions in neighboring countries spilled over to the DRC. In 1997, Laurent-Désiré
Kabila overthrew Mobutu and became the new president. Kabila changed the name of the country
from Zaïre to the DRC. A war followed the coup, often called the First African World War, and
led to the deaths of millions. After the assassination of Laurent-Désiré Kabila in 2001, his son,
Joseph Kabila Kabange, took over as head of state. The signing of the Global and Inclusive Peace
22 FSI 2017 (Fragile States Index 2017 database), Fund for Peace, Washington, DC, http://fundforpeace.org/fsi/data/ 23 See Meditz and Merril (1994).
14
Agreement in 2002 restored peace. In 2006, Joseph Kabila Kabange became president after
winning the first democratic, multiparty elections.
31. The continued violence and insecurity, coupled with the absence of a functioning legal
and regulatory system, have torn apart the social fabric of the country. More than 3.5 million
people have died in the war that began in 1998, and nearly half of the dead were children under 5
years of age. About 2 million children in the eastern provinces do not have access to education
because the conflict destroyed or damaged schools in those areas. GBV is widespread and, while
noncombatants committed the majority of sexual crimes in 2012 (58 percent), sexual and gender-
based violence remain correlated with violence and insecurity, especially in eastern provinces.
Overall access to key social and economic services is limited. The population is particularly
vulnerable to disease because of inadequate sanitation services and lack of access to health
services. The lack of adequate transport infrastructure is among the main bottlenecks to growth
and development.
32. The conflict in the east continues to generate high levels of displacement and
humanitarian need. There are over 1.9 million internally displaced persons (IDPs) mainly
because of violent attacks and armed conflict. The DRC is also host to no less than a half million
refugees, originating mainly from neighboring countries. The UN estimates that 7.3 million people
will need humanitarian assistance in the DRC in 2017. Basic services (the lack of which increases
mortality) and protection constitute the main needs. Countries in the Great Lakes region have
relatively robust policy and legal frameworks in place to protect displaced persons. However,
realities on the ground define their situation more than the existence of protective legal
frameworks.
33. IDPs, both in the DRC and from the DRC, remain highly dependent on humanitarian
assistance. The development challenges for displaced persons include: (i) representation and
governance, since civil society is underdeveloped and few formal structures exist to communicate
and consult with local and national authorities; (ii) access to social services, with low access to
education; and (iii) significant risk of gender‐based violence and disruption to gender roles.
Vulnerable subgroups among IDPs, including female‐headed households, the elderly, those with
psychological challenges, and the disabled24 face these challenges even more acutely.
34. Addressing the instability in the east will require a regional solution that involves all
the countries of the Great Lakes region, especially Burundi, Rwanda, and Uganda. Since
2004, several waves of armed groups have been integrated into the DRC’s national army.
However, several groups, including the Mai-Mai, have managed to keep some of their combatants
and continue to harass civilians and fight one another or the army, often for control of mineral
resources. The prevailing mistrust in the region means security is fragile. The signing of the Peace,
Security and Cooperation Framework for the DRC by the 11 countries in the region on February
24, 2013,25 brought hope to the Congolese people and to the region that the end of a protracted
period of conflict and insecurity might be in sight.
24 Forced Displacement in the Great Lakes Region. World Bank. Washington, DC: World Bank. 25 A UN Security Council resolution adopted on March 28, 2013, has established a 2,500-strong intervention force
under MONUSCO with a mandate to disarm the armed groups and address their threats.
15
35. As of the end of 2016, serious pockets of insecurity persisted and violence developed
in the former Kasais provinces, highlighting the need for continuous regional and
international commitments for peace. Violence in the eastern provinces is widespread, with
many armed groups active in the Kivus, Ituri, the Ueles, Tanganyika, and North Kivu provinces.
Violence developed quickly in the former Kasais, throwing tens of thousands of displaced on the
roads within and outside the borders of the DRC. The government emphasized a military response
rather than dialogue, which has worsened the humanitarian situation. The militarization of the
countryside has led to displacement, worsening tensions, and human rights violations by all sides.
The influx of refugees from Burundi since May 2015 has added to the tensions. The United Nations
Organization Stabilization Mission in the DRC (Mission de l'Organisation des Nations unies pour
la stabilisation en République démocratique du Congo, MONUSCO) remains in place. The World
Bank is working closely with both MONUSCO and the government to support the implementation
of the Disarmament, Demobilization, and Reintegration III Strategy. However, as long as core
grievances, often related to land and identity, are not addressed, the region will remain vulnerable
to conflict. More effort may also be needed to pair dialogue with military operations, enhance
coordination with MONUSCO, and make progress in security sector reform.
36. The dynamics of conflict and instability in the Great Lakes Region are
multidimensional and historically deep-rooted. The 2013 WBG report on the Great Lakes
initiative 26 has identified the root causes of conflict in the Great Lakes region in general and in the
DRC in particular. The report argues that the dynamics of conflict and instability are driven by a
complex mix of political, security, social, and economic factors at both the national level,
especially in the DRC, and at the regional level. The report further argues that in the DRC conflict
is driven by the weakness of the state and its inability to provide security and basic state services,
long-standing ethnic tensions exacerbated by lack of clarity and insecurity over land ownership,
the continued presence of both foreign and Congolese armed groups and their involvement in illicit
mining activities, and severe socioeconomic vulnerability of the local population. Annex A
provides a detailed analysis of the root causes of conflict in the Great Lakes region and the DRC.
37. The DRC is still a post-conflict and fragile country, and building resilience is a
challenge in such an environment. As discussed in the WDR 2011, post-conflict countries face
three fundamental challenges: (1) launching initial agreements on change is difficult because elites
do not trust each other and few people trust the state; (2) maintaining agreements is difficult since
institutional change can increase the risks of violence in the short term because of political
backlash from the groups that lost power or economic benefits; and (3) during fragile periods of
institutional transformation, fragile countries may face external security threats or economic
shocks that can overshadow progress.
38. The cost of conflict is immense and affects the economic activity of firms and
households, and building resilience takes time and requires persistence. A major episode of
violence, unlike natural disasters or economic cycles, can wipe out an entire generation of
economic progress. According to the WDR 2011, on average, a country that experienced major
violence between 1981 and 2005 has a poverty rate 21 percentage points higher than a country that
saw no violence. The cost of civil war is estimated at about 30 years of GDP growth for a medium-
26 Reviving the Great Lakes. A World Bank Group Regional Initiative for Peace, Stability, and Economic
Development. World Bank Africa Region, March 2013.
16
income developing country. Trade levels after major episodes of violence take 20 years to recover.
In addition, firms in Sub-Saharan Africa lose a higher percentage of their sales to crime and spend
a higher percentage their sales proceeds on security than any other region. Finally, experience
shows it takes 27 years to get corruption under control, even among the most rapidly recovering
countries. In sum, there is no easy path to achieving resilience in the DRC. According to the WDR
2011, “for every three years a country is affected by major violence (battle deaths or excess deaths
from homicides equivalent to a major war), poverty reduction lags behind by 2.7 percentage
points.”
39. The 2006 constitution defined the DRC as a unitary but decentralized state, but the
decentralization agenda remains unfinished. The 11 (former) provincial capitals are located an
average of 1,700 kilometers from Kinshasa; the closest provincial capital, Matadi, is located 346
kilometers away. The decentralization framework envisaged the transfer of responsibility for
health care, primary and secondary education, and agriculture to the provinces. In return, provinces
were entitled to 40 percent of the fiscal revenues collected by national authorities. The number of
provinces increased from 11 to 26. The boundaries of Kinshasa and four other provinces would
not change. Provinces have limited capacity to carry out their responsibilities. Despite the recent
increases, provincial revenues have consistently been below the constitutionally mandated share
of 40 percent. This has raised tensions between national and provincial authorities. Indeed, the
weak institutional capacity and limited accountability of provincial authorities have impeded the
delivery of basic services and diminished the expected benefits of decentralization.
1.2. Recent Economic Developments, 2010–17
40. Sound policies supported the remarkable economic performance of the DRC between
2010 and 2015. Real GDP growth accelerated at an annual average rate of 7.5 percent over 2010–
15, and outperformed the Sub-Saharan African average by 3 percentage points. The October 2016
Africa’s Pulse ranks the DRC among the group of “improved” countries. This group is
characterized by those countries with a growth rate below the top tercile of Sub-Saharan African
distribution in 1995–2008, but with a rate of GDP growth in 2014–15 greater than the top tercile.
It comprises eight countries: Benin, Cameroon, Côte d’Ivoire, the DRC, Kenya, Namibia, Senegal,
and Togo. The group of improved performers saw their GDP growth rate increase from 3.2 percent
in 1995–2008 to 6.5 percent in 2014–15. The largest growth acceleration among the improved
performers was experienced by Côte d’Ivoire and the DRC (with an increase in the rate of GDP
growth that exceeded 600 basis points between the two periods).27
27 The other three groups include: (i) Established. This group of countries registered an annual average growth rate
that exceeds the top tercile in both periods (1995–2008 and 2014–15). The established growth performers comprise
five countries: Ethiopia, Mali, Mozambique, Rwanda, and Tanzania; (ii) Slipping. This is a group of economies with
a decelerating GDP growth rate; their average annual growth rate in 1995–2008 exceeded the bottom tercile of Sub-
Saharan Africa’s growth distribution, but the GDP growth rate in 2014–15 fell below the bottom tercile. The slipping
group comprises nine countries: Botswana, Cabo Verde, Equatorial Guinea, The Gambia, Liberia, Madagascar, Sierra
Leone, South Africa, and Sudan; and (iii) Falling behind. This group of economies displayed the weakest growth
trajectory throughout 1995–2008 and 2014–15; their GDP growth failed to surpass the bottom tercile in both periods.
The falling behind group comprises mostly fragile states as well as small (mainland and island) countries: Burundi,
the Central African Republic, the Comoros, Guinea, the Seychelles, Swaziland, and Zimbabwe.
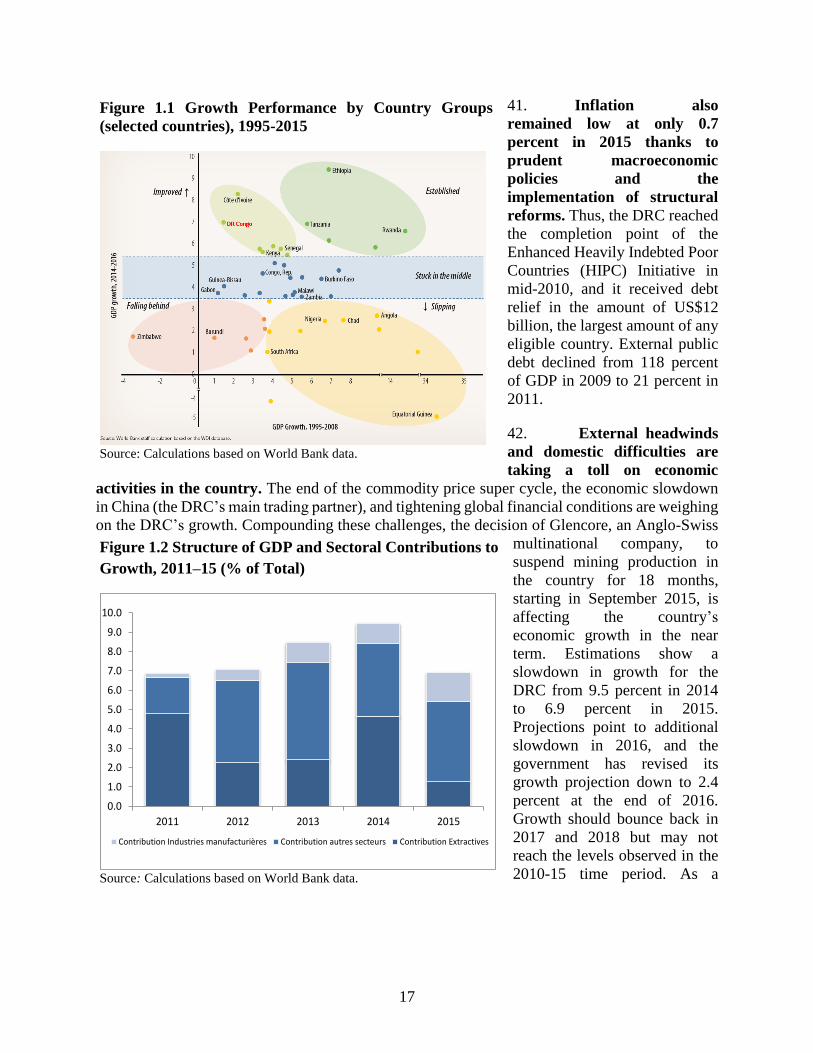
17
41. Inflation also
remained low at only 0.7
percent in 2015 thanks to
prudent macroeconomic
policies and the
implementation of structural
reforms. Thus, the DRC reached
the completion point of the
Enhanced Heavily Indebted Poor
Countries (HIPC) Initiative in
mid-2010, and it received debt
relief in the amount of US$12
billion, the largest amount of any
eligible country. External public
debt declined from 118 percent
of GDP in 2009 to 21 percent in
2011.
42. External headwinds
and domestic difficulties are
taking a toll on economic
activities in the country. The end of the commodity price super cycle, the economic slowdown
in China (the DRC’s main trading partner), and tightening global financial conditions are weighing
on the DRC’s growth. Compounding these challenges, the decision of Glencore, an Anglo-Swiss
multinational company, to
suspend mining production in
the country for 18 months,
starting in September 2015, is
affecting the country’s
economic growth in the near
term. Estimations show a
slowdown in growth for the
DRC from 9.5 percent in 2014
to 6.9 percent in 2015.
Projections point to additional
slowdown in 2016, and the
government has revised its
growth projection down to 2.4
percent at the end of 2016.
Growth should bounce back in
2017 and 2018 but may not
reach the levels observed in the
2010-15 time period. As a
Figure 1.1 Growth Performance by Country Groups
(selected countries), 1995-2015
Source: Calculations based on World Bank data.
Figure 1.2 Structure of GDP and Sectoral Contributions to
Growth, 2011–15 (% of Total)
Source: Calculations based on World Bank data.
0.0
1.0
2.0
3.0
4.0
5.0
6.0
7.0
8.0
9.0
10.0
2011 2012 2013 2014 2015
Contribution Industries manufacturières Contribution autres secteurs Contribution Extractives
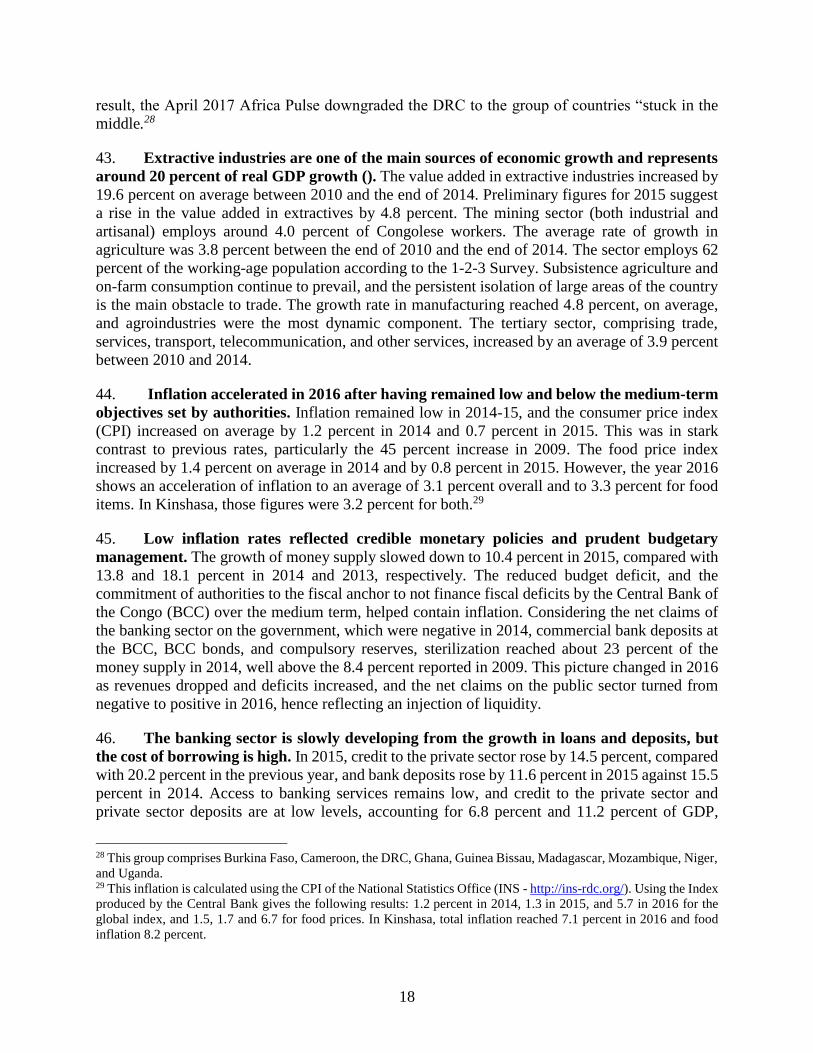
18
result, the April 2017 Africa Pulse downgraded the DRC to the group of countries “stuck in the
middle.28
43. Extractive industries are one of the main sources of economic growth and represents
around 20 percent of real GDP growth (). The value added in extractive industries increased by
19.6 percent on average between 2010 and the end of 2014. Preliminary figures for 2015 suggest
a rise in the value added in extractives by 4.8 percent. The mining sector (both industrial and
artisanal) employs around 4.0 percent of Congolese workers. The average rate of growth in
agriculture was 3.8 percent between the end of 2010 and the end of 2014. The sector employs 62
percent of the working-age population according to the 1-2-3 Survey. Subsistence agriculture and
on-farm consumption continue to prevail, and the persistent isolation of large areas of the country
is the main obstacle to trade. The growth rate in manufacturing reached 4.8 percent, on average,
and agroindustries were the most dynamic component. The tertiary sector, comprising trade,
services, transport, telecommunication, and other services, increased by an average of 3.9 percent
between 2010 and 2014.
44. Inflation accelerated in 2016 after having remained low and below the medium-term
objectives set by authorities. Inflation remained low in 2014-15, and the consumer price index
(CPI) increased on average by 1.2 percent in 2014 and 0.7 percent in 2015. This was in stark
contrast to previous rates, particularly the 45 percent increase in 2009. The food price index
increased by 1.4 percent on average in 2014 and by 0.8 percent in 2015. However, the year 2016
shows an acceleration of inflation to an average of 3.1 percent overall and to 3.3 percent for food
items. In Kinshasa, those figures were 3.2 percent for both.29
45. Low inflation rates reflected credible monetary policies and prudent budgetary
management. The growth of money supply slowed down to 10.4 percent in 2015, compared with
13.8 and 18.1 percent in 2014 and 2013, respectively. The reduced budget deficit, and the
commitment of authorities to the fiscal anchor to not finance fiscal deficits by the Central Bank of
the Congo (BCC) over the medium term, helped contain inflation. Considering the net claims of
the banking sector on the government, which were negative in 2014, commercial bank deposits at
the BCC, BCC bonds, and compulsory reserves, sterilization reached about 23 percent of the
money supply in 2014, well above the 8.4 percent reported in 2009. This picture changed in 2016
as revenues dropped and deficits increased, and the net claims on the public sector turned from
negative to positive in 2016, hence reflecting an injection of liquidity.
46. The banking sector is slowly developing from the growth in loans and deposits, but
the cost of borrowing is high. In 2015, credit to the private sector rose by 14.5 percent, compared
with 20.2 percent in the previous year, and bank deposits rose by 11.6 percent in 2015 against 15.5
percent in 2014. Access to banking services remains low, and credit to the private sector and
private sector deposits are at low levels, accounting for 6.8 percent and 11.2 percent of GDP,
28 This group comprises Burkina Faso, Cameroon, the DRC, Ghana, Guinea Bissau, Madagascar, Mozambique, Niger,
and Uganda. 29 This inflation is calculated using the CPI of the National Statistics Office (INS - http://ins-rdc.org/). Using the Index
produced by the Central Bank gives the following results: 1.2 percent in 2014, 1.3 in 2015, and 5.7 in 2016 for the
global index, and 1.5, 1.7 and 6.7 for food prices. In Kinshasa, total inflation reached 7.1 percent in 2016 and food
inflation 8.2 percent.
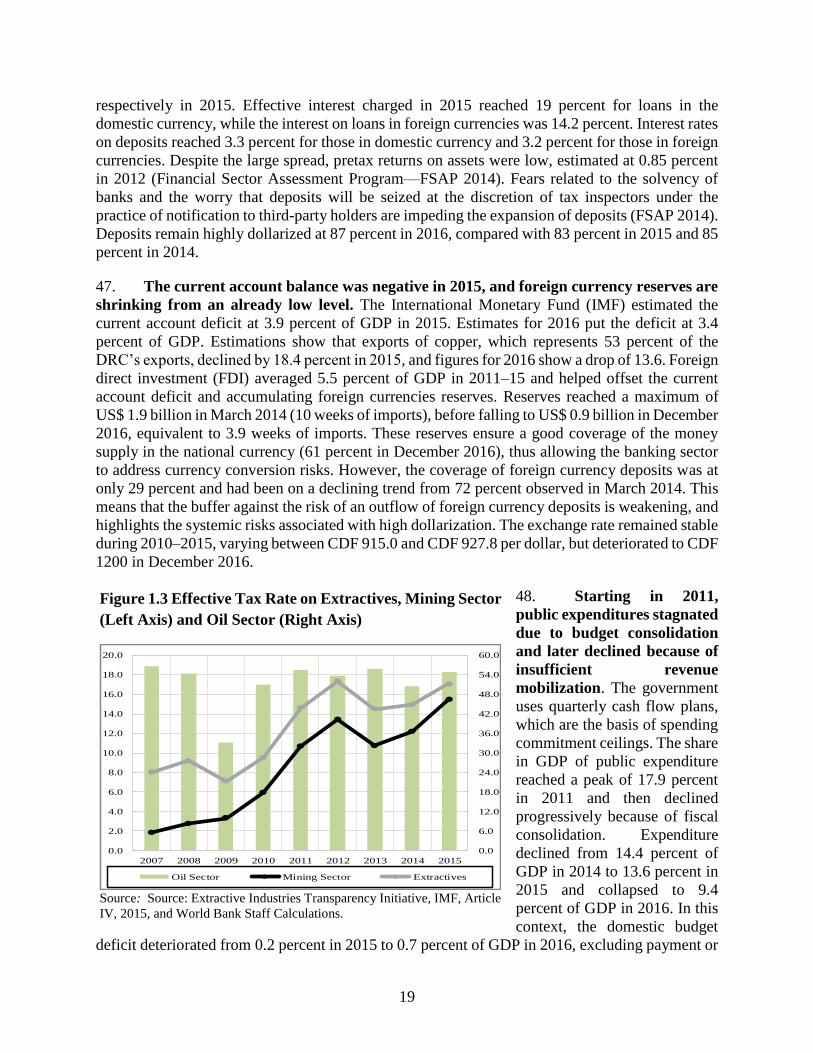
19
respectively in 2015. Effective interest charged in 2015 reached 19 percent for loans in the
domestic currency, while the interest on loans in foreign currencies was 14.2 percent. Interest rates
on deposits reached 3.3 percent for those in domestic currency and 3.2 percent for those in foreign
currencies. Despite the large spread, pretax returns on assets were low, estimated at 0.85 percent
in 2012 (Financial Sector Assessment Program—FSAP 2014). Fears related to the solvency of
banks and the worry that deposits will be seized at the discretion of tax inspectors under the
practice of notification to third-party holders are impeding the expansion of deposits (FSAP 2014).
Deposits remain highly dollarized at 87 percent in 2016, compared with 83 percent in 2015 and 85
percent in 2014.
47. The current account balance was negative in 2015, and foreign currency reserves are
shrinking from an already low level. The International Monetary Fund (IMF) estimated the
current account deficit at 3.9 percent of GDP in 2015. Estimates for 2016 put the deficit at 3.4
percent of GDP. Estimations show that exports of copper, which represents 53 percent of the
DRC’s exports, declined by 18.4 percent in 2015, and figures for 2016 show a drop of 13.6. Foreign
direct investment (FDI) averaged 5.5 percent of GDP in 2011–15 and helped offset the current
account deficit and accumulating foreign currencies reserves. Reserves reached a maximum of
US$ 1.9 billion in March 2014 (10 weeks of imports), before falling to US$ 0.9 billion in December
2016, equivalent to 3.9 weeks of imports. These reserves ensure a good coverage of the money
supply in the national currency (61 percent in December 2016), thus allowing the banking sector
to address currency conversion risks. However, the coverage of foreign currency deposits was at
only 29 percent and had been on a declining trend from 72 percent observed in March 2014. This
means that the buffer against the risk of an outflow of foreign currency deposits is weakening, and
highlights the systemic risks associated with high dollarization. The exchange rate remained stable
during 2010–2015, varying between CDF 915.0 and CDF 927.8 per dollar, but deteriorated to CDF
1200 in December 2016.
48. Starting in 2011,
public expenditures stagnated
due to budget consolidation
and later declined because of
insufficient revenue
mobilization. The government
uses quarterly cash flow plans,
which are the basis of spending
commitment ceilings. The share
in GDP of public expenditure
reached a peak of 17.9 percent
in 2011 and then declined
progressively because of fiscal
consolidation. Expenditure
declined from 14.4 percent of
GDP in 2014 to 13.6 percent in
2015 and collapsed to 9.4
percent of GDP in 2016. In this
context, the domestic budget
deficit deteriorated from 0.2 percent in 2015 to 0.7 percent of GDP in 2016, excluding payment or
Figure 1.3 Effective Tax Rate on Extractives, Mining Sector
(Left Axis) and Oil Sector (Right Axis)
Source: Source: Extractive Industries Transparency Initiative, IMF, Article
IV, 2015, and World Bank Staff Calculations.
0.0
6.0
12.0
18.0
24.0
30.0
36.0
42.0
48.0
54.0
60.0
0.0
2.0
4.0
6.0
8.0
10.0
12.0
14.0
16.0
18.0
20.0
2007 2008 2009 2010 2011 2012 2013 2014 2015
Oil Sector Mining Sector Extractives
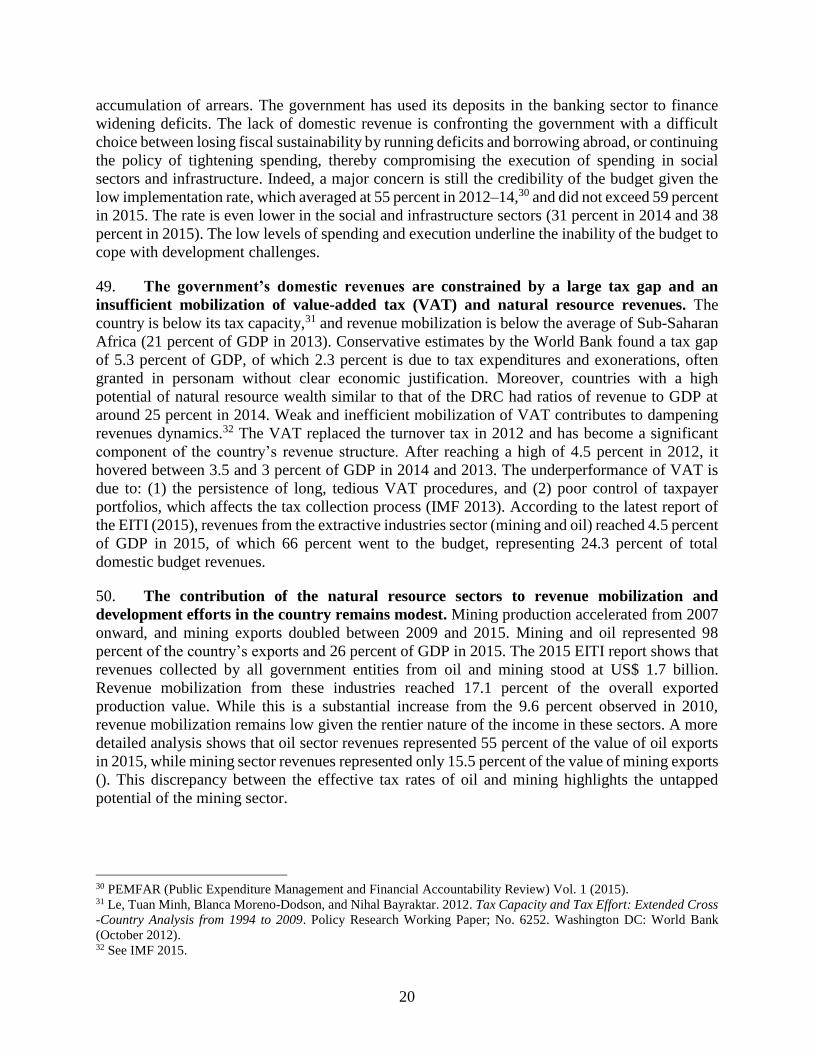
20
accumulation of arrears. The government has used its deposits in the banking sector to finance
widening deficits. The lack of domestic revenue is confronting the government with a difficult
choice between losing fiscal sustainability by running deficits and borrowing abroad, or continuing
the policy of tightening spending, thereby compromising the execution of spending in social
sectors and infrastructure. Indeed, a major concern is still the credibility of the budget given the
low implementation rate, which averaged at 55 percent in 2012–14,30 and did not exceed 59 percent
in 2015. The rate is even lower in the social and infrastructure sectors (31 percent in 2014 and 38
percent in 2015). The low levels of spending and execution underline the inability of the budget to
cope with development challenges.
49. The government’s domestic revenues are constrained by a large tax gap and an
insufficient mobilization of value-added tax (VAT) and natural resource revenues. The
country is below its tax capacity,31 and revenue mobilization is below the average of Sub-Saharan
Africa (21 percent of GDP in 2013). Conservative estimates by the World Bank found a tax gap
of 5.3 percent of GDP, of which 2.3 percent is due to tax expenditures and exonerations, often
granted in personam without clear economic justification. Moreover, countries with a high
potential of natural resource wealth similar to that of the DRC had ratios of revenue to GDP at
around 25 percent in 2014. Weak and inefficient mobilization of VAT contributes to dampening
revenues dynamics.32 The VAT replaced the turnover tax in 2012 and has become a significant
component of the country’s revenue structure. After reaching a high of 4.5 percent in 2012, it
hovered between 3.5 and 3 percent of GDP in 2014 and 2013. The underperformance of VAT is
due to: (1) the persistence of long, tedious VAT procedures, and (2) poor control of taxpayer
portfolios, which affects the tax collection process (IMF 2013). According to the latest report of
the EITI (2015), revenues from the extractive industries sector (mining and oil) reached 4.5 percent
of GDP in 2015, of which 66 percent went to the budget, representing 24.3 percent of total
domestic budget revenues.
50. The contribution of the natural resource sectors to revenue mobilization and
development efforts in the country remains modest. Mining production accelerated from 2007
onward, and mining exports doubled between 2009 and 2015. Mining and oil represented 98
percent of the country’s exports and 26 percent of GDP in 2015. The 2015 EITI report shows that
revenues collected by all government entities from oil and mining stood at US$ 1.7 billion.
Revenue mobilization from these industries reached 17.1 percent of the overall exported
production value. While this is a substantial increase from the 9.6 percent observed in 2010,
revenue mobilization remains low given the rentier nature of the income in these sectors. A more
detailed analysis shows that oil sector revenues represented 55 percent of the value of oil exports
in 2015, while mining sector revenues represented only 15.5 percent of the value of mining exports
(). This discrepancy between the effective tax rates of oil and mining highlights the untapped
potential of the mining sector.
30 PEMFAR (Public Expenditure Management and Financial Accountability Review) Vol. 1 (2015). 31 Le, Tuan Minh, Blanca Moreno-Dodson, and Nihal Bayraktar. 2012. Tax Capacity and Tax Effort: Extended Cross
-Country Analysis from 1994 to 2009. Policy Research Working Paper; No. 6252. Washington DC: World Bank
(October 2012). 32 See IMF 2015.
21
1.3. Facing New Challenges and Risks in a Rapidly Changing Global Economy
51. The decline in commodity prices raises serious questions about the DRC’s economic
prospects. After a decade of steadily rising prices, the international market for major commodities
has entered into a new cycle of falling prices, exacerbated by the slowdown in growth and
rebalancing in China. Commodity prices have been persistently low since January 2014, mostly
because of robust supply and lower demand. The prices of crude oil dropped by 46 percent on
average between 2014 and 2015, following demand shocks (such as the Chinese growth
slowdown) and a glut in oil production. The price retreated by 16 percent in 2016. Meanwhile, the
international price of agricultural goods, metals, and minerals declined steadily. The price of
copper, the country’s major export commodity, has followed the same trend, falling by 19.7
percent in 2015 and by 12 percent on average in 2016.
52. The macroeconomic imbalances and vulnerabilities in the economy are likely to
worsen. Lower and volatile prices may persist33 given the shocks underlying the plunge in
commodity prices. The decision by Glencore to suspend production for 18 months starting at the
end of August 2015 in the DRC and Zambia has worsened the impact of the downturn in the
commodity price super cycle.34 The World Bank estimates that the impact of Glencore’s decision
may have included forgone exports of US$ 1.2 billion in 2016. This is a balance of payments shock
of 3.1 percent of GDP and may have cost from US$ 500 million to US$ 700 million in reserves.35
53. The slowdown in China’s growth has taken a toll on the DRC’s economy. China has
been the main export market for the DRC in the last decade, replacing the European Union. China
alone accounted for 41 percent of the country’s exports in 2013. The DRC’s exports to China grew
at an average annual rate of over 102.9 percent between 2000 and 2013. The slowdown in China
affected the global demand for minerals, which in turn affected the DRC economy.36 The estimated
GDP growth for the DRC was 6.9 percent in 2015, 2.6 percentage points below the 2014 level of
9.5 percent. The country’s reserves declined by US$ 100 million in 2014, US$ 240 million in 2015,
and US$ 560 million in 2016. The fiscal implication of the Chinese slowdown and of the decision
by Glencore is estimated at US$ 720 million in forgone revenues in 2016, or 0.9 percent of GDP,
which is more or less the estimation of the deficit by the IMF.
54. Protracted political tensions combined with a sluggish global economic outlook
dampen the DRC’s medium-term economic outlook. Growth may have been lower than 2.5
percent in 2016 due to the fall in demand for commodities, decline in public investment, and
general slowdown in economic activity. Projections for 2017–18 are more optimistic and put
33 See World Bank, Africa’s Pulse, October 2015, vol. 12, p. 4. 34 KCC, the Glencore subsidiary in the DRC, produced 17 percent of the country’s copper and 5 percent of cobalt in
the first half of 2015. According to the IMF (2015), the two minerals accounted for 78 percent of the DRC’s exports
in 2014. 35 KCC contributed 19 percent to mining revenues in 2014 and 3 percent of total domestic revenues for the Treasury,
equivalent to 0.4 percent of GDP. The government was expecting increases in mining revenues in 2015 and 2016,
including from KCC. The accelerated depreciation period from which mining investments benefited thanks to the
mining code ended for some of them in 2015–16, including for Glencore. Hence, revenues were expected to increase
by 0.4 percent of GDP each year in 2015 and 2016. 36 Simulations show that a 1 percent slowdown in China would generate a 0.3 percent decline in the DRC’s GDP, a
similar deterioration in the current account deficit, and a drop of US$107 million in reserves (Bou-Habib and Kebede
2016).
22
economic growth at 3 percent on average, which is above the level expected in 2016 but
substantially lower than the average observed in 2010–15. Growth in 2017–18 would benefit from
a gradual recovery in extractives as a response to the slow recovery in the demand for commodities,
and from an expansion in agriculture and services. However, protracted political tensions may
dampen prospects for recovery, and maintain growth at the level estimated for 2016.
55. Investments in infrastructure and human capital are required to unlock the DRC’s
longer-term growth potential. Product and market diversification of DRC exports and favoring
various scales of mining production would promote long-term development objectives and
increase the country’s resilience. Diversifying the economy will require removing infrastructure
bottlenecks and enhancing human capital. Such investments are difficult to sustain without an
enhancement in domestic revenue mobilization that could help the government to both increase
public spending and build institutions to monitor it. Mobilizing and using revenues from the donor
community and the natural resources sector are also key to reducing macroeconomic
vulnerabilities and improving decentralization. This domestic revenue mobilization is unlikely to
happen unless the country adopts and enforces credible legal, administrative, and institutional
frameworks.
56. The immediate risk to the economy is the continuous decline in revenues from
extractives and its impact on macroeconomic stability. The decline in foreign currency reserves
may lead to a shortage in foreign currencies that will make the import of basic goods a challenge.
This could translate into price increases that are detrimental to the poor. In addition, declining
reserves would lead to further deteriorations in the exchange rate, reinforcing inflationary
pressures. At the end of 2016, the exchange rate depreciated by 24 percent and 26 percent on the
official and parallel markets, respectively. This environment of slowing economic growth and
increased inflation may lead to social tensions. In parallel, political tensions around the fate of the
presidential election are high. Thus, the immediate challenge for the DRC is to reduce political
uncertainty and mitigate macroeconomic imbalances to avoid a situation where tensions may feed
into each other and lead to instability and decline in economic activity.
57. In the longer term, the country needs to progress on the reform agenda and to give
careful intergenerational attention to management of natural resources. The stalemate of the
reform agenda observed since 2015 will jeopardize the success of major initiatives, such as
decentralization and diversification. So far, the creation of new provinces remains formal, and the
decentralization process is unlikely to take off, due to capacity constraints at various levels. In
addition, diversification is indispensable to overcome vulnerabilities associated with DRC exports
being exposed to the volatility of commodity prices and to swings in the GDPs of trading partners.
As the WDR 2014 (p. 6) states, “risk management can be a powerful tool for development” and
“to pursue opportunity, people must confront risk.” Diversification can also help the DRC
attenuate or reverse the trends in adjusted net savings which indicate that the country is running
down its capital stock (including energy, minerals, forests) and is on an unsustainable path. This
is further analyzed in Chapter 4.
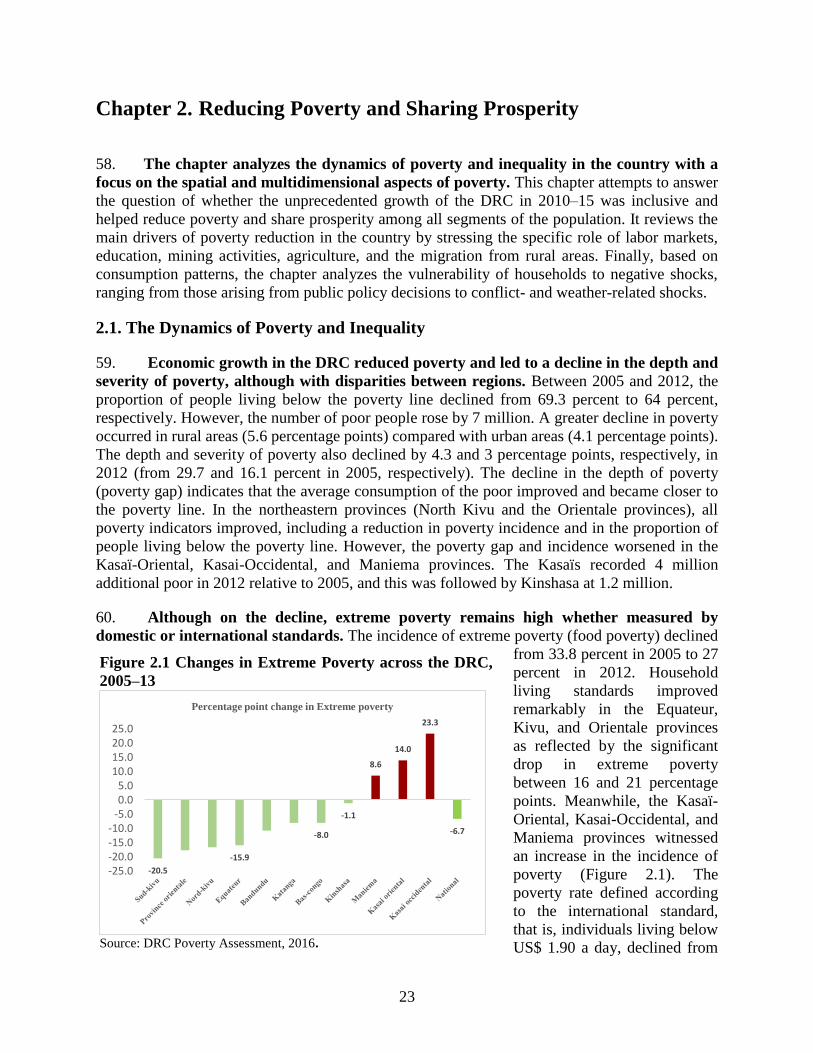
23
Chapter 2. Reducing Poverty and Sharing Prosperity
58. The chapter analyzes the dynamics of poverty and inequality in the country with a
focus on the spatial and multidimensional aspects of poverty. This chapter attempts to answer
the question of whether the unprecedented growth of the DRC in 2010–15 was inclusive and
helped reduce poverty and share prosperity among all segments of the population. It reviews the
main drivers of poverty reduction in the country by stressing the specific role of labor markets,
education, mining activities, agriculture, and the migration from rural areas. Finally, based on
consumption patterns, the chapter analyzes the vulnerability of households to negative shocks,
ranging from those arising from public policy decisions to conflict- and weather-related shocks.
2.1. The Dynamics of Poverty and Inequality
59. Economic growth in the DRC reduced poverty and led to a decline in the depth and
severity of poverty, although with disparities between regions. Between 2005 and 2012, the
proportion of people living below the poverty line declined from 69.3 percent to 64 percent,
respectively. However, the number of poor people rose by 7 million. A greater decline in poverty
occurred in rural areas (5.6 percentage points) compared with urban areas (4.1 percentage points).
The depth and severity of poverty also declined by 4.3 and 3 percentage points, respectively, in
2012 (from 29.7 and 16.1 percent in 2005, respectively). The decline in the depth of poverty
(poverty gap) indicates that the average consumption of the poor improved and became closer to
the poverty line. In the northeastern provinces (North Kivu and the Orientale provinces), all
poverty indicators improved, including a reduction in poverty incidence and in the proportion of
people living below the poverty line. However, the poverty gap and incidence worsened in the
Kasaï-Oriental, Kasai-Occidental, and Maniema provinces. The Kasaïs recorded 4 million
additional poor in 2012 relative to 2005, and this was followed by Kinshasa at 1.2 million.
60. Although on the decline, extreme poverty remains high whether measured by
domestic or international standards. The incidence of extreme poverty (food poverty) declined
from 33.8 percent in 2005 to 27
percent in 2012. Household
living standards improved
remarkably in the Equateur,
Kivu, and Orientale provinces
as reflected by the significant
drop in extreme poverty
between 16 and 21 percentage
points. Meanwhile, the Kasaï-
Oriental, Kasai-Occidental, and
Maniema provinces witnessed
an increase in the incidence of
poverty (Figure 2.1). The
poverty rate defined according
to the international standard,
that is, individuals living below
US$ 1.90 a day, declined from
Figure 2.1 Changes in Extreme Poverty across the DRC,
2005–13
Source: DRC Poverty Assessment, 2016.
-20.5
-15.9
-8.0
-1.1
8.6
14.0
23.3
-6.7
-25.0-20.0-15.0-10.0
-5.00.05.0
10.015.020.025.0
Percentage point change in Extreme poverty

24
94.3 percent in 2005 to a still high 76.9 percent in 2012. However, it remains substantially higher
than the Sub-Saharan African average, 42.6 percent.
61. The Kasais and Kivus provinces followed divergent paths characterized by
deindustrialization (Kasais) versus war economy (Kivus). In the past decades, both Kasai
Occidental and Oriental have undergone rapid deindustrialization. Diamond production, the key
industry for both Kasais has been in a steep decline. With the closure of MIBA (Société Minière
du Bakwanga), the main industrial producer of diamonds in the Kasais, and the depletion of layers
accessible by artisanal mining, revenue generated by diamond extraction fell (see Garett, Levin,
and Mitchell 2008). Closing of the border by Angola has also capped diamond smuggling and
other cross-border trade. Furthermore, the closing of the railway that connected Kasai Occidental
to Lubumbashi and Kinshasa and deterioration of roads has led to increased economic isolation of
the region. The last industrial producer, a brewery, closed in 2013, leading to the pauperization of
workers and the overall decline in living standards. Slowing down of the regional economy has
led to the exodus of the better off and the more educated strata to Kinshasa or abroad, putting in
motion the vicious circle of deindustrialization, loss of human capital, and accelerated
impoverishment of the population (World Bank 2011).
62. In the Kivus, by contrast, economic opportunities have expanded compared with
2005. The scale of fragility and conflict has diminished sufficiently to allow for more consistent
agricultural production on one of the most fertile lands of the country. Legal and illegal mining
and cross-border trade in an array of high-value natural resources (gold, cassiterite, coltan,
wolfram) is the source of relative wealth in the region (Spittaels et al. 2014). A particular “benefit”
of the monitored fragility of the region is the presence of a large number of international
organizations and NGOs (estimated at more than 200 in Goma, the capital of North Kivu alone),
a source of middle-income employment. Presence of UN forces, international organizations, and
NGOs produces a ripple effect in terms of housing and services market. An additional factor is the
greater social cohesion among some of the ethnicities of the region that support formal and
informal channels of distribution and private service provision (Kabamba 2013). This confluence
of circumstances and factors creates conditions in the Kivus for faster income generation and
better-distributed poverty alleviation.
63. Inequality in consumption is moderate and stayed relatively stable over time. The Gini
index declined from 38 to 35 between 2005 and 2012, respectively, but inequality remained stable
overall. Indeed, the richest 20 percent of the population accounted for approximately 44 percent
of total consumption in 2005 and 2012. The bottom 40 percent accounted for only 16.7 percent of
total consumption in 2012, down by 1.1 percent since 2005. When the DRC is split into areas
(Kinshasa, secondary cities, and rural areas), the decomposition of the inequality in consumption
shows that 99 percent of total inequality is attributable to intraregional inequality. Meanwhile,
interregional inequality only drives 1 percent of overall consumption inequality.37
64. Translating the recent positive economic performance to improved household
welfare seems modest according to nonmonetary socioeconomic indicators. Poverty
encompasses multiple dimensions of deprivations that affect well-being. Lack of access to health
37 Poverty is widespread and the Gini coefficients are not significantly different between regions: Kinshasa (32.4
percent), other urban (36.0 percent), and rural (35.0 percent)—which explains why the total inequality is driven by
intraregional inequality.
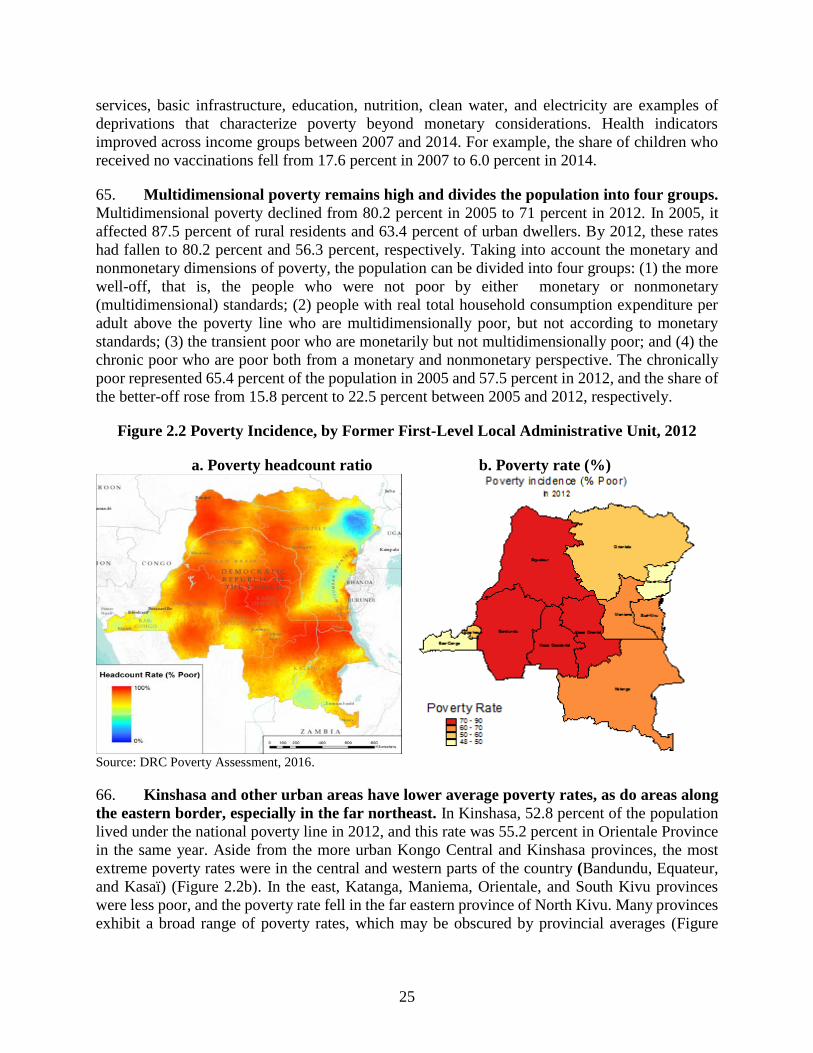
25
services, basic infrastructure, education, nutrition, clean water, and electricity are examples of
deprivations that characterize poverty beyond monetary considerations. Health indicators
improved across income groups between 2007 and 2014. For example, the share of children who
received no vaccinations fell from 17.6 percent in 2007 to 6.0 percent in 2014.
65. Multidimensional poverty remains high and divides the population into four groups.
Multidimensional poverty declined from 80.2 percent in 2005 to 71 percent in 2012. In 2005, it
affected 87.5 percent of rural residents and 63.4 percent of urban dwellers. By 2012, these rates
had fallen to 80.2 percent and 56.3 percent, respectively. Taking into account the monetary and
nonmonetary dimensions of poverty, the population can be divided into four groups: (1) the more
well-off, that is, the people who were not poor by either monetary or nonmonetary
(multidimensional) standards; (2) people with real total household consumption expenditure per
adult above the poverty line who are multidimensionally poor, but not according to monetary
standards; (3) the transient poor who are monetarily but not multidimensionally poor; and (4) the
chronic poor who are poor both from a monetary and nonmonetary perspective. The chronically
poor represented 65.4 percent of the population in 2005 and 57.5 percent in 2012, and the share of
the better-off rose from 15.8 percent to 22.5 percent between 2005 and 2012, respectively.
Figure 2.2 Poverty Incidence, by Former First-Level Local Administrative Unit, 2012
a. Poverty headcount ratio b. Poverty rate (%)
Source: DRC Poverty Assessment, 2016.
66. Kinshasa and other urban areas have lower average poverty rates, as do areas along
the eastern border, especially in the far northeast. In Kinshasa, 52.8 percent of the population
lived under the national poverty line in 2012, and this rate was 55.2 percent in Orientale Province
in the same year. Aside from the more urban Kongo Central and Kinshasa provinces, the most
extreme poverty rates were in the central and western parts of the country (Bandundu, Equateur,
and Kasaï) (Figure 2.2b). In the east, Katanga, Maniema, Orientale, and South Kivu provinces
were less poor, and the poverty rate fell in the far eastern province of North Kivu. Many provinces
exhibit a broad range of poverty rates, which may be obscured by provincial averages (Figure
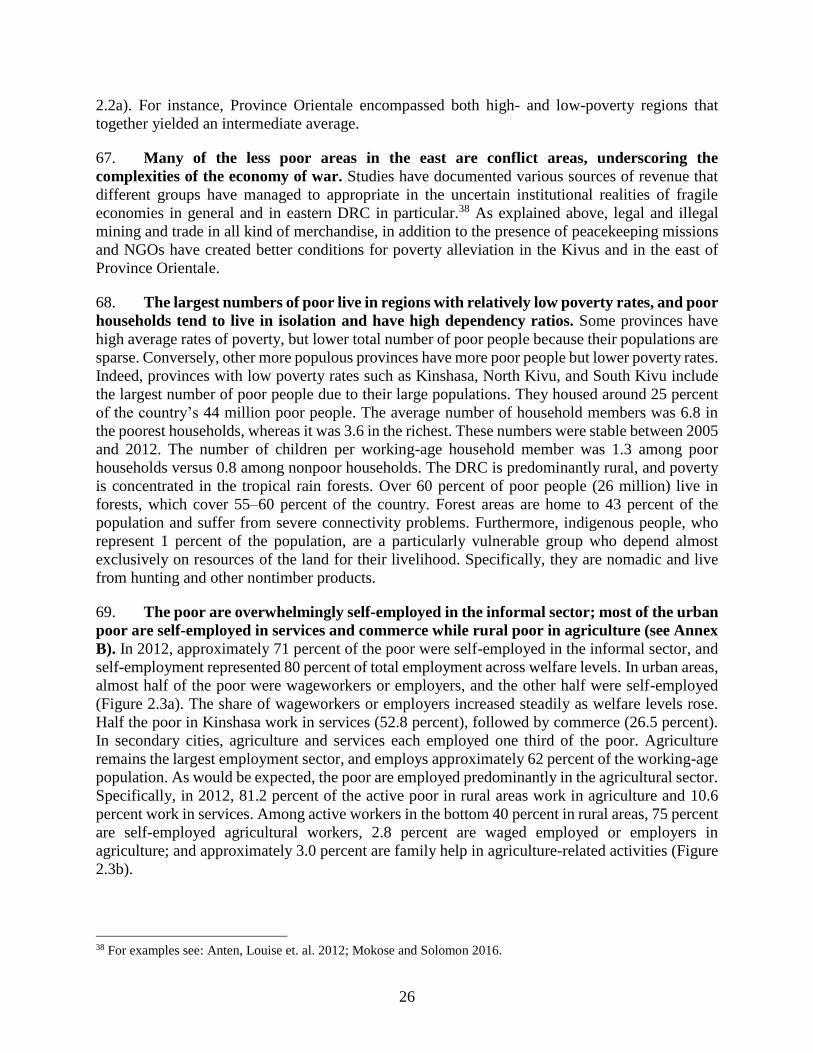
26
2.2a). For instance, Province Orientale encompassed both high- and low-poverty regions that
together yielded an intermediate average.
67. Many of the less poor areas in the east are conflict areas, underscoring the
complexities of the economy of war. Studies have documented various sources of revenue that
different groups have managed to appropriate in the uncertain institutional realities of fragile
economies in general and in eastern DRC in particular.38 As explained above, legal and illegal
mining and trade in all kind of merchandise, in addition to the presence of peacekeeping missions
and NGOs have created better conditions for poverty alleviation in the Kivus and in the east of
Province Orientale.
68. The largest numbers of poor live in regions with relatively low poverty rates, and poor
households tend to live in isolation and have high dependency ratios. Some provinces have
high average rates of poverty, but lower total number of poor people because their populations are
sparse. Conversely, other more populous provinces have more poor people but lower poverty rates.
Indeed, provinces with low poverty rates such as Kinshasa, North Kivu, and South Kivu include
the largest number of poor people due to their large populations. They housed around 25 percent
of the country’s 44 million poor people. The average number of household members was 6.8 in
the poorest households, whereas it was 3.6 in the richest. These numbers were stable between 2005
and 2012. The number of children per working-age household member was 1.3 among poor
households versus 0.8 among nonpoor households. The DRC is predominantly rural, and poverty
is concentrated in the tropical rain forests. Over 60 percent of poor people (26 million) live in
forests, which cover 55–60 percent of the country. Forest areas are home to 43 percent of the
population and suffer from severe connectivity problems. Furthermore, indigenous people, who
represent 1 percent of the population, are a particularly vulnerable group who depend almost
exclusively on resources of the land for their livelihood. Specifically, they are nomadic and live
from hunting and other nontimber products.
69. The poor are overwhelmingly self-employed in the informal sector; most of the urban
poor are self-employed in services and commerce while rural poor in agriculture (see Annex
B). In 2012, approximately 71 percent of the poor were self-employed in the informal sector, and
self-employment represented 80 percent of total employment across welfare levels. In urban areas,
almost half of the poor were wageworkers or employers, and the other half were self-employed
(Figure 2.3a). The share of wageworkers or employers increased steadily as welfare levels rose.
Half the poor in Kinshasa work in services (52.8 percent), followed by commerce (26.5 percent).
In secondary cities, agriculture and services each employed one third of the poor. Agriculture
remains the largest employment sector, and employs approximately 62 percent of the working-age
population. As would be expected, the poor are employed predominantly in the agricultural sector.
Specifically, in 2012, 81.2 percent of the active poor in rural areas work in agriculture and 10.6
percent work in services. Among active workers in the bottom 40 percent in rural areas, 75 percent
are self-employed agricultural workers, 2.8 percent are waged employed or employers in
agriculture; and approximately 3.0 percent are family help in agriculture-related activities (Figure
2.3b).
38 For examples see: Anten, Louise et. al. 2012; Mokose and Solomon 2016.
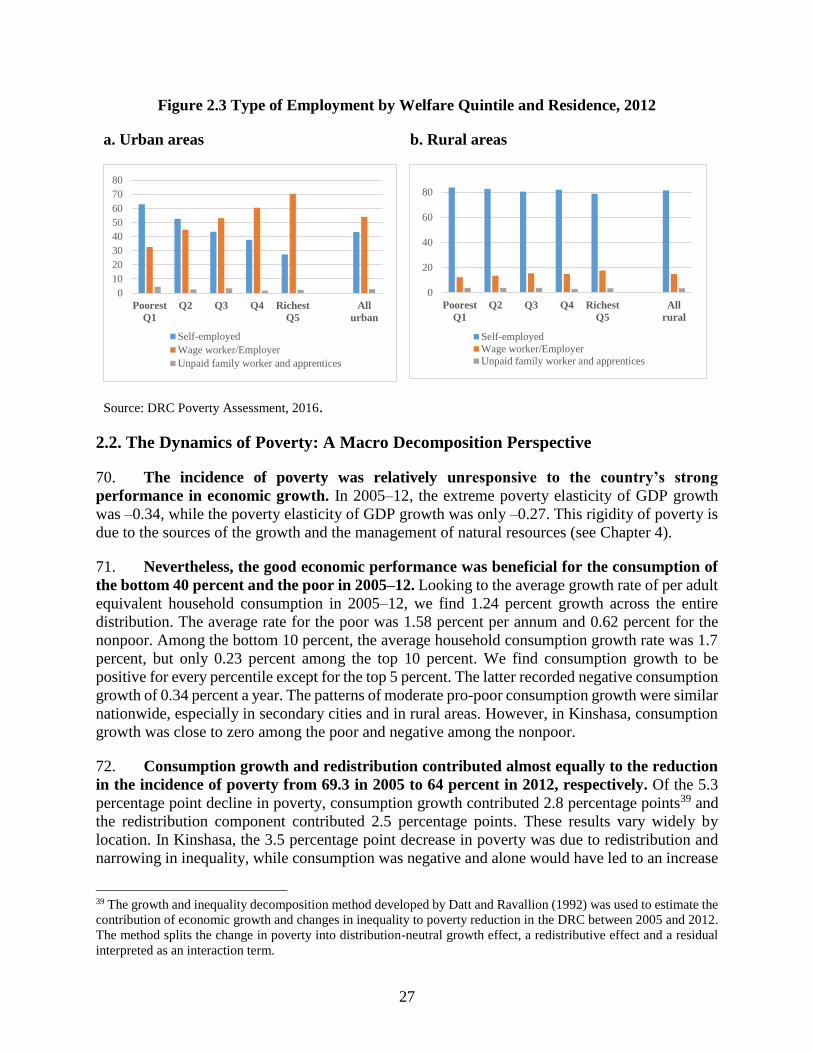
27
Figure 2.3 Type of Employment by Welfare Quintile and Residence, 2012
a. Urban areas
b. Rural areas
Source: DRC Poverty Assessment, 2016.
2.2. The Dynamics of Poverty: A Macro Decomposition Perspective
70. The incidence of poverty was relatively unresponsive to the country’s strong
performance in economic growth. In 2005–12, the extreme poverty elasticity of GDP growth
was –0.34, while the poverty elasticity of GDP growth was only –0.27. This rigidity of poverty is
due to the sources of the growth and the management of natural resources (see Chapter 4).
71. Nevertheless, the good economic performance was beneficial for the consumption of
the bottom 40 percent and the poor in 2005–12. Looking to the average growth rate of per adult
equivalent household consumption in 2005–12, we find 1.24 percent growth across the entire
distribution. The average rate for the poor was 1.58 percent per annum and 0.62 percent for the
nonpoor. Among the bottom 10 percent, the average household consumption growth rate was 1.7
percent, but only 0.23 percent among the top 10 percent. We find consumption growth to be
positive for every percentile except for the top 5 percent. The latter recorded negative consumption
growth of 0.34 percent a year. The patterns of moderate pro-poor consumption growth were similar
nationwide, especially in secondary cities and in rural areas. However, in Kinshasa, consumption
growth was close to zero among the poor and negative among the nonpoor.
72. Consumption growth and redistribution contributed almost equally to the reduction
in the incidence of poverty from 69.3 in 2005 to 64 percent in 2012, respectively. Of the 5.3
percentage point decline in poverty, consumption growth contributed 2.8 percentage points39 and
the redistribution component contributed 2.5 percentage points. These results vary widely by
location. In Kinshasa, the 3.5 percentage point decrease in poverty was due to redistribution and
narrowing in inequality, while consumption was negative and alone would have led to an increase
39 The growth and inequality decomposition method developed by Datt and Ravallion (1992) was used to estimate the
contribution of economic growth and changes in inequality to poverty reduction in the DRC between 2005 and 2012.
The method splits the change in poverty into distribution-neutral growth effect, a redistributive effect and a residual
interpreted as an interaction term.
0
10
20
30
40
50
60
70
80
Poorest
Q1
Q2 Q3 Q4 Richest
Q5
All
urban
Self-employed
Wage worker/Employer
Unpaid family worker and apprentices
0
20
40
60
80
Poorest
Q1
Q2 Q3 Q4 Richest
Q5
All
rural
Self-employed
Wage worker/Employer
Unpaid family worker and apprentices
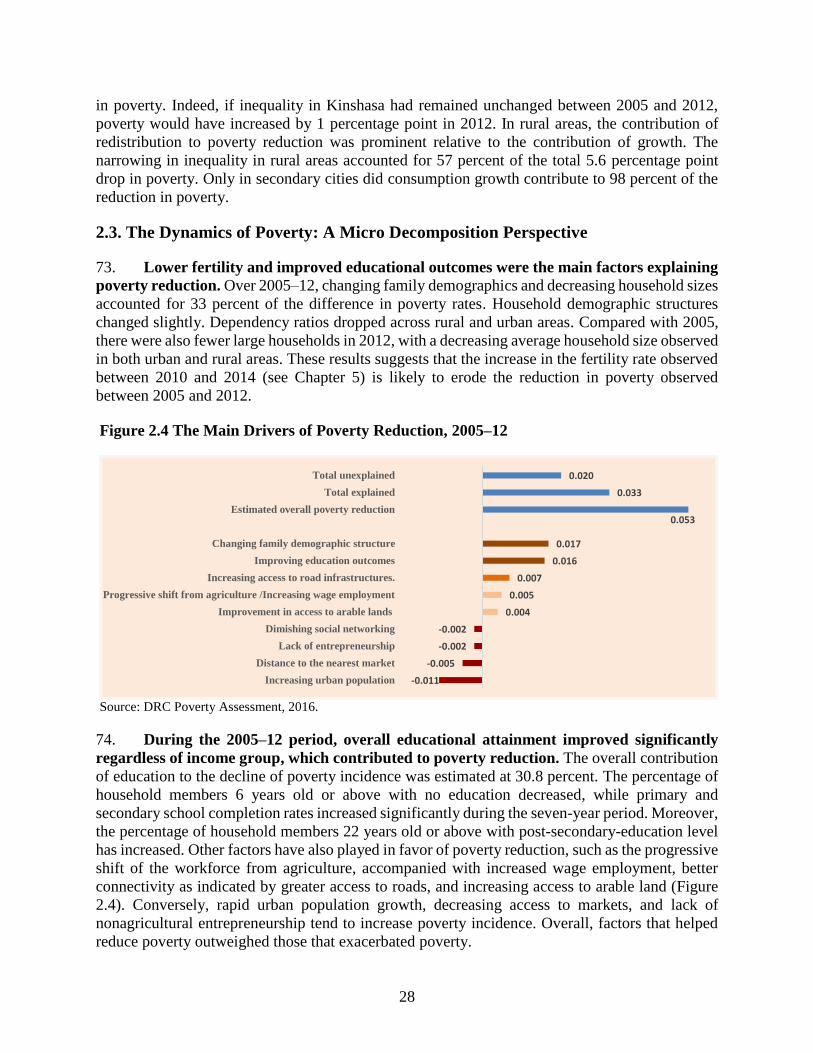
28
in poverty. Indeed, if inequality in Kinshasa had remained unchanged between 2005 and 2012,
poverty would have increased by 1 percentage point in 2012. In rural areas, the contribution of
redistribution to poverty reduction was prominent relative to the contribution of growth. The
narrowing in inequality in rural areas accounted for 57 percent of the total 5.6 percentage point
drop in poverty. Only in secondary cities did consumption growth contribute to 98 percent of the
reduction in poverty.
2.3. The Dynamics of Poverty: A Micro Decomposition Perspective
73. Lower fertility and improved educational outcomes were the main factors explaining
poverty reduction. Over 2005–12, changing family demographics and decreasing household sizes
accounted for 33 percent of the difference in poverty rates. Household demographic structures
changed slightly. Dependency ratios dropped across rural and urban areas. Compared with 2005,
there were also fewer large households in 2012, with a decreasing average household size observed
in both urban and rural areas. These results suggests that the increase in the fertility rate observed
between 2010 and 2014 (see Chapter 5) is likely to erode the reduction in poverty observed
between 2005 and 2012.
74. During the 2005–12 period, overall educational attainment improved significantly
regardless of income group, which contributed to poverty reduction. The overall contribution
of education to the decline of poverty incidence was estimated at 30.8 percent. The percentage of
household members 6 years old or above with no education decreased, while primary and
secondary school completion rates increased significantly during the seven-year period. Moreover,
the percentage of household members 22 years old or above with post-secondary-education level
has increased. Other factors have also played in favor of poverty reduction, such as the progressive
shift of the workforce from agriculture, accompanied with increased wage employment, better
connectivity as indicated by greater access to roads, and increasing access to arable land (Figure
2.4). Conversely, rapid urban population growth, decreasing access to markets, and lack of
nonagricultural entrepreneurship tend to increase poverty incidence. Overall, factors that helped
reduce poverty outweighed those that exacerbated poverty.
Figure 2.4 The Main Drivers of Poverty Reduction, 2005–12
Source: DRC Poverty Assessment, 2016.
-0.011
-0.005
-0.002
-0.002
0.004
0.005
0.007
0.016
0.017
0.053
0.033
0.020
Increasing urban population
Distance to the nearest market
Lack of entrepreneurship
Dimishing social networking
Improvement in access to arable lands
Progressive shift from agriculture /Increasing wage employment
Increasing access to road infrastructures.
Improving education outcomes
Changing family demographic structure
Estimated overall poverty reduction
Total explained
Total unexplained
29
75. The shift of labor from agriculture to wage employment is a distinctive feature of the
structural transformation of the DRC and was beneficial across welfare groups (see Annex
B). The shift out of agriculture, and the increase in wage employment contributed 0.5 percentage
points to the decrease in poverty between 2005 and 2012. Wage employment increased by 2.3
percentage points among the bottom 40 percent, and by three times more among the top 60 percent.
The employment rate improved among women: the share of women wage workers rose by 3.4
percentage points, to 8 percent in 2012. The change in the structure of employment in 2005–12,
characterized by more waged and salaried jobs at the expense of self-employment and unpaid
family workers, was observed across all welfare quintiles. The share of wage workers was 20
percent in 2012, following a 6 percentage points increase since 2005. Similarly, the share of wage
workers in poor households rose by 5 percentage points to 17 percent in 2012.
76. Improved access to
the road network
contributed 13.2 percent
to the observed poverty
reduction between 2005
and 2012. The share of
households located less than
five kilometers from the
nearest road increased from
23.6 percent in 2005 to 33.8
percent in 2012. In 2012, the
poor were thus less isolated,
and access to roads
expanded by 15.3 percent
for the lowest three quintiles
and 7.7 percent for the top
two quintiles.
77. Improvement in
access to arable land
emerges as one of the
drivers of poverty reduction in the DRC. From 2005 to 2012, increase in ownership of arable
lands by household members accounted for 0.04 percentage points in the decline of poverty
incidence nationally (or 8 percent of total poverty reduction). Access to land is important, but land
alone is not sufficient to improve the well-being of rural households. The size of the cultivated
land and the use of fertilizers and improved seeds are critical to improve productivity.
78. At the subnational level, provinces that suffered from employment decline in the
informal ASM sector experienced increases in poverty rates. While the national poverty rate
declined by 5.3 percentage points, subnational trends were mixed. Some provinces experienced
reductions in poverty rates of up to 20 percentage points (North Kivu); others registered large
increases. In Kasaï Oriental (now Kasaï-Oriental, Lomami, and Sankuru), Kasaï Occidental (now
Kasai and Kasai Central), and Maniema, poverty rates rose between 14 and 26 percentage points.
In 2005, two of these now former provinces were heavily involved in ASM and had a large number
of workers employed in the sector. They subsequently suffered huge job losses because of the
Figure 2.5 Change in the Share of Workers in the Mining
Sector, by First-Level Local Administrative Unit, 2005–12
Source: Calculations based on data of the 1-2-3 Surveys, 2005, 2012.
0.5 0.70.0
3.4
10.810.1
0.10.6
0.10.7
1.9
(100,000)
(80,000)
(60,000)
(40,000)
(20,000)
-
20,000
40,000
60,000
Change 2012-05 % mining 2005
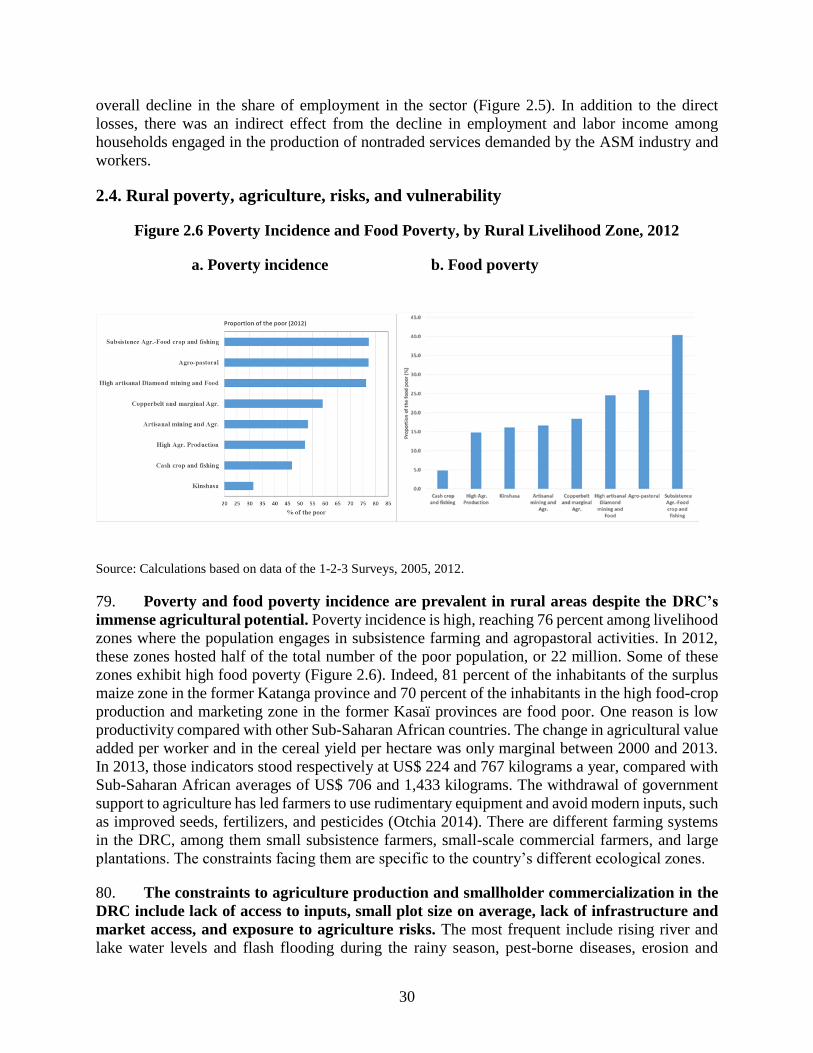
30
overall decline in the share of employment in the sector (Figure 2.5). In addition to the direct
losses, there was an indirect effect from the decline in employment and labor income among
households engaged in the production of nontraded services demanded by the ASM industry and
workers.
2.4. Rural poverty, agriculture, risks, and vulnerability
Figure 2.6 Poverty Incidence and Food Poverty, by Rural Livelihood Zone, 2012
a. Poverty incidence b. Food poverty
Source: Calculations based on data of the 1-2-3 Surveys, 2005, 2012.
79. Poverty and food poverty incidence are prevalent in rural areas despite the DRC’s
immense agricultural potential. Poverty incidence is high, reaching 76 percent among livelihood
zones where the population engages in subsistence farming and agropastoral activities. In 2012,
these zones hosted half of the total number of the poor population, or 22 million. Some of these
zones exhibit high food poverty (Figure 2.6). Indeed, 81 percent of the inhabitants of the surplus
maize zone in the former Katanga province and 70 percent of the inhabitants in the high food-crop
production and marketing zone in the former Kasaï provinces are food poor. One reason is low
productivity compared with other Sub-Saharan African countries. The change in agricultural value
added per worker and in the cereal yield per hectare was only marginal between 2000 and 2013.
In 2013, those indicators stood respectively at US$ 224 and 767 kilograms a year, compared with
Sub-Saharan African averages of US$ 706 and 1,433 kilograms. The withdrawal of government
support to agriculture has led farmers to use rudimentary equipment and avoid modern inputs, such
as improved seeds, fertilizers, and pesticides (Otchia 2014). There are different farming systems
in the DRC, among them small subsistence farmers, small-scale commercial farmers, and large
plantations. The constraints facing them are specific to the country’s different ecological zones.
80. The constraints to agriculture production and smallholder commercialization in the
DRC include lack of access to inputs, small plot size on average, lack of infrastructure and
market access, and exposure to agriculture risks. The most frequent include rising river and
lake water levels and flash flooding during the rainy season, pest-borne diseases, erosion and
31
drought that result in famine. For example, in 2012, around 50 percent of households in agricultural
subsistence livelihood zones reported experiencing death because of drought and famine. The
impact of these risks on the welfare of rural farming households have resulted in food insecurity
because of low assets at household level (social, physical, human, and economic capital). Rural
farming households represent a vulnerable group as they grapple with chronically low levels of
income, which translate into volatile consumption patterns.
81. Insufficient domestic agricultural production contributes to food price volatility, and
food insecurity and conflict are straining agricultural production systems. While the
population is engaged predominantly in agriculture, only a third of food consumed in the country
is locally produced. The DRC is a net importer in every category of agricultural commodity. The
population is not food self-sufficient and is unable to produce enough to cover their own
consumption. This is evident given the high rates of poverty, post-harvest loss, hunger, and no
food reserves, particularly affecting subsistence farmers. Slight disruptions in, for example,
transport because of floods or conflict could affect retail prices of food in markets and have a major
impact predominantly among the poor. In addition, assets insecurity for the poor (land access and
livestock) is one of the main drivers of conflict, particularly in eastern DRC, and has a spillover
effect on food insecurity and vulnerability. Refugee influx in the eastern provinces has led to food
price spikes and acute food crisis in this region.
2.5. Educational Attainment and Poverty
82. Improvement in educational attainment among household members had a positive
impact on poverty reduction. Educational attainment improved significantly between 2005 and
2012 regardless of poverty status. Importantly, the share of household members ages 22 years or
above with postsecondary education has also increased. An analysis of the returns on education
based on data from the 1-2-3 Survey of 2012 indicates that an additional year of schooling is
associated with a 2.5 percent and 6.2 percent decline in the unemployment rate among men and
women, respectively. Moreover, an additional year of education increases the chance of obtaining
wage employment and participating in nonagricultural household businesses.
83. Education provided at the post-primary levels lacks relevance and does not provide
adequate skills in sciences, engineering, and technology. As a result, only 20 percent of
secondary students opt for science sections. Technical and vocational education at secondary and
tertiary levels is unregulated, obsolete, and insufficiently aligned with the needs of the private
sector. In higher education, student enrollment is low in the programs targeting sectors that are
important for the DRC’s economic growth. The deficiencies in the education system are mainly
due to poor governance and inefficient utilization of resources.
84. While educational attainment moderately improved, the country still lags behind
most Sub-Saharan African countries, and gender gaps persist in enrollment and attainment
rates in secondary education. Progress has been made in improving access for girls to primary
school. In 2007, the average share of female students in primary school was 44.8 percent in the
DRC, against 47.1 percent in Sub-Saharan Africa. By 2013, this share increased to 47.2 percent in
the DRC, but remained at 0.4 percentage points lower than the average in Sub-Saharan Africa.
Although improving, the ratio of female students in secondary school remains low in the DRC
32
compared with Sub-Saharan Africa. The share of female students reached 38.1 percent in
secondary schools in DRC, while the average across Sub-Saharan Africa was 45.7 percent.
85. Female teenagers drop out of school primarily because of marriage and pregnancy,
while male teenagers drop out due to financial difficulty. Females 15–22 years old report
marriage and pregnancy as the main reason for not attending school. The adolescent fertility rate
among females 15–19 years old is high in the DRC. In 2013, 122.9 live births per 1,000 for this
age group were reported, against 105.6 in Sub-Saharan Africa. The cost per student in secondary
school, public and private combined, is considerable, equivalent to 17 percent of a household’s per
capita expenditure. The development consequences of high adolescent fertility rates are
significant, increasing risk of death at childbirth. Early child bearing also reduces educational
attainment rates and impedes future opportunities for training and employment.
86. Tuition waivers and low tuition fees help teenage girls in the lowest wealth quintile
stay in school, suggesting that policy interventions may be effective. Although poverty rates
are higher in low-tuition provinces, there is no gender gap in school enrollment rates across wealth
quintiles in these provinces. In contrast, the gender differences in school enrollment rates among
teenagers 13 years old or above are substantial among the lowest wealth quintile in high-tuition
provinces. Poor provinces tend to provide tuition waivers, and the cost of education tends to be
lower in these provinces than in those with low poverty rates. In the former provinces of Bandundu,
Equateur, Kasaï-Oriental, Kasaï-Occidental, and Maniema, 30 percent of households with children
older than 6 years do not pay tuition at public schools. Meanwhile, in the low-poverty provinces
of Kongo-Central, Katanga, and South Kivu, 90 percent of households with children older than 6
years of age do pay tuition at public school. Among children in the 6–12 age group, 21 percent in
the poorest quintile in low-tuition provinces benefited from tuition waivers in 2012, while only 4
percent in the poorest quintile in high-tuition provinces received such waivers.
33
Chapter 3. Political Instability and Governance Failures: The
Challenge of Extractive Political Institutions
87. The DRC has been plagued by many shocks that led to years of mismanagement,
dysfunction, decimation of the public administration, and socioeconomic problems. The
country suffered from armed conflict, economic degradation, and political and economic shocks.
Thus, the current governance environment lacks transparency, gives little access to information,
permits wide administrative discretion, and creates regulatory uncertainty and an overall weakness
of accountability mechanisms. These problems can be traced down to the sector level (see Annex
H). The DRC’s poor performance in growth, job‐creation, and poverty reduction originates in
deeply-entrenched constituencies with strong vested interests. These groups have captured the
policy-making and regulatory process to maintain and expand their privileges.
88. The patrimonial nature of governance in the DRC is undermining progress toward
poverty reduction and shared prosperity. According to a 2010 Transparency International
report, various forms of political patronage and clientelism are practiced in the DRC and “key
positions in the administration are also allocated on the basis of cronyism and patronage politics
rather than on merit.” 40 Despite anticorruption efforts cited in the same report, little seems to have
changed. Indeed, a 2016 Business Anti-Corruption report states that “clientelism, rent-seeking and
patronage have decimated fair competition, particularly in the sectors of public procurement and
extractive industries,” and adds that “the ruling elite has a direct stake in the country's economy,
and often steer economic activities in accordance to their own personal opportunities.” The same
report acknowledges the existence of an anti-corruption legal framework through the Penal Code,
which is, however, poorly implemented.41 In sum, the state-society relationship is characterized as
one of patron-client, where formal institutions are weak and private and public spheres coalesce.
Influence is created by building and feeding a network from usually the same socioeconomic
group. The distribution of resources is primarily motivated by personal relationships and loyalties
and takes the form of personal favors. Ethnic and tribal affiliation are often used as an alibi to
justify this patron-client relationship.
3.1 Persistent Weaknesses in Governance Indicators
89. Over the last decade, the DRC made improvements in governance. According to the
2015 Worldwide Governance Indicators (WGI), the DRC scored 3.85 in government effectiveness
(up from 2.93 in 2005), 6.25 on regulatory quality (up from 3.92 in 2005), 3.37 on rule of law
(down from 3.83 in 2005), and 3.81 on political stability and absence of violence (up from 1.45 in
2005) (Figure 3.1). The DRC slightly improved on voice and accountability, from a WGI of 6.25
in 2005 to a score of 12.81 in 2015. The same indicator on the 2016 Ibrahim Index of African
Governance (IIAG) had a cumulative increase of over 12 points over the last decade, making it the
single highest double digit gain for the country. This is partly due to the government’s move
40 Source: Transparency International, Anticorruption Resource Center, and CHR. Michelson Institute: Overview of
corruption and anti-corruption in the Democratic Republic of Congo (DRC), October 8, 2010,
http://www.transparency.org/files/content/corruptionqas/257_Corruption_and_anti_corruption_in_the_DRC.pdf 41 Source: GAN Business Anti-Corruption Portal: DR Congo Corruption Report, August 2016, http://www.business-
anti-corruption.com/country-profiles/democratic-republic-of-the-congo.
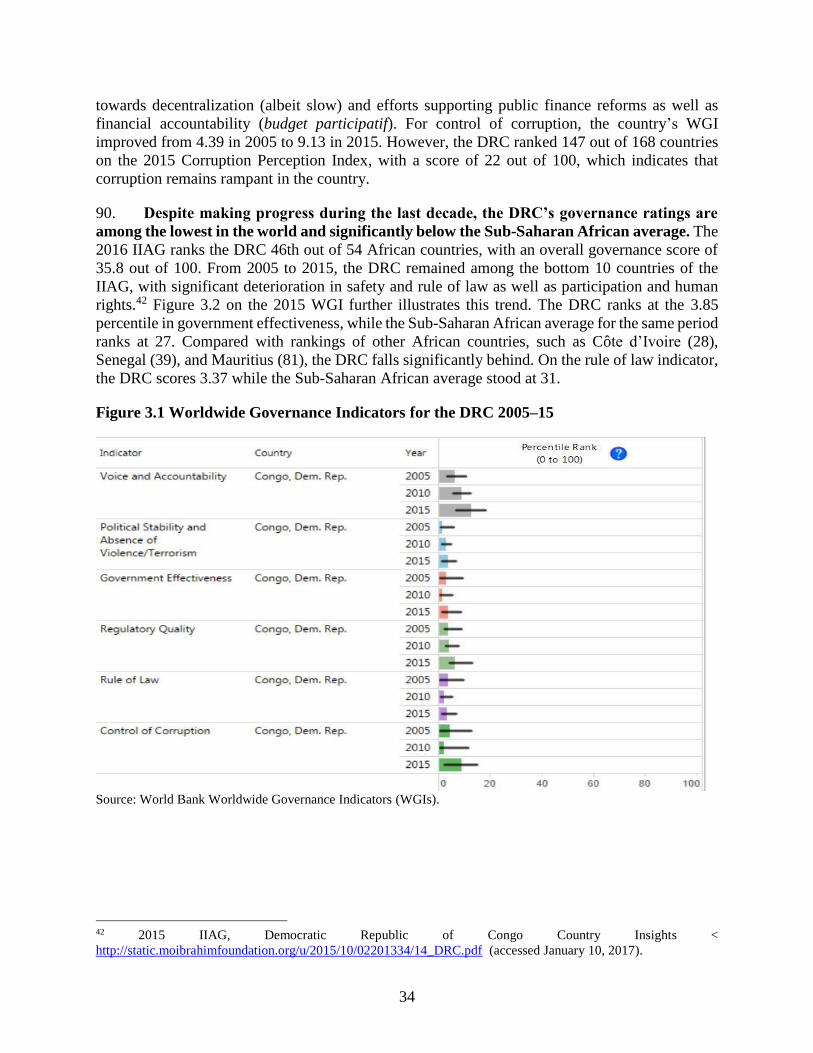
34
towards decentralization (albeit slow) and efforts supporting public finance reforms as well as
financial accountability (budget participatif). For control of corruption, the country’s WGI
improved from 4.39 in 2005 to 9.13 in 2015. However, the DRC ranked 147 out of 168 countries
on the 2015 Corruption Perception Index, with a score of 22 out of 100, which indicates that
corruption remains rampant in the country.
90. Despite making progress during the last decade, the DRC’s governance ratings are
among the lowest in the world and significantly below the Sub-Saharan African average. The
2016 IIAG ranks the DRC 46th out of 54 African countries, with an overall governance score of
35.8 out of 100. From 2005 to 2015, the DRC remained among the bottom 10 countries of the
IIAG, with significant deterioration in safety and rule of law as well as participation and human
rights.42 Figure 3.2 on the 2015 WGI further illustrates this trend. The DRC ranks at the 3.85
percentile in government effectiveness, while the Sub-Saharan African average for the same period
ranks at 27. Compared with rankings of other African countries, such as Côte d’Ivoire (28),
Senegal (39), and Mauritius (81), the DRC falls significantly behind. On the rule of law indicator,
the DRC scores 3.37 while the Sub-Saharan African average stood at 31.
Figure 3.1 Worldwide Governance Indicators for the DRC 2005–15
Source: World Bank Worldwide Governance Indicators (WGIs).
42 2015 IIAG, Democratic Republic of Congo Country Insights <
http://static.moibrahimfoundation.org/u/2015/10/02201334/14_DRC.pdf (accessed January 10, 2017).

35
Figure 3.2 Comparative 2015 Worldwide Governance Indicator in Sub-Saharan Africa
Source: World Bank WGIs.
Figure 3.3 Bertelsmann Transformation Index Report (BTI), DRC 2006–16
Source: BTI 2016.
36
91. As a result of weak governance, improvements in the institutional performance of the
DRC’s economy and political participation systems have been stagnant. Data from the
Bertelsmann Transformation Index (BTI)—an index that tracks countries’ democratic and
economic trends through institutional performance—corroborates a downward trend in the
performance of democratic and economic institutions in the DRC, as highlighted by previous
indicators. Figure 3.3 from the 2016 BTI report compares the DRC’s performance from 2006 to
2016 and highlights that in the last decade property rights have declined due to the dysfunctional
public administration and judicial systems. The report also stresses that the country’s commitment
to democratic institutions remains weak and that “key institutions of democracy and the rule of
law such as the constitution, elections and referenda are often used to foster the ruling elites’ grip
to power,” which has reinforced systemic corruption.
3.2 Weak Governance Has Far-Reaching Consequences
92. Political settlements in the DRC are competitive43 and initiatives to improve
governance need to be carefully sequenced. The nature of political settlement in the country can
be characterized as personalized-competitive, where politics is competitive44 but rules governing
both the polity and the economy remain personalized.45 In personalized-competitive countries,
politics is organized around personalized interactions, and rent is distributed between elites. In the
DRC, sequencing governance reforms is very important as reforms upsetting the existing
equilibrium are highly likely to be contested and/or sabotaged. In the early stages of the reform
process, there will be resistance to comprehensive public sector management reforms as they will
aim to limit personalized discretion.
93. Excluding the powerless from decision-making processes has far-reaching
consequences for a population who suffers from quasi-inexistent public services. After
decades of state collapse, the public service sector is unable to cope with reasonable service
provision. Millions of Congolese lack access to water, sanitation, all-season roads, and electricity.
Access to quality education and health care is unattainable for many. Once an exporter of food,
the DRC now struggles to meet the basic nutritional needs of its citizens. Militia activity and ethnic
conflicts in several parts of the country, insecurity in the east, and abuse by police and security
forces subject the population to violence and insecurity.
43 A political settlement, which establishes the formal and informal rules for managing political and economic
relations, is competitive when it is organized around a truce in which rival forces agree on rules for political
competition. In the DRC, the basis for building political coalitions is personalized relationships, a combination of
bargaining and rent-distribution among elites. In the post-independence period, personalized relationships among the
elites (évolués) played an important role in shaping political bargains and establishing a mutually beneficial
relationship for political consolidation and survival. 44 Political alliances and parties include Alliance pour la majorité présidentielle (ruling alliance composed of many
smaller parties); Mouvement pour la Libération du Congo (led by Jean-Pierre Bemba); Parti Lumumbiste Unifie
(Antoine Gizenga); Parti du peuple pour la reconstruction et le développement (presidential party); Rassemblement
Congolais pour la Démocratie (Azarias Ruberwa); Rassemblement Congolais pour la Démocratie-
Kisangani/Mouvement de libération (Mbusa Nyamwisi); Union des démocrates Mobutistes (Nzanga Mobutu); Union
pour la nation Congolaise (Vital Kamerhe); and Union pour la démocratie et le progrès sociale (Félix Tshisekedi).
In total, the country has over 500 parties. 45 Levy, B. 2014.
37
94. Women are an important vulnerable group. Women are largely responsible for family
survival and cohesion and have become important actors in the dominant informal economy.
However, they tend to be sidelined in decision-making processes, both within the family and at
the national political level. For example, there were eight women in the 67-member government
of Samy Badibanga (December 2016–April 2017). Political representation of women in both
chambers of Parliament remains low; women account for only 8.9 percent of the National
Assembly—occupying 44 out of 492 seats—and only 4.6 percent of the Senate with only five seats
out of 108. Critically, the 2015 revision of the electoral law removed a provision enabling a 30-
percent quota for women’s representation at the national level, which is likely to impede gains in
women’s political participation.46
95. Lack of trust and accountability are the main characteristics of the state-society
relationship. Withholding rights and entitlements and undermining equal opportunities, voice,
and access to resources and services are all distinguishing features of the rules governing the state-
society relationship in the DRC. The country has never had a social contract based on
accountability to citizens. The relationships between the state and its people are often exploitative
and predatory.47 The availability of natural resource revenues undermines the incentive of rulers
to respond to interests expressed in the society and economy. Rents from natural resources do not
trickle down to the population.48 The top levels of the state make decisions on concession awards
and partnership arrangements, including with foreign and multinational companies. Formal
provisions governing the flow of proceeds from natural resources to local communities are not
enforced. Many Congolese find themselves in a complex set of power relations whereby the power
of the state is used for extortion and exclusionary governance practices. In many cases, tax
collection by government agents occurs informally and illegally, with little public awareness of
what fees are legal (Afoaku. 2010; Lamer et al. 2013, Laudati et al. 2013).49
96. The predominance of extractive economic and political institutions and crumbling
state institutions have led to the erratic evolution of the political situation. The economic and
political institutions of the DRC are still unable to create incentives for delivering an inclusive
development agenda. Tensions persist regarding the enforcement of property rights, and the
population is yet to receive basic public services and see serious prospects for a sustainable
economic and social progress. Within institutions, there is an ongoing debate between, from one
side, a vision of resource management for sustainable development and, from the other side, a
tendency to subordinate the use of these resources to short-term economic and political interests.
As Acemoglu and Robinson (2012, 368, 372) could have pointed out in the context of DRC: “The
most common reason why nations fail today is because they have extractive institutions … Nations
fail today because their extractive economic institutions do not create the incentives needed for
people to save, invest, and innovate. Extractive political institutions support these economic
46 See http://www.ipu.org/wmn-e/classif.htm. 47 Many reports have documented the long tradition of predatory management of natural resources. Global Witness in
particular have reported how the DRC’s considerable natural wealth is exploited for the benefit of a small number of
business and political actors to the detriment of the population. See the report at
http://reliefweb.int/sites/reliefweb.int/files/resources/8A6BAC4CBE4F056785256ECA00130FF8-gw-cod-30jul.pdf 48 A report by the UN Panel of Experts on the DRC describes the scale of loss and leakages of natural resource
revenues, see https://www.srwolf.com/reports/UNCONGO.pdf 49 Afoaku, O. 2010. Report on the DRC (Kinshasa) in Countries at the Crossroads 2010, 32 country reports published
by Freedom House; Lamer, M. et al. 2013; Laudati et al. 2013.
38
institutions by cementing the power of those who benefit from the extraction. Extractive economic
and political institutions, though their details vary under different circumstances, are always at the
root of this failure.”
97. A major source of conflict in the DRC is the absence of institutions able to adjudicate
conflicts and the underlying grievances over land and mineral rights. For decades, political
actors and armed groups have manipulated ethnic and communal identities in the eastern
provinces. This led to armed conflicts and migrations within the Great Lakes region that
engendered social and political exclusion and loss of identity, hence fueling instability and
triggering the forced displacement of large numbers of people. Manipulation of ethnicity and
identity is also evident in the competition for the occupation of land, leading to disenfranchisement
and conflict.
3.3 Symptoms of Weak Governance in Fiscal Management and Public
Administration
98. The tax revenue base in the DRC is narrow and does not allow the government to
mobilize the revenues needed to finance its own operations and deliver public services. Only
a small share of the population pays taxes. The narrow base is a consequence of the structure of
the economy with strong reliance on natural resources and widespread informality. The narrow
base also derives from legal arrangements that grant investors tax holidays and privileges outside
the General Tax Code. In addition, further narrowing of the tax base derives from the excessive
discretionary use of tax exemptions across most tax sources, such as the personal income tax, the
corporate income tax, VAT, and excise taxes. Weak tax administration and consequent tax evasion
narrow the tax base further.
99. The national budget is insignificant given the size, population, and natural resource
wealth of the country. Despite its inconsequential size, the government struggles to execute the
national budget. Bottlenecks in public expenditure management and procurement lead to low
budget execution rates and inefficient public spending in priority sectors. The overall budget
execution rate hovered around 55 percent from 2012 to 2014 and reached 59 percent in 2015.50
There is a need to strengthen the budgetary capacity of line ministries. Budget execution suffers
from: (1) redundant and lengthy steps in budget execution processes, including various political
interventions in the approval of commitments and payments; (2) abuse in the use of exceptional or
emergency procedures; (3) excessive centralization of budget execution authority in the Ministry
of Finance and the Ministry of the Budget; and (4) inefficient use of public procurement procedures
and entities, especially procurement units, that are not yet fully operational.
100. The weakness of formal institutions charged with the oversight of public finances has
enabled the widespread use of discretionary power. There are indications that such institutions
have deliberately been weakened by the withholding of funds for the Supreme Audit Institution
(Cour des comptes), the Inspector General of Finance, and the Procurement Regulation Authority,
ARMP (Autorité de Régulation des Marchés Publics). The role of public accountants has been
progressively reduced in favor of much looser forms of financial reporting. The National Assembly
has always been adequately funded, but has shown very little interest in performing its financial
50 The Democratic Republic of Congo Economic Update report, 2016. World Bank.
39
oversight role. Part of the explanation for this weakness lies in the capacity constraints of
Parliament. However, there is little incentive on the part of parliamentarians to hold the executive
accountable when the parliament is dominated by political parties aligned with the ruling majority
(majorité présidentielle).
101. Progress on administrative reforms was limited and vulnerable due to lack of
ownership and donors’ limited understanding of local realities. The professional assessment
of specialists working on administrative reforms in the DRC is that the structures targeted for
reform are usually very weak and disorganized. Therefore, reforming them requires a lot of
patience and hands-on support as well as an understanding of local realities (Saint-Martin 2008,
Marchal et al. 2007, Iyaka 2010). Saint-Martin argues that administrative reforms cannot be
limited to the setting up of legal frameworks, redrafting rules and regulations, and designing new
organizational charts and work plans. He stresses that, to be effective, reforms need to confront
prevailing local values and culture, and revolutionize mentalities.
Box 3.1 Political Developments in the DRC since 2013
In December 2013, President Kabila signed ordinance 13/078, which governs the creation, organization, and
operation of a series of national consultations. Most political leaders and parties received the initiative well, except
for the main opposition leader, Etienne Tchisekedi. Hence, more than a year after the national consultations, the
president announced the formation of a new government composed of 42 ministers, of which seven came from the
opposition. Prime Minister Augustin Matata Ponyo Mapon was confirmed as the head of the new government.
In early 2015, the opposition interpreted the passing of a law that called for a nationwide census before any new
elections as an attempt to delay the elections due in 2016. Street protests erupted in Kinshasa and elsewhere until
the law was altered. The opposition also demanded a new election timetable. On September 14, 2015, a group of
seven leaders from the opposition parties represented in the government addressed a letter to President Kabila
asking him to state clearly that he would respect the constitution of 2006. This was followed by a reshuffling of the
government.
The second and last term of President Kabila expired in December 2016, and elections were delayed with a
commitment to hold them by the end of 2017. Conflict around elections has led to internal tensions and the delay
of key reforms. Demonstrations erupted on September 19, 2016, and, in parallel, the DRC’s relationship with
several countries deteriorated. The European Union and the United States have initiated financial sanctions against
high-ranking government and army officials.
On December 31, 2016, discussions facilitated by Catholic bishops led to a political agreement. Earlier in October
2016, President Kabila nominated a new prime minister (PM), following a deal with a portion of the opposition.
The new PM, Samy Badibanga, a former member of the Union for Democracy and Social Progress (UDPS), the
main opposition group, has formed a 67- member government. On April 5, 2017, President Joseph Kabila, in his
address to the lower and upper houses of parliament announced that he would appoint a new PM as part of the
December 2016 political agreement. He then appointed Bruno Tshibala as new PM, a member of UDPS who does
not recognize the authority over the party of Felix Tshisekedi (the son of the late Etienne Tshisekedi). Tshibala
announced his cabinet on May 9, 2017. It has 53 ministers, of whom only three are new and from the opposition.
In November 2017, the authorities published an electoral calendar setting the date of the elections for December
23, 2018. The main opposition coalition led by Félix Tshisekedi has rejected the calendar and continues to contest
the legitimacy of the government.
Source: World Bank staff, based on latest development as of end 2017.
40
Chapter 4. The Challenge: Making Growth Sustainable and
Inclusive
102. The main question here is why the economic performance of 2010–15 did not translate
into improvements in the lives of most people. The policies the government had pursued during
this period led to macroeconomic stabilization. However, there is an opinion that growth over this
same period has not been inclusive. This chapter therefore attempts to highlight the following: (1)
the high growth experienced in the past few years was the result of a convergence toward average
incomes in the world economy (the catch-up effect) rather than a dynamic growth path that could
have led to substantial poverty reduction; (2) the link between growth and poverty is weak in DRC;
(3) the sources of growth do not generally lend themselves to inclusiveness, and policy choices
and mismanagement in extractives reinforced this tendency; (4) there are several binding
constraints to sustainable inclusive growth; and (5) the policies that have been implemented are
primarily aimed at stabilizing the economy rather than making growth inclusive.
4.1. Growth: Catching Up Without Inclusiveness
103. The high growth rates the country has enjoyed in recent years mirror a catching-up
effect. The catching-up effect emanated from a commodity price super cycle (good luck), the
implementation of sound economic policies and structural reforms (good policies), and massive
foreign aid (good luck).51 Before the authorities started addressing extreme economic and social
conditions in 2001, four decades had been lost to economic mismanagement, conflict, and a lack
of overall governance. The government’s Enhanced Interim Program (June 2001–March 2002),
produced significant results, namely, it brought hyperinflation to a halt, strengthened public
finances, and laid the groundwork for the resumption of growth. In 2002, for the first time in 13
years, the economy grew by 2.9 percent, catching up from a low economic base (nominal GDP of
about US$ 7.4 billion in 2001 vs US$ 35.7 billion in 2016). Yet per capita GDP in 2016 was less
than 40 percent of the level in 1970 (US$ 387 vs US$1016 in constant dollars of 2010).52
104. Massive flows of resources were used for peacebuilding, reconstructing the country’s
infrastructure, and revitalizing industrial mining. The investments in infrastructure projects
and the mining sector have been the driving forces behind growth, with growth rates nearing
double digits. Large mining industries that closed during the 1980s and 1990s are now back in
operation, although ASM, largely informal, continues to produce53 and to employ around 1 million
people (4.0 percent of the 15–64 age-group), including women. The recovery in large-scale mining
activities is attributable to the establishment of joint ventures between state-owned enterprises
(SOEs), especially the mining giant Gécamines, and foreign-owned companies. The expansion of
51 Following progress made in implementing sound economic policies and structural reforms supported by the World
Bank and the IMF during the last CAS (Country Assistance Strategy) process (now the CPF), the DRC reached
completion of the HIPC Initiative and, in July 2010, received a debt cancellation of US$ 12.3 billion, the largest in
the history of the HIPC Initiative. 52 Source: WDI database. 53 The revision of the national accounts revealed that informal mining activity, which is essentially ASM, generates
over 50 percent of the value added in the extractive sector (INS 2013).
41
a large mine in 2010 (Tenke Fungurume Mining, then a joint venture between Freeport McMoran
and Gécamines) boosted mining growth by 25 percent.
105. The country’s economic growth since 2002 has not been matched in employment
generation and revenue sharing among the poor and the most vulnerable. Periods following
the end of a social conflict present economic opportunities, As Collier and Hoeffler point out: “The
economic circumstances of post conflict societies are distinctive in several respects … Typically,
opportunities for recovery enable a phase when growth is supranormal. The need to restore
infrastructure, juxtaposed against the collapse of revenue, tend to make aid unusually
productive.”54 However, this type of growth is not usually complemented by great social progress
(Cerra and Saxena 2008) and this is demonstrated by the sluggish improvement in the social
development indicators of the DRC (see Chapter 5). Indeed, rapid catching-up seems to be
naturally noninclusive, and the benefits of growth to a larger population depend on the subsequent
sustainability and structural dynamism of the growth.
4.2. The Missing Link in the Growth-Poverty Nexus
106. Although improving, the country’s extractive sector contribution to inclusive growth
remains below potential. First, while ASM contributes to rural employment and livelihoods, the
development of highly capitalistic industrial mining does not create many jobs. Second, a large
part of revenues from extraction are either transferred abroad or captured by vested interests and
do not reach the poor and vulnerable. Third, the contribution of the sector to the government’s
budget is low given both exemptions, special treatments, special regimes, institutional
dysfunctions, and weak administrative capacity. As a result, the resources allocated to priority
infrastructure and social sectors are limited, especially considering the country’s huge
development challenges. Fourth, negative environmental and social externalities associated with
extractive projects pose important challenges to inclusive growth. Managing these externalities
requires further efforts to regulate extractive activities and empower citizens to play their oversight
and advocacy roles.
107. The rigidity of poverty, despite strong growth, relates to both the sources of growth
and the management of natural resources. The average poverty elasticity of GDP growth for
the past decade was only –0.27. Indeed, thanks to the development of industrial mining, the mining
sector accounted for more than half of the country’s growth until the end of the commodity super-
cycle in 2015. However, as already highlighted in Chapter 2, the development of mining had a
conflicting impact on employment and poverty. Industrial mining created jobs in some regions
(previous Katanga province), and ASM remained strong in the Kivus provinces and the eastern
part of Province Orientale. In contrast, the two previous Kasais provinces experienced massive
losses in ASM employment in parallel to increases in poverty rates.
108. Incomes of DRC nationals, both public and private, did not follow the strong pace of
GDP increase. Despite the strong contribution of mining to overall economic growth, the DRC
was unable to retain in the domestic economy a greater part of the income and wealth generated
by the mining activity. This is true for the income of ASM workers, whose number is on the decline
and who continue to be underpaid for a job performed in difficult conditions. This is also true for
54 2002, 2.

42
capital-intensive industrial mining, whose transfers of revenues to the public sector remain below
potential. Indeed, at the climax of the commodities cycle, factor income payments to the rest of
the world to remunerate foreign direct investments in extractives increased rapidly. This meant
that a large part of the value added generated in extractives did not benefit the DRC. Hence, while
the growth of GDP per capita averaged 4.2 percent in 2010–14, the growth of the per capita GNDI
averaged 2.7 percent only (see Annex C for details). Since GNDI is the resources counterpart of
the domestic aggregate demand, an increase in GNDI at a slower pace than GDP means that the
growth model benefited the population only partially in terms of better welfare and increase in
consumption.
109. The fact that growth from the mining sector has not translated into higher revenues
for the government partly explains the insufficient increase in GNDI. The DRC combines one
of the highest ratios of natural resource rents to GDP in the world (38 percent of GDP in 2014 and
ranks 7th) with one of the lowest ratios of domestic revenues to GDP (13.3 percent of GDP: 92th
out of 99 countries in 2014). The Treasury collected revenues estimated at about 13.6 percent of
GDP in 2015, of which the extractive industries accounted for only 3.1 percent of GDP and 22.8
percent of budget revenues. In sum, the sector’s contribution to revenue sharing remained below
the potential, hence depriving the public sector of resources it needs to increase its own capacity
and finance infrastructure and social spending to help reduce poverty.
4.3. The Binding Constraints to Inclusive and Sustainable Growth
110. Poor governance and weak institutions stand out as the first major constraints to
inclusive growth in the DRC.55 The experience of East Asian countries shows the intimate link
between governance and institution building and sustainable and poverty reducing growth. Table
4.1 compares the situation of the DRC in 2014 with the initial levels of development in countries
before their growth accelerated. The DRC scores better on political institutions and school
enrollments. This implies that the DRC’s education is in a relatively good position to sustain
growth if it manages to address other factors properly. This was also the case for political
institutions in 2014, but the situation there might have changed since. On all other dimensions,
such as economic institutions, governance, and cost of doing business, the DRC’s 2014 scores are
largely below those of comparator countries at the beginning of their growth spurts.
111. Corruption is an impeding factor in the DRC, and it needs to be addressed to create
an efficient environment. The DRC scored 1 compared with 3.4 for comparator countries, on a
scale of 0 (high corruption) to 6. Furthermore, in 2015, the country ranked 147th among 167
countries, scoring 22 on a scale of 0 (highly corrupt) to 100 (highly clean).56 In 2015, Malaysia,
one of the sustained growth countries, scored 85 and was ranked 8th among 167 countries.
Consistent with these findings, 75 percent of respondents in Transparency International’s 2011
55 Albassam 2013; Furubotn and Richter 2005; Kaufman and Kraay 2008; Mantzavinos 2001, present strong evidence
that good governance and strong institutions are important for sustainable, inclusive economic growth. Acemoglu and
Robinson (2012) examine why and how governance matters for economic development. Kaufmann and Kraay (2002)
argue that governance quality and economic growth are positively related. In their evaluation of WGIs from 1996 to
2002, they find that per capita incomes and the quality of governance are strongly positively correlated across countries
(Ibid, 1). 56 CPI database, Transparency International, London, http://www.transparency.org/research/cpi/overview.
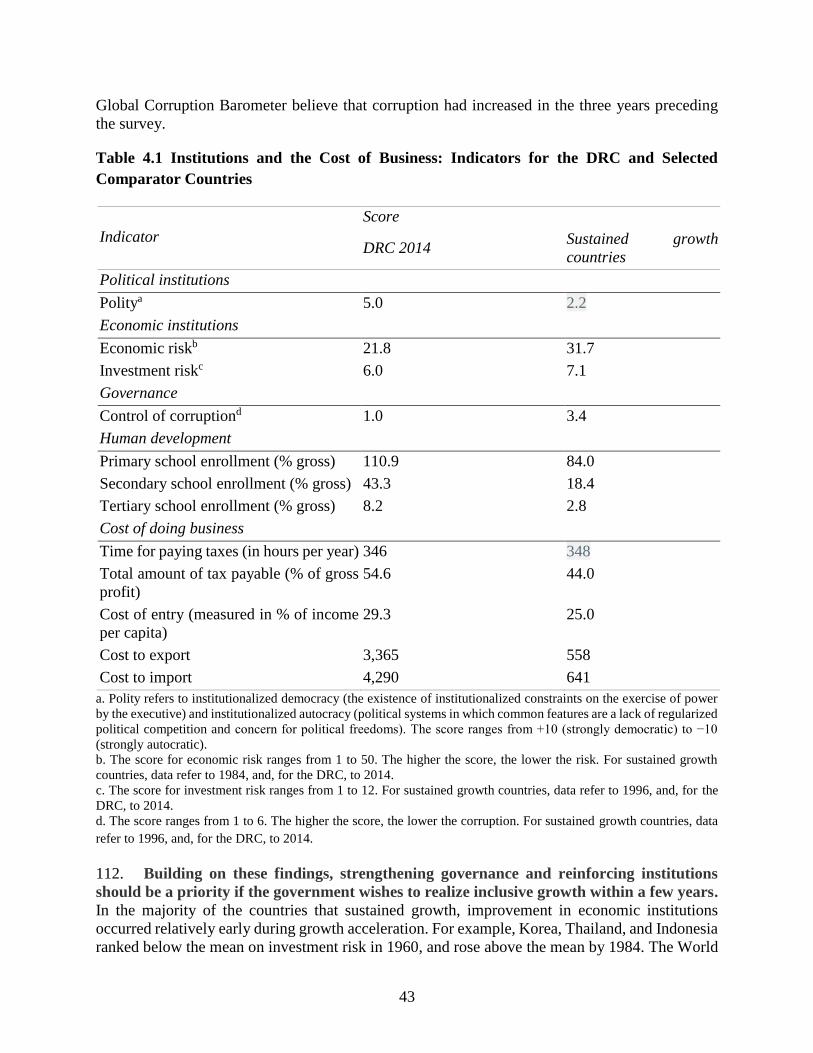
43
Global Corruption Barometer believe that corruption had increased in the three years preceding
the survey.
Table 4.1 Institutions and the Cost of Business: Indicators for the DRC and Selected
Comparator Countries
Indicator
Score
DRC 2014 Sustained growth
countries
Political institutions
Politya 5.0 2.2
Economic institutions
Economic riskb 21.8 31.7
Investment riskc 6.0 7.1
Governance
Control of corruptiond 1.0 3.4
Human development
Primary school enrollment (% gross) 110.9 84.0
Secondary school enrollment (% gross) 43.3 18.4
Tertiary school enrollment (% gross) 8.2 2.8
Cost of doing business
Time for paying taxes (in hours per year) 346 348
Total amount of tax payable (% of gross
profit)
54.6 44.0
Cost of entry (measured in % of income
per capita)
29.3 25.0
Cost to export 3,365 558
Cost to import 4,290 641
a. Polity refers to institutionalized democracy (the existence of institutionalized constraints on the exercise of power
by the executive) and institutionalized autocracy (political systems in which common features are a lack of regularized
political competition and concern for political freedoms). The score ranges from +10 (strongly democratic) to −10
(strongly autocratic).
b. The score for economic risk ranges from 1 to 50. The higher the score, the lower the risk. For sustained growth
countries, data refer to 1984, and, for the DRC, to 2014.
c. The score for investment risk ranges from 1 to 12. For sustained growth countries, data refer to 1996, and, for the
DRC, to 2014.
d. The score ranges from 1 to 6. The higher the score, the lower the corruption. For sustained growth countries, data
refer to 1996, and, for the DRC, to 2014.
112. Building on these findings, strengthening governance and reinforcing institutions
should be a priority if the government wishes to realize inclusive growth within a few years.
In the majority of the countries that sustained growth, improvement in economic institutions
occurred relatively early during growth acceleration. For example, Korea, Thailand, and Indonesia
ranked below the mean on investment risk in 1960, and rose above the mean by 1984. The World
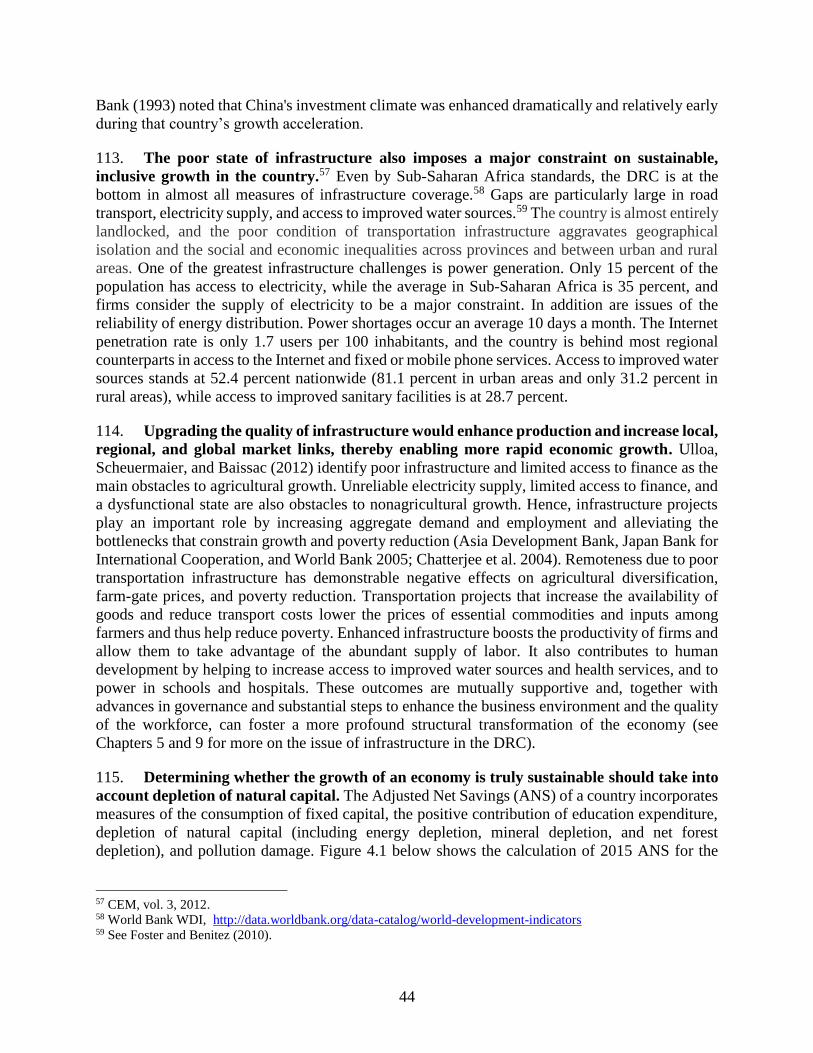
44
Bank (1993) noted that China's investment climate was enhanced dramatically and relatively early
during that country’s growth acceleration.
113. The poor state of infrastructure also imposes a major constraint on sustainable,
inclusive growth in the country.57 Even by Sub-Saharan Africa standards, the DRC is at the
bottom in almost all measures of infrastructure coverage.58 Gaps are particularly large in road
transport, electricity supply, and access to improved water sources.59 The country is almost entirely
landlocked, and the poor condition of transportation infrastructure aggravates geographical
isolation and the social and economic inequalities across provinces and between urban and rural
areas. One of the greatest infrastructure challenges is power generation. Only 15 percent of the
population has access to electricity, while the average in Sub-Saharan Africa is 35 percent, and
firms consider the supply of electricity to be a major constraint. In addition are issues of the
reliability of energy distribution. Power shortages occur an average 10 days a month. The Internet
penetration rate is only 1.7 users per 100 inhabitants, and the country is behind most regional
counterparts in access to the Internet and fixed or mobile phone services. Access to improved water
sources stands at 52.4 percent nationwide (81.1 percent in urban areas and only 31.2 percent in
rural areas), while access to improved sanitary facilities is at 28.7 percent.
114. Upgrading the quality of infrastructure would enhance production and increase local,
regional, and global market links, thereby enabling more rapid economic growth. Ulloa,
Scheuermaier, and Baissac (2012) identify poor infrastructure and limited access to finance as the
main obstacles to agricultural growth. Unreliable electricity supply, limited access to finance, and
a dysfunctional state are also obstacles to nonagricultural growth. Hence, infrastructure projects
play an important role by increasing aggregate demand and employment and alleviating the
bottlenecks that constrain growth and poverty reduction (Asia Development Bank, Japan Bank for
International Cooperation, and World Bank 2005; Chatterjee et al. 2004). Remoteness due to poor
transportation infrastructure has demonstrable negative effects on agricultural diversification,
farm-gate prices, and poverty reduction. Transportation projects that increase the availability of
goods and reduce transport costs lower the prices of essential commodities and inputs among
farmers and thus help reduce poverty. Enhanced infrastructure boosts the productivity of firms and
allow them to take advantage of the abundant supply of labor. It also contributes to human
development by helping to increase access to improved water sources and health services, and to
power in schools and hospitals. These outcomes are mutually supportive and, together with
advances in governance and substantial steps to enhance the business environment and the quality
of the workforce, can foster a more profound structural transformation of the economy (see
Chapters 5 and 9 for more on the issue of infrastructure in the DRC).
115. Determining whether the growth of an economy is truly sustainable should take into
account depletion of natural capital. The Adjusted Net Savings (ANS) of a country incorporates
measures of the consumption of fixed capital, the positive contribution of education expenditure,
depletion of natural capital (including energy depletion, mineral depletion, and net forest
depletion), and pollution damage. Figure 4.1 below shows the calculation of 2015 ANS for the
57 CEM, vol. 3, 2012. 58 World Bank WDI, http://data.worldbank.org/data-catalog/world-development-indicators 59 See Foster and Benitez (2010).
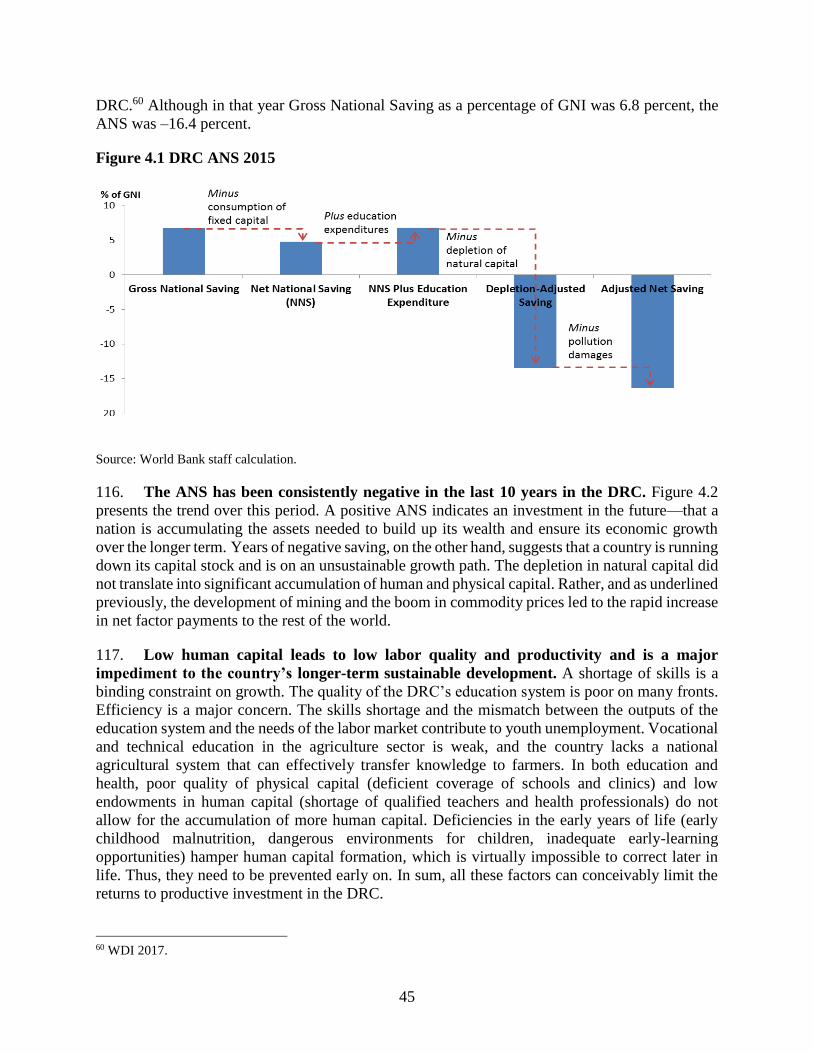
45
DRC.60 Although in that year Gross National Saving as a percentage of GNI was 6.8 percent, the
ANS was –16.4 percent.
Figure 4.1 DRC ANS 2015
Source: World Bank staff calculation.
116. The ANS has been consistently negative in the last 10 years in the DRC. Figure 4.2
presents the trend over this period. A positive ANS indicates an investment in the future—that a
nation is accumulating the assets needed to build up its wealth and ensure its economic growth
over the longer term. Years of negative saving, on the other hand, suggests that a country is running
down its capital stock and is on an unsustainable growth path. The depletion in natural capital did
not translate into significant accumulation of human and physical capital. Rather, and as underlined
previously, the development of mining and the boom in commodity prices led to the rapid increase
in net factor payments to the rest of the world.
117. Low human capital leads to low labor quality and productivity and is a major
impediment to the country’s longer-term sustainable development. A shortage of skills is a
binding constraint on growth. The quality of the DRC’s education system is poor on many fronts.
Efficiency is a major concern. The skills shortage and the mismatch between the outputs of the
education system and the needs of the labor market contribute to youth unemployment. Vocational
and technical education in the agriculture sector is weak, and the country lacks a national
agricultural system that can effectively transfer knowledge to farmers. In both education and
health, poor quality of physical capital (deficient coverage of schools and clinics) and low
endowments in human capital (shortage of qualified teachers and health professionals) do not
allow for the accumulation of more human capital. Deficiencies in the early years of life (early
childhood malnutrition, dangerous environments for children, inadequate early-learning
opportunities) hamper human capital formation, which is virtually impossible to correct later in
life. Thus, they need to be prevented early on. In sum, all these factors can conceivably limit the
returns to productive investment in the DRC.
60 WDI 2017.
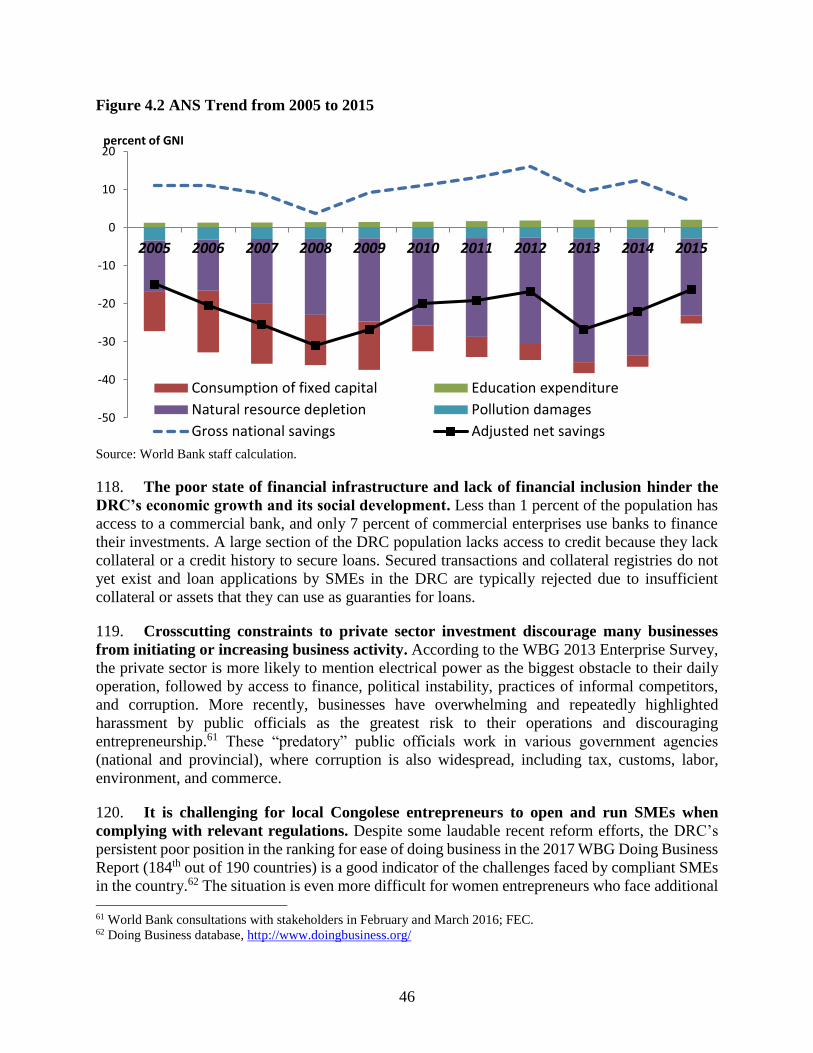
46
Figure 4.2 ANS Trend from 2005 to 2015
Source: World Bank staff calculation.
118. The poor state of financial infrastructure and lack of financial inclusion hinder the
DRC’s economic growth and its social development. Less than 1 percent of the population has
access to a commercial bank, and only 7 percent of commercial enterprises use banks to finance
their investments. A large section of the DRC population lacks access to credit because they lack
collateral or a credit history to secure loans. Secured transactions and collateral registries do not
yet exist and loan applications by SMEs in the DRC are typically rejected due to insufficient
collateral or assets that they can use as guaranties for loans.
119. Crosscutting constraints to private sector investment discourage many businesses
from initiating or increasing business activity. According to the WBG 2013 Enterprise Survey,
the private sector is more likely to mention electrical power as the biggest obstacle to their daily
operation, followed by access to finance, political instability, practices of informal competitors,
and corruption. More recently, businesses have overwhelming and repeatedly highlighted
harassment by public officials as the greatest risk to their operations and discouraging
entrepreneurship.61 These “predatory” public officials work in various government agencies
(national and provincial), where corruption is also widespread, including tax, customs, labor,
environment, and commerce.
120. It is challenging for local Congolese entrepreneurs to open and run SMEs when
complying with relevant regulations. Despite some laudable recent reform efforts, the DRC’s
persistent poor position in the ranking for ease of doing business in the 2017 WBG Doing Business
Report (184th out of 190 countries) is a good indicator of the challenges faced by compliant SMEs
in the country.62 The situation is even more difficult for women entrepreneurs who face additional 61 World Bank consultations with stakeholders in February and March 2016; FEC. 62 Doing Business database, http://www.doingbusiness.org/
-50
-40
-30
-20
-10
0
10
20
2005 2006 2007 2008 2009 2010 2011 2012 2013 2014 2015
percent of GNI
Consumption of fixed capital Education expenditure
Natural resource depletion Pollution damages
Gross national savings Adjusted net savings
47
hurdles.63 Furthermore, businesses in the DRC face various challenges in relation to starting a
business (96th); dealing with construction permits (114th); getting electricity (175th); registering
property (156th); getting credit (139th); protecting minority investors (162nd); paying taxes (177th);
trading across borders (188th); enforcing contracts (171st); and resolving insolvency (169th). Thus,
the country needs to make considerable efforts in order to achieve significant and impactful
improvements in all the areas measured by the report.
4.4. The Challenges of Making Public Policies Inclusive of Growth
121. Government policies can promote inclusive growth and address the low poverty
elasticity of growth. Public policies can foster inclusive growth if they help promote job creation
among skilled and unskilled workers and contribute to reducing poverty and inequality (Kireyev
2013). Furthermore, studies have found that inequality can limit the impact of economic growth
on poverty (Ravallion 2004). Inequality may also hinder growth because the potential of the less
fortunate is underused. Cross-country analyses show that inequality has negative impacts on
growth, particularly in developing countries (Barro 2000, 2008). Indicators to monitor and assess
the inclusiveness of growth include: (1) the number of jobs created per year; (2) the overall level
of social expenditure; (3) measures taken to increase incomes among the poor; and (4) the
development and implementation of social safety net programs.
122. Job creation remains low and insufficient in the DRC, which highlights that
employment has been less responsive to the growth trend. Of an estimated 9,000 graduates,
fewer than 100 (less than 1 percent) find employment corresponding to their abilities and skills.
The second Growth and Poverty Reduction Strategy Paper (PRSP-2), which covered 2012–16,
envisaged the creation of 900,000 jobs each year, but the target proved too ambitious and difficult
to achieve. According to World Bank estimates, the country needs to create two to four million
jobs every year to absorb new entrants into to the labor market and reduce poverty. The
government needs to commit to fostering youth employment if it wants to execute policies that
will create job opportunities for young people. The availability of productive and satisfying
employment opportunities for the youth will be critical to ensure social stability in the DRC.
123. The government undertook efforts to align public expenditure and poverty reduction,
but significant needs remain and require substantial resource mobilization. Cross-country
experience suggests that countries with relatively higher spending on human capital, health care,
pensions, and other aspects of the social safety net tend to enjoy growth that is more inclusive. The
DRC has allocated more budget resources to pro-poor expenditures,64 including for education and
health, and the government has initiated programs to promote access by the poor and vulnerable
to public services. The execution rates of pro-poor spending and public spending on education
doubled between 2007 and 2013. The increase in wages for teachers and a fee-free policy in
primary education enhanced the school enrollment and attendance of poor children. However, at
1.8 percent of GDP, domestic and aid-financed public spending on education was three times lower
than the Sub-Saharan African average. In health, domestic and aid-financed spending reached 2.1
percent of GDP in 2013, half the average of the least developed countries. For example, the DRC’s
63 Advancing Opportunities for Women-led SMEs in the DRC. World Bank, August 2016. 64 The pro-poor expenditure classification was introduced in 2003 and updated in 2005 to track the use of savings
generated through HIPC debt relief. The system allows for adequate tracking of budget allocations to priority sectors
because practically all expenditures pass through the regular budget execution process.
48
total health expenditure (from all sources including government, donors, the private sector, and
households) is only one-tenth of the Sub-Saharan African average.
124. Yet simply increasing government spending on education and health does not
guarantee better outcomes (Dreher, Nunnenkamp, and Thiele 2008, Filmer and Pritchett 1999,
World Bank 2003, and Filmer 2017). Research has shown that spending has more of an impact on
the poor (Bidani and Ravallion 1997) when it is done in a context of better overall governance
(Rajkumar and Swaroop 2008).65 “Strategically targeted investments—especially those that
establish a solid foundation of human capital on which to build further skills—and careful attention
to factors that enhance the effectiveness of spending are important for turning the additional
investments enabled by resource wealth into human development.”66
125. The DRC’s social protection system suffers from low and fragmented coverage and
is largely financed by external development partners. While existing social programs provide
some benefits, more volume and cohesiveness is needed to promote inclusive growth. The PRSP-
2 envisions the establishment of a comprehensive nationwide social protection system by 2025,
including social safety nets guaranteeing a minimum income, access to basic health care and
education, old-age pensions, food security, and maternal and child care. However, a World Bank-
supported safety net assessment conducted in 2014—the first ever in the country—estimated the
total funding for safety nets at about 0.7 percent of GDP, below the average of lower-income
countries in Africa. Personnel expenditure represented about 60 percent of the spending at the
Ministry of Social Affairs. Thus, the lack of spending on operating budgets (other than personnel)
and social transfers limits the impact and reduces the quality of public social assistance services.
The growing number of people living with disabilities and so-called street children in large cities,
such as Kinshasa, is a visible testimony to the deteriorating social situation in the country.
According to a study conducted by Caritas Congo, street children in Kinshasa were estimated at
around 30,000 boys and girls. Finally, the gender gap remains wide despite efforts by the
government, and equal rights and opportunities for women remain elusive (see Chapter 5).
126. The weakness of revenue mobilization in the DRC means there are no income
redistribution schemes to benefit the most vulnerable groups. The poorest households as well
as specific vulnerable groups (children living in difficult circumstances, people living with
disabilities, displaced populations, women, the elderly, indigenous people) do not receive the
support needed to pull them out of poverty. The DRC does not have any large-scale income
redistribution systems (such as cash transfer programs) that can enable the redistribution of the
benefits of growth and reduce poverty.
65 Rajkumar, Andrew Sunil, and Vinaya Swaroop. 2008. “Public Spending and Outcomes: Does Governance Matter?”
Journal of Development Economics 86 (2008): 96–111. This paper studies the links between public spending,
governance, and outcomes. It examines the role of governance—measured by the level of corruption and the quality
of bureaucracy—in determining the efficacy of public spending in improving human development. The authors show
that the differences in the efficacy of public spending can be largely explained by the quality of governance. Public
health spending lowers child mortality rates more in countries with good governance. Similarly, public spending on
primary education becomes more effective in increasing primary education attainment in countries with good
governance. Public spending has virtually no impact on health and education outcomes in poorly governed countries. 66 de la Brière, Bénédicte, and Deon Filmer, Dena Ringold, Dominic Rohner, Karelle Samuda, and Anastasiya
Denisova, 2017. From Mines and Wells to Well-Built Minds: Turning Sub-Saharan Africa’s Natural Resource Wealth
into Human Capital. Directions in Development. Human Development, World Bank Group (May 2017): 11.

49
Chapter 5. Physical, Natural, and Human Capital
127. The DRC has large physical and human capital gaps and has not achieved any of its
MDGs. Rehabilitation and reconstruction efforts are under way in most sectors. However,
challenges persist in transportation, power, water supply and sanitation, and telecommunications,
etc. The country ranked 186th of 187 countries on the human development index before 2015, and
many challenges persist at several levels of Human Development, including in education and
health. The combination of low physical and human capital stocks means that the country is unable
to harness its natural resources endowments for long-term sustainable development. Thus, while
agriculture employs 62 percent of the working age population, it remains essentially a subsistence
activity, which is exposed to a changing climate, and contributing to deforestation. Oil and mineral
price cycles call for diversification, local processing, better governance, and more efficiency.
5.1. Physical Capital: Progresses and Challenges
128. Decades of political instability have left most infrastructure and institutions in
disrepair. SOEs still play a dominant role in the economy and struggle to improve performance
and implement reform. Rehabilitation and reconstruction efforts are under way across most
sectors. Dealing with rapid urbanization and engaging in the digital economy have emerged as
priorities. This section reviews current challenges and opportunities in the transport, power, water
supply and sanitation, and telecommunication sectors, as well as land and urban management.
5.1.1. Transport
129. The transport system was initially designed as an integrated multimodal network of
roads, rivers, and rail connecting all parts of the country. The government policy and
regulatory functions have been eroding since the 1970s, and the transport system has degraded.
Less than 5 percent of the 58,000-kilometer national road network is paved, and the density of this
network is only 25 kilometers per 1,000 square kilometers, or 0.9 kilometers per 1,000 inhabitants,
against the SSA average of 204 kilometers and 3.4 kilometers, respectively. Only four of the 26
new provincial capitals can be reached by road from the national capital. With a network of 3,500
kilometers in the south and 400 kilometers in the west, railways are in a state of disrepair owing
to dilapidated infrastructure and an historically failed management culture. At over 25,000
navigable kilometers, waterways constitute a potential backbone of the transport system, but
institutional barriers prevent the development of a waterway transport sector. Air transport
infrastructure became dilapidated over the years and the DRC’s airspace poses high air-navigation
risks.
130. The country’s poor performance in transport hinders business and is one of the key
causes of persistent poverty. The country ranked 159th among 160 countries on the logistics
performance index in 2014. Only Somalia fared worse. The rate to haul 1 ton of goods over
1kilometer averages US$ 0.20 in the DRC against only US$ 0.05 in southern Africa. Container
dwell time in the Port of Matadi averages 25 days, five times the regional average. Mobility and
accessibility are major issues in both urban and rural areas. More than 60 percent of the rural
population lacks acceptable access, defined as living within a 2-kilometer radius of an all-weather
road. Major problems of urban mobility are encountered in Kinshasa, where 80 percent of trips are
50
made by foot, which sharply cuts access to job opportunities. In addition, Kinshasa has lower
paved road density than other cities in the sub-region. While Addis Ababa and Dar es Salaam have
more than 120 meters of paved road per 1,000 inhabitants, Kinshasa has only 54 meters (against
318 meters in Sub-Saharan Africa and 1,000 meters in other developing countries).
131. The country has a particularly poor track record in transportation safety, and the
challenges in raising the transport system to acceptable standards are daunting. Safety issues
are overwhelming in waterway navigation, road traffic, and air transport. All airlines based in the
country are on a European Union blacklist, and the civil aviation system meets only 26 percent of
recommended international safety standards and practices.67 The financing required to close the
most pressing infrastructure gaps, and catch up with other developing countries, is estimated at
US$ 1.4 billion a year over 10 years. The obstacles in rebuilding institutional and technical
capacity are even more overwhelming. Decades of mismanagement have led to an aging workforce
in the public sector and in the various SOEs in transport. There are practically no younger cadres
with sufficient qualifications, especially in specialized fields such as civil aviation, railways,
waterways, and urban transport.
132. Governance problems and corruption continue to hamper development prospects in
the transport sector. Corruption of several state officials in the transport sector is taking a heavy
toll on public capacity to deliver key services. At the higher level, corruption has been aggravated
by the various conflicts and political transitions, during which the lack of a strong executive
prevented the imposition of effective sanctions. At the lower level, the problem is compounded by
the low level and episodes of irregular payment of government employees’ salaries (see Annex
H).
133. The political economy behind the operations and reforms of the transport sector is
related to the different interest groups behind each SOE. These groups vary depending on: (i)
the geographical location of SOE activities, thus where the money and employment are generated
and the province(s) most impacted (former Katanga province for SNCC [Société Nationale des
Chemins de fer du Congo]; Kongo Central for CVM [Congolaise des Voies Maritimes]; and SCTP
[Société Commerciale des Transports et des Ports], formerly ONATRA); (ii) the power to corrupt
or attract interest groups based on the level of revenues generated by each SOE (low revenues of
the river transportation SOE Régies des Voies Fluviales do not generate much interest, whereas
SCTP’s higher revenues do); (iii) the cross linkages with other revenue-generating industries
(mining for railways, freight forwarding, and import/export management and taxation for ports
and airports); (iv) the power of patronage associated with the state’s control of SOEs, which have
average salaries ranging from US$ 4,000 to US$ 8,000/year/employee (US$ 15,000 and more for
high-level positions) compared with less than US$ 1,500 for regular government employees; (v)
the accountability for SOE results at oversight ministries and their management; and (vi) the power
of each SOE (a strike at the Port of Matadi managed by SCTP can paralyze Kinshasa’s economic
activity).
134. Resistance to reform is accompanied by attempts by some staff members of several
agencies to extract money from private-sector operators. This practice happens often without
67 Audit of the International Civil Aviation Organization, https://www.icao.int/safety/iStars/Pages/API-Data-
Service.aspx.
51
providing any type of services in return. Outdated laws and regulations are used to create rent-
seeking opportunities. For instance, private-sector river barge operators pay about 48 different fees
and taxes to numerous agencies before they can start a voyage upstream (this is down from more
than 70 in 2014). They must also pay “tolls” along the river to various civilian and/or military
authorities. The positioning of higher authorities towards this behavior is variable, depending on
the institutions and the persons in charge. There are even some transport-sector agencies that
execute no real function at all (for example, the Congolaise des Voies Maritimes), but still have
the right to charge for services, which are no longer delivered.
5.1.2. Power
135. The electricity access rate is 15.2 percent, which is far below the Sub-Saharan African
average of 35 percent, and significant disparities exist between urban and rural areas. In
rural areas, access rates reach only 1 percent, while they reach up to 35 percent in urban areas. The
few households and businesses that are connected to the grid experience power outages on average
of more than three hours each day for more than 180 days a year. The country is currently a net
electricity importer, compounding the financial constraints since firms are forced to rely on
expensive backup generators.
136. With potential capacity of 100 gigawatts, hydropower is the mainstay of the country’s
energy sector. It has the potential to yield vast and transformative returns in economic
development for the country and for the continent. However, although it is abundant, resilient to
seasonality, cheap, and clean, only 2.5 percent of the hydropower potential is being exploited. In
addition, the national electricity company, SNEL (Société nationale d’électricité) dominates the
sector and faces significant institutional, regulatory, and technical issues. These include: (1)
inefficient institutions and governance issues characterized by the absence of strategic planning
and investment, and pervasive corruption; (2) substantial losses due to tariffs below cost-recovery
in urban areas and in sectors such as mining, and to low or inexistent collection; (3) low access
rate and poor quality of supply; and (4) adverse impact on economic development since, for
example, mining companies are increasingly facing the challenge of the bad quality of the
electricity supply.
137. Households rely heavily on biomass and wood, which provide about 80 percent of
household cooking energy in Kinshasa and likely more in rural areas. In 2015, solid biomass
covered more than 90 percent of household energy needs (mostly for cooking, using appliances
with about a 10 percent energy efficiency). This exacerbates the country’s deforestation at a rate
of 350,000 hectares a year (0.3 percent of carbon stocks), with hotspots around large cities. Also,
because of the low quality of the cooking appliances and installations, respiratory disease and
premature death, mainly among women and children, are frequent.
5.1.3. Water Supply and Sanitation
138. The public water utility, Regideso, is the most important supplier in urban areas, but
its performance declined between 1990 and 2009. Regideso serves 97 urban centers, though 75
percent of revenues are concentrated in the three cities of Kinshasa, Lubumbashi, and Matadi.
After 1990, Regideso suffered from the effects of war, lack of investment and maintenance, and
the suspension of aid. As a result, water supply coverage in urban areas fell significantly and
52
unaccounted-for-water rose to 40 percent of the utility’s provision. A reform program failed to
restore Regideso’s financial viability. First, uncontrolled increases in salaries by up to 30 percent
offset the impact of the staff retrenchment plan of 2010 that led to a reduction in the number of
staff by 450 (out of 4,600). Second, since the 2012 settlement of public arrears on water bills, the
government paid less than 10 percent of its water consumption annually. The public arrears
amounted to around US$ 87 million in 2016 (three years of public water bills). Water quality for
human consumption is an issue, and there is a risk of water pollution by the mining sector and
large cities.
139. Sanitation is one of the lowest performing sectors in the DRC. The sanitation sector
lacks political prioritization and an adequate legal and institutional framework. Furthermore, it
suffers from weaknesses in basic infrastructure and inadequate financing. As a result, urban
sanitation is a major, unaddressed problem in the country. Even optimistic estimates show the
urban access rate for improved sanitation declining since 2000, and it was a mere 28.5 percent in
2015.68 There is currently no public piped sewer system of scale in any city in the DRC, and there
are no safe disposal sites for fecal sludge from latrines. This is nothing less than a public health
crisis, reflected in high rates of diarrhea and malnutrition.
140. Institutional reform in the water and sanitation sector are hampered by more general
constraints associated with state fragility and poor governance (see Annex H). State fragility
and governance issues are key factors in explaining low performance, capacity gaps, as well as the
procurement risks and large overhead costs in the sector. Thus, the overarching issues facing the
water and sanitation sector are institutional fragmentation, capacity gaps, especially at
decentralized level, service and funding biases, and poor governance. These collectively
undermine the ability of the sector to cope with rapid socioeconomic and demographic change.
141. In rural areas, the institutional framework for water supply services lacks
organizational clarity and sanitation remains a challenge. Only 31.2 percent of the population
has access to safe water, and the majority of households in towns, villages, and the periphery of
large cities are without water services. Most public investments are assigned to urban areas, and
most interventions in rural areas are supported by humanitarian agencies with limited state support.
Many actors are engaged in the development of community-based water systems that are important
in supplying safe water in rural areas. However, these actors lack the capacity to monitor and
coordinate their interventions, and state agencies have limited knowledge and involvement in
autonomous water systems. Regarding sanitation, the government implemented the Healthy
Village Program (Programme Village Assaini) to reduce morbidity and mortality associated with
waterborne diseases and the lack of basic sanitation. However, open defecation is still a common
practice.
5.1.4. Telecommunications
142. Telecommunications represent a growing share of GDP, and mobile phone service
has been a success story. In 2015, the estimated revenue of the four main private mobile operators
grew to US$ 2 billion, representing 5.3 percent of GDP, up from 3.6 percent in 2012 (but less than
Senegal and Cote d’Ivoire with 11 and 6 percent, respectively). Compared with other Sub-Saharan
68 WHO/UNICEF Joint Monitoring Programme (JMP) for Water Supply and Sanitation, figures for 2015.
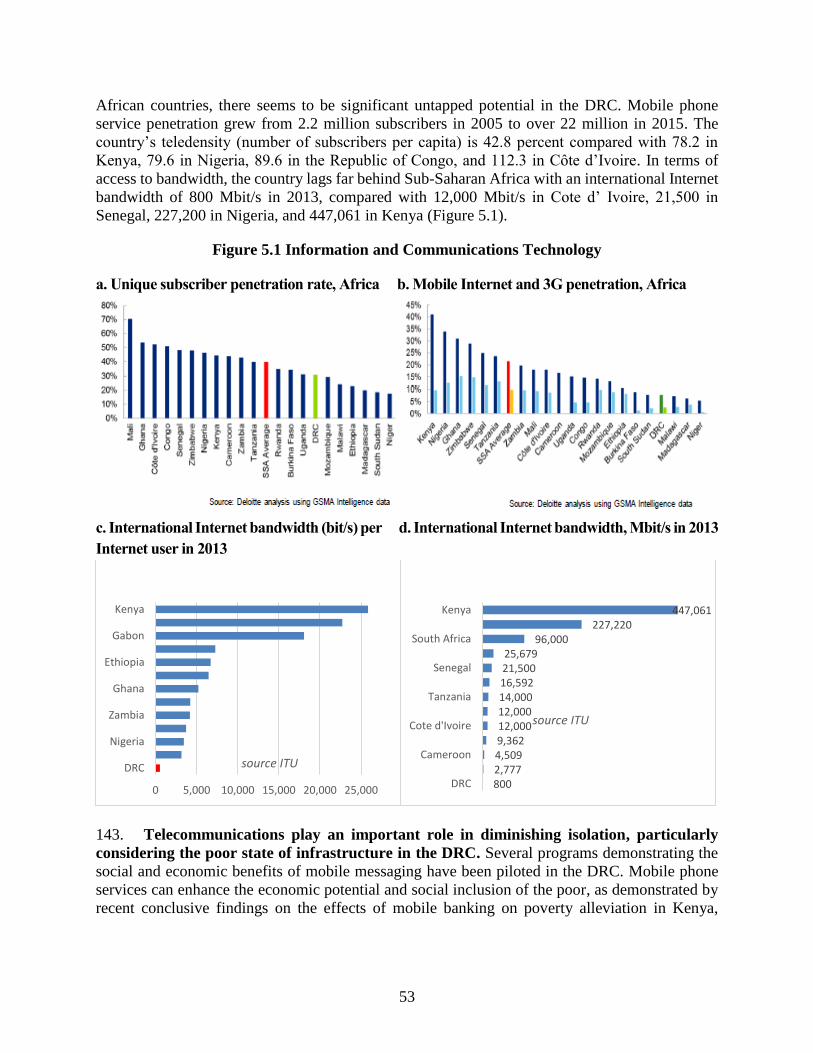
53
African countries, there seems to be significant untapped potential in the DRC. Mobile phone
service penetration grew from 2.2 million subscribers in 2005 to over 22 million in 2015. The
country’s teledensity (number of subscribers per capita) is 42.8 percent compared with 78.2 in
Kenya, 79.6 in Nigeria, 89.6 in the Republic of Congo, and 112.3 in Côte d’Ivoire. In terms of
access to bandwidth, the country lags far behind Sub-Saharan Africa with an international Internet
bandwidth of 800 Mbit/s in 2013, compared with 12,000 Mbit/s in Cote d’ Ivoire, 21,500 in
Senegal, 227,200 in Nigeria, and 447,061 in Kenya (Figure 5.1).
Figure 5.1 Information and Communications Technology
a. Unique subscriber penetration rate, Africa b. Mobile Internet and 3G penetration, Africa
c. International Internet bandwidth (bit/s) per d. International Internet bandwidth, Mbit/s in 2013
Internet user in 2013
143. Telecommunications play an important role in diminishing isolation, particularly
considering the poor state of infrastructure in the DRC. Several programs demonstrating the
social and economic benefits of mobile messaging have been piloted in the DRC. Mobile phone
services can enhance the economic potential and social inclusion of the poor, as demonstrated by
recent conclusive findings on the effects of mobile banking on poverty alleviation in Kenya,
0 5,000 10,000 15,000 20,000 25,000
DRC
Nigeria
Zambia
Ghana
Ethiopia
Gabon
Kenya
source ITU
800 2,777 4,509 9,362 12,000 12,000 14,000 16,592 21,500 25,679
96,000 227,220
447,061
DRC
Cameroon
Cote d'Ivoire
Tanzania
Senegal
South Africa
Kenya
source ITU
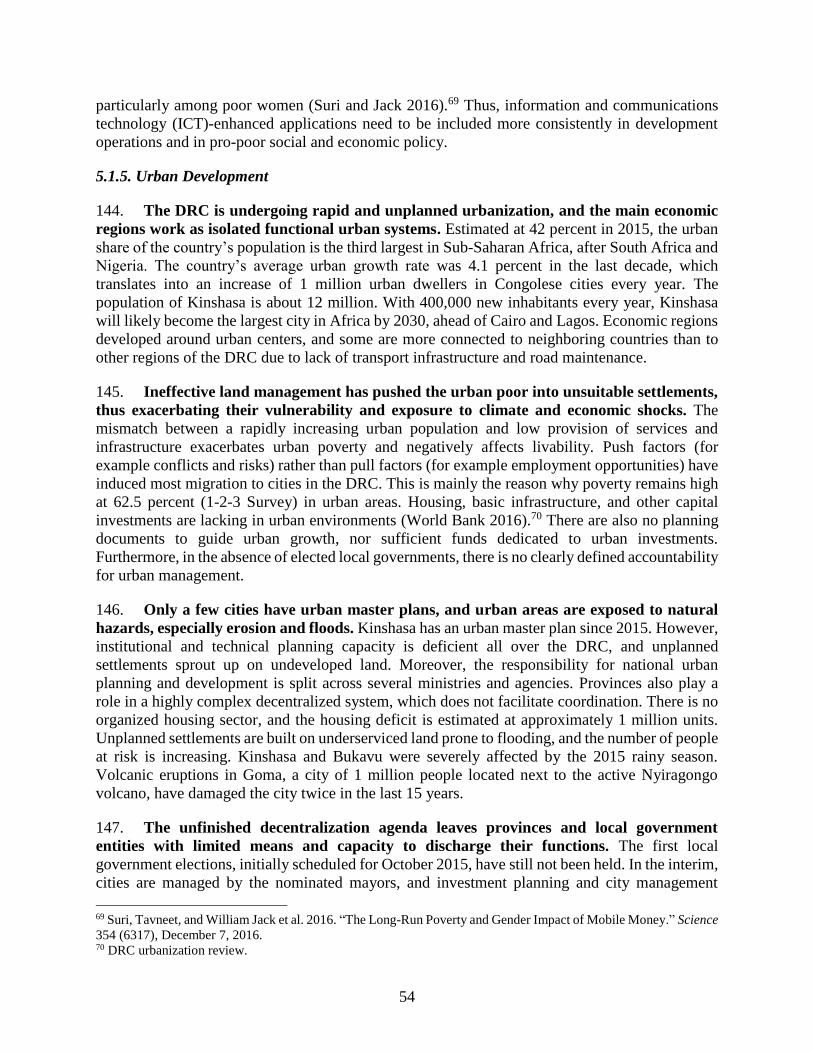
54
particularly among poor women (Suri and Jack 2016).69 Thus, information and communications
technology (ICT)-enhanced applications need to be included more consistently in development
operations and in pro-poor social and economic policy.
5.1.5. Urban Development
144. The DRC is undergoing rapid and unplanned urbanization, and the main economic
regions work as isolated functional urban systems. Estimated at 42 percent in 2015, the urban
share of the country’s population is the third largest in Sub-Saharan Africa, after South Africa and
Nigeria. The country’s average urban growth rate was 4.1 percent in the last decade, which
translates into an increase of 1 million urban dwellers in Congolese cities every year. The
population of Kinshasa is about 12 million. With 400,000 new inhabitants every year, Kinshasa
will likely become the largest city in Africa by 2030, ahead of Cairo and Lagos. Economic regions
developed around urban centers, and some are more connected to neighboring countries than to
other regions of the DRC due to lack of transport infrastructure and road maintenance.
145. Ineffective land management has pushed the urban poor into unsuitable settlements,
thus exacerbating their vulnerability and exposure to climate and economic shocks. The
mismatch between a rapidly increasing urban population and low provision of services and
infrastructure exacerbates urban poverty and negatively affects livability. Push factors (for
example conflicts and risks) rather than pull factors (for example employment opportunities) have
induced most migration to cities in the DRC. This is mainly the reason why poverty remains high
at 62.5 percent (1-2-3 Survey) in urban areas. Housing, basic infrastructure, and other capital
investments are lacking in urban environments (World Bank 2016).70 There are also no planning
documents to guide urban growth, nor sufficient funds dedicated to urban investments.
Furthermore, in the absence of elected local governments, there is no clearly defined accountability
for urban management.
146. Only a few cities have urban master plans, and urban areas are exposed to natural
hazards, especially erosion and floods. Kinshasa has an urban master plan since 2015. However,
institutional and technical planning capacity is deficient all over the DRC, and unplanned
settlements sprout up on undeveloped land. Moreover, the responsibility for national urban
planning and development is split across several ministries and agencies. Provinces also play a
role in a highly complex decentralized system, which does not facilitate coordination. There is no
organized housing sector, and the housing deficit is estimated at approximately 1 million units.
Unplanned settlements are built on underserviced land prone to flooding, and the number of people
at risk is increasing. Kinshasa and Bukavu were severely affected by the 2015 rainy season.
Volcanic eruptions in Goma, a city of 1 million people located next to the active Nyiragongo
volcano, have damaged the city twice in the last 15 years.
147. The unfinished decentralization agenda leaves provinces and local government
entities with limited means and capacity to discharge their functions. The first local
government elections, initially scheduled for October 2015, have still not been held. In the interim,
cities are managed by the nominated mayors, and investment planning and city management
69 Suri, Tavneet, and William Jack et al. 2016. “The Long-Run Poverty and Gender Impact of Mobile Money.” Science
354 (6317), December 7, 2016. 70 DRC urbanization review.
55
continue to be carried out from Kinshasa or by provincial governors. In general, cities operate
through personnel placed by the provincial governor or contracted employees. Even larger cities
with populations of over half a million typically do not have more than 75 staff. They have limited
budgets because of irregular transfers from the central government, limited capacity for local tax
collection, and inadequate financial management systems. City budgets are typically around US$
1.00–3.00 per capita, which is insufficient to run basic services.
5.1.6. Land Administration
148. Land administration is inefficient and cumbersome, and insecure land rights affect
livelihoods, and hamper urban planning and investment in agriculture and other sectors.
First, the tenure system is dual (statutory and customary) and is covered by overlapping laws. The
allocation of land use rights by customary authorities is the most widespread, though it is not
formally recognized.71 Second, the capacity of land administration authorities is weak, and there
are limited formal land rights because of unreliable information processing or data storage. This
leads to conflicting land claims that create the potential for social conflict and violence, cause
investment uncertainty, and disrupt business. Furthermore, women are largely excluded from the
process of formal land claims. Third, local communities in general, and indigenous people in
particular, are the most marginalized in regard to land claims in rural areas. Fourth, the persisting
violence in post-conflict areas in the east, and in other parts of the country, is mainly related to
land disputes. Indeed, competition over land is tied to community identities and a sense of social
cohesion, and has been a recruitment tool for armed groups. Fifth, separate sectoral laws, each
with their own jurisdiction over certain land uses, currently govern the management of the state’s
land property, and several ministries have corresponding land allocation plans, often creating
overlaps that need to be resolved.
5.2. Natural Capital: Dealing with Abundance
149. The DRC is endowed with exceptional mineral, land, water, and forest resources.
Although often mismanaged, these resources do sustain the livelihoods of millions of poor people
and have the potential for generating better jobs and income if they are managed effectively and
sustainably. Agriculture employs 62 percent of the working age population (1-2-3 Survey) and
mining around 4 percent (mainly in ASM). Oil and mineral price cycles call for diversification,
local processing, better governance, and more efficiency. The country is exposed to a changing
climate, especially in agriculture, while forests may contribute to carbon storage on a global scale.
5.2.1. Oil and Gas
150. The country holds considerable reserves of crude oil and methane that could be
utilized for power generation or other industries. With revenues of US$ 211 million in 2015,
the oil sector accounts for 4 percent of budget revenues, and 18 percent of the extractive sector’s
contribution to budget revenues. Production is essentially off-shore, but additional crude oil
reserves in the Central Basin and the Albertine Graben have a development potential that could
71 The central administration relies on a national framework that is difficult to apply. Indeed, land rights administration
is regulated by various laws and other texts that may at times overlap or even contradict each other and be applied by
different parts of the administration, such as land laws, agricultural laws, hydrocarbon and mining laws, and
environmental laws.
56
lead to a tenfold increase in production. However, one important element required to unlock this
potential is the modernization of the legislative framework to attract foreign investment. The
president approved the new hydrocarbon code in July 2015. Lake Kivu has gas reserves estimated
at 60 billion cubic meters, which constitutes an economic potential if extracted properly. Indeed,
the methane gas could generate as much as 1,000 megawatts of electricity. A pilot project on the
Rwandan side of the lake to use the methane to generate 25 megawatts of power is under
development. Another source of electricity generation is offshore gas flaring. The associated
natural gas flared in Muanda have the potential to supply close to 150 megawatts of power.
151. There are multiple signs of opacity and lack of transparency in the sector. Indeed,
although links to oil contracts are published on the website of the sector ministry, these links are
not active and do not provide any information. It is not clear if this is due to a technical glitch, but
this has been the case for several months and as of the completion of the report the situation was
unchanged. In addition, companies provide statistics showing that production has remained at an
average of 25,000 barrels a day for many years with very little variations, which seems rather
unusual. Further details on production statistics do not seem accessible.
5.2.2. Mining
152. The country has exceptional geology in terms of diversity of minerals and their
accessibility. The DRC is very rich in a variety of minerals, including copper, cobalt, zinc,
diamond, gold, and rare earths. Subterranean deposits for diamonds, copper, cobalt, and gold are
among the richest in the world, hence attracting significant foreign industrial investment. At the
same time, sub-surface and near-surface deposits of similar minerals are accessible to artisanal and
small-scale miners, making the informal extraction of minerals easy for rural populations. In this
way, the mining sector in particular offers inclusive growth opportunities for the country.
153. Whereas overall GDP growth was 7.5 percent on average in 2010–15, growth in
extractives was 19.6 percent over the same period. The mining sector suffered a major decline
due to the global financial crisis of 2008–09, but has rebounded strongly in a short amount of time,
hence demonstrating the attractiveness of the sector. However, the DRC did not fully benefit from
the 2010–14 mining boom due to various policy, administrative, and institutional constraints and
dysfunctions. Starting late 2015, declining commodity demand and prices, especially for copper,
contributed to an overall GDP slowdown in 2015 and 2016. Although the overall GDP slowdown
is likely to have implications on local economies who have benefited from extractive activities,
quantifying these implications remains rather sparse and difficult.
154. Aware of the need to improve benefits from extractive activities, the government has
moved in two directions on policy reform in early 2017. First, the government prepared a new
national mining policy that calls for more benefit-sharing at the local level through subsidiary
business development and local participation in mining economy supply chains. Second, the
government prepared the new National Strategy on ASM, which recognizes the importance of this
sub-sector to rural employment and livelihoods and places a priority on formalization of the current
largely informal sector. These policy efforts are good moves towards developing local activities
around the mining sector and enhancing the opportunities for ASM development, which has
different implications than industrial mining for the population in terms of jobs and shared
57
prosperity. Other aspects that extractive/mining policies in DRC still need to explore are the
intergenerational equity and sustainable management of nonrenewable resources.
155. Although mining contracts are in general available on the website of the sector
ministry,72 the overall management of the sector suffers from deficiencies (see Annex H).
One symptom is the delay in the revision of the mining code. The revisions started in 2012, and
the government approved and transmitted the revisions to Parliament in March 2015. However,
discussion only started in the second half of 2017. Delays reflect strong lobbying from powerful
interests, often conducted by former local or foreign high-ranking officials, in a country that lacks
any legislation on conflicts of interests. Another symptom is the existence of conventions with
special treatment for some investors, often signed in the 1990s when DRC was in the midst of
political chaos. These conventions grant exclusive rights over areas that in some cases cover
thousands of square kilometers, therefore creating tensions with the local population. Some
companies can benefit from exceptionally low royalties, one notorious case being that of a
convention granting a 1 percent royalty rate on gold, which is even below the 2.5 percent of the
former 2002 mining code and the SSA averages of 4–5 percent. A third symptom are the opaque
transactions involving Gécamines, the large mining SOE. These have been highlighted in several
international and national reports, including the Africa Progress Report (2013) and the latest EITI
report on DRC for 2015.73
156. ASM remains an important formal and informal employment sector in the DRC,
often providing a safety net when an economic crisis unfolds. The recent episode of downturn
in the commodities market confirms the relative resilience of ASM. The downturn has not affected
ASM activities, even with the minerals that have faced the biggest price downturns. Indeed, global
market downturn in the mining industry impacts employment in large industrial mines and pushes
the unemployed into ASM. This is a common phenomenon across ASM environments globally,
not just in the DRC. At this stage, only anecdotal information is available. For instance, in southern
Katanga, recent layoffs in copper mines in 2016 seem to have pushed another 15,000 people into
ASM around Kolwezi. In addition, a downturn in the commodity price for one mineral pushes
artisanal miners into other commodities. ASM miners more readily move from one mineral to
another than abandon mining altogether. This was the case during the well-documented 2008
diamond crash in the DRC and when the 3Ts (tin, tantalum, tungsten) crashed in 2010. In both
cases, artisanal miners simply moved into gold.
157. There are gendered dimensions to the artisanal mining sector. A recent World Bank
report further emphasizes that workers in ASMs are migratory populations with low levels of
education, motivated by poverty and lack of employment opportunities elsewhere. The study also
found that women migrate to unfamiliar mining areas more often than men. These women are
often the sole income source in the family due to loss of husbands or male relatives or to loss in
traditional income opportunities (Hayes and Perks 2012; World Bank and HHI 2015). This
migration too often contributes to higher rates of vulnerability, extending from lack of connection
to social support groups and networks to lack of information on the availability of goods and
services. Although women are essential actors in the mining sector, they are also more vulnerable
72 See website of the Minister of Mining, http://mines-rdc.cd/fr/index.php/contrats-des-ressources-naturelles/contrats-
miniers. 73 See Rapport ITIE-RDC 2015, http://www.itierdc.net/rapport-itie-rdc-2015/.
58
to sexual and economic predation, frequently paid lower wages and excluded from critical
decision-making and benefit-sharing bodies (World Bank and HHI 2015).
5.2.3. Agriculture and Agribusiness
158. The DRC has the largest reserve of arable land in Africa, a favorable climate, and
abundant water throughout the year. Irrigation is not a major issue in DRC since most
agriculture is rain-fed. However, of the 80 million hectares of arable lands, only 10 percent are
used. Diverse agroecological zones enable a variety of staple and cash crops, as well as dairy,
livestock, and fisheries. Almost half of rural households hold some kind of livestock as an income
diversification strategy. There is potential for combining small-scale agriculture (including
cooperatives), and large-scale agroindustry through contract farming and for supporting mid-size
operators in relevant value chains and regions. In the livestock sector, pasture is abundant and
inland fishing potential is three times current production. The country offers huge opportunities to
promote commercial agriculture by modernizing the agriculture sector for both small-scale and
larger agroindustrial farms. The current World Bank agriculture portfolio is engaged in supporting
government efforts in that direction through targeted support to commercial agriculture value
chains, the promotion of investments to develop these value chains, and the creation of an enabling
environment for agribusiness development. Indeed, the enabling environment is in need of urgent
reforms because of intertwined factors not only from the agriculture sector.
159. Agriculture continues to account for the largest share of employment in the economy.
Of the population, 61 percent live in rural areas and agriculture employs 62 percent of the working
age population, though most of these jobs only provide for subsistence. The sector is unable to
feed the population: over 6 million people are severely food insecure, and malnutrition is
widespread. The country has a food trade deficit of US$ 1.5 billion annually, representing 9 percent
of total food consumption and 23 percent of total imports on average between 2010 and 2014. The
agribusiness sector offers enormous potential to create high quality and sustainable jobs along the
value chains, particularly for youth and women. Removing the key barriers related to the sector’s
governance is key to make this happen and ensure social stability.
160. Agricultural development is hampered by limited access to inputs, financing,
technology, and markets, lack of clarity in land tenure, poor rural infrastructure, weak
institutional capacity, and administrative bottlenecks along the value chain. Indeed, the
severely degraded and nonfunctional transport system, both river and road, remains a major
constraint. As long as farmers do not have easy access to markets, the normal incentives for
increased production are suspended. Production technology is still rudimentary and severely limits
productivity. Knowledge of, and better access to, improved planting materials and agricultural
equipment will be markedly facilitated by reestablishing extension and research services. Such
services could also transmit information on market opportunities. Weak and/or nonexistent
institutional capacity has helped to maintain the vicious cycle of poor agricultural productivity and
rural poverty. The inadequate supply of basic agricultural services such as research, extension,
veterinary, and pest management; the lack of access to market-related services such as market
information, identification of new markets, financing, and risk management; and the lack of access
to agricultural credit threaten agricultural growth. An additional challenge is the extremely low
level of skills and competence of female and youths compared with reference Sub-Saharan African
countries. Female producers also confront sociocultural constraints that prevent their access to
59
income, resources, and land that might otherwise enable improved outputs and yields. The
agricultural policy environment is also not conducive to realizing the potential of the sector and
significantly constrains its revival. This is in part due to weak participation by farmers’
organizations and private sector representatives in the policy-making process.
5.2.4. Forests and Biodiversity
161. Approximately 35 million people reside in or are dependent upon the country’s 148
million hectares of forest. Forest-based incomes support consumption, constitute a safety net in
response to shocks, and can play a role in household efforts to find a pathway out of poverty.
Unsustainable forest management therefore poses a challenge for the rural poor. Forests also
supply an estimated US$ 8.7 billion in food and other nontimber forest products, including wood
products valued at US$ 1.8 billion a year. The forest sector provides an estimated 519,000 full-
time-equivalent jobs, 97 percent of which are informal. Informal wood production, particularly of
fuelwood, dominates the sector, and accounts for 99.7 percent of the economic value of the sector.
Degradation and deforestation have turned the country into the world’s 35th largest net emitter of
greenhouse gases. In 2012, the country emitted 202 million tons of carbon dioxide equivalent.
Emissions from land-use change and forestry represent 82 percent of the total—165 metric tons of
carbon dioxide equivalent—ranking the country fourth in the world. Yet Congolese forests remain
a carbon sink of global importance. Addressing the drivers of deforestation and forest degradation
provides the country with the opportunity to capitalize on its forests through carbon finance, of
which US$ 360 million dollars have been mobilized.
162. The DRC’s rich biodiversity endowment makes it one of the world’s 17 megadiverse
countries. The country contains numerous priority conservation areas of global significance.
Intended to protect the country’s rich biodiversity, the DRC’s national network of protected areas
(PAs), covering 11 percent of the country, constitutes seven national parks and 57 nature and
hunting reserves, for a total of some 22 million hectares. ICCN (Institut Congolais pour la
Conservation de la Nature) is the government agency charged with administering the PAs. ICCN
manages the PA network with support from many partners, including bilateral and multilateral
donors, as well as national and international conservation organizations. The financial situation of
ICCN is precarious and highly dependent on donors. As a result of institutional weaknesses, lack
of adequate funding, and conflict-related threats to the parks, many parks in the country are facing
ongoing crises of biodiversity loss. The UN Educational, Scientific and Cultural Organization
(UNESCO) currently lists all five DRC World Heritage Sites as being in peril.74
5.2.5. Climate Change
163. The impacts of climate change are noticeable throughout the country through adverse
effects that pose risks to sustainable development. The DRC is witnessing extreme rain and
flood events leading to soil erosion and degradation, a prolongation of the dry season, and an
increase in drought periods during the rainy seasons. These may influence agricultural
productivity, increase bush fires, and damage infrastructure, thereby generating catastrophic
situations in poorly planned cities. Small farmers and the urban poor will be most vulnerable to
the expected impacts of climate change. These include: (1) likely increase in temperatures, since
74 http://whc.unesco.org/en/danger.
60
the Congo Basin has warmed by an average of 0.2°C–0.3°C per decade in the last quarter of the
20th century (this trend would threaten vulnerable groups, particularly infants and the elderly, and
lead to the increase in waterborne diseases, malaria, and trypanosomiasis); (2) possible rise in the
frequency and extent of extreme precipitation and flooding; (3) higher frequency of droughts with
disruption of the agricultural calendar; and (4) continuing rise in sea levels, following from the 21-
centimeter rise that was observed in 2009 relative to 1880.
164. Specifically, for the Congolese rainforests, the second most extensive in the world
after the Amazon forests, multiple lines of evidence indicate a browning over the last
decade,75 partially attributable to the long-term drying trend of Central Africa caused by climate
change. For Congolese forests, there may be critical thresholds of water availability below which
higher biomass, closed-canopy forests could transition to more open, lower-biomass forests.
Changes in the composition and structure of these forests will have potentially major impacts on
biodiversity, forestry, and forest-dependent communities, in addition to entailing globally
significant losses of sequestered carbon.
165. Climate change affects men and women differently, and they differ in their capacity
to respond to its impacts. It is essential for the DRC to strengthen the focus on gender-inclusion
and responsiveness in supporting climate change mitigation and adaptation agenda, including
through: (i) conducting a gender-informed analysis to capture gender differences in climate change
impacts and responses; (ii) ensuring gender-inclusion in stakeholder consultations at all levels; (iii)
identifying and then addressing gender-specific obstacles to equitable benefit-sharing of the
resources obtained through climate finance; (iv) mobilizing climate finance to support
development and distribution of a new generation of improved cook-stoves; and (v) supporting
future private sector engagement in climate finance in the DRC.
166. Overall, our understanding of Central African climate and expected changes to
climate is weaker than compared with other areas of the world. It is urgent to rebuild the
climate monitoring network in Africa, linking the weather stations to global reporting networks
and integrating with satellite observations. Similarly, modernizing and rebuilding the hydro-
meteorological network is needed to understand the implications of coming changes in the weather
and in river flows.
5.3. Human Capital: Progress amid Fragility
167. Despite progresses in several human development indicators, the DRC did not achieve
any of its MDGs. While the mortality rate declined by 30 percent in 2010–14, the country ranked
186th of 187 countries on the HDI until it reached 176 in 2015. Many challenges persist at several
levels, including: (1) demographic trends; (2) malnutrition; (3) health; (4) education; (5) youth
employment; (6) identification; (7) gender; and (8) forced displacement.
5.3.1. Demographic Trends
168. The DRC is sparsely populated and the country experienced major demographic
crises in the past century with massive population losses. The country’s density of population
is 34.8 per square kilometer (sqkm), and it ranks 178th worldwide among 246 countries or
75 Zhou, L. et al. 2014. “Widespread Decline of Congo Rainforest Greenness in the Past Decade.” Nature 10:1038.

61
dependent territories. In addition, and aside from the demographic drain related to slavery since
the 15th century, the country faced three major demographic crises in the past century of which
two are directly related to colonial policies. Indeed, the Congo Free State (1885–1908) imposed a
harsh forced labor system that led directly and indirectly to massive deaths of a magnitude that is
still debated among scholars.76 Later, population losses occurred frequently, mainly due to
sleeping-sickness epidemics whose occurrence is associated with the colonization of Africa.77 The
last demographic crisis came with the wars of the years 1996–2002 that took the lives of millions
of Congolese. All these facts are deeply anchored in the memory of the population who sees that
the narrative about fertility rate disregards this past and blames their poverty on their fertility rather
than on the economic model and its underlying political-economy.
169. The sensitivity of the demographic question is understandable; however, a forward-
looking approach shows that high fertility rates are a challenge for the development of the
DRC. Over the next 10–15 years, the structure of the country’s population will change
significantly, and the government and society need to be prepared to respond. The DRC’s fertility
rate is the sixth highest in the world, and increased from 6.3 per woman in 2010 to 6.6 in 2014.
Annual population growth is 2.8 percent, which means that the population is expected to double
in about 25 years. Figure 5.2a shows projections of the DRC’s total fertility rate to the year 2050.
Figure 5.2 Projection of Demographic Trends in the DRC by 2050
a. Total Fertility Rate b. Child Share of the population (%)
Source: Calculations based on data of the 1-2-3 Surveys, 2005, 2012.
170. The society must lower its fertility rate to reap the benefits of the demographic
dividend. According to the Global Monitoring Report 2015/16 classification, the DRC is a pre-
76 See controversy between Adam Hochschild (author of King Leopold’s Ghosts) and Jean-Luc Vellut (Professor
Emertus at the Catholic University of Louvain) about the death toll (January 12, 2006). “In the Heart of Darkness.”
The New York Review of Books, http://www.nybooks.com/articles/2006/01/12/in-the-heart-of-darkness/. 77 The rapid spread of sleeping sickness as a result of the opening up of Africa followed precisely the sequence of the
European invasion along the Congo River as far as the shores of Lake Victoria; see: De Raadt, Peter, the History of
Sleeping Sickness, WHO 2005, http://www.who.int/trypanosomiasis_african/country/history/en/index5.html.
3.43
3.93
2.93
6.15
2.5
3
3.5
4
4.5
5
5.5
6
6.5
2015 20 25 30 35 40 45 50
Medium High
30
35
40
45
50
2015 20 25 30 35 40 45 50
Medium High
62
demographic dividend country.78 The demographic dividend refers to the potential accelerated
economic growth made possible by opportunities created by changes in the age structure of a
population during a demographic transition (see Annex D for more details). Even if the DRC
manages to keep a greater part of the natural resources wealth in the country and use it for physical
and human capital accumulation, the prospects for human development and economic growth
would remain constrained by the persistently high fertility rate that leads to a population age
structure relatively more concentrated in dependent children (45 percent of the population is under
age 15 years). Figure 5.2b shows that even if fertility rates fell by half, more than a third of the
population would be children in 2050. The share of adolescents is around 24 percent.
171. Gender inequality sustains the negative dynamics of high fertility, high dependency,
and the preponderance of youth in the overall population. A key insight from recent work on
demographic dynamics in Africa is that promoting gender equality is at the core of new thinking
on population policy. Approximately 40 percent of girls are married and 25 percent become
pregnant before they turn 18 years of age. The DRC’s growing young population will require large
investments to sustain minimum coverage of basic health, education, and other services, resulting
in an increasing demand for fiscal resources. Hence, high fertility rates will make the achievement
of the sustainable development and universal development goals (universal primary education and
universal health coverage) difficult. Creating jobs and imparting skills for employability for such
a rapidly growing number of young people will be critical and even more challenging.
5.3.2. Malnutrition
172. Malnutrition is the underlying cause for 48 percent of the deaths among children
under 5 years of age in the DRC. Some common contributory factors to malnutrition have
improved slightly, such as access to clean drinking water, which increased from 49 percent of the
population in 2005 to 52.4 percent in 2012.79 However, such minor improvements have had little
impact. The prevalence of malnutrition among pregnant women and under-5-year-olds remains
among the highest in Africa. The nutritional status of women and children still presents an alarming
situation, with 43 percent of under-5-year-olds suffering from stunting, 8 percent from acute
malnutrition, and 23 percent underweight (DHS 2013–14).80 High malnutrition levels in women
increases the likelihood of giving birth to low-birthweight babies and thus perpetuating the
intergenerational cycle of malnutrition. The rates of chronic malnutrition are high across the
country and exceed 50 percent in some provinces (North Kivu, South Kivu, and the former
province of Kasaï-Occidental). The educational status of mothers is a strong predictor of
malnutrition in their children, highlighting the importance of keeping girls in school.
173. Malnutrition results in irreversible losses in human capital and contributes to losses
in economic productivity. Low birthweight is associated with a drop of 5 points in the intelligence
quotient; child stunting with a reduction of 5–11 points; and iodine deficiency with a reduction of
78 World Bank. 2016. Global Monitoring Report 2015/16: Development Goals in an Era of Demographic Change.
Washington, DC. 79 WHO / UNICEF Joint Monitoring Program (JMP) for Water Supply and Sanitation (2005 and 2015). 80 As in many other countries, most of the malnutrition in the DRC occurs between conception and a child’s second
birthday. This coincides with the most important period of brain development and explains the links between
malnutrition and impaired, irreversible, cognitive development problems.
63
10–15 points. Well-nourished children complete 1.2 more years of schooling, show speedier grade
progression, and receive higher scores on reading comprehension tests and nonverbal cognitive
tests.81 Malnourished children and adults are more likely to become sick, be hospitalized, and stay
longer in hospitals.82 This leads to lost schooling or employment among children and adults.
Malnutrition also leads to higher mortality rates, more widespread illness, and longer-term effects
on cognitive abilities and education outcomes. It is estimated that vitamin and mineral deficiencies
in the DRC collectively add up to an estimated loss of over US$ 100 million in GDP every year.
The government currently allocates approximately 7.5 percent of the total budget to health, only a
fraction of which is for nutrition. Total donor financing for nutrition interventions is also low, but
it gradually rose from about US$ 20 million annually in 2007 to US$ 25 million in 2012.
5.3.3. Health
174. Health indicators in general, and maternal and child health indicators in particular,
are unsatisfactory despite significant improvements. The maternal mortality ratio was
estimated at 846 per 100,000 live births in 2014.83 The infant mortality rate decreased from 92
deaths per 1,000 live births in 2010 to 58 in 2013, and the U5MR (under-5 mortality rate) declined
from 148 per 1000 live births in 2010 to 104 in 2013.84 While the DRC is home to only 1 percent
of the world’s population, the country is one of five countries responsible for half of all deaths
globally among under-5-year-olds (WHO 2012). The country is facing a large burden of
communicable diseases: it is among the 22 countries most affected by tuberculosis and one of the
27 countries accounting for 85 percent of the global burden of disease linked to multidrug-resistant
tuberculosis (WHO 2013). HIV prevalence has stabilized at around 1.2 percent of the population
since 2012 and considerable progress has been achieved in access to treatment. The number of
patients receiving antiretroviral treatment rose from 64,219 (25 percent) to 101,089 (46 percent)
in 2007–14. Meanwhile, the DRC was declared polio-free, but still faces outbreaks of other
infectious diseases. About 97 percent of the population lives in malaria-endemic areas.
Coordinated efforts have been undertaken in recent years to promote the use of long-lasting
insecticide-treated mosquito nets, resulting in a coverage rate of 72 percent. The nets have been
responsible for a 33 percent reduction in the U5MR85 according to 2013–14 data from the
Demographic and Health Survey (DHS).
175. The DRC is prone to epidemics, which are managed in an ad-hoc manner. Ebola was
first discovered in the DRC in 1976, and the country has suffered through seven outbreaks of the
virus, mostly in relatively remote rural areas. The latest major outbreak was contained in 2014
following 66 registered cases with 49 deaths. However, a much bigger outbreak is possible in an
urban setting, which can result in a high number of casualties and spread to neighboring countries.
In 2016, the DRC had an epidemic of yellow fever and cholera. While the government has acted
swiftly to manage and contain epidemics in the past, it has directed less financing and technical
81 Maluccio, Jahn A. et al. 2009. 82 The Global Burden of Disease analysis shows that underweight in young children is the number one risk factor in
the burden of disease among adults and children in East, West, and Central Africa and the fourth most important factor
in South Asia. See: Murray, Christopher J. L. et al. 2012. 83 Based on data of DHS (2014). 84 Comparison of 2013–14 DHS Survey and 2010 Multiple Indicator Cluster Survey. 85 UNICEF, 2013–14 DHS II analysis report.
64
assistance toward building a more strategic, cost-effective, and sustainable disease surveillance
and response system.
176. Health service utilization rates are low due to poor quality of infrastructure, lack of
clear catchment areas, and financial barriers to care (see Annex H). Two-thirds of patients do
not rely on the formal health care system because of the lack of available services, long travel
distances, poor quality of services, and financial barriers. Key quality issues are: (1) poor
performance of health workers (absenteeism, inadequate quality of clinical care, lack of
interpersonal skills), (2) insufficient financial resources among health facilities to ensure the
availability of medicines and medical supplies; (3) limited range of services available at health
facilities; and (4) inconvenience of services (inconvenient operating hours and long travel
distances), including local hospitality services such as meals and laundry. Although the uptake of
some preventive services is high (for example mosquito nets), others that are typically provided
through community platforms (for example family planning and behavior change for prevention
of malnutrition) have low coverage.
177. Public health resources need to be increased significantly to meet the needs of the
population and reduce inequalities. The government spends around US$ 1.00 per capita per year
on healthcare (National Health Accounts 2016), one of the lowest rates of health funding in the
world. Fees in public health care facilities are relatively high and are comparable to the fees in the
private sector. This is partly caused by the limited government subsidies to the health sector, which
results in health facility budgets that are insufficient to cover the actual costs of care. Overstaffed
healthcare facilities are common in both rural and urban areas. Adding to this problem is the fact
that 70 percent of the health workforce do not receive salaries, some are overdue for retirement,
and there is a need to retrain many workers. The average availability of essential medicines in
health facilities is estimated at around 30 percent. However, the availability of affordable
medicines varies across health facilities. Given the poor performance of the public drug
distribution system, health facilities procure medicines from a diverse set of sources, including
private sector distributers. Indeed, there is a parallel subsystem for supplying medicines and this
poses problem in coordination, harmonization, delivery amounts, and logistics. In sum, this has
resulted in: (1) stock-outs in some healthcare districts and overstocking in others, leading to
medicines that are stocked past the use-by date; and (2) inefficient transport of medicines and
supplies by various subsystems to the same health districts, resulting in increasing the cost of
logistics. Although prices are relatively low in the private pharmaceutical market, it is not well
regulated and quality assurance is lacking.
5.3.4. Education
178. The current state of human capital accumulation in DRC is not conducive to the
socioeconomic development of the country. The education system is struggling to provide the
country with a skilled labor force capable of turning the country into an industrialized economy
by 2030 (see Annex H). Almost half the working-age population in the country86 has either no
education (28 percent) or less than primary education attainment (19 percent), suggesting a need
for programs that increase education quality.
86 Skills for Economic Recovery and Shared Growth in DRC (P153289).
65
179. The primary school completion rate rose from 65 percent in 2005 to 70 percent in
2014. Despite noticeable progress, the DRC did not achieve universal primary education, and 4.9
million children of primary school age are not in school, of which close to 3 million have never
attended school. The dropout rate is significant during the first year. Although the gender gap is
narrowing, girls continue to score much lower than boys on tests at the end of primary school.
Children enter school poorly-prepared as a result of the high rates of chronic malnutrition and the
low access to early childhood education. The quality of education and the resultant learning
outcomes need to improve.
180. Post-primary education is deficient, and technical and vocational education and
training (TVET) lacks quality and relevance. The quality of secondary education is not aligned
with the DRC’s socioeconomic development ambitions. The pass rate in mathematics and sciences
at the end of the cycle hovers around 50 percent. Many curricula are outdated and incomplete, and
there is a shortage of pedagogical materials. In addition, the image and attraction of technical and
vocational training have eroded over time. Over 80 percent of secondary students are enrolled in
general education or teacher training programs, with no prospects for jobs. The share of students
in secondary TVET was a mere 18.5 percent of total enrollment in 2012. This is troubling as this
sub-sector is critical to provide the skills and competencies needed in the labor market to achieve
investment-led growth.
181. The higher education sector needs significant leaps in quality and improvements in
efficient use of resources. Half of enrolled university students drop out before they reach their
third year. The completion rate hovers around 60 percent. A viability audit in 2011 highlighted the
challenges undermining the learning environment and the delivery of quality outcomes, including:
(1) uncontrolled expansion of low-quality institutions, especially in the private sector; (2) sub-
standard governance and accountability; (3) dilapidated buildings and obsolete equipment; (4)
limited space and overcrowded lecture halls; (5) a mismatch between academic programs and
market demand; and (6) a shortage of appropriately qualified teaching staff. There is only one
qualified teacher per 80 students in public higher education and one per 850 in private higher
education. The average age of qualified staff within the system is 65. Programs that target skills
complementary to key growth sectors in the economy attract few students.
5.3.5. Employment
182. Employment is predominantly agricultural, and unemployment is disproportionately
urban. The vast majority of people, over 16 million, were occupied in agricultural activities, with
commerce a distant second place with just over 3 million. Women account for 70 percent of labor
in agricultural production, albeit at subsistence levels (FAO 2015). But employment growth has
been much faster in commerce and services, with the latter having doubled between 2005 and
2012, whereas employment in the agricultural sector increased only by 12 percent over the same
time span. Despite the employment expansion, unemployment rates measured according the
international definition87 increased from 2.5 percent to 3.2 percent between 2005 and 2012. Using
a relaxed definition of unemployment that includes discouraged jobless people, the unemployment
87 The international definition of unemployment used by the ILO covers people who are: out of work, want a job, have
actively sought work in the previous four weeks and are available to start work within the next fortnight; or out of
work and have accepted a job that they are waiting to start in the next fortnight.

66
rate climbs to 17.7 percent nationally, peaking at 31 percent in urban areas and 39 percent in
Kinshasa.88 Over 80 percent of unemployment can be found in urban areas, even though their share
has been contracting with a corresponding expansion of unemployment rates in rural areas.
Potential female workers still face specific barriers to employment, and their higher rate of
inactivity (21 percent against 16 percent for males) suggests that many of them have likely stopped
looking for a job. At the same time, child labor is widespread, with 25 percent of 13-year-olds
combining school and work, and a steady 3–4 percent of children 5–14 years old working and not
attending school.
183. Job prospects for the 1 million young Congolese joining the labor market every year
are particularly limited, as indicated by the high underemployment and joblessness rates. A
high share of youth (22 percent) are both economically inactive and out of school. Kinshasa has
the highest rates of such youth in the country (over 40 percent), suggesting a connection with the
growth of urban gangs (kuluna). The definition of youth in the DRC covers a wide age range (the
15–35 age-group), and the picture changes considerably for the narrower, 15–24 age group used
in most international statistics on youth employment. Labor force participation is much lower
among this younger age group compared with the 15–35 age group (35 versus 55 percent), while
education participation is much higher (49 versus 30 percent). Youth unemployment is three times
that of adults. Differences across provinces are vast. In Kinshasa and South Kivu, 27 percent and
14 percent, respectively, of the youth population are actively looking for work, against an average
of 3 percent in the other provinces.
184. Human capital development is low among many young people. The quality of basic
education is inadequate. It produces poor learning outcomes and provides insufficient preparation
for entry into the labor market. The severe weaknesses in the TVET system 89 contribute to the
disconnect between youth employment preferences (formal or informal sector, public or private)
and available jobs (largely in the informal sector), a situation likely to fuel the discontent, if not
hopelessness, felt by many young Congolese. The services of the National Employment Office are
only available to a tiny fraction of the unemployed and lack of resources makes it virtually
impossible to match job seekers to job openings. A few programs to encourage entrepreneurship,
especially among women or youth, are implemented with donor support, but their outreach is
minimal and often confined to the main urban centers.
5.3.6. Identification
185. Birth registrations are declining in the DRC, and inequality in the access to an
officially recorded and recognized identity is widening. The first step in recording personal
identifications involves the civil registration of children at birth and the identities of their parents.
However, only 25 percent of births are being registered, and only around half of the registered
children are assigned birth certificates (UNICEF 2015). The lack of registration is high among the
poor. The share of births registered among the poorest quintile of households fell from 37.9 percent
in 2001 to 15.7 percent in 2013–14, while it rose from 31.7 percent to 38.4 percent among the
wealthiest quintile, respectively. The share decreased in the three middle quintiles during the
period. In 2013, the ratio of birth registrations among the richest and poorest quintiles in the DRC
88 Source: 1-2-3 Survey. 89 Consulting en Développement Communautaire et en gestion d'Entreprises, Diagnostic et recommandations pour
l’adéquation formation emploi et production (ADEP) de la main d’œuvre qualifiée en RDC. Draft, March 2016.
67
was 2.45, which was higher than the average of least-developed countries (1.96) and Sub-Saharan
Africa (2.42). Despite the extension of the registration deadline to 90 days, poorer parents in the
DRC cannot afford the exorbitant fees (officially US$ 32, but can reach more than US$ 100 with
add-ons), fail to see value in registering births, or are not aware of alternative means to register.
186. The DRC needs a routine, secure, and cost-effective identity system because issuing
new identity certificates every five years is costly and does not work. Dahan and Gelb also
point out that repeated voter registration exercises, such as those in the DRC (at a cost of US$ 203
million in 2011 and managed by the UN Development Program) do not necessarily strengthen
identity systems. The DRC is a particularly relevant case: two rounds of biometric registration
were conducted, but the lack of continuity in registration means that people who were not yet age-
eligible to vote will now likely not be able to prove their identity for at least five more years
independently of their actual age. In the formulation of Gelb and Diofasi (2016), “wasteful,
repeated, voter registration is a clear example” of interinstitutional competition and lack of
coordination among actors, both national and international.
187. Identification is a fundamental human right and a foundation for national
development. Identity matters in many ways that could help DRC reduce poverty and
vulnerability. Dahan and Gelb (2015)90 identify 10 Sustainable Development Goals (SDGs)
clusters that stand to benefit from improved identity systems. Among these clusters is the
implementation of appropriate social protection systems, which require robust identity
management in order to strengthen the assurances that funds are properly used. These systems also
offer the opportunity to increase financial inclusion among the most vulnerable through direct
payments to bank accounts (or mobile money). Identity benefits in financial services include
facilitating access to credit, improving market regulation, and reducing fraud and money
laundering.
188. In light of the levels of poverty and its depth in DRC, social sectors can benefit largely
from identity systems. A strong social protection scheme can be a major tool to increase resilience
and reduce poverty through targeted transfers. In education, identity systems are essential to
monitoring progress of individual pupils, observing how pupils enter, progress, and exit the school
system for targeting purposes, and for verifying academic credentials. A well-functioning identity
system could also help to identify out-of-school children. In health, identity would support the
management and targeting of universal healthcare. Cause-of-death statistics, collected as part of
the end-of-life process, would support better targeting of the roughly 40–50 percent of total
healthcare expenditure financed by government or external sources.91
5.3.7. Gender
189. Congolese society had a mix of patriarchal and matriarchal family structures that
gave way to a single patriarchal model of family under colonization. The patriarchal model of
family, authority, and hierarchy continued after independence. Nowadays, gender disparities in the
DRC are stark across multiple social, economic, and human development indicators. Gender
inequality indicators—across health, empowerment, and economic measures—are among the
worst in the region, reported at 0.673 on the 2012 Gender Inequality Index, which is the worst of 90 Gelb, Alan, and Mariana Dahan 2015. 91 Barroy H. et al. 2015.
68
five countries in Africa (UNDP 2012). Similarly, the Gender Development Index is 0.833,
reflecting that women’s human development is about 83 percent that of men’s (UNDP 2016).
Despite important gains, for example in health and education, persistent disparities denote
sociocultural norms that circumscribe women’s social status in public and in the home, and
contribute to their exclusion from political and public decision-making spheres. Identification of
and attention to these disparities is crucial; closing gender gaps in health and education is critical
to promoting human capital formation and increased economic opportunities, while greater gender
equality and diversity can enhance productivity, improve development outcomes for the next
generation, and allow businesses and institutions to perform more effectively.
190. While policies and laws in the DRC specifically address gender equality, gender
difference remains a serious challenge. Articles 14 and 15 of the 2006 Constitution affirm the
equal rights of men and women. There were several discriminatory provisions in the previous
family code, which impeded entrepreneurial activities and financial inclusion of women. For
instance, married women needed the permission of their husbands to have a document notarized,
to sign a contract, register land, register a company, open a bank account, obtain a loan, go to court,
or work outside the home. The new family code approved by the National Assembly in July 2016,
removes a majority of these restrictions and increases the minimum age of marriage for girls from
15 to 18 years of age. Considerable work remains to be done, however, to ensure new laws are
enforced.
191. Women’s participation in representative politics is constrained in the DRC. Political
participation is limited; women currently occupy roughly 8 percent of parliamentary seats in both
the National Assembly and in the Senate, as compared with an average of 20.6 percent among low-
income countries. Changes to the election laws in 2015 further removed provisions allowing for a
quota of women’s representation of 30 percent, perceived as a regressive measure likely to impede
participation rates further. Key constraints circumscribing women’s roles and participation in
decision-making include social and cultural norms. More broadly, the lack of education and
economic resources and patriarchal power structures are perpetuating male dominance.
192. There are no significant gender differences in the DRC in human development in the
early years of life. The reduction in under-five mortality between 2007 and 2013 and the U5MR,
are the same for young girls and boys. There is also no significant difference between girls and
boys in terms of childhood chronic malnutrition or access to early childhood health services such
as vaccination. The gender parity ratio in gross primary-school enrollments reached 0.96 in 2013,
up from 0.81 in 2007.
193. However, significant gender gaps do form after early childhood, notably in education,
health care, economic activity, legal status, land tenure, property ownership, inheritance
practices, and decision-making authority. The ratio in secondary education, at 0.62 in 2013,
remains lower than the average of 0.77 in low-income countries. While progress has been achieved
in health care, the maternal mortality rate remains high and shortcomings exist in access to family
planning services and to assistance by skilled birth attendants. The gender gap in social status is
linked to poor development outcomes, such as fewer girls in secondary school, lower female labor
force participation, fewer women-owned businesses, greater control by husbands of marital
69
property, and lower rate of access to bank accounts among women (World Bank 2016).92 Women
tend to have low decision-making power within the household, with only 11 percent of cases in
which a woman is the main decider on matters that affect her own health. Men are the main
decision-maker in 53 percent of the cases and joint decisions are made in 36 percent of cases (DHS
2013–14). Of the 173 economies covered in the World Bank report, the DRC is one of only 28
that show 10 or more differences in legal status. In Sub-Saharan Africa, only Mauritania and Sudan
have higher numbers of restrictions on women.
194. Economically, women are primarily engaged in agricultural production activities and
small businesses in the informal sector. Female producers frequently lack access to land and
financial resources, which restricts their investments in new technologies and productive assets,
including improved seeds, tools, and fertilizers. Although there are laws against discrimination in
pay and employment, 63 percent of women earned less than CDF 30,000 a month, against 43
percent of men in 2012 for identical time-commitment to work.93 Lower proportions of women
than men tend to own property or land (DHS 2013–14), as linked to sociocultural dynamics that
restrict women’s ownership and inheritance of land. The 2013 Global Financial Inclusion Database
(Findex) demonstrates, for example, the lack of banking penetration and gender gap in DRC: there
are 40 percent fewer female account holders over the age of 15 than men.
195. Women in the DRC are exposed to high levels of GBV, which goes beyond the well-
publicized, conflict-related sexual violence in the east. According to the 2013–14 DHS, more
than half (52 percent) of women have experienced physical violence at some point in their life
since the age of 15 and more than a quarter (27 percent) were victims of physical violence in the
previous 12 months. The conflict in the eastern provinces contributes significantly to the high
levels of sexual and GBV. Indeed, armed groups perpetrated the majority of sexual crimes in North
Kivu and South Kivu.94 However, the causes of violence are not entirely conflict related, and
noncombatants committed the majority of sexual crimes in 2012 (58 percent). Intimate partner
violence (IPV) is a particularly prevalent challenge; of those women who are married or have a
partner, 57 percent have experienced IPV—including physical and/or sexual violence—which is
well above regional rates of 38 percent (WHO 2013).
196. GBV rates vary significantly across provinces. They are particularly high in Equateur,
Maniema, Katanga; Kasai Oriental; and Kasai Occidental.95 In addition, acceptability of IPV is
particularly high in the DRC. Overall, acceptance of IPV is high in Africa, on average around 30
percent, more than twice the average of the rest of the developing world, at 14 percent. Acceptance
92 World Bank Group. 2015. Women, Business, and the Law 2016: Getting to Equal. Washington DC: World Bank. 93 République Démocratique du Congo, Rapport de Suivi de la Situation Economique, 2nd Edition : Renforcer l’Etat
et Transformer la Richesse Minière en vecteur de Croissance, de Développement et de Cohésion Nationale (World
Bank 2014). 94 Ministry of Gender, Family Affairs, and Children and UNFPA, Ampleur des Violences Sexuelles en RDC et actions
de lutte contre le phénomène de 2011 à 2012, June 2013. 95 For these provinces, the respective prevalence of physical violence and of sexual violence was: Equateur, 58.8 and
27.4 percent; Maniema, 57.8 and 34 percent; Katanga, 49 and 22.7 percent; Kasai Oriental, 57.4 and 30.5 percent;
Kasai Occidental, 61.8 and 36.3 percent. Figures presented here are from the 2014 DHS which does not take into
account the new administrative provincial boundaries and only reports on domestic violence (physical and sexual).
These figures do not provide information on non-partner physical or sexual violence.
70
levels toward IPV in DRC are the highest in the region; 74.8 of women and 59.5 percent of men
(aged 15–49) believe that wife beating is justified for at least one specified reason.
197. GBV has enduring impact on physical and mental health, social cohesion, communal
and household stability. In addition, in a context where both the rate of GBV and its level of
social acceptance are high, the risk of such violence can be exacerbated by development
interventions, including infrastructure investments. Labor influx associated with large investment
projects, taking place in a context where social norms and values may include high acceptance
levels of GBV can further expose vulnerable groups to sexual assault, transactional sex, rape, and
forced or early marriage. Also, violence has economic costs extending from out-of-pocket
expenses, lost productivity and foregone income, and impacts on human capital formation.96
Hence, ensuring the safety and well-being of women and children is a security and governance
issue for DRC, as well as a development imperative, and needs to be given the highest priority.
198. The 2006 Sexual Violence Law broadened the definition of sexual assault. The law
criminalized rape, sexual slavery, sexual harassment, and forced pregnancy. Sexual violence has
spread into a wider social phenomenon. The DRC is a signatory (2009) of the African Union
Convention for the Protection and Assistance of Internally Displaced Persons in Africa. The
government also endorsed the Strategy Against Gender Based Violence (2009), which aims to
support the efficient coordination of prevention, protection, and response efforts for the benefit of
survivors. In June 2014, the president nominated a special advisor on sexual and GBV, but
prosecutions are generally rare, and impunity remains a serious problem.
5.3.8. Forced Displacement
199. According to UN High Commission for Refugees data (UNHCR 2016), the DRC is the
fourth largest host of refugees in Africa, after Ethiopia, Kenya and Uganda. As of December
2016, the DRC was host to over 452,000 refugees, including 245,000 from Rwanda, 102,000 from
the Central African Republic, 67,000 from South Sudan, and 36,000 from Burundi. Almost all
refugees are living in rural areas (98.7 percent) and a minority in the urban areas of Kinshasa,
Lubumbashi, Goma, and Bukavu). Females comprise 52 percent, and the majority (64.4 percent)
are youth and children under age 18.
200. Conflict and instability in the DRC, including two wars, have generated massive
internal displacement and refugee flows. By the end of 2016 there were an estimated 2 million
IDPs within DRC. Over 90 percent of IDPs are concentrated in the eastern provinces of North
Kivu, South Kivu, Tanganyika, Ituri, and Maniema. IDPs have tended to choose places of refuge
where there is relatively better security, access to land and economic opportunities, social
networks, and hospitality from host communities (Internal Displacement Monitoring Center -
IDMC, 2015), as well as proximity to their home village (Joint IDP Profiling Service, 2010).
Approximately 80 percent are living with local communities or host families outside of camp
environments (IDMC 2015).97 Those taken in by already poor host communities face the worst
conditions in terms of access to services, livelihood opportunities, and accommodation (World
96 The World Bank’s 2014 report Voice and Agency: Empowering Women and Girls for Shared Prosperity examined
GBV across five countries, estimating the cost of IPV alone to range from 1.2 to nearly 4 percent of GDP, equivalent
to what many governments spend on primary education (Klugman et al 2014). 97 Some IDPs occupy a room in the host family’s house, while others sleep with their hosts in the same rooms.
71
Bank 2015). Following reports that IDP camps were infiltrated by armed groups, Mokoto IDP
camp and three other IDP camps in North Kivu were forcibly dismantled by the government,
leading to the displacement of 35,000 into the surrounding localities (UNICEF 2016). Over the
last 15 years, there have been consistently more than a million IDPs in the DRC, with numbers
peaking in 2003 and 2013 at around 3 million people (IDMC 2016). As of 2016 year-end, there
were also almost 0.5 million refugees from DRC (UNHCR 2016), 87 percent of whom had sought
refuge in the neighboring countries of Uganda (47 percent), Rwanda (15 percent), Tanzania (13
percent) and Burundi (12 percent).
201. Since 2010, several thousand IDPs have returned each year to their areas of origin.
According to the World Bank, most IDPs would like to return to their home areas provided there
is security and adequate return assistance provided.98 Improvements in security are likely to be
uneven—some areas are likely to become stable before others, allowing access to land and
property. For those unable to return due to insecurity in areas of origin or travel, there may be
some prospects for local integration where there is land available, such as in Katanga and Uele
provinces. However, Ituri, North Kivu, and South Kivu provinces are densely populated and
experience intertribal conflict, and so it is unlikely that IDPs will be able to achieve durable
solutions in the medium term (World Bank 2015).
202. Refugees from DRC are returning in relatively small numbers. However, many return
to areas that also host IDPs and refugees, and so they contribute to pressures on already
overstretched infrastructure and services, land disputes, and competition for natural resources and
livelihood opportunities. In most cases, returning refugees receive more assistance than IDPs.
Those returning with UNHCR assistance receive a package that includes transportation, a
resettlement kit, housing materials, ID card, assistance with school fees, and assistance with
medical expenses. UNHCR also provides health and medical support at the community level. Little
assistance is provided to those who return spontaneously (World Bank 2015).
98 Forty-six percent of the displaced around Goma wish to return to their areas of origin (Province du Nord-Kivu
2017). A survey of IDPs in Goma found that 29 percent do not wish to return to their place of origin—higher among
female-headed households, of whom 39 percent plan to remain. Many who said they intend to return have no concrete
plans to do so. Main reasons for return include: land ownership (41 percent), property ownership (17 percent), ability
to find employment (14 percent), and family reasons (11 percent). Around 90 percent of camp-based IDPs intend to
return and said they plan to do so within three months (Norwegian Refugee Council 2014).
72
Chapter 6. The Challenges Facing the Private Sector
203. Since the end of the Second Congo War, the DRC has been making very important
and encouraging efforts to improve the ground rules.99 The DRC has been improving the
regulatory environment that private businesses operate in by passing a significant number of major
reforms (for example OHADA laws, and labor, sector, and Doing Business reforms). These efforts
attempted to protect property rights, improve governance in various sectors, and enhance the
functioning of finance and labor markets. Thus, in the context of a relatively more favorable
macroeconomic and political context until 2015, and despite the persistent serious challenge of
poor infrastructure (notably energy and transport), these reforms have to some extent helped in
increasing private investments in key sectors, such as construction, mining, telecommunications,
and banking.
204. Businesses of all sizes and sectors still highlight the DRC’s poor business climate as
the top obstacle for the private sector in the economy. Consequently, the private sector is not
able to mobilize its potential, which would have contributed to economic growth and poverty
reduction and to addressing key drivers of fragility and conflict in the country.100 Most of the
problem stems from the huge gap between the introduction of formal policy reforms and their
actual implementation, that is, the inability and/or unwillingness to enforce rules. This is due
mainly to the weakness of institutions and the country’s overall uncertain and risky political
economy.
6.1. Lack of Effective Implementation of Reforms
205. Over the past eight years, the DRC has been adopting and implementing a
comprehensive program of regulatory reforms to improve its business environment. This has
notably enabled the country to be recognized in the WBG’s Doing Business 2015 as one of the top
10 reforming countries in the world. This demonstrates that the country has the capacity to make
efforts to improve its business climate when there is committed leadership.
206. In practice, however, there is a discrepancy between the introduction of new
regulations and their actual implementation on the ground. The expected improvements of
reforms are often slow to take place as well as their impact on the performance as tracked by the
Doing Business report. Indeed, strong resistance to reforms comes notably from public officials
and various public and private interest groups benefiting from market distortions and/or other
special privileges, often encouraged and facilitated by a rampant system of elite capture.
Furthermore, as the country initiates new reforms designed to positively facilitate and reduce the
cost of doing business, it also tends to introduce reforms that have the opposite effect due to various
inefficiencies in government institutions. Thus, in addition to the 19 positive reforms recognized
99 According to the USAID Guide to Economic Growth in Post-Conflict Countries (2009), in a post-conflict situation,
after security and macroeconomic policies, the business enabling environment is the most important element for
encouraging and sustaining growth. The risks confronting business in post-conflict societies tend to take two primary
forms: 1) uncertainty over the rules of the game (laws and regulations) and 2) an inability to enforce rules that are
certain (weak institutions). 100 WBG consultations with stakeholders in February and March 2016; Statements by FEC.
73
by the Doing Business report between 2010 and 2016, the DRC unfortunately recorded five
negative reforms over the same period.
6.2. Weak Commercial Legal System
207. Businesses in the DRC lack confidence in the courts to uphold their rights by fairly
and efficiently enforcing laws and regulations. Despite recent efforts to improve a severely
dysfunctional commercial justice system (such as the establishment of specialized commercial
courts in Kinshasa, Lubumbashi, Matadi, and Kisangani), serious weaknesses remain, such as
widespread corruption, lack of independence, understaffing, lack of expertise, and inadequate
equipment. According to the 2013 World Bank Enterprise Survey, the share of managers citing
lack of effective courts as a major or severe obstacle to business expansion was 33 percent in the
DRC against 12.2 percent in Sub-Saharan Africa.
6.3. Weak Financial Infrastructure and Regulation
208. The development of a more solid and inclusive financial sector is essential for
sustainable economic development in the DRC. The banking sector largely dominates the
Congolese financial sector, and the top four banks hold nearly 60 percent of total banking assets
and about 62 percent of deposits. The banking sector comprises 18 licensed banks representing 95
percent of the total financial system, and their assets reached US$ 4.6 billion in 2014, or 14 percent
of GDP. In addition, there are: one state insurance company (SONAS), one development bank
(SOFIDE), one development fund (FPI), the National Social Security Institute (INSS), 143 Micro
Finance Institutions (MFIs) and cooperatives, 59 transfer institutions, three electronic money
institutions, and 16 Forex exchange bureaus. There is neither a stock market nor a debt capital
market. Operations are not very sophisticated and consist of collecting deposits and short-term
financing operations. Banks lack long-term resources; hence, loans to customers have short-term
maturities. The financial system’s vulnerability to macroeconomic shocks is compounded by weak
supervision from the regulator, lack of regulation enforcement, lack of appropriate AML/CFT101
tools, large operating costs and low profitability, and heavy reliance on sight deposits.
209. The largest part of the DRC population continues to be excluded from the financial
sector. Less than 1 percent of the population has access to a commercial bank, and only 7 percent
of enterprises use banks to finance their investments. In addition, 54 percent of firms surveyed in
2013 pointed access to finance as the biggest constraint to business growth. Domestic credits to
the private sector as a percentage of GDP stood at 6.8 percent and deposits to GDP at 11.2 percent
in 2015, compared with 36 percent and 46 percent in Sub-Saharan Africa, respectively. The
following factors have notably been identified as impediments to banking penetration: (i) poor
status of infrastructure across the country; (ii) high operational costs; (iii) weak capacity for long-
term or large-scale investment project finance; (iv) lack of confidence and very slow rebuilding of
confidence in the banking system; (v) slow development/reform of the nonbanking financial
sector, including insurance, pension system, leasing, secured lending, and other forms of financing
and; (vi) high level of informal economy.
101
Anti-Money Laundering/Combating the Financing of Terrorism.
74
210. Political interference is undermining the effectiveness of BCC and its ability to
enforce its own regulations. BCC supervision practices still focus more on ensuring compliance
with Central Bank prudential ratios than adopting a risk-based approach where risks are anticipated
and appropriately mitigated.
211. Assessments of bank-specific and systemic soundness are severely handicapped by
weak supervisory data and other information gaps. There are significant weaknesses in
accounting and auditing practices and, even if indicators suggest relatively sound capitalization
levels of commercial banks, a more detailed analysis suggests banks are underprovisioned. This is
partly due to lax implementation of new nonperforming loans and provisioning rules. Money
laundering risks are important and are the consequence of the large, cash-based, informal
economy, large foreign exchange transactions, and the buoyant real estate market.
212. Responsible finance (financial consumer protection and financial education) is
inexistent. There is in general a lack of transparency due to lack of any disclosure requirement,
leading to lack of understanding by consumers, unfair competition, and high fees and charges. This
not only poses risks of over-indebtedness for credit products but also contributes to the lack of
usage and uptake of other formal financial services (for example transaction accounts). Internal
and external mechanisms for consumers to seek redress are also inexistent, hindering consumer
confidence in the formal financial sector. In addition, while the government has approved a
national financial education program, its implementation is slow and mainly focused on traditional
tools, which have a limited impact on the short term.
6.4. Shortage of Skills on the Labor Market
213. There is a significant mismatch between the DRC's general education curriculum and
the skills sought by employers. The country faces a major challenge in the scarcity of skilled
workers for sectors such as services (banking, insurance), agribusiness, mining, construction, and
manufacturing. Some of the most critical factors include: (i) a noticeable degradation in the quality
of education at all levels and a cumbersome and outdated education system; (ii) limited vocational
training opportunities; (iii) lack of government initiatives to foster internship programs for youth
attracted by the public or the private sector; (iv) the absence of coordination between the
government, private sector, and educational structures, which is necessary to ensure a better match
between the skills of young graduates and job seekers with those desired by the private sector; and
(v) absence of job information data, which would provide students, graduates, and job seekers with
the relevant information they need to make informed education and career decisions. The demand
for jobs is on the rise while supply has been falling sharply. This mismatch has fostered the
emergence of the informal sector, which employs about 80 percent of the active population
214. Young people face huge problems in finding work because of the limited number of
jobs on offer. Few graduates are prepared to embrace the entrepreneurial scheme because most
academic institutions offer no entrepreneurship programs. As a result of the declining national
education system, foreign qualifications are the most sought-after skills and they open the door
more widely to the labor market and jobs with more responsibility. The DRC is also characterized
by a low level of labor remuneration, with monthly income averages at CDF 113,000, CDF
249,386, and CDF 166,738 for jobs in public administration, para public, and the private sector,
respectively.
75
6.5. Narrow Market of Business Development Services (BDS)
215. While demand for BDS is extremely high, the BDS landscape has yet to develop and
grow in maturity. In the DRC, the majority of entrepreneurs start a business out of necessity and
more than 75 percent operate in the informal sector, of which only a few have accessed world-
class BDS. Micro, small and medium enterprises (MSMEs) cite lack of skills and business
knowledge in the targeted sectors as two of the major constraints to growth. The lack of specialized
BDS providers with specialized skills has hampered the development of sectors with high potential
(energy, tourism, fisheries, etc.).
216. Currently, the BDS market (private and public) is still narrow with a limited number
of professionally organized and structured BDS providers. It offers very limited solutions to
firms and to individual entrepreneurs, and is mostly focused on managerial topics. The market is
also characterized by a lack of culture for entrepreneurs to consult and be paid consulting fees. The
BDS landscape can be divided into three main categories: (i) public institutions (OPEC, INPP,
etc.) offering subsidized BDS to MSMEs, (ii) semi-public institutions and companies, and (iii)
private BDS providers expanding BDS to a few large firms and to MSMEs. There is a new trend
of universities developing solutions for MSMEs, but many are still focused on managerial
solutions. Technically-oriented schools and universities (for example ISTA) have not yet joined
the BDS market.
6.6. Difficult Access to Markets
217. Access to markets remains one of the major constraints for large firms and MSMEs
in the DRC. It is exacerbated by factors such as weak governance and lack of clearly defined
strategic options, and inability to implement bold measures to attract both domestic and foreign
investments, foster fiscal sustainability, or promote efficient economic decentralization, leveraging
on provincial diversities to achieve coherent domestic market development and increased
penetration into regional and international markets.
76
PART II. EMERGING OPPORTUNITIES AND PRIORITIES
MAIN MESSAGES
While the current risky and volatile economic context and uncertain political environment are a burden on
the DRC’s development prospects, they also offer to policy makers the opportunity to change the course of
the country’s current underdevelopment and turn it toward a sustainable path of growth and long-term
development. Five major opportunities and priority areas are emerging—in which policy actions could provide
quick wins and build cumulative and virtuous cycles, and thus sustain growth and foster resilience and prosperity
in the DRC over the next decade—as follows: (i) building the resilience of the macroeconomic framework; (ii)
building inclusive institutions and strengthening governance; (iii) leveraging infrastructure, natural resources, and
agriculture; (iv) building human capital and promoting gender parity and inclusiveness; and (v) leveraging the
private sector by effectively implementing investment climate reforms, and strengthening institutions that support
markets.
Macroeconomic stability is priority number one for the DRC and the deterioration of macroeconomic
indicators since mid-2015 is threatening the hard-won economic gains of the past decade. Mobilizing more
domestic revenues and diversifying the economy are top priorities, and long-term and sustainable solutions to
restore the confidence of economic agents and build the resilience and credibility of the macroeconomic framework.
The government should restore price stability and reduce inflationary pressures through sound monetary policy.
The BCC’s zero monetary financing policy of fiscal deficits has been tested recently and should be restored, and
macroprudential policies should be strengthened. The economy also needs to go through gradual dedollarization.
Building institutions and improving governance stands out as an urgent development imperative for the DRC
to meet the twin goals. The DRC needs a strong public sector and meritocratic state bureaucracy. Governance
initiatives should first support the less powerful. Decentralization has the potential to constrain Kinshasa in relation
to subnational governments. Development partners in the DRC can support inclusive institutions/organizations and
the less powerful through a wide variety of development interventions in a range of areas, such as: (i) analytical
tools; (ii) stronger legal and regulatory frameworks; and (iii) voice, empowerment, and accountability interventions.
However, there are several prerequisites to making public sector institutions more inclusive to achieve economic
resilience as well as economic growth and poverty reduction, including: (i) strengthening capacity to mobilize
domestic revenues; (ii) improving public expenditure management and efficiency in priority sectors; (iii) building
public sector capacity to foster good quality service delivery at the central and provincial level; and (iv) enacting
SOE reforms and reforming the security sector. Effective interventions in the DRC have to factor in various political,
social, cultural, and economic caveats.
Leveraging infrastructure, natural resources, and agriculture is also an emerging priority. There is a need to
upgrade the DRC’s infrastructure to serve the population and the economy, and improve the management and use
of natural resources. Accelerating governance reform and investment in the transport and energy sectors, reinforcing
the reform agenda in the water and sanitation sectors, as well as in the information and communications technology
sector are key policy priorities. Natural resources have the potential to generate better jobs and income if they are
managed more effectively and sustainably. Agribusiness could improve living conditions and help diversify the
economy. Moving the country toward a green revolution would entail a two-track approach, including: (i) increasing
production through access to improved seeds, fertilizers, finance, and technology, and (ii) reaching markets more
efficiently by enabling producer cooperatives to identify markets, pool resources, add value, negotiate contracts,
and access feeder roads and storage facilities.
Enhancing the stock and quality of human capital is crucial for building long-term resilience and sustained
economic growth. Government policies should focus on: (i) Modernizing the national identity system; (ii)
establishing the preconditions for an eventual demographic dividend; (iii) laying the foundation for future
productivity through improved nutrition; (iv) improving the quality of education for employability; (v) enhancing
the role of women to build for the future; (vi) increasing access to good-quality health services; (vii) building a
safety net system to consolidate the benefits of investments in human development and foster household resilience;
77
(viii) broadening the benefits of growth through measures to support youth employment; and (ix) addressing the
impact of conflict.
Leveraging the potential of the private sector is a development imperative if the DRC wants to achieve the
twin goals. Here, government policies should focus on: (i) strengthening the commercial legal system to protect
property, business, and contracts rights—this will help reduce the risks firms face (in particular SMEs) and increase
their willingness to invest more; (ii) enhancing financial infrastructure and regulation to scale-up business access to
financial services; (iii) addressing the shortage of skills by building a relevant education curriculum and a stronger
labor market to ensure that young Congolese people find decent jobs; (iv) expanding the market of BDS providers
to support entrepreneurs and ensure private sector development; and (v) facilitating access to markets, which is an
overarching objective for private sector development.
However, policy actions must go beyond formal policy reforms and focus on their effective implementation.
Effective implementation can be achieved through stronger leadership and more effective coordination of reforms.
In this respect, the revitalization of the DRC’s Intergovernmental Steering Committee on Business Climate and of
the Economic Governance Matrix could be useful.
78
Chapter 7. Building Resilience and Credibility into the
Macroeconomic Framework
218. Macroeconomic volatility is an impediment to achieving development goals in the
long term. Macroeconomic policy plays a unique and pivotal role in managing risk and volatility
and building the resilience and credibility of the macroeconomic framework. The SCD concurs
with the conclusion of the WDR 2014 (World Bank 2013) and the World Economic Outlook 2015
(IMF 2015), that mobilizing more domestic revenues is the long-term solution to creating fiscal
space. This should be feasible for a naturally resource–rich country such as the DRC. This chapter
also emphasizes that the government should continue delivering low inflation through sound
monetary policy. The BCC’s zero monetary financing policy of fiscal deficits has been tested
recently and should be restored, and macroprudential policies should be strengthened. The
economy also needs to go through gradual dedollarization. Finally, the chapter argues that
diversifying the economy is the long-term solution to shield the country from external volatility.
7.1. Enhancing Fiscal Policy and Creating Fiscal Space
219. The government’s current fiscal policy and policy options are facing headwinds in an
unfavorable domestic environment. By keeping the fiscal balance under control, lowering
inflation, and stabilizing the exchange rate, the government’s prudent fiscal policy has been at the
center of the country’s remarkable macroeconomic performance. This policy is put to the test by
falling commodity prices, a tightening in external financing, and the suspension of mining
production by major mining operators (see Chapter 1). The government has three fiscal policy
options to cope with in the current situation: (1) cut spending; (2) seek external financing; and (3)
mobilize more domestic resources.
220. The composition of spending cuts is not neutral and their design has to consider their
long-term growth and development implications. The revised 2016 budget cut spending by 22
percent. The procyclical nature of this policy may aggravate the impact of the shock on the
economy and increase output volatility, thereby undermining long-term growth. The economy’s
stock of infrastructure is particularly low, and protecting public investment projects can have
lasting positive effects on GDP growth, productivity, and poverty reduction.102 The government
will need to define and protect a core public investment program that rehabilitates and maintains
infrastructure103 in areas such as energy and rural roads, and supports agricultural projects.
Moreover, the implementation of this program and of any countercyclical policy requires policy
buffers (budget reserves and foreign currency reserves) and coordination across the government
during planning, bidding, contracting, construction, and evaluation. These elements either are
weak or do not exist.
221. Beyond spending cuts, external financing may be a second option for fiscal
authorities. The government indicated in 2016 its willingness to issue bonds worth at least US$
700 million in international debt markets to finance investment projects. In general, greater access
to financial markets offers potential benefits, such as supplementing the low level of domestic
102 See Calderón, Moral-Benito, and Servén 2015. 103 Empirical evidence shows that, while the short-run impact of government investment on output is 0.6 in developing
countries, the cumulative impact rises to a long-run value of 1.6. See Ilzetzki, Mendoza, and Végh (2013).
79
savings, diversifying the investor base, extending the maturity profile of debt, and helping address
declining access to concessional financing. Yet international bond issuances are also associated
with risks. For instance, an issuance of the above-mentioned size would substantially expand the
foreign exchange exposure of the debt portfolio, leaving the country with unsustainable debt levels
and at risk of future depreciation and inflated servicing costs. An example of possible outcomes is
the large depreciation of Ghanaian and Nigerian currencies in 2014.
222. Concessional support may be a better option since large resource flows from the
issuance of bonds, if not managed adequately, may contribute to financial instability. The
economy of the DRC showed resilience to the 2008–09 global financial crisis and the euro turmoil
in 2011 because of the country’s weak financial links with international financial markets.104
Alternative concessional support does not bear the same risks as bond issuances and presents three
advantages: (1) avoiding the compression of already low levels of spending beyond the minimum
operational needs at the expense of pro-poor spending; (2) restoring and preserving past
achievements, mainly improved macroeconomic management;105 and (3) promoting longer-term
resilience by building up the stock of foreign reserves and strengthening the ability of the
government to conduct macroprudential policies.
223. Increasing domestic revenues will require long-overdue fiscal policy, administrative,
and institutional reforms. The low revenue mobilization in the DRC reflects inadequate tax
policies and legal frameworks and relates to ineffective institutional and administrative
arrangements and processes. On the policy side, both laws and ongoing decision-making remain
favorable to investors at the expense of public finance and the population. Such is the case in the
mining sector where the former mining code and some mining contracts and conventions shift rent
distributions for the benefit of investors. On the administrative and institutional sides, low
capacity, fragmentation, and suboptimal arrangements are evident. A vicious circle is in place,
whereby insufficient revenues deprive the public administration of the human and financial
resources it needs to operate, including in mobilizing revenues. National and local governments
are unable to implement and enforce laws on property taxation. Revenue collection is fragmented
between three main agencies and several supplementary agencies.
224. Mitigation measures include the creation of fiscal space and buffers during good times
to help save funds for bad times. As the WDR 2014 (228) puts it, “to manage risk properly,
policy makers must graduate from being crisis fighters to being cycle managers.” Successful
experiences, such as in Chile, can bring valuable lessons. Chile put in place a fiscal rule supported
by a stabilization fund to strengthen macroeconomic policy and withstand external shocks. The
fiscal rule for the DRC may correct, in the first place, only for the price of its main commodity
export— copper. The rule should commit the government to a target level for a fiscal balance, and
aim to save during high-revenue periods and deploy resources in bad times. The effectiveness of 104 Increasing integration into international private capital markets, combined with financial liberalization and
immature but evolving domestic financial systems, can mix with sharp volatility in capital flows and lead to financial
crisis and damaging macroeconomic instability (Tyson 2015). 105 This shows in the higher rating of the macroeconomic component of the Country Policy and Institutional
Assessment (CPIA). The country’s overall CPIA rating improved from 2.7 to 3.0 in 2013 and 2014, remained stable
in 2015, and decreased to 2.9 in 2016. The rating on macroeconomic management increased from 3.2 to 3.5, then
declined to 3.2, reflecting first improvement then deterioration in fiscal policy and monetary policy. On debt
management, the country risk improved from high to moderate, but might deteriorate if the budget deficits continue
to increase.
80
this rule would require that it is locked in in an institutional framework (law) that strengthens the
link between the fiscal rule and the use of government savings. Learning from the experience of
Chile, it is also important that the authorities establish an ex ante escape clause from the rule
(which would apply under pre-specified conditions) or ex post sanctions for violating the rule and
to ensure corrections. Building sovereign wealth funds, such as a stabilization fund, would improve
the chances of success of the fiscal rule. The effective governance of such a fund requires
establishing a clear transparency and accountability framework.
225. Cognizant of the shrinking fiscal space and unfolding economic turmoil, the
authorities of the DRC announced a set of 28 measures in January 2016. These measures aim
at enhancing domestic revenue mobilization and promoting investment and growth. Annex E
provides a summary of these 28 measures. The main measures aimed at generating revenues were:
(1) the effective recovery of personal income tax on the remuneration of all members of central
and provincial public institutions and SOE staff; (2) installing cash registers in key areas to
increase the collection of VAT; (3) strengthening revenue collection from the forestry sector; and
(4) fighting tax/customs evasion in the economic, telecommunication, and transport sectors. The
impact of these measures has yet to materialize.
7.2. Strengthening Monetary Policy to Deliver Low Inflation
226. The government should strengthen monetary policy to deliver permanent price
stability. This is particularly important because high inflation distorts the savings and investment
decisions in the economy and hurts the poor who earn low incomes, consume basic goods, and
thus cannot change their consumption behavior. As in other African countries (for example Ghana
and Nigeria), monetary policy could progressively establish an inflation-targeting regime.106 The
regime would make low inflation the direct and primary objective of monetary policy. This implies
that the authorities—the BCC—would announce a range or a specific targeted value for the
inflation rate. However, there are some preconditions for the success of inflation targeting,107
including: (1) an independent and credible central bank; (2) sustainable fiscal deficits and public
debt; (3) absence of a de facto exchange rate target; (4) enhanced transparency and responsibility
in the management of monetary policy; (5) a healthy and sufficiently developed financial system;
and (6) a good knowledge of the transmission channel and the technical capacity to forecast
inflation. If the BCC is not in a position to convince the markets and economic agents that inflation
targeting is the ultimate objective of monetary policy, its credibility may be at risk, and restoring
and maintaining price stability may become difficult in the medium term.
227. The DRC has already met some of the conditions to proceed with inflation targeting
while others are still missing. The ratio of public and publicly guaranteed external debt was
relatively low at less than 13 percent of GDP in 2014, and the risk of debt distress is moderate.
While still underdeveloped, the financial sector is well capitalized. According to the IMF (2014),
the ratio of capital requirements over risky assets is 25 percent. However, the overall picture of the
financial sector may hide specific cases of vulnerabilities that can develop into systemic risks, as
illustrated through the BIAC (Banque Internationale de l’Afrique au Congo) episode. Important
efforts are needed to strengthen technical capacity and produce accurate and timely data to conduct 106 See Agénor and Pereira da Silva (2013) for a discussion on inflation-targeting regimes in developing countries. 107Ibid. For a detailed analysis of the prerequisites of the adoption of an inflation-targeting regime in a typical
developing country.
81
monetary policy on a daily basis. In addition, the BCC’s interventions on the foreign exchange
market and recent monetary financing of fiscal deficit may lead to a questioning of the BCC’s
commitment to inflation targeting.
7.3. Pursuing Macroprudential and Countercyclical Policies to Build Resilience
228. Pursuing macroprudential policies in good times has proved to be a major ingredient
of the successful management of the 2008 global crisis in a few countries. The experience of
countries that have successfully managed the crises offers two major lessons: (1) they pursued
macroprudential policies in good times, while continuously strengthening the domestic financial
system; and (2) they implemented timely countercyclical macropolicies. Countries as different as
the Czech Republic, Kenya, and Peru offer compelling examples of how macroeconomic
preparation has shielded the economy from the negative effects of a global financial crisis (see
Annex F). Although political leaders may have been tempted to adopt procyclical measures during
good economic times, these three countries understood the necessity of strengthening their
financial and macrofiscal systems to prepare for economic turmoil. The relative resilience of these
three countries to the global crisis in 2008 was the result of an arduous process undertaken a decade
or more before the shock. Having achieved lower fiscal deficits, disciplined monetary policy, and
lower checking-account deficits, these countries experienced a smaller decline in growth rates in
the aftermath of the 2008 crisis than they did following the 1997 East Asian crisis.
229. The DRC can integrate new instruments of macroprudential management into its
policy toolkit. While the country is confronting the negative impacts of the global downturn, it
can benefit from the lessons of the impressive ability to manage macrofinancial risk in countries
such as the Czech Republic, Kenya, and Peru. New countercyclical, macroprudential tools could
be developed to complement the short-term macroeconomic management instruments as called for
by the Bales Agreement. Some instruments, such as reserve requirements, are already being used
by the BCC. However, it is important that these instruments be used systematically as
countercyclical tools.
7.4. Maintaining Exchange-Rate Stability
230. Congolese policy makers should limit the use of the exchange rate as an absorber for
the balance of payment shock. This policy prescription is backed up by three arguments. First, a
further depreciation of the exchange rate would nourish inflation and hurt primarily the poor.
Second, the magnitude of the shock does not make the exchange rate an effective policy tool to
cope with its multiple macroeconomic and financial consequences highlighted in the first part of
this report. Third, the memory of hyperinflation in the 1980s, triggered by exchange rate
depreciation, is still alive; many Congolese lost a large part of their assets and poverty increased
widely.
231. The depreciation of the exchange rate continues despite the measures taken by the
authorities and point to the need for external support. The BCC required mining companies to
pay taxes in US dollars, raised the reserve requirement on foreign currency deposits, and
intervened in the foreign exchange market. Notwithstanding the considerable efforts, however,
sustaining or reinforcing these policies seems impossible and exchange rate depreciation
continues, especially with the persistence of political tensions. Indeed, the depreciation related to
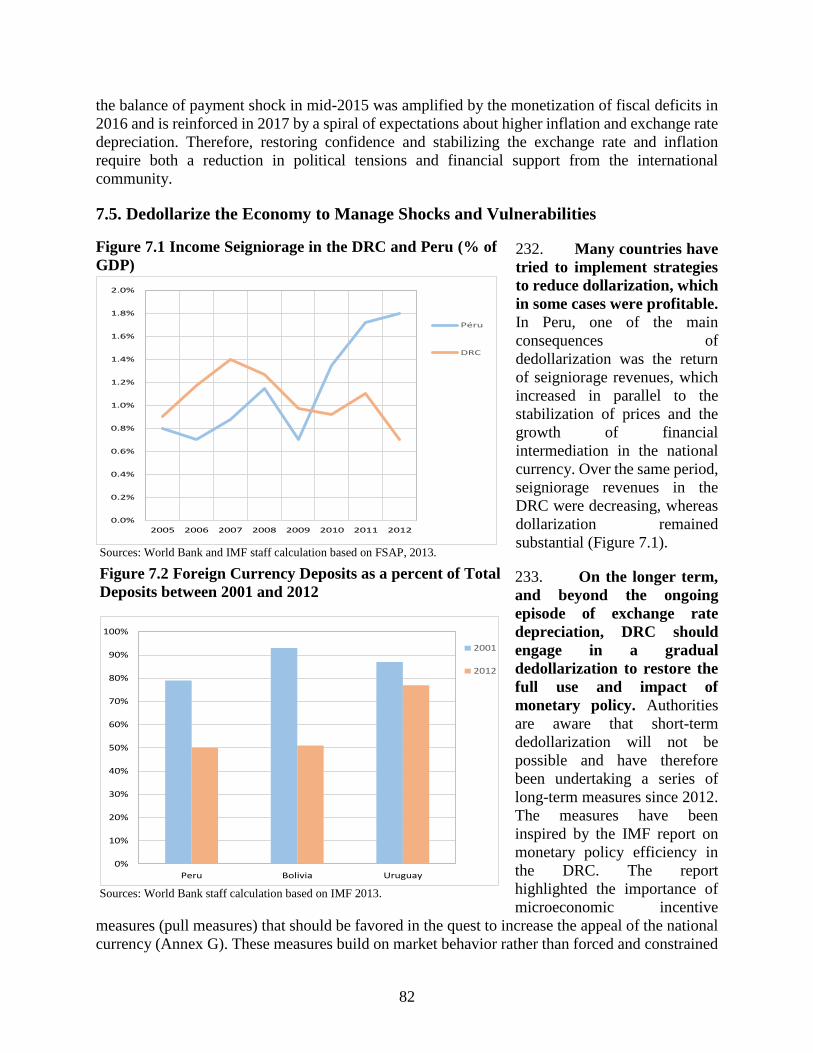
82
the balance of payment shock in mid-2015 was amplified by the monetization of fiscal deficits in
2016 and is reinforced in 2017 by a spiral of expectations about higher inflation and exchange rate
depreciation. Therefore, restoring confidence and stabilizing the exchange rate and inflation
require both a reduction in political tensions and financial support from the international
community.
7.5. Dedollarize the Economy to Manage Shocks and Vulnerabilities
232. Many countries have
tried to implement strategies
to reduce dollarization, which
in some cases were profitable.
In Peru, one of the main
consequences of
dedollarization was the return
of seigniorage revenues, which
increased in parallel to the
stabilization of prices and the
growth of financial
intermediation in the national
currency. Over the same period,
seigniorage revenues in the
DRC were decreasing, whereas
dollarization remained
substantial (Figure 7.1).
233. On the longer term,
and beyond the ongoing
episode of exchange rate
depreciation, DRC should
engage in a gradual
dedollarization to restore the
full use and impact of
monetary policy. Authorities
are aware that short-term
dedollarization will not be
possible and have therefore
been undertaking a series of
long-term measures since 2012.
The measures have been
inspired by the IMF report on
monetary policy efficiency in
the DRC. The report
highlighted the importance of
microeconomic incentive
measures (pull measures) that should be favored in the quest to increase the appeal of the national
currency (Annex G). These measures build on market behavior rather than forced and constrained
Sources: World Bank and IMF staff calculation based on FSAP, 2013.
Figure 7.2 Foreign Currency Deposits as a percent of Total
Deposits between 2001 and 2012
Sources: World Bank staff calculation based on IMF 2013.
0%
10%
20%
30%
40%
50%
60%
70%
80%
90%
100%
Peru Bolivia Uruguay
2001
2012
0.0%
0.2%
0.4%
0.6%
0.8%
1.0%
1.2%
1.4%
1.6%
1.8%
2.0%
2005 2006 2007 2008 2009 2010 2011 2012
Péru
DRC
Figure 7.1 Income Seigniorage in the DRC and Peru (% of
GDP)
83
dedollarization (push measures). Among the pull measures are the following: (1) elimination of
the administrative capping of interest rates on domestic currency deposits and loans; (2) reduction
in the nonremunerated reserve requirement on national currency deposits; (3) adoption of inflation
targeting and more flexible exchange rate regimes; (4) development of a market for government
paper denominated in national currency; and (5) increase in national payment system efficiency.
234. Dedollarization was often partial in the countries where it worked, and the full use
of national currency was restored in only a few cases. While Bolivia, Peru, and Uruguay may
be cited as successful cases of dedollarization, dollarization in these countries is still over 40
percent. In 10 years of reform, Bolivia managed to cut dollarization by half. Peru has been on the
dedollarization path for a few years, but has succeeded in reducing dollarization by only 25 percent
(Figure 7.2). Indeed, according to the IMF (2014), among the countries with dollarization above
80 percent, none has been able to reduce the level to less than 20 percent. While the inertia seems
to have no macroeconomic justification, its roots appear to lie in microeconomic incentives.
7.6. Diversifying the Economy to Build Resilience and Sustained Growth
235. Building up resilience in the economy requires greater diversification of trading
partners and of products, including along the value chain in the mining sector. DRC should
increase exports to markets other than its traditional trading partners and avoid depending on the
economic cycle of one or a few trading partners. On the longer term, DRC should also diversify
the products it exports, but this requires substantial improvements in the investment climate. Along
the value chain in mining, beneficiation and the processing and development of backward and
forward links could be an option for increasing local content and shifting from a focus on exporting
raw materials to exporting semi-finished products. However, the inefficient and inexistent
infrastructure in energy and transport represents a serious obstacle to the development of backward
and forward linkages. Infrastructure bottlenecks are currently hampering mining production and
operating deficiencies at SNEL have cost the equivalent of US$ 100 million a year in lost
production. In addition, building skills will be critical for backward and forward links.
236. An option for diversification would be to promote the development of various
structures of production in the mining sector. The government can also promote diversification
within the mining sector. This involves the implementation of the government’s strategy to
formalize ASM. Mineral deposits in the country are, in many locations, accessible using artisanal
methods or light equipment, which makes the case stronger for fostering ASM. ASM is taking the
place of agriculture in many rural environments and, with the exception of copper and cobalt, the
majority of mineral production and exports derive from artisanal mines. Unlike capital-intensive
industrial mining, ASM is labor intensive. Income generated from ASM is captured by households
and national and local entities, while income from industrial mining is largely transferred as factor
income remunerating FDI. The more mining income remains in the country, the greater is the
amount of foreign currency retained domestically; the greater are the aggregate demand and
household consumption, and the potential for national and local revenue. Hence, the country could
reap the benefits of promoting ASM production and increase the resilience of the economy.
84
Chapter 8. Building Institutions and Better Governance
237. Strengthening the state and improving governance in the DRC should aim to
reinforce the position of the less powerful in the political bargaining. It is crucial to gain a
better understanding of the prevailing political settlement dynamics in the country and the main
causes and consequences of governance fragility. Improving governance will be reached through
incremental public sector reforms and sequenced interventions to build inclusive institutions and
achieve the equitable distribution of natural resource wealth. Indeed, there are varying degrees of
ownership of public sector governance reforms within the elite and the largely donor-driven
service delivery reduces accountability of rulers towards the population.
8.1. Supporting Inclusive Institutions and Organizations
238. Building inclusive institutions and public sector organizations is a key priority for the
development agenda of the DRC. Inclusive institutions bestow equal rights and entitlements, and
enable equal opportunities, voice, and access to resources and services. Institutions are the
underlying rules of the game. Organizations are groups of individuals bound by a common
purpose. Organizations are shaped by institutions and, in turn, influence how institutions change
(North 1990). As argued by Acemoglu and Robinson (2012): “inclusive economic institutions that
enforce property rights, create a level playing field, and encourage investments in new
technologies and skills are more conducive to economic growth than extractive economic
institutions that are structured to extract resources from the many by the few.”
239. There are several prerequisites for making public sector institutions more inclusive
to achieve economic resilience as well as economic growth and poverty reduction. They
include strengthening capacity to mobilize domestic revenues; improving public expenditure
management and efficiency in priority sectors; building public sector capacity to foster good-
quality service delivery at the central and provincial level; enacting reforms of SOEs; and
reforming the security sector.
240. The DRC needs a strong public sector and meritocratic state bureaucracy.
Administrative reform has been on the political agenda in the country since independence. The
size of the country, its intricate ethnic population, its ecological disparity, and the complex nature
of the country’s political economy seriously undermine its administrative organization (Trefon
2008). A variety of problems hinder the public sector from functioning effectively. In addition to
limited capacity to design and implement public policies, there is no monitoring or follow-up
capacity in the administration on policy implementation, the legal status of the civil service is
outdated (the new legal status of the civil service was adopted and promulgated only in 2016), the
exact number of civil servants is not known,108 the wage system is opaque, and many civil servants
need to be retired. Under these circumstances, civil servants have privatized what is officially
public service provision, largely because official salaries account for only a small percentage of
108 The Central Public Service Ministry (Ministère de la Fonction Publique) employs approximately 130,000 staff
(Verheijen and Mabi 2008, 11). This represents approximately 20–25 percent of all civil servants, because it does not
include school teachers, medical staff, and security forces.
85
their earnings. Ambiguous and nontransparent bonuses and illicit payments (extortion money,
bribes, and kickbacks) paid by service users constitute the bulk of earnings.
241. The reform of SOEs offers opportunities to boost economic growth. In the DRC, SOEs
have historically owned and managed the main infrastructure facilities, and have in many cases
stifled competition because of archaic regulatory and legal frameworks (Herderschee, Kaiser and
Samba 2012). New business models, careful selection of investment projects based on transparent
criteria, and the use of modern public private partnership (PPP) arrangements can be instrumental
for removing infrastructure obstacles to economic growth.
242. The lack of security is a constraint on economic growth and social progress. The DRC
government should maintain efforts to improve protection of its people and control of its territory
in order to ensure economic and social progress. Devising a comprehensive security sector reform
encompassing the police, the army, and the judicial sector, is essential for rebuilding trust among
the population and potential investors. The imperative of developing a robust, disciplined, and
professional security force together with an accessible and fair judicial system is key to
safeguarding economic and social progress. Ex-combatants continue to perpetrate violence, rape,
and other forms of abusive behavior towards civilians. In local communities, poverty and violence
fracture social capital and trust in the state and increase the fear of expropriation (Herderschee,
Kaiser and Samba 2012). This fear, compounded with the lack of connectivity and market access
and lack of financial capital, results in subsistence production being preferred over commercial.
8.2. Supporting the Less Powerful
243. Governance initiatives should first identify and then focus on ways of establishing
areas of convergence between the powerful and the powerless. Support for establishing
inclusive public sector organizations and economic institutions should be accompanied by support
for interventions to distribute power widely in a pluralistic manner. This power distribution should
focus on establishing law and order, securing property rights, and creating an inclusive market
economy. Past experience with reform failures suggests the need for better consideration of the
split between insiders and outsiders, the powerful and the powerless, and the included and
excluded. Therefore, public sector governance reforms need to be complemented by interventions
to support the positions of the less powerful who do not necessarily trust the more powerful.
Focusing on governance initiatives where interests overlap to avoid winner-takes-all situations will
be crucial in working towards political compromise, accommodation, and social peace. The idea
of convergence refers to governance initiatives that would enable elites to maintain some of their
prerogatives while transferring benefits to the public sphere. In this context, it is important to
provide support to the less powerful, such as subnational governments, civil society stakeholders,
minorities, and small-scale economic actors.
244. Decentralization has the potential to constrain Kinshasa vis-à-vis subnational
governments. Decentralization is the central feature of the 2006 Constitution, which envisions
devolving power to autonomous provinces. The constitution has established a decentralized
unitary state to avoid the past mistakes of the concentration of power. It provides the legal basis
for effective decentralization with the following features, which have yet to be implemented: (i)
revenue sharing; (ii) transfer of competencies and human resources to the provinces; and (iii)
86
election of subnational authorities. Kinshasa is more powerful than subnational governments,
including provincial governments and decentralized territorial entities.
245. However, in the DRC, decentralization tends to reproduce and spread the
dysfunctionalities of the state rather than cure them. 109 The DRC needs to be careful about
spreading “decentralized territorial predation based on a political culture of military
entrepreneurship” (Trefon 2010) or supporting provincial administrations who do “relatively little
beyond taking care of themselves” (Englebert and Mungongo 2016). Certain features of Congolese
society need to be recognized at the onset of decentralization interventions to avoid unrealistic
expectations, and design them to tackle provincial predation and centralization of power. Fallacies
that the rise of alternative and autonomous centers of power by themselves will constrain Kinshasa
or that provincial elites represent the interests of local populations will need to be avoided. In the
DRC, governance malpractices, such as patronage, rapportage, and the privatization of public
office, are prevalent at the central as well as provincial level. Most provinces allocate the majority
of their budget to salaries and functioning costs of governors, their cabinet, and provincial
assemblies.
246. Providing access to provincial or local power does not necessarily promote
accountable behavior or checks and balances between local and central authority. Englebert
and Mungongo (2016) describe a common donor misdiagnosis as: “A reliance on decentralization
to combat personal rule, unaccountability, and predation assumed that Congo’s ills resided at the
top and that, by spreading power, reforms could neutralize “bad leadership.” However, personal
rule, unaccountability, and predation are not a matter of central elite behavior alone. They are
pervasive features of Congolese political life and result, at least in part, from a widespread
understanding of the state as a resource. Decentralization multiplied the tools of statehood and the
number of claimants to its benefits, but it did not, on average, wrestle these tools away from
abusive leaders to give them to accountable local actors.”110 Therefore, increasing the
developmental impact of decentralization requires getting local governance right by thinking
through interventions to obtain more responsive and accountable subnational governments.
247. Investment in strengthening local associations and civil society organizations should
be an ongoing priority of governance initiatives. In rural areas, cooperatives can serve as a
platform for voice and empowerment of local farmers and artisanal miners. Cooperatives can have
both economic, social, and political function. Economically, they allow small producers to join
forces and acquire equipment, inputs, and services they cannot afford individually. They are well
adapted to the structure of land ownership in DRC. They give small owners access to collective
inputs they can use to exploit their plots without losing ownership. In case of collectively owned
land, cooperatives allow collective exploitation and reduce the grievances of those who otherwise
would have felt unfairly excluded from accessing a collective resource. Socially, cooperatives
restore mechanisms of cooperation, dialogue, and trust within communities, hence allowing for a
gradual reconstitution of social capital and social cohesion. This same social cohesion would
translate into more political clout towards local and national authorities. Ultimately and in general,
a dense network of small and cooperating producers can be the social base for strong and stable,
local political power and representation. In addition, support for women and minorities is
109. For more on this issue see Englebert, P., and Emmanuel Kasongo Mungongo. 2016; and Trefon, Theodore. 2010. 110 See: Englebert and Mungongo 2016, 24.
87
important to strengthen state-society bonds. Ethnicity plays an important role in Congolese politics
as it has direct and indirect impacts on local and national political dynamics.
8.3. Approaches, Interventions, and Tools for Supporting Inclusive Institutions and
Organizations and the Less Powerful
248. Development partners in the DRC can support inclusive institutions and
organizations and the less powerful through a wide variety of development interventions in
a range of areas, such as:
a. Analytical tools: Political economy analysis, gender analysis, poverty and social impact
analysis, and fragility assessment constitute several tools that are available to understand how
power is exercised and what the relationship is between formal and informal institutions, and actors
and organizations.
b. Strengthening legal and regulatory frameworks: Rights-based legislation is the formal
mechanism to demand better and enhanced governance. Examples include right-to-information
legislation, laws on citizen participation to decision-making (for example budget decisions),
affirmative action (gender, minority, vulnerable group quotas), and social guarantee approaches to
service delivery.
c. Voice, empowerment, and accountability interventions: Development partners can
support activities that strengthen the voice of marginalized people and empower them both
economically and socially. Cooperatives can be powerful structures to reinforce the position of the
less powerful and local media is an important voice mechanism. Community radios play an
important role in informing citizens about developments in their community and in the nation.
88
Chapter 9. Leveraging Infrastructure, Natural Resources, and
Agriculture
249. The DRC needs to upgrade its infrastructure to serve the population and the
economy, and improve the management and use of natural resources. Well-functioning
infrastructure is essential for business and industry to thrive and for social service delivery to be
effective. This chapter aims to identify emerging priorities and policy options for rebuilding
transport, power, and water systems, while also boosting telecommunications and managing
rapidly growing cities. Natural resources in the DRC sustain the livelihoods of millions of poor
people, especially in agriculture and artisanal mining. Natural resources have the potential to
generate better jobs and income if they are managed more effectively and sustainably.
Agribusiness could improve living conditions and help diversify the economy. Adapting to climate
change and reducing emissions also need attention, both of which representing opportunities for
international partnerships.
9.1. Rebuilding Infrastructure to Establish Resilience and Sustain Inclusive Growth
250. Infrastructure in the DRC is substandard and unable to effectively serve the
population and the economy. Key infrastructures, including transport, power, water systems, and
telecommunications, play a major role in efforts to build resilience and achieve sustainable
inclusive growth in the country.
9.1.1. Transport: Accelerating Governance Reform and Investment
251. Weak policy and institutional capacity and limited financial resources have
constrained the government’s reform of the transport sector. Transport is key to increasing
agricultural and mining production, boosting trade, reconnecting isolated communities, and
improving security. This is critical to inclusive and sustainable growth. A program to rehabilitate
key roads is under way with support from development partners. The program has enabled a first
phase of modernization of the road sector through, the National Road Fund (FONER—Fonds
National d’Entretien Routier) . Efforts to improve the safety of air and river transport, stabilize
railways, and reform the ports sector are also under way. Progress on all these fronts is slow
because of weak capacity in the public sector and limited financial resources.
252. The government can undertake key transport reforms by updating its multimodal
transport strategy and development plan. Reforms can focus on improving sectoral governance
in policy formulation, strategic planning, prioritization, funding and financial sustainability, and
reforming SOEs in transport (see Annex H). Key measures would apply as follows: (1) build the
human capital of public sector staff in transport by training new employees and replacing old staff
at all levels; (2) devise a multimodal vision of transport by combining various projects led by
different institutions in line with a coherent and concerted plan; (3) tackle the issue of SOEs in the
transport sector; (4) leverage financing from development partners and the private sector; (5)
develop financial management instruments to collect data and assess the efficiency of
expenditures; and (6) balance transport investments with environmental considerations to ensure
sustainability. Given the country’s untapped waterway potential, navigation needs more attention.
89
Improving access to waterways could play a vital role in growing the economy: a 10 percent
reduction in the travel time to a fluvial port leads to a 3.7 percent increase in crop production.
9.1.2. Power: Accelerating Governance Reform and Investment
253. In 2014, the DRC enacted a new law that provides a legal, regulatory, and institutional
framework for increasing electrical power. The law liberalizes the power sector, strips the
national utility SNEL of its monopoly, and promotes PPPs. It also called for the creation of an
electricity sector regulator, the National Electricity Regulatory Agency (ARE—Agence de
Régulation de l’Electricité), and a rural electrification agency, the National Rural Energy Service
Agency (ANSER—Agence Nationale de Service Energétique Rural) that will promote and finance
rural and peri-urban electrification. In addition, the public utility and the government signed a
performance contract, and SNEL recruited a consultant to help improve its technical, commercial,
and financial performance. The rehabilitation of key generation and transmission infrastructure
has recently been completed or is under way, including the rehabilitation of the 600 megawatts
generation capacity at Inga I and Inga II and the rehabilitation of the 2,000-kilometer transmission
line connecting Kinshasa with the mining rich Katanga.
254. The government needs to leverage the private sector to generate capacity and clarify
the relationship between the power and mining sectors. Sectoral needs are vast, and financing
resources are limited to international donors. Crowding-in the private sector is critical and requires
the issuance of decrees to implement the 2014 sector law, and eliminating corruption to improve
the broader business environment. However, any engagement with the private sector requires the
clarification of existing PPPs. Indeed, SNEL inherited financing agreements with some mining
companies involving power production. With regard to these agreements, SNEL has little space to
implement any medium- or long-term strategy, defend its financial interests relative to these
private investors, or make sure it can service its debt.
255. The DRC needs to undertake a set of crucial reforms to strengthen the governance of
the power sector, expand access to electricity, and increase production and transmission
capacities:
• Strengthen sector governance and financial control to: (1) improve the commercial practices
of SNEL in line with key high voltage, medium voltage, and public clients; (2) address SNEL’s
debt and improve commercial management; (3) implement solid financial controls; and (4)
implement tariff based on cost-recovery.
• Expand access to electricity services, which will require substantial policy and institutional
development, and the development of new business models to attract private investment. Reaching
this objective will require implementing the 2014 law and adapting the proposed PPP structures to
entice private sector investment. The new business model should harness opportunities along the
value chain, including: (1) greater concessions to international and regional utilities aligned with
the generation and transmission master plan; (2) locally operated mini-grids with hybrid solar or
hydro technologies that favor lower investments and operating costs, such as those supported by
the World Bank in Mali; (3) solar home system and pay-as-you-go service providers, such as those
expanding in neighboring Tanzania and Uganda; and (4) the development of commercial markets
for portable solar lanterns and plug-and-play solar systems supported by Lighting Africa, a joint
90
IDA-IFC initiative. These new business models require the implementation of new financing
mechanisms and de-risking of investments.
• Expand access to electricity, which will also require increasing production, transmission, and
distribution through the rehabilitation of existing infrastructure and new investments. The
completion of the Development of Electricity for Domestic Consumption and Export Project
through the rehabilitation of groups at Inga I and II, and the construction of a second intake canal
are expected by June 2018. Beyond this, low voltage distribution investment is a priority to
minimize losses. In addition, large regional and national hydropower projects aimed at reversing
the sector’s power deficit and positioning the country to export electricity are currently at various
stages of development.
256. In parallel to developing the power sector, the DRC should support the introduction
of clean and modern cooking solutions. The country can reach this objective by facilitating the
development of commercial markets for improved cook stoves and for other energy forms. This
would mitigate deforestation and reduce respiratory illnesses and premature deaths among women
and children as a result of unhealthy cooking practices.
9.1.3. Water and Sanitation: Revamping the Reform Agenda
257. The water supply reform agenda was reactivated in 2013, but the government has not
met its commitment and provides little financial investment in the sector. A performance
contract was signed in 2013 between the state and Regideso. The main challenge for improving
Regideso’s performance is its financial viability, which is inhibited by the nonpayment of water
bills by government agencies. Despite improvements, the utility remains financially unviable.
There are two priorities in restoring Regideso’s financial viability: first, complete the Staff
Reduction Plan initiated in 2010 and cap remaining staff salary increases; second, the government
should comply with the performance contract and pay its water bill to Regideso. The large amount
of public arrears and the out-of-control increase in the wage bill have hampered the initial vision
of the reform to gradually expand major investments to all service centers and create autonomous
regional branches. Hence, struggling to achieve financial viability, Regideso has remained focused
on its core centers.
258. The country context and the persistent challenges to restoring adequate services
reduce the sector’s attractiveness for private partners. Government payment of its water
consumption annually, cost-based tariffs, and control over the wage bill are key to involve private
sector and improve service delivery. The support from a service contract is the only option in the
coming years to enable Regideso to improve its financial and operating performance. Since 2013,
Regideso has benefited from the assistance of a private operator as part of a service contract.
259. The 2015 water law sets the stage for much needed decentralization of the sector. The
law gives the prime responsibility to plan, organize, and monitor public water services to the
provinces and decentralized local entities (entités territoriales décentralisées). It also provides a
legal basis to work directly with provincial authorities or autonomous user associations to realize
urban water investments and recruit third-party operators where Regideso has no functional
presence. In addition to allowing more direct investments in decentralized urban water services in
marginal areas, such alternative approaches may also increase civic and commercial pressure on
91
Regideso to improve its performance. The law also calls for cost-based tariffs and special pro-poor
measures to facilitate the access to water among vulnerable households. Although the law is a
useful step, its implementation faces multiple challenges, including limited capacity in newly
created provinces.
260. The new water law’s impact on the institutional structure, although potentially
profound, has remained largely unrealized. A key challenge in its implementation is to
transform the currently centralized, fragmented, and biased institutional structure to one that is
decentralized, coherent, and more evenly balanced. At the national policy level, two
complementary approaches to implementing the law may be discerned. The first approach
emphasizes the gradual creation of the administrative, regulatory, and legal structures to apply the
law in practice. The second approach argues that the law already provides a basis for key reforms,
such as decentralized asset ownership, service delegation, and at-cost tariffs, and calls for projects
to create practical precedents. The new law could improve coherence and reduce fragmentation by
creating one national ministry, one regulator, and a clear distribution of responsibilities between
central and decentralized levels, as well as providing guidance on the role of key institutions, such
as Regideso. A realistic approach to institutional restructuring should attempt to take the
underlying incentive structure of sector actors into account (for example, control of funding
sources). The delay in the law’s implementation is due to some complexity and inertia of the state
apparatus, and to a political environment that is not conducive for reforms on the short term.
261. Many donors are financing autonomous networks based on the previsions in the new
law and due to Regideso’s persistent deficiencies. This is understandable due to the challenges
of improving performance and ensuring good governance in the water service sector. However,
autonomous networks based on community management are transitional solutions. Hence, they
should be realized in a way that allows for their future integration in the networks of Regideso in
the long term. The government and external partners must ensure that external aid assists Regideso
in managing water systems in a sustainable manner.
262. The next steps in urban water should seek to increase reform pressure on Regideso
and support complementary models directly. The main challenge for urban water is that
improved access is barely keeping up with urban growth. Safely managed access is low while
inequalities in access persist between major and marginal urban areas. The primary cause is the
incomplete reform of Regideso and its structural bias towards major centers, as well as the
weakness of alternative supply models. In urban sanitation, the core challenges are the clarification
of institutional leadership, creation of implementation capacity at the municipal level, and
implementation of replicable pilot projects to break with a century of public inaction and initiate a
cycle of improvement (see Annex H).
9.1.4. Information and Communications Technology (ICT): Accelerating Reform
263. Several regulatory, policy, and operational reforms have the potential to boost the
growth of the ICT sector. These include: (1) building a comprehensive national fiber optic
backbone infrastructure for the provision of broadband services; (2) harmonizing the currently
fragmented wireless, copper, and fiber optic cable networks operating in various parts of the
country; (3) providing affordable access to mobile services; (4) investing in adequate network
coverage for a dispersed population; (5) scaling up investment in the network; (6) streamlining the
92
legal and fiscal framework, which is inadequate and complex and poses significant barriers to
doing business; and (7) modernizing the regulatory environment to enable oversight of a quickly
evolving sector.
9.1.5. Managing Cities for Urban Development and Poverty Reduction
264. The government needs to support productivity and livability within cities in order to
reverse the current trend of socioeconomic exclusion in urban areas. The lack of reliable data
on urban areas is a major handicap for the DRC’s urban development strategy. Policy making and
coordination at the national level have been largely absent. The 2008 government strategy for the
urban sector targeted improvements in living conditions through a land management policy and
activities to curb urban poverty. However, the strategy was not implemented due to lack of
resources and follow-up, and cities continue to be constructed along patterns that could lock in
economic inefficiencies for many decades to come. For example, over 80 percent of trips in
Kinshasa are made by foot. With jobs concentrated in the central Gombe commune, this
substantially isolates workers from jobs.
265. Well-managed cities are key to reducing poverty and increasing prosperity because
they successfully harness greater economies of scale that boost productivity. If people work
and live close together, the proximity creates sufficient density of demand and supply. As the city
grows, it begins to reap the rewards of agglomeration economies through specialization and an
integrated labor market. The unit cost of providing infrastructure and basic services for a dense
pool of workers decreases, which improves livability. As the economy diversifies, productivity
increases. To kick-off this virtuous cycle, the DRC needs to increase investments in city planning
and development. The 2010 urban sector study estimated urban investment needs at 17 percent of
central government expenditures, which amounts to US$ 12 per capita or three times the current
investment level.
266. Building the institutions for urban management will require balancing investments
with the creation of supply and demand for improved local governance. Planning and
managing cities well also hold the potential to generate local revenues that can be reinvested
locally to contribute to filling the infrastructure investment gap, and, just as importantly, to
planning and funding maintenance infrastructure for an overall more efficient approach to public
expenditure. This will be needed to accommodate the over 1 million new urban dwellers in the
country every year and build cities that are more resilient to the climate shocks already taking a
toll on urban dwellers in the form of flooding.
9.1.6. Land Administration
267. Land is critical for the country’s economic growth and poverty reduction, and
efficient land rights registration should be conducive to the development of the economy.
Investment, stability, and the generation and distribution of wealth depend on the legal terms on
which land is held, used, and transferred. Clearly recognized and secured property rights have
many advantages: (1) they promote the development of agriculture and create favorable conditions
for national and international investors to invest in the sector. In addition, secure and formal land
rights encourage farmers to invest in their plots, and can facilitate access to credit. Robust land
tenure systems enable individuals and families to transfer and bequeath rights; (2) they promote
93
stability and help mitigate conflict since most violence originates from competing access to land.
Indeed, social cohesion, conflict prevention, and judicial services depend on clear property rights
and a reliable, transparent system for managing land rights information; (3) they promote urban
planning and development, and decentralization, thanks to better knowledge of urban property
rights. In addition, taxation and hence municipal financial resources are dependent on
comprehensive and updated land information systems.
268. The government recognizes the need to improve its land management policy and has
displayed an interest in land tenure reform since 2012. The DRC ranks 142 on land property
transfers in the World Bank’s Doing Business report. It announced a roadmap for land reform in
July 2012 and created the National Commission on Land Reform in May 2013. However, the
process faced obstacles. The priorities in reform should include recognizing individual and
collective land rights, supplying undisputed lands for agricultural and industrial investments, and
formalizing land rights in urban areas. New land management approaches also need to reflect local
diversity and specificities and should build on existing good local practices. A central institution
should monitor local land management practices and pilot an innovative land registration system
throughout the country. Land reform is a long-term process and may require an initial phase of 5–
10 years to test innovative approaches and update the legal framework. This would pave the way
for a second stage when reforms would be scaled up across the country.
269. The DRC needs to design, pilot, and implement a land management system that
combines customary regulations and a legal framework. The country needs to establish a new
land management system based on improved and legally recognized social practices. Relevant
local practices are surfacing in some urban and rural areas as a result of attempts to document land
use or ownership, such as the fiches parcellaires (land parcel record) in Kinshasa and experimental
customary titles in South Kivu. They could inspire new ways of securing land rights that allow for
more rapid and affordable registration of land rights. This requires establishing a legal framework
for local practices and strengthening local capacities.
270. In addition, the country needs to modernize the land administration system, clarify
responsibilities, and foster the reform process. Challenges remain, including the rehabilitation
of information systems, tools, equipment, and buildings, capacity building, and administration
training. An updated land policy should provide guidelines to help the land administration services
play a new role within an institutional framework that will recognize the responsibilities of
customary authorities and municipalities over land. It is crucial to reconcile inconsistencies and
clarify roles and responsibilities so that the allocation of land rights will not be a source of dispute.
However, the implementation of a new land policy is limited because of institutional issues and
the small size of the National Commission on Land Reform. The government needs to resolve the
institutional issues and support the commission with technical and logistical assistance.
9.2. Managing Natural Resources More Sustainably and Boosting Agribusiness
9.2.1. Oil and Gas
271. Reforms are needed to unlock the potential of the oil and gas sector that promises
new explorations and discoveries. Policy making needs to be informed by best practices if the
oil and gas sector is to reach its potential and effectively contribute to economic development.
94
Decrees regarding applications are currently being developed following the adoption of the new
hydrocarbon code in 2015. The government’s objective is to award new prospecting and
exploration blocks in a competitive and transparent way. Aside from implementing a favorable
regulatory environment, there are many challenges that hamper the development of the sector,
including: (1) reserves are located in contested and difficult areas; (2) infrastructure needs are huge
and production in the east needs to be connected with consumption markets in the west; (3)
exploiting the reserves may raise tensions around environmental and social concerns that could
threaten stability; and (5) governance (see Annex J).
272. To turn these challenges into opportunities, various areas of collaboration and reform
are available to ensure that the oil sector reaches its potential. These include: (1)
implementation of the hydrocarbon code; (2) creation of a hydrocarbon database; (3) use of Lake
Kivu gas to generate 1000 megawatts of electricity; (4) use of gas flaring to generate up to 150
megawatts of power; (5) capacity building; (6) compliance with the EITI; (7) resolution of border
conflicts; (8) promotion of regional integration; and (9) implementation of environmental and
social safeguards (see Annex J).
9.2.2. Mining
273. Sustained growth will depend on government capacity to turn a share of mining sector
revenues into development. This requires the new mining code to fulfill the announced promise
of readjusting rent distribution in favor of the DRC and to the benefit of the population. This also
requires ensuring that expiring contracts and conventions will be offered or renewed under new
terms more advantageous for the country. In addition, the DRC needs to move forward on
completing the geological survey and consolidating the functions of several institutions.
Generating geological information and making it publicly available can ensure an open and
competitive process for contract attributions. In addition, many major companies have their
individual corporate social responsibility programs, but these generally operate in isolation of
development efforts by local and provincial governments. Thus, by encouraging public-private
coordination, company investments can be harmonized to strategically address the big
infrastructure and social needs in the country. Furthermore, in many remote mining areas where
ASM occurs, basic health and other social service infrastructure is lacking, despite high population
density.
274. The newly adopted ASM National Strategy offers a clear framework for the
government to address formalization. Strengthening the small-scale mining support service,
SAEMAPE (Service d’Assistance et d’Encadrement de l’Exploitation Minière Artisanale et à
Petite Echelle), is key for the success of formalization and for enhancing the impact of ASM on
development. Indeed, ASM has high extraction volumes, generates employment and income for
households, and has the potential to generate revenue for national and local entities. However,
efforts are needed in traceability, certification, and formalization. In traceability, the successful
work to combat conflict minerals in the DRC has allowed ASM to develop in the 3Ts. There,
employment has remained steady due to the consistent demand for certified minerals in the eastern
part of the country, reaching over 200,000 people in that area alone. There is also a system to
certify diamonds. Moving forward, formalization in the domestic market should be encouraged to
complement and sustain the benefits of certification and traceability. For example, introduction of
95
government gold-buying schemes, as seen in Ethiopia, could prove an important policy step, be
cost-effective, produce good results, and increase national income.
275. Whether in industrial or ASM activities, governance remains a critical area for the
government (see Annex H). Processes such as EITI have proved an important vehicle to facilitate
open dialogue on the benefits from extractives, and should continue. The government’s own
commitment to financing the EITI process is laudable, despite budgetary constraints since 2015.
Improving the administration of the sector, including tax administration, and monitoring transfer
pricing require both administrative reforms and capacity building efforts. Institutional weaknesses
in the management of mining SOEs are particularly challenging. One way to move forward in this
area would be to have an inventory of SOEs’ assets, and to build business models for major
minerals that allow for the evaluation of revenue streams according to various parameters. This
evaluation would in turn help both in asset valuation and in orienting tax reforms affecting the
sector.
276. The decentralization process will have new implications on governance and stability
in extractives. Further provincial revenue mobilization efforts will for sure have an impact on the
existing tax framework for extractives. While specific commodity taxes are enshrined in the
mining code and are subject to national enforcement, provinces have become active in placing
additional taxes on local extractive projects. Implications are most visible on the bourgeoning
ASM sector. These types of ad hoc practices should be a focus of national dialogue and debate.
Indeed, ensuring the role of mining activities in future inclusive growth requires streamlining and
coordinating revenue policies of local and provincial structures.
9.2.3. Agriculture and Agribusiness
277. Agriculture has become a top priority for the government in recent years. The DRC
allocated 8 percent of the national budget to agriculture in 2016, an increase of 3 percent. The
government’s National Agriculture Investment Plan (2013 Programme National d’Investissement
Agricole) comprises five pillars: (1) fostering value chains and agribusiness; (2) achieving food
security; (3) enhancing research and training; (4) improving sectoral governance, gender
participation, and institutional capacity; and (5) adapting to climate change. The total program cost
is estimated at US$ 5.7 billion up to 2020.
278. Achieving a green revolution in the DRC will require a technological leap combined
with progress on cross-cutting infrastructure and institutional issues. Moving the country
toward a green revolution would entail a two-track approach. The first track consists in
transforming small-scale subsistence farmers into commercial farmers by: (1) increasing
production through access to improved genetic materials (seed breeds), fertilizers, finance, and
technology; and (2) reaching markets more efficiently by enabling producer cooperatives to
identify markets, pool resources, add value, negotiate contracts, and access feeder roads and
storage facilities. This all while ensuring that development does not infringe on ecologically
sensitive areas. The second track consists in restarting private investment in commercial
agriculture using modern technologies geared toward agroprocessing and exports. The government
aims to attract private investment in agroindustrial parks, where it plans to provide basic
infrastructure (transport, water, power, ICT) and a transparent administrative and fiscal framework
(for example, land titles and special economic zone status). This safe haven approach is piloted in
96
peri-urban Kinshasa. There is potential for combining small-scale agriculture and large-scale
agroindustries through contract farming and by supporting midsize operators in relevant value
chains and regions. The productive alliance model will be tested in new operations to reinforce the
commercialization of products and ensure market integration of small farmers.
279. Developing agriculture and agribusiness could promote long-term economic and
social development in the DRC. Boosting crop yields in the DRC to even modest levels would
have a measurable impact on overall GDP. The DRC could double its agricultural GDP, and
increase its overall GDP by 23 percent, simply by increasing crop yields to the level of neighboring
countries in Central Africa. A striving agriculture sector could go a long way to realizing the
following developmental goals: (1) reducing poverty by helping millions of poor small farmers
secure livelihoods and raise sustainable incomes; (2) enhancing food affordability and security
through higher food availability year round in remote rural areas and urban centers; (3) promoting
job creation and economic spillover, since agriculture, agroprocessing, and marketing can generate
more jobs and multiplier effects on services and manufacturing through backward and forward
linkages; (4) enhancing economic diversification and prosperity—agriculture has the potential to
benefit people throughout the country in a socially inclusive way, as opposed to capital-intensive
industrial mining, which is geographically and economically concentrated; (5) improving trade
balance as the country could become a net food exporter; and (6) improving climate resilience by
adapting crops to a changing climate and by storing more carbon in soils.
9.2.4. Forests and Biodiversity
280. Forest-friendly agriculture has high potential for sustained growth and rural poverty
reduction, particularly on degraded and savannah land at the forest frontier. However,
production of agroforestry perennial crops (for example, coffee, cocoa, rubber, palm oil) and of
nontimber forest products as alternatives to slash-and-burn agriculture are currently underfinanced.
These approaches to production require management and enforcement of local development plans
to ensure that these products do not become destructive to the forest cover. They also require
improved governance, clarification of tenure rights, and investment in value chains.
281. Increased control over forest resources would improve sustainability and increase
revenues for the government. Forest law enforcement is underresourced in human, technical, and
financial terms. The lack of control over wood production poses significant sustainability
challenges and reduces the sector’s contribution to national and local economies and government
revenues. Improving control over the resource and the efficiency of its management through a
timber tracking system, including in the dominant informal sector, is therefore key. Supporting
such a system and efforts to formalize the informal sector are priorities. A viable community
forestry regime could represent a new model of resource management. Improved policy
coordination through comprehensive land-use planning and clarification of tenure and resource
rights would improve the investment climate at all levels.
282. The management of protected areas needs to be improved in collaboration with local
and indigenous communities. The government is seeking to replace ad hoc area-specific funding
support with the establishment of a more sustainable funding strategy. A nascent ecotourism
industry has the potential to generate revenues, but this is contingent on the maintenance and
sustainable funding for the system surrounding the protected area, and improved technical and
97
administrative capacity of the Congolese Institute for Nature Conservation. Financing for the
protected area system needs to be dramatically increased; one good option to move in that direction
is to finalize the establishment of the Okapi Fund, the conservation trust fund for the system. The
creation of the Okapi Fund is currently being supported by the World Bank, but establishment has
been very slow and hampered by bureaucratic obstacles; resolving these will help ensure long-
term funding for the sustainability of the protected area system.
9.2.5. Climate Change: Adaptation and Mitigation
283. The DRC has signed the Paris Agreement under the UN Framework Convention on
Climate Change, although it has not yet been ratified. The country submitted an Intended
Nationally Determined Contribution (INDC), outlining national priorities for mitigation and
adaptation programs. Once DRC has ratified the Paris Agreement, its proposal will become a
Nationally Determined Contribution (NDC). Realizing the NDC objective, to reduce greenhouse
gas emissions by 2030 by 17 percent below the 2000 level, is conditional on external funding
becoming available to the country.
284. Reducing emissions from deforestation and forest degradation (REDD+) represents
an opportunity to create forest-smart development and contributes significantly to climate
mitigation. The government should ensure the success of the provincial level Mai-Ndombe
Emissions Reductions Program. The cross-sectoral approach to address the multiple drivers of
deforestation should be programmatic and incorporate the approaches discussed in section 9.2.4.
The programmatic approach offers the opportunity to address simultaneously the challenges of
climate change, poverty reduction, natural resource management, and biodiversity protection.
285. Developing climate-smart agriculture, especially in the dry southern parts of the
country, is an adaptation priority, although the urban poor remain the most vulnerable to
climate change. Agriculture and water resources are the two sectors most vulnerable to climate
change with the most direct impact on rural inhabitants. Extreme rainfall events, droughts, and
floods represent the greatest natural hazards, and may affect economic growth. The impact on
crops and livestock may threaten the incomes and domestic food security of farming households.
The National Adaptation Program of Action indicates that the urban poor are the most vulnerable
to climate change, with an exposure rate of 72 percent, followed by small landowners.
286. The country needs to strengthen institutions to face its environmental challenges.
Environmental degradation continues largely unabated because of a poorly enforced, piecemeal
legal framework in environmental protection. The government is ill-equipped to address
environmental challenges and comply with commitments under multilateral climate agreements.
Decentralization creates an additional challenge, particularly in coordination, enforcement, and
funding of new entities. Priorities include: (1) strengthening human and technical capacity,
including working conditions for staff in remote areas; (2) upgrading infrastructure and equipment,
particularly at the provincial level; and (3) allocating resources for climate-related activities,
including at the Ministry of Environment. Strategies and platforms to integrate civil society and
increase awareness are gradually emerging, although the effort is still wanting.
98
Chapter 10. Resilience and Sustainable Growth through Human
Capital
287. Building long-term resilience and sustained economic growth requires that the
country enhance the stock and quality of human capital. Government policies should focus on:
(1) establishing the preconditions for an eventual demographic dividend; (2) laying the foundation
for future productivity through improved nutrition; (3) increasing access to good-quality health
services, while avoiding impoverishment because of catastrophic health expenditures; (4)
improving the quality of education for employability to harness the demographic dividend;
(5) building a safety net system to consolidate the benefits of investments in human development
and foster household resilience; (6) broadening the benefits of growth through measures to support
youth employment; (7) modernizing the national identity system; (8) enhancing the role of women
to build for the future; and (9) addressing the impact of conflict.
10.1. Establishing the Preconditions for a Demographic Dividend
288. To harness the demographic dividend in the DRC, policies are required that hasten
the transition to smaller cohorts and enable cohorts to be productive. The demographic
dividend is the economic growth potential that may result if the share of the working-age
population (aged 15–64) is greater than the share of the nonworking-age population (under 15 and
over 64). It accounts for a boost in economic productivity that occurs if there are growing numbers
of people in the workforce relative to the number of dependents. The demographic dividend may
be the outcome of falling fertility rates following significant reductions in infant and child
mortality rates. These effects lead to cuts in household spending on dependents and boosts
economic growth.
289. Modest accelerations in DRC’s fertility decline can lead to substantial changes in its
projected age structure. Under the median fertility scenario of the UN World Population
Prospects (WPP) population projections, the total fertility rate (TFR) is projected to fall to only
4.77 by 2030 and 3.43 by 2050. With these fertility rates, the population share of children is
maintaining a steady decline, but will remain high for several decades. Children currently account
for 46 percent of the population, and will remain at more than 42 percent in 2030, and more than
35 percent in 2050. The working-age population currently accounts for 51 percent of the
population, and this age cohort will account for more than 60 percent of the population by 2050.
If fertility declines are slower, as under the WPP’s high fertility scenario, then the future population
share of children is even higher. In contrast, if fertility decline is faster in the future, as under the
WPP’s low fertility scenario, then there will be more potential workers by 2050 due to the higher
share of people aged 15 to 64.
290. The country requires policies to accelerate the reduction in child mortality and help
couples gain access to services and products that will enable them to plan their fertility.
Policies in the following four key areas would help increase the demographic dividend: (1)
reduction in child mortality, (2) increases in female education, (3) improved access to
comprehensive family planning services, and (4) measures to facilitate women’s empowerment.
Enhancements in these four areas are desirable regardless of the potential economic payoffs and
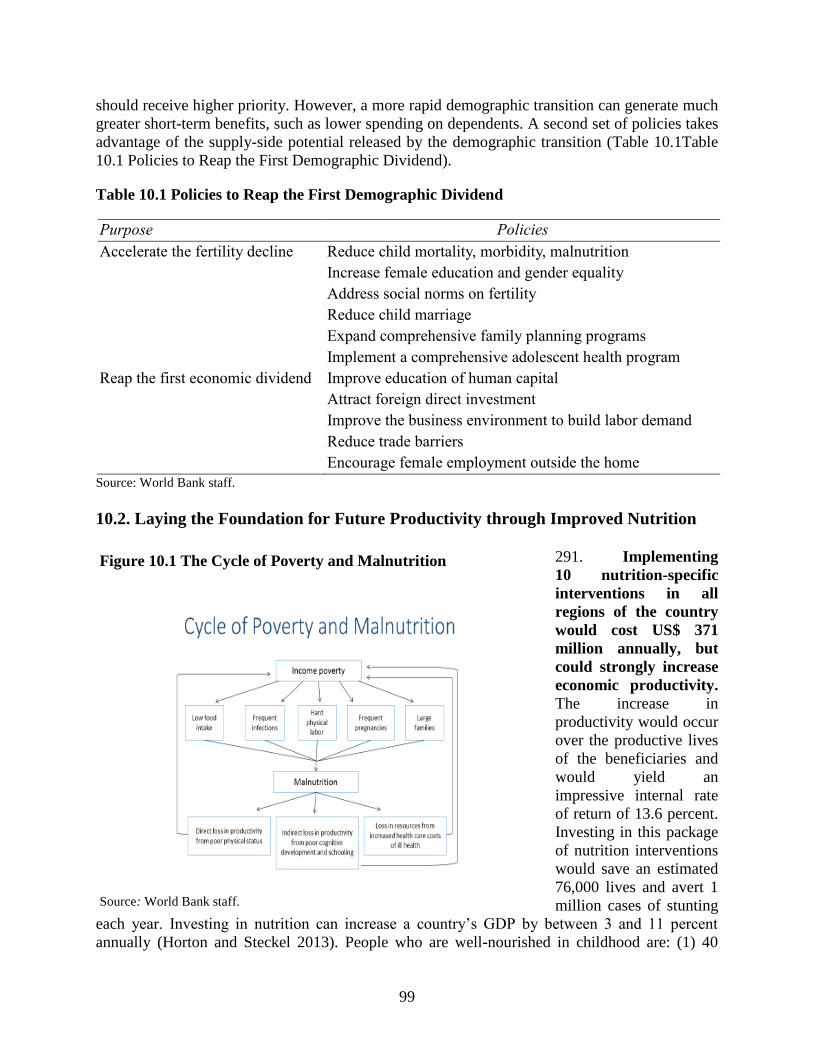
99
should receive higher priority. However, a more rapid demographic transition can generate much
greater short-term benefits, such as lower spending on dependents. A second set of policies takes
advantage of the supply-side potential released by the demographic transition (Table 10.1Table
10.1 Policies to Reap the First Demographic Dividend).
Table 10.1 Policies to Reap the First Demographic Dividend
Purpose Policies
Accelerate the fertility decline Reduce child mortality, morbidity, malnutrition
Increase female education and gender equality
Address social norms on fertility
Reduce child marriage
Expand comprehensive family planning programs
Implement a comprehensive adolescent health program
Reap the first economic dividend Improve education of human capital
Attract foreign direct investment
Improve the business environment to build labor demand
Reduce trade barriers
Encourage female employment outside the home
Source: World Bank staff.
10.2. Laying the Foundation for Future Productivity through Improved Nutrition
291. Implementing
10 nutrition-specific
interventions in all
regions of the country
would cost US$ 371
million annually, but
could strongly increase
economic productivity.
The increase in
productivity would occur
over the productive lives
of the beneficiaries and
would yield an
impressive internal rate
of return of 13.6 percent.
Investing in this package
of nutrition interventions
would save an estimated
76,000 lives and avert 1
million cases of stunting
each year. Investing in nutrition can increase a country’s GDP by between 3 and 11 percent
annually (Horton and Steckel 2013). People who are well-nourished in childhood are: (1) 40
Source: World Bank staff.
Figure 10.1 The Cycle of Poverty and Malnutrition
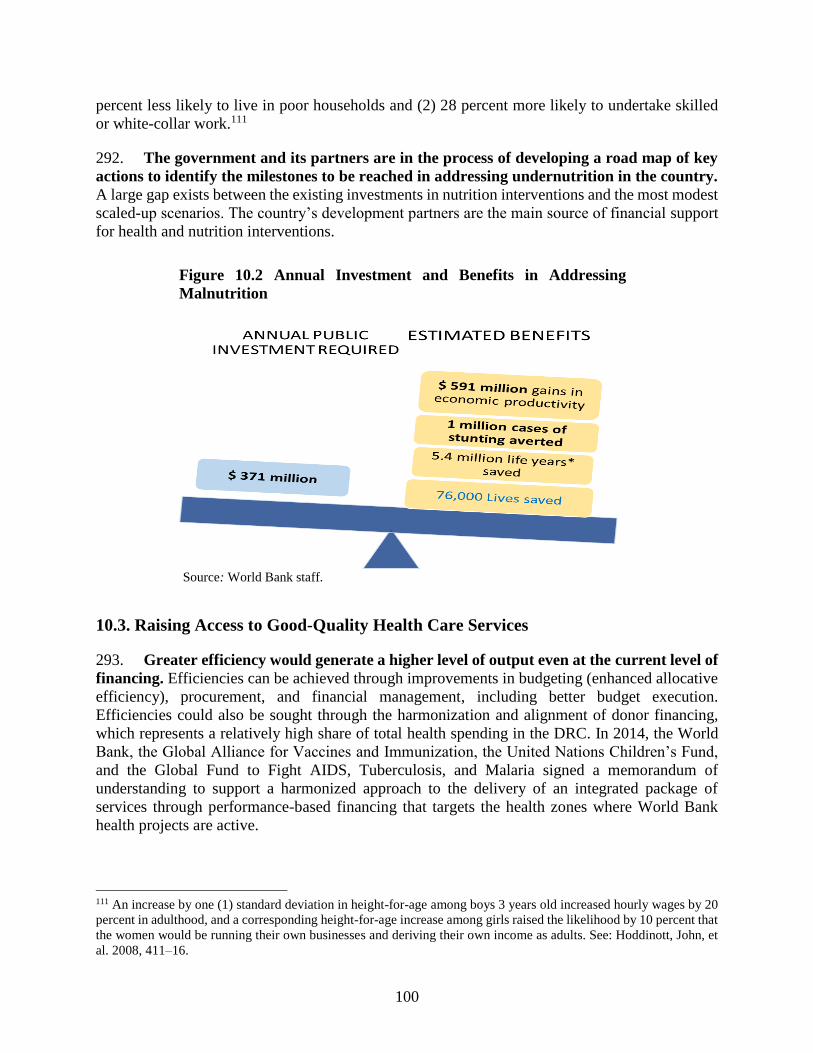
100
percent less likely to live in poor households and (2) 28 percent more likely to undertake skilled
or white-collar work.111
292. The government and its partners are in the process of developing a road map of key
actions to identify the milestones to be reached in addressing undernutrition in the country.
A large gap exists between the existing investments in nutrition interventions and the most modest
scaled-up scenarios. The country’s development partners are the main source of financial support
for health and nutrition interventions.
10.3. Raising Access to Good-Quality Health Care Services
293. Greater efficiency would generate a higher level of output even at the current level of
financing. Efficiencies can be achieved through improvements in budgeting (enhanced allocative
efficiency), procurement, and financial management, including better budget execution.
Efficiencies could also be sought through the harmonization and alignment of donor financing,
which represents a relatively high share of total health spending in the DRC. In 2014, the World
Bank, the Global Alliance for Vaccines and Immunization, the United Nations Children’s Fund,
and the Global Fund to Fight AIDS, Tuberculosis, and Malaria signed a memorandum of
understanding to support a harmonized approach to the delivery of an integrated package of
services through performance-based financing that targets the health zones where World Bank
health projects are active.
111 An increase by one (1) standard deviation in height-for-age among boys 3 years old increased hourly wages by 20
percent in adulthood, and a corresponding height-for-age increase among girls raised the likelihood by 10 percent that
the women would be running their own businesses and deriving their own income as adults. See: Hoddinott, John, et
al. 2008, 411–16.
Source: World Bank staff.
Figure 10.2 Annual Investment and Benefits in Addressing
Malnutrition
101
294. A focus on a basic health service package will be required in the DRC’s resource-
restrained environment. A sharper focus on services that address the highest burden of disease
will enable the government to improve the efficiency of spending at current funding levels. Other
countries, such as Ethiopia, have shown that an initial concentration on a more limited service
package provides space to ensure greater equity, while improving the quality of health care
coverage and government interventions. Once a high rate of coverage of the limited package of
good-quality services has been achieved, additional public resources can be used to expand
services.
295. Addressing the inefficiency in the allocation and use of human resources for health is
critical. A critical reform would involve adjusting the current size, age profile, and skill set of the
workforce to match the needs of the system, including redistributing healthcare workers to
geographical areas in need. The reform must also focus on addressing the lack of worker
motivation while enhancing skills.
296. Improving the operation of the national supply system to essential medicines is a
priority. The government has adopted a cost-recovery policy for medicines in public health
facilities, except for a few selected generic medicines that the government distributes for free to
treat malaria and other diseases.
297. Performance-based financing is a strategy that can help in some of these areas of
reform. This type of financing supports results based on the quantity and quality of the services
produced by individual health facilities or health directorates and services at all levels of the
system. It ensures that cash subsidies are available for health facilities and health administrations,
and that these entities have autonomy in maximizing the use of funding to improve the services
they offer. This way, funding can be used to procure necessary inputs and pay performance
bonuses, while ensuring a high level of accountability and transparency. Performance-based
financing can strengthen the performance of the health sector in tackling crucial aspects of the
health system, such as financing, payments, regulation, organization and decentralization, and
patient satisfaction, while focusing on equity, quality, efficiency, and access. Performance-based
financing can be an effective way to harness the high proportion of the health sector that is
managed by nonstate actors.
10.4. Education for Employability and to Harness the Demographic Dividend
298. Raising the education and training levels of the DRC’s young population has the
potential to fuel more rapid and equitable economic growth and social progress. This
potential demographic dividend will be reaped only if the government makes effective, high-
quality investments to build the human capital of this segment of the population. The government
will need to: (1) promote inclusive basic education to include children of all socioeconomic
backgrounds; (2) ensure that transition rates to secondary and tertiary education are substantially
improved by increasing access for the poorest and for rural dwellers; (3) invest efficiently in
secondary education and in TVET; (5) use evidence to define policy and invest in education quality
throughout the system; and (6) foster an appropriate education program for children in indigenous
communities, as well as a catch-up educational program for street children and other marginalized
young people.
102
299. Education offers improved opportunities for boosting income and increasing the
likelihood of obtaining employment in high-productivity sectors. An additional year of
education is associated with an average rise of 9.1 percent in monthly income, and higher
educational attainment is associated with higher income. Education also increases the chances of
getting high-productivity employment with higher wages and in sectors with greater stability. For
example, an additional year of schooling increases the likelihood of obtaining a salaried job and
occupying a job in a family business by 38 and 12 percent, respectively. Education yields higher
rates of return to investment among individuals at all levels of the education system—23 percent
for completed primary school, 81 percent for completed higher secondary school, 158 percent for
higher education.
300. Government investment in inclusive education and enhanced learning will help boost
economic growth, reduce inequality, and combat poverty. It will help develop capacities and
provide opportunities for the entire population to participate fully in society and contribute to
economic development. Raising the quality of education at all levels is a priority that needs to be
pursued. Primary education attainment needs to be boosted and governance of the education
system needs to be strengthened to reach efficient free and universal primary education. The
quality of post-primary education is also crucial to a high-productivity workforce. Raising the
quality of post-primary education would help address the mismatch of skills and favor youth
employment. About 18 percent of youth entering the labor market do not have any education or
have dropped out of primary education. Structural reforms will be required to improve the equality
and quality of general secondary education. The goal must be to provide students of all
socioeconomic backgrounds with the relevant knowledge and skills to join the workforce.
Curricula need to be upgraded and mainstreamed, with particular emphasis on mathematics,
science, and the development of soft skills. Opportunities for learning need to be made available
to poor students, especially girls. In an environment of competition for public financing, PPPs are
essential to mobilizing the necessary resources and ensuring that secondary education fits the
DRC’s development context.
301. Policy should focus on modernizing TVET and creating a new management and
operating model for technical schools. Effective collaboration will be needed among the many
ministries involved in the delivery of TVET. There is also a need to create an institutional body
for TVET certification to ensure the quality of academic programs, validate professional
experience, and vet work-study programs and traineeships in enterprises and competency-based
teaching methodologies and learning modules. Curricula need to be reviewed to be in line with the
needs of the private sector and supported by modern equipment and instructional materials.
302. At the tertiary level, academic programs must become more practical and support an
enabling environment for teaching and learning. Academic institutions (secondary schools and
tertiary institutions) need to adapt to a new model of management based on private sector
participation and the principles of accountability and management for results. This approach would
rely on the following main features: (1) effective PPPs involving the participation of private sector
representatives on institution management committees to identify and address skills shortages and
develop training programs that balance academic study and practical work experience; (2) a
coherent financial management framework linking needs and priorities to available resources; and
(3) use of performance-based contracting.
103
10.5. Broadening the Benefits of Growth through Support for Employment
303. The challenge related to job opportunities and especially youth employment is closely
aligned with the challenge of promoting inclusive growth. A comprehensive approach would
relieve the constraints on human capital and the business environment. These constraints prevent
the private sector from seizing opportunities and increasing productivity in agriculture,
nonagricultural household enterprises, and the modern wage sector. The key employment issue is
that productivity and earnings are low, while aspirations, especially those of the youth, are high.
304. The solution lies beyond simply expanding government-provided technical and
vocational skills training. Support is needed in the areas that would improve productivity in the
economic activities of households and enterprises. Specific short-term actions include increasing
access to finance for households, enterprises, and firms, and improving access to land and
technology so young people can expand their earnings in agriculture. Furthermore, the government
could improve infrastructure that would increase overall business productivity, and open up access
to regional markets so that firms can broaden their reach. World Bank programs are already
addressing some of these constraints in the DRC.
305. It is equally urgent to undertake actions that can only pay off in the medium term.
For example, improvements in early childhood nutrition and basic education—the foundation for
developing all skills—will take time to translate into higher productivity and better employment
outcomes when these children enter the labor market as adults. Additionally, reforms to the
business climate will require sustained effort and it may take time for investors to respond.
306. In the interim, it is important to deal with the current population who do not have the
skills to meet the needs of the labor market. A number of approaches toward skills training have
worked in other countries, particularly those that were done in close partnership with the private
sector (for example, through subsidized internships) and provided start-up grants and technical
assistance for the most promising micro-entrepreneurs. Labor-intensive public works provide
short-term employment while building community infrastructure. However, it is critical to include
skills development and savings components to expand these types of short-term employment
opportunities into longer-term benefits. This approach is working well in the eastern provinces and
could be expanded to other areas of the country. Ex-combatants are a particularly high-risk group
(many are young) that requires skills immediately, including entrepreneurial training, to facilitate
their reinsertion into society and productive sector.
307. There is also a need for more and better data on employment. The basis for building a
better evidence base on potentially successful, cost-effective approaches to promote employment
is experimentation with careful evaluation of the impacts. Little information is available on labor-
market interventions in the DRC that target job creation and better income-generating
opportunities, particularly among the youth. Such interventions could provide an escape from
poverty and contribute to peacebuilding.
104
10.6. Building a Safety Net System to Foster Resilience and Consolidate the Benefits
of Human Development
308. The absence of an effective safety net system represents an important obstacle to
human development and inclusive growth. It also explains the costly mechanisms used by
households to cope with shocks, such as selling productive assets, taking children out of school,
forfeiting health care, and reducing caloric intake. The consequences in terms of human capital
and individual welfare can be long-lasting and may even promote a vicious circle as poverty passes
to the next generation. The implementation of an effective safety net system can prevent this
downward spiral and reduce the demand for costly social services, such as orphanages or
nutritional recuperation programs. Safety nets can also contribute to social cohesion and reduce
the risk of violent conflict, which is fed by economic hopelessness among some population groups.
309. Evidence shows that safety net programs play an important role in speeding up
poverty reduction, promoting shared prosperity, and improving social indicators. Studies
such as the World Bank’s Independent Evaluation Group112 Safety Nets Review of 2011 have
shown that safety nets increase the quantity and improve the quality of household consumption,
improve children’s nutritional intake, improve children’s education and health status, and increase
expenditures on the productive activities and assets needed to build the resilience of the most
disadvantaged population. Evidence from Africa shows that these programs have a nominal
income multiplier on target communities ranging from US$ 1.34 to US$ 2.52 for each US$ 1.00
provided to poor families as a cash transfer. Hence, safety nets protect household consumption
while helping to reduce poverty and increase productivity in a permanent way.
310. The DRC should pursue the gradual implementation of an integrated safety net
system. The international trend is to avoid fragmenting social assistance across several programs
and instead rely on a systemic approach that facilitates coordination with other sectors (particularly
health care and education), reduces overlaps, and allows for economies of scale. In the DRC, the
creation of a nationwide integrated system can only be a long-term objective that is supported by
a clear and shared vision as well as strong political commitment. The disproportion between the
number of the poor and vulnerable and the weakness of the available budget will require strict
targeting of the extreme poor or even certain categories of the extreme poor.
311. Two types of safety net programs appear appropriate for scaling-up in the country:
direct transfers and labor-intensive public works. These initiatives share several fundamental
characteristics: they have already been successfully implemented in the country at a reasonably
large scale; they can be easily expanded; they are relevant to the vast majority of vulnerable
households; and they function in coordination with other sectors.
• Direct transfers have been used extensively by humanitarian actors in the east and will soon
be piloted by the Ministry of Social Affairs in Bandundu and Kinshasa. While setting
conditionalities, such as school attendance, would probably be too challenging administratively,
accompanying measures such as nutrition and hygiene education have proven quite effective in
other countries and could be used to complement efforts to enhance social service delivery. The
112
Internal Evaluation Group (IEG). 2011. Evidence and Lessons Learned from Impact Evaluations on Social Safety
Nets. Washington DC: World Bank.
105
transfers should preferably be in cash, considering the lower unit cost compared with in-kind
transfers and the greater flexibility allowed by cash in addressing the multiple needs of poor
households.
• Labor-intensive public works have been used extensively to provide temporary employment to
populations affected by conflict. Most of these cash-for-work programs have been implemented
by humanitarian and United Nations agencies, but the experience of the Social Fund, an
autonomous government agency under the Office of the President, demonstrates that governmental
actors are capable of running such programs. Given the huge infrastructure deficit in the country,
scaling up these programs would serve the double purpose of benefiting poor households and
stimulating the local economy.
312. The administrative and technical challenges of running a large safety net program
and the limited budget available mean there must be strict targeting. The government is only
running one nationwide safety net program, the welfare card scheme (carte d’indigence), a fee
waiver program. Although the program could help in establishing a national civil registry of
vulnerable people, which is one of the building blocks of a social protection system, reforming it
would probably prove too costly and time consuming. Eliminating the program would likely be
the best option even if politically difficult, unless considerable and sustained technical assistance
is made available.
313. Cash-for-work programs are the type of safety net that should be given priority in
scaling-up. Labor-intensive public works should be extended countrywide, because there is no
shortage of work that could be carried out with labor-intensive techniques (for example road
maintenance, ditch cleaning, reforestation, terracing, garbage collection, etc.). These would not
only benefit beneficiaries, but also society as a whole. The ministries in charge of public
infrastructure should adopt policies requiring the systematic use of labor-intensive techniques
whenever possible. The main challenges would be to adopt objective and transparent targeting
mechanisms that could later provide the basis for a national social registry, and ensure the technical
quality of the works. The latter is important considering the mixed experience with road
rehabilitation.
314. Cash-for-work programs are also increasingly used to promote resilience by offering
a variety of accompanying measures such as capacity building and matching grants. In this
way, they can function as safety nets, but also as springboards to facilitate the transition to
sustainable employment, which is often self-employment. The Social Fund is piloting this
approach in the eastern provinces, and the planned impact evaluation will serve to draw lessons
for the rest of the country. The instruments developed for this program—targeting, identification,
registration, monitoring, and evaluation—could be used to establish the building blocks of a
national social protection system.
315. A large-scale works program should eventually be complemented by a cash transfer
program tested through pilot experiences. Humanitarian actors in the east have already
successfully implemented cash transfer programs for the internally displaced. The government
should build on this experience when it pilots its own cash transfer program. Piloting would make
it possible to determine if this type of safety net is appropriate in the country outside of a
humanitarian context and if the government has the capacity to manage such a program. It would

106
also help to identify the most appropriate implementation mechanisms. However, piloting in the
absence of a clear commitment to eventually scale up would make little sense.
10.7. Modernizing the National Identity System
316. An identity system could help the country enhance the efficiency of social protection
systems, reduce poverty and vulnerability, and have large payoffs in health and education.
Dahan and Gelb (2015) identify social protection among the areas that would benefit from
improved identity systems. Social protection systems require robust identity management to
strengthen the assurances that funds are properly used. These systems also offer the opportunity to
expand financial inclusion among the most vulnerable through direct payments to bank accounts
(or mobile money). Considering the levels and depth of poverty in the DRC, a strong social
protection scheme can be a major tool for boosting resilience and reducing poverty through
targeted transfers. The current welfare card scheme is not a reliable proof of identity and imposes
a cost (US$ 10) that impedes reduced-fee access to services. In education, identity systems are
essential in monitoring the progress of individual pupils; observing how pupils enter, progress, and
exit the school system; and verifying academic credentials. In health, the identity system would
support the management of universal health care. Cause of death statistics, collected as part of the
end-of-life process, would support more effective targeting of health care expenditure financed by
the government or external sources.113
317. Careful thought is needed on how to implement civil registration and the identity
system in the DRC. Gelb and Diofasi (2016) highlight three key goals (identity cards for all,
unique and verifiable identity cards, and systems integration for cost effectiveness) and three key
risks (exclusion, misuse of data, and inefficient use). Given the concerns about nationality, it may
be useful to focus first on individual identity rather than national identity. The initial focus could
be on reform and modernization to increase the efficiency and transparency of the fees for the civil
registration and vital statistics system (registration of births, marriages, divorces, deaths). This can
be obtained by introducing modern information and communication technologies. The government
announced plans to release a biometric passport, but the US$ 125 cost is prohibitive, and the
passport would be used by only a small share of the population. Given the high number of youth
who do not exist legally because they do not hold a valid birth registration certificate, opportunities
should also be sought to organize catch-up birth registration campaigns in association with other
mobilization events such as vaccination campaigns and school registration days.
318. Weak identity infrastructure penalizes financial services that could promote
productive investment and a reduction in fraud (bancarisation) and money laundering. Banks
face substantial hurdles in meeting the know-your-customer obligations. This forces them to
develop their own identification protocols, which are costly and reduce availability of financial
services, including loans. Those who are most likely to be negatively affected are the poor and
vulnerable. Without reliable, consistent identification, banks also cannot develop a shared database
of customer loans, an essential tool in the development of credit markets. This impedes financial
regulation and the speed with which funds can be recycled in the economy.
113
Barroy and Andre et al. 2015.
107
10.8. Reforms to Enhance the Role of Women in Building the Future
319. Addressing gender inequality in the DRC will require mainstreaming, but also a focus
on achieving results that foster the elimination of gender gaps. Key areas include: (1) applying
the new family code; (2) improving gender equality in access to basic services; (3) expanding the
economic opportunities available to women; and (4) promoting gender inclusion in policy and
decision-making bodies within communities. In addition, the following areas need to be addressed:
(1) sexual and GBV; (2) managing masculinity and male identities, particularly the challenges
confronting young men at risk of reengaging in conflict; and (3) applying a gender lens in programs
for IDPs.
320. The adoption of the new family code has removed a variety of discriminatory
provisions and paved the way for improving gender equality. The DRC has taken a bold step
forward in adopting its new family code, but considerable work remains to ensure that it is
effectively applied. The new code allows married women independent access to finance, property
rights, and entrepreneurship, and expands professional options for women. It also increases the
minimum age of marriage for girls from age 15 to 18. The new code should significantly improve
women’s access and control over their own assets, enabling them to engage in sustainable
economic activities.
321. Interventions that target gender equality in school enrollments among girls are
important in allowing the country to capture the demographic dividend from its youth bulge.
Recent impact evaluations suggest that conditional cash transfers can have substantial impact on
schooling among girls as well as on early marriage and adolescent fertility (see Akresh et al. 2013
on Burkina Faso; Baird et al. 2010 on Malawi). Particularly relevant to the DRC, conditional cash
transfer programs have been successfully implemented in settings with low administrative
capacity, where they have helped increase school attendance, the use of health facilities, and
household savings and investments. They have also encouraged greater community engagement,
especially among women (see Evans et al. 2014 on Tanzania).
322. Programs should aim at removing the constraints on economic empowerment of
women, which would also help address the country’s high fertility rates. Job creation programs
should include a specific focus on the creation of SMEs among women. Private sector development
and employment programs in agriculture should continue supporting the promotion of small-scale
agricultural businesses run by women, improving women’s access to finance, enhancing
agricultural service delivery to meet the needs and priorities of women farmers, and ensuring
gender inclusion in community organizations and decision-making bodies. Given the large youth
population, there should be a particular concentration on interventions aimed at adolescent girls.
There is strong evidence that interventions combining vocational and life skills can have
significant impact not only on economic opportunities among young women, but also on sexual
and reproductive behavior (see Bandiera et al. 2014 on Uganda).
323. The DRC needs to increase women’s participation in Parliament and at the local level
by ensuring gender inclusion in community-level and decision-making bodies. Local and
community mechanisms aimed at improving demand-side governance would provide significant
opportunities to enhance the participation of women. Women’s participation could thus be
enhanced in health care, school management, and parents’ committees, and in decision-making on
108
local priorities. However, a recent study in the DRC showed mixed results. For instance, making
women’s participation mandatory on committees did not change attitudes about the role and
responsibilities of women (Humphreys et al. 2014). Moreover, differences in project selection
between the control group in which women’s participation was not mandated and the groups where
this participation was mandatory did not reflect the different preferences of men and women.
10.9. Addressing the Impact of Conflict
324. The government is implementing a series of programs with the aim of transforming
conflict and boosting development. Specifically, they address GBV, demobilization and re-
integration of ex-combatants, agricultural development, social infrastructure, short-term
employment, community dialogue, land management, the needs of displaced persons, and steps to
strengthen the resilience of small-scale traders (mainly women). These programs are all supported
by the Great Lakes Region Conflict Facility, which assists in the development of conflict-
transformative subprojects, brings local stakeholders onboard, and provides analytical services.
325. Considering the deeply rooted and political causes of violence in the country,
programs cannot merely be focused on infrastructure, capacity building, or development.
Three main principles should guide conflict-transformative programs in the DRC. First, the
theories of change behind any program should be spelled out in terms of how and where it intends
to engage with the negative dynamics of conflict. Because the drivers of conflict differ
fundamentally across areas, programs must adopt a geographically diverse approach. Programs
should actively seek to transform conflict. Second, programs should analyze who is involved in
the production of violence or the production of resilience and target them. Activities often target
either vulnerable groups, such as women and children, or groups at risk of mobilization for
violence, such as youth and demobilized soldiers, and aim to integrate these groups into the
decision-making process. Dialogues with communities also reveal where programs may have an
impact on tensions among groups. To ensure the careful targeting of interventions, programs
should be accompanied by fragility and political economy assessments. Third, programs should
enhance ownership and use an explicit community-driven development approach, where
beneficiaries are involved in setting priorities, selecting implementation partners, and participating
in the work. As the Eastern Recovery Project is demonstrating, community-driven development
projects also provide a platform for community-based conflict management and prevention.
326. The United Nations-World Bank collaboration needs to continue to leverage the
World Bank’s technical expertise and combine these strengths with the UN’s political and
security mandate. This should allow programs to have an aggregate impact, including through
the many other partners working on peacebuilding in the eastern provinces. At the regional level,
the World Bank will continue to maintain close contacts with the Office of the UN Special Envoy
for the Great Lakes region and provide technical expertise to a series of regional initiatives under
the regional Peace, Security, and Cooperation Framework.
327. Programs tailored to specific groups affected by conflict should continue in the
eastern provinces. These programs are targeting: (1) IDPs and host communities; (2) survivors of
sexual violence; and (3) ex-combatants and male youth at risk of reengaging in conflict.
109
328. Programs for IDPs should include a gender lens. Specifically, they should: (1) undertake
efforts to clarify changes in gender roles and relations among IDPs; (2) address issues among
vulnerable groups, such as women and children; and (3) incorporate needs and vulnerabilities of
young men and issues of masculinity in gender-related humanitarian and development responses.
329. Expanded planning to address the high levels of sexual violence is needed
countrywide. Fighting sexual violence requires a two-pronged strategy: (1) a continuation of
dedicated, stand-alone initiatives aimed at sexual and GBV that incorporate response and
prevention interventions; and (2) a multisectoral approach that integrates components and planning
on sexual and GBV into relevant sectors, such as health care, education, IDPs and refugees,
economic empowerment, criminal justice, and correctional services. Planning should include
activities that support awareness-building and advocacy to promote gender equality, behavior
change, and violence prevention to shift attitudes and norms, reduce violence, and break cycles of
violence in fragile environments. To decrease the currently high levels of sexual violence, the issue
of the impunity of the perpetrators of sexual violence must be addressed. A rigorous evaluation of
the impact of a stand-alone sexual and GBV program in South Kivu (Bass et al. 2013) found
significant improvement in the overall well-being of survivors after the provision of cognitive
processing therapy, as well as village savings and loan schemes.
330. Adverse masculinities and male identities are a serious challenge, and many ex-
combatants and young males are at risk of reengaging in conflict. To prevent violence and
change behavior, cognitive and life skills interventions should focus on developing traditional
livelihoods and promoting business skills. Community-driven development programs or specific
youth empowerment interventions should also aim to increase resilience, particularly among
youth, by combining high-intensity labor projects with capacity building and behavior change
interventions. These programs should integrate approaches that address not only the economic
needs of targeted youth populations, but also the challenging social, behavioral, and normative
dynamics.
331. Impact evaluations offer evidence that multipronged programs can be successful
among young men, including in fragile and post-conflict settings. In Liberia, Blattman et al.
(2015) show that a combination of cognitive behavioral therapy, life skills training, and cash grants
brought about a higher level of savings and a 50 percent reduction in crime and violence. A
program that specifically targeted ex-combatants in Liberia through agricultural training, capital
inputs, and counseling found that the combined intervention brought higher profits and reduced
illicit and mercenary activity. In Uganda’s Karamoja region, combining life skills training and
livelihood diversification programs and targeting at-risk young men resulted in promising trends
in youth behavior change, perceptions on domestic violence, and improvements in interpersonal
relationships (Feinstein International Center 2014).
332. Ongoing, tailored programs should continue to be directed at demobilized and
reintegrated ex-combatants. Breaking the ongoing cycle of violence requires therapies focused
on trauma to address posttraumatic stress disorder (PTSD), depression, substance abuse, and
appetitive aggression among ex-combatants and others formerly associated with violent groups.
Narrative Exposure Therapy for Forensic Offender Rehabilitation (FORNET) has been piloted
with success in several conflict-affected settings. In North Kivu, ex-combatants receiving
FORNET showed a significant decrease in the symptoms of PTSD and improved reintegration
110
outcomes (Hermenau et al. 2013; Köbach et al. 2015). In Burundi, FORNET beneficiaries
committed fewer violent acts and exhibited reductions in other combat- or stress-related problems,
including substance use disorder, physical illness, and depression (Crombach and Elbert 2015).
Similar promising results have also been found in a recent trial with youth gangs in South Africa
(Hinsberger et al. 2016).
333. World Bank-supported programs should be well-coordinated with the actions of
humanitarian organizations. As the World Bank report Forcibly Displaced114 points out,
development activities are part of a broader international effort that has political, security,
humanitarian, and diplomatic dimensions. Attention must be given to each dimension in order to
deliver a comprehensive and effective response. The report argues that the best results are likely
to be achieved when humanitarian and development actors work together. The humanitarian-
development nexus has long been seen as sequential, with an initial humanitarian response
followed by a development effort when the situation stabilizes. In fact, rather than replace or
succeed each other, both sets of actors can engage in complementary efforts for greater impact
throughout the entire period of forced displacement. Humanitarian and development agencies have
different objectives, counterparts, and instruments—this can be a source of strength. Given the
protracted nature of the humanitarian crisis in the DRC, its development partners have increasingly
been working to reduce the gaps in the humanitarian-development nexus in order to improve
development outcomes and enhance sustainability.
114
World Bank 2016.
111
Chapter 11. Leveraging the Private Sector: The Role of Investment
Climate Reforms and Institutions that Support Markets
334. The DRC must go beyond formal policy reforms and focus on their effective
implementation. Together with strengthening governance, implementation of reforms should
foster private sector-led growth by unlocking the full potential of the sector through greater
productive and responsible private investments. A key challenge will be to ensure that
implementation is effective outside major urban centers, particularly in the context of the recent
division of the country’s 11 provinces into 26. Also, it will be vital to strengthen the dysfunctional
commercial justice system.
11.1. Going Beyond Formal Policy Reforms: Effective Implementation of Reforms
and Stronger Governance to Boost Greater Productive Investments
335. A good investment climate provides opportunities and incentives for firms, whether
microenterprises or multinationals, to invest productively, create jobs, and expand.115
Therefore, a good investment climate plays a central role in growth and poverty reduction.
However, according to the WDR 2005, “Progress requires more than changes in formal policies”;
and, “over 90 percent of firms in developing countries report gaps between formal policies and
what happens in practice. And the content as well as the implementation of policies are vulnerable
to a deeper set of policy failures.” In the DRC, private firms report that these gaps are wide and
continue to widen as the country undergoes an economic crisis, exacerbated by political tensions
and uncertainties.
336. Effective implementation can be achieved through stronger leadership and more
effective coordination of reforms. Indeed, experience shows that all countries that have been
successful in efficiently implementing reforms to improve their business climate are those that
have set up specific government units to monitor and strengthen reform efforts. These units are led
by high-level officials with the necessary power to implement the required changes. In this respect,
the revitalization of the DRC’s Intergovernmental Steering Committee on Business Climate could
be useful. Another hurdle to effective implementation is the lack of communication around reforms
to inform and train implementing agencies, especially in areas outside of major business centers.
The communication deficit also concerns the private sector, and many private actors complain
about key policy changes introduced without prior consultation. Moreover, the absence of a
platform for dynamic and inclusive public-private dialogue prevents a strong, meaningful, and
permanent policy discussion between government and business.
11.2. Strengthening the Commercial Legal System to Protect Property, Business, and
Contracts Rights
337. Strengthening the commercial legal system would remove a major bottleneck to the
development of the private sector. Improving the ability of courts to resolve commercial
disputes, and promoting other dispute resolution mechanisms—such as mediation and
arbitration—will help reduce the risks firms face, in particular SMEs, and increase their 115 World Bank WDR 2005, A Better Investment Climate for Everyone.
112
willingness to invest more. Better-performing courts will also help businesses enjoy greater access
to credit. Indeed, banks view the inefficiency of the commercial justice system as a top risk for
SME financing. As a result, access to credit remains a great challenge for firms.
11.3. Enhancing Financial Infrastructure and Regulation to Scale-Up Business Access
to Financial Services
338. Strengthening the financial infrastructure (payment systems, credit bureau,
collateral registry) and the underpinning legal and regulatory framework in the DRC is a
critical step toward establishing the core foundations of a sound financial sector. In fact, more
adequate financial infrastructure could not only ensure increased access to financial services and
the long-term viability of increased access, but would also contribute to stabilizing a sector that
has faced crisis in the past and is currently undergoing another one. Further efficiency could be
gained through better financial infrastructures.
339. Improving credit infrastructure with a modern credit reporting system can help
improve access to finance, including for the unbanked or underbanked by providing them
with viable credit histories. A key element for improving the financial sector would be to assist
the DRC design of a regulatory and financial infrastructure that facilitates access to credit,
particularly for SMEs, with effective collateral and credit information systems as well as strong
disclosure requirements. This would also include finalizing implementation of the new credit
bureau system to complement the current Central Risk Division; and the design of a movable
collateral regime which can contribute to greater access to finance for all firms, in particular SMEs.
340. Implementation of National Payments System infrastructure needs to be completed
urgently to support the strengthening of the financial sector, dedollarization efforts, and
creation of a more inclusive economy. With the support of the World Bank, the BCC is in the
process of establishing an Automated Transfer System, which will represent the backbone of the
DRC National Payments System. Other key steps that should follow include implementing
National Payment System legislation and strengthening of the payment system oversight function.
The BCC is also planning to develop a national payment switch, which will help increase
convenience to customers when making payments by achieving full interoperability of payment
instruments as well as pushing banks and payment service providers to further expand their reach.
341. Increased access of individuals and SMEs to financial services, starting from
transaction accounts, will be a key enabling factor for deepening the inclusiveness of the
financial sector, hence paving the way for the population to access other financial services.
As explained in the World Bank-CPMI Payment Aspects of Financial Inclusion116 report, a robust
national payment system is one of the foundations to improved financial access for both
individuals and SMEs. Financial sector players need to contribute to this by designing adequate
products that address the needs of the population and by expanding their network of access points.
This also requires that an enabling legal and regulatory framework is established, whereby banks
and other players can expand their offer and reach. Lastly, authorities can boost access and usage
116
For more information on the World Bank-CPMI Payment Aspects of Financial Inclusion report, please see
http://www.worldbank.org/en/topic/paymentsystemsremittances/brief/pafi-task-force-and-report.
113
of electronic payments by leveraging large volume payment streams, such as payments to and from
the government.
342. In the same vein, PE/VC117 legal regulatory and institutional reforms will be
embedded as a way to increase access to finance for MSMEs. Globally, young SMEs are the
primary source of job creation. A recent OECD study across 18 countries over the 2001–211 period
shows that young SMEs (less than five years old), although representing on average 17 percent of
employment, contribute 42 percent of total job creation and only 22 percent of all job destruction,
making them net job creators. By contrast, older SMEs are generally net job destroyers. The
disproportionate contribution of young firms to employment creation holds across all economies,
sectors and years considered.
343. The strengthening of microfinance and the reform of the insurance and pension
sectors could facilitate the expansion of financial services and attract long-term investors.
An overall reform of the legal and supervisory framework of the microfinance and financial
cooperatives sectors, as recommended in the Financial Sector Assessment Program (FSAP) 2014
review carried out by the World Bank and the IMF, would enable greater reach and sustainability
and broader financial access. Supporting technical innovation, including mobile banking, would
also greatly help ensure more financial inclusion. Many banks have developed digital services to
reach out to more customers across the country offering various walletless services including
online banking and electronic transactions. Banks and telecommunications operators may
cooperate to spread financial services to the doorsteps of customers in remote, underserved, rural
areas. Support will be required for the newly established insurance supervisory body, ARCA
(Autorité de Régulation et de Contrôle des Assurances), to help it build its technical capacity and
design supervisory policies and insurance regulations.
344. Strengthening the BCC, a well-defined crisis management framework, and the
upgrading of the banking sector’s resolution and liquidation framework are crucial. Ensuring
the effective independence of the BCC will be key for further strengthening the financial sector.
The BCC should build its capacity; make better effort in monitoring and in the timely addressing
of compliance by banks with legislation, regulations, and best practices; and enforce sanctions.
The implementation of risk-based supervision by the BCC is essential to avert or mitigate crisis.
The recent banking crisis has demonstrated that the resolution framework needs to be streamlined,
including by reinforcing liquidator powers. This would help eliminate significant delays and
reduce actual costs to the budget. Adoption of any (limited) deposit guarantee scheme on
Congolese franc-denominated deposits should be conditioned on steps to limit moral hazard and
the assurance of sufficient fiscal backstops.
345. Lastly, an adequate framework to ensure responsible financial inclusion could
further assist in improving financial access and ensure its long-term benefits and viability.
The World Bank is expected to assist the BCC in implementing some key measures to ensure more
transparency with regard to transaction accounts and to explore potential ways to implement
targeted financial education programs.
117
PE = Private Equity, VC = Venture Capital.
114
11.4. Addressing the Shortage of Skills by Building a Relevant Education Curriculum
and a Stronger Labor Market
346. As the economy expands, the employment challenge is expected to become even more
critical. Matching business needs and labor skills is essential to sustain the country’s development
and ensure better living conditions for workers. Job seekers and school graduates need to learn
new skills so they can better leverage their assets to find decent employment. (Box 11.1).
347. Possible measures to match skills with labor needs could include the following:
• Support the creation of a platform that will join education authorities and private sector
and academic institutions in a mission to ensure a better match between the skills of young
graduates and job seekers and those needed by DRC employers. This partnership should allow for
better sharing of labor market information to enable students, graduates, and job seekers to access
the information they need to make informed education and career decisions.
• Foster collaboration between educational structures and industries to ensure that curricula
are relevant and meet the needs of industries.
• Support round-table discussions with various stakeholders to discuss the best way to
support entrepreneurship programs, internship, and hand-holding programs for young graduates.
Box 11.1 Accompanying the Informal Sector: Entrepreneurship to Reduce Poverty
The informal sector represents a major source of employment and offers opportunities to the most vulnerable,
namely the poorest, the women, and the youth. As showed by the Poverty Assessment (World Bank 2017,
forthcoming), the informal sector in the DRC is a mix of three groups of micro enterprises. The first is a group of
growth-oriented entrepreneurs (top-performers) who enjoy a higher level of capital. The second and the largest
group are micro enterprises, mainly owned by poor, are low performing firms that struggle to grow (“survivalist”).
The third group (constrained gazelles) includes entrepreneurs with high-unexploited growth potential but have
low performance.
Poverty and income inequality are more prevalent among constrained gazelles and survivalists than among top-
performers. Income inequality among informal firms is mainly explained by performance gaps, differences in
educational attainment of the owners, and lack of access to credit. Drivers of micro enterprises performance
include mainly characteristics of entrepreneurs, such as age, education, and managerial skills, but also differs
depending on whether the firms belong to the group of top-performers, constrained gazelle, or survivalists. Thus,
policies aimed at reducing the performance gap between top-performers and the two other categories of informal
firms – constrained gazelles and survivalists – could decrease income inequality and reduce poverty.
Policies aimed at achieving poverty reduction in the DRC should be tailored to each of the three groups in the
informal sector. For survivalists, priorities should focus on providing vocational training to improve their technical
and managerial skills and raise the sense of entrepreneurship. Improving financial literacy as well as easing their
access to finance is also essential for this group. For constrained gazelles, unlocking their potential would require
easing access to credit and providing training programs to improve their managerial skills. For top-performers,
assistance could further strengthen their managerial skills, and improve their access to infrastructure, allowing
them to expand their markets.
Source: World Bank staff.
115
• Work in partnership with stakeholders to determine if there is need to create better
incentives for employers to take on more apprentices for training, as well as to train and upgrade
the skills of their existing apprentices by providing more on-the-job training.
• Initiate round-table discussions with various stakeholders to think about the best possible
way to increase support to vocational education.
11.5. Expanding the Market of Business Development Services (BDS) Providers to
Support Entrepreneurs
348. Potential support to expansion of the BDS landscape should primarily focus on: (i)
public institutions, such as OPEC and INPP, expanding collaboration with privately-owned BDS
providers to increase reach to provinces and remote areas; (ii) developing specialized BDS and
aligning them to the potential needs of sectors, as well as facilitating the emergence of BDS
providers countrywide; (iii) resuscitating technical platforms initiated by large firms to foster
technical skills within their value chains (this is the case with platforms developed in the mining
sector in the Katanga province); and (iv) scaling MSME support through platforms initiated by
donors, such as the WBG International Finance Corporation (IFC) Business Edge and the
International Labor Organization GERME.
11.6. Facilitating Access to Markets
349. The DRC is becoming increasingly urban, with a growing demand for goods and
services from the urban population. The urban population is concentrated in a few large cities,
such as Kinshasa which is expected to reach 20 million residents by the year 2020.118 In the new
context, more than in the past, these cities provide strong social and economic opportunities that
can materialize through the development of integrated growth poles. These can pull economic
activities around main cities and at the same time facilitate connection with other regions to tap
into provincial diversities (based on comparative advantages) and foster internal market
development.
350. Possible strategic options could take into account the following orientations:
• Increasing inclusivity in the supply chains of large firms to lift the growth of MSMEs.
The focus should be on facilitating partnerships between MSMEs and companies whose supply
chains integrate large numbers of suppliers and retailers. These companies can be found in
different high potential sectors, such as extractive industries (mostly in Katanga, North-Kivu, and
Province Orientale), agribusiness with breweries, construction (for example, cement plants in
Kongo Central), manufacturing, telecommunications, and financial services. MSMEs need to
improve in the area of skills development to properly align with the operations of large firms.
Along with improving market access for MSMEs, there is a need to create sound policies and
measures to protect large firms in nascent and priority industries from uncontrolled competition
from regional economic space and to alleviate pressure on large firms (for example complexity of
tax regimes, etc.).
118 Misilu MN, Eric et al. 2010.
116
• Increasing the effectiveness of access to public contracts for large local firms and
MSMEs through the development of a regulatory framework and institutional capacity that
facilitates the fight against corruption in procurement.
• Streamlining and strengthening the legal framework and building up institutional
capacity to ease the implementation of the law on small trade.
• Leveraging the DRC’s unique geographic position in Central Africa to improve cross-
border trade and connections to regional markets. The DRC has nine neighboring countries it
can trade with and each of its provinces bordering these markets has abundant, specific, and
diversified wealth, and natural resources. This can translate into comparative advantages for
MSMEs and large firms. Support to targeted provinces is critical to: (i) develop strategic options,
develop the required infrastructure, build institutional capacity (including at borders), and adopt
measures to create an enabling environment for private sector investment in targeted priority and
high potential sectors; and (ii) prepare and strengthen private businesses, individually and/or in
associations/cooperatives.
• Reviving the country’s regional integration by working on readiness to play an
effective role in regional markets. To benefit from regional integration, the DRC needs to invest
heavily in infrastructure (for example ports, etc.) and institutional capacity to improve its
investment climate and attract resources in high potential sectors. If the private sector starts to
shrink as result of inability to compete in regional markets and against foreign products, the local
economic tissue would eventually vanish.
11.7. The Impact of Security and Macroeconomic Stability on Private Investments
and Private Sector Behavior
351. A critical overarching concern for entrepreneurs in the DRC continues to be the need
for greater physical security. There is a need to further consolidate the peacebuilding process
and to maintain political as well as macroeconomic stability. These are two essential prerequisites
for other policy improvements to gain traction and meaningfully reduce risks for all investors.
352. Most businesses in the DRC shorten their time horizons because of the insecure and
risky business environment. The environment is marked by considerable uncertainty about the
future, and both formal and informal businesses engage in activities they believe are lower-risk
and/or offer a higher return. Therefore, the challenge for the government is to reassure businesses
to take a longer-term view and accept somewhat more risk. It will also have to incentivize private
firms to meaningfully invest and create many more jobs in priority (yet more challenging) sectors,
such as agribusiness, infrastructure, and manufacturing; and in conflict-affected areas where
investment conditions are even more difficult. This is particularly vital for the growth of SMEs as
it is widely believed that success in business in the DRC depends more on ability to rely on
networks (social, political, and other connections) and bribery than on entrepreneurial skills and
competitiveness.
117
ANNEXES
Annex A. Drivers of conflict in the DRC and the Great Lakes region
a. Drivers of conflict in eastern DRC
353. The weakness of the state in projecting its power within its borders is a critical factor
that contributes to regional instability. While a number of states in the Great Lakes region are
weak in their capacity to secure their borders, and ensure internal security, the DRC poses a
particular challenge given its size and location, with borders shared with nine other countries. The
DRC did not inherit a national public administration system from the colonial period, and more
than 30 years of subsequent misgovernance left the state with little ability to secure and administer
the vast territory of the DRC. The central government does not have adequate capability to provide
national security; nor do provincial governments have the capacity to manage internal security as
this is a concurrent responsibility with the central government. The spillovers from the ethnic
genocide in Rwanda have had a particularly devastating effect through the presence of armed
groups in eastern DRC, and have resulted in periodic military interventions by Rwandese security
forces and alleged sponsoring of militias in the country by external sources. MONUSCO’s
presence has not succeeded in restoring security in eastern DRC given the absence of adequate
national military capability.
354. Years of conflict have destroyed most state-owned infrastructure, while continued
insecurity impedes the restoration and deployment of state services beyond provincial
capitals. While progress is being made in strengthening the capacity of some provincial and local
governments, the capacity of each level of government remains very weak and a significant state
building agenda remains to be addressed. Lack of effective state institutions and the failure to
deliver basic services has created the conditions for conflicts to persist in eastern DRC. Inadequate
transfers of resources from central government to provincial authorities have compounded these
problems. The DRC government is committed to reforming state institutions but progress has been
uneven, with more progress in some of the provinces and less at the national level.
355. Ethnic tensions have led to outright conflict and generated widespread insecurity.
Ethnic tensions in the Kivus have their roots in waves of migration dating back to the 17th century,
intensifying with the influx of refugees (containing perpetrators of genocide-related violence) into
eastern DRC following the 1994 Rwandan genocide. Politically-motivated, unclear, and
conflicting messages on nationality status provided by successive Congolese governments has
reinforced ethnic and nationality divisions that have been exploited and reinforced by politicians
looking to mobilize support bases.
356. Lack of clarity and insecurity over land ownership and the absence of effective
resolution mechanisms have contributed to the destabilization of local communities and
escalation of disputes. Colonial-driven and directed migration to the Kivus has led to disputes
over the status of community land given to migrants, an issue that became particularly
118
inflammatory when migrants began to claim autonomy over land, customs, and administration.119
Problems are intensified in the context of insecure or insufficient access to land. For example, the
Kivus are densely populated5 and, with the increase in population size as the displaced have
returned, food insecurity has increased and land holdings have shrunk. The result has been that
many have found themselves crowded out of land, and by extension, livelihood. Important among
this landless group in the Kivus are youths, who have been targets for manipulation and recruitment
by armed groups. The absence of effective governance mechanisms or clear legislation to resolve
land and migration-related disputes means that without safeguards, tensions quickly boil over into
violence.
357. The continued presence of foreign and Congolese armed groups, some of which
operate across borders, constitutes an immediate threat to the consolidation of peace in
eastern DRC and drives the continued violence and armed conflict. Since 2006, a number of
foreign and Congolese armed groups in eastern Congo have remained engaged in active military
campaigns against the DRC government, exacting a heavy toll on the civilian population and
impeding the resumption of normal social and economic activities in areas under their control.
With the government incapable of achieving a decisive military solution, the situation is best
characterized as an uneasy stalemate punctuated by low-level military operations and insurgency
operations.
358. The spoils of war facilitate continued violence and create perverse incentives for
instability. Armed groups, including rebels and criminal networks of the DRC army (FARDC),
enrich themselves through control of mining and trade in minerals. Gold and other minerals are
prevalent in the Kalehe and Masisi territories as well as the Ituri district and armed groups are
benefiting from smuggling minerals into Rwanda and Uganda. There are also claims that external
actors are actively involved in the illicit mining activities in eastern DRC and promote militias to
ensure control over valuable mining assets.
359. Nonmineral natural resources continue to provide additional financing to armed
groups in the form of sale and taxation of land, timber, agricultural goods, charcoal, and
other goods. The lucrative illicit economy and presence of armed groups thrive in the face of weak
state authority, and in turn, its very presence impedes the ability of the state to redeploy its
authority. However, it is important to note that not all armed groups are financed through the
exploitation of natural resources and that denying access to these revenues, in the absence of
effective governance and state security, may simply cause increased harassment of the local
population.
360. Acute socioeconomic vulnerability contributes to fragility and conflict in the eastern
region of the DRC. Conflict has had a profound social and economic impact in the eastern
provinces, including severe and prolonged disruptions to livelihoods and access to basic services.
For example, in the eastern provinces, 2 million children cannot benefit from education due to
destruction of schools. Over 900,000 households (over 4.5 million people, including 2.7 million
119 International Alert 2012, 18. In South Kivu, more than 50 percent of the population is concentrated in 9
percent of the land area.
119
displaced people) currently lack appropriate shelter or have lost property due to conflict and
insecurity.
361. Lack of economic opportunity has provided a basis for continued fragility and
conflict. In the DRC, poverty and the lack of employment opportunities push people (especially
the youth) toward illicit activities and into armed groups. While large areas of land are fertile,
farming has been limited by constant attacks against the population and lack of transport to take
goods to market. Where land is cultivated, lack of modern techniques and low use of inputs such
as higher yielding seeds and fertilizers limit output and enhance environmental degradation. This
in turn exacerbates competition and conflict over land.
b. Drivers of conflict in the broader Great Lakes region
362. Insecure or insufficient access to land in many parts of the Great Lakes region is a
significant factor in the impoverishment of thousands of rural people. Lack of access to land
is seen by many as a structural cause of conflict (both internal in the DRC and cross-border) in the
region. Conflict changes social relationships in profound ways. Perceptions of mutual rights and
responsibilities in relation to land between individuals, social groups, and the state are altered due
to changes in perceived legitimacy of institutions and obligations. Conflict is producing new
competition for land, as part of a wider renegotiation of the local economic space and redrawing
of ethnic, class, and other boundaries between groups. There are many communal conflicts and
social tensions around land, which in certain cases have had cross-border dimensions. Large
displacements of populations within and between countries have led to substantial insecurity and
struggles over access to land. The majority of the population in the region lives off subsistence
farming and hence access to land is crucial. In Burundi, 80 percent of all legal disputes brought
before the courts concern land conflicts. The most acute disputes are those involving land recovery
claims by returnees from refugee camps in neighboring countries and IDPs.
363. IDPs constitute potential triggers for local conflict in the region as they represent
additional and unforeseen claims on available resources. IDPs are vulnerable to recruitment
into armed groups, particularly in the case of eastern DRC. While the number of IDPs is far higher
in eastern DRC than in the broader region, displacement is an issue pertinent to other Great Lakes
countries.120 Displaced populations face extremely limited access to livelihoods and basic services
and alienation from their land, as well as nonparticipation in the community’s social, economic,
and political spheres, leaving them susceptible to manipulation by armed forces. Migration,
displacement, and return have also created shifting demographic balances, leaving some native
communities in the minority, hence affecting their local and provincial political representation. In
this context, politicians, traditional leaders and militia used inflammatory rhetoric to peddle
exclusionary discourse on autochthon identity and rights and promise communities a voice and
protection.
364. Conflicts in the region are also fueled by exploitation of high-value tradable
commodities. These includes minerals such as diamonds, gold, and the 3Ts, and also timber.
Control over the extraction and trade of these resources has been highly contested, fermenting 120 UNHCR reports 60,000 IDPs in Burundi and 15,000 in Uganda as of January 2013. There are no reported IDPs
in Rwanda. UNHCR also reports 37,750 refugees from the DRC in Burundi, 68,400 in Rwanda and 113,290 in
Uganda and 40,000 returning refugees in Burundi, 10,000 in Rwanda and 14,780 in Uganda.
120
conflict and corruption both within and between countries. For the most part, activities take place
through informal and often illicit channels. The benefits have accrued to those that control critical
parts of the value chain in the DRC, in transit countries, and in destination countries. Formalizing
and facilitating official trade in minerals and other resources such as timber will be a key element
in providing stability. Substantial amounts of minerals and other resources are exported via other
countries in the region and have enriched influential elites.
365. Dramatic demographic growth continues to contribute to grievances over resources.
Almost half of DRC's population (45 percent) is under the age of 15 years, lacking opportunity for
education or employment, which heightens frustrations and contributes to the potential for conflict.
The very young age structure and the high dependency ratio are expected to continue to impact the
Great Lakes region. Fertility rates in the region remain higher than those in the surrounding areas,
although Rwanda made considerable progress with a rapid fall in fertility rates, reducing the
nation’s average family size over the past decade. Fertility rates in North and South Kivu are 7.3
and 7.4, respectively, compared with a national average of 6.6, while in Burundi the rate in the
area bordering the lakes is around 7.1 compared with the national average of 6.3. Thus, the
countries trying to achieve the demographic dividend will need to accelerate fertility transition,
which must include addressing gender empowerment and increasing access to family planning.
The demographic transition could spur on future growth if productive employment can
accommodate the bulge in working-age adults.
366. Borders are also a factor and a feature of conflict. Many borders areas have provided
conditions that have allowed armed groups to establish and proliferate. Competition over
resources, including land and water, is also prevalent in border areas. Borders are a key factor in
the illicit movement of minerals, and delineate international migrations of people within the Great
Lakes region. Borders also dissect established ethnic groups who therefore are living in multiple
countries. Borders are also part of the solution in terms of providing security and control over
weapons, and regulating the flow of high-value resources and facilitating trade between countries
in the region.
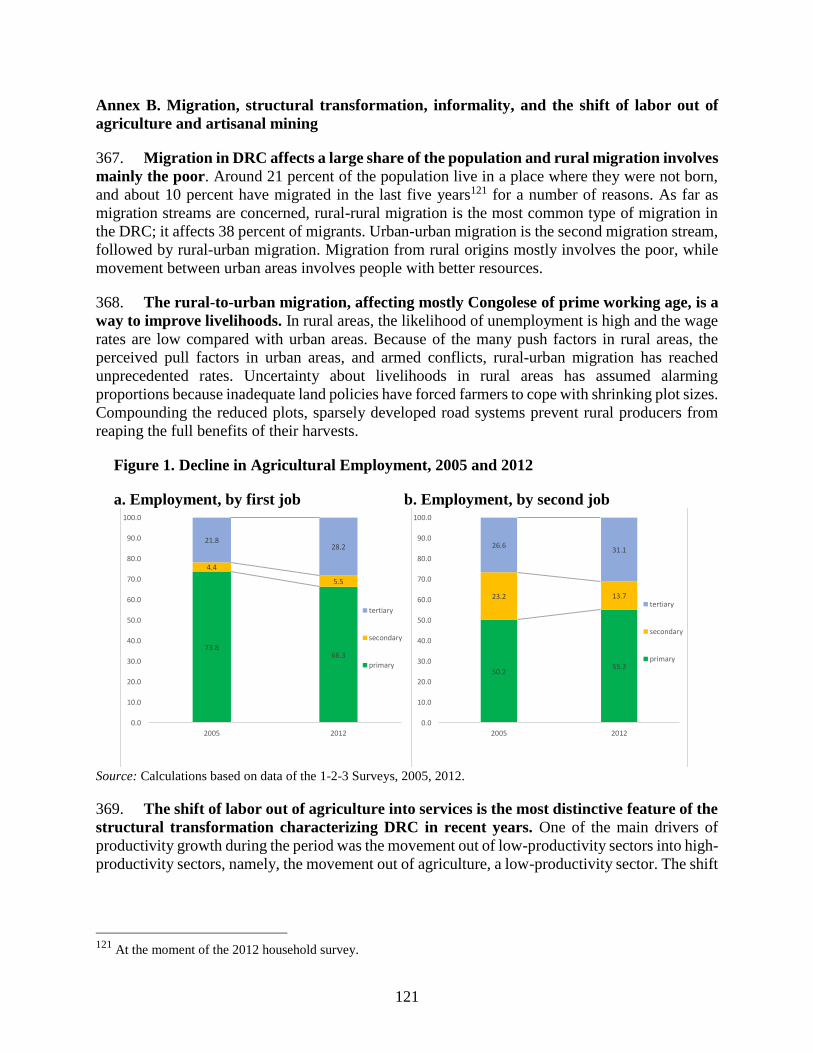
121
Annex B. Migration, structural transformation, informality, and the shift of labor out of
agriculture and artisanal mining
367. Migration in DRC affects a large share of the population and rural migration involves
mainly the poor. Around 21 percent of the population live in a place where they were not born,
and about 10 percent have migrated in the last five years121 for a number of reasons. As far as
migration streams are concerned, rural-rural migration is the most common type of migration in
the DRC; it affects 38 percent of migrants. Urban-urban migration is the second migration stream,
followed by rural-urban migration. Migration from rural origins mostly involves the poor, while
movement between urban areas involves people with better resources.
368. The rural-to-urban migration, affecting mostly Congolese of prime working age, is a
way to improve livelihoods. In rural areas, the likelihood of unemployment is high and the wage
rates are low compared with urban areas. Because of the many push factors in rural areas, the
perceived pull factors in urban areas, and armed conflicts, rural-urban migration has reached
unprecedented rates. Uncertainty about livelihoods in rural areas has assumed alarming
proportions because inadequate land policies have forced farmers to cope with shrinking plot sizes.
Compounding the reduced plots, sparsely developed road systems prevent rural producers from
reaping the full benefits of their harvests.
Figure 1. Decline in Agricultural Employment, 2005 and 2012
a. Employment, by first job b. Employment, by second job
Source: Calculations based on data of the 1-2-3 Surveys, 2005, 2012.
369. The shift of labor out of agriculture into services is the most distinctive feature of the
structural transformation characterizing DRC in recent years. One of the main drivers of
productivity growth during the period was the movement out of low-productivity sectors into high-
productivity sectors, namely, the movement out of agriculture, a low-productivity sector. The shift
121
At the moment of the 2012 household survey.
73.866.3
4.4
5.5
21.828.2
0.0
10.0
20.0
30.0
40.0
50.0
60.0
70.0
80.0
90.0
100.0
2005 2012
tertiary
secondary
primary50.2
55.2
23.2 13.7
26.631.1
0.0
10.0
20.0
30.0
40.0
50.0
60.0
70.0
80.0
90.0
100.0
2005 2012
tertiary
secondary
primary
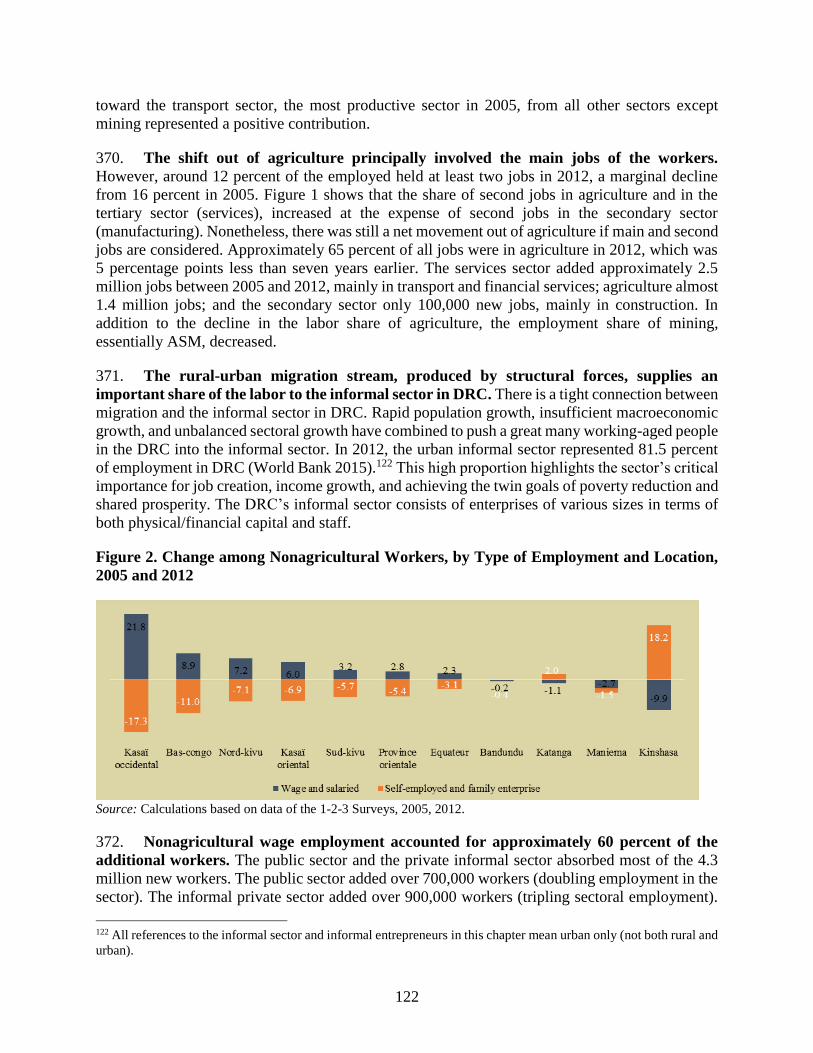
122
toward the transport sector, the most productive sector in 2005, from all other sectors except
mining represented a positive contribution.
370. The shift out of agriculture principally involved the main jobs of the workers.
However, around 12 percent of the employed held at least two jobs in 2012, a marginal decline
from 16 percent in 2005. Figure 1 shows that the share of second jobs in agriculture and in the
tertiary sector (services), increased at the expense of second jobs in the secondary sector
(manufacturing). Nonetheless, there was still a net movement out of agriculture if main and second
jobs are considered. Approximately 65 percent of all jobs were in agriculture in 2012, which was
5 percentage points less than seven years earlier. The services sector added approximately 2.5
million jobs between 2005 and 2012, mainly in transport and financial services; agriculture almost
1.4 million jobs; and the secondary sector only 100,000 new jobs, mainly in construction. In
addition to the decline in the labor share of agriculture, the employment share of mining,
essentially ASM, decreased.
371. The rural-urban migration stream, produced by structural forces, supplies an
important share of the labor to the informal sector in DRC. There is a tight connection between
migration and the informal sector in DRC. Rapid population growth, insufficient macroeconomic
growth, and unbalanced sectoral growth have combined to push a great many working-aged people
in the DRC into the informal sector. In 2012, the urban informal sector represented 81.5 percent
of employment in DRC (World Bank 2015).122 This high proportion highlights the sector’s critical
importance for job creation, income growth, and achieving the twin goals of poverty reduction and
shared prosperity. The DRC’s informal sector consists of enterprises of various sizes in terms of
both physical/financial capital and staff.
Figure 2. Change among Nonagricultural Workers, by Type of Employment and Location,
2005 and 2012
Source: Calculations based on data of the 1-2-3 Surveys, 2005, 2012.
372. Nonagricultural wage employment accounted for approximately 60 percent of the
additional workers. The public sector and the private informal sector absorbed most of the 4.3
million new workers. The public sector added over 700,000 workers (doubling employment in the
sector). The informal private sector added over 900,000 workers (tripling sectoral employment).
122 All references to the informal sector and informal entrepreneurs in this chapter mean urban only (not both rural and
urban).
123
The formal private sector added 59,000 workers (a 28 percent increase since 2005). Altogether,
the modern wage sector expanded by approximately 40 percent, the public sector accounting for
the bulk of the increase.
373. The transition from the informal sector to wage and salaried work was evident in
most provinces. However, in Katanga and Kinshasa, formal sector employment shrank, and
informal activities appear to have expanded. This may have been caused mainly by a permanent
migration of informal sector workers with their families to big cities (especially Kinshasa and
Lubumbashi). Moreover, the employment situation worsened in Bandundu and Maniema, where
both formal and informal sector jobs collapsed (Figure 2).
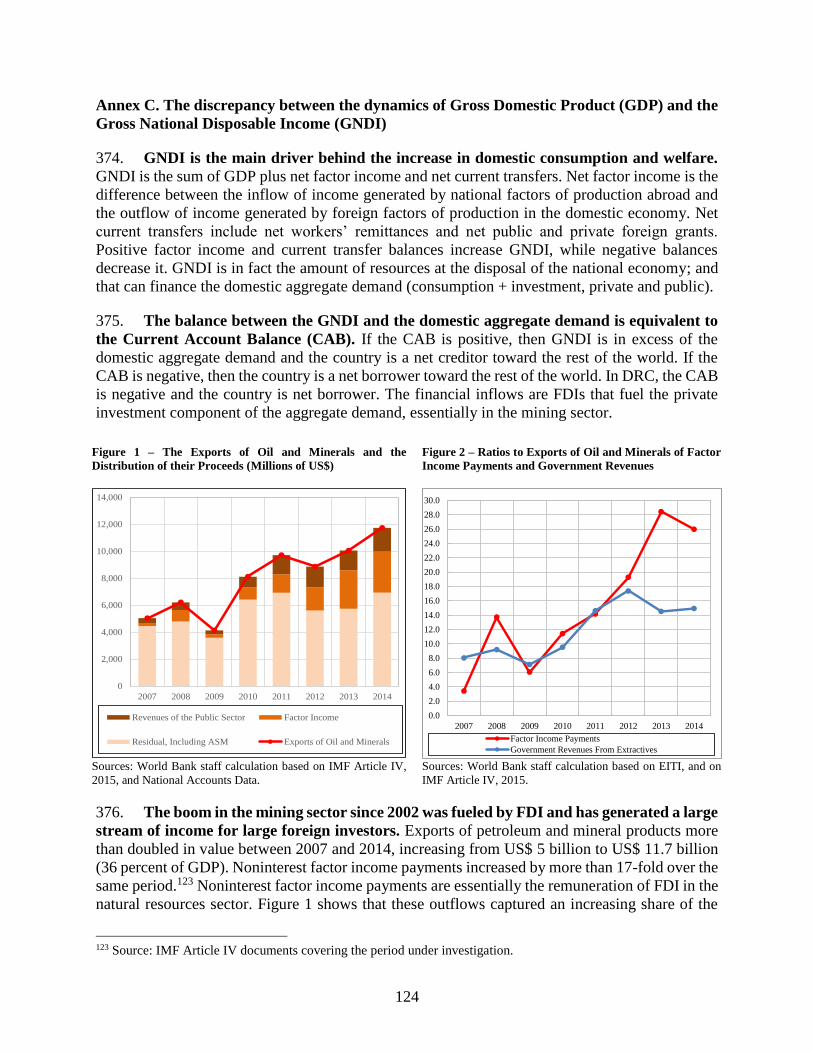
124
Annex C. The discrepancy between the dynamics of Gross Domestic Product (GDP) and the
Gross National Disposable Income (GNDI)
374. GNDI is the main driver behind the increase in domestic consumption and welfare.
GNDI is the sum of GDP plus net factor income and net current transfers. Net factor income is the
difference between the inflow of income generated by national factors of production abroad and
the outflow of income generated by foreign factors of production in the domestic economy. Net
current transfers include net workers’ remittances and net public and private foreign grants.
Positive factor income and current transfer balances increase GNDI, while negative balances
decrease it. GNDI is in fact the amount of resources at the disposal of the national economy; and
that can finance the domestic aggregate demand (consumption + investment, private and public).
375. The balance between the GNDI and the domestic aggregate demand is equivalent to
the Current Account Balance (CAB). If the CAB is positive, then GNDI is in excess of the
domestic aggregate demand and the country is a net creditor toward the rest of the world. If the
CAB is negative, then the country is a net borrower toward the rest of the world. In DRC, the CAB
is negative and the country is net borrower. The financial inflows are FDIs that fuel the private
investment component of the aggregate demand, essentially in the mining sector.
376. The boom in the mining sector since 2002 was fueled by FDI and has generated a large
stream of income for large foreign investors. Exports of petroleum and mineral products more
than doubled in value between 2007 and 2014, increasing from US$ 5 billion to US$ 11.7 billion
(36 percent of GDP). Noninterest factor income payments increased by more than 17-fold over the
same period.123 Noninterest factor income payments are essentially the remuneration of FDI in the
natural resources sector. Figure 1 shows that these outflows captured an increasing share of the
123 Source: IMF Article IV documents covering the period under investigation.
Figure 1 – The Exports of Oil and Minerals and the
Distribution of their Proceeds (Millions of US$) Figure 2 – Ratios to Exports of Oil and Minerals of Factor
Income Payments and Government Revenues
Sources: World Bank staff calculation based on IMF Article IV,
2015, and National Accounts Data.
Sources: World Bank staff calculation based on EITI, and on
IMF Article IV, 2015.
0
2,000
4,000
6,000
8,000
10,000
12,000
14,000
2007 2008 2009 2010 2011 2012 2013 2014
Revenues of the Public Sector Factor Income
Residual, Including ASM Exports of Oil and Minerals
0.0
2.0
4.0
6.0
8.0
10.0
12.0
14.0
16.0
18.0
20.0
22.0
24.0
26.0
28.0
30.0
2007 2008 2009 2010 2011 2012 2013 2014
Factor Income Payments
Government Revenues From Extractives
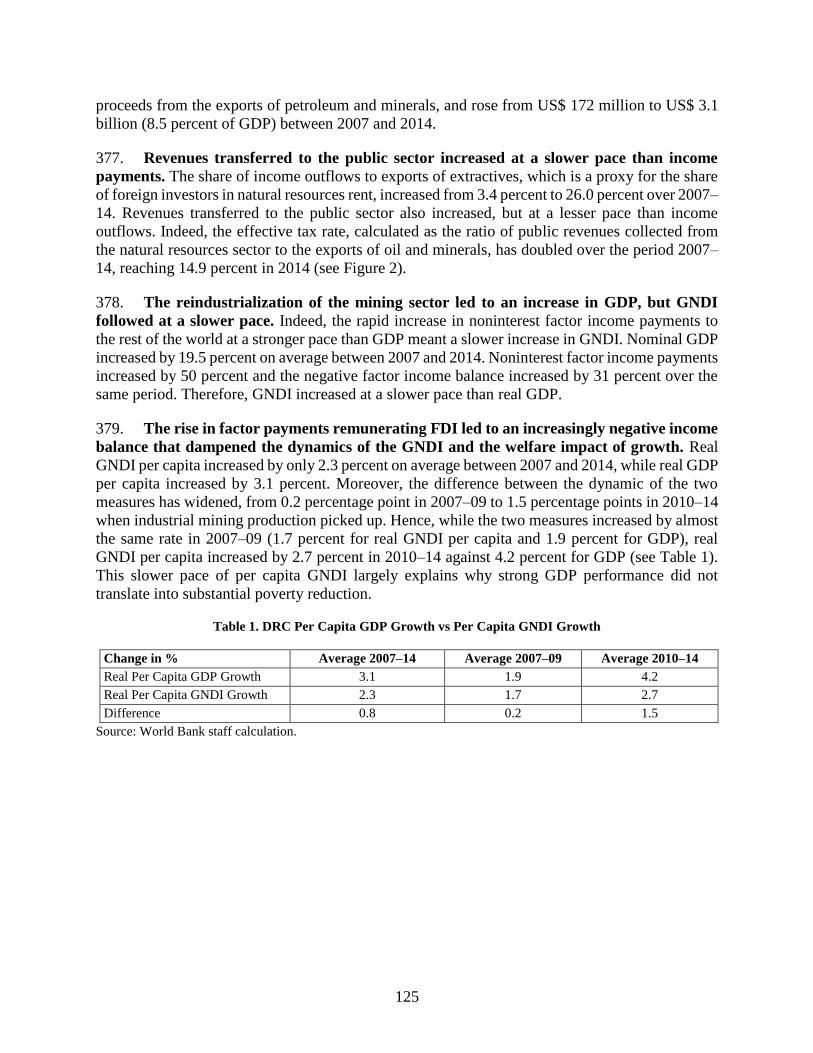
125
proceeds from the exports of petroleum and minerals, and rose from US$ 172 million to US$ 3.1
billion (8.5 percent of GDP) between 2007 and 2014.
377. Revenues transferred to the public sector increased at a slower pace than income
payments. The share of income outflows to exports of extractives, which is a proxy for the share
of foreign investors in natural resources rent, increased from 3.4 percent to 26.0 percent over 2007–
14. Revenues transferred to the public sector also increased, but at a lesser pace than income
outflows. Indeed, the effective tax rate, calculated as the ratio of public revenues collected from
the natural resources sector to the exports of oil and minerals, has doubled over the period 2007–
14, reaching 14.9 percent in 2014 (see Figure 2).
378. The reindustrialization of the mining sector led to an increase in GDP, but GNDI
followed at a slower pace. Indeed, the rapid increase in noninterest factor income payments to
the rest of the world at a stronger pace than GDP meant a slower increase in GNDI. Nominal GDP
increased by 19.5 percent on average between 2007 and 2014. Noninterest factor income payments
increased by 50 percent and the negative factor income balance increased by 31 percent over the
same period. Therefore, GNDI increased at a slower pace than real GDP.
379. The rise in factor payments remunerating FDI led to an increasingly negative income
balance that dampened the dynamics of the GNDI and the welfare impact of growth. Real
GNDI per capita increased by only 2.3 percent on average between 2007 and 2014, while real GDP
per capita increased by 3.1 percent. Moreover, the difference between the dynamic of the two
measures has widened, from 0.2 percentage point in 2007–09 to 1.5 percentage points in 2010–14
when industrial mining production picked up. Hence, while the two measures increased by almost
the same rate in 2007–09 (1.7 percent for real GNDI per capita and 1.9 percent for GDP), real
GNDI per capita increased by 2.7 percent in 2010–14 against 4.2 percent for GDP (see Table 1).
This slower pace of per capita GNDI largely explains why strong GDP performance did not
translate into substantial poverty reduction.
Table 1. DRC Per Capita GDP Growth vs Per Capita GNDI Growth
Change in % Average 2007–14 Average 2007–09 Average 2010–14
Real Per Capita GDP Growth 3.1 1.9 4.2
Real Per Capita GNDI Growth 2.3 1.7 2.7
Difference 0.8 0.2 1.5
Source: World Bank staff calculation.

126
Annex D. The challenges and the dividends of demographic transition.
380. Demographic transition and change in age structure can have a profound impact on
human development (Canning et al. 2015).124 At the household level, family planning and a
decline in fertility improve both health (maternal and child) and educational outcomes (enrollment
as well as quality) (see Schultz 2010 for an example). First, smaller family size enables increased
investment per child. This investment will be on factors affecting early childhood development
(health, nutrition, education). Such an investment would in turn affect children’s immediate
cognitive development and educational outcomes in their adulthood (Bleakley 2010).125,126
Adulthood health is also predicated by investment in childhood health (Barker 1992). As one’s
healthy life span extends (a favorable condition to reap returns on education), there is an incentive
to continue investing on both education and health (Kalemli-ozcan 2002). Second, family planning
facilitates continuous learning for older girls. In the event of an unplanned birth, older girls usually
drop out of school as they become caregivers (Koissy et al. 2012; Eloundou-Enyegue and Williams
2006; Lloyd and Gage-Brandon 1994). Moreover, increasing age at first birth and birth spacing
through family planning will reduce childbirth- and pregnancy-related risks (Ahmed et al. 2012;
Jain 2011). In turn, these improvements in school attendance and health facilitate learning and
hence better human development outcomes in both the short and the long term.
381. When high-fertility countries begin fertility transition, they experience shifts in age
structure that can boost economic development. After fertility rates begin to fall, the share of
children in the population eventually begin to decline. At the same time, the share of people of
working age (commonly recognized as 15–64 years) begins to rise and the economy has the
potential to realize a demographic dividend to development. Rising shares of people of working-
age suggest that the labor supply can grow faster than the total population—even if employment
ratios remain constant—leading to an increase in workers per capita. There would thus be an
automatic increase in real GDP per capita growth. If the higher numbers of workers are saving at
least at the same rate as previous generations, there would also be an increase in aggregate savings.
If these savings can be converted to productive investment, there would be faster capital formation
and improvements in capital-to-worker ratios, all leading to even faster real GDP per capita
growth.127
382. As households’ child-dependency ratios fall and the shares of working-age people
increase, per capita income is likely to rise and poverty could fall. Families who have fewer
children will have more per capita resources at their disposal for consumption, as well as
124
The study shows a steep negative gradient between TFR and primary and secondary school completion rates in
Sub-Saharan Africa. 125
This will also translate to higher income at adulthood. Significant positive wage returns related to schooling are
documented in various settings. For example, Psacharopoulos (1994) finds that one more year of schooling increases
wages by 10 percent. 126
At the aggregate level, per capita spending on children might increase because in most cases spending in children
is a constant share of national resources (irrespective of the size of the youth cohort) (Mason et al. 2009). Governments
could also allocate more on these services if revenue increases due to increased labor force participation. 127
World Bank (2015a) provides empirical estimates of the impact of the age-structure changes on growth and poverty
reduction, in addition to an extensive review of the demographic dividend literature. Bloom and Williamson (1998)
and Bloom et al. (2000) provide empirical evidence of East Asia’s demographic dividend.
127
investment. Evidence from Bangladesh suggests that demographic factors, including age structure,
gender, and regional distributions of populations, accounted for a quarter of the rapid reductions
in poverty that occurred between 2000 and 2010 (World Bank 2013). Cross-country estimates
suggest that a one percentage point reduction in the child dependency ratio is associated with a
reduction of 0.38 percentage point in the poverty headcount rate (World Bank 2015).128
128
The child dependency ratio is the ratio of the aged under-15 population to the population aged 15–64. The aged
dependency ratio is the ratio of the population over age 64 to the population aged 15–64.
128
Annex E. The government’s policy response to the crisis: the 28 measures
383. Pillar 1. Domestic Revenue Mobilization
1. (Gov. No 1) Fighting tax/customs evasion in economic, telecommunications, and transport
sectors through : (a) creating specialized teams; (b) evaluating and auditing contracts and
partnerships with mining SOEs; (c) more scrutiny in granting tax exemptions; (d)reduction of taxes
on exports of some products; (e) enhanced supervision of the local office of national revenues
agencies; (f) increased supervision in the transportation sector; (g) strict abidance with the
directives specifying which agencies are allowed to operate on national borders; (h) using
molecular marking of fuels; (i) the control of Sim box activities and authorizing the Regulatory
Authority for Post and Telecommunications of Congo (ARPTC) to sign partnership contracts with
companies specialized in fighting fraud.
2. (Gov. No 2) Evaluation of VAT, looking into ways to improve VAT collection, examining the
possibility of having multiple rates, such as, for example, a reduced rate for basic food items.
3. (Gov. No 5) Maximizing internal and external resources by: (a) mobilizing private domestic
savings; (b) deploying the one-stop shop (guichet unique) to help investors; (c) issuing Treasury
bonds on the international financial market; (d) digitalizing cadaster and securing land titles; (e)
improving administration and collection of property taxes; (f) accelerating the transfer to digital
terrestrial television (DTT) to free up waves to be used for 4G implementation.
4. (Gov. No 6) Strengthening rewards and sanctions toward tax officials and concerned businesses
by: (a) retroceding funds legally due to revenue departments as share from the revenue they collect;
(b) sanctioning officials involved in fraud and corruption; (c) enforcing declaration of their assets
by the management of revenue agencies at the start and end of their mandates.
5. (Gov. No 7) The recovery of Personal Income Tax on the remuneration of all members of central
and provincial public institutions and SOE staff.
6. (Gov. No 8) Strengthening border controls to reduce illegal export of banknotes and precious
metals.
7. (Gov. No 9) Strengthening revenue collection from the forestry sector.
384. Pillar II. Governance
8. (Gov. No 10) Reduction of the cost of public institutions and of public spending by: (a)
harmonizing the salaries and wages within these institutions; (b) controlling payroll and operating
costs; (c) complying with the public procurement law for expenses related to elections; (d)
respecting budget and spending processes.
9. (Gov. No 14) Evaluation and continuation of the reform of state holding companies.
10. (Gov. No 18) Creation of the Insurance Supervision and Regulation Authority (ARCA).
11. (Gov. No 4) Controlling the quality and the level of investment in the mining sector.
129
12. (Gov. No 19) Continuation of the meetings of the Permanent Economic Concertation
Framework (CPCE) for the improvement of the business climate.
13. (Gov. No 20) Revitalizing the Public Procurement Regulatory Authority and deploying local
offices in all provinces to ensure strict observance of procurement procedures.
14. (Gov. No 24) Establishment of a series of incentives for the private sector in collaboration
with the Federation of Enterprises of Congo (FEC) and other organizations.
15. (Gov. No 26) Urgent review by the Executive of PPP law, including BOT (build, operate,
transfer), and the transfer of this law to Parliament for discussion and approval.
16. (Gov. No 27) Mobilizing external resources by easing restrictions on nonconcessional
financing of infrastructure projects and SMEs, and authorizing the Minister of Finance to extend
a state guarantee for the funding of infrastructure projects and other promising projects.
17. (Gov. No 28) The certification of mineral reserves and hydrocarbons through geophysical
evaluation and certification work.
385. Pillar III. Structural reform
18. (Gov. No 11) Resuming infrastructure and equipment projects, including those related to
electrification and water supply in the capitals of the newly created provinces and privileging the
use of renewable energy.
19. (Gov. No 12) Increasing public investment expenditures and their execution rate.
20. (Gov. No 13) Providing advisory, financial, and technical support to SMEs and small and
medium industries.
21. (Gov. No 15) Creating specialized banks, including an agriculture bank, a real estate bank, the
SME development bank, the National Investment Fund, and the Industry Promotion Fund
transformed into a bank for industrial investment and recapitalization of CADECO and SOFIDE
(Societe Financière de Developpement).
22. (Gov. No 16) Simplifying the conditions required to receive a state guarantee, and allowing
the Minister of Finance to grant such a guarantee to promising projects.
23. (Gov. No 17) Creating three special economic zones and developing agroindustrial parks in
provinces, supervising farmers, and promoting the diversification and intensification of production
in agriculture.
24. (Gov. No 3) Diversifying mining production through increased reliance on the polymetallic
ores of the east, gold deposits, and rare earth elements.
25. (Gov. No 21) Continuation of meter installation by SNEL for the control of electricity
consumption and the recovery of bills.
130
26. (Gov. No 22) Promptly organizing consultations with SNEL and Regideso for implementation
of an electrification and water supply program in rural areas.
27. (Gov. No 23) Reviving tourism, including through securing funding for the Tourism Promotion
Fund and enhancing the security of touristic sites.
28. (Gov. No 25) Funding feasibility studies for a series of projects to be financed over the period
2016–20, especially in infrastructure, energy, and transport sectors.
131
Annex F. Macroprudential policies and preparing for downturns: the examples of Czech
Republic, Peru, and Kenya
386. The Czech Republic started building stronger foundations for aggregate risk
management following major lessons learned from the 1997–98 banking crisis. In 1997 the
country abandoned its fixed exchange rate regime in favor of a monetary policy framework based
on inflation targeting. In part thanks to its increased financial and political independence, the Czech
National Bank managed to increase the credibility of monetary policy and achieve greater price
stability. Starting in 2006, all microprudential regulators were integrated under the Czech National
Bank, which was already the monetary authority and macroprudential supervisor. During the 2008
crisis, the Czech Republic did not have to undertake any major measures, and a simple relaxation
of monetary policy proved sufficient to ensure adequate liquidity. Despite decreased lending
during the crisis period, Czech banks continued to generate profits and further strengthen their
capital buffers, which helped them cope with a notable increase in the share of nonperforming
loans.
387. In the 1990s, Peru put in place key reforms to stabilize the economy. It brought
hyperinflation under control through explicit targets on the monetary base. Once inflation
was reduced to single digits, the central bank adopted an inflation-targeting regime with a flexible
exchange rate that kept inflation in check. The tax system and the financial sector were reformed.
Foreign trade was liberalized in the early 1990s. Peru saved part of the revenues from natural
resources. International reserves grew to the equivalent of more than 17 months of imports in 2007,
and the fiscal primary surplus increased. Given the good conditions that Peru has created since the
mid-1990s, the government was able to respond in an efficient and countercyclical manner to
sustain the national economy during the global crisis. The central bank injected liquidity into the
financial system, both in local currency (nuevos soles) and US dollars, to prevent a liquidity
squeeze and a credit crunch. The monetary policy rate was lowered to 1.25 percent, and the first
package—equivalent to 3.4 percent of GDP—of a threefold stimulus plan was enacted in 2009,
financed by fiscal savings.
388. Kenya successfully built resilience by strengthening both its financial and macrofiscal
systems. In the early 1990s, the government decided to implement economic reforms to stabilize
the financial sector and regain sustainable growth. The banking system was strengthened, notably
through substantial capitalization of the banks, and access to finance for the population was
improved. Kenya also managed to decrease its public debt and accumulate high international
reserves (up to four months of import coverage) by adopting prudent fiscal policies and
maintaining a healthy external position. Kenya’s demonstration of risk management is arguably
impressive, considering the quadruple shock it faced within a very short period: postelection
violence in early 2008, oil and food price increases, catastrophic drought, and the global financial
crisis. The central bank successfully implemented countercyclical monetary policies, reducing its
rate, and the cash reserve ratio, to inject liquidity into the market. With public debt under control,
and buoyed by large international reserves, the government was able to implement an ambitious
fiscal stimulus program of US$ 300 million, thereby protecting key expenditures. The stimulus
boosted employment and economic activity, notably by increasing spending on infrastructure.
132
Annex G. Dedollarization: lessons learned (based on analysis by Fischer, Lundren and
Jahjah 2013)
389. According to Erasmus et al. (2009) and Kokenyne (2010), a good dedollarization
strategy should deal with three dimensions: (i) macroeconomic policies; (ii) legal and regulatory
framework reforms; and (iii) direct administrative measures. Measures to increase the
attractiveness of the national currency should generally tend to reduce risks and costs associated
with its use (Socorro 2005). Experience shows that incitation to use the local currency (pull
measures) has a greater chance of working than forced dedollarization (push measures). Below is
a snapshot of several measures taken in various dedollarization cases.
A. Dedollarization measures based on market powers (pull measures)
390. Strengthening liquidity management and central bank’s policy tools are crucial to
make local currency more attractive by increasing its ease of use and reducing interest rate
volatility. A number of policy tools can be mobilized for that purpose, including: (i) reserves
requirements, (ii) standing facilities of lending and deposit, (iii) open-market operations to
stabilize the domestic interbank rate; (iv) introduction of mid-term Treasury bills to develop a yield
curve and promote the development of a domestic bond market; and (v) development of the foreign
exchange market to ensure easy access to foreign currencies and reduce precautionary savings of
foreign currencies. Regarding (iv), it is obvious that the current Treasury bills with maturities of
seven or 28 days, are too short-term to enable the emergence of secondary and interbank markets.
Hence, with such short maturities, it is impossible to draw a yield curve, and to develop a capital
market. However, the demand for securities with longer-term maturities is probably too weak to
make the case for their introduction by the BCC.
391. Improving budget and public debt management. The reduction of the share of
government bonds denominated in foreign currencies may contribute to the dedollarization of
government liability. To the extent that it is possible, the government should use the national
currency in all operations, including the collection of direct and payroll taxes, and goods and
services taxes (as in Angola). Taxation should remain currency neutral, and should not foster the
holding of foreign currencies, and proceeds from external aide should be used in local currency.
One way to dedollarize the government balance sheet and to increase exchange rate flexibility
would be through the issuance of public debt bonds denominated in national currency—an
initiative that has been tested during dedollarization in Bolivia, Brazil, Israel, Mexico, and Turkey.
All the measures described in above can be applied to the DRC in one form or another, in parallel
to the government commitment to sustainable fiscal management.
392. Emergence of a domestic capital market and development of retail banking.
Government bonds denominated in national currency would be a first step towards developing a
liquid domestic bond market. However, the DRC needs first to reinforce the national debt
management system prior to issuing national currency bonds and creating a domestic bond market.
Dedollarization can be encouraged by widening the choice of securities denominated in national
currency that are traded on the domestic monetary and financial markets. The financial deepening
will enable banking services to extend to those sections of the business sector and of the population
that are the most likely to use the national currency. The increased potential of retail banking
services will also prompt banks to increasingly use the national currency in their operations. The
133
current expansion of the banking sector is a positive development that should be accompanied by
banking supervision reinforcement.
393. Reinforcing payment systems and promoting the use of the national currency.
Payment systems should be designed so that paying with the national currency is at least as
practical and efficient as using foreign currencies. The first step consists in making available
banknotes with face values adapted to user needs in order to minimize transaction costs and make
the national currency more practical for transactions of large amounts. In Cambodia for instance,
the introduction of higher value denomination notes boosted the demand for the national currency.
Therefore, the recent introduction of banknotes with higher face value in the DRC is undoubtedly
a good move into the right direction. Furthermore, new legislation on payment systems is expected
to be soon submitted to Parliament and should ease payment procedures while reducing transaction
costs in the banking sector.
394. Creating an interest rate spread. A number of countries have tried this strategy, with
moderate success. An interest rate spread can only work if substitution is more likely between
national currency and foreign currency within the country, rather than with foreign currency
deposits abroad. Indeed, a large spread can generate a massive inflow of funds from abroad with
which are too massive (Hungary).
395. Establishing effective supervision and prudential regulation. This can encourage
dedollarization by highlighting both balance sheet risks related to dollarization and foreign
currency operational risk. In Mozambique, for example, banks have to make greater provisions for
foreign currency loans granted to nonexporters. Reinforcing banking supervision is a priority in
the DRC and an ambitious reform program is under way.
396. Excluding foreign currency deposits from the deposit insurance system or having the
deposit insurance in local currency whatever the deposit currency. Such a measure requires
the public to be well-informed. In fact, banks are likely to encourage customers to hold foreign
currency deposits, since interest rates on these deposits are generally lower than on local currency
deposits. The DRC does not currently provide any deposit insurance, and is not likely to have any
unless banking supervision improves significantly and prudential standards are set and enforced.
B. Constraining dollarization, or the use of push measures
397. Local currency reserve requirements. Several measures were taken by various countries
to increase the spread on deposit interest rates in favor of local currency deposits. These include:
(i) imposing reserve requirements denominated solely or partially in local currency (the DRC); (ii)
creating a national currency captive market by remunerating reserve requirements in local currency
at a higher rate than foreign currency reserves (Bolivia, Honduras, Israel, Nicaragua); and (iii)
imposing more important reserve requirements on foreign currency deposits. However, given the
extremely high dollarization level of the DRC’s economy, having local currency reserve
requirements also cover foreign currency deposits is not advisable, because the net open positions
of commercial banks would be too high and their management would be impossible. Furthermore,
having the reserve requirements on foreign currency deposits exclusively denominated in national
currency would deprive the BCC of an additional source of foreign currencies and weaken its
ability to react in the event of a banking crisis.
134
398. Obligation to use local currency for domestic transactions and for setting the price of
goods and services. Use of foreign currencies in domestic transactions has been prohibited in
many countries (including Angola, Israel, Lao PDR, and Peru). In some cases, the use of foreign
currencies is authorized, but the price displayed must be in the national currency.
399. A regulation penalizing the use of foreign currencies is used in some countries, with,
for example, limits on borrowing or loans in foreign currency (Angola, Argentina, Israel, Lebanon,
Turkey, and Vietnam). In other countries, a mandatory conservation period for foreign currencies
is established. Indeed, there are cases where holding sight deposits in foreign currencies is
prohibited and where maturities on foreign currency term deposits are legally set to be longer than
on national currency deposits. The drawback with this option is that it may cause an increase in
the holding of foreign currency liquidity.
400. Constrained dedollarization through the obligation to convert foreign currency
deposits into national currency. This option has had negative impacts in Bolivia, Mexico, and
Peru and has generated both a loss of trust in the authorities and a perceived confiscation risk.
Mexico has attempted to restrict the right of holding foreign currency assets to businesses. A
number of countries, including Argentina and Pakistan, have tried various measures to block
access to foreign currency deposits, but these moves have also compromised the trust in the
banking system and triggered capital flights.
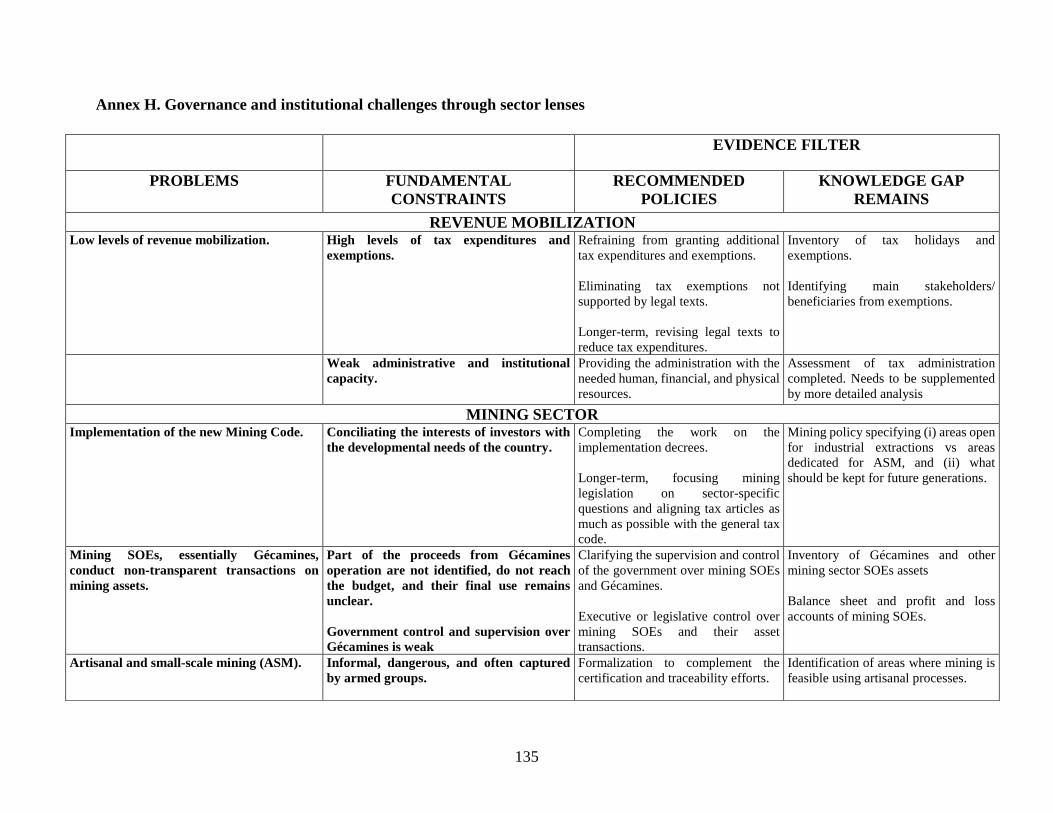
135
Annex H. Governance and institutional challenges through sector lenses
EVIDENCE FILTER
PROBLEMS FUNDAMENTAL
CONSTRAINTS
RECOMMENDED
POLICIES
KNOWLEDGE GAP
REMAINS
REVENUE MOBILIZATION
Low levels of revenue mobilization. High levels of tax expenditures and
exemptions.
Refraining from granting additional
tax expenditures and exemptions.
Eliminating tax exemptions not
supported by legal texts.
Longer-term, revising legal texts to
reduce tax expenditures.
Inventory of tax holidays and
exemptions.
Identifying main stakeholders/
beneficiaries from exemptions.
Weak administrative and institutional
capacity.
Providing the administration with the
needed human, financial, and physical
resources.
Assessment of tax administration
completed. Needs to be supplemented
by more detailed analysis
MINING SECTOR
Implementation of the new Mining Code. Conciliating the interests of investors with
the developmental needs of the country.
Completing the work on the
implementation decrees.
Longer-term, focusing mining
legislation on sector-specific
questions and aligning tax articles as
much as possible with the general tax
code.
Mining policy specifying (i) areas open
for industrial extractions vs areas
dedicated for ASM, and (ii) what
should be kept for future generations.
Mining SOEs, essentially Gécamines,
conduct non-transparent transactions on
mining assets.
Part of the proceeds from Gécamines
operation are not identified, do not reach
the budget, and their final use remains
unclear.
Government control and supervision over
Gécamines is weak
Clarifying the supervision and control
of the government over mining SOEs
and Gécamines.
Executive or legislative control over
mining SOEs and their asset
transactions.
Inventory of Gécamines and other
mining sector SOEs assets
Balance sheet and profit and loss
accounts of mining SOEs.
Artisanal and small-scale mining (ASM). Informal, dangerous, and often captured
by armed groups.
Formalization to complement the
certification and traceability efforts.
Identification of areas where mining is
feasible using artisanal processes.
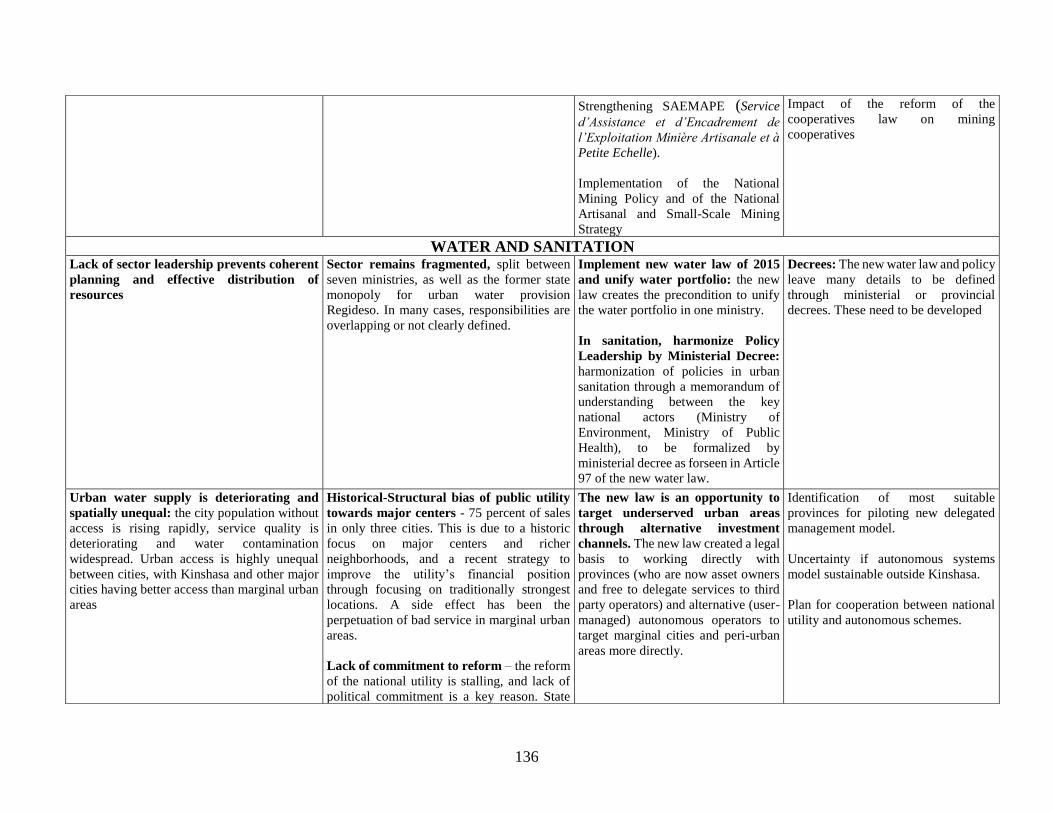
136
Strengthening SAEMAPE (Service
d’Assistance et d’Encadrement de
l’Exploitation Minière Artisanale et à
Petite Echelle).
Implementation of the National
Mining Policy and of the National
Artisanal and Small-Scale Mining
Strategy
Impact of the reform of the
cooperatives law on mining
cooperatives
WATER AND SANITATION
Lack of sector leadership prevents coherent
planning and effective distribution of
resources
Sector remains fragmented, split between
seven ministries, as well as the former state
monopoly for urban water provision
Regideso. In many cases, responsibilities are
overlapping or not clearly defined.
Implement new water law of 2015
and unify water portfolio: the new
law creates the precondition to unify
the water portfolio in one ministry.
In sanitation, harmonize Policy
Leadership by Ministerial Decree:
harmonization of policies in urban
sanitation through a memorandum of
understanding between the key
national actors (Ministry of
Environment, Ministry of Public
Health), to be formalized by
ministerial decree as forseen in Article
97 of the new water law.
Decrees: The new water law and policy
leave many details to be defined
through ministerial or provincial
decrees. These need to be developed
Urban water supply is deteriorating and
spatially unequal: the city population without
access is rising rapidly, service quality is
deteriorating and water contamination
widespread. Urban access is highly unequal
between cities, with Kinshasa and other major
cities having better access than marginal urban
areas
Historical-Structural bias of public utility
towards major centers - 75 percent of sales
in only three cities. This is due to a historic
focus on major centers and richer
neighborhoods, and a recent strategy to
improve the utility’s financial position
through focusing on traditionally strongest
locations. A side effect has been the
perpetuation of bad service in marginal urban
areas.
Lack of commitment to reform – the reform
of the national utility is stalling, and lack of
political commitment is a key reason. State
The new law is an opportunity to
target underserved urban areas
through alternative investment
channels. The new law created a legal
basis to working directly with
provinces (who are now asset owners
and free to delegate services to third
party operators) and alternative (user-
managed) autonomous operators to
target marginal cities and peri-urban
areas more directly.
Identification of most suitable
provinces for piloting new delegated
management model.
Uncertainty if autonomous systems
model sustainable outside Kinshasa.
Plan for cooperation between national
utility and autonomous schemes.
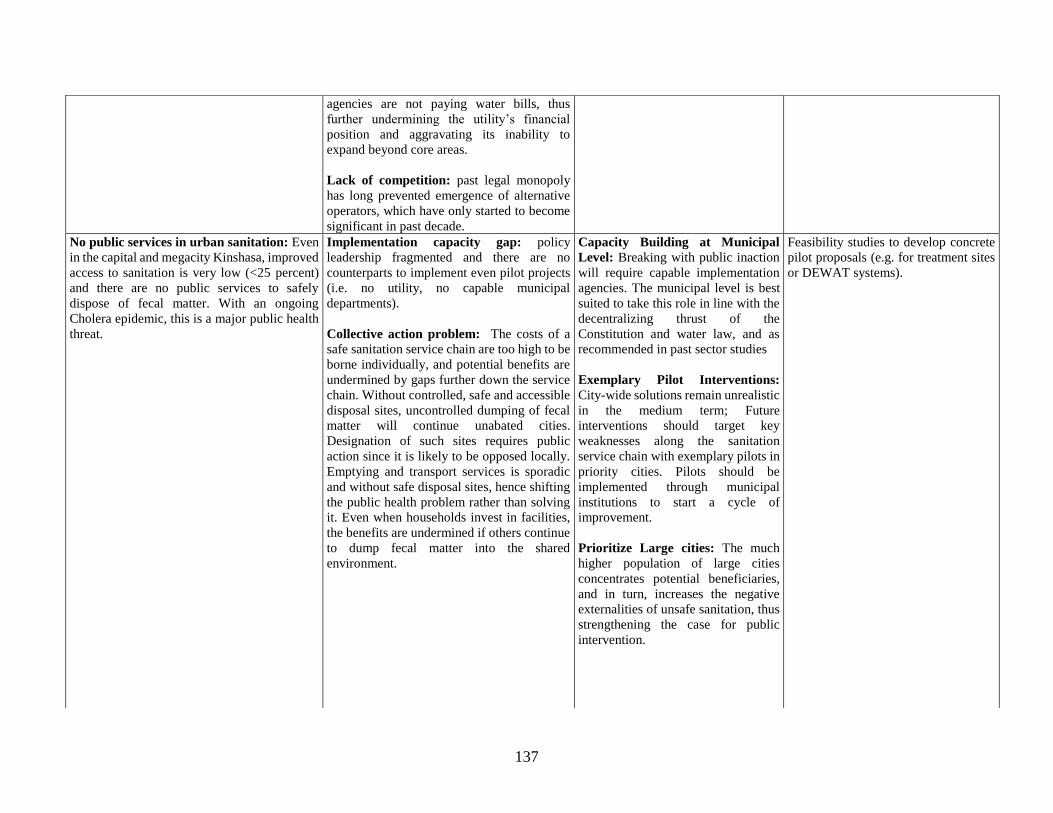
137
agencies are not paying water bills, thus
further undermining the utility’s financial
position and aggravating its inability to
expand beyond core areas.
Lack of competition: past legal monopoly
has long prevented emergence of alternative
operators, which have only started to become
significant in past decade.
No public services in urban sanitation: Even
in the capital and megacity Kinshasa, improved
access to sanitation is very low (<25 percent)
and there are no public services to safely
dispose of fecal matter. With an ongoing
Cholera epidemic, this is a major public health
threat.
Implementation capacity gap: policy
leadership fragmented and there are no
counterparts to implement even pilot projects
(i.e. no utility, no capable municipal
departments).
Collective action problem: The costs of a
safe sanitation service chain are too high to be
borne individually, and potential benefits are
undermined by gaps further down the service
chain. Without controlled, safe and accessible
disposal sites, uncontrolled dumping of fecal
matter will continue unabated cities.
Designation of such sites requires public
action since it is likely to be opposed locally.
Emptying and transport services is sporadic
and without safe disposal sites, hence shifting
the public health problem rather than solving
it. Even when households invest in facilities,
the benefits are undermined if others continue
to dump fecal matter into the shared
environment.
Capacity Building at Municipal
Level: Breaking with public inaction
will require capable implementation
agencies. The municipal level is best
suited to take this role in line with the
decentralizing thrust of the
Constitution and water law, and as
recommended in past sector studies
Exemplary Pilot Interventions:
City-wide solutions remain unrealistic
in the medium term; Future
interventions should target key
weaknesses along the sanitation
service chain with exemplary pilots in
priority cities. Pilots should be
implemented through municipal
institutions to start a cycle of
improvement.
Prioritize Large cities: The much
higher population of large cities
concentrates potential beneficiaries,
and in turn, increases the negative
externalities of unsafe sanitation, thus
strengthening the case for public
intervention.
Feasibility studies to develop concrete
pilot proposals (e.g. for treatment sites
or DEWAT systems).
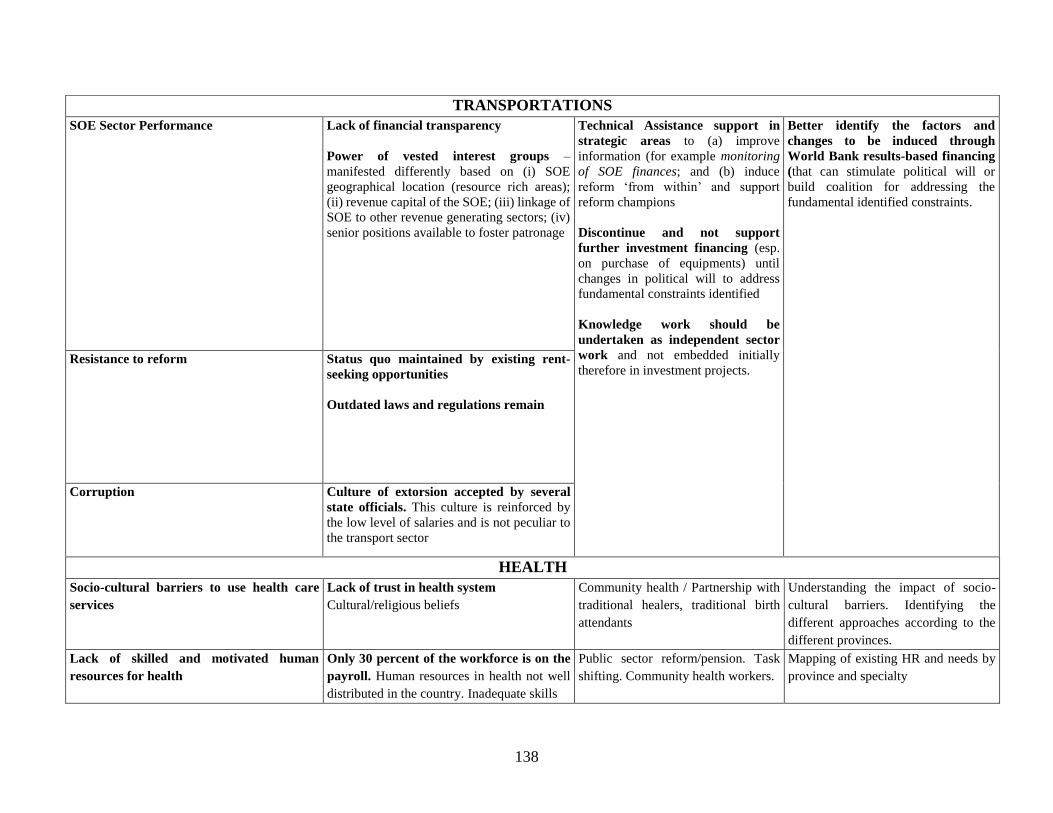
138
HEALTH
Socio-cultural barriers to use health care
services
Lack of trust in health system
Cultural/religious beliefs
Community health / Partnership with
traditional healers, traditional birth
attendants
Understanding the impact of socio-
cultural barriers. Identifying the
different approaches according to the
different provinces.
Lack of skilled and motivated human
resources for health
Only 30 percent of the workforce is on the
payroll. Human resources in health not well
distributed in the country. Inadequate skills
Public sector reform/pension. Task
shifting. Community health workers.
Mapping of existing HR and needs by
province and specialty
TRANSPORTATIONS
SOE Sector Performance Lack of financial transparency
Power of vested interest groups –
manifested differently based on (i) SOE
geographical location (resource rich areas);
(ii) revenue capital of the SOE; (iii) linkage of
SOE to other revenue generating sectors; (iv)
senior positions available to foster patronage
Technical Assistance support in
strategic areas to (a) improve
information (for example monitoring
of SOE finances; and (b) induce
reform ‘from within’ and support
reform champions
Discontinue and not support
further investment financing (esp.
on purchase of equipments) until
changes in political will to address
fundamental constraints identified
Knowledge work should be
undertaken as independent sector
work and not embedded initially
therefore in investment projects.
Better identify the factors and
changes to be induced through
World Bank results-based financing
(that can stimulate political will or
build coalition for addressing the
fundamental identified constraints.
Resistance to reform Status quo maintained by existing rent-
seeking opportunities
Outdated laws and regulations remain
Corruption Culture of extorsion accepted by several
state officials. This culture is reinforced by
the low level of salaries and is not peculiar to
the transport sector
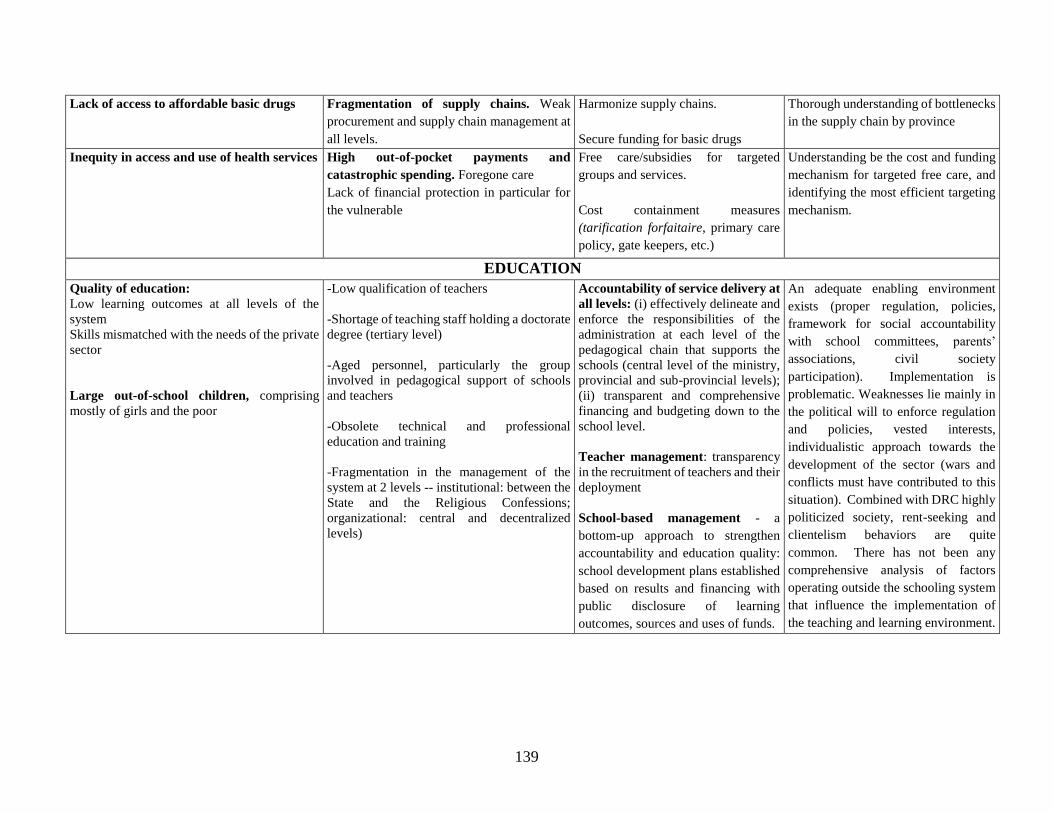
139
Lack of access to affordable basic drugs Fragmentation of supply chains. Weak
procurement and supply chain management at
all levels.
Harmonize supply chains.
Secure funding for basic drugs
Thorough understanding of bottlenecks
in the supply chain by province
Inequity in access and use of health services High out-of-pocket payments and
catastrophic spending. Foregone care
Lack of financial protection in particular for
the vulnerable
Free care/subsidies for targeted
groups and services.
Cost containment measures
(tarification forfaitaire, primary care
policy, gate keepers, etc.)
Understanding be the cost and funding
mechanism for targeted free care, and
identifying the most efficient targeting
mechanism.
EDUCATION
Quality of education:
Low learning outcomes at all levels of the
system
Skills mismatched with the needs of the private
sector
Large out-of-school children, comprising
mostly of girls and the poor
-Low qualification of teachers
-Shortage of teaching staff holding a doctorate
degree (tertiary level)
-Aged personnel, particularly the group
involved in pedagogical support of schools
and teachers
-Obsolete technical and professional
education and training
-Fragmentation in the management of the
system at 2 levels -- institutional: between the
State and the Religious Confessions;
organizational: central and decentralized
levels)
Accountability of service delivery at
all levels: (i) effectively delineate and
enforce the responsibilities of the
administration at each level of the
pedagogical chain that supports the
schools (central level of the ministry,
provincial and sub-provincial levels);
(ii) transparent and comprehensive
financing and budgeting down to the
school level.
Teacher management: transparency
in the recruitment of teachers and their
deployment
School-based management - a
bottom-up approach to strengthen
accountability and education quality:
school development plans established
based on results and financing with
public disclosure of learning
outcomes, sources and uses of funds.
An adequate enabling environment
exists (proper regulation, policies,
framework for social accountability
with school committees, parents’
associations, civil society
participation). Implementation is
problematic. Weaknesses lie mainly in
the political will to enforce regulation
and policies, vested interests,
individualistic approach towards the
development of the sector (wars and
conflicts must have contributed to this
situation). Combined with DRC highly
politicized society, rent-seeking and
clientelism behaviors are quite
common. There has not been any
comprehensive analysis of factors
operating outside the schooling system
that influence the implementation of
the teaching and learning environment.
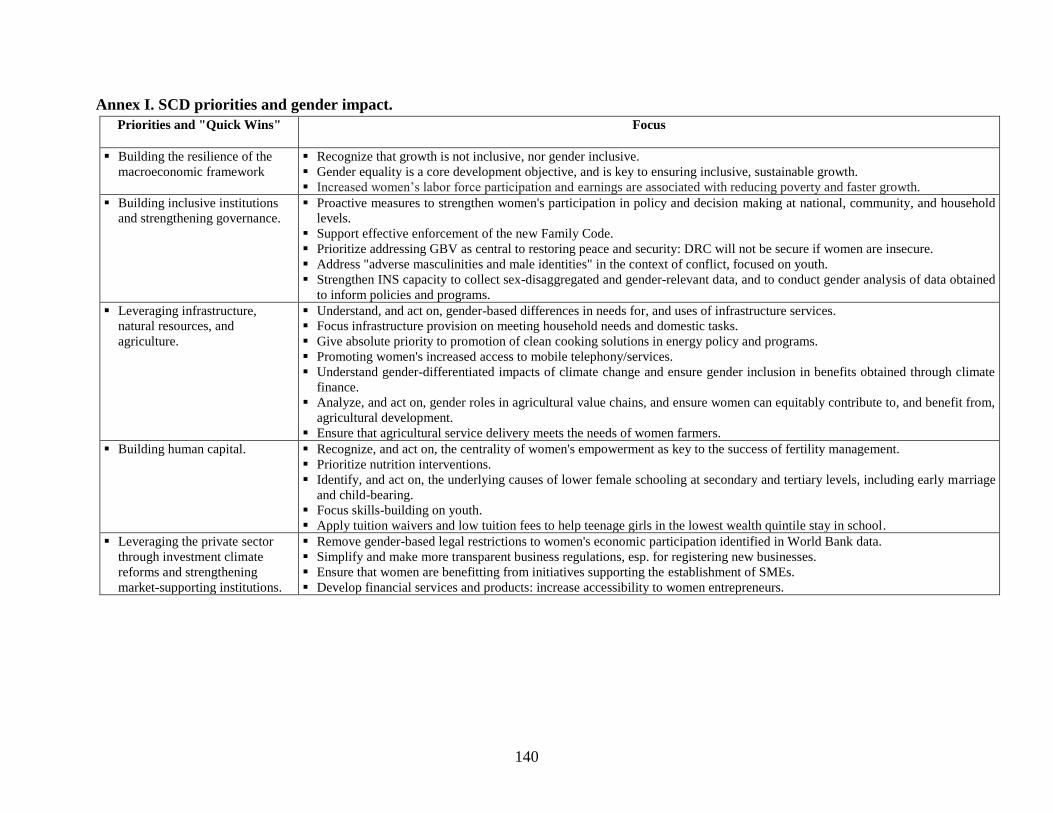
140
Annex I. SCD priorities and gender impact.
Priorities and "Quick Wins" Focus
▪ Building the resilience of the
macroeconomic framework
▪ Recognize that growth is not inclusive, nor gender inclusive.
▪ Gender equality is a core development objective, and is key to ensuring inclusive, sustainable growth.
▪ Increased women’s labor force participation and earnings are associated with reducing poverty and faster growth.
▪ Building inclusive institutions
and strengthening governance.
▪ Proactive measures to strengthen women's participation in policy and decision making at national, community, and household
levels.
▪ Support effective enforcement of the new Family Code.
▪ Prioritize addressing GBV as central to restoring peace and security: DRC will not be secure if women are insecure.
▪ Address "adverse masculinities and male identities" in the context of conflict, focused on youth.
▪ Strengthen INS capacity to collect sex-disaggregated and gender-relevant data, and to conduct gender analysis of data obtained
to inform policies and programs.
▪ Leveraging infrastructure,
natural resources, and
agriculture.
▪ Understand, and act on, gender-based differences in needs for, and uses of infrastructure services.
▪ Focus infrastructure provision on meeting household needs and domestic tasks.
▪ Give absolute priority to promotion of clean cooking solutions in energy policy and programs.
▪ Promoting women's increased access to mobile telephony/services.
▪ Understand gender-differentiated impacts of climate change and ensure gender inclusion in benefits obtained through climate
finance.
▪ Analyze, and act on, gender roles in agricultural value chains, and ensure women can equitably contribute to, and benefit from,
agricultural development.
▪ Ensure that agricultural service delivery meets the needs of women farmers.
▪ Building human capital. ▪ Recognize, and act on, the centrality of women's empowerment as key to the success of fertility management.
▪ Prioritize nutrition interventions.
▪ Identify, and act on, the underlying causes of lower female schooling at secondary and tertiary levels, including early marriage
and child-bearing.
▪ Focus skills-building on youth.
▪ Apply tuition waivers and low tuition fees to help teenage girls in the lowest wealth quintile stay in school.
▪ Leveraging the private sector
through investment climate
reforms and strengthening
market-supporting institutions.
▪ Remove gender-based legal restrictions to women's economic participation identified in World Bank data.
▪ Simplify and make more transparent business regulations, esp. for registering new businesses.
▪ Ensure that women are benefitting from initiatives supporting the establishment of SMEs.
▪ Develop financial services and products: increase accessibility to women entrepreneurs.
141
Annex J. Challenges facing the development of the oil and gas sector in the DRC
401. The DRC’s nascent oil and gas sector is very promising but faces many challenges.
Many of these challenges are already plaguing the development of other sectors. These are:
1- Reserves in contested and difficult areas: this includes the Albertine Graben (Lake Albert in
the east)—instability, remoteness, and encroachment on globally important biodiversity areas; and
offshore Bas-Congo—contested with Angola; a new production-sharing agreement in a zone of
common interest is under discussion.
2- Infrastructure development: the bulk of oil reserves are located in the east, while most
consumption centers are in the west, which means significant investment would be required in
transport and storage unless a regional solution is considered.
3- Environmental and social concerns: potential oil reserves in the east are located in sensitive
ecosystems, adjacent to protected areas and World Heritage Sites such as Virunga National Park.
In addition, the state’s inability to regulate diverging interests between oil companies and local
communities may spark resentment and tensions.
4- The threat to stability: renewed interest in the DRC’s oil resources could become a factor
behind instability in a still vulnerable postconflict country, especially in the east where the central
government does not yet exercise full control. Border issues with neighboring countries, for
example with Angola to the west and with Uganda to the east, could exacerbate tensions.
5- Governance: poor governance remains a significant concern in the sector. The government has
allowed an exploration frenzy without establishing clear procedures, a transparent legal
framework, or robust institutions. Many concessions were awarded in a nontransparent manner by
previous governments, although this was recently halted until passage of the new Hydrocarbon
Code. The lessons learned in other extractive sectors should be reexamined to enable the nascent
oil industry to grow in a sustainable manner and contribute to the national economy.
402. To turn these challenges into opportunities, various areas of collaboration and
support are available to ensure that the oil sector reaches its potential, as follows:
1- Implementation of the Hydrocarbon Code: adequate regulation of the fiscal regime and
environmental and social safeguards need to be established.
2- Hydrocarbon database: design and implementation of an IT system is required to manage the
hydrocarbon data necessary for exploration activities and for the organization of competitive,
transparent bidding rounds for oil and gas blocks.
3- Lake Kivu gas: if extracted properly, methane gas could generate as much as 1,000 megawatts
of electricity. On the Rwandan side of the lake, a pilot project is already being developed to use
the methane to generate 25 megawatts of power. There is clearly potential for replicability or
integration with the Congolese side.
4- Offshore gas flaring monetization: close to 30 million cubic feet per day of associated natural
gas are being flared in Muanda, in addition to gas reserves estimated at between 350 billion and
142
500 billion cubic feet. There could be potential to supply close to 150 megawatts of power to the
region.
5- Capacity building: at the Ministry of Hydrocarbons, staff need training in contract negotiations,
environmental and social project impact assessment, and the tendering process; review of the
organizational structure of the ministry is required.
6- The Extractive Industries Transparency Initiative: the DRC has made significant progress in
recent years to ensuring compliance. The country became a full member of the Extractive
Industries Transparency Initiative in July 2014. There is further room for support to ensure that
production-sharing contracts and exploration licenses are fully disclosed, including details of
beneficial ownership.
7- The resolution of border conflicts: the DRC should invest in conflict resolution with its
neighbors before beginning oil exploration.
8- Regional integration: given the potential of the oil reserves in the east, the government needs
to seek alternative solutions to channel the oil production potential through neighboring countries,
for example, the Kenya-Uganda pipeline. There is clearly room for regional integration, and this
may become a requisite to enticing oil companies to develop these resources that are now stranded
in the Great Lakes region.
9- Environmental and social safeguards: clear procedures and guidelines need to be drawn up for
oil exploration in sensitive areas, even a moratorium on exploration in protected areas. The
successful development of the oil sector is contingent on preserving the interests of local
populations and helping them benefit from the sector’s development. Local content policies and
programs such as Reducing Emissions from Deforestation and Forest Degradation should be
encouraged and promoted.
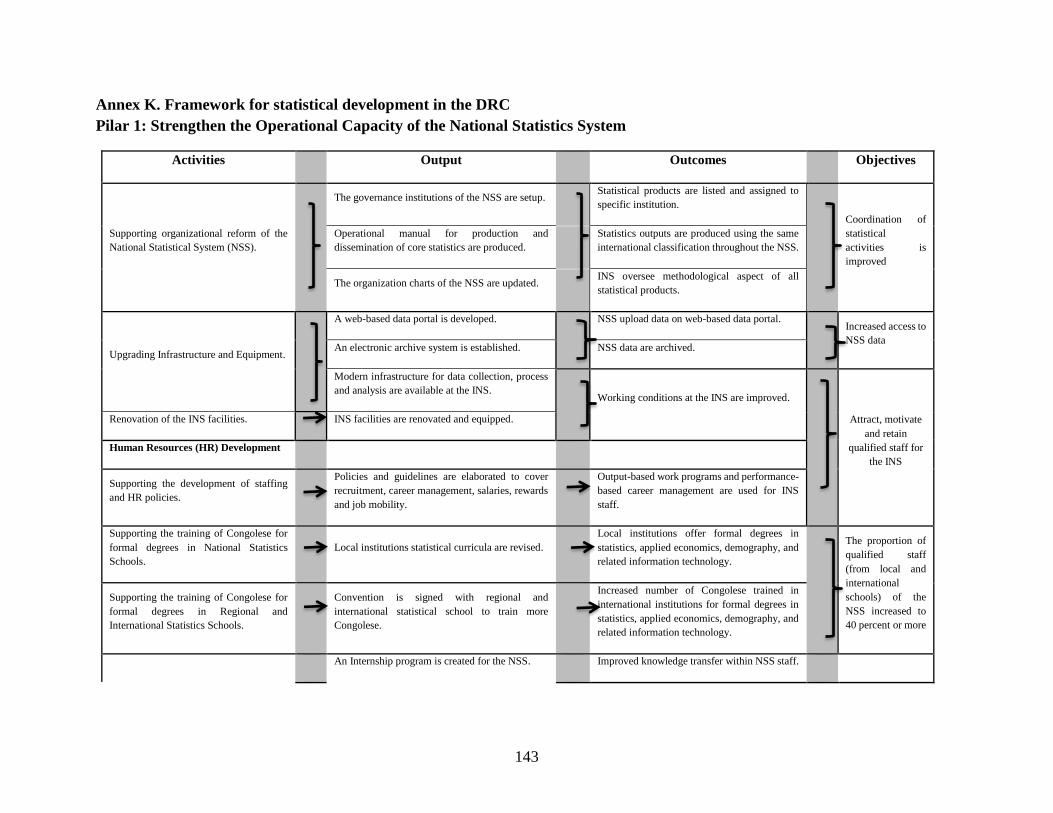
143
Annex K. Framework for statistical development in the DRC
Pilar 1: Strengthen the Operational Capacity of the National Statistics System
Activities Output Outcomes Objectives
Supporting organizational reform of the
National Statistical System (NSS).
The governance institutions of the NSS are setup.
Statistical products are listed and assigned to
specific institution.
Coordination of
statistical
activities is
improved
Operational manual for production and
dissemination of core statistics are produced.
Statistics outputs are produced using the same
international classification throughout the NSS.
The organization charts of the NSS are updated. INS oversee methodological aspect of all
statistical products.
Upgrading Infrastructure and Equipment.
A web-based data portal is developed. NSS upload data on web-based data portal. Increased access to
NSS data An electronic archive system is established. NSS data are archived.
Modern infrastructure for data collection, process
and analysis are available at the INS.
Working conditions at the INS are improved.
Attract, motivate
and retain
qualified staff for
the INS
Renovation of the INS facilities. INS facilities are renovated and equipped.
Human Resources (HR) Development
Supporting the development of staffing
and HR policies.
Policies and guidelines are elaborated to cover
recruitment, career management, salaries, rewards
and job mobility.
Output-based work programs and performance-
based career management are used for INS
staff.
Supporting the training of Congolese for
formal degrees in National Statistics
Schools.
Local institutions statistical curricula are revised.
Local institutions offer formal degrees in
statistics, applied economics, demography, and
related information technology.
The proportion of
qualified staff
(from local and
international
schools) of the
NSS increased to
40 percent or more
Supporting the training of Congolese for
formal degrees in Regional and
International Statistics Schools.
Convention is signed with regional and
international statistical school to train more
Congolese.
Increased number of Congolese trained in
international institutions for formal degrees in
statistics, applied economics, demography, and
related information technology.
An Internship program is created for the NSS. Improved knowledge transfer within NSS staff.
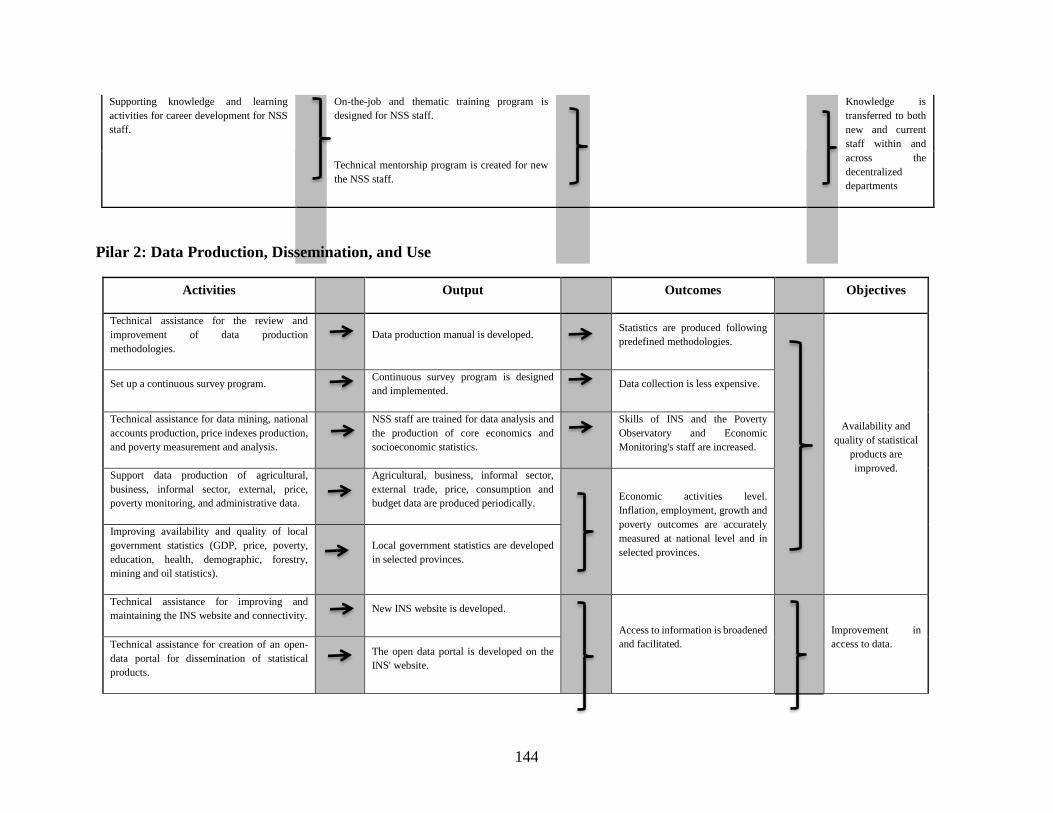
144
Supporting knowledge and learning
activities for career development for NSS
staff.
On-the-job and thematic training program is
designed for NSS staff.
Knowledge is
transferred to both
new and current
staff within and
across the
decentralized
departments
Technical mentorship program is created for new
the NSS staff.
Pilar 2: Data Production, Dissemination, and Use
Activities Output Outcomes Objectives
Technical assistance for the review and
improvement of data production
methodologies.
Data production manual is developed. Statistics are produced following
predefined methodologies.
Availability and
quality of statistical
products are
improved.
Set up a continuous survey program. Continuous survey program is designed
and implemented. Data collection is less expensive.
Technical assistance for data mining, national
accounts production, price indexes production,
and poverty measurement and analysis.
NSS staff are trained for data analysis and
the production of core economics and
socioeconomic statistics.
Skills of INS and the Poverty
Observatory and Economic
Monitoring's staff are increased.
Support data production of agricultural,
business, informal sector, external, price,
poverty monitoring, and administrative data.
Agricultural, business, informal sector,
external trade, price, consumption and
budget data are produced periodically. Economic activities level.
Inflation, employment, growth and
poverty outcomes are accurately
measured at national level and in
selected provinces.
Improving availability and quality of local
government statistics (GDP, price, poverty,
education, health, demographic, forestry,
mining and oil statistics).
Local government statistics are developed
in selected provinces.
Technical assistance for improving and
maintaining the INS website and connectivity. New INS website is developed.
Access to information is broadened
and facilitated.
Improvement in
access to data. Technical assistance for creation of an open-
data portal for dissemination of statistical
products.
The open data portal is developed on the
INS' website.
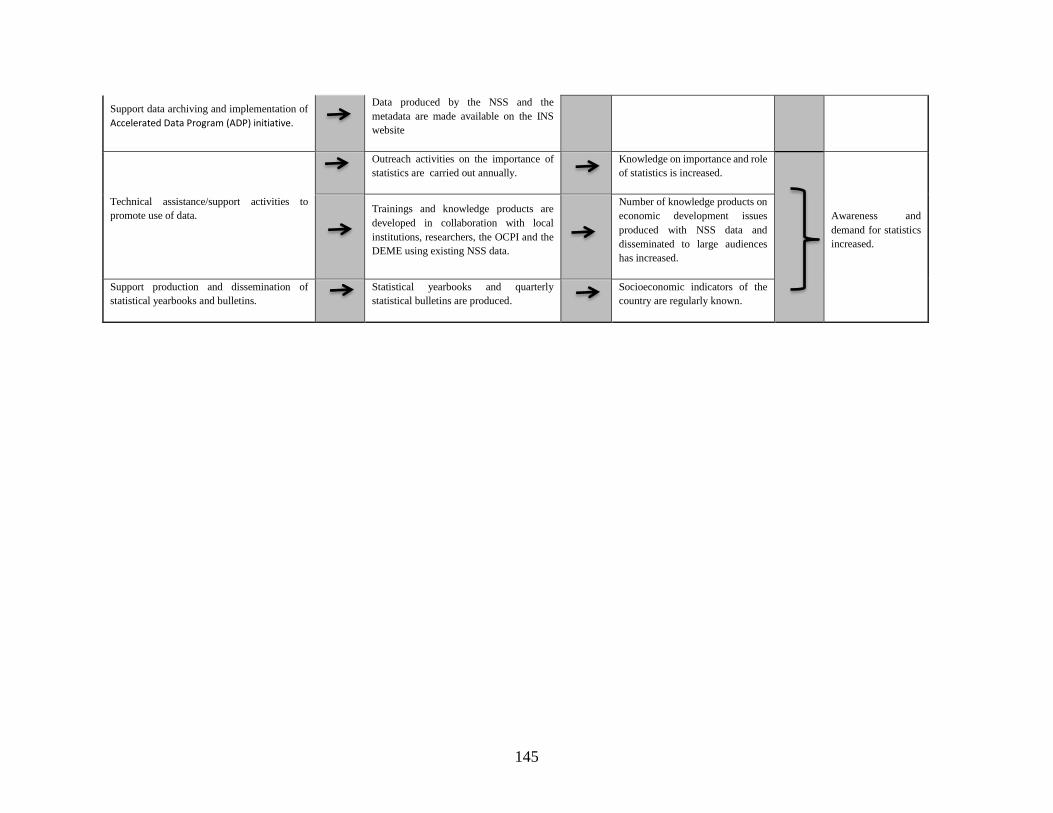
145
Support data archiving and implementation of
Accelerated Data Program (ADP) initiative.
Data produced by the NSS and the
metadata are made available on the INS
website
Technical assistance/support activities to
promote use of data.
Outreach activities on the importance of
statistics are carried out annually.
Knowledge on importance and role
of statistics is increased.
Awareness and
demand for statistics
increased.
Trainings and knowledge products are
developed in collaboration with local
institutions, researchers, the OCPI and the
DEME using existing NSS data.
Number of knowledge products on
economic development issues
produced with NSS data and
disseminated to large audiences
has increased.
Support production and dissemination of
statistical yearbooks and bulletins.
Statistical yearbooks and quarterly
statistical bulletins are produced.
Socioeconomic indicators of the
country are regularly known.
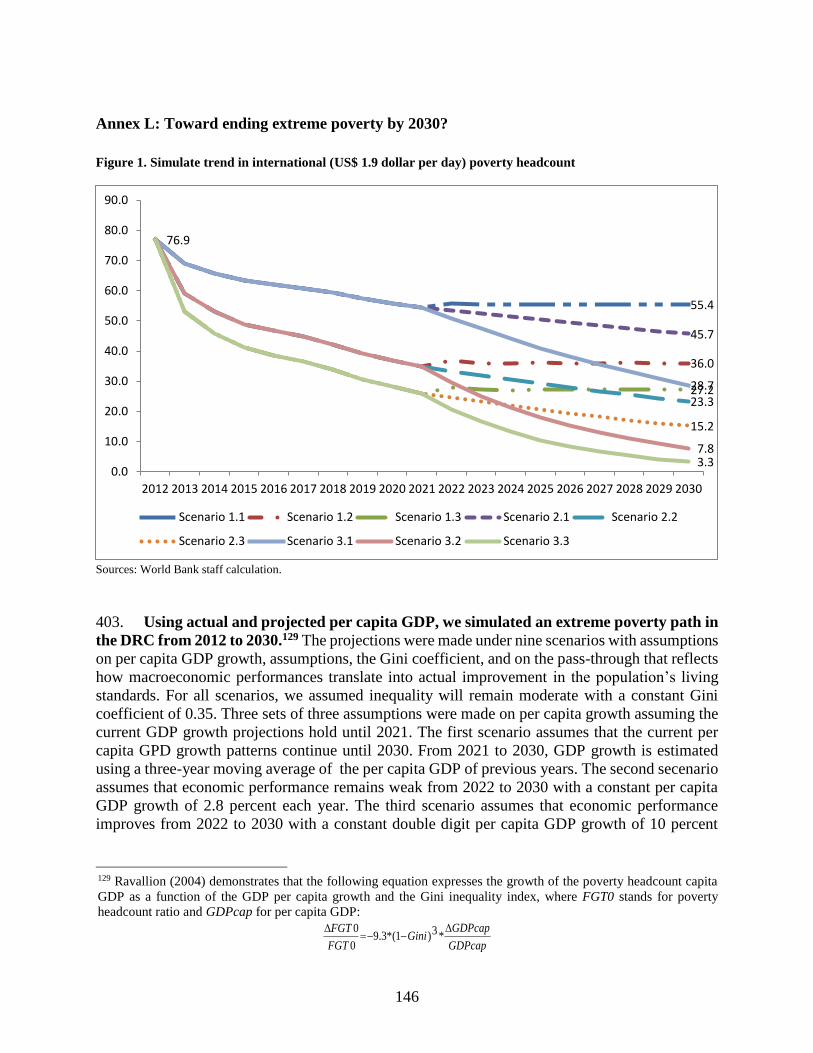
146
Annex L: Toward ending extreme poverty by 2030?
Figure 1. Simulate trend in international (US$ 1.9 dollar per day) poverty headcount
Sources: World Bank staff calculation.
403. Using actual and projected per capita GDP, we simulated an extreme poverty path in
the DRC from 2012 to 2030.129 The projections were made under nine scenarios with assumptions
on per capita GDP growth, assumptions, the Gini coefficient, and on the pass-through that reflects
how macroeconomic performances translate into actual improvement in the population’s living
standards. For all scenarios, we assumed inequality will remain moderate with a constant Gini
coefficient of 0.35. Three sets of three assumptions were made on per capita growth assuming the
current GDP growth projections hold until 2021. The first scenario assumes that the current per
capita GPD growth patterns continue until 2030. From 2021 to 2030, GDP growth is estimated
using a three-year moving average of the per capita GDP of previous years. The second secenario
assumes that economic performance remains weak from 2022 to 2030 with a constant per capita
GDP growth of 2.8 percent each year. The third scenario assumes that economic performance
improves from 2022 to 2030 with a constant double digit per capita GDP growth of 10 percent
129 Ravallion (2004) demonstrates that the following equation expresses the growth of the poverty headcount capita
GDP as a function of the GDP per capita growth and the Gini inequality index, where FGT0 stands for poverty
headcount ratio and GDPcap for per capita GDP:
GDPcap
GDPcapGini
FGT
FGT
*3)1(*3.9
0
0
55.4
36.0
27.2
45.7
23.3
15.2
28.7
7.8
76.9
3.30.0
10.0
20.0
30.0
40.0
50.0
60.0
70.0
80.0
90.0
2012 2013 2014 2015 2016 2017 2018 2019 2020 2021 2022 2023 2024 2025 2026 2027 2028 2029 2030
Scenario 1.1 Scenario 1.2 Scenario 1.3 Scenario 2.1 Scenario 2.2
Scenario 2.3 Scenario 3.1 Scenario 3.2 Scenario 3.3
147
each year. Three variants of each scenario are developped assuming three values of the pass-
through : 0.27, 0.5, and 0.8.
404. Microsimulation results suggest that, if the DRC continues on its current path with
moderate inequality and the same per capita GPD growth patterns, one in two or approximately 60
million Congolese will still be living in extreme poverty in 2030. Under very optimistic scenarios,
with constant double digit and highly inclusive growth, the DRC could reduce its extreme poverty
rate to 3.3 percent by 2030. The more realistic scenario shows that one in three Congolese will be
in extreme poverty in 2030.
Scenario 1.1: Business as usual: the current per capita GPD growth patterns continue and pass-
through is equal to the current elasticity of growth on poverty (0.27).
Scenario 1.2: Business as usual: the current per capita GPD growth patterns continue and pass-
through is the double of the current elasticity of growth on poverty (0.6).
Scenario 1.3: Business as usual: the current per capita GPD growth patterns continue and pass-
through is three time the current elasticity of growth on poverty (0.8).
Scenario 2.1: Bad luck: the economic performance remains weak from 2022 to 2030 with a
constant per capita GDP growth of 2.8 percent each year and pass-through is equal to the current
elasticity of growth on poverty (0.27).
Scenario 2.2: Bad luck: the economic performance remains weak from 2022 to 2030 with a
constant per capita GDP growth of 2.8 percent each year and pass-through is the double of the
current elasticity of growth on poverty (0.6).
Scenario 2.3: Bad luck: the economic performance remains weak from 2022 to 2030 with a
constant per capita GDP growth of 2.8 percent each year and pass-through is three time the current
elasticity of growth on poverty (0.8).
Scenario 3.1: Good luck: economic performance improves from 2022 to 2030 with a constant 10
percent per capita GDP growth each year and pass-through is equal to the current elasticity of
growth on poverty (0.27).
Scenario 3.2: Good luck: economic performance improves from 2022 to 2030 with a constant 10
percent per capita GDP growth each year and pass-through is the double of the current elasticity
of growth on poverty (0.6).
Scenario 3.3: Good luck: economic performance improves from 2022 to 2030 with a constant 10
percent per capita GDP growth each year and pass-through is three time the current elasticity of
growth on poverty (0.8).
148
References
Acemoglu, Daron and Robinson, James. 2012. “Why Nations Fail.” Crown Business.
Africa Progress Panel. 2013. Africa Progress Report 2013: Equity in Extractives Stewarding
Africa’s natural resources for all. Geneva: Africa Progress Panel.
Agénor, Pierre-Richard, and Luiz A. Pereira da Silva. 2013. Inflation Targeting and Financial
Stability. A Perspective from the Developing World. Inter-American Development Bank
(IDB) and Centro de Estudios Monetarios Latinoamericanos (CEMLA).
Ahmed, Saifuddin., Qingfeng Li, Li Liu, and Amy O Tsui. 2012. “Maternal Deaths Averted by
Contraceptive Use: An Analysis of 172 Countries.” The Lancet 380 (9837): 111–25.
Albassam, Bassam. 2013. “The relationship between governance and economic growth during
times of crisis.” European Journal of Sustainable Development, 2 (4), 1–18.
Anten, Louise, Ivan Briscoe, and Marco Mezzera. 2012. The Political Economy of State-building
in Situations of Fragility and Conflict: from Analysis to Strategy. A synthesis paper based
on studies of Afghanistan, Democratic Republic of Congo, Guatemala, Kosovo and
Pakistan. The Hague: Clingendael Institute.
Barker, David James Purslove. 1992. The fetal and infant origins of adult disease. British Medical
Journal. 301:1111.
Barro, Robert J. 2000. “Inequality and growth in a panel of countries”, Journal of Economic
Growth, 5, 5-32.
Barro, Robert J. 2008. “Inequality and growth revisited”, Asian Development Bank, Working
Paper Series on Regional Economic Integration, 11.
Barroy, Helene, Francoise Andre, Serge Mayaka, and Hadia Samaha. 2014. Health Public
Expenditure Review. Investing in Universal Health Coverage: Opportunities and
Challenges for Health Financing in the Democratic Republic of Congo. Washington, DC:
World Bank.
Bleakley, Hoyt. 2010. “Health, human capital, and development.” Annual Reviews of Economics,
2, 283-310.
Bloom, David E.; Canning, David; and Malaney, Pia. 2000. “Demographic change and economic
growth in Asia.” Population and Development Review 26, 257–290.
149
Bloom, David E.; Williamson, Jeffrey G. 1998. “Demographic transitions and economic miracles
in emerging Asia.” The World Bank economic review. -- Vol. 12, no. 3 (September 1998),
pp. 419-455.
Bou-Habib, Chadi, and Ephraim Kebede. 2016. “Democratic Republic of Congo: Product and
Market Concentration and the Vulnerability to Exogenous Shocks.” Policy Research
Working Paper, No. 7700. Washington, DC: World Bank.
Calderón, César, Enrique Moral-Benito, and Luis Servén. 2015. “Is Infrastructure Capital
Productive? A Dynamic Heterogeneous Approach.” Journal of Applied Econometrics 30,
no. 2: 177–98.
Canning, David, Raja, Sangeeta, and Yazbeck, Abdo S. 2015. “Africa's Demographic Transition:
Dividend or Disaster?”. Africa Development Forum. Washington, DC: World Bank; and
Agence Française de Développement. © World Bank.
https://openknowledge.worldbank.org/handle/10986/22036 License: CC BY 3.0 IGO.”
Carter Center, “Carter Center Urges DRC, Freeport, and Lundin to Publish Revised TFM Contract
and Disclose Payments to DRC State-owned Miner Gécamines.” Carter Center,
https://www.cartercenter.org/news/pr/drc-011917.html.
Cerra, Valerie, and Chaman Saxena, Sweta. 2008. "Growth Dynamics: The Myth of Economic
Recovery." American Economic Review, American Economic Association, vol. 98(1),
pages 439-457, March.
Chatterjee, Shiladitya; Duncan, Tyrell; Narayansuwami, Colanda velu; Prakash, Brahm. 2004.
“Asia-Pacific - infrastructure, regional cooperation, and poverty reduction: lessons from
the region (English).” Washington, DC: World Bank.
Collier, Paul. May 2009. “The Political Economy of Fragile States and Implications for European
Development Policy.” Department of Economics, Oxford University.
Collier, Paul, and Anke Hoeffler. 2002. “Aid, Policy, and Growth in Postconflict Societies.” Policy
Research Working Paper 2902. Washington, DC: World Bank.
Crombach, A., and Elbert, T. 2015. “Controlling offensive behavior using Narrative Exposure
Therapy: A RCT of former street children.” Clinical Psychological Science, 3, 270-282.
Dahan, Mariana, and Alan Gelb. 2015. “The Identity Target in the Post-2015 Development
Agenda: Enabling Access to Services for All.” Washington, DC: World Bank.
Doing Business Database. World Bank. http://www.doingbusiness.org/.
Dreher, Axel; Nunnenkamp, Peter; and Thiele, Rainer. 2008. “Does Aid for Education Educate
Children?” Evidence from Panel Data, World Bank Economic Review, vol. 22, issue 2,
291-314.
150
Eloundou-Enyegue, Parfait. M., and Lindy B. Williams. 2006. “Family Size and Schooling in Sub-
Saharan African Settings: A Reexamination.” Demography 43 (1): 25–52.
Englebert, P., and Emmanuel K. Mungongo. 2016. “Misguided and Misdiagnosed: The Failure of
Decentralization Reforms in the DR Congo.” African Studies Review, 59 (1): 5–32.
Erasmus, L., Leichter, J., and Menkulasi, J., 2009, “Dedollarization in Liberia—Lessons from
Cross-country Experience.” IMF Working Paper No. 09/37, (Washington: International
Monetary Fund).
Fund for Peace. Fragile States Index (FSI) 2015 database. http://fsi.fundforpeace.org/rankings-
2015.
Furubotn, E.G. and Richter, R. 2005. “Institutions and Economic Theory. The Contribution of the
New Institutional Economics, 2nd revised and extended edition”, [1st ed. 1997]. Ann
Arbor, MI: University of Michigan Press.
Gelb, Alan and Diofasi, Anna. August 17, 2016. “Biometric Elections in Poor Countries: Wasteful
or a Worthwhile Investment?” Center for Global Development Working Paper No. 435.
Available at SSRN: https://ssrn.com/abstract=2848544 or
http://dx.doi.org/10.2139/ssrn.2848544
Global Witness, “Congo signs over potential $880m of royalties in Glencore project to offshore
company belonging to friend of Congolese President.”
https://www.globalwitness.org/en/press-releases/congo-signs-over-potential-
880mroyalties-glencore-project-offshore-company-belonging-friend-congolese-
president/.
Hermenau K., Hecker T., Maedl A., Schauer M., and Elbert T. 2013. “Growing up in armed
groups: trauma and aggression among child soldiers in DR Congo.” European Journal of
Psychotraumatology. 2013;4:10.3402/ejpt.v4i0.21408. doi:10.3402/ejpt.v4i0.21408.
Hinsberger, M., Sommer, J., Kaminer, D., Holtzhausen, L., Weierstall, R., Seedat, S., Elbert, T.,
et. al. 2016. “Perpetuating the cycle of violence in South African low-income communities:
attraction to violence in young men exposed to continuous threat.” European Journal of
Psychotraumatology, 7, 10.3402/ejpt.v7.29099. http://doi.org/10.3402/ejpt.v7.29099
Herderschee, Johannes, Kai A. Kaiser, and Daniel M. Samba. 2012. Resilience of an African
Giant: Boosting Growth and Development in the Democratic Republic of Congo.
Washington, DC: World Bank.
ICF International. Demographic and Health Surveys Database.
http://www.dhsprogram.com/Data/.
151
Ilzetzki, Ethan; Mendoza, Enrique G., and Végh, Carlos A. 2013. "How big (small?) are fiscal
multipliers?" Journal of Monetary Economics, Elsevier, vol. 60(2), pages 239-254.
International Alert. 2012. Ending the deadlock: Towards a new vision of peace in eastern DRC.
London: International Alert.
International Monetary Fund (IMF). 2015. World Economic Outlook. Uneven Growth: Short- and
Long-Term Factors. Washington, DC: IMF.
Jain, Anil K. 2011. “Measuring the Effect of Fertility Decline on the Maternal Mortality Ratio.”
Studies in Family Planning 42 (4): 247–60.
Kabamba, P. 2013. Business of Civil War: New Forms of Life in the Debris of the Democratic
Republic of Congo. Dakar: Codesria.
Kalemli-Ozcan, Sebnem. 2002. “A Stochastic Model of Mortality, Fertility, and Human Capital
Investment.” Journal of Development Economics.
Kaufmann, D. and Kraay. A. 2008. “Governance indicators: where are we, where should we be
going?” The World Bank Research Observer, 23, 1, available online at
http://web.worldbank.org/WBSITE/EXTERNAL/WBI/EXTWBIGOVANTCOR/0,,conte
ntMDK: 21499997∼page PK: 64168445∼piPK: 64168309∼theSitePK: 1740530,00.html.
Kireyev, Alexei, “Inclusive Growth and Inequality in Senegal.” October 2013. IMF Working
Paper No. 13/215. Available at SSRN: https://ssrn.com/abstract=2358486
Klugman, J., Hanmer, L., Twigg, S., Hasan, T., McCleary-Sills, J., and Santa Maria, J. 2014.
“Voice and Agency: Empowering women and girls for shared prosperity.” Washington,
DC: World Bank. https://openknowledge.worldbank.org/handle/10986/19036.
Köbach A., Nandi C., Crombach A., Bambonyé M., Westner B., and Elbert T. 2015. “Violent
Offending Promotes Appetitive Aggression Rather than Posttraumatic Stress.” A
Replication Study with Burundian Ex-Combatants. Frontiers in Psychology. 2015;6:1755.
doi:10.3389/fpsyg.2015.01755.
Koissy-Kpein Sandrine, Mathias Kuepie, and Michel Tenikue. 2012. “Fertility Shock and
Schooling.” Working Paper No 2012-12. CEPS/INSTEAD, Luxembourg.
Kokenyne, A., Ley, J., and Veyrune, R., 2010. “Dedollarization”. IMF Working Paper No. 188,
International Monetary Fund, Washington DC.
Lamer, M., Anne Laudati, and John F. Clark. “Neither War Nor Peace in the Democratic Republic
of Congo: Profiting and Coping Amid Violence and Disorder.” Review of African Political
Economy 40 (135): 1–12.
Levy, B. 2014. Working with the Grain Integrating Governance and Growth in Development
Strategies. New York: Oxford University Press.
152
Lloyd, Cynthia B, Gage-Brandon, Anastasia J. 1994. “High Fertility and Children's Schooling in
Ghana: Sex Differences in Parental Contributions and Educational Outcomes.” Population
Studies, Vol.48, No 2, 293-306. Routledge.
Lubabu, Tshitenge. “RDC : pauvres députés!” Jeune Afrique. (October 24, 2012).
http://www.jeuneafrique.com/139553/politique/rdc-pauvres-d-put-s/.
Misilu M.N. Eric, and Chen Shouyu, Zhang li Qin. 2010. “Sustainable Urbanization’s Challenge
in Democratic Republic of Congo.” Journal of Sustainable Development 3 (2).
Maluccio, Jahn A., John F. Hoddinott, Jere R. Behrman, Reynaldo Martorell, and Agnes R.
Quisumbing. 2009. “The Impact of Improving Nutrition during Early Childhood on
Education among Guatemalan Adults.” Economic Journal 119 (537): 734–63.
Mantzavinos, C. 2001. “Individuals, Institutions, and Markets.” Cambridge University Press.
Ministry of Gender, Family Affairs, and Children, and UNFPA. 2013. Ampleur des Violences
Sexuelles en RDC et actions de lutte contre le phénomène de 2011 à 2012. Ministry of
Gender, Family Affairs, and Children, and UNFPA.
Mo Ibrahim Foundation. “2015 Ibrahim Index of African Governance (IIAG). Democratic
Republic of Congo.
http://static.moibrahimfoundation.org/u/2015/10/02201334/14_DRC.pdf.
Mokose, T. Manapo, and Hussein Solomon. 2016. How the War Economy Centred in the Eastern
Region of the Democratic Republic of the Congo is Fuelling the Conflict in the Great Lakes
Region (1998–2016). Acta Academica 48 (2): 1–20.
Moore Stephens LLP. 2015. République Démocratique du Congo: Comité Exécutif de l’Initiative
pour la Transparence dans les Industries Extractives. Rapport ITIE RDC 2014. EITI.
Murray, Christopher J. L., M. Ezzati, A.D. Flaxman, S. Lim, R. Lozano, C. Michaud, M. Naghavi,
J.A. Salomon, K. Shibuya, A.D. Lopez AD. 2012, “GBD 2010: A Multi-investigator
Collaboration for Global Comparative Descriptive Epidemiology.” Lancet 380 (9859):
2055–58.
Natural Resource Governance Institute (NRGI). 2015. Country Strategy Note: Democratic
Republic of Congo.
Oluka, Benon H. “Africa: How Ugandan MPs' Pay Compares With Counterparts' Worldwide.”
The Observer (Kampala). http://allafrica.com/stories/201610030730.html.
Pinto Moreira, Emmanuel. 2017. “Managing (Fiscally) Resource Price Volatility: Exploring
Policy Options for the Democratic Republic of Congo.” In Foreign Capital Flows and
153
Economic Development in Africa BRICS’ versus OECD’s Impact, ed. by Evelyn F.
Wamboye and Esubalew A. Tiruneh. Palgrave McMillan.
Psacharopoulos, G. 1994. "Returns to Investment in Education: A Global Update."
World Development 22(9):1325-43.
Ravallion, Martin. 2005. "A poverty-inequality trade-off?" Policy Research Working Paper Series
3579, The World Bank.
Reyes Mason, Lisa; Nam, Yunju; Clancy, Margaret; Kim, Youngmi; and Loke, Vernon. 2009.
“Child Development Accounts and Saving for Children’s Future: Do Financial Incentives
Matter?” CSD Working Papers, No. 09-54.
Schultz, T. Paul. 2010. “Population and Health Policies”, in Handbook of Development
Economics, Volume 5, Elsevier.
Socorro, Heysen. 2005. “Dollarisation.” Finance and Development.
Spittaels, Steven; Matthysen, Ken; Weyns, Yannick; Hilgert, Filip; and Bulzomi, Anna. 2014.
“Analysis of the interactive map of artisanal mining areas in Eastern DR Congo.”
May 2014 update: Brussels, Belgium, International Peace Information Service, 30 p.
Suri, Tavneet, and William Jack. 2016. “The Long-Run Poverty and Gender Impact of Mobile
Money.” Science 354: 6317.
Transparency International. Corruption Perceptions Index database.
http://www.transparency.org/research/cpi/overview.
Trefon, Theodore. 2010. “Administrative Obstacles to Reform in the Democratic Republic of
Congo.” International Review of Administrative Sciences 76 (4) : 702–22.
Ulloa, Alfie; Scheuermaier, Markus; and Baissac, Claude. 2012. “Contraintes à la croissance
économique en République Démocratique du Congo”, in Johannes Herderschee, Daniel
Mukoko Samba et Moїse Tshimenga Tshibangu (éditeurs), Résilience d’un Géant Africain
Accélérer la Croissance et Promouvoir en République Démocratique du Congo, Volume I
Synthèse, contexte historique et macroéconomique, MÉDIASPAUL, Kinshasa, pages 171-
225.
USAID (United States Agency for International Development). 2009. Guide to Economic Growth
in Post-Conflict Countries. Washington, DC: USAID.
World Bank. 2005. World Development Report (WDI) 2005: A Better Investment Climate for
Everyone. Washington, DC: World Bank.
World Bank. 2011. World Development Report 2011: Conflict, Security, and Development.
Washington, DC: World Bank.
154
World Bank. 2013. Country Assistance Strategy for the Democratic Republic of Congo for the
Period FY2013–FY2016. Washington, DC: World Bank.
World Bank. 2013. Reviving the Great Lakes: A World Bank Group Regional Initiative for Peace
Stability, and Economic Development. World Bank, Africa Region.
World Bank. 2014. Doing Business 2015: Going Beyond Efficiency. Washington, DC: World
Bank.
World Bank. 2014. World Development Report 2014: Risk and Opportunity—Managing Risk for
Development. Washington, DC: World Bank.
World Bank. 2015. “An analysis of issues shaping Africa’s economic future.” Africa’s Pulse 12: 4.
World Bank. 2015. Forced Displacement in the Great Lakes Region. Washington, DC: World
Bank.
World Bank. 2015. Women, Business, and the Law 2016: Getting to Equal. Washington, DC:
World Bank.
World Bank 2016. Forcibly Displaced; Towards a Development Approach Supporting Refugees,
the Internally Displaced, and their Hosts. Washington, DC: World Bank.
World Bank. 2016. Global Monitoring Report 2015/16: Development Goals in an Era of
Demographic Change. Washington, DC: World Bank.
World Bank. 2017. World Development Report 2017: Governance and the Law. Washington, DC:
World Bank.
World Bank. 2017. Doing Business 2017: Equal Opportunity for All. Washington, DC: World
Bank.
World Bank. World Development Indicators (WDI) database.
http://databank.worldbank.org/data/reports.aspx?source=World percent20Development
percent20Indicators.
World Bank. Worldwide Governance Indicators database 2015.
http://info.worldbank.org/governance/wgi/index.aspx#home.
Zhou, L., et al. 2014 a. “Widespread decline of Congo rainforest greenness in the past decade.”
Nature 509: 86–90.