democratic people’s republic of korea - world food … · democratic people’s republic of korea...
TRANSCRIPT

Preliminary Report, National Nutrition Survey 2012, DPRK
0
Democratic People’s Republic of Korea
Preliminary Report of the National Nutrition Survey 2012
October 2012
CBS
With technical and financial support from: UNICEF, WFP, WHO

Preliminary Report, National Nutrition Survey 2012, DPRK
1
Contents
ACRONYMS .................................................................................................................................. 2
1. EXECUTIVE SUMMARY ................................................................................................... 3
2. CONTEXT ............................................................................................................................ 5
3. SURVEY OBJECTIVE ........................................................................................................ 6
4. METHODOLOGY ................................................................................................................ 7
4.1 Target population ................................................................................................... 7
4.2 Sampling method ................................................................................................... 7
4.3 Sample size ............................................................................................................. 7
4.4 Indicators ................................................................................................................. 8
4.5 Standards ................................................................................................................ 9
4.6 Morbidity ................................................................................................................ 10
4.7 Multi-micronutrient supplementation for pregnant women ............................. 10
4.8 Vitamin A supplementation in children .............................................................. 10
4.9 Feeding practices ................................................................................................. 10
4.10 Questionnaires ...................................................................................................... 10
4.11 Anthropometric equipment and haemoglobin meter ....................................... 10
4.12 Survey staff ........................................................................................................... 11
4.13 Training and evaluation ....................................................................................... 11
4.14 Data management ................................................................................................ 12
4.15 Weighing and Variance ....................................................................................... 13
4.16 Surveyor‟s manual ............................................................................................... 13
4.17 Risks, probable bias and assumptions ......................................................... 13
5. ETHICAL ISSUES ............................................................................................................. 15
6. RESULTS ........................................................................................................................... 16
6.1 Children .................................................................................................................. 16
6.2 Women ................................................................................................................... 23
7. DISCUSSION ..................................................................................................................... 26
Stunting (Chronic malnutrition) ......................................................................................... 26
Wasting (Acute Malnutrition): ............................................................................................ 26
Other aspects in children: .................................................................................................. 28
Mother‟s nutritional status: ................................................................................................ 28
Historic of malnutrition in DPRK ....................................................................................... 29
8. CONCLUSIONS AND RECOMMENDATIONS ............................................................ 31
9. ACKNOWLEDGEMENTS ................................................................................................ 32
Annex 1 - Data appraisal for key indicators per Province, DPR Korea, October 2012 .... 33
Annex 2 - Children and Women questionnaire, DPR Korea, October 2012 ..................... 35
Annex 3 – Composition of multi-micronutrient supplementation tablets for pregnant and lactating women, DPR Korea, October 2012 ............................................. 39

Preliminary Report, National Nutrition Survey 2012, DPRK
2
ACRONYMS
BMI Body mass index
CBS Central bureau of statistics, DPR Korea
CMAM Community management of acute malnutrition
ENA Emergency nutrition assessment software program
FAO Food and agriculture organisation of the United Nation
GAM Global acute malnutrition
H/A Height-for-age
ICN Institute of Child Nutrition, DPR Korea
IDDS Individual dietary diversity score
MUAC Mid upper arm circumference
MOPH Ministry of public health
MAM Moderate acute malnutrition
MCM Moderate chronic malnutrition
MICS Multiple indicator cluster survey
NCHS National Centre for Health Statistics of USA
PSU Primary sampling unit
PPS Proportional to population sampling
RTI Respiratory tract infection
SAM Severe acute malnutrition
SCM Severe chronic malnutrition
SMART Standardised monitoring and assessment of relief and transition
UNICEF United nations children's fund
WASH Water, Sanitation and Hygiene
W/A Weight-for-age
W/H Weight-for-height
WG/PC Working Group / People's Cluster
WFP World food programme
WHO World health organisation

Preliminary Report, National Nutrition Survey 2012, DPRK
3
1. EXECUTIVE SUMMARY ·
The last nationwide survey including nutrition indicators was the Multiple Indicator Cluster Survey (MICS) carried out in 2009. It showed that 32.4% of children <5y (0-59 months) were stunted (Chronic malnutrition) (8.4% severely stunted) and that 5.2%1 of children were acutely malnourished (0.5% of the severe form). Since then two screenings of mid-upper-arm circumference (MUAC) have been done (October 2011 and February 2012) in the counties were a community management of acute malnutrition (CMAM) program is on-going. Another nutrition assessment using MUAC methodology was conducted in November 2011 in WFP operational counties. All of the MUAC assessments were conducted in different times so comparison of the findings with the national data is not possible but gives indication of seasonal child acute malnutrition in the assessed geographical areas.
The present survey was therefore needed to update the indicators for the population nutritional status. All 10 provinces have been included2. Data collection was done from September 17th to October 17th 2012.
The methodology is based on SMART3 and MICS4 surveys. It is a clustered, stratified by provinces, two-stage sampling survey. The target population includes children under 5 and their mothers. The sample size per province is 400 children in Pyongyang municipality and 812 children in all other provinces for most indicators.
The table 1 shows the main preliminary results at national level.
Tab. 1: Main results of National Nutrition Survey 2012. DPR Korea, October 2012.
Indicator Age group Prevalence 95%
confidence intervals
Children
Global chronic malnutrition (stunting) 0 – 59 months 27.9% 26.3-29.4
Severe chronic malnutrition (severe stunting) 0 – 59 months 7.2% 6.4-7.9
Global acute malnutrition (wasting) 0 – 59 months 4.0% 3.5-4.5
Severe acute malnutrition (severe wasting) 0 – 59 months 0.6% 0.4-0.7
Underweight 0 – 59 months 15.2% 14.2-16.3
Low MUAC (< 125 mm) 6 – 59 months 4.1% 3.6-4.6
Anaemia 6 – 59 months 28.7% 26.5-30.9
Women
Anaemia 15-49 years 31.2% 29.6-32.9
Low MUAC (< 225 mm) 15-49 years 23.2% 21.9-24.5
(< 210 mm) 15-49 years 5.3% 4.7-5.9
Chronic malnutrition, despite a modest drop since MICS 2009 (from 32.3% to 27.9% at national level) remains in the ranges labelled ‟medium‟. Stunting has irreversible impact on
1 Prevalence of height-for-age <-2 z-score (stunting) and weight-for-height < -2 z-score (acute malnutrition) from the
median according to WHO 2006 growth standards. 2 8 Provinces had representative samples, while Nampo and South Pyongan provinces have been coupled due to the small
size of the first one and only one representative sample was drawn for the two. 3 Standardised monitoring and assessment of relief and transition. For more details see: Measuring Mortality, Nutritional
Status and Food Security in Crisis Situations: SMART METHODOLOGY. April 2006. Available at : www.smartindicators.org (accessed on October 18, 2012).
4 Multiple Indicator Cluster Surveys. For more details see: http://www.childinfo.org/mics3_background.html (accessed on October 18, 2012).

Preliminary Report, National Nutrition Survey 2012, DPRK
4
the development of children as a result on the Country development. The prevention of stunting in early life (starting during or even before pregnancy) as well as the prevention of anaemia in mothers and their children (mainly those under 2 years old) through different multi-sectoral interventions combining nutrition, health, WASH, social protection, food security and agriculture requires more efforts and resources. The survey also shows a picture of the acute nutritional status of children modestly improved since 2009. The situation is not critical and does not suggest emergency operations. However, attentions need to be paid to such factors as essential medicines, WASH situation and food security which affect the vulnerable children. The presence of acute malnutrition in women is also of concern. Programmes like the management of acute malnutrition at hospital and community levels (CMAM) need to be continued and expanded. Provision of nutritious food for children at institutions should also continue. On-going monitoring of the nutritional situation is important to identify the trends and changes in the situation and bring support as soon as possible when the situation is negatively changing5. In reference to the MDG 1, the achievement in decreasing underweight over time (from 60.6% in 1998 (MICS1 to 15.5% in the actual survey), as well as chronic and acute malnutrition, are primarily due to concerted efforts between the Government, the UN Agencies and others partners in DPRK in addressing the different causes of malnutrition. But malnutrition still remains and requires continued and strengthened interventions on chronic and acute malnutrition in order to have more impact on the underweight prevalence and to ensure a more optimal growth to the children.
5 MUAC screenings, nutrition surveillance in clinics and hospitals and surveys are the three main methods of nutritional
assessment.

Preliminary Report, National Nutrition Survey 2012, DPRK
5
2. CONTEXT DPR Korea has a surface of approximately 120,540 km2, 80% of which is made up of mountains and uplands. The total population is 24 488 8616. Children under five are 1 705 620 (6.96%). The population of women from 15 to 49 years old is 6 564 148.
The climate is continental with long and cold winters, while most rains fall from July to August. Agricultural activities are also concentrated during the spring and most crops are harvested from September to October. Main foods produced are, in order of decreasing production figures7, rice, maize, potatoes and soybeans.
Primary healthcare is provided at Ri/Up/Ku/Dong hospitals (clinics) where the number of doctors appointed depend on the population (one doctor is in charge of approximately 150 households i.e. approximately 44 children). Hospitals are located in County and Province capitals.
The main fields of intervention of aid agencies (including UN and NGOs) are food security, health and nutrition, education, water and sanitation.
DPRK already has on-going valuable nutrition interventions such as farming interventions and fortified food distribution for children and pregnant and lactating women. Ten Provincial Maternity Hospitals are certified Baby-Friendly Hospitals and are doing promotion of breastfeeding. Micronutrient supplementation and deworming of at least 98% of children happens two times per year through the Child Health Days while the supplementation of multi-micronutrients powders is being done only on a small scale. Weekly iron and folic acid supplementation of pre-pregnant women 23-28 years and daily supplementation of pregnant and lactating women is done countrywide. Community interventions need to be developed to strengthen the counselling on infant and young child and women‟s feeding practices.
The CMAM was implemented in 2008 in the 14 Baby Homes and 4 Counties while the in-patient treatment of severe acute malnutrition in the 10 Provincial Paediatric Hospitals has been ongoing for more than 12 years. In 2011 CMAM was established in 50 counties of North and South Hamyong, Ryanggang and Kangwon. At the moment of the survey, CMAM is still implemented in 29 Counties and 14 Baby Homes while the in-patient treatment of severe acute malnutrition is done in 12 Provincial Hospitals and at least 29 County Hospitals. The number of CMAM counties targeted was reduced after March 2012 due to lack of funding.
Children have received nutritious meals at child institutions while pregnant and lactating women have also received nutritious food in selected counties. This interventions could also have influence the data on acute malnutrition.
6 Data released by CBS in June 2012, number of population at the end of 2011. .
7 FAO, 2011-2012 agricultural season.

Preliminary Report, National Nutrition Survey 2012, DPRK
6
3. SURVEY OBJECTIVE The survey objective was to collect updated information on the nutritional and health status of children and women in DPRK and inform policy makers and program managers on priority sectors and strategies.
This survey collected information on some key indicators of interest for MOPH, UNICEF and other institutions and organisations programs. Data collection was done from September 17th to October 17th 2012.
The selected indicators are acute and chronic malnutrition, MUAC, morbidity, anaemia, vitamin A supplementation coverage, feeding practices in children and dietary diversity in women.

Preliminary Report, National Nutrition Survey 2012, DPRK
7
4. METHODOLOGY 4.1 Target population
The target population includes all children aged 0 to 59 months and their mothers aged 15 to 49 years living in DPRK. Women who lost their children are not included. Some indicators, such as mid-upper-arm circumference in children or micronutrient supplementation in women, are only be assessed in sub-groups such as children aged from 6 to 59 months and women who gave birth in the last 2 years.
4.2 Sampling method
The National Nutrition Survey 2012 is a cross-sectional, stratified, two-stage cluster survey based on the SMART and MICS methodology.
The sampling plan is designed to provide estimates at the Province and Country levels. Using non self-weighting provincial samples, national estimates are derived by weighting the Provincial findings according to population size.
Ten (10) domains are identified, one for each of the nine (9) Provinces, plus one for the Pyongyang Municipality. The Nampo Municipality is included in the South Pyongyan Province to make up one domain. The primary sampling unit (PSU) is the Ri/Up/Ku/Dong, an administrative unit including an average of approximately 10 villages.
In the first stage, 40 Ri/Up/Ku/Dong (or Clusters) were selected by the Central Bureau of Statistics (CBS) among all the Ri/Up/Ku/Dong in each Province with a systematic probability proportional to size (PPS) method.
In each cluster one Working Group/People‟s Cluster (WG/PC), which is the administrative divisions below the Ri/Up/Ku/Dong in rural and urban areas respectively, was randomly selected by field staff just before data collection. Then, in the selected WG/PC, 21 children aged 0-59 months were randomly selected from the list of all children in that age group living in that WG/PC (except in Pyongyang where the number of children was 12 – more explanation given in sample size section on this particularity). If there were less than 21 children in the WG/PC (or 12 in Pyongyang) all of them would be included and the sample would be completed in the nearest WG and so on. In most cases several WG/PC were needed to achieve the sample needed. Therefore the WG/PC stage is a virtual stage, and due to the PPS selection of clusters in the first stage, the variance of the estimates will unlikely be affected. In data analysis with SPSS/PASW complex samples module, this stage has not been computed. This method of sampling and analysis is also known as ultimate cluster approach8 and widely used in complex surveys with clustering and stratification.
4.3 Sample size
The required sample size was calculated, within each Province, for five key indicators under evaluation. The purpose was to choose among them a single sample size (the largest) to cover all the indicators and so simplify the work during data collection. Ideally only one sample size for all provinces and for all indicators would have been selected.
The key indicators for children are the followings: global acute malnutrition (6-59 months), anaemia prevalence (6-59 months), exclusive breastfeeding rate (0-5.9 months). As for 15-49 years mothers, the key indicators were: low MUAC and anaemia prevalence.
ENA (delta version, June 2011) was used to estimate sample sizes. The formula used is:
N = DEFF (t² x p (1-p) / m²)
8 Journal of the Royal Statistical Society. Series A (General), Vol. 142, No. 2 (1979), pp. 210-222.

Preliminary Report, National Nutrition Survey 2012, DPRK
8
where: N = sample size
DEFF = design effect
t = 1.96 for a confidence level of 95%
m = desired precision
p = expected prevalence
Design effect was estimated at 1.5. 2009 MICS result data was used for design effect. In 2009 MICS, design effect for weight for height(wasting) was 1.5. The most recent data from surveys (mostly MICS 2009 and National Nutrition Survey 2004) were used to estimate prevalence.
Once we calculated the 50 samples sizes (10 strata times 5 key indicators) in number of children and women they were converted into households, using CBS census data 2008. The census data were not needed to estimate population absolute figures but proportions were used as they are not likely to change significantly over few years. This procedure allows the comparison of sample sizes coming from different groups (children/mothers, and different age groups within these categories). In all Provinces the largest sample size, of approximately 9 000 to 10 000 households, was needed for the exclusive breastfeeding rate, due to the small age group under study. However this was far higher than other indicators sample sizes and not feasible within this survey. The GAM variable needed on average the second largest sample size. For most Provinces (8 out of 10) the GAM sample size was in the range of 2 500-3 200 households and the latter figure was retained as main sample size. This figure was then re-converted in number of children, which gave 812 children as main sample size. Nevertheless, data on exclusive breastfeeding has been collected, but, like in the MICS, only national and not provincial estimates will be provided for this indicator.
Two exceptions were made to this main (n=812) sample size:
- In Pyongyang municipality the largest required sample size is for haemoglobin in women (2883 households), so it has been preferred because as it still include enough children in the household sample for the other indicators and it reduces costs and efforts compared to the main one.
- The haemoglobin check in children is the most expensive one and needed for only about-half the main sample size (1 500-1 600 children 6-59.9 according to Province). Therefore it has been done only in odd numbered children.
Therefore three different sample sizes were retained:
- 812 children for all Provinces but Pyongyang and for all indicators but haemoglobin
- 406 children for all Provinces but Pyongyang for haemoglobin
- 423 children for Pyongyang for all indicators.
All the mothers of the above children, aged 15-49 years, were included.
To attain the above mentioned sample sizes we chose to select 40 clusters (Ri/Up/Ku/Dong) in each Province and 21 children in each cluster. Haemoglobin concentration was only assessed in every second child so that 11 children in each cluster were included. In Pyongyang 40 clusters and 12 children in each cluster were selected; haemoglobin concentration being tested for all of them. Therefore the final number of children to be assessed per Province was:
- 840 children for all Provinces but Pyongyang and for all indicators but haemoglobin
- 440 children for all Provinces but Pyongyang for haemoglobin
- 480 children for Pyongyang for all indicators.
4.4 Indicators

Preliminary Report, National Nutrition Survey 2012, DPRK
9
The table 2 presents the indicators assessed separately for children and women according to age group of interest.
Only key results are presented in the preliminary report while all results will be presented in the final report.
Tab. 2: List of indicators for children and women detailed by age group.
Children Age group (months)
Mothers Age group (years)
Global chronic malnutrition (GCM) / Stunting
Height-for-Age <-2 z-score
0-59.9 % with MUAC <210mm 15-49.9
Severe chronic malnutrition (SCM) / Severe stunting
Height-for-Age <-3 z-score
0-59.9 % with MUAC <180mm 15-49.9
Moderate chronic malnutrition (MCM) / Moderate stunting
Height-for-Age ≥-3 z-score and <-2 z-score
0-59.9 % with MUAC <225mm (old MICS threshold)
15-49.9
Global acute malnutrition (GAM) / Wasting
Weight-for-Height <-2 z-score
0-59.9, 6-59.9 Prevalence of anaemia in all women
Hb <12 g/dL if non-pregnant)
Hb < 11g/dL if pregnant
15-49.9
Severe acute malnutrition (SAM) / Severe wasting
Weight-for-Height <-3 z-score
0-59.9, 6-59.9 Prevalence of anaemia in pregnant women (only national estimate)
Hb < 11 g/dL if pregnant
15-49.9
Moderate acute malnutrition (MAM) / Moderate wasting
Weight-for-Height ≥-3 z-score and <-2 z-score
0-59.9, 6-59.9 Proportion of women who received multi-micronutrient supplement during pregnancy
15-49.9 with U2 children
Kwashiorkor (nutritional oedema) prevalence
0-59.9 Multi-micronutrient supplement compliance
15-49.9 with U2 children
% with MUAC <125mm 6-59.9 IDDS14 (Individual dietary diversity score over 14 food groups)
15-49.9
% with MUAC <115mm 6-59.9
Prevalence of anaemia
(Hb < 11.0 g/dL)
6-59.9
% who received Vitamin A in last 6 months
6-59.9
Morbidity prevalence (sickness) over 14 previous days
0-59.9
Prevalence of diarrhoea and RTI 0-59.9
Exclusive breastfeeding proportion 0-5.9
Timely introduction of solid, semi-solid, soft foods
6-8.9
Minimum dietary diversity 6-23.9
Early initiation of breastfeeding 0-23.9
Continued breastfeeding proportion at 1 year
12-15.9
4.5 Standards

Preliminary Report, National Nutrition Survey 2012, DPRK
10
WHO 2006 growth standards9 were used to compute W/H, W/A and H/A indices in z-scores. Commonly used thresholds have been used for analysis of MUAC and anaemia.
4.6 Morbidity
Morbidity was assessed retrospectively over 14 days, by asking to the caretakers whether the child had been sick or not. Symptoms were also investigated although for programmatic interest and simplicity we chose to include only three options: diarrhoea, cough, rapid breath or respiratory tract infections and others.
4.7 Multi-micronutrient supplementation for pregnant women
In DPRK, pregnant women can benefit from daily multi-micronutrient supplementation for 6 months. To estimate the proportion of women who received the multi-micronutrient supplementation, surveyors asked to women who gave birth in the last two years if they had received the micronutrient supplementation, and, if so, for how long. A sample of tablets was shown.
4.8 Vitamin A supplementation in children
Vitamin A is given twice per year during Child Health Days held in May and November each year to all children from 6 months up to 5 years. To evaluate the proportion of children who received vitamin A in the last 6 months, caretakers of selected children were asked if the child had received a capsule during the last 6 months. A sample of the capsule was shown.
4.9 Feeding practices
Methods used to collect and analyse information about feeding practices in children is based on WHO (2010) manuals: „Indicators for assessing infant and young child feeding practices‟ parts 1, 2, 3. Dietary diversity was assessed in women 15-49 years old using the FAO (2007) „Guidelines for measuring household and individual dietary diversity‟. A qualitative 24h recall method was used in both cases. A comprehensive list of food groups, adapted to local foods, was included in the questionnaires. Nursery staff participated in data collection to provide information about meals consumed by the children at the nursery the day before.
4.10 Questionnaires
Two questionnaires, one for children and one for women were used (Annex 2). The questionnaires were administered to the mother or the caretaker of the child. The questionnaires were tested during the pre-survey in Pyongyang but no changes were needed. Questionnaires and all other tools used were in Korean. They were initially designed in English, translated by CBS and then back-translated by an independent person to check for inconsistencies.
4.11 Anthropometric equipment and haemoglobin meter
9 WHO Multicentre Growth Reference Study Group (2006). WHO Child Growth Standards: Length/height-for-age, weight-for-age, weight-for-length, weight-for-height and body mass index-for-age: Methods and development. WHO Genève.

Preliminary Report, National Nutrition Survey 2012, DPRK
11
MUAC tape of plasticized paper, children and adult type, three colors with thresholds at 115/125mm and 210/230mm respectively) , weight scales (SECA, electronic, 0.1 Kg division), and wooden height boards (Shorr, 0.1 cm division, two pieces) were provided by UNICEF and comply with UNICEF standards.
Hemocue meters (mod. Hb 201+), kindly provided by WHO, were used to estimate haemoglobin blood concentration in children and women
4.12 Survey staff
Field staff is made up of 2 teams per Province, i.e. 20 teams in total. Each team include three staff, a team leader and two enumerators (or measurers). The team leader is responsible of the application of methodology and for administering the questions to the caretaker. One enumerator is in charge of the scale and of taking the weight while the other is in charge of the height board and of taking height. The enumerators were assigned to their task following a standardisation test completed at the end of the enumerators‟ training (see details in the following section). The enumerators‟ roles were exclusive and teams were requested not to exchange roles during the data collection.
As per DPRK Ministry of Public Health regulations, only doctors can manipulate blood samples. Based on this requirement, one local clinic doctor for each cluster was involved to collect the blood sample and filling the cuvette for the haemoglobin test. Then, one enumerator operated the Hemocue meter, inserting the cuvette and reading the measure.
Selected staffs for the survey were from CBS and Institute of Child Nutrition (ICN). Most of them had experience in participating in MICS and nutrition survey. All from ICN have medical doctor background. Team leaders were selected according to their experience in surveys, training in statistics, public health and epidemiology. A lower profile is needed for enumerators, which need only basic math, logical and communication skills.
4.13 Training and evaluation
Two training of trainers sessions were conducted by an international nutrition consultant on 18-19 July and 13-14 August 2012. Eleven officers from CBS and Institute of Child Nutrition officers attended both. The objective was to prepare a pool of trainers/coordinators for nutrition surveys. The main subjects were sampling methods, field procedures for surveys and software utilisation for data entry and analysis.
The training session was conducted on 27-29 August and 3-5 September All survey staff was trained on their specific duties. The training was facilitated by CBS staff with the support of the international consultant provided by UNICEF. The total duration of the training was 6 days, although it varied according to the role of personnel. Team leaders were trained for the whole 6 days. Enumerators received a training of 3 days (including standardisation test, and pre-survey). A half day training session was given to the Hemocue operators.
The agenda of the training is set out in table 3.
Tab. 3: Training planning.
Day Module
1 Lecture: survey methodology I
2 Lecture: survey methodology II
3 Lecture: ENA (morning) - Lecture & practical: haemoglobin test
(afternoon)

Preliminary Report, National Nutrition Survey 2012, DPRK
12
4 Lecture: recap of methodology, anthropometric theory (divide in two
groups)
5 Pre-survey (divided in two groups)
6 Standardization test (divided in two groups)
The selection of measurers after the training was based on the ENA software “evaluation of the enumerators” test, also known as standardisation test. The supervisor and the measurers measured two times the weight, height and MUAC of 10 children. The accuracy (differences between the enumerator values and the supervisor values) and the precision (differences between the two measurements taken by each enumerator) were then calculated. The results were showing that 3 enumerators were not reaching the required measurement quality so they were retrained and the test repeated and passed by all of them. Standardisation test results will be annexed to the final report.
A one-day pre-survey was carried out before the standardisation test.
A survey manual was provided to each team leader, which included instructions, weight for height tables, random number table and reference tables.
4.14 Data management
Data collection was done from September 17th to October 17th 2012.
All teams were supervised by technical nutrition staff from UNICEF, WHO, and WFP during the first week of data collection and from CBS during the course of the survey.
One laptop was provided to each survey teams to facilitate data entry of child anthropometry data in the field, everyday. Each team leader was responsible to check data quality, ensure correction of mistakes, retake measurements if needed and assess the team work. A plausibility check is included in the ENA software (delta version) and it runs the most common statistical quality tests for such data.
Double entry of all data was performed. The first data entry was initiated on the field, with ENA (ver. delta, 2011), and completed in Pyongyang by CBS with CSPro (ver. 4.0). The second data entry was performed in Pyongyang after the end of data collection with CSPro.
Data cleaning for anthropometric indicators followed WHO cut off as included in ENA / Anthro macro. Anthropometric indices were excluded if they were as follows:
W/H < -5 z-s or > 5 z-s
H/A < -6 z-s or > 6 z-s
W/A <-6 z-s or > 5 z-s.
The above values are referred to the WHO reference population mean and not to our sample observed mean
MUAC <90 or >190 mm in children was excluded. Haemoglobin values was excluded if negative or > 25,6 g/dL, which is the Hemocue range.
As there is no agreed international cut-off for data cleaning for MUAC in women, no “reasonably wrong” values for MUAC in women were identified.
Children anthropometric indices have been computed with Anthro macro for SPSS/PASW (ver. 18).
Data analysis was done with SPSS/PASW (ver. 18).
Clothes worn by children at weighing were recorded with a multiple choice question. 4 categories were included: naked, with pants, with t-shirt, with diapers. The average weight of these clothes was assessed in a nursery with the following results: 20g for pants, 40g for t-shirt and 80g for the diaper. These weights were later subtracted from the children‟s measured weight to obtain the estimated naked weight.
Sample sizes presented in the report are unweighted count of cases.

Preliminary Report, National Nutrition Survey 2012, DPRK
13
4.15 Weighing and Variance
As provincial samples were not self-weighing, national estimates were calculated taking into account the Province population from DPRK Census 200810. The weighing factor used was: ((Province population/National population)/(Province sample /National sample)). Inclusion probability was constant across any Province so no province specific weights were applied.
The complex sample module available in SPSS/PASW (ver. 18) was used to estimate standard errors and confidence intervals at both provincial and national level. An analysis plan for PASW complex samples module was drawn to account for the cluster and stratification applied.
4.16 Surveyor’s manual
Detailed field procedures were included in the surveyor‟s manual, which was given to all team leaders. This document will be attached to the final report.
4.17 Risks, probable bias and assumptions
In Ryannggang, Jaggang, South and North Hamgyong Provinces an insufficient number of hemocue kits was accidentally provided to teams at the beginning of the data collection. For logistical reasons it was not possible to provide the missing kits to the teams. Therefore very soon, after the first 3 days of data collection, it was decided to divide the number of tests left by the number of clusters remaining to decrease bias. The results are therefore slightly biased toward the first 2-3 clusters. The final samples in these Provinces are slightly smaller than planned, with Ryanggang being the Province with the largest undersampling with 213 cases of children measured versus the minimum sample of 254 children required. However, the response rate, which was expected to be around 60%, was much higher due to a good sensitization of participants by the surveyors.
The final stage of selection was done through a simple random selection of children from a list prepared by local village leaders. Recall bias as well as intentional exclusion of some children could have occurred. Team staff were repeatedly sensitized on this risk and asked to avoid any exclusion. If recall bias and intentional exclusions happened, they are expected to have been equally distributed across age groups.
During the data collection period, the main crops harvesting was almost finished and the nutritional status of the population could be better off than in the previous weeks/months due to the seasonal variation of acute malnutrition possibly associated with changes diarrhoea and pneumonia incidence and accessibility to diversified food items
All estimates for women are only representative of mothers aged 15-49.9 of children aged 0 to 59.9 months. They are not representative of all mothers neither of all women.
Nurseries are very popular in DPRK for children between 3 months and 4 years of age. In nurseries, infants and children usually spend the morning and have lunch.
10
This is the latest census available. It was assumed that the relative Province populations had not significantly changed since the 2008 Census.

Preliminary Report, National Nutrition Survey 2012, DPRK
14
Dietary diversity will therefore be assessed in two stages, at home and at the nursery for the children who have been at the nursery the day before. Recall bias is likely to affect the nursery staff, since they are dealing with many children at the same time. The most probable bias is not remembering a deviation from the standard diet at the nursery, in particular the refusal of some food. In this case food diversity might be overestimated.
Vitamin A supplementation and deworming campaigns (Child Health Days) are usually done every 6 months (in May and November each year). Mothers of children who have received their dose at the nursery may not be aware or remind this fact. Underestimation of vitamin A coverage could occur.
Preliminary Report, National Nutrition Survey 2012, DPRK
15
5. ETHICAL ISSUES
Participation in the survey was on a volunteer basis and verbal consent was asked to all respondents (mothers and caretakers were answering for their children). A further authorisation was asked to perform the haemoglobin test. The answer was marked on the questionnaire. Children were weighted naked if the caretaker gave the authorisation, if not with the minimum possible clothes dressed. Moderate and severe acute malnourished (assessed with Weight-for-Height or with MUAC) and anaemic children and mothers were informed of their condition. A supply of 1 month of iron/folic acid supplements were given to anaemic women and 1 month of micronutrient powders to anaemic children to ensure a minimum of supplementation until their household doctor could suggest appropriate treatment. Non-malnourished and non-anaemic children and mother were informed of their good nutritional status.

Preliminary Report, National Nutrition Survey 2012, DPRK
16
6. RESULTS 6.1 Children
6.1.1 Anthropometry
Anthropometry results are based on WHO 2006 growth standards. All sample sizes presented are unweighted. National estimates are weighed to the provincial population.
In table 4, chronic malnutrition figures, based on height for age, are presented. Chronic malnutrition, also known as stunting or growth faltering, is due to a prolonged exposition to poor nutrition. Moreover it has an intergenerational effect, as shorter mothers are likely to give birth to small-for–gestational-age infants11. Stunting is irreversible after 24 months of age12. Global chronic malnutrition is the sum of moderate and severe.
Tab. 4: Prevalence of global (H/A < -2 Z-scores), moderate (H/A ≥ -3 Z-s et < -2 Z-s), and severe (H/A < -3
Z-s) chronic malnutrition based on height for age z-score per sex, province and age group in children aged 0-59 months. DPR Korea, October 2012.
Unweighted count
Global chronic malnutrition (95%
CI)
Moderate chronic malnutrition (95%
CI)
Severe chronic malnutrition (95%
CI)
Total total 8 036 27.9 20.7 7.2
(26.3-29.4) (19.5-21.9) (6.4-7.9)
Sex
Boys 4 115 29.9 21.7 8.2
(28-31.8) (20.1-23.2) (7.2-9.3)
Girls 3 921 25.8 19.7 6.1
(23.7-27.8) (17.9-21.4) (5.2-7)
Province
Ryanggang 840 39.6 27.5 12.1
(35.2-44) (24.3-30.7) (9.8-14.4)
North Hamgyong 840 28.7 20.5 8.2
(24.6-32.8) (17.6-23.4) (5.8-10.7)
South Hamgyong 840 32.9 23.5 9.4
(28.4-37.3) (20.6-26.3) (6.5-12.3)
Kangwon 836 28.6 20.7 7.9
(23.6-33.5) (16.8-24.6) (5.1-10.7)
Jagang 840 33.3 23.6 9.8
(29.5-37.2) (20.4-26.8) (8-11.6)
North Phyongan 840 29.4 21.3 8.1
(24-34.8) (17-25.6) (5.2-11)
South Phyongan/Nampo
840 25.8 21.2 4.6
(21.3-30.3) (17.4-24.9) (3-6.3)
North Hwanghae 840 28.7 20.6 8.1
(24.3-33) (17-24.2) (5.9-10.3)
South Hwanghae 840 25.6 18.9 6.7
(22-29.2) (15.9-22) (4.8-8.5)
Pyongyang 480 19.6 15.6 4.0
(15.1-24) (12-19.3) (2.3-5.6)
Age group (month)
0-5 643 3.7 3.3 0.5
(2-5.4) (1.6-4.9) (0-0.9)
11
Black et al, Lancet 2008 12
Victora et al, Lancet 2008

Preliminary Report, National Nutrition Survey 2012, DPRK
17
6-11 939 8.4 6.7 1.7
(6.2-10.5) (4.7-8.7) (0.9-2.5)
12-23 1 631 27.0 20.7 6.3
(24.4-29.6) (18.3-23) (5-7.7)
24-35 1 671 36.8 26.4 10.4
(33.8-39.7) (23.7-29) (8.7-12.1)
36-47 1 558 33.3 24.7 8.6
(30.3-36.3) (22.1-27.3) (6.9-10.3)
48-59 1 594 35.4 26.2 9.2
(32.3-38.5) (23.6-28.8) (7.7-10.8)
Table 5 display the acute malnutrition prevalence based on weight-for-height by category and degree of severity. This is also known as wasting or thinness and is an indicator of insufficient dietary intake13 over a relatively short period of time. No cases of nutritional oedema (a condition also known as kwashiorkor) were found during the survey. Therefore, global acute malnutrition is the sum of the moderate and severe form14.
Tab. 5 : Prevalence of global (W/H < -2 Z-scores), moderate (W/H ≥ -3 Z-s and < -2 Z-s), and severe acute malnutrition (W/H < -3 Z-s) per sex, province and age group in children aged 0-59 months.
DPR Korea, October 2012.
Unweighted
count
Global acute malnutrition
(95% CI)
Moderate acute malnutrition
(95% CI)
Severe acute malnutrition
(95% CI)
Total
8 035 4.0 3.4 0.6
(3.5-4.5) (2.9-3.9) (0.4-0.7)
Sex
Boys 4 114 4.1 3.6 0.6
(3.5-4.8) (3-4.2) (0.3-0.8)
Girls 3 921 3.8 3.2 0.6
(3.1-4.5) (2.6-3.9) (0.3-0.8)
Province
Ryanggang 840 6.1 5.0 1.1
(4.4-7.7) (3.6-6.4) (0.4-1.8)
North Hamgyong 840 4.8 4.2 0.6
(3.4-6.1) (2.9-5.5) (0.1-1.1)
South Hamgyong 840 4.3 3.6 0.7
(2.4-6.2) (2-5.1) (0.1-1.3)
Kangwon 836 4.7 3.9 0.7
(3-6.3) (2.4-5.4) (0.2-1.3)
Jagang 839 5.7 5.0 0.7
(3.6-7.9) (3.1-6.9) (0.1-1.3)
North Phyongan 840 3.8 3.5 0.4
(2.4-5.2) (2.2-4.8) (0-0.8)
South Phyongan/Nampo
840 3.6 3.2 0.4
(2.5-4.7) (2.1-4.3) (0-0.8)
North Hwanghae 840 4.4 3.6 0.8
(2.9-6) (2.1-5.1) (0.1-1.6)
South Hwanghae 840 3.3 2.9 0.5
(1.9-4.8) (1.6-4.1) (0-0.9)
Pyongyang 480 2.3 1.9 0.4
(1-3.6) (0.6-3.1) (-0.2-1)
Age group (month)
0-5 642 4.3 3.6 0.7
(2.7-6) (2.1-5.1) (0-1.4)
6-11 939 4.9 3.4 1.5
13
Although acute malnutrition is mostly a consequence of protein and energy deficit, micronutrient deficiencies are often associated.
14 In some cases in this table GAM prevalence is 0.1 smaller or greater than the sum of MAM and SAM. This is due to
rounding of numbers to the first decimal digit.

Preliminary Report, National Nutrition Survey 2012, DPRK
18
(3.4-6.4) (2.2-4.6) (0.6-2.4)
12-23 1 631 4.3 3.6 0.7
(3.3-5.3) (2.7-4.5) (0.3-1.1)
24-35 1 671 3.9 3.4 0.6
(2.9-5) (2.4-4.3) (0.1-1)
36-47 1 558 3.6 3.5 0.1
(2.5-4.8) (2.4-4.7) (0-0.2)
48-59 1 594 3.3 3.0 0.3
(2.4-4.2) (2.2-3.9) (0-0.5)
Table 6 shows the results of MUAC measurements. MUAC is habitually not used to determine the population prevalence but is a good indicator for acute malnutrition. As well as weight for height ratio, low MUAC is associated with a higher of mortality. It is then also used for diagnosis of acute malnutrition in children and referral to proper care according to the severity of their status. In children from 6 to 59 months15 the most common thresholds for severe and moderate malnutrition are 115 and 125 mm respectively.
Tab. 6: Proportion of low MUAC in children aged 6-59 months per sex, province and age group,
DPR Korea, October 2012.
Unweighted count
MUAC < 125 mm (95% CI)
MUAC ≥ 115 & < 125 mm (95% CI)
MUAC < 115 mm (95% CI)
Total
7 382 4.1 3.4 0.6
(3.6-4.6) (3-3.9) (0.4-0.8)
Sex
Boys 3 783 3.1 2.6 0.5
(2.5-3.6) (2.1-3.1) (0.3-0.7)
Girls 3 599 5.1 4.4 0.8
(4.3-5.9) (3.6-5.1) (0.5-1.1)
Province
Ryanggang 762 6.6 5.5 1.0
(4.8-8.3) (4.1-6.9) (0.3-1.8)
North Hamgyong 770 4.4 3.8 0.6
(2.9-5.9) (2.2-5.3) (0.1-1.2)
South Hamgyong 782 4.3 3.6 0.8
(2.6-6.1) (1.9-5.3) (0.1-1.4)
Kangwon 766 4.8 4.2 0.7
(3.2-6.4) (2.9-5.5) (0-1.3)
Jagang 751 5.9 4.9 0.9
(4-7.7) (3.4-6.4) (0.2-1.7)
North Phyongan 790 5.1 4.3 0.8
(3.3-6.8) (2.7-5.9) (0.1-1.4)
South Phyongan/Nampo
770 3.9 3.2 0.6
(2.6-5.2) (2-4.5) (0.1-1.2)
North Hwanghae 782 4.5 3.8 0.6
(3.2-5.8) (2.6-5.1) (0.1-1.2)
South Hwanghae 778 2.6 2.1 0.5
(1.5-3.7) (1-3.1) (0-1)
Pyongyang 431 2.1 1.9 0.2
(0.9-3.3) (0.7-3) (-0.2-0.7)
Age group (month)
6-11 933 4.7 3.9 0.9
(3.3-6.2) (2.5-5.2) (0.3-1.5)
12-23 1 630 7.1 6.0 1.0
15
Cut-offs values for MUAC were validated by WHO for children aged 6-59 months.

Preliminary Report, National Nutrition Survey 2012, DPRK
19
(5.7-8.4) (4.8-7.3) (0.5-1.6)
24-35 1 669 4.9 4.2 0.7
(3.7-6) (3.1-5.3) (0.3-1.1)
36-47 1 558 1.6 1.4 0.2
(1-2.3) (0.8-2) (0-0.4)
48-59 1 592 2.2 1.8 0.4
(1.4-3) (1.1-2.5) (0-0.8)
Underweight or weight-for-age is presented in table 7 and is one of the Millennium Development Goal (MDG) indicators for MDG 1; to eradicate poverty and hunger. Underweight was largely used in the past because of its simplicity but as it gives information on both acute and chronic malnutrition at the same time, it lacks a certain precision for definition of interventions. More specific indicators like weight for height (or MUAC) and height for age are preferred for programme purpose.
Tab. 7: Prevalence of global (W/A < -2 Z-scores), moderate (W/A ≥ -3 Z-s et < -2 Z-s), and severe (W/A < -3
Z-s) underweight based on weight for age z-score per sex, province and age group in children aged 0-59 months. DPR Korea, October 2012.
Unweighted
count
Global underweight
(95% CI)
Moderate underweight
(95% CI)
Severe underweight
(95% CI)
Total total 8 036 15.2 12.4 2.9
(14.2-16.3) (11.5-13.3) (2.4-3.3)
Sex
Boys 4 115 15.5 12.3 3.2
(14.1-16.9) (11.1-13.6) (2.6-3.7)
Girls 3 921 15.0 12.4 2.6
(13.6-16.4) (11.2-13.6) (2-3.1)
Province
Ryanggang 840 20.0 14.5 5.5
(16.6-23.4) (11.7-17.3) (3.8-7.2)
North Hamgyong 840 16.4 14.0 2.4
(13.7-19.1) (11.4-16.7) (1.3-3.5)
South Hamgyong 840 18.6 13.9 4.6
(14.9-22.2) (11.3-16.5) (2.8-6.5)
Kangwon 836 18.7 14.6 4.1
(15.2-22.2) (11.9-17.3) (2.3-5.9)
Jagang 840 16.5 13.6 3.0
(13.6-19.5) (10.8-16.3) (1.9-4)
North Phyongan 840 17.1 13.3 3.8
(13.1-21.2) (10.2-16.5) (2.2-5.4)
South Phyongan/Nampo
840 13.0 11.5 1.4
(10-15.9) (8.8-14.3) (0.5-2.3)
North Hwanghae 840 14.6 12.0 2.6
(12-17.2) (10-14.1) (1.3-3.9)
South Hwanghae 840 14.6 11.4 3.2
(11.7-17.6) (8.7-14.2) (2.1-4.3)
Pyongyang 480 10.0 8.8 1.3
(7.1-12.9) (6.2-11.3) (0.1-2.4)
Age group (month)
0-5 643 2.9 2.2 0.7
(1.6-4.3) (1-3.4) (0.1-1.3)
6-11 939 8.2 6.6 1.6
(6.1-10.2) (4.7-8.5) (0.8-2.4)
Preliminary Report, National Nutrition Survey 2012, DPRK
20
12-23 1 631 13.6 10.9 2.7
(11.6-15.6) (9-12.7) (1.9-3.5)
24-35 1 671 18.5 14.7 3.8
(16.3-20.7) (12.6-16.7) (2.8-4.8)
36-47 1 558 18.0 14.9 3.1
(15.8-20.3) (12.9-17) (2.1-4.1)
48-59 1 594 20.0 16.5 3.5
(17.6-22.3) (14.4-18.6) (2.5-4.4)
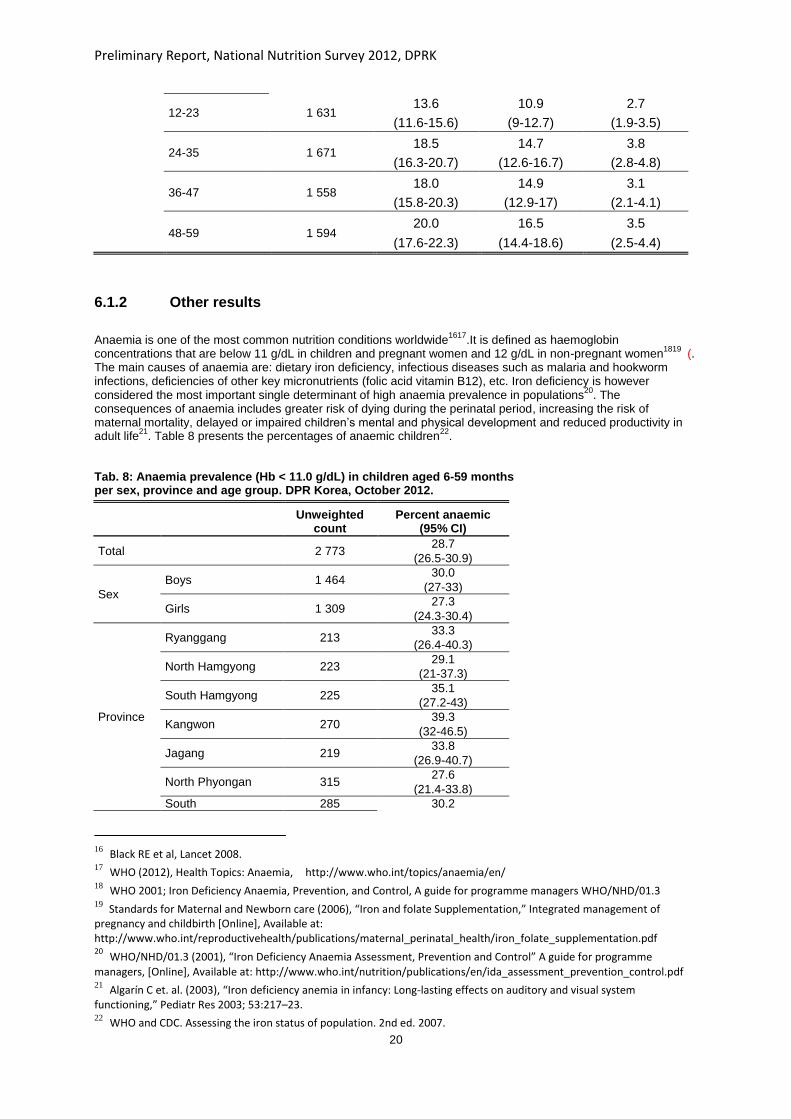
6.1.2 Other results
Anaemia is one of the most common nutrition conditions worldwide
1617.It is defined as haemoglobin
concentrations that are below 11 g/dL in children and pregnant women and 12 g/dL in non-pregnant women1819
(. The main causes of anaemia are: dietary iron deficiency, infectious diseases such as malaria and hookworm infections, deficiencies of other key micronutrients (folic acid vitamin B12), etc. Iron deficiency is however considered the most important single determinant of high anaemia prevalence in populations
20. The
consequences of anaemia includes greater risk of dying during the perinatal period, increasing the risk of maternal mortality, delayed or impaired children‟s mental and physical development and reduced productivity in adult life
21. Table 8 presents the percentages of anaemic children
22.
Tab. 8: Anaemia prevalence (Hb < 11.0 g/dL) in children aged 6-59 months per sex, province and age group. DPR Korea, October 2012.
Unweighted count
Percent anaemic (95% CI)
Total
2 773 28.7
(26.5-30.9)
Sex
Boys 1 464 30.0
(27-33)
Girls 1 309 27.3
(24.3-30.4)
Province
Ryanggang 213 33.3
(26.4-40.3)
North Hamgyong 223 29.1
(21-37.3)
South Hamgyong 225 35.1
(27.2-43)
Kangwon 270 39.3
(32-46.5)
Jagang 219 33.8
(26.9-40.7)
North Phyongan 315 27.6
(21.4-33.8)
South 285 30.2
16
Black RE et al, Lancet 2008. 17
WHO (2012), Health Topics: Anaemia, http://www.who.int/topics/anaemia/en/ 18
WHO 2001; Iron Deficiency Anaemia, Prevention, and Control, A guide for programme managers WHO/NHD/01.3 19
Standards for Maternal and Newborn care (2006), “Iron and folate Supplementation,” Integrated management of pregnancy and childbirth [Online], Available at: http://www.who.int/reproductivehealth/publications/maternal_perinatal_health/iron_folate_supplementation.pdf 20
WHO/NHD/01.3 (2001), “Iron Deficiency Anaemia Assessment, Prevention and Control” A guide for programme
managers, [Online], Available at: http://www.who.int/nutrition/publications/en/ida_assessment_prevention_control.pdf 21
Algarín C et. al. (2003), “Iron deficiency anemia in infancy: Long-lasting effects on auditory and visual system functioning,” Pediatr Res 2003; 53:217–23. 22
WHO and CDC. Assessing the iron status of population. 2nd ed. 2007.

Preliminary Report, National Nutrition Survey 2012, DPRK
21
Phyongan/Nampo (23.5-36.9)
North Hwanghae 323 28.5
(23.6-33.4)
South Hwanghae 285 28.1
(21.9-34.2)
Pyongyang 415 23.9
(19.2-28.5)
Age group (month)
6-11 305 45.4
(39-51.8)
12-23 654 47.9
(43.1-52.8)
24-35 627 22.9
(19.1-26.8)
36-47 587 19.1
(15.4-22.8)
48-59 600 15.1
(12-18.2)
Worldwide, vitamin A supplementation to children aged from 6 to 59 month has shown a large impact on child survival and is one of the most common public health programs targeting children (Black et al, Lancet 2008). In DPRK, it is usually distributed twice in a year through nurseries and Household doctors. The proportion of children who received one dose of Vitamin A in the last six months can be found in table 9.
Tab. 9: Proportion of children aged 6-59 months who received vitamin A
supplementation in the last 6 months per sex, province and age group. DPR Korea, October 2012.
Unweighted
count Percent (95% CI)
Total
7 393 97.8
(97.4-98.2)
Sex
Boys 3 788 97.9
(97.4-98.4)
Girls 3 605 97.7
(97.1-98.3)
Province
Ryanggang 762 97.8
(96.8-98.7)
North Hamgyong 770 98.3
(97.5-99.2)
South Hamgyong 782 98.2
(97.1-99.3)
Kangwon 768 97.8
(96.7-98.9)
Jagang 753 97.7
(96.6-98.9)
North Phyongan 790 98.5
(97.7-99.3)
South Phyongan/Nampo
771 96.6
(95-98.2)
North Hwanghae 784 96.8
(95.5-98.1)
South Hwanghae 779 98.2
(97.3-99.1)
Pyongyang 434 98.4

Preliminary Report, National Nutrition Survey 2012, DPRK
22
(97.3-99.5)
Age group (month)
6-11 939 96.5
(95.1-97.9)
12-23 1 631 98.2
(97.5-98.9)
24-35 1 671 97.8
(97-98.6)
36-47 1 558 98.1
(97.4-98.9)
48-59 1 594 97.9
(97-98.7)
Caretakers were asked if their child had been sick in the last two weeks and, if so, did it suffer from diarrhoea, respiratory tract infections or others. Disease and infections are important determinants of nutritional status. Results are shown in table 10.
Tab. 10: Morbidity prevalence or reported sickness over the last 14 days and prevalence of diarrhoea and
RTI (over the total sample) in children aged 0-59 months per sex, province and age group. DPR Korea, October 2012.
Unweighted
count
Morbidity prevalence (95%
CI)
Percent with diarrhoea (95%
CI)
Percent with respiratory tract
infection (95% CI)
Total
8 040 14.0 8.5 6.5
(13.1-15) (7.8-9.3) (5.8-7.2)
Sex
Boys 4 117 14.8 9.3 6.7
(13.6-16.1) (8.3-10.3) (5.7-7.6)
Girls 3 923 13.2 7.7 6.3
(12-14.4) (6.8-8.7) (5.4-7.2)
Province
Ryanggang 840 15.8 9.0 5.6
(13.7-18) (6.9-11.2) (4.1-7.1)
North Hamgyong 840 18.0 12.3 7.0
(14.8-21.1) (9.5-15) (4.4-9.7)
South Hamgyong 840 14.5 8.9 6.2
(12-17) (6.7-11.2) (4.3-8.1)
Kangwon 840 14.9 8.5 8.6
(12.5-17.2) (6.4-10.5) (6.9-10.3)
Jagang 840 15.0 9.5 6.2
(12.4-17.6) (7.2-11.8) (4.4-7.9)
North Phyongan 840 11.3 7.9 7.5
(8.8-13.8) (6.1-9.6) (5.3-9.7)
South Phyongan/Nampo
840 11.5 8.0 4.6
(9.3-13.8) (6.1-9.9) (3.3-6)
North Hwanghae 840 16.3 7.4 8.0
(13.4-19.3) (5.7-9.1) (5.8-10.2)
South Hwanghae 840 11.0 7.0 6.3
(8.4-13.6) (5-9) (4.4-8.2)
Pyongyang 480 15.8 8.1 6.5
(12.4-19.3) (5.5-10.7) (3.9-9)
Age group (month)
0-5 647 9.8 9.8 6.7
(6.9-12.7) (6.9-12.7) (4.4-9.1)
6-11 939 11.1 11.1 8.7
(8.9-13.3) (8.9-13.3) (6.7-10.8)

Preliminary Report, National Nutrition Survey 2012, DPRK
23
12-23 1 631 11.8 11.8 6.7
(10.1-13.5) (10.1-13.5) (5.3-8.2)
24-35 1 671 8.6 8.6 6.3
(7-10.1) (7-10.1) (4.9-7.6)
36-47 1 558 6.6 6.6 7.3
(5.1-8) (5.1-8) (5.8-8.8)
48-59 1 594 9.7 5.1 4.3
(8.1-11.3) (3.8-6.4) (3.3-5.4)
6.2 Women
MUAC is also used also in adults to diagnose acute malnutrition. Unlike BMI (body mass index) it is not affected by pregnancy. Two commonly used thresholds23 for program admissions are 180mm for severe acute malnutrition and 210mm for moderate. The prevalence of MUAC < 225 mm is also presented as it was used in the last MICS survey (2009) and still in use in several countries.
The main results concerning the mothers of selected children, aged 15-49 years, are presented in tables 11.
Tab. 11: Proportion of women aged 18-49 years with low MUAC per province and age group. DPR Korea,
October 2012.
Unweighted
count
MUAC < 210 mm
(95% CI)
MUAC ≥ 180 and < 210 mm
(95% CI)
MUAC < 180 mm
(95% CI)
MUAC < 225 mm
(95% CI)
Total
7 622 5.3 5.0 0.3 23.2
(4.7-5.9) (4.4-5.6) (0-1) (21.9-24.5)
Province
Ryanggang 801 6.6 6.1 0.5 23.1
(5-8.3) (4.5-7.8) (0-1) (19.9-26.3)
North Hamgyong
813 5.9 5.5 0.4 19.9
(4.2-7.6) (3.9-7.2) (0-0.8) (17-22.9)
South Hamgyong
795 6.2 5.8 0.4 26.4
(4.3-8) (4-7.6) (0-0.8) (22.6-30.2)
Kangwon 790 6.1 5.8 0.3 22.9
(4.2-8) (4-7.7) (-0.1-0.6) (19.2-26.6)
Jagang 822 5.6 5.2 0.4 18.1
(4.1-7.1) (3.8-6.7) (0-0.8) (15.1-21.2)
North Phyongan
783 4.7 4.5 0.3 21.5
(3.1-6.3) (2.9-6) (-0.1-0.6) (18-24.9)
South Phyongan/Nampo
787 5.2 5.0 0.3 22.2
(3.1-7.1) (3-6.9) (-0.1-0.6) (18-26.4)
North Hwanghae
778 5.5 5.3 0.3 26.7
(3.7-7.4) (3.6-6.9) (-0.2-0.8) (22.5-31)
South Hwanghae
780 5.4 5.1 0.3 28.2
(3.9-6.9) (3.6-6.6) (-0.1-0.6) (24.7-31.7)
Pyongyang 473 3.8 3.6 0.2 21.8
(1.9-5.7) (1.7-5.5) (-0.2-0.6) (17.5-26.1)
Age group (year)
15-19 1 0.0 0.0 0.0 0.0
(0-0) (0-0) (0-0) (0-0)
20-29 3 675 6.0 5.8 0.2 25.2
23
Unlike MUAC in children there is no international consensus on MUAC thresholds in adults.

Preliminary Report, National Nutrition Survey 2012, DPRK
24
(5-6.9) (4.9-6.7) (0.1-0.3) (23.4-27.1)
30-39 3 648 4.8 4.4 0.4 21.4
(4-5.5) (3.7-5.1) (0.2-0.6) (19.7-23)
40-49 298 4.1 3.8 0.3 21.8
(1.8-6.4) (1.5-6) (-0.3-1) (16.4-27.2)
Anaemia prevalence assessed through haemoglobin concentration in mothers of surveyed children is presented in table 12.
Tab. 12: Prevalence of anaemia (Hb < 11 g/dL if pregnant and <12.0 g/dL if non-pregnant)
in women aged 15-49 years per province and age group.
DPR Korea, October 2012.
Unweighted count
Percent anaemic (95% CI)
Total
5 843 31.2
(29.6-32.9)
Province
Ryanggang 522 36.0
(31.7-40.3)
North Hamgyong 520 33.5
(28.3-38.6)
South Hamgyong 527 33.8
(29.3-38.3)
Kangwon 676 34.2
(29.2-39.1)
Jagang 529 34.2
(29.6-38.8)
North Phyongan 640 29.8
(24.8-34.9)
South Phyongan/Nampo
666 28.7
(24.1-33.2)
North Hwanghae 636 32.5
(29.1-36)
South Hwanghae 680 31.5
(26.9-36)
Pyongyang 447 28.9
(24.3-33.5)
Age group (year)
15-19 1 0.0
(0-0)
20-29 2 816 31.8
(29.5-34.1)
30-39 2 805 30.2
(28.1-32.3)
40-49 221 38.7
(31.6-45.7)
As soon as a woman knows that she is pregnant she can benefit of a multi-micronutrient supplement (one tablet daily for 6 months) through the primary healthcare system. This supplement includes 15 different types of vitamins and minerals (see annex 3 for detailed composition), including iron, folic acid, iodine and vitamin A. The main purpose is to prevent anaemia and provide extra micronutrients for the pregnancy requirements. Results are

Preliminary Report, National Nutrition Survey 2012, DPRK
25
presented in table 13. Duration in month of the supplementation will be presented in the final report.
Tab. 13: Proportion of women aged 15-49 who received the micronutrient supplement during pregnancy per province and age group. DPR Korea, October 2012.
Unweighted count
Percent (95% CI)
Total
3 110 74.0
(72.1-75.8)
Province
Ryanggang 334 55.1
(50-60.1)
North Hamgyong 328 62.5
(57.9-67.1)
South Hamgyong 322 69.6
(64.3-74.8)
Kangwon 346 76.9
(72.3-81.5)
Jagang 325 65.5
(60.6-70.5)
North Phyongan 310 76.1
(70.5-81.7)
South Phyongan/Nampo 334 72.5
(66.6-78.3)
North Hwanghae 313 73.2
(67.3-79)
South Hwanghae 299 80.3
(74.3-86.2)
Pyongyang 199 88.4
(83.7-93.2)
women age
15-19 1 100.0
(100-100)
20-29 1 999 73.7
(71.3-76.1)
30-39 1 047 74.3
(71.5-77)
40-49 63 78.7
(68.3-89.1)
Preliminary Report, National Nutrition Survey 2012, DPRK
26
7. DISCUSSION
Stunting (Chronic malnutrition)
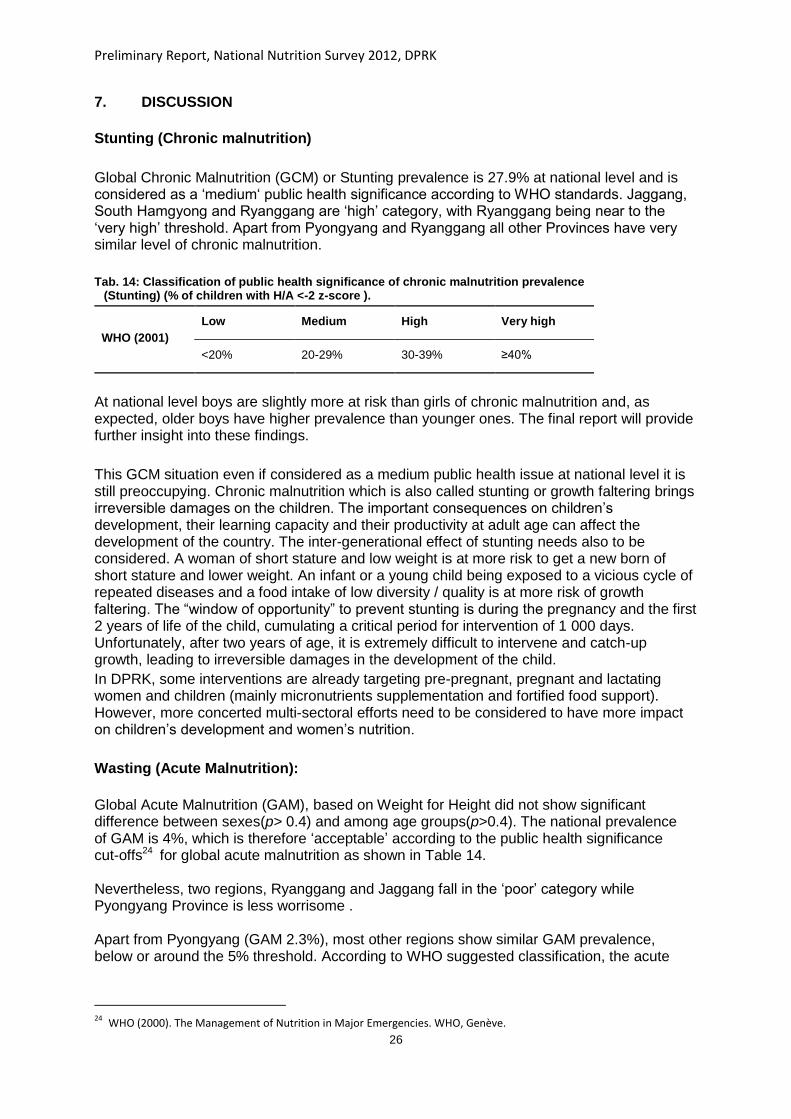
Global Chronic Malnutrition (GCM) or Stunting prevalence is 27.9% at national level and is considered as a „medium„ public health significance according to WHO standards. Jaggang, South Hamgyong and Ryanggang are „high‟ category, with Ryanggang being near to the „very high‟ threshold. Apart from Pyongyang and Ryanggang all other Provinces have very similar level of chronic malnutrition.
Tab. 14: Classification of public health significance of chronic malnutrition prevalence
(Stunting) (% of children with H/A <-2 z-score ).
WHO (2001)
Low Medium High Very high
<20% 20-29% 30-39% ≥40%
At national level boys are slightly more at risk than girls of chronic malnutrition and, as expected, older boys have higher prevalence than younger ones. The final report will provide further insight into these findings.
This GCM situation even if considered as a medium public health issue at national level it is still preoccupying. Chronic malnutrition which is also called stunting or growth faltering brings irreversible damages on the children. The important consequences on children‟s development, their learning capacity and their productivity at adult age can affect the development of the country. The inter-generational effect of stunting needs also to be considered. A woman of short stature and low weight is at more risk to get a new born of short stature and lower weight. An infant or a young child being exposed to a vicious cycle of repeated diseases and a food intake of low diversity / quality is at more risk of growth faltering. The “window of opportunity” to prevent stunting is during the pregnancy and the first 2 years of life of the child, cumulating a critical period for intervention of 1 000 days. Unfortunately, after two years of age, it is extremely difficult to intervene and catch-up growth, leading to irreversible damages in the development of the child.
In DPRK, some interventions are already targeting pre-pregnant, pregnant and lactating women and children (mainly micronutrients supplementation and fortified food support). However, more concerted multi-sectoral efforts need to be considered to have more impact on children‟s development and women‟s nutrition.
Wasting (Acute Malnutrition):
Global Acute Malnutrition (GAM), based on Weight for Height did not show significant difference between sexes(p> 0.4) and among age groups(p>0.4). The national prevalence of GAM is 4%, which is therefore „acceptable‟ according to the public health significance cut-offs24 for global acute malnutrition as shown in Table 14. Nevertheless, two regions, Ryanggang and Jaggang fall in the „poor‟ category while Pyongyang Province is less worrisome . Apart from Pyongyang (GAM 2.3%), most other regions show similar GAM prevalence, below or around the 5% threshold. According to WHO suggested classification, the acute
24
WHO (2000). The Management of Nutrition in Major Emergencies. WHO, Genève.

Preliminary Report, National Nutrition Survey 2012, DPRK
27
malnutrition situation in these regions is at the limit between acceptable and poor situation.25 Several factors such as sufficient WASH facilities and practices, access to essential medications and food security affect children‟s daily life. It is important to note some key aspects about interventions and several factors in DPRK:
The interventions on agriculture, food security, health, WASH and nutrition all play a major role in the nutritional status in children and women. It is highly possible that a decrease of any of these interventions could affect negatively the nutritional status of children.
The data collection was conducted during the harvest season where the food diversity and food intake of children may be somewhat higher than in other seasons with a wider availability to wild food and consumption of household authorized production.
It is known through medical records that the acute malnutrition is decreasing in September compared to June-July-August period.
In 2012, the agricultural season was less affected by environmental challenges (floods, dryspell, drought) as compared to 2011 allowing then the Government to maintain an average food ration of 370g (rice, maize, potato, wheat, barley or soya depending on the season and the location) per day per person almost throughout the year (350-400g ).
The public health significance thresholds and the international triggers for emergency operations, must be used sensibly for making decision concerning nutrition-related programs. Acutely malnourished children have a much higher risk of mortality than normal children and do not grow properly during acute malnutrition episode putting them at higher risk of stunting and thus negatively impacting on their mental development26. Regardless of malnutrition prevalence, national institutions should ensure a regular identification of all acutely malnourished children and provide proper treatment. This illustrates the importance of regular monitoring of the nutritional status in the most affected areas. The prevalence of GAM based on MUAC is similar to the Weigth for Height27results, showing differences between gender(p from chi-square <0.001) or age groups(p from chi-square <0.001). Tab. 15: Classification of public health significance of acute malnutrition prevalence (% of
children with W/H <-2 z-score and/or oedema).
WHO (2000)
Acceptable Poor Serious Critical
<5% 5-9% 10-14% ≥15%
This survey is not designed to count the number of children with chronic or acute malnutrition. However, extrapolation can still be done based on the actual population of children aged 0-59 months (population at the end of 2011: 24 488 861 with 1 705 620 children 0-59 months (about 6.96% of population). Chronic malnutrition does not vary during the year and will show variation over many years instead of months as opposed to acute malnutrition. If the extrapolation is done with chronic malnutrition, it is then estimated that, at the time of the survey, 475 868 children are stunted (122 805 being severely stunted). There are about 4523 Ri/ Up/Ku/Dong (village / urban
25
WFP-UNHCR (2011). Guidelines For Selective Feeding: The Management Of Malnutrition In Emergencies January 2011. 26
Black et al, Lancet 2008. 27
However this does not means that the two methods identify the same children.

Preliminary Report, National Nutrition Survey 2012, DPRK
28
neighbourhood) in DPRK. This means that in every Ri/Up/Ku/Dong, there are about 105 stunted children (27being severely stunted). At the time of the survey (September 17th to October 17th), still 68 225 children were acutely malnourished (10 234 being severely acute malnourished) with about 15 children with acute malnutrition in every Ri/Up/Ku/Dong (2 being in a severe status). It is likely that each Province may have Counties or part of Counties with either higher or lower prevalence of acute malnutrition. This result of acute malnutrition varies monthly and even weekly according to season and the accumulated number must be considered for the whole year.
Other aspects in children:
According to WHO28 classification of severity in table 16 DPRK presents a „moderate‟ level of anaemia prevalence and disaggregated provincial figures are also in this same category.
Tab. 16: Classification of public health significance of anaemia (% of children with Hb < 11.0 g/dL).
WHO (2001)
Normal Mild Moderate Severe
<5% 5-19% 20-39% ≥40%
A high peak of anaemia was found in infants below 2 years of age, which may depend on inadequate breastfeeding and complementary feeding practices, including low nutrient quality of complementary food, especially in iron. Prevalence of infectious disease may also be a reason although prevalence of diarrhoea and/or acute respiratory infections was not particularly high in this age group. Deworming and micronutrient supplementation (or distribution of fortified food support) strategies need to be revised to improve effectiveness of interventions in the fight against anaemia in children under 2 years.
Vitamin A supplementation was almost universal, as on average almost 98% of mothers reported that their child had received a capsule in the last 6 months. No significant differences among Provinces, age groups or sexes stand out. Vitamin A is distributed two times per year through the Child Health Days. This result is in accordance with the coverage reported in the MICS 2009.
Morbidity in children was reported by 14% of respondents. No international cut-off exists for the public health importance of this level. Comparison with previous survey data will tell more.
Mother’s nutritional status:
The mothers‟ situation is very similar to the one in their children. Acute malnutrition prevalence, based on MUAC < 210mm, was 5.3% and anaemia 31.2%. Compared to MICS 2009 and Nutrition Assessment 2004 a slight reduction in acute malnutrition (based on MUAC < 225 mm) (from 25.6% to 23.2%) and anaemia has been found but still no statistically significant difference was noted. These data will be disaggregated by pregnancy status in the final report.
Multi-micronutrient supplementation during pregnancy was reported by 74%29 of interviewed mothers, ranging from 55% in Ryanggang to 80.3% in Pyongyang. The duration of the
28
WHO (2001). Iron Deficiency Anaemia Assessment, Prevention, and Control. A guide for programme managers. 29
Compliance with the therapy will be reported in the final report.

Preliminary Report, National Nutrition Survey 2012, DPRK
29
supplementation will be further explored in the final report. This program should also be strengthened to achieve a wider coverage as it has proven a highly effective public health intervention to prevent anaemia.
Historic of malnutrition in DPRK
In the table 17 the main nutrition findings of previous surveys are set out for comparison. A decrease trend in malnutrition and anaemia is apparent although further analysis is needed to assess trends in the nutritional status of the population. Moreover, in some cases different coverage, sampling methods, standards and age groups were used making comparisons uneasy. Tab. 17: Historical records of nutrition and health surveys in DPRK since 1998.
Survey
Month and year of data
collection
Coverage
Sample size for acute
malnutrition
GCM SCM GAM SAM Global Underweight
Vitamin A
children
Anaemia childre
n
Anaemia wome
n
Nat. Nut. Survey 2012
Sep. –Oct. 2012
National 8035 27.9%
7.2% 4.0% 0.6%
15.2% 97.8% 28.7% 31.2%
MICS 3 Sep.-Oct.
2009 National 2172
32.4%
8.4% 5.2% 0.5%
18.8% 98.0% NA NA
DPRK Nutrition
Assessment*
October 2004
7 Provinces and 1
Municipality 4795
37.0%
12.2%
7.0% 1.8%
23.3 98.2% NA 34.7%
DPRK Nutrition
Assessment**
October 2002
National 5994 39.2%
NA 8.1% 2.7%
20.1 98.6% NA 33.6%
MICS 2† May 2000 National 4175 45.2%
22.4%
10.4%
4.2%
27.9 80.2% NA NA
MICS 1‡ Sep. –Oct. 1998
130 over 212
national counties
1762 62.3%
NA 15.6%
NA 60.6 NA 31.7% 34.7%
* NCHS 1977 standards. Anthropometry for children from 0 to 7 years. Anaemia threshold in women 12.0 g/dL. Anaemia only in mothers of under 2. Vitamin A in children 6-24 months
** NCHS 1977 standards. Anthropometry for children from 0 to 7 years. Vitamin A in children 6-24 months
† NCHS 1977 standards. Anthropometry children 0-59 months
‡ NCHS 1977 standards. Anaemia and anthropometry in children aged 6 to 84 months.
Figure 1 illustrates more specific the changes in GAM from last MICS 2009 survey. GAM levels are plotted by province. Error bars represent the confidence intervals and allows for a first assessment of significance of variation30. As it is apparent from the figure, there is slight, consistent, dropping in malnutrition estimates across all Provinces. However these reductions are not statistically significant. Large confidence intervals in MICS survey are due to the smaller sample size.
30
The more the confidence intervals of two estimates overlap, the more that difference is likely due to chance and so is not significant. If confidence intervals do not overlap

Preliminary Report, National Nutrition Survey 2012, DPRK
30
Fig. 1 : GAM prevalence and confidence intervals of MICS 2009 and
National Nutrition Survey 2012 surveys.
The Millennium Development Goals (MDG) 1 was to eradicate extreme poverty and hunger between 1990 and 201531. Three indicators should be used to assess achievement of a country for this MDG:
1- Decrease by 50%the proportion of people who suffer from hunger 2- Decrease by 50% the proportion of population below the minimum level of dietary
energy consumption 3- Decrease by 50% the prevalence of underweight children under five years of age
The actual survey was not designed to bring information on the objectives 1 and 2. Despite the difficulties to compare the different surveys completed since 1998, this National Nutrition Survey allows to look at the situation for the third indicator related to the underweight prevalence. The table 17 presents the prevalence of underweight obtained in the different nutritional surveys since 1998.The achievement in decreasing underweight over time, as well as acute and chronic malnutrition, are primarily due to concerted efforts between Government, UN Agencies and others partners in DPRK in addressing the different causes of malnutrition. But malnutrition still remains and requires continued and strengthened interventions on acute and chronic malnutrition in order to have more impact on the underweight prevalence.
31
United Nations Development Group. Thematic Paper on MDG 1: Eradicate extreme poverty and hunger

Preliminary Report, National Nutrition Survey 2012, DPRK
31
8. CONCLUSIONS AND RECOMMENDATIONS Global Chronic Malnutrition (GCM) or Stunting prevalence is 27.9% at national level and is considered as a „medium„public health significance according to WHO standards. It is estimated that 475 868 children are stunted in DPRK. Stunting has irreversible impact on the development of children and as a result on the Country development. The prevention of stunting in early life (starting during or even before pregnancy) as well as the prevention of anaemia in mothers and their children (mainly those under 2 years old) through different multi-sectoral interventions combining nutrition, health, WASH, social protection, food security and agriculture requires more efforts and resources. The acute nutritional status of children is modestly improved since the last MICS assessment in 2009. The situation is not critical and does not suggest emergency operations. However, attentions need to be paid to such factors as essential medicines, WASH situation and food security which affect the vulnerable children. The presence of acute malnutrition and anaemia in women is important as these women should be targeted with more specific interventions during pregnancy and lactation to offer the best start as possible for their children. Programmes like the management of acute malnutrition at hospital and community levels (CMAM) need to be continued and expanded to allow early identification of these children and cover a maximum of children. At the moment of the survey, 68 225 children were acutely malnourished in the Country and 10 234 of them were severely affected. On-going monitoring of the nutritional situation is important to identify the trends and changes in the situation and bring support as soon as possible when the situation is negatively changing32. The prevalence of anaemia is quite high in children and women and requires more attention as it has important impact on the outcome of pregnancy and children development. Causal relationships cannot be extrapolated from this survey but further analysis will be presented in the final to suggest possible relationship between anaemia, food diversity and nutritional status. In reference to the MDG 1, the achievement in decreasing underweight over time, as well as chronic and acute malnutrition, are primarily due to concerted efforts between the Government, the UN Agencies and others partners in DPRK in addressing the different causes of malnutrition. But malnutrition still remains and requires continued and strengthened interventions on acute and especially chronic malnutrition in order to have more impact on the underweight prevalence and to ensure a more optimal growth to the children.
32
MUAC screenings, nutrition surveillance in clinics and hospitals and surveys are the three main methods of nutritional assessment.

Preliminary Report, National Nutrition Survey 2012, DPRK
32
9. ACKNOWLEDGEMENTS
It was the first time for the CBS to conduct national nutrition survey in September and October 2012 based on SMART survey. SMART is a survey methodology which enables to monitor and evaluate nutrition and health status of the children and mothers in emergencies. 2012 DPRK national nutrition survey was done successfully with close relationship between national agencies as CBS, ICN, MoPH, NCC, and international organizations as UNICEF, WFP and WHO. Many people from CBS, every provincial and city, county people‟s committee and statistical offices, and ri/up/ku/dong office worked hard for success of the survey. 2012 nutrition survey indicators gave technical assistance for scientific accuracy of the survey to nutrition persons from ICN by evaluating nutrition and health status of the children and mothers. We pay thanks to all the agencies and people for the assistance to the 2012 survey. Also special thanks are expressed to the respondents who answered personal questions of the enumerators with deep understanding and generosity. Without their voluntary and positive participation, this survey could not be done properly. We show gratitude to UNICEF, WFP and WHO for giving support to successfully conduct the survey. Sampling, data processing procedure and processing based on standardized SMART methodology provided by UNICEF enhanced CBS nutrition survey team‟s capacity to analyze more profoundly about the general sampling survey and gave a lot of help for future statistics. In the whole process of the 2012 nutrition survey, UNICEF consultant David Rizzi endeavoured for training, sampling, accuracy of data processing and tabulation, and preliminary report writing and etc. We are grateful for all the technical, financial assistance by UNICEF during the whole survey period and devoted efforts of UNICEF nutrition team in all stages of the nutrition survey for successful implementation.

Preliminary Report, National Nutrition Survey 2012, DPRK
33
Annex 1 - Data appraisal for key indicators per Province, DPR Korea, October 2012
N Mean ± SD Design effect Missing values
Out of range values
Variable Value Count Percent Count Percent
Total
W/H 8 035 -0.30 ± 1.00 < -2 z-s 1.36 5 0.1 0 0.0
W/A 8 036 -0.94 ± 1.09 < -2 z-s 1.92 4 0.0 0 0.0
H/A 8 036 -1.30 ± 1.29 < -2 z-s 2.45 4 0.0 0 0.0
MUAC children 7 382 145.24 ± 11.78 < 125 mm 1.24 11 0.1 1 0.0
Hb children* 2 773 11.46 ± 1.30 < 11.0 g/dL 1.74 4620 62.5 0 0.0
MUAC women 7 622 238.72 ± 20.52 < 210 mm 1.46 27 0.4 0 0.0
Hb NPW** 5 745 -0.30 ± 1.00 < 12 g/dL 1.81 1904 24.9 3 0.0
Ryanggang
W/H 840 -0.29 ± 1.05 < -2 z-s .30 0 0.0 0 0.0
W/A 840 -1.14 ± 1.13 < -2 z-s .45 0 0.0 0 0.0
H/A 840 -1.66 ± 1.31 < -2 z-s .51 0 0.0 0 0.0
MUAC children 762 140.5 ± 11.22 < 125 mm .28 0 0.0 0 0.0
Hb children 213 11.16 ± 1.33 < 11.0 g/dL .30 549 72.0 0 0.0
MUAC women 801 239.47 ± 21.27 < 210 mm .26 6 0.7 0 0.0
Hb NPW 511 12.23 ± 1.32 < 12 g/dL .32 296 36.7 0 0.0
North Hamgyong
W/H 840 -0.38 ± 0.97 < -2 z-s .87 0 0.0 0 0.0
W/A 840 -1.03 ± 1.02 < -2 z-s 1.08 0 0.0 0 0.0
H/A 840 -1.35 ± 1.33 < -2 z-s 1.73 0 0.0 0 0.0
MUAC children 770 142.12 ± 10.16 < 125 mm 1.03 0 0.0 0 0.0
Hb children 223 11.67 ± 1.43 < 11.0 g/dL 1.54 547 71.0 0 0.0
MUAC women 813 241.39 ± 22 < 210 mm .99 0 0.0 0 0.0
Hb NPW 516 12.37 ± 1.38 < 12 g/dL 1.46 297 36.5 0 0.0
South Hamgyong
W/H 840 -0.36 ± 0.98 < -2 z-s 2.48 0 0.0 0 0.0
W/A 840 -1.04 ± 1.14 < -2 z-s 2.42 0 0.0 0 0.0
H/A 840 -1.39 ± 1.37 < -2 z-s 2.50 0 0.0 0 0.0
MUAC children 782 144.97 ± 11.86 < 125 mm 1.91 0 0.0 0 0.0
Hb children 225 11.26 ± 1.2 < 11.0 g/dL 1.78 557 71.2 0 0.0
MUAC women 795 236.06 ± 19.72 < 210 mm 1.55 7 0.9 0 0.0
Hb NPW 513 12.52 ± 1.34 < 12 g/dL 1.47 289 36.0 0 0.0
Kangwon
W/H 836 -0.46 ± 0.93 < -2 z-s .82 4 0.5 0 0.0
W/A 836 -1.06 ± 1.1 < -2 z-s 1.06 4 0.5 0 0.0
H/A 836 -1.29 ± 1.38 < -2 z-s 1.57 4 0.5 0 0.0
MUAC children 766 142.35 ± 10.94 < 125 mm .68 2 0.3 0 0.0
Hb children 270 11.02 ± 1.16 < 11.0 g/dL .82 498 64.8 0 0.0
MUAC women 790 239.21 ± 20.23 < 210 mm .79 0 0.0 0 0.0
Hb NPW 667 12.36 ± 1.13 < 12 g/dL 1.08 123 15.6 0 0.0
Jagang
W/H 839 -0.33 ± 1.03 < -2 z-s 1.01 1 0.1 0 0.0
W/A 840 -1.08 ± 1.06 < -2 z-s .73 0 0.0 0 0.0
H/A 840 -1.48 ± 1.3 < -2 z-s .78 0 0.0 0 0.0
MUAC children 751 143.03 ± 13.86 < 125 mm .63 2 0.3 0 0.0
Hb children 219 11.25 ± 1.28 < 11.0 g/dL .58 534 70.9 0 0.0
MUAC women 822 241.85 ± 21.35 < 210 mm .47 6 0.7 0 0.0
Hb NPW 517 12.25 ± 1.11 < 12 g/dL .69 311 37.6 0 0.0
North Phyongan
W/H 840 -0.5 ± 0.91 < -2 z-s 1.40 0 0.0 0 0.0
W/A 840 -1.13 ± 1.02 < -2 z-s 2.87 0 0.0 0 0.0
H/A 840 -1.38 ± 1.27 < -2 z-s 3.56 0 0.0 0 0.0
MUAC children 790 145.94 ± 11.87 < 125 mm 1.54 0 0.0 0 0.0
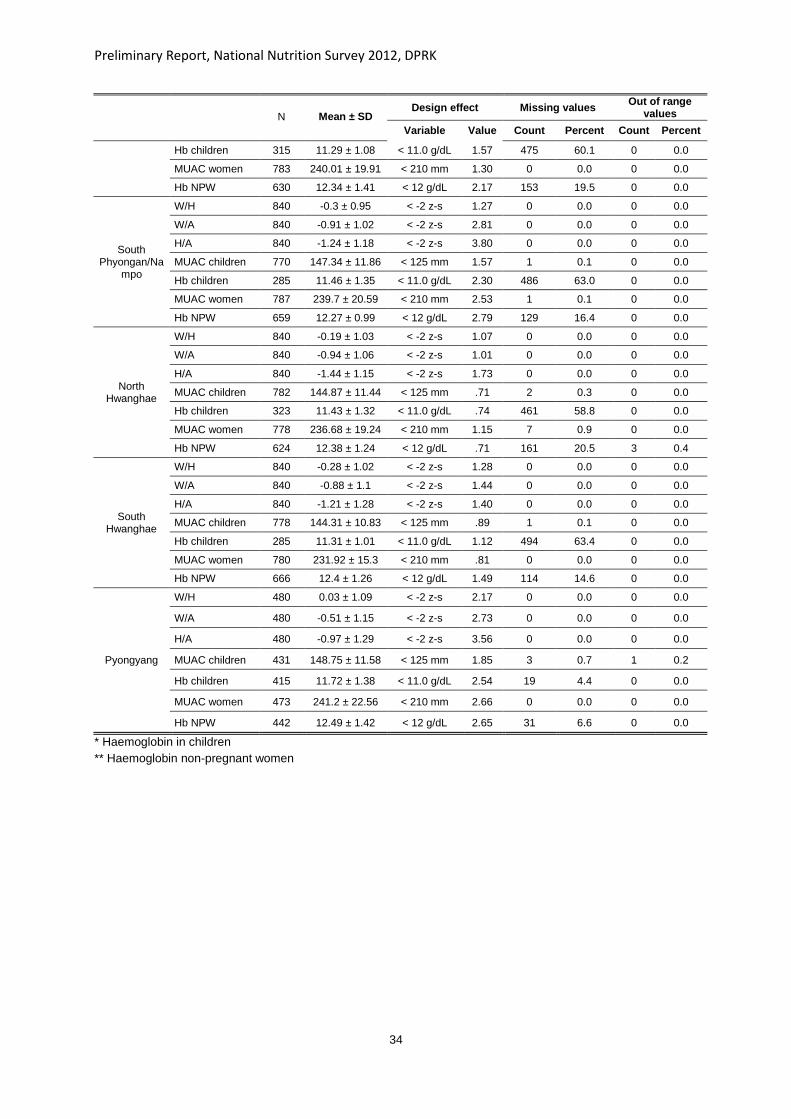
Preliminary Report, National Nutrition Survey 2012, DPRK
34
N Mean ± SD Design effect Missing values
Out of range values
Variable Value Count Percent Count Percent
Hb children 315 11.29 ± 1.08 < 11.0 g/dL 1.57 475 60.1 0 0.0
MUAC women 783 240.01 ± 19.91 < 210 mm 1.30 0 0.0 0 0.0
Hb NPW 630 12.34 ± 1.41 < 12 g/dL 2.17 153 19.5 0 0.0
South Phyongan/Na
mpo
W/H 840 -0.3 ± 0.95 < -2 z-s 1.27 0 0.0 0 0.0
W/A 840 -0.91 ± 1.02 < -2 z-s 2.81 0 0.0 0 0.0
H/A 840 -1.24 ± 1.18 < -2 z-s 3.80 0 0.0 0 0.0
MUAC children 770 147.34 ± 11.86 < 125 mm 1.57 1 0.1 0 0.0
Hb children 285 11.46 ± 1.35 < 11.0 g/dL 2.30 486 63.0 0 0.0
MUAC women 787 239.7 ± 20.59 < 210 mm 2.53 1 0.1 0 0.0
Hb NPW 659 12.27 ± 0.99 < 12 g/dL 2.79 129 16.4 0 0.0
North Hwanghae
W/H 840 -0.19 ± 1.03 < -2 z-s 1.07 0 0.0 0 0.0
W/A 840 -0.94 ± 1.06 < -2 z-s 1.01 0 0.0 0 0.0
H/A 840 -1.44 ± 1.15 < -2 z-s 1.73 0 0.0 0 0.0
MUAC children 782 144.87 ± 11.44 < 125 mm .71 2 0.3 0 0.0
Hb children 323 11.43 ± 1.32 < 11.0 g/dL .74 461 58.8 0 0.0
MUAC women 778 236.68 ± 19.24 < 210 mm 1.15 7 0.9 0 0.0
Hb NPW 624 12.38 ± 1.24 < 12 g/dL .71 161 20.5 3 0.4
South Hwanghae
W/H 840 -0.28 ± 1.02 < -2 z-s 1.28 0 0.0 0 0.0
W/A 840 -0.88 ± 1.1 < -2 z-s 1.44 0 0.0 0 0.0
H/A 840 -1.21 ± 1.28 < -2 z-s 1.40 0 0.0 0 0.0
MUAC children 778 144.31 ± 10.83 < 125 mm .89 1 0.1 0 0.0
Hb children 285 11.31 ± 1.01 < 11.0 g/dL 1.12 494 63.4 0 0.0
MUAC women 780 231.92 ± 15.3 < 210 mm .81 0 0.0 0 0.0
Hb NPW 666 12.4 ± 1.26 < 12 g/dL 1.49 114 14.6 0 0.0
Pyongyang
W/H 480 0.03 ± 1.09 < -2 z-s 2.17 0 0.0 0 0.0
W/A 480 -0.51 ± 1.15 < -2 z-s 2.73 0 0.0 0 0.0
H/A 480 -0.97 ± 1.29 < -2 z-s 3.56 0 0.0 0 0.0
MUAC children 431 148.75 ± 11.58 < 125 mm 1.85 3 0.7 1 0.2
Hb children 415 11.72 ± 1.38 < 11.0 g/dL 2.54 19 4.4 0 0.0
MUAC women 473 241.2 ± 22.56 < 210 mm 2.66 0 0.0 0 0.0
Hb NPW 442 12.49 ± 1.42 < 12 g/dL 2.65 31 6.6 0 0.0
* Haemoglobin in children
** Haemoglobin non-pregnant women

Preliminary Report, National Nutrition Survey 2012, DPRK
35
Annex 2 - Children and Women questionnaire, DPR Korea, October 2012
Q1 – Nutrition/Health Children Province : _____________ Ri/Up/Gu/Dong: ____________ WG/PC: ___________ Date (yy/mm/dd): ___ ___ ___
For all children between 0 and 23.9 months
C5. Child's name:
For all children between 0 and 59.9 months (muac from 6 months)
C17-C18 HEMOGLOBIN CONCENTRATION, VITAMIN A
Shorts………1Pants…….1
Only for children between 6 and 59.9 months
T-shirt……….1Diapers……..1
Yes …….…….1
No …….……...2
C13-C14 MORBIDITY
For all children between 0 and 59.9 months
Yes …………….…….1
No …………….……...2 → Go to C15
DK ………….……...…8 → Go to C15
WG/PC: _______________
C15-C16 BREASTFEEDINGC1-C8 CHILD IDENTIFICATION
C2. Household number: ____ ____
C11. Oedema (y/n)
___ ____ / ____ Kg ___ ____ / ____ cm
C15. HOW LONG AFTER BIRTH DID YOU FIRST PUT (NAME)
TO THE BREAST?Immediately…000
Hours…………1 ___ ___
C1. Cluster number: ___ ___ ___ ____
C4. Child's ID: ____ ____ ____
C18. HAS (NAME) RECEIVED A VITAMIN A
DOSE LIKE (THIS) WITHIN THE LAST 6
MONTHS?
Yes …………….…….1
C09-C12 ANTHROPOMETRY
C9. Weight (Kg) ±
100g
C8. Child's age in months: ________
DK ………….……...…8
No …………….……...2
Yes …….…….1
W/H (z-score) __________
C12. MUAC (mm)
6 to 59.9 months
old
___ ___ ___ mm
C13. HAS (NAME) BEEN SICK IN THE
LAST 14 DAYS?
WE WOULD LIKE TO ASK YOU THE
PERMISSION TO DO A BLOOD TEST FOR
HEMOGLOBINE CONCENTRATION ON (NAME).
THIS WILL CAUSE A LITTLE BIT OF PAIN.
THERE IS NO RISK FOR HIS HEALTH THOUGH.
WE WILL PROVIDE YOU THE RESULTS, SO IN
CASE OF ANEMIA, YOU CAN SEEK CARE AT
THE CLINIC.
C7. Birthday (yyyy/mm/dd):
C17.
Haemoglobin
concentration
(g/dL)
___ ___ / ___ g/dL
________ _____ _____
Days………….2 ___ ___
If Hb<11 g/dL refer to the clinic.
C6. Child's Sex (m/f): _______
No …….……...2
If respondent reports she put the infant to the breast immediately
after birth, circle '000'. If less than 1 hour, circle '1' for hours and
record '00' hours. If less than 24 hours, circle '1' and record
number of completed hours, from 01 to 23. Otherwise, circle '2'
and record number of completed days.
C16. WAS (NAME) BREASTFED YESTERDAY DURING THE
DAY OR AT NIGHT?
□ No, permission is not given → Go to C18
□ Yes, permission is given
C3. Team's number: ____ ____
__________________________________
C10. Height (cm)
± 0.1cm
C14. WHAT DID (NAME) SUFFER OF ?
Other………………….3
Cough, rapid breath., respiratory tract
infection……..…….....2
Diarrhea……….......…1

Preliminary Report, National Nutrition Survey 2012, DPRK
36
YES NO DK
Porridge, bread, rice, noodles and other foods made from grains A 1 2 8
Pumpkin, carrots, sweet potatoes and other vitamine A rich vegetables (yellow or orange inside) B 1 2 8
Potatoes and food made from potatoes C 1 2 8
Chrisantemum leaves, spinach, broccoli, sea weed and other dark green vegetables D 1 2 8
Apricot, peach E 1 2 8
Any other vegetable and fruit (cabbage, cucumber, tomato, eggplant, apple, pear, watermelon, etc) F 1 2 8
Liver, kidney, heart, or other organ meats G 1 2 8
Any meat, such as beef, pork, lamb, goat, chicken, or duck H 1 2 8
Eggs of all sorts I 1 2 8
Fresh or dried fish, shellfish or seafood J 1 2 8
Any food made from beans, peas, lentils, nuts ,or seeds K 1 2 8
Breastmilk L 1 2 8
Animal milk (fresh milk, milk powder, infant formula, tinned milk), yogurt, other milk products M 1 2 8
Cheese N 1 2 8
Oil, butter, or foods made with any of these O 1 2 8
Sweets, honey, caramel, chocolate, biscuits, cakes and other candy P 1 2 8
Drinks (tea, cofee, coke, fanta, sprite, tonic, etc.) Q 1 2 8
Water R 1 2 8
Fruit juice (strawberry, apple, pear, etc) S 1 2 8
Clear broth, thin soup T 1 2 8
Condiments such as pepper, parsley, salt, soy sauce, garlic, fish powder, etc U 1 2 8
Other foods V 1 2 8
C19 DIET
For children between 0 and 23.9 months
PLEASE DESCRIBE EVERYTHING THAT (NAME) ATE YESTERDAY DURING THE DAY OR NIGHT, WHETHER AT HOME OR OUTSIDE THE HOME.
As the respondent recalls foods, underline the corresponding food and circle ‘1’ in the column next to the food group. if the food is not listed in any of the food groups below,
write the food in the box labeled ‘other foods’. If foods are used in small amounts for seasoning or as a condiment, include them under the condiments food group.
Once the respondent finishes recalling foods eaten, read each food group where ‘1’ was not circled, ask the following question and circle ‘1’ if respondent says yes, ‘2’ if no and
‘8’ if don’t know: YESTERDAY DURING THE DAY OR NIGHT, DID (NAME) DRINK/EAT ANY (FOOD GROUP ITEMS)?
Other foods - Please write down other foods in this box
that respondent mentioned but are not in the list below:

Preliminary Report, National Nutrition Survey 2012, DPRK
37
Q2 – MothersProvince : _____________ Ri/Up/Gu/Dong: ____________ WG/PC: ___________ Date (yy/mm/dd): ___ ___ ___
M10 HEMOGLOBIN CONCENTRATION
For all women 15-49.9
M5. Woman's name:
__________________________________
M7. Pregnant Yes ……….1
No ………...2
M8 - M9 MICRONUTRIENT SUPPLEMENTATION
Only for women who gave birth in the last 23.9 months
Yes ……….1
For women 18-49.9
No ………...2 → go to question M10
Show common type of tablet DK ……...…8 → go to question M10
____ months
DK ……...… 99
M9. FOR HOW MANY MONTHS DID
YOU TAKE MICRONUTRIENT TABLETS
DURING THE PREGNANCY?
WE WOULD LIKE TO ASK YOU THE
PERMISSION TO DO A BLOOD TEST FOR
HEMOGLOBINE CONCENTRATION. THIS
WILL CAUSE A LITTLE BIT OF PAIN.
THERE IS NO RISK FOR YOUR HEALTH
THOUGH. WE WILL PROVIDE YOU THE
RESULTS, SO IN CASE OF ANEMIA, YOU
CAN SEEK CARE AT THE CLINIC.
Refer to clinic if:
- pregnant women Hb<11 g/dL
- non-pregnant women Hb<12 g/dL
M11. MUAC MEASURE (mm) ____ ____ ____ mm
M10.
Haemoglobin
concentration
___ ___ / ___ g/dl
M3. Team's number: ____ ____
M6. Woman's age in years: ____ ____
M11 MUACM8. DURING THE PREGNANCY FOR
THIS CHILD, DID YOU TAKE
MICRONUTRIENT TABLETS?
M1-M6 MOTHER IDENTIFICATION
M1. Cluster number: ____ ____ ____ M2. Household number: ____ ____
M4. Woman's ID: ____ ____ ____
□ No, permission is not given → Go to
M7
□ Yes, permission is given

Preliminary Report, National Nutrition Survey 2012, DPRK
38
YES NO DK
Porridge, bread, rice, noodles and other foods made from grains A 1 2 8
Pumpkin, carrots, sweet potatoes and other vitamin A rich vegetables (yellow or orange inside) B 1 2 8
Potatoes and food made from potatoes C 1 2 8
Chrisanemum leaves, spinach, broccoli, sea weed and other dark green vegetables D 1 2 8
Other vegetables (cabbage, cucumber, tomato, eggplant, etc) E 1 2 8
Apricot, peach (vitamin A rich fruits) and their juices F 1 2 8
Other fruits (apple, pear, watermelon, etc) and their juices G 1 2 8
Liver, kidney, heart, or other organ meats H 1 2 8
Any meat, such as beef, pork, lamb, goat, chicken, or duck I 1 2 8
Eggs of all sorts J 1 2 8
Fresh or dried fish, shellfish or seafood K 1 2 8
Any food made from beans, peas, lentils, nuts ,or seeds L 1 2 8
Milk (fresh milk, milk powder, tinned milk), yogurt, cheese, other milk products M 1 2 8
Oil, butter, or foods made with any of these N 1 2 8
Sweets, honey, caramel, non-fruit juice (coke, fanta, sprite, tonic), chocolate, biscuits, cakes and other candy O 1 2 8
Condiments and beverages such as pepper, parsley, salt, soy sauce, garlic, fish powder, tea, coffee, alcoholic beverages P 1 2 8
M12 DIET
For all women 15-49.9
Write down all food and drinks mentioned by the respondent. When the respondent has finished, probe for meals and snacks not mentioned, at home or outside.
PLEASE DESCRIBE THE FOODS (MEALS AND SNACKS) THAT YOU ATE YESTERDAY DURING THE DAY AND THE NIGHT, WHETHER AT HOME OR OUTSIDE
THE HOME. START WITH THE FIRST FOOD EATEN IN THE MORNING.
When the respondent recall is complete, fill in the food groups based on the informations recorded above. For any food group not mentioned, ask the respondent if a
food item from this group was consumed.
Breakfast Snack Lunch Snack Dinner Snack

Preliminary Report, National Nutrition Survey 2012, DPRK
39
Annex 3 – Composition of multi-micronutrient supplementation tablets for pregnant and lactating women, DPR Korea, October 2012
Micronutrient,film-coated tabs/PAC-1000
General Description:
Micronutrient tablets, film coated
Each tablet contains:
Retinol (vitamin A) 800 RE
Vitamin E 10 mg
Vitamin D 200 I.U.
Vitamin B1 1.4 mg
Vitamin B2 1.4 mg
Niacin 18 mg
Vitamin B6 1.9 mg
Vitamin B12 2.6 microgram
Folic Acid 400 microgram
Vitamin C 70 mg
Iron 30 mg (as iron fumarate or iron sulphate)
Zinc 15 mg (as zinc sulphate)
Copper 2 mg
Selenium 65 microgram
Iodine 150 microgram
Packed in a tamper-evident container of 1000 tablets.