demand & supply of mall space in bangalore october … & supply of mall space in delhi and...
TRANSCRIPT

Demand & Supply of Mall Space in Bangalore
Research Studies on MALLS IN INDIA
October 2010
RESEARCH STUDIES ON MALLS IN INDIA
May 2
011
Demand & Supply of
Mall Space in India
DELHI & NCR
0
Demand & Supply of Mall Space in Delhi and NCR May 2011
Research Studies on MALLS IN INDIA
1
CONTENTS
Background 2
International Comparisons 2
Malls in Delhi and NCR 4
TABLE 2: Existing Malls in Delhi and NCR 4
TABLE 3: Upcoming Malls in Delhi and NCR 6
TABLE 4: Malls on hold in Delhi and NCR 7
TABLE 5: Delhi and NCR Mall Space Demand & Supply - I 8
CHART 1: Delhi and NCR Mall Space Demand & Supply - I 9
TABLE 6: Delhi and NCR Mall Space Demand & Supply - II 10
CHART 2: Delhi and NCR Mall Space Demand & Supply - II 11
Map 12
Analysis by Micro Markets 13
Analysis by Footfalls 15
Demand and Supply Analysis 16
Methodology 19
About Asipac 20
Acknowledgments 20

Demand & Supply of Mall Space in Delhi and NCR May 2011
Research Studies on MALLS IN INDIA
BACKGROUND
Across the world, in any major (modern) city, retail shops/outlets are usually spread across
malls or shopping centres, high streets or main streets and neighbourhood strips. For the
modern retail industry, and especially malls, to do well, the macro economic theory of
demand and supply comes into play.
No one will question the fact that there is obviously limited demand for retail space anywhere
in the world and any oversupply positions, especially in large percentages, are not just
unhealthy for property owners, investors, occupants, consumers and other stakeholders, but
also for the industry and the overall economy at large.
Table 1 below shows the per capita total retail space and the per capita mall space in different
countries around the world.
Globally, there is broad consensus that the per capita mall space (PCMS) is in a huge
oversupply position in markets such as Dubai, USA, China and Singapore. On the other hand,
Japan, UK, Sweden, Netherlands, Australia and NZ are much better off with the PCMS ranging
between 3.8 sft and 6.8 sft.
2
Country Per Capita Total Retail Space (sft) Per Capita Mall Space (sft)
Dubai -- 25.3
USA 46.6 23.1
Singapore 15.7 7.2
Australia, New Zealand 24 to 31 5.5 to 6.8
Sweden, Netherlands -- 4.8 to 5.1
UK 16.7 to 18 3.9
Hong Kong, South Korea 14 to 16 --
Japan 12 to 13 3.8
South Africa -- 3.2
Spain, France, Italy -- 2.7
Russia, Turkey, Belgium -- 0.6 to 0.7
PER CAPITA TOTAL RETAIL SPACE AND PER CAPITA MALL SPACE Table 1

Demand & Supply of Mall Space in Delhi and NCR May 2011
Research Studies on MALLS IN INDIA
Needless to say, there has to be some correlation between the PCMS and the per-capita
income in any market. So while 3.8 or 3.9 sft may not be considered as oversupply in Japan or
UK, the PCMS of 3.2 sft in South Africa is definitely in an oversupply position.
Taking into account the above comparisons and considering India’s current per capita income
and spending power, together with estimated growth rates for the next 5 years, Asipac
estimates that the ideal PCMS in India’s top 20 urban centres is about 1.2 square feet per
person, but this can fluctuate from 1.0 sft and 1.5 sft in different micro markets, based on the
per-capita income of that particular micro market.
This report (the fifth in the series by Asipac) studies the demand and supply scenario, both
current as well as projected till the year 2014, for mall space in Delhi and the National Capital
Region (NCR) – Gurgaon, Faridabad, Ghaziabad, Noida and Greater Noida.
sft = square feet; 1 sqm or m2 = 10.764 sft
3

Demand & Supply of Mall Space in Delhi and NCR May 2011
Research Studies on MALLS IN INDIA
4
MALLS IN DELHI AND NCR
With an estimated current urban population of over 27 million people (as per the latest
Census 2011 provisional data) and based on an ideal mall space ratio of 1.2 sft per capita (as
explained in the BACKGROUND section of this report), Delhi and NCR can currently absorb
total mall space of 32.460 million square feet in GLA (Gross Lettable Area).
Of this, the 62 operational malls in the region have a total GLA of 19.703 million square feet
(including developments less than 150,000 sft grouped under ‘Other Miscellaneous’). See Table 2
below for existing malls in Delhi and NCR and the two following tables for upcoming malls and
malls currently on hold, respectively.
EXISTING MALLS IN DELHI & NCR (as of April 2011) Table 2
Please refer to Map on Page 12
Sl. Name of the Mall Location GLA in sft
1 Select City Walk Saket District Centre 600,000
2 Ambi Mall Vasant Kunj 560,000
3 Mahagun Metro Mall Vaishali 415,373
4 DLF Place Saket District Centre 400,000
5 Pacific Mall Subhash Nagar 350,000
6 MGF Metropolitan Mall Saket District Centre 335,000
7 V3S East Centre Laxmi Nagar 300,000
8 Westgate Mall Shivaji Place 265,000
9 DT City Centre Shalimar Bagh 260,000
10 D Mall Pitampura 250,000
11 Vasant Square Mall Vasant Kunj 250,000
12 D Mall Rohini 245,000
13 DLF Promenade Vasant Kunj 225,000
14 DLF Galleria Mayur Vihar Centre 210,000
15 Pearls Omaxe Pitampura 203,000
16 Metro Walk Rohini 200,000
17 Northgate Orbit Plaza Gujrawala Town 200,000
18 Rohini City Centre Rohini 200,000
19 Cross River Mall Shahdara 175,000
20 DLF Emporio Vasant Kunj 175,000
21 Shop-in park Shalimar Bagh 175,000
22 Ansal Plaza Andrews Ganj 170,000
23 City Square Mall Rajouri Garden 165,000
24 Star City Mall Mayur Place 163,500
25 Aditya Plaza Shahdara 156,000
26 D Mall Paschim Vihar 150,000
27 Westend Mall Janakpuri District Centre 150,000
Delhi

Demand & Supply of Mall Space in Delhi and NCR May 2011
Research Studies on MALLS IN INDIA
5
Please refer to Map on Page 12
EXISTING MALLS IN DELHI & NCR (as of April 2011)
Sl. Name of the Mall Location GLA in sft
28 Crown Interiorz Mathura Road 350,000
29 Ansal Crown Plaza Sector 15 300,000
30 Senior Mall Destination Point 175,000
31 Eldeco Station 1 Mall Mathura Road 150,000
32 Parsvnath Mall Manhattan Mathura Road 150,000
33 SRS Mall Sector 12 150,000
34 East Delhi Mall (EDM) Kaushambi 360,000
35 Shipra Mall Indirapuram 350,000
36 Pacific Mall Sahibabad Industrial Area 325,000
37 MMX Mall GT Road 250,000
38 AEZ Brand Factory Vaishali 210,000
39 Celebration Mall Nehru Vikas Minar 210,000
40 The Opulent Mall GT Road 200,000
41 East End Mall Kaushambi 175,000
42 Krishna Apra D Mall Indirapuram 175,000
43 Eros Market Place Indirapuram 171,500
44 Ansal Plaza Vaishali 150,000
45 Ambience Mall NH-8 1,030,000
46 South Point Mall Golf Course Road 300,000
47 DT Mega Mall DLF City 290,000
48 Raheja Mall Sohna Road 290,000
49 Ansal Plaza Palam Vihar 260,000
50 DLF City Centre MG Road 260,000
51 Sahara Mall MG Road 247,000
52 MGF Metropolitan MG Road 245,000
53 Star Mall NH-8 212,000
54 MGF Megacity Mall MG Road 200,000
55 Centrum Plaza Golf Course Road 186,000
56 Omaxe Celebration Mall Sohna Road 185,500
57 Senior Automall NH-8 183,400
58 Gold Souk Sohna Road 180,000
59 Orchid Agora MG Road 170,000
60 Great India Place Sector 38, Noida 900,000
61 Ansal Plaza Pari Chowk, Greater Noida 525,000
62 The Centrestage Mall Sector 18, Noida 256,000
63 2,983,736
TOTAL 19,703,009
Other MiscellaneousOther Miscellaneous
Noida and Greater Noida
Gurgaon
Ghaziabad
Faridabad
Demand & Supply of Mall Space in Delhi and NCR May 2011
Research Studies on MALLS IN INDIA
6
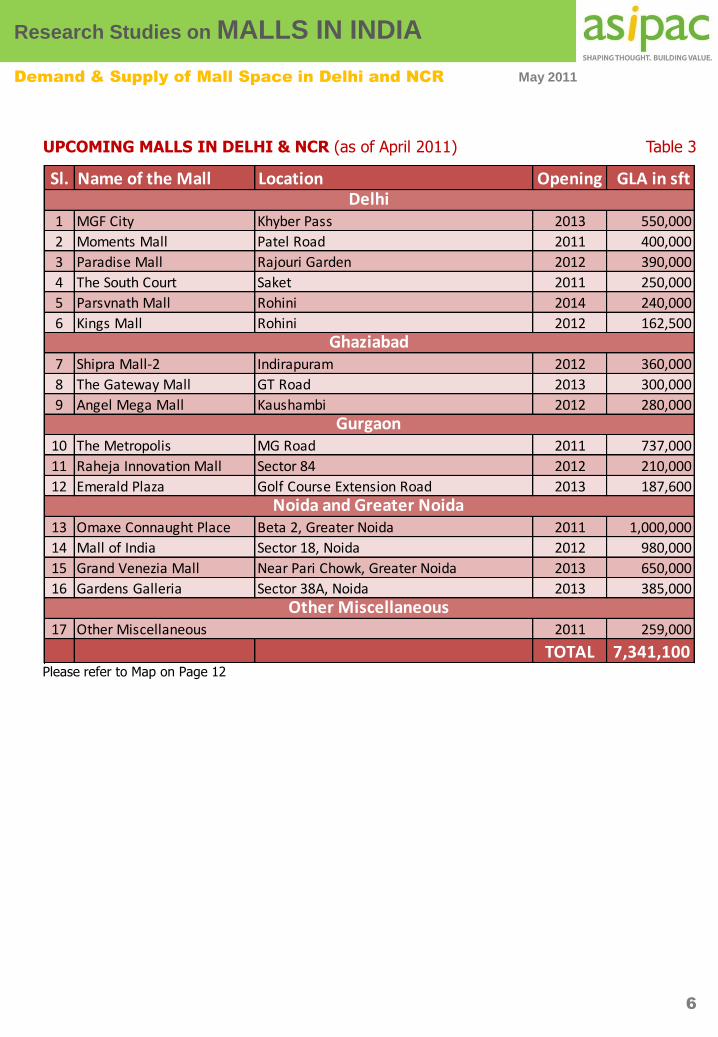
UPCOMING MALLS IN DELHI & NCR (as of April 2011) Table 3
Please refer to Map on Pg 7
Please refer to Map on Page 12
Sl. Name of the Mall Location Opening GLA in sft
1 MGF City Khyber Pass 2013 550,000
2 Moments Mall Patel Road 2011 400,000
3 Paradise Mall Rajouri Garden 2012 390,000
4 The South Court Saket 2011 250,000
5 Parsvnath Mall Rohini 2014 240,000
6 Kings Mall Rohini 2012 162,500
7 Shipra Mall-2 Indirapuram 2012 360,000
8 The Gateway Mall GT Road 2013 300,000
9 Angel Mega Mall Kaushambi 2012 280,000
10 The Metropolis MG Road 2011 737,000
11 Raheja Innovation Mall Sector 84 2012 210,000
12 Emerald Plaza Golf Course Extension Road 2013 187,600
13 Omaxe Connaught Place Beta 2, Greater Noida 2011 1,000,000
14 Mall of India Sector 18, Noida 2012 980,000
15 Grand Venezia Mall Near Pari Chowk, Greater Noida 2013 650,000
16 Gardens Galleria Sector 38A, Noida 2013 385,000
17 2011 259,000
TOTAL 7,341,100
Other MiscellaneousOther Miscellaneous
Delhi
Noida and Greater Noida
Ghaziabad
Gurgaon

Demand & Supply of Mall Space in Delhi and NCR May 2011
Research Studies on MALLS IN INDIA
7
Please refer to Map on Pg 7
Please refer to Map on Page 12
MALLS ON HOLD IN DELHI & NCR (as of April 2011) Table 4
The malls tabulated above are either on hold or under reconsideration by the promoters. The
total retail space on hold is more than 1.04 million sft.
Note: Some of the information for malls on hold was not provided by the promoter’s representatives
(information regarding size and date of opening), hence the figures used to arrive at 1.04 million sft
have been taken from third parties.
Sl. Name of the Mall Location1 Parsvnath Metro Mall, Akshardham Near Akshardham Metro Station, Delhi
2 Parsvnath Metro Mall, Welcome Near Welcome Metro Station, Delhi
3 Parsvnath Metro Mall, Seelampur Near Seelampur Metro Station, Delhi
4 Parsvnath Metro Mall, Azadpur Near Azadpur Metro Station, Delhi
5 Parsvnath Metro Mall, Netaji Subhash Place Near Netaji Subhash Place Metro Station, Delhi

Demand & Supply of Mall Space in Delhi and NCR May 2011
Research Studies on MALLS IN INDIA
DELHI & NCR MALL SPACE DEMAND & SUPPLY - I (2011 to 2014)
8
Note: Figures are in Million Square Feet except %
As of now, as per available information, there are 16 upcoming malls in Delhi and NCR
region (refer to Table 3) planned till 2014, totaling a GLA of 7.341 million square feet
(including developments less than 150,000 sft under the heading ‘Other Miscellaneous’). In
addition, there are 5 malls on hold, with approximate retail space of 1.04 million sft. There
may be a few more projects on the planning sheets or drawing boards of developers which
are not yet public information. We shall now analyse the following two scenarios.
A) When only 16 confirmed malls come up by the end of 2014
B) When (or if), along with these 16 confirmed malls, the 5 malls on hold come up by the
year 2014
Scenario A
If all the 16 projects (listed in Table 3) were to come up, Delhi and NCR will have 78 malls
with total GLA of 27.044 million square feet by 2014, leading to an undersupply of 4%.
Table 5 below shows the total serviceable demand (based on population) and the total
Stock (scheduled supply plus the total GLA of existing operational malls) for the next four
years. Since all the existing and planned/upcoming malls put together only cover about
80% of the city’s geographical expanse, it is important to consider the Adjusted Demand
rather than the Total Demand.
YEAR 2011 2012 2013 2014
(Figures below in Millions of Square Feet except %)
Total Demand in Delhi 32.460 33.310 34.183 35.079
Adjusted Demand in 80% Area 25.968 26.648 27.347 28.063
New Supply during the year
(Confirmed)2.646 2.383 2.073 0.240
Total Stock at year end
(Confirmed)22.349 24.732 26.804 27.044
Shortfall (or Oversupply) 3.619 1.917 0.542 1.019
Shortfall % 14% 7% 2% 4%
Oversupply % NA NA NA NA
Table 5

Demand & Supply of Mall Space in Delhi and NCR May 2011
Research Studies on MALLS IN INDIA
9
DELHI & NCR MALL SPACE DEMAND & SUPPLY - I (2011 to 2014) Chart 1
As is evident from Table 5 on the previous page, there is an estimated shortage of mall
space of 3.619 million square feet in Delhi and NCR by the end of 2011, resulting in an
undersupply of 14%.
However, in the year 2012, this undersupply of 14% decreases to 7% due to a further supply
of 2.383 million sft, bringing the total Stock at the end of the year 2012 to 24.732 million
sft. In 2013, Delhi and NCR is expected to experience a much better situation, with a
shortfall of just 2%. This situation may not change much since most of these malls are
already under construction; even if new malls are announced, they would easily take 3 to
4 years to commence operations.
The data presented in Table 5 is shown graphically in Chart 1 below for those who are more
inclined to analyse graphically represented data.
0.0
5.0
10.0
15.0
20.0
25.0
30.0
2011 2012 2013 2014
Demand Supply

Demand & Supply of Mall Space in Delhi and NCR May 2011
Research Studies on MALLS IN INDIA
10
Sft, millions
DELHI & NCR MALL SPACE DEMAND & SUPPLY - II (2011 to 2014) Table 6
Scenario B
If, along with the 16 upcoming malls, all of the 5 malls on hold come up by 2014 (we have
assumed 0.52 million sft of supply in 2013 and 0.52 million sft in 2014), Delhi and NCR will
have 83 malls with total approximate GLA of 28.084 million sft by 2014. The expected
demand will be met as early as 2013, and the increase in demand over the next year will be
matched by the scheduled supply, thereby continuing the demand-supply equilibrium in 2014.
Table 6 below shows the total serviceable demand (based on population) and the total Stock
(scheduled supply plus the total GLA of existing operational malls) for the next four years.
Since all the existing and planned/upcoming malls put together only cover about 80% of the
city’s geographical expanse, it is important to consider the Adjusted Demand rather than the
Total Demand.
It is quite evident from the above Table that the demand-supply situation will ease off if the
malls on hold are also kicked off and subsequently completed. The undersupply of 14% in
2011 will decrease to 7% in 2012 and will be negligible in 2013 and 2014.
Note: Figures are in Million Square Feet except %
YEAR 2011 2012 2013 2014
(Figures below in Millions of Square Feet except %)
Total Demand in Delhi 32.460 33.310 34.183 35.079
Adjusted Demand in 80% Area 25.968 26.648 27.347 28.063
New Supply during the year
(Confirmed)2.646 2.383 2.073 0.240
New Supply from projects on hold 0.000 0.000 0.520 0.520
Total Stock at year end
(Confirmed)22.349 24.732 27.324 28.084
Shortfall (or Oversupply) 3.619 1.917 0.022 (0.021)
Shortfall % 14% 7% 0% 0%
Oversupply % NA NA 0% 0%

Demand & Supply of Mall Space in Delhi and NCR May 2011
Research Studies on MALLS IN INDIA
11
DELHI & NCR MALL SPACE DEMAND & SUPPLY - II (2011 to 2014) Chart 2
The data presented in Table 6 is shown graphically in Chart 2 below for those who are more
inclined to analyze graphically represented data.
This means that if all the mall projects in the offing were to come up, the demand and supply
situation in Delhi and NCR will be in an equilibrium in 2013 and 2014. However, it remains to
be seen whether this equilibrium is maintained thereafter.
This report will be helpful to developers to decide on the size and location of new malls which
are still on the planning sheets or drawing board.
0.0
5.0
10.0
15.0
20.0
25.0
30.0
2011 2012 2013 2014
Demand Supply

45
60
1
2
61
3
4
34
28
5 35
6
36
29
46
7
47
48
8
49
50
9
62
10
37
11
51
22
1
12
59
13
20
53
38
39
14
16
15
54
18
40
55
56
57
58
19
20
4142
30
21
43
52
23
24
25 44
26
31
32 33
27
17
13
14
10
15
2
16
8
379
1
4
5
11 12
6
23
4
5
Existing Malls
Upcoming Malls
Malls on Hold12
Ex
istin
g a
nd
U
pc
om
in
g M
alls in
D
elh
i a
nd
N
CR
Ma
y 2
01
1
Re
se
arc
h S
tud
ies
on
MA
LL
S IN
IN
DIA

Demand & Supply of Mall Space in Delhi and NCR May 2011
Research Studies on MALLS IN INDIA
13
ANALYSIS BY MICRO MARKETS
From Table 6, it is evident that while some micro markets (geographical areas) are either
already facing a drastic oversupply situation or are headed for one, some others still have
potential for new malls to come up. The Map on Page 12 shows a much clearer picture.
For the purpose of this analysis, and as explained in the ‘Background’ section of this Report,
we have divided the whole Delhi and NCR region into six micro markets or broad catchment
areas based on their location.
The worst mismatch between demand and supply seems to be in Gurgaon. Not only is there
an existing gross oversupply situation, when the three planned malls begin operations, they
will take the total supply of mall space in Gurgaon by the year 2014 to 6.71 million sft (which
includes malls less than 150,000 sft) as against an estimated demand of only about 1.78
million sft. In other words, the current demand is for less than one-fourth of the existing
malls, and the situation is not expected to improve much even by 2014.
A similar case is evident in Noida and Greater Noida. Although only five malls are planned
here, these total up to a GLA of 3.01 million sft. The total supply for Noida and Greater Noida
by the end of the year 2014 will be 2.93 million sft and 2.18 million sft respectively, and when
viewed against the estimated demand of 1.18 million sft and 0.83 million sft respectively, it is
a sign of huge oversupply. The following tables show the demand-supply scenario for Noida
and Greater Noida.
GURGAON MALL SPACE DEMAND & SUPPLY Table 7
Note: Figures are in Million Square Feet
NOIDA MALL SPACE DEMAND & SUPPLY Table 8
GREATER NOIDA MALL SPACE DEMAND & SUPPLY Table 9
Note: Figures are in Million Square Feet
Note: Figures are in Million Square Feet
YEAR 2011 2012 2013 2014
Estimated Demand 1.51 1.60 1.69 1.78
Total Stock (including fresh Supply) 6.32 6.53 6.71 6.71
YEAR 2011 2012 2013 2014
Estimated Demand 1.04 1.08 1.13 1.18
Total Stock (including fresh Supply) 1.56 2.54 2.93 2.93
YEAR 2011 2012 2013 2014
Estimated Demand 0.73 0.76 0.79 0.83
Total Stock (including fresh Supply) 1.53 1.53 2.18 2.18

Demand & Supply of Mall Space in Delhi and NCR May 2011
Research Studies on MALLS IN INDIA
14
On the other hand, the cities of Delhi, Faridabad and Ghaziabad are showing signs of
undersupply - quite drastically in the case of Delhi.
By 2014, the total estimated demand for mall space in Delhi will be close to 18 million sft,
whereas the supply will be less than 10 million sft, just over half of what is required.
Similar is the case for Faridabad and Ghaziabad, where although the estimated demand is
high, the scheduled supply is much lesser. All these three regions (Delhi, Faridabad and
Ghaziabad) contribute heavily to the situation of overall undersupply in the Delhi and NCR
region and must be looked into by developers. The following tables represent the demand-
supply scenario for Faridabad and Ghaziabad, respectively.
While there is a clear case of oversupply in many micro markets, the city of Delhi is still
expected to remain grossly underserviced. One must note that as more malls come up in the
various micro-markets, consumers will simply stay closer home and tend not to visit the city
centre if their needs are met within the micro-market itself.
DELHI MALL SPACE DEMAND & SUPPLY Table 10
Note: Figures are in Million Square Feet
FARIDABAD MALL SPACE DEMAND & SUPPLY Table 11
Note: Figures are in Million Square Feet
GHAZIABAD MALL SPACE DEMAND & SUPPLY Table 12
Note: Figures are in Million Square Feet
YEAR 2011 2012 2013 2014
Estimated Demand 2.62 2.69 2.77 2.85
Total Stock (including fresh Supply) 1.50 1.50 1.50 1.50
YEAR 2011 2012 2013 2014
Estimated Demand 16.70 17.02 17.35 17.68
Total Stock (including fresh Supply) 8.36 8.91 9.46 9.70
YEAR 2011 2012 2013 2014
Estimated Demand 4.45 4.60 4.76 4.93
Total Stock (including fresh Supply) 3.09 3.73 4.03 4.03

Demand & Supply of Mall Space in Delhi and NCR May 2011
Research Studies on MALLS IN INDIA
15
ANALYSIS BY FOOTFALLS
The total GLA of the 62 existing malls is 19.703 million sft. By end of the year 2014, the 16
planned malls are expected to add another 7.341 million sft of GLA. Hence, by the end of
2014, there will be total mall GLA of 27.044 million sft. A few other projects may be
announced in the coming months, which will further push the total GLA upwards.
The average Footfalls Per Square Foot Per Month (FPSPM) for the three largest malls in Delhi
and NCR listed above comes to 2.29.
By the year 2014, the GLA of confirmed malls is expected to exceed 27.044 million sft. At an
average of 2.29 footfalls/SFT/month (as calculated above), the desired footfalls for sustainable
operations of malls in the region would be around 61.931 million. Assuming the annual
growth rate of Delhi and NCR’s population to be the same as what it was from 2001 – 2011
(2.62%), the population of Delhi and NCR will be 29.233 million in 2014. If 54% (assumed to
be the proportion of the population of SEC A and B) visit malls at least twice a month, the
total footfalls per month in 2014 may barely cross 31.571 million, creating a footfall shortage
of 49%. This shows that even in a retail market like Delhi and NCR, where there appears to be
an undersupply of malls, making efforts to increase footfalls is critical, thereby highlighting
the importance of effective marketing and mall management.
So, here’s the big question, “What will be the strategies adopted by mall developers and
retailers to make all of these malls successful?"
ANALYSIS BY FOOTFALLS Table 13
15
Weekend
and Holiday
(WHF)
Weekday
(WDF) Monthly
Per sft
per
month
Avg per
sft per
month
1Ambience
Mall
NH-8,
Gurgaon85,000 50,000 1,856,250 1,030,000 1.80
2Great India
Place
Sector 38,
Noida125,000 75,000 2,760,417 900,000 3.07
3Select City
Walk
Saket District
Centre, Delhi 70,000 25,000 1,191,667 600,000 1.99
2.29
Footfalls
Sl. Name of
the Mall Location
Footfalls
GLA

Demand & Supply of Mall Space in Delhi and NCR May 2011
Research Studies on MALLS IN INDIA
As has been known by many, the city of Delhi is a shopaholic’s utopia, and the numerous
shopping malls that have mushroomed in the region over the past few years are proof of that.
Wherever one goes, one is highly likely to come across a glittering mall. The emergence of
‘The Great Indian Middle Class’ has brought in a kind of retail revolution across India, and
Delhi, by its very nature, has not missed out on it.
It is a fact that the population of Delhi and NCR region has been increasing in leaps and
bounds. Currently at 27 million, Delhi and NCR’s combined population is expected to touch 30
million in the next three years.
As population increases, so does demand for retail spaces. Delhi has no dearth of shopping
options - it has some very famous bazaars and open markets like Connaught Place, Karol
Bagh, Chandni Chowk, Sarojini Nagar, Lajpat Nagar etc., all famous for the variety and quality
of merchandise they offer. However, if we focus on the average per-capita income in the
region, it emerges as one of the highest in India, thereby suggesting that there is still a lot of
untapped demand for organized shopping spaces like shopping malls.
To cater to the existing and expected future demand, many new malls are coming up in the
Delhi and NCR region, and it is possible that many more could be at the planning stage. In
spite of this scheduled supply of malls, the demand-supply ratio of malls in Delhi and NCR
appears to be healthy, at least till 2014.
Data for upcoming (or planned) malls beyond 2014 has not been considered for the purpose
of this study. However, the pace at which new malls have been announced in last few years,
one cannot rule out the possibility of oversupply, just like in the case of other metropolitan
city-regions like Bangalore, Mumbai and Hyderabad.
It is always an advantage to open a mall in a city which has an undersupply of mall space.
However, projected demand is not the only factor responsible for a mall’s success - bad
functional design and/or tenancy mix can result in the failure of a mall in any market, despite
unmet demand. Sigma Mall and Lido Mall in Bangalore, and Crossroads and Atria Mall in
Mumbai, amongst other malls across the country, are good examples of malls having failed
even during the years when there was undersupply in those cities.
It has to be seen if there are any significant differences between the 16 new malls under
development in Delhi and NCR. Four of the 16 new malls are too small (less than 250,000
square feet) to make any significant impact. Of the others, five have a GLA of greater than
500,000 sft - three of them are coming up in Noida and Greater Noida , one in Gurgaon and
one in Delhi.
16
DEMAND & SUPPLY ANALYSIS

Demand & Supply of Mall Space in Delhi and NCR May 2011
Research Studies on MALLS IN INDIA
Delhi has the maximum number of upcoming malls (six), followed by four in Noida and
Greater Noida and three each in Ghaziabad and Gurgaon. Faridabad, with its six existing
malls, has no malls currently under development, although there might be some on the
drawing board for which information is not currently available.
As Gurgaon continues to develop beyond Golf Course Road, this growth is reflected in new
malls being planned in that region. With the MG Road/NH-8 area already inundated with
malls, only one new mall is planned there.
Indirapuram, in Ghaziabad, appears to be in the thick of action, with as many as nine
functioning malls and two more scheduled to open up by the year 2013.
Greater Noida, on the other hand, is slowly emerging as a growth centre with two upcoming
malls to add to its solitary mall – Ansal Plaza. There might be other malls in Greater Noida
which might be lesser than 150,000 sft in GLA and, hence, have not been considered for this
study.
While Delhi is in the midst of a gross shortfall of mall space, Gurgaon, Noida and Greater
Noida are already experiencing an oversupply scenario. The situation is worst in Gurgaon,
where the total Stock of mall space is approximately four times the estimated demand, and
is expected to continue to be so till the year 2014 and even beyond that. Noida is presently
facing an oversupply of 50%, and the corresponding figure will be almost 150% in 2014.
Greater Noida, already at supply levels that are double that of the projected demand, will
end up at oversupply of 163% in 2014.
Ghaziabad and Faridabad, in contrast, are underserved with shortfalls of 31% and 43%
respectively, and are expected to face an undersupply of mall space even in 2014.
The situation in Delhi is not very different from what is evident in Asipac’s reports on the
demand and supply scenario of mall spaces in Hyderabad, Bangalore, Chennai and Pune.
While some micro markets in Hyderabad are headed for a drastic oversupply, some others
appear to be safe for now. Overall, from a shortfall of 66% in the year 2011, Hyderabad is
headed for an oversupply that could go as high as 53% in 2014 if all projects currently on
hold were to come up. Yet, there are areas like Begumpet and Ameerpet which neither have
an existing mall, nor do they have any malls scheduled to come up in the next 2-3 years.
Similarly in Bangalore, although the Central Business District is expected to remain
underserved, most suburban and peripheral micro locations in the city seem to be destined
for a situation of oversupply - a situation that will become only worse with each passing year
and might reach an oversupply of 60% by 2014.
17
Demand & Supply of Mall Space in Delhi and NCR May 2011
Research Studies on MALLS IN INDIA
Chennai, on the other hand, is currently experiencing a shortfall of 34% in the supply of mall
space, and a demand-supply balance is expected to kick in only by 2013 or 2014. Similarly,
Pune, with a shortfall of 23%, would reach a demand-supply equilibrium by 2014, but only if
all projects currently on hold were to be revived and completed by then. Assuming these
projects do not take off, Pune is expected to end up with a shortfall as high as 35% by the year
2014.
Needless to say, if upcoming malls lack the wow factor and do not differentiate from others,
they will fall short of required attention and eventually die.
Malls require considerable investment of time and money. They have to be run for one or two
years before their viability to survive in the long run is confirmed. If they are found to be
unviable, it takes a few years and a lot of debate to take them out of operation and/or use the
structures for other limited commercial purposes.
Malls decide the fate of their tenants’ business and profitability. Small businesses are more
impacted since many are experimenting in a mall for the first time. If they don’t do well, this
could drive them completely out of business. Sadly, mall developers/owners and most
property consultants don’t realise this truth. It is even more disheartening to see some
experienced developers repeating a cookie-cutter plan/design in one mall after the other.
So especially in a market like Delhi and NCR, where there is no shortage of quality shopping
and no distance is far with the successful Delhi Metro running like a lifeline, shopping mall
developers need to think something different and fast. There is still untapped opportunity in
Delhi and NCR, and if planned properly and in the right direction, it will be fruitful to all stake
holders.
18

Demand & Supply of Mall Space in Delhi and NCR May 2011
Research Studies on MALLS IN INDIA
19
METHODOLOGY
The data for this survey/study was collected by Asipac consultants through direct contact with
executives working with most of the developers whose projects have been listed as well as
through the developers’ current websites in April 2011.
Further information was obtained from the various retailers who have either been contacted
to take up retail spaces in one or more of the project listed or were just aware of the
project/s.
Retail real estate projects below a GLA of 150,000 square feet have been grouped under
‘Other Miscellaneous’.
Mall space has been considered not just in terms of fresh supply every year, but also total
Stock , which is the sum total of mall space in the city at the end of each year.
Some of the projects listed in the Upcoming Malls Table may be temporarily on hold, but
developers are looking for the first possible opportunity to get them off the ground. Many
others have been re-sized (mostly downsized). There are several others (on the planning
tables or drawing boards) currently on hold which do not find a place on the Table.
In any study of this nature, there are bound to be errors and omissions. While Asipac believes
that the information presented herein is reasonably correct, Asipac does not make any
warranty to that effect. For example, Asipac believes that there are bound to be upcoming
malls in Faridabad, but no information to that effect could be obtained, either from
developers or through secondary research.
If anyone reading this report comes across any such errors or omissions, we will be happy to
receive your comments on [email protected] and will incorporate necessary corrections after
verifying its/their accuracy.

Demand & Supply of Mall Space in Delhi and NCR May 2011
Research Studies on MALLS IN INDIA
20
ABOUT ASIPAC
Established in 1996, Asipac Group comprises India’s largest Mall Planning & Leasing Consultants (byvolume of work), multiple award winning real estate marketing strategy consultant, a highlyrespected retail research & consulting firm and India’s fastest growing mall management company.
Our services include:• Project Conception• Comprehensive Mall Planning• Design Process Management• Letting and Lease Management• Retail Research and Consulting• Mall Marketing Consultancy• Mall Management• Rental Yield Maximization• Conception of New Retail Formats• Marketing Strategy, Ideas and Programs for Real Estate Projects
In 14 years, we have provided high level strategic advice to RE developers on projects with acombined built-up area of 380 million square feet valued at more than US$24 billion.
In retail real estate, we have advised developers on retail / shopping centre projects of over 16.42million square feet, including seven of the 15 largest shopping centres in India. We have leasedmore than 8.45 million square feet of retail real estate across India in just five years. We haveleasing mandates for seven malls in five cities, with GLA of 6.14 million square feet. We also haveMall Management mandates of 5.1 million square feet.
Asipac undertakes strategic research on the retail as well as the retail real estate sectors. Our studyof trading densities of modern retail formats was featured twice in The Economic Times and wascover story of Images Retail’s February 2010 issue. Our study on India’s largest malls featured in TheEconomic Times, The Times of India (twice), The New Indian Express, Business Today and ShoppingCentre News. Our study of Revenue Share Rent was published in Shopping Centre News. Our studieson Demand and Supply of mall spaces in Bangalore, Chennai, Hyderabad and Pune were all publishedin Shopping Centre News.
Asipac was voted at GIREM as Best Marketing Firm 2008 competing against 3 IPCs and has won3 Remmy Awards from The Times of India. One of our projects broke a Guinness World Record andwas a finalist in Mixed Use Project category of Cityscape Asia 2008 RE Awards. A project launch wona Bronze at 2009 EEMAX Awards. An unpublished campaign won GOLD at the Big Bang Awards ofAd Club, Bangalore.
With 225+ media articles and 40+ TV features, including 20+ front page/cover stories, ourcredentials are well known in Indian real estate.
ACKNOWLEDGMENTS
We wish to acknowledge the contributions of all retailers, mall owners, mall managers and leasingprofessionals with other firms who have cooperated in sharing data with us.

Copyright 2011, ASIPAC
The material contained in this document is CONFIDENTIAL and belongs to Asipac Mall Services Pvt. Ltd.,
Bangalore (“Asipac”). Any photocopying or duplicating in any other manner or use of this material by any
third person or party, in full or in part, without the explicit written permission of Asipac is strictly
prohibited, and will be illegal and liable for legal action.
Asipac Disclaimer
Asipac has exercised reasonable care in developing the information incorporated into this document. While Asipac believes that the
information presented herein is reasonably correct, Asipac does not make any warranty to that effect. Asipac disclaims all other
warranties, either express or implied, including, without limitation, the implied warranty of merchantability and fitness. The
appropriate use of the information contained in this document requires professional business judgment and may require sourcing of
additional detailed information and proper due diligence. This document is not intended as a substitute for professional judgment by
the reader or anyone acting on their behalf.
Asipac Mall Services Pvt. Ltd.
Research and Consulting Division
7/1, 1st Floor, Ulsoor Road
Bangalore-560 042
T: +91 80 4015 0000
F: +91 80 4015 0099
www.asipac.com
21