delta electricity sustainability report
DESCRIPTION
2011 Sustainability ReportTRANSCRIPT

SUSTAINABILITY REPORT 2010-11
ENERGY FOR LIFE
SUSTAINING

This report is printed on Tudor RP 100%, the ideal choice for those wanting to make a positive contribution to the Australian environment. Tudor RP is also Certified Carbon Neutral by the Department of Climate Change & Energy Efficiency’s National Carbon Offset Standard (NCOS), an Australian Government Initiative.
Cover: Kerrie Davis, Greenhouse Data and Energy Officer

Contents
03 Table 1: Generating capacity of our power stations
03 Figure 1: Locations of our power stations
06 Table 2: Sustainability scorecard (2011–2012 Strategic Plan)
09 Figure 2: Top material issues identified by stakeholders
19 Table 3: Total greenhouse gas emissions
19 Figure 3: Total greenhouse gas emissions
22 Figure 4: Total water usage
22 Table 4: Water sources
23 Table 5: Total water discharge by quality and destination
23 Table 6: Thermal discharges. Hours/years at specific tempeatures above background
24 Figure 5: Central Coast Maximum PM10 concentrations
24 Table 7: Central Coast Maximum one - hour average SO2 concentrations
24 Table 8: Central Coast Maximum one - hour average NO2 concentrations
25 Table 9: Central Coast Annual average TSP concentrations
25 Table 10: Central Coast Maximum PM10 concentrations
25 Table 11: Central Coast - Maximum PM2.5 concentrations
25 Figure 6: Location of power stations and air quality monitors in the Western region
26 Table 12: Western region Maximum one-hour average SO2 concentrations
26 Table 13: Western region Maximum one - hour average NO2 concentrations
26 Table 14: Western region Maximum PM10 concentrations
26 Table 15: Western region Maximum PM2.5 concentrations
27 Table 16: Significant stack emissions
29 Table 17: Materials converted to energy
29 Table 18: Recycled materials used in energy production
29 Table 19: Energy consumption
29 Table 20: Total weight of waste
29 Table 21: Waste disposal methods
30 Figure 7: Fines
31 Figure 8: Environmental complaints and inquiries 2001-2011
43 Figure 9: Total staff numbers
44 Table 22: Trends in the representation of EEO Groups1% of total staff
44 Figure 10: New employees in 2010-11
47 Table 23: Lost time injuries (employees)
47 Figure 11: Lost time injuries (contractors)
48 Figure 12: Training hours per employee
48 Table 24: Training hours by employee category
49 Figure 13: Apprentices
55 Figure 14: Production 2010-11 (as generated)
56 Table 25: Generation efficiency
56 Table 26: Average plant reliability
56 Table 27: Average plant availability
57 Table 28: Financial performance
58 Figure 15: Customer satisfaction
59 Figure 16: Average NSW Spot Price
43 Employment at Delta
46 Workplace safety
48 Training & Development
51 Case studies
Workplace
53 Gentrader process
54 Performance
56 Portfolio efficiency
57 Financial performance
58 Product performance
60 Case study
Customers
02 Chief Executive’s introduction
03 About Delta Electricity
05 Sustainability
19 Climate change
22 Water use
24 Air emissions
28 Biodiversity and land management
29 Resource inputs and waste
30 Biodiversity and land management
31 Case studies
Environment
Introduction
62 Appendix 1 Compliance with GRI principles
64 Appendix 2 Index of standard disclosures
80 Appendix 3 2010 - 11 Sustainability Goals
81 Appendix 4 Reporting materiality
82 Glossary of acronyms
Appendices
Tables & Figures
Community33 Our local communities
34 Identifying community’s concerns
35 Engagement with local community
36 Our other major stakeholders
41 Case studies

Delta Electricity, as Australia’s largest capacity electricity generator, significantly contributes to maintaining and improving our standard of living. This year, we have introduced several important initiatives to improve our sustainability performance. The new format of this year’s sustainability report reflects a more strategic focus on sustainability by following and reporting on our Sustainability Scorecard.
In 2010-11 electricity generation has been at the centre of Australian political discourse with carbon pricing dominating Federal parliamentary debate and the energy reform process being a key issue in the lead-up to the NSW State election in March 2011. These have had major impacts on our operating environment and on our organisational structure and management. In December 2010 the NSW Government contracted the output from the western region power stations, Mt Piper and Wallerawang, to TRUenergy under the Delta West Gentrader contract. This has created a new structure for Delta. Western operations generate in accordance with the requirements of TRUenergy, while the Central Coast operations continue to be dispatched directly into the National Electricity Market by Delta.
Delta has delivered electricity efficiently and economically during a period of significant change. It is a credit to our staff, management and Board that, despite the uncertainties of the industry and carbon pricing reforms, we have achieved high levels of customer satisfaction and maintained strong stakeholder relations.
We continue to pursue a range of projects to reduce our production of greenhouse gases. We completed a pilot scale carbon capture trial in 2010 and are now progressing with the first stage of a large-scale carbon capture and storage demonstration plant funded by the Federal Government, the NSW Government, and the Australian Coal Association. Delta supports constructive steps to reduce greenhouse gas emissions and, as a key industry participant, we have contributed to the recent political discourse on carbon pricing.
We have undertaken more extensive stakeholder analyses to identify and to respond to our stakeholders concerns. A community survey was undertaken and used to develop the 2011-2013 Community and Stakeholder Engagement Plan.
We have improved staff focus on sustainability by developing the Step Ahead program which is part of Delta’s involvement in the NSW Office of Environment and Heritage’s Sustainability Advantage program. Delta was awarded Bronze level recognition in June 2011 under the program. Step Ahead helps us to recognise individual and team achievements that support our sustainability goals. We have also employed an Internal Communications Manager to improve staff engagement in sustainability.
In the next few years we are expecting unprecedented competition for fuel supplies, the implementation of a carbon-pricing regime, and a market dominated by vertically integrated electricity companies. Market prices are expected to rise in parallel with the proposed carbon price, although not sufficiently for Delta to cover all its carbon related costs.
Nevertheless, we are committed to continue working towards achieving our long-term sustainability objective, which is to balance social and economic benefits of electricity generation with the environmental impacts in a way that is acceptable to our major stakeholders.
Greg Everett Chief Executive
Chief Executive’s introduction
Delta Electricity Sustainability Report 2010-11

3
Who we areDelta Electricity is a statutory, state-owned, electricity generation corporation operating in New South Wales under the Energy Services Corporations Act 1995 and the State Owned Corporations Act 1989.
Delta has five large power stations: Mt Piper and Wallerawang near Lithgow; and Vales Point, Munmorah and Colongra on the Central Coast. These stations have a combined generating capacity of almost 5,000 MW, making Delta the largest capacity electricity generator in Australia.
We also have three hydro-electric plants: Mt Piper with a capacity of 0.350 MW, and at Dungog and Chichester each with a capacity of 0.110 MW.
About Delta Electricity
Figure 1: Locations of our power stations
Gas
Coal
Hydro
Hydro planned
SYDNEYWallerawang
Dungog
Mt PiperMunmorah
NEWCASTLE
LITHGOW
Colongra
Chichester
Vales Point
Gas
Coal
Hydro
SYDNEYWallerawang
Dungog
Mt PiperMunmorah
NEWCASTLE
LITHGOW
Colongra
Chichester
Vales Point
Gas
Coal
Hydro
SYDNEYWallerawang
Dungog
Mt PiperMunmorah
NEWCASTLE
LITHGOW
Colongra
Chichester
Vales Point
Gas
Coal
Hydro
SYDNEYWallerawang
Dungog
Mt PiperMunmorah
NEWCASTLE
LITHGOW
Colongra
Chichester
Vales Point
Gas
Coal
Hydro
Table 1: Generating capacity of our power stations
Type Unit size Total units Capacity
Coal
Mt Piper 700 MW 2 1,400 MW
Vales Point 660 MW 2 1,320 MW
Wallerawang 500 MW 2 1,000 MW
Munmorah 300 MW 2 600 MW
Gas
Colongra 167 MW 4 667 MW
Hydro
Mt Piper 350 kW 1 350 kW
Chichester Dam 110 kW 1 110 kW
Dungog Water Treatment Plant
110 kW 1 110 kW
Total 4,987.57 MW
Our generators produce 12% of the electricity needed by consumers in the National Electricity Market (NEM), comprising all states and territories except Western Australia and the Northern Territory. The NEM operates one of the world’s longest interconnected power systems with an end-to-end distance of more than 4000 kilometres. Over $11 billion of electricity is traded annually in the NEM to meet the demand of almost eight million end-use consumers.
The output from Delta’s western power stations is traded in the NEM by TRUenergy under the terms of a Gentrader contract. Delta directly participates in the NEM from its operations on the Central Coast.
Delta continues to be a regional employer of choice in both the Western and Central Coast regions. The total number of Delta employees at the end of the reporting period was 688, with 332 on the Central Coast, 289 in the Western Region and 67 in the Sydney Head Office.
SYDNEYWallerawang
Dungog
Mt PiperMunmorah
NEWCASTLE
LITHGOW
Colongra
Chichester
Vales Point
Gas
Coal
Hydro

Introduction AppendicesWorkplaceCustomersCommunityEnvironment
Our vision and missionVisionGenerating performance through innovation.
MissionTo generate electricity safely, reliably, competitively while respecting our workmates, our customers, our community and the environment.
Principle functionsDelta Electricity’s principal functions are to establish, maintain and operate facilities for the generation of electricity and other forms of energy; and to supply electricity and other forms of energy.
12% of the electricity needed by consumers in the National Electricity Market is produced by our generators.
12%
ObjectivesGuiding Delta in carrying out these functions re the following objectives:
1. to be a successful business and, to this end to:
- operate at least as efficiently as any other comparable businesses;
- to maximise the net worth of the state’s investment in Delta; and
- to exhibit a sense of social responsibility by having regard to the interests of the community in which it operates;
2. to protect the environment by conducting its operations in compliance with the principles of ecologically sustainable development contained in section 6 (2) of the Protection of the Environment Administration Act 1991;
3. to exhibit a sense of responsibility towards regional development and decentralisation in the way in which it operates;
4. to operate efficient, safe and reliable facilities for the generation of electricity;
5. to be an efficient and responsible supplier of electricity; and
6. to be a successful participant in the wholesale market for electricity.
About Delta Electricity Continued

5Delta Electricity Sustainability Report 2010-11
Meeting our sustainability objectiveThis year we developed a sustainability scorecard to further embed sustainability into our corporate strategy. The scorecard defines the key sustainability metrics and targets to measure our performance and to report progress. It aligns our sustainability programs with the requirements of our operating licences and annual business plans. It also provides a mechanism to engage employees and the community with our sustainability goals and performance, and to increase accountability and trust.
Delivering our sustainability strategyDelta uses a set of well-defined and established principles to guide strategic decision-making. These include principles that maximise the state’s investment, are socially responsible and enable ecologically sustainable development.
Delta won a Bronze level recognition in the Office of Environment and Heritage (OEH) Sustainability Advantage Program. We have adopted several modules to help integrate sustainability principles into our business including the staff engagement module which promotes and encourages a sustainability culture by recognising behaviours and achievements that align with our sustainability values.
Sustainability
This year we have also commenced establishing a sustainability governance framework to identify accountabilities for each metric at each level of the organisation—corporate, regional and site. The framework embeds sustainability within the existing governance processes, organisational structures and culture practices. This is the framework on which we will be basing our sustainability reporting.
Delta Electricity operates under the Energy Services Corporations Act (1995) and the State Owned Corporations Act (1989). As a Government Trading Enterprise, Delta prepares a Statement of Corporate Intent each year.
In addition, we also set our own stringent environmental targets. These include targets to reduce fuel and water use per unit of production and to manage air and water emissions. We also undertake additional monitoring with the aim of reducing the impact of our operations on the environment and nearby communities.
The ISO 14001 international standard outlines best practice processes to manage environmental impact. A recertification audit was carried out on the Central Coast and the Western Region in 2008 and recertification was achieved.
Bronze Member in the Office of Environment and Heritage Sustainability Advantage Program.

Introduction AppendicesWorkplaceCustomersCommunityEnvironment
Table 2:
Sustainability scorecard (2011–2012 Strategic Plan)
Environment
Environmental impact
Water management
Target: Water discharge compliance with ANZECC guidelines by 2018 (L2 - 80%)
Status: Significant progress was made on implementation of a water treatment plant at Wallerawang Power Station to treat 50% of Cooling Tower Blowdown wastewater.
Visible air emissionsTarget: No visible chimney stack emissions by 2017
Status: Fabric filter plant will be installed at Wallerawang by 2017. This will eliminate visible emissions from Wallerawang Power Station and meet Group 6 emission limits.
Ambient air qualityTarget: Full compliance with National Air Quality Standards for power station emissions for SOx, NOx, and particulates
Status: Full compliance with National Air Quality Standards was achieved. Monitoring continues.
Greenhouse response
Greenhouse Gas EmissionsTarget: Reduce greenhouse gas emission intensity at Vales Point by more than 9 t/GWh in 2011/12.
Status: Air heater performance degraded in 2010/11. Rectification work in late 2011 should see this target achieved.
Carbon Capture and Storage Target: Demonstration plant operational by 2015
Status: The project’s engineering feasibility, stakeholder management plan and risk management plan were completed. Environmental consultants were appointed and a geological assessment to identify a suitable storage site is underway.
Large Scale Biomass DevelopmentTarget: Pursue 5-20% biomass co-firing at Vales Point and Wallerawang
Status: Currently, large scale biomass co-firing is not feasible due to combined high fuel risk and regulatory risk. In the event that these drivers change in the future, we will revisit the project at that time. Biomass co-firing on a small scale continues at Vales Point Power Station.
Resource inputs and waste
Increase ash re-usedTarget: Increase ash utilization 50% on 2010 levels by 2015
Status: Ash sales remain steady. Infrastructure was installed at Wallerawang and Mt Piper to increase supply to aggregate and cement industries.
Vales Point ash contract is currently being negotiated to identify the potential for further opportunities for ash utilisation.

7Delta Electricity Sustainability Report 2010-11
Community Workplace Customers
Community satisfaction
Community engagement Target: Implement a revised and targeted stakeholder engagement plan June 12
Status: Stakeholder Engagement Plan approved 2011-13 and implementation commenced. Sponsorship and donations program work component is underway.
Community involvement
Staff volunteer programTarget: 50% days taken by 2014
Status: A staff volunteer program will be developed as part of our Community and Stakeholder Engagement Plan. We will be exploring ways to encourage our staff to become more involved in community activities and to support them once they are involved.
Safety
LTIFR
Target: Zero
Status: We have achieved a continuous decrease in LTIFR since 2007-08. Our LTIFR was 3.7 in 2010-11.
Employee engagement
Employee engagement score
Target: Implement and begin tracking engagement metric by Sept-11
Status: A methodology was developed to measure employee engagement. An employee engagement index score of 69 will be used as a benchmark for future measures of staff engagement.
Customer Satisfaction
Results of Customer Survey
Target: 90% Customer satisfaction by 2012
Status: Delta is the highest rated generator of its customers. 95% customer satisfaction was achieved in 2010.

Introduction AppendicesWorkplaceCustomersCommunityEnvironment
Determining what is material to our stakeholdersMateriality is a measure of the importance of a topic to our stakeholders. Determining materiality ensures that the information in the sustainability report reflects the spectrum of economic, environmental and social impacts most important to our full range of stakeholders.
Determining what is material to our stakeholdersMateriality is a measure of the importance of a topic to our stakeholders. Determining materiality ensures that the information in the sustainability report reflects the spectrum of economic, environmental and social impacts most important to our full range of stakeholders.
Determining materiality for the Sustainability Report was a key improvement to last year’s report. This year the materiality analysis had more information available and is more comprehensive than that undertaken for 2009-2010 (for more information see Appendix 3).
Delta’s top stakeholder issuesMateriality is primarily used to guide the selection of information for inclusion in the Sustainability Report and also to assist with strategy development. Figure 2 shows the top stakeholder issues in terms of materiality.
Changes to materiality from last year
The list of top material issues differs significantly from last year. The changes occurred because of the significant changes to the operating environment and also increased rigour of the analysis (there were more source documents used in the determination and the analyses were more detailed).
Sustainability AdvantageDelta is a member of the Sustainability Advantage (SA) program run by the Office of Environment and Heritage since September 2009. This year we achieved Bronze level recognition through actively participation in three SA modules:
- Vision, Commitment and Planning;
- Resource Efficiency; and
- Staff Engagement.
Our commitment to sustainability was shown by our practical applications in these areas, such as the Step Ahead initiative (Staff Engagement), further ash utilisation efforts (Resource Efficiency) and the revised mission and values statement (Vision, Commitment and Planning).
Stakeholder expectationsA long-term sustainable business is one that is aligned with the expectations of its stakeholders. Awareness of what stakeholders expect from Delta gives us the information to adapt our operations, strategy and management practices more responsively. Delta implements its sustainability framework through the strategic and business planning process. Progress with implementation of strategic objectives is reviewed regularly at executive level and bi-annually at Board level.
By incorporating the expectations of our stakeholders into our sustainability practices we can better manage a range of activities:
- Clarify issues driving long-term business value;
- Identify, prioritise and address risks;
- Identify and capture opportunities;
- Build and maintain a stronger reputation;
- Anticipate and manage change; and
- Assess balanced performance at the time.
This requires us to move beyond legal compliance, or conformance with industry norms, and aspire to practices that align with shifting and contemporary community expectations. Alignment is achieved by identifying our most influential stakeholders, by exploring their expectations and by identifying issues that are most material to them.
Sustainability Continued

Delta is a member of the Sustainability Advantage program run by the Office of Environment and Heritage program since September 2009
SUSTAINABILITY REPORT 2010-11
ENERGY FOR LIFE
SUSTAINING
9Delta Electricity Sustainability Report 2010-11
About This ReportThe Delta Sustainability Report 2011 reports performance from 1 July 2010 to 30 June 2011. We report on our sustainability performance on an annual basis.
In 2008, we based our reporting on the National Generators Forum (NGF) guidelines that used the Global Reporting Initiative’s (GRI) Draft Electricity Utilities Sector Supplement as its basis. In 2009, Delta adopted the Energy Supply Association of Australia (esaa) Sustainability Reporting Framework which uses a similar method to the NGF by selecting relevant performance indicators from the GRI standard.
Delta reports to the GRI Level B reporting standard which is an international benchmark.
Our sustainability scorecard is based on four key elements: customers, workplace, environment and community. Under these elements we have chosen areas of focus and developed specific targets and measures. This is the basis of our strategic sustainability reporting. The remainder of the Introduction provides a summary of the four key elements within Delta’s sustainability Report with separate chapters focussing on the detail of these elements.
Figure 2: Top material issues identified by stakeholders
Issues of materiality
Public Policy
Emissions, Effluents and Waste
Availability and Reliabilty
Provision of information
Community
Employment
Training and Education
Economic Performance
Market Presence
Marketing Communications
Occupational Health and Safety
Water
Biodiversity
Compliance
Labour/Management Relations
Materials
Research and Development
Overall (Environment)
System Efficency
Plant Decommissioning
Transport
18
17
11
11
10
10
10
9
8
8
8
8
7
6
6
6
6
5
5
4
4
View online: WWW.DE.COM.AU

Introduction AppendicesWorkplaceCustomersCommunityEnvironment
Performance- The $20 million reverse osmosis (RO)
water treatment plant at Wallerawang was commissioned to treat up to six million litres a day of blowdown water.
- No significant fines or other penalties for non-compliance with environmental laws and regulations
- We have increased the amount of ash reuse by ten per cent
- Successful trials of ash utilisation for increased use as an aggregate in the construction industry
- The biomass torrefaction trials were successful
- The eucalyptus mallee trial in the Forbes region (grown as a fuel crop) has been enthusiastically supported by farmers and is showing high plant productivity
- Submitted our third Greenhouse Emission Report—for 2010-2011
- No significant spills for the last four years
- One reportable licence non-conformance with pH limit being exceeded at Wallerawang
- Three NSW Land and Environment Court matters
Key objective
Ensure all plant operates to high environmental standards to target zero incidents and zero licence breaches.
Environment
Key issues Emissions and air qualityDelta monitors air quality in the Central Coast and Western regions where we operate. The monitoring shows that air quality is consistently high and well within health and environmental air quality standards.
Water managementIn 2011 a $20 million reverse osmosis (RO) water treatment plant and pipeline was constructed at Wallerawang to treat up to six million litres of water per day cooling tower blowdown. The reverse osmosis plant removes salt and trace elements from water used in electricity generation processes.
Biodiversity and land managementDelta has procedures in place to ensure compliance with the Environmental Protection and Biodiversity Conservation Act 1999, including obligations in our contracts and works orders to ensure contractor compliance with the requirements of the legislation. We have carried out biodiversity and cultural heritage surveys for lands managed in the regions.
Research and development We are exploring carbon capture and storage technologies as well as new technologies for biomass processing. We are also funding the Delta Electricity Chair in Sustainable Energy Development at the University of Sydney which is focusing research on energy storage and its contribution to sustainable energy use.
Overall environmental management Delta’s Environmental Management System (EMS) is the foundation of our environmental compliance and risk management approach. Our EMS is accredited under ISO 14001, the international standard which defines environmental best practice approach.
Environmental incidentsDelta had no significant fines or non-monetary sanctions for non-compliance with environmental laws and regulations in the reporting period. However, an action was commenced in the Land and Environment Court (LEC) last year alleging Delta had polluted the Upper Coxs River. The matter has since been settled.
Two other LEC matters were in relation to two development consents (Mt Piper Extension and Munmorah Rehabilitation projects) approved by the Department of Planning. Delta is a second respondent in these matters.

11Delta Electricity Sustainability Report 2010-11
Wallerawang reverse osmosis water treatment plant commissioned
Sustainability scorecard
Environmental impactWater management
Target: Water discharge compliance with ANZECC guidelines by 2018 (L2 - 80%)
Status: Significant progress was made on implementation of a water treatment plant at Wallerawang Power Station to treat 50% of Cooling Tower blowdown wastewater.
Visible air emissionsTarget: No visible chimney stack emissions by 2017
Status: Fabric filter plant will be installed at Wallerawang by 2017. This will eliminate visible emissions from Wallerawang Power Station and meet Group 6 emission limits.
Ambient air qualityTarget: Full compliance with National Air Quality Standards for power station emissions for SOx, NOx, and particulates
Status: Full compliance with National Air Quality Standards was achieved. Monitoring continues.
Greenhouse response
Greenhouse Gas EmissionsTarget: Reduce greenhouse gas emission intensity at Vales Point by more than 9 t/GWh in 2011/12.
Status: The baseline thermal efficiency at Vales Point was restored. The Efficiency Committee is identifying additional projects to further improve the station’s thermal efficiency, which will reduce the greenhouse gas emission intensity.
Carbon Capture and Storage Target: Demonstration plant operational by 2015
Status: The project’s engineering feasibility, stakeholder management plan and risk management plan were completed. Environmental consultants were appointed and a geological assessment to identify a suitable storage site is underway.
Large Scale Biomass DevelopmentTarget: Pursue 5-20% biomass co-firing at Vales Point and Wallerawang
Status: Currently, large scale biomass co-firing is not feasible due to combined high fuel risk and regulatory risk. Biomass co-firing on a small scale continues at Vales Point Power Station.
Resource inputs and wasteIncrease ash re-usedTarget: Increase ash utilization 50% on 2010 levels by 2015
Status: Ash sales increased. Infrastructure was installed at Wallerawang and Mt Piper to increase supply to road and cement industries.
Vales Point ash contract is currently being negotiated to identify the potential of further opportunities for ash utilisation.

Performance- A community survey identified a good understanding
of our activities and recognition of our importance as a provider of electricity and as a regional employer
- Developed a Community and Stakeholder Engagement Plan for 2011-2013
- Provided approximately $750,000 through sponsorships and donations for education and community activities including Landcare, Tidy Towns, Clean Up Australia Day and other community activities and events
- Corporate sponsorship to support research bodies, cultural institutions and our participation in industry and environment conferences
- Developing a corporate volunteer program to support staff volunteering in our local communities
- Announced we will contribute towards the costs of redeveloping the Lithgow Aquatic Centre.
- Provided sponsorship for the NAIDOC event on the Central Coast that involved a Health Expo and Community Gathering at Gosford Showground
- Through our community advisory groups we have identified and responded to local concerns including operational noise, feral animals and impacts of water discharges
Key objective
To be respected by all stakeholders for support and responsiveness provided to the communities that share regional locations with Delta.
Sustainability scorecard
Community satisfactionCommunity engagement Target: Implement a revised and targeted stakeholder engagement plan June 12
Status: Stakeholder Engagement Plan approved 2011-13 and implementation commenced. Sponsorship and donations program work component is underway. Community involvement
Staff volunteer programTarget: 50% days taken by 2014
Status: A staff volunteer program is being developed as part of our Community and Stakeholder Engagement Plan. We are exploring ways to encourage our staff to become more involved in community activities and to support them once they are involved.
Introduction AppendicesWorkplaceCustomersCommunityEnvironment
Community

Key issues
Stakeholder engagementDelta undertakes community and stakeholder engagement through formal and structured channels and informal liaison through a number of local organisations. The Central Coast Community Access Regional Environment Forum and the Western Region Community Reference Group meet quarterly with senior Delta managers for briefings on operations and initiatives, to provide an opportunity to understand community concerns and issues and to find ways to improve outcomes and minimise impacts on the surrounding communities.
We have a long and proud history of supporting local communities in many ways. One of the ways that Delta provides this support is through our sponsorship and donations programs. Each region has a considerable allocated budget each year for sponsorships, donations and partnerships to assist in a range of community activities.
Transport impactsEffective management of fuel handling systems ensures that operations are controlled to mitigate and minimise environmental impacts on our local stakeholders. Delta uses several mitigation techniques to reduce the impacts of the transport and handling of coal such as utilisation of buffer zones to minimise visual and noise impacts and the use of private haul roads in the Western region.
Provided through sponsorships and donations for education and community activities.
A survey identified community has a good understanding of our activities and recognition of our importance as a provider of electricity and as a regional employer.
Our commitment to sustainability was shown by our practical applications such as the Step Ahead initiative
13Delta Electricity Sustainability Report 2010-11
?

Performance- The number of lost time injuries improved (from 6 to 5)
and there was also a reduction in the severity of injuries
- Delta continues to be a regional employer of choice in both the Western and Central Coast regions
- Delivered a new enterprise award with no time lost in dispute
- Despite significant changes in Board membership, strong governance practices were maintained throughout the year
- Developed an Internal Communication Plan for 2011–2012
- Developed the Step Ahead program to promote a staff culture of sustainability
- Appointed an Internal Communications Manager to increase staff engagement
- Sponsored 18 new apprenticeships
- Several scholarships provided to university
Key objective
Ensure practices are in place that support business goals, get the job done efficiently and foster skills development.
Sustainability scorecard
SafetyLTIFR
Target: Zero
Status: We achieved a continuous decrease in LTIFR since 2007-08. Our LTIFR was 3.7 in 2010-11.
Employee engagement
Employee engagement score
Target: Implement and begin tracking engagement metric by Sept-11
Status: A methodology developed to measure employee engagement. An employee engagement index score of 69 will be used as a benchmark for future measures of staff engagement.
Introduction AppendicesWorkplaceCustomersCommunityEnvironment
Workplace

Key issues
Provision of information The appointment of an Internal Communications Manager is a direct response to an identified need to improve our internal communications, to provide more timely and appropriate information to staff and to increase staff engagement in the development of sustainability in Delta.
Employer of choice Delta continues to be a regional employer of choice in both the Western and Central Coast regions. On the Central Coast, the effects of reduced operations of Munmorah are being partially offset by the operation of Colongra and by some staff retirements.
Training and educationDelta’s skills portfolio is supported by clear role definition incorporating a competency framework, a performance management system, workforce planning framework and a budgetary commitment to ensure the maintenance of the skills needed to run the business. Delta has clear policies on training and development.
Occupational Health and SafetyBy applying strict standards on plant isolations, including a lock out system, and successfully implementing a behaviourally based safety system (D-ZIP), Delta has achieved continual improvement in safety performance.
Labour management relationsDelta has maintained a close working relationship with Unions NSW and union representatives during this period, with forums being conducted on a regular basis to ensure a two-way flow of information and to identify issues at an early stage. A new employee enterprise agreement has been signed in this period.
All of these activities have resulted in increasing alignment to our mission and values and a reduction in conflicts leading to industrial disputes.
15Delta Electricity Sustainability Report 2010-11
Delta sponsored 18 new apprenticeships since June 2010
Delta’s lost time injury improved from 6 to 5 and there was also a reduction in the severity of injuries
Internal Communication Plan developed for 2011–2012.
5

- Underlying net profit before tax of $86.2 million—an improvement of 19% compared to the Statement of Corporate Intent budget
- Electricity production was 21,501 GWh sent out—less than the budgeted level of production due to prevailing market conditions and lower than expected demand for electricity
- Under the NSW electricity reform process, Western operations operate under a Gentrader contract with TRUenergy, while Central Coast operations operate directly in the NEM
- Plant achieved high levels of reliability with the overall plant availability well above budget at 90.88% and forced outage factor at 2.0%
- Record energy production (as generated) of 10,003 GWh for Mt Piper and 5,541 GWh for Wallerawang
- Successfully demonstrated Colongra‘s black start capability during a test to bring the national electricity network back online in the event of a catastrophic event
- Our customer satisfaction survey showed Delta scored highly against other generators but there was reduced satisfaction due to uncertainty about the energy reform process
- The average spot price in the NSW region of National Electricity Market (NEM) for 2010-11 was the lowest in seven years
- The Sunshine Electricity Joint Venture went into receivership in February 2011 due to low crop volumes and low Renewable Energy Certificates prices
Key objective
Leverage exceptional relationships to achieve business success. Secure revenue premiums above market prices for sales.
Performance
Sustainability scorecard
Customer SatisfactionResults of Customer Survey
Target: 90% customer satisfaction by 2012
Status: Delta is the highest rated generator by its customers. 95% customer satisfaction was achieved in 2010.
Introduction AppendicesWorkplaceCustomersCommunityEnvironment
Customers

Key Issues
Reliability and availabilityAvailability and reliability are two of Delta’s key performance indicators and are central parts of Delta’s strategic and business planning processes. The recent performance of Delta’s plant reflects successes resulting from plant maintenance and capital expenditure programs.
Overall, Delta plant achieved high levels of availability at 91.44%. Colongra’s availability was 99.95% and had a start reliability of 97%. Coal-fired plant availability was 90.1%.
Economic performanceDelta delivered an underlying net profit before tax of $86.2 million which was an improvement of 19% compared to the Statement of Corporate Intent 2010-2011 budget. The underlying net profit before tax excludes a $166.7 million impact of accounting adjustments related to the Gentrader transaction ($895m inclusive of balance sheet write-downs) and a $156.4 million impairment of Central Coast asset values, primarily related to the impact of the proposed carbon tax ($318.4 million inclusive of balance sheet write-downs).
The Sunshine Electricity Joint Venture between Delta Electricity Australia and the NSW Sugar Milling Cooperative went into receivership in February 2011 due to low crop volumes and low Renewable Energy Certificates prices.
Market presence/forcesThe average spot price in the NSW region of National Electricity Market (NEM) for 2010-11 was the lowest in seven years. The continuing pressure on market prices is the result of the recent commissioning of new gas and renewable generating capacity and reducing wholesale energy demand.
Marketing communicationsDelta undertakes customer satisfaction surveys with retailers to provide a direct measure of our success and possible areas of improvement in our marketing communications. Interviews were carried out by telephone with representatives of AGL, Country Energy, Energy Australia, Integral Energy, Origin Energy, Red Energy, Snowy Hydro, and TruEnergy. The survey was carried out in June 2010 and reported in July.
Delta undertakes customer satisfaction surveys with retailers to provide a direct measure of our success and possible areas of improvement in our marketing communications.
MaterialsCoal prices have increased significantly in recent years as a result of record demand for coal exports. This has increased the risk for Delta in securing domestic supplies of coal at competitive prices. Purchases of coal for Delta’s power stations meant expenditure in excess of $400 million in our local regions which contributes significantly to local employment and the economic sustainability of local communities.
System efficiencyImproving system efficiency is an important, cost-effective strategy to increase production without having to invest in building further plant. We continually improve the generation efficiency of our plants: major works were carried out at Vales Point Power Station to address thermal efficiency; Mt Piper had a capacity upgrade in 2009; and several major modifications were undertaken at Wallerawang Power Station to optimise its combustion systems and to improve cooling tower efficiency.
17Delta Electricity Sustainability Report 2010-11
$86.2m underlying net profit before tax - an improvement of 19% compared to the Statement of Corporate Intent budget
$86.2m

AppendicesWorkplaceCustomersCommunityEnvironmentIntroduction Environment
EnvironmentKey Objective
Ensure all plant operates to high environmental standards to target zero incidents and zero licence breaches.

19Delta Electricity Sustainability Report 2010-11
Delta’s greenhouse gas emissionsDelta produced 19.976 million tonnes of CO2-e this year compared with 20.686 million tonnes of CO2-e last year. Although Delta is one of the biggest greenhouse gas (GHG) emitters in Australia, this is a reflection on Delta’s size in capacity terms, rather than its operational efficiency.
In preparation for carbon constrained future, Delta invested in the Colongra gas turbines, which were commissioned in late 2009 and have just completed their first full year of operation.
Delta has not operated the Munmorah power station since August 2010. This decision was made due to its high operating costs and relatively high GHG emission intensity compared to the rest of Delta’s portfolio. Munmorah has been placed on standby and will only be operated if market conditions warrant.
Climate Change
Table 3: Total greenhouse gas emissions
Emission type*
Million tonnes
2010-11 2009-10
Direct (Scope 1 emissions) 19.788 20.453
Indirect (Scope 2 emissions) 0.188 0.233
Total 19.976 20.686
* See Greenhouse Reporting for Scope 1 and 2 definitions.
Figure 3: Greenhouse gas emission rates by station (tonnes CO2-e/GWh sent out)
1,050
1,200
1,150
1,100
1,000
950
900
850
800
750
700
650
Sep 200
8
Dec 200
8
Mar 200
9
Jun 2009
Sep 200
9
Dec 200
9
Mar 2010
Jun 2010
Sep 2010
Dec 2010
Mar 2011
Jun 2011
Munmorah Vales Point Wallerawang Mt Piper Colongra

Introduction AppendicesWorkplaceCustomersCommunityEnvironment
Figure 3 shows emission rates of Delta’s power stations over the last three years. Wallerawang and Mt Piper’s emission rates were relatively stable other than changes attributable to stockpile adjustments1. Vales Point was also relatively stable throughout the first two years, but its emission rate increased throughout the year, which is partly due to low output factors and some operational issues. Delta has planned maintenance due in late 2011 and early 2012 to rectify these issues. Munmorah’s rate trended upward until its last operational month in August 2010, attributable to its declining output. Colongra’s greenhouse gas emission rate has trended down since commissioning, due to the transition from high diesel use ratios during commissioning to predominantly gas use during normal operations.
Greenhouse Reporting
Delta has adopted the National Greenhouse and Energy Reporting (NGERs) protocol for reporting greenhouse emissions.
Scope 1 represents direct greenhouse gas emissions from on-site energy production or other industrial activities. Scope 2 represents emissions from energy that is purchased off-site (primarily electricity, but can also include energy like steam).
Delta does not calculate nor report Scope 3 emissions as the category is less significant for a power generator. Scope 3 includes upstream and downstream emissions including: employee travel, emissions embedded in products purchased or processed by the firm, and emissions associated with transporting and disposing of products sold by the firm.
Our third Greenhouse Emission Report (2010-2011) was submitted this year. This is a requirement under the Australian Government’s National Greenhouse and Energy Reporting Act 2007. The national greenhouse and energy data for large scale greenhouse emitters and energy users is publicly available and published by the Department of Climate Change and Energy Efficiency2.
Responding to Climate Change
Low GHG Emission GenerationColongra Gas Power Station Colongra is designed to operate preferentially on natural gas, only using diesel when the gas supply is limited but peak energy demand remains high. It generated approximately 65GWh electricity during 2010-11 and produced, on average, 25% less greenhouse emissions than that of coal-fired power plants. This has saved approximately 13,500 tonnes of greenhouse gas emissions that would have otherwise been produced by coal-fired power stations.
Sugar MillsThe Sunshine Electricity Joint Venture between Delta Electricity Australia and the NSW Sugar Milling Cooperative went into receivership in February 2011 due to fuel shortages and low Renewable Energy Certificate prices. This meant that the project, whilst valuable and significant in the development of renewables, became financially unviable.
Until February 2011, Delta’s share of the electricity generated from the project was around 90 GWh, which saved around 82,000 tonnes of greenhouse gas emissions.
Efficiency ImprovementsDelta conducts a formal review of power station efficiency at quarterly meetings with ongoing reporting occurring within the Production business unit at weekly and monthly performance review meetings. The efficiency meetings compare actual efficiency with the design efficiency and attempt to identify the main plant contributors to a reduction in efficiency.
Following the introduction of a carbon price, Delta is re-evaluating efficiency projects that previously did not meet financial hurdles. The carbon price will improve the viability of efficiency projects.
Research and DevelopmentDelta’s support for research and development activities is a key element in our strategy to reduce greenhouse emissions and deliver a more reliable and sustainable energy supply.
Professor Tony Vassallo is the inaugural Delta Electricity Chair in Sustainable Energy Development at the University of Sydney. His research focuses on energy storage and its contribution to sustainable energy use and is directed at finding cheaper ways of storing energy to facilitate the widespread uptake of renewable energy sources. Delta has sponsored this Chair since 2008.
ContinuedClimate Change
1These occur because of weighing inaccuracies over time and periodic stock surveys using laser imaging are used to correct the weight of combusted coal. 2 http://www.climatechange.gov.au/en/government/initiatives/national-greenhouse-energy-reporting/publication-of-data.aspx

Delta’s support for research and development activities is a key element in our strategy to reduce greenhouse emissions and deliver a more sustainable energy supply.
21Delta Electricity Sustainability Report 2010-11
Post-combustion carbon capture pilot programThe post-combustion carbon capture pilot plant experimental program conducted at Munmorah, in conjunction with the CSIRO, was completed in August 2010. The pilot plant exceeded its targets for capture rate, carbon dioxide purity and sulphur removal.
The data generated from the pilot plant will be used to select technology for a large-scale demonstration scale plant.
Delta and CSIRO will relocate the pilot plant from Munmorah to Vales Point to conduct further research in 2012.
Carbon capture and storage demonstration projectDelta’s Carbon Capture and Storage (CCS) Demonstration project will be the first in Australia to demonstrate integrated post combustion capture, transport and permanent geological storage of carbon dioxide from a power station, storing up to 100,000 tonnes of CO2 per year. It will be hosted at Delta’s Vales Point power station.
The NSW Government, Commonwealth Government and Australian Coal Association have signed a funding agreement with Delta Electricity for a “Development and Approvals” Stage 1 of the demonstration project. This stage will pioneer in NSW:
- community engagement on a CCS project;
- gaining exploration permits for CO2 storage;
- establishment of storage leases; and
- planning and environmental approvals for CCS.
Stage 2 will demonstrate the integrated process by validating post-combustion capture technology and verifying geological storage techniques.
Post combustion capture (PCC) of carbon dioxide (i.e. the process that will be deployed at Vales Point) is a technology which has the potential to significantly reduce greenhouse emissions from coal and gas fired power stations.
Carbon dioxide captured by the process is compressed to a liquid and transported to a geological storage site. At the storage site, CO2 will be injected underground to a depth greater than 800 metres and sequestered permanently inside a geological trap or matrix. A comprehensive program to monitor the effectiveness and integrity of the matrix will be implemented for the duration of the demonstration project and continued thereafter for a prescribed period of time.
Assuming the timely identification and proving of a suitable storage site in NSW and the availability of suitable grant funding, construction of the project would take place between 2013 and 2015. The operational phase of the demonstration project is expected to run for two years, although it is anticipated the capture facility may continue operation after this time.
Large scale biomass co-firing developmentBiomass is a renewable, carbon-neutral fuel with the potential to replace up to 20% of coal usage without impacting on the quality and continuity of electricity supply. We continue to research new technologies for biomass processing.
Delta is hosting the demonstration scale ‘torrefaction’ facility at Vales Point in cooperation with Crucible Carbon. Torrefaction is a form of pyrolysis where biomass is chemically treated at high temperatures to partly decompose the biomass and to drive off the volatile components, leaving a torrefied biomass which has approximately 30% more energy content per unit of mass.
Delta continues to undertake commercial and feasibility studies into the options of co-firing at Vales Point to achieve up to 20% electricity generation from biomass. Currently, large scale biomass co-firing is not feasible due to combined high fuel risk and regulatory risk. To mitigate fuel risk, Delta’s mallee tree planting trial of 200,000 trees in the Forbes region will monitor propagation and seedling survival rates. The trees will be monitored until they reach a harvestable growth level.
Biomass co-firing on a small scale (i.e. less than1%) continues at Vales Point as part of its normal operations.
Eucalyptus Mallee trial is being enthusiastically supported by farmers and is showing high plant productivity

Introduction AppendicesWorkplaceCustomersCommunityEnvironment
Water SourcesDelta follows sustainable water management practices when water is extracted from local rivers and local government water supplies. Wherever possible we will use or develop alternative sources of water to reduce our reliance on high quality water supplies.
Water use at our power stations is shown in Figure 4. In 2010-11, we continued to lower our total water usage through successful water management initiatives such as the commissioning of a reverse osmosis plant at Wallerawang in May 2011. Delta is committed to expanding these facilities to fully treat all cooling tower blowdown at Wallerawang by 2015, which will further reduce Delta’s reliance on higher quality water resources.
Water ManagementWestern region water managementTo generate electricity from the Western Region power stations about 23 gigalitres (GL) of water is used each year. About 99% of the power stations’ water supply may be consumed for cooling purposes and released by evaporation.
Water is sourced primarily from Delta’s own storages at Lake Wallace, Lake Lyell and Thompsons Creek Dam (all fed from the Coxs River); and from the Springvale Mine with the remainder from the Fish River supply.
A Water Management Licence for the Western Region sets out conditions for power station access to the Coxs River water supplies. While the licence allows for extraction of 23 GL/year, the full allocation has not recently been used. The better quality Fish River water is required for operational reasons but
Water Use
Table 4: Water sources
Water source
Gross extraction (ML)
2010-11 2009-10
Surface water Coxs River 21,308 22,821
Fish River (potable) 4,667 2,860
Waste water Springvale mine water 6,096 4,056
Treated sewage effluent 195 212
Municipal water supplies Hunter and Wyong 406 495
Estuaries and oceans Lake Munmorah and Lake Macquarie 1,614,069 1,760,903
Figure 4: Total water usage
07-08 08-09 09-10 10-11
1,646,741 ML
1,791,347 ML
1,895,726 ML
1,999.298 ML

Delta follows sustainable water management practices when water is extracted from local rivers and local government water supplies.
23Delta Electricity Sustainability Report 2010-11
a proportion of mine water is used to supplement available supplies and to reduce demands on the Coxs and Fish River systems. The proportions vary each year depending on water availability, operational requirements and water quality.
There is insufficient capacity in the Upper Coxs River system alone to sustain generation over an extended dry period without reducing generation output. The other stakeholders using water from the Upper Coxs River catchment include the Lithgow Shire community and users involved in agriculture, mining and forestry. The recurrence of drought conditions would lead to a decline in water storage levels. Therefore the supplementary source of mine water discharges and increased treatment at waste water discharges are essential to maintain the water supply for electricity generation during drought. Maintaining water quality under constrained water supply circumstances also requires careful management.
Securing a reliable water supplyDelta is continuing to work with the community to improve water quality. In May 2011, the $20 million reverse osmosis (RO) water treatment plant and pipeline at Wallerawang was commissioned to treat up to six million litres of cooling water blow down per day. The RO plant reduces the salinity of the cooling water blow down and reduces our reliance on the Fish River scheme during drought. The plant will complement two similar plants installed at Mt Piper.
Springvale mine water was an important resource during the recent prolonged drought. By using mine water we not only decrease river discharges but also reduce demands on natural catchment water sources (such as Coxs River) and help to minimise potential water supply and water quality issues.
DestinationTreatment method Is it reused?
Volume (ML)
2010-11 2009-10
Coxs River at Wallerawang
pH control Drinking water and power station extraction
4,885 6,160
Saline ash dam discharges at Lake Macquarie and Lake Munmorah
Settlement No 17,718 14,617
Station
Operating hours >35OC (hours/year)
2010-11 2009-10
Vales Point 60 126
Munmorah Nil 14
Table5: Total water discharge by quality and destination Table 6: Thermal discharges. Hours/years at specific tempeatures above background
Rain during late 2010 replenished inland water sources. As of June 2011, Oberon Dam was at 54% of capacity, and Delta’s total Coxs River storage was at 75%.
Central Coast water managementThe reverse osmosis plant at Vales Point has been operating successfully to treat sewage water to high quality recycled water for use in the demineralisation plant. The plant produced 194 million litres of high quality water in 2010-2011. Significantly, this volume of recycled water replaced an equivalent volume of drinking quality water and reduced demand on the municipal water supply.
As part of the NSW Office of Environment and Heritage Sustainability Advantage program’s resource efficiency module, the conversion of the cooling water canal foam sprays from fresh to salt water has been completed at Vales Point. This will result in a saving of approximately 23 million litres of water per year (average for last 3 years).
The cooling water discharge temperature of Vales Point must, under normal market conditions, be below 37.5
oC at all times as
per its Environmental Protection Licence. The licence restricts the number of hours that Vales Point can operate in the range of 35
oC and 37.5
oC. The station is equipped with systems to cool
down its cooling water (known as attemperation) before releasing to Lake Macquarie. When this is not sufficient to lower the water temperature below the licence requirements (i.e. extremely hot weather) the power station must reduce load as required.

Introduction AppendicesWorkplaceCustomersCommunityEnvironment
Monitoring air quality
The Central Coast Monitoring locationsDelta operates two coal-fired and one gas-fired power station in the Central Coast region of NSW.
Air quality in the region of the power stations is monitored continuously by three air quality monitoring stations operated by Delta (Figure 5). The Wyee and Lake Munmorah Public School sites commenced monitoring in the early 1990s and the Morisset Peninsula site was established in late 2005. In addition to the air quality monitoring sites, Delta operates a climate station at Munmorah and a number of dust fall-out gauges around coal and ash storage areas at Vales Point and Munmorah. Eraring Power station is owned by Eraring Energy, and it is the operator of the Marks Point and Dora Creek monitoring stations.
Air emissions
SO2 concentrations
Parts per million (ppm)
2010 2009 2008
Maximum one - hour average SO2 concentrations
0.07 0.07 0.11
National Standard, less than
0.2 0.2 0.2
Exceedences 0 0 0
Table 7: Central Coast Maximum one - hour average SO2 concentrations
NO2 concentrations
Parts per million (ppm)
2010 2009 2008
Maximum one - hour average NO2 concentrations
0.04 0.04 0.04
National Standard, less than
0.12 0.12 0.12
Exceedences 0 0 0
Table 8: Central Coast Maximum one - hour average NO2 concentrations
Sulphur dioxide and nitrogen dioxide concentrationsThe tables below show that the maximum sulphur dioxide (SO2) and nitrogen dioxide (NO2) concentrations are well below the relevant one-hour average National Air Quality Standards – no exceedences have been recorded over the years of monitoring that has been undertaken. Results for other averaging periods are also well below the relevant National Standards.
Figure 5: Central Coast Maximum PM10 concentrations
Delta Power Stations
Eraring Monitors
Delta Monitors
Lake Munmorah School
Munmorah
Colongra
Vales PointWyee
Morisset
Dora Creek
Eraring Marks Point

Delta’s monitoring shows that air quality is consistently high and well within health and environmental air quality standards.
25Delta Electricity Sustainability Report 2010-11
Table 9: Central Coast Annual average TSP concentrations
Annual average TSP concentrations
Micrograms per cubic metre mg /m3
2010 2009 2008
Annual average TSP concentrations
21.9 42 40
NSW assessment criterion, less than
90 90 90
Exceedences 0 0 0
Table 10: Central Coast Maximum PM10 concentrations
Maximum PM10
concentrations
Micrograms per cubic metre mg /m31
2010 2009 2008
Maximum 24 hour average PM10 concentrations 27.4 19232 32
National Standard, less than1 50 50 50
Exceedences 0 5 0
1. National Standard 50 μg /m3 with a maximum of 5 exceedences in a year2. Dust storms across eastern Australia
The Western RegionDelta’s Wallerawang and Mt Piper coal-fired power stations have operated in the Western region since the 1970s and 1990s, respectively.
Air quality near the power stations is monitored continuously by two air quality monitoring stations operated by Delta (Figure 6). The Wallerawang and Blackmans Flat sites commenced operation in the early 1990s. Delta also operates a particulate monitor near the Mt Piper ash storage area for management purposes.
In addition to the air quality monitoring sites, Delta operates a climate station at Mt Piper and a number of dust fall-out gauges around coal and ash storage areas.
ParticulatesA diverse range of local and regional sources contribute to the particulate results measured at the monitoring stations. The sources also vary over time and it is not always straightforward to determine which sources have contributed to the monitored results.
The table below shows that concentrations of total suspended particulates (TSP) are well below the NSW assessment criterion (there being no National Standard for TSP).
The tables also show that smaller sized particulate matter (PM10 and PM2.5) concentrations are below the standards for the vast majority of the time - occasional elevated concentrations are usually related to broad-scale factors such as bushfires and dust storms, most recently in September 2009.
Table 11: Central Coast - Maximum PM2.5 concentrations
Maximum PM2.5 concentrations
Micrograms per cubic metre mg /m31
2010 2009 2008
Maximum 24 hour average PM2.5 concentrations
22.1 250 2 21
National Advisory Standard, less than1 25 25 25
Exceedences 0 2 0
1. National Advisory Standard 25 μg /m3 with a maximum of 5 exceedences in a year2. Dust storms across eastern Australia
Figure 6: Location of power stations and air quality monitors in the Western region
Mt PiperBlackmans Flat
Delta Power Stations Delta Monitors
Wallerawang
Wallerawang

Introduction AppendicesWorkplaceCustomersCommunityEnvironment
Air emissions
Table 12: Western region Maximum one-hour average SO2 concentrations
Sulphur dioxide and nitrogen dioxide concentrationsThe following tables show that the maximum SO2 and NO2 concentrations are below the relevant one-hour average National Air Quality Standards – no exceedences have been recorded over the years of monitoring that has been undertaken. Results for other averaging periods are also well below the relevant National Standards.
Table 14: Western region Maximum PM10 concentrations
Maximum PM10 concentrations
Micrograms per cubic metre mg/m31
2010
Maximum 24 hour average PM10 concentrations
49.2
National Standard, less than1 50
Exceedences 0
. National Standard 50 μg /m3 with a maximum of 5 exceedences in a year
SO2 concentrations
Parts per million (ppm)
2010 2009 2008
Maximum one - hour average SO2 concentrations
0.08 0.09 0.16
National Standard, less than 0.2 0.2 0.2
Exceedences 0 0 0
Table 13: Western region Maximum one-hour average NO2 concentrations
NO2 concentrations
Parts per million (ppm)
2010 2009 2008
Maximum one - hour average NO2 concentrations
0.05 0.03 0.03
National Standard, less than 0.12 0.12 0.12
Exceedences 0 0 0
Table 15: Western region Maximum PM2.5 concentrations
Maximum PM2.5 concentrations
Micrograms per cubic metre mg/m31
2010
Maximum 24 hour average PM2.5 concentrations
28.9
National Advisory Standard, less than1 25
Exceedences 2 2
1. National Advisory Standard 25 μg /m3 with a maximum of 5 exceedences in a year2. Cause of the events unclear – do not appear to be related to Delta’s operations
ParticulatesMonitoring of particulates at the Wallerawang and Blackmans Flat sites commenced in late 2009. A diverse range of local and regional sources influence the results measured at the monitoring stations to varying degrees at different times and it is not always easy or straightforward to determine which source(s) has contributed to the monitored results.
Particulate emissions from Wallerawang are generally more pronounced than those of Mt Piper due to its older precipitator technology. We plan to start installing the fabric filter technology that would dramatically reduce the power station’s particulate emissions from mid-2015.
Data to the end of 2010 show that fine particulate matter (PM10 and PM2.5) concentrations are below the standards for the vast majority of the time—occasional elevated concentrations are usually related to broad-scale factors such as bushfires and dust storms.

In preparation for carbon constrained future, Delta invested in the Colongra gas turbines, which were commissioned in late 2009 and have just completed their first full year of operation
27Delta Electricity Sustainability Report 2010-11
Significant stack emissions Total stack emissions will vary with the amount of electricity generated. All Delta plant operated in full compliance with their Environmental Protection Licence requirements. The measure of kg/MWh provides an indication as to how emissions vary for each unit of electricity produced.
Maximum PM2.5 concentrations
Micrograms per cubic metre mg/m31
2010
Maximum 24 hour average PM2.5 concentrations
28.9
National Advisory Standard, less than1 25
Exceedences 2 2
NOx emissions (as NO2 equivalent)
kilotonnes kg/MWh sent-out
2010-11 2009-10 2010-11 2009-10
Western 45.6 36.9 2.98 2.79
Central Coast 15.0 21.1 2.47 2.42
Total 60.6 58.0 2.83 2.64
SOx emissions (as SO2 equivalent)
kilotonnes kg/MWh sent-out
2010-11 2009-10 2010-11 2009-10
Western 75.1 60.5 4.91 4.57
Central Coast 16.7 21.1 2.75 2.41
Total 91.8 81.6 4.29 3.70
Total particulate emissionskilotonnes kg/MWh sent-out
2010-11 2009-10 2010-11 2009-10
Western 2.4 2.5 0.16 0.19
Central Coast 0.2 0.3 0.04 0.04
Total 2.6 2.8 0.12 0.13
Total fluride emissions (as HF equivalent)
kilotonnes kg/MWh sent-out
2010-11 2009-10 2010-11 2009-10
Western 0.2 0.2 0.2 0.2
Central Coast 0.1 0.1 0.01 0.01
Total 0.3 0.3 0.01 0.01
Table 16: Significant stack emissions

Introduction AppendicesWorkplaceCustomersCommunityEnvironment
Land Management PlansDelta maintains land management plans for all its landholdings consistent with the National Generators Forum Guideline for Land Management. This year, we have carried out biodiversity and cultural heritage surveys for land managed by Delta Western and Delta Central Coast. The survey included the identification of the effects of a proposed activity on all flora and fauna species (including fish and marine vegetation species), populations, ecological communities and their habitats, including effects on Commonwealth listed threatened species, ecological communities and/or migratory species.
We update our Land Management Plans every five years. The next update is due in 2012. This year we have commenced scoping out the review process. For the 2012 update, we are planning to combine our two Land Management Plans for Delta Western and Delta Central Coast into one to achieve a consistency of approach, organisation-wide. While, there are key differences between each region, and the planning and delivery of each region’s individual sections will of necessity be separate (i.e. field/site visits, stakeholder engagement, environmental issues and maps, Environment Protection Licences, some legislative differences, development approvals/applications etc.) there are a number of key similarities across the two that will allow for a combined approach to be presented in a way that is suitable to both Delta’s strategic planning and the on-ground delivery personnel that will implement the Land Management Plans.
The 2012 update will include a review of the relevant management plans and strategies of Delta’s key stakeholders (e.g. councils) and concerns of our neighbours through stakeholder consultation workshops. The outcomes of this will include the identification of potential for future partnership opportunities for projects on property neighbouring Delta’s.
The 2012 Land Management Plan will also include a provision of a target hierarchy for all management action (12 month) , resource condition (3 – 5 year) and targets to achieve Delta’s Land Management ‘Vision’ (10 year goals). Hierarchy model will be developed according to the results from internal and external consultation meetings; and serve as a guide for the development of further management plans and on-ground work programs.
In addition, for our new projects, we assess the likely significance of the action on threatened biodiversity following the Guidelines for Threatened Species Assessment (NSW Office of Environment and Heritage). For example, this year, provisions for habitat offsets have been incorporated into the development consent conditions for the Mt Piper Ash Placement Project.
Biodiversity and land management
Bushfire Risk ManagementDelta has Fire Procedures manuals for its Western and Central Coast business units. The Manuals include Land Fire Risk Mitigation Management and Fire Mitigation Action Plans for the protection of the environment from the potential hazards of fire. The plans are based on available information concerning the site impacts of fire on biodiversity for different vegetation communities and the known fire history. They also define fire regimes corresponding to vegetation community types.
We review these plans every twelve months to ensure that adequate measures are in place to protect neighbouring properties from damage caused by fires originating on or passing through Delta land. This permits actions and the appropriate control measures to be implemented before the bushfire season. The Plans have been developed to effectively manage the bushfire risk in such a manner that Delta complies with the requirements of the Rural Fire Act 1997.
We also regularly consult with the Rural Fire Service and the local community to discuss hazard reduction burning and fire trail maintenance to minimise risk and protect neighbouring properties, wetlands, aboriginal sacred sites and heritage areas from the damage caused by fire.
We have increased the amount of ash reuse by ten per cent

29Delta Electricity Sustainability Report 2010-11
Resource inputs and waste
Fuel sourcesBlack coal and gas are the main fuel for Delta’s five power stations. We also use biomass for co-generation, waste fuel oil for starting up boilers, as well as fuel oil and mine methane as a substitute fuel.
Waste products and managementDelta provides progress reports to the NSW Office of Environment and Heritage against the NSW Government Waste Reduction and Purchasing Policy (WRAPP) every year.
Delta’s WRAPP report complements Corporate Standards and Regional Waste Management Plans that include significant waste reduction and purchasing strategies. The plan applies to all employees and contractors employed at Delta sites and facilities and sets out the requirements for the management of waste and the purchase of materials.
We have improved the waste stream management from our facilities. A single contract now covers our four coal-fired power stations and the contractor is responsible for managing all waste streams (excluding ash). This has made us more efficient in recycling, reusing or safely disposing of wastes. This year, we achieved a 10% increase in waste reuse.
Fly ash generated by coal-fired power stations is principally used in cement mixes as substitute for materials that may be energy-intensive to create. Consequently, reusing ash in cement production further reduces the total GHG emissions emitted to atmosphere. Delta is currently investigating alternative ash reuse technologies (e.g. as an aggregate for use in the construction industry). Further information in regar to this inititative can be found in the case study “Reusing ash, a by-product of coal-fired generation”.
Waste type
Waste amount (tonnes)
2010-11 2009-10
Hazardous 6,500* 0
Non-hazardous (ash) 2,157,361 2,162,370
Non-hazardous (other solid wastes)
328 275
TOTAL 2,164,189 2,162,645
Disposal method
Waste amount (tonnes)
2010-11 2009-10
Reuse (ash) 311,003 282,709
Landfill 328 275
On-site storage (ash) 1,846,358 1,879,662
TOTAL 2,157,689 2,162,646
Table 20: Total weight of waste
Table 21: Waste disposal methods
Materials
Weight/volume
2010-11
Coal (tonnes) 9,353,873
Fuel oil (kL) 9,790
Gas (GJ) 744,640
Biomass (tonnes)* 233,648
Recycled materials used
Weight (tonnes)
2010-11
Re-refined oil 919
Bagasse 171,839
Wood waste 56,524
Energy Crops 3,108
Municipal Waste 2,177
Materials
Energy consumption* (GJ)
2010-11
Coal 224,482,663
Fuel oil 377,894
Gas 744,640
Biomass (sugar mill co-generation)*
2,305,443
Mine methane 19,072
Table 17: Materials converted to energy
Table 18: Recycled materials used in energy production
Table 19: Energy consumption
wetery
*Based On Delta’s share of fuel used by the Sunshine Electricity Joint Venture.

Introduction AppendicesWorkplaceCustomersCommunityEnvironment
Figure 8: Environmental complaints and inquiries 2001-2011
Environmental management systemsDelta is committed to managing the environmental impact from our power generating activities. We continue to maintain an Environmental Management System (EMS) with ISO 14001 accreditation and meets international standards for best practice environmental management systems. Delta continues to fully comply with statutory requirements in the relevant legislation, regulations and licences issued by government authorities to ensure that our generation activities are sensitively managed and our environmental impacts minimised.
Environmental incidentsDelta received no significant fines or other penalties for non-compliance with environmental laws and regulations (for the second year in a row).
Environmental management
action based on Delta implementing a program of works, to be completed by the end of 2015, to treat all cooling water blowdown from the Wallerawang power station. We believe the mediated outcome reinforces our commitment to sustainability and working with our stakeholders as the action proposed by Delta goes significantly beyond the original concerns.
Spills Delta has had no significant spills of chemicals, oils or fuels for the last four years of sustainability reporting.
Environment complaints Delta, as part of its internal environmental compliance reporting processes, prepares a monthly and annual Business Performance Environment Report, which includes a comprehensive log of the details of environmental complaints and any actions initiated in response. There were 58 complaints and enquiries this year. This is consistent with the 10 year average of 53 complaints and enquiries a year (marked on the graph below). The complaints and enquiries log is useful for determining those issues that are of concern to the community. Further discussion of those issues is provided in the Community chapter.
There was one minor reportable licence noncompliance during the 2010/2011 year. This occurred at Wallerawang when water discharge pH level exceeded the limit. In response, Delta engaged external consultants to investigate the cause of the pH rise which was found to be due to natural causes arising from drought conditions. The Office of Environment and Heritage has amended the licence and increased the pH limit at the licensed discharge point in recognition of the naturally varying pH range of the watercourse.
In June 2009 the Blue Mountains Conservation Society lodged a summons in the NSW Land and Environment Court alleging that Delta polluted the Coxs River by discharging water that contained Salt, Copper, Boron, Zinc, Arsenic, Aluminium and Fluoride. The case had been listed for directions; however, the Society and Delta reached a mutually acceptable outcome outside of court proceedings. The mediation occurred and the Society and Delta have agreed to discontinue the legal
$50k
07-08 08-09 09-10 10-11
$40k
$30k
$20k
$10k
$0
Year
Am
oun
t
Figure 7: Fines
01-0
2
02-0
3
04-0
5
05-0
6
06-0
7
07-0
8
08-0
9
09-1
0
10-1
1
03-0
4
80
90
70
60
50
40
30
20
10
0

31Delta Electricity Sustainability Report 2010-11
Case studies
Reusing ash, a by-product of coal-fired generation
A major by-product of coal-fuelled electricity generation is ash; both fly ash and bottom ash. Bottom ash is collected from the bottom of the boilers while fly ash is a mineral matter collected in dust collection plant. There is currently a
modest and largely saturated market for fly ash reuse as a cement replacement (up to 30% by volume).
Fly ash from the more efficient power stations, such as Mt Piper, is preferred for use in cement because the ash has a low carbon content. However, when ash is used as an aggregate, its carbon content is less important and therefore the market for ash can be expanded.
Delta is seeking to develop new markets for ash utilisation. A comprehensive testing regime has been undertaken to understand ash properties as an aggregate for use in the construction industry. This work is being developed under the NSW OEH Sustainability Advantage program in conjunction with the program partners.
Delta is conducting tests with two operators to develop a road base specification using ash. We are making our specialists available to industry to help them develop an aggregate product such as road base using ash. This approach ensures that knowledge about ash products is developed within industry, making implementation more likely.
Delta will build a control road in conjunction with the RTA to monitor the performance of ash in road bases. Due to the unique properties of fly ash, it is anticipated that the use of fly ash will lead to more durable road construction production and that this will lead to a higher utilisation of ash.
Central Coast Water Management and Savings Strategy
Delta’s Central Coast power stations, Munmorah, Vales Point and Colongra are surrounded by the Tuggerah Lakes and Lake Macquarie. It is extremely important for Delta to continually identify and implement water saving strategies on the Central
Coast to decrease our reliance on local water supplies.
The Delta Central Coast Production Group has formed a Water Management and Savings Strategy Committee to formulate water savings measures. The Committee meets quarterly to review water usage, the progress of current initiatives and to discuss newly proposed savings measures.
The Committee includes management representatives from all groups within Central Coast Production. All Committee members are dedicated to developing and implementing projects that will provide real and substantial water savings for the Central Coast.
Several initiatives have already been implemented that have resulted in significant reductions in the use of drinking quality water:
- construction of a water reclamation and reverse osmosis plant to treat waste water for supply to the Vales Point demineralisation plant,
- installation of water efficient shower heads, dual flush toilets and water-saving tap washers at the Munmorah and Vales Point administration buildings and at the Vales Point Water Reclamation amenities buildings, and
- the replacement of water-based cleaning with other processes where possible.

Introduction AppendicesWorkplaceCustomersCommunityEnvironment
CommunityKey Objective
Ensure all plant operates to high environmental standards to target zero incidents and zero licence breaches.

33Delta Electricity Sustainability Report 2010-11
One of Delta’s key sustainability principles is the effective engagement with stakeholders, particularly our local communities close to our power stations. Stakeholders include local government representatives, local businesses, community organisations and schools in the regions.
We have established consultative forums in both major regions where we operate: the Western Community Reference Group in the Western Region and the Community Advisory Regional Environmental (CARE) Forum on the Central Coast.
Our local communities
Local community
These two groups meet quarterly and site visits are also undertaken when needed. The meeting agendas, minutes and presentations are made available on the Delta website.
Environmental groups are also keenly interested in the operations of the energy industry. Delta complies with a broad range of environmental licence conditions. We take our reporting obligations seriously because it is crucial to local environment groups who provide a welcome level of scrutiny to our operations.
Representatives - Community & representative groups including:
Local government
Local residents
Local schools
Local businesses
Police and emergency
services
Local environmental
groups
Rural Fire Service
NGOs
Concerns and focus Methods of engagement
- Demonstrate corporate social responsibility
including community consultation
- Support for local schools, community organisations and public amenities
- Noise, water and air quality impacts
- Operational issues
- Local and regional economy development
- Local employment and
apprenticeship opportunities
- The Western Region Forum (quarterly)
- The Central Coast CARE Forum (quarterly)
- Regional community engagement programs including sponsorship and donations (ongoing)
- Freecall 1800 recorded info. line
- Local media (issues driven)
- Website (always available)
- Occasional community newsletters
- Site tours (when needed)
- Community consultation on new projects (when needed)
- Membership of regional environment Committees: Lake Macquarie Estuary, Coastal and Floodplain Management Committee and Tuggerah Lakes Estuary, Coastal and Floodplain Management Committee

Introduction AppendicesWorkplaceCustomersCommunityEnvironment
Identifying community’s concerns
1Delta has adopted the definition of stakeholders used by the Global Reporting Initiative that stakeholders are individuals or groups who affect—or are affected by—an organisation’s activities.
As part of our commitment to sustainable business practices, we aim to ensure that our operations are understood and accepted by our stakeholders. We conduct stakeholder research to gain a better idea of the broader community’s knowledge and understanding of our business. We undertook a community survey in December 2010 to identify the community’s issues, their understanding of our core activities, daily operations and impacts and how we interact with the community1.
The survey showed that local communities had a good understanding of our activities. The community stakeholders acknowledged that Delta provides an essential service in producing reliable electricity to the state; that we contribute substantially to local employment; and we provide opportunities for employment and training of young people in the regions.
Areas of improvement included increased consultation and communication; further reductions in emissions; and a shift to low carbon forms of power generation.
The findings have been used in developing the Community and Stakeholder Engagement Plan for 2011-2013. This plan integrates the Stakeholder and Community Engagement Plan for the regions and for the corporate level. The aims for this plan have been developed and flow from the Delta Strategic Plan.
Our employee focus groups explore a range of key areas including communication, leadership, environmental performance and safety ideas to further engage with our local communities.
Stakeholder network and linkage assessments undertaken for new projects have added to our understanding of stakeholder material issues. The identification of these particular interests has helped Delta focus engagement activities on the elements of the community that have the greatest stake in Delta’s business.
We seek to address our stakeholders’ concerns through multiple channels.
We pride ourselves on our quality education for our children from K–12. This great new food techonology facility at the Portland Central School assists our local children to gain skills. Delta’s support for the Industry Links program also helps skill our kids for work and life.Neville Castle, Mayor of Lithgow, Portland Central School Careers Advisor and Industry Links Coordinator

35Delta Electricity Sustainability Report 2010-11
Engagement with local community
Community engagement is conducted along a spectrum of strategies ranging from providing information to directly consulting with the community. Delta’s approach to community consultation is to inform community representatives about ongoing operations and new developments and seek their feedback. Some operations or aspects of a proposed new development may be modified in order to address concerns raised by community members.
Community representatives on our consultative groups are residents in the small towns located near our power stations and are often active in other local community groups such as precinct committees, Landcare, progress associations and the Tidy Towns movement. Through this wide representation they act as a two way conduit for information between Delta and the broader community.
These consultative groups are effective in giving the community access to Delta’s decision-making processes and have allowed us to be more responsive to community needs and concerns.
Western Community Reference Group The immediate neighbours of our Western power stations at Mt Piper and Wallerawang include the residents of Wallerawang, Lidsdale, Cullen Bullen, Portland and Blackman’s Flat.
In late 2007, we established the Western Community Reference Group as a regular consultative forum. Representatives of local communities and other community stakeholders continue to meet to discuss operational and development matters with Delta senior management every three months. Periodically, we also consult with the community about specific new operational or infrastructure developments and conduct telephone surveys or focus groups to gauge community opinions about our operations.
Information is regularly provided to the local media and Delta managers participate in a range of committees and meetings. Through our sponsorship and donation program we support many community activities in the region. These include:
- environmental projects by Landcare groups;
- support for children and young people through sporting, arts and music organisations;
- Tidy Towns committees; and
- community events such as Celebrate Lithgow, Ironfest and Australia Day.
The Central Coast Community Advisory Regional Environmental (CARE) Forum The neighbours of Colongra, Munmorah and Vales Point power stations on the Central Coast include the people of Buff Point, Halekulani, Budgewoi, San Remo, Doyalson, Blue Haven, Windermere Park, Lake Munmorah, Chain Valley Bay, Mannering Park, Wyee Point, Wyee, Gwandalan, Summerland Point, Brightwaters, Morisset Park, Sunshine and Bonnells Bay.
For over ten years, the Community Advisory Regional Environmental (CARE) Forum has been meeting quarterly with Delta managers. The CARE Forum is made up of representatives from local progress associations and the Central Coast Environment Council. The CARE Forum helps Delta understand what the community thinks about our activities in the region.
Through our sponsorship and donation program we support many local activities, often in partnership with Wyong and Lake Macquarie Councils. This year, we have:
- ensured the amenity of local parks for families and people with disabilities;
- sponsored community events such as Australia Day and Clean Up Australia Day;
- provided support for various environmental initiatives including Landcare (see case study); and
- helped many local organisations, including Lions and Rotary Clubs, Tidy Towns, the Country Women’s Association, Cancer Council, Surf Clubs and local schools.
Minimising transport impactsDelta’s coal supplies are received from local and distant sources where the coal quality and volumes can vary due to the different fuel contracts established. Coal may be delivered to the stations by rail or road and transferred on site using overland conveyor systems. Shortfalls in coal supply may require that additional coal be delivered by road which can result in intermittent periods of high volume truck movements near the delivery station. Effective management of fuel handling systems ensures that operations are controlled to mitigate and minimise environmental impacts on our local stakeholders. Delta uses several mitigation techniques to reduce the impacts of the transport and handling of coal:
- use of private haul roads in the Western region;
- water drainage and treatment systems;
- water tankers for dust suppression on site;
- buffer zones to minimise visual and noise impacts; and
- night operations are kept to a minimum when possible.

Introduction AppendicesWorkplaceCustomersCommunityEnvironment
Engagement with local community
Donations and sponsorships Sponsorship is an important aspect of stakeholder engagement in the regional communities where our power stations are located. Delta engages in sponsorship to enhance the effectiveness of our stakeholder engagement, to support our local communities and to build a positive corporate reputation with a wider group of stakeholders.
A regional community sponsorship and donations plan has been developed as a part of the Stakeholder and Community Engagement plan with up to $200,000 committed in each region annually as well as at the corporate level. This year we provided around $750,000 through sponsorships and donations for education and community activities
2.
Delta Electricity’s Western Region sponsorships and donations go to a wide range of community, education and training, environmental, arts and cultural events and local economic development. Sponsorship support for the Australian EcoSystems Foundation has assisted the endangered Brush Tailed Rock Wallaby breeding program in the local Lithgow area. Delta also supported the Barton Park Giant Trees Arboretum, a 40 acre plus site donated by Delta Electricity along the east side of Lake Wallace in Wallerawang. Of great pride to the region is our involvement in education initiatives at the primary, secondary and post-school level to engage with young people and provide opportunities and pathways to employment in the region. Arts and cultural activities also feature strongly in Delta’s sponsorship program, including the Portland Art Prize and IronFest – Lithgow’s newest festival, as well as a host of other activities.
In the Central Coast and Lake Macquarie communities, Delta has strong links to many community initiatives. During 2010-2011, sponsorship and donation recipients included environmental projects though Landcare, local economic initiatives and Chamber of Commerce Business Awards, Rotary and Lions Club events, Tidy Towns and breakfast celebrations on Australia Day. Other local initiatives include support for Lifesaving and Surf Clubs, coastal patrols, search and rescue services and the Rural Fire Service.
Newly supported initiatives include the new Delta Sculpture Award, won by Angela Griffiths for Vanishing Point at the Kooindah Sculpture Prize Exhibition.
Since 2007, an annual $2,500 scholarship has been donated to the University of Newcastle for a student from an indigenous background studying at the Ourimbah Campus, on the Central Coast. We also provided $5,000 sponsorship for the NAIDOC event on the Central Coast that involved a Health Expo and Community Gathering at Gosford Showground.
There are also two corporate sponsorship activities. Delta sponsors the Art Gallery of NSW with a two-year sponsorship from 2010 to 2012 and a chair of Sustainability at University of Sydney for the development of alternative energy technologies and energy storage.
Delta provides dollar-for-dollar matching donations for a range of fundraising activities, including donations for organisations such as Walsh Cancer Fund, Australia’s Biggest Morning Tea, SIDS, Red Nose Day, Smith Family, Careflight, Salvation Army, Lithgow PCYC and Portland Pool.
Delta also maintains the Energy Expo located near Mt Piper. It is a display of the technology used in the production of energy efficient electricity. Interactive exhibits have been designed to provide an insight into what electricity is, how it is made and how it is distributed. It is a popular destination for school excursion groups. We conduct tours of Mt Piper for school groups and interested community members on a daily basis.
Staff volunteer program We will be developing a staff volunteer program as part of our Community and Stakeholder Engagement Plan for 2011 –13 and it is part of our Sustainability Scorecard targets. By complementing our sponsorship and donations with a corporate volunteer program we aim to enhance sustainability by further contributing to robust and resilient communities in our areas of operation.
Our staff can offer diverse skills and experience to help deliver community services, to provide specific technical and professional expertise, to help provide leadership on community boards and committees, and to help promote and build support for programs.
We will be investigating existing staff involvement in community activities to identify staff interest in activity types. We are also exploring ways to encourage our staff to become more involved in community activities and to support them once they are involved. Some ideas have included volunteer information programs and integrating volunteer activities into the Step Ahead recognition program.
Continued
2 Includes the corporate payment of $200,000 to University of Sydney for Chair of Sustainability.

37Delta Electricity Sustainability Report 2010-11
Our institutional stakeholders include the two shareholding Ministers of the NSW Government, local mayors and council members and the Members of Parliament for the electorates where we operate.
The performance agreement between the Board and the Voting Shareholders is in the form of an Annual Statement of Corporate Intent. Quarterly performance reports are provided to the Voting Shareholders with six-monthly meetings arranged
Our other major stakeholders
Delta has been focusing on identifying and engaging with our stakeholders for over a decade. Identification of the most influential groups such as customers, shareholders, local communities and staff is clear and unambiguous. We also identify other less obvious groups, which often require greater analysis to understand their more complex concerns and different focuses and we seek to find ways of engaging with them..
to discuss progress against the objectives set out in the Statement. A meeting with the Voting Shareholders is held to discuss and agree each forthcoming Annual Statement.
New local NSW Members of Parliament were offered briefings and tours of Delta’s operations after the March 2011 NSW elections. Several accepted the offer which provided us with great opportunities to showcase our operations, initiatives and local commitment, and provided a good foundation for future engagement.
Shareholders
Representatives Concerns and focus Methods of engagement
Shareholders & Portfolio Minister,NSW & Australian Government MPs
- Cost and production efficiency- Reliability
- Contentious issues including environmental and social impacts- Carbon reduction
- Formal management arrangements- Statutory reporting
- Compliance reporting
- Regular briefings on relevant issues- Launches
Representatives Concerns and focus Methods of engagement
Customers (electricity retailers)
- Demonstrate professional integrity and expertise
- Maintain the highest level of customer satisfaction
- High levels of contact including regular face-to-face meetings
- Conferences & industry forums
Customers
Delta undertakes an annual customer satisfaction survey with our retail customers. This provides a direct measure of our successes and possible areas of improvement in our marketing communications. The survey results are explained in more depth in the Customer Section—Marketing communications.

Introduction AppendicesWorkplaceCustomersCommunityEnvironment
Our other major stakeholders Continued
Industry
We also provide a range of industry-based scholarships including a PhD Scholarship in Chemical Engineering at University of Sydney. We offer general scholarships to the University of Newcastle, one indigenous scholarship and two TAFE scholarships at the Ourimbah campus. In the Western Region we provide a range of scholarships including three scholarships to the University of Wollongong and one to Charles Sturt University.
General community
We undertook a community survey in December 2010 to identify community issues; the community’s understanding of our core activities, daily operations and impacts, and how successfully we interact with the community. The findings were used in developing the Community and Stakeholder Engagement Plan for 2011–13.
Representatives Concerns and focus Methods of engagement
Industry
- Demonstrate professional integrity and expertise
- Provide information on Delta, sustainability & energy reliability and leadership on energy generation issues
- High levels of direct contact website
- Industry & environment conferences & forums and publications
- Chambers of Commerce
- Engagement with peak industry and other groups
- Chair of Sustainability
Representatives Concerns and focus Methods of engagement
General community
- Reliability of electricity supply
- Water use and quality
- CO2 emissions & climate change
- Press and broadcast media comment
- Delta’s website
In September 2010 Delta hosted the annual Power Industry and Fire Safety Games. The games provide a competitive framework to build fire management, safety and first aid skills among participants in realistic industry specific scenarios. Fifteen teams from the power industry competed. Delta Central Coast Senior Team completed the games as the overall winner and the Delta Western region team came in second place.

Employee engagement is a key initiative in Delta’s Strategic Plan. Engagement in setting and achieving sustainability goals is vital to the future success of Delta.
39Delta Electricity Sustainability Report 2010-11
Employees
Employee engagement is a key initiative in Delta’s Strategic Plan. Engagement in setting and achieving sustainability goals is vital to the future success of Delta. We understand that to make sustainability the foundation of our business we must have participation and ownership from all levels of the organisation (see Workplace section).
Suppliers
Delta’s suppliers of goods and services, including contractors, are also stakeholders. We have established communication channels and management processes to ensure that timely, understandable information is available to help suppliers to effectively and safely provide their goods or services.
Representatives Concerns and focus Methods of engagement
Employees
- Employee engagement
- Engage staff in environmental initiatives
- Engage staff in community initiatives
- Step Ahead and recognition program
- Donations Program
- Internal communications
- Apprenticeships program
Representatives Concerns and focus Methods of engagement
Suppliers
- Demonstrate corporate social responsibility through support for local chambers of commerce and local business networks
- Local and regional economy development
- Sponsorship of annual business awards.
- Direct engagement with business networks in the regions
- Policies to support regional economic development
- Membership of local chambers of commerce

Introduction AppendicesWorkplaceCustomersCommunityEnvironment
Our other major stakeholders Continued
Representatives Concerns and focus Methods of engagement
Media
- Predominantly local operational issues, environmental impacts and new developments
- Briefings, interviews and media
- Releases
- Site tours & launches
Representatives Concerns and focus Methods of engagement
Education Sector
- New developments
- Information and education
- Energy Expo
- Chair of Sustainability engagement
- Student scholarships
- Curriculum support
- Apprenticeships agreements
Media
Delta recognises the importance of the media as a stakeholder in their own right as well as a communication channel to other stakeholders either at the local, regional, or state level. We provide information on our website specifically for the media.
Education Sector
The Mount Piper Energy Expo at Mt Piper power station is open to visitors every day of the year. Its exhibits showcase how electricity is produced and distributed, the importance of electricity to the history of the region and developments in sustainability and renewable energy. Guided tours of the Mt Piper are held daily.
We provide primary schools with curriculum support on electricity. We also give presentations and tours to high schools and universities (and overseas delegations). Over 5,500 people visited the Energy Expo and toured Mt Piper during 2010-2011 (including children from 91 schools).

41Delta Electricity Sustainability Report 2010-11
Delta Art Prize opens doors for sculptor Delta Electricity has sponsored the Kooindah Sculpture Exhibition on the Central Coast by donating a $3500 prize for a highly commended work at the exhibition.
John Koller represented Delta Electricity and presented the highly commended award to Angela Griffiths for her Antarctic sculpture lit by LED lights set in porcelain, Vanishing Point.
This was the first year that Delta has sponsored the Kooindah Exhibition.
“We were involved with the local art festival for a number of years but unfortunately that fell over,” said John.
“The Kooindah Exhibition is a renewal of that festival and it is very professionally run by the local Rotary Club. We felt it was important to play a part in this exhibition which is well-loved by the community and create our own prize to recognize other artists beyond the winner.
“The prize really worked for me. I think it was the springboard that helped me to be included in the next Sculpture by the Sea exhibition in Sydney,” Angela said.
You can see more of Angela Griffiths’ work at angelagriffiths.com.
Supporting landcare on the Central CoastDelta has entered into a co-sponsorship arrangement with Wyong Council to provide funding to support Landcare groups. Our particular focus is helping with areas in the communities surrounding Vales Point power station.
John Koller, Commercial Manager, ‘Delta is more than happy to support the community and the environment
through the Council’s Landcare network. We have been happy with the results and we receive regular reports from the council of how the funds are spent.’
‘It’s a great arrangement between two organisations committed to helping out the community.’
Some of the initiatives supported by Council and Delta include supplying:
- timber, hardware, native plants, a new splatter gun and funds towards a new trailer for Budgewoi Beach Dunecare;
- native plants and materials to both Chain Valley Bay South and Colongra Bay Landcare;
- tree guards, native plants and materials to Buff Point Landcare;
- tools and native plants to both Lake Munmorah and Lakes Beach United Landcare;
- shed and gazebo to Kanwal Public School Junior Landare;
- tools, plant and shirts to Gwandalan/Sunderland Point Tidy Towns/Landcare; and
- tools and equipment to San Remo Tidy Towns/Landcare.
Delta continues to sponsor the Wyong Shire Council Schools Environment competition and also sponsors the Wyong Eco Park.
In addition, in the past year, Delta has put $16,500 towards the construction of a barbecue and shelter at the park on Narambi Road Buff Point, and will supply three bench seats for the lake walkway at Mannering Park.
Wyong Mayor, Bob Graham, said council was thankful for Delta’s financial support.
“All of the projects we have been involved in with Delta have been a wonderful improvement to the areas,” Mayor Graham said.
“Our Landcare teams do a great job, and to be able to complete so many projects just wouldn’t be possible if it wasn’t for Delta’s generous sponsorship.”
Case studies

Introduction CustomersCommunityEnvironment AppendicesWorkplace
WorkplaceKey Objective
Ensure practices are in place that support business goals; get the job done efficiently and foster skills development.

43Delta Electricity Sustainability Report 2010-11
We value our highly skilled workforce and we are continuing to develop innovative work structures to maintain a competitive place in the regional labour market.
The total number of Delta employees at the end of the reporting period was 688. This was a reduction of 45 from the previous year. Delta’s workforce is made up of 652 full-time staff, 13 part-time, 8 casual, 6 fixed-term contract and 9 temporary university students. Staff is distributed across the regions with 332 on the Central Coast, 289 in the Western Region and 67 in the Sydney Head Office.
The Western workforce has responded positively to the significant change in operating mode under the Gentrader arrangements. As a part of the transition, the Western region underwent a restructure that combined the Delta Maintenance Western staff with the Production Group. Consultation on the restructure was undertaken that involved all affected employees. The maintenance workforces converged into a single unit that focuses on routine and defect maintenance and the management of outage works and major projects.
On the Central Coast, the effects of reduced operations of Munmorah are being partially offset by the operation of Colongra and by some staff retirements.
Contractors and sub-contractorsDelta uses a significant number of contractors to work on power stations. The total number for at the end of the reporting period was 3,346, an increase from 3,097 last year.
Labour/management relationsDelta’s commitment to employee engagement is demonstrated in our communication and consultation processes with employees.
A communication plan provides focus for internal communications and defines responsibilities for disseminating information across the organisation. It includes both formal and informal staff briefings, staff newsletters, notifications and weekly updates to all staff concerning issues that affect Delta. All staff members are connected to our intranet where they can access information concerning their employment and our operations.
We encourage opportunities to engage with staff in consultative processes including union representations. Delta has maintained close working relationships with Unions NSW and with union representatives, with regular forums to identify issues at an early stage.
All of these activities have resulted in increasing the alignment to our mission and values and a reduction in industrial disputes.
Employment at Delta
Figure 9: Total staff numbers
2007-08
Central Coast Western Region Sydney
2008-09 2009-10 2010-11
391
391
292
292
401
401
300
300
375
375
290
290
289
289
332
332
6161 636
3
6868
6767
Employee engagement Employee engagement is a key initiative in Delta’s Strategic Plan and part of our new Sustainability Scorecard. Employee engagement is the emotional and intellectual extent to which employees commit to their work and the vision and mission of the organisation. A sense of permission and empowerment positively contributes to our ability to achieve our sustainability goals.
We are embedding sustainability into the corporate culture through resource teams, new employee orientation and training, alignment in staff communication related to corporate sustainability goals and an annual survey.
Our target for this year is developing a methodology to measure our employee engagement and to establish our benchmark. Previously we have used qualitative data but we intend to develop a score or quantitative measure to define our performance from year to year.

Table 22: Trends in the representation of EEO Groups1
% of total staff2
EEO group 2011 2010
Woman 11% 10%
Aboriginal people or Torres Strait Islanders
1.5% 1.0%
People whose first language is not English
6% 6%
People with a disability 5% 6%
People with a disability requiring a work-related adjustment
2% 2.5%
1. Staff numbers are as 30 June 2011.2. Excludes casual staff.
Figure 10: New employees in 2010-11
Introduction AppendicesWorkplaceCustomersCommunityEnvironment
Fairness and equityEqual Employment Opportunities (EEO)Delta supports the principles of Equal Employment Opportunity (EEO). The percentage of employees at Delta that are representative of the different EEO groups is outlined in Table xx. The table indicates a slight increase in most of the group areas, apart from people with a disability.
The distribution number of EEO groups across the organisation is outlined in Table xx and shows a good distribution of groups compared with the benchmark. Delta Electricity ensures that our recruitment process is non-discriminatory.
In addition, our policies and procedures include ongoing training to ensure a workplace free of harassment, discrimination and bullying. During 2010/2011, these procedures were reviewed and updated.
Cultural Diversity Delta recognises the importance and benefits of cultural diversity to our organisation and to the community at large. Delta’s Multicultural Policies and Services Program identifies objectives and targets relating to social justice, community harmony and cultural opportunities.
There were no complaints of discrimination lodged against Delta on the grounds of race, colour, sex, religion, political opinion, national extraction or social origin. Delta does not accept bullying, harassment or discriminatory behaviour and will take disciplinary action when instances are identified. We have a Prevention and Management of Bullying, Harassment and Discrimination Complaints Procedure which clearly describes how these incidents will be identified and investigated and ensures that all complaints will be managed confidentially, seriously and with sensitivity.
Employing womenOf new employees employed by Delta in 2010-2011, 37% were women. Delta continues to encourage employment opportunities for women, particularly those in non-traditional roles. This includes promoting apprenticeship and engineering opportunities at school information sessions and career days.
An accelerated development program is run by Delta mentoring the next level of management, with a 30% participation rate by women.
Supporting people with a disabilityDelta is committed to ensuring that equal opportunities exist for people with disabilities, enabling their maximum participation and contribution in the workforce. Our Disability Plan addresses three key result areas, these being employment, access and communication/reporting.
During 2010/2011, our plan focused on Delta’s internal recruitment processes, ensuring that opportunities are made to assist those with a disability in entering and maintaining employment. Delta has a commitment for making workplace adjustments to accommodate staff with specific needs.
Employment at Delta Continued
37%37%
63%63%
FemaleMale

Delta’s communication plan provides focus for internal communications and defines responsibilities for disseminating information across the organisation.
45Delta Electricity Sustainability Report 2010-11
Employee benefitsDelta provides staff with access to a range of benefits over and above legislative requirements including:
- Additional employer superannuation contributions;
- Access to a range of salary sacrifice arrangements;
- Reimbursement of fitness fees;
- Study assistance;
- Opportunity to work flexible arrangements;
- Staff Enterprise Agreement;
- Reward and recognition program to acknowledge individuals/teams/projects that have demonstrated an outstanding work commitment or an innovative and flexible approach to the achievement of significant performance objectives;
- Employee assistance program provides counselling services to members of staff and their families;
- Influenza vaccinations are made available free of charge and health monitoring of at-risk staff members, including health checks, skin checks and Dust and Disease Board lung x-rays; and
- Access to a Business Success Payment based upon the achievement of key business measures for each Business Unit across Delta.
Staff retentionWe conduct an annual review to determine Delta’s workforce profile and future skill needs. This includes a review of positions that are deemed critical to our ongoing operations. This work provides the basis for future succession strategies.
This year, the staff turnover has continued to remain low with a turnover rate of around 6%. The low turnover rate is due to , in part, to the significant number of staff who have defined benefit superannuation arrangements that maximise benefits towards the end of a person’s career. In addition to the employee benefits, this type of scheme has encouraged staff to remain with Delta.
Fraud and corruption preventionDuring the year, the existing Delta policy on fraud prevention was replaced by a new Fraud and Corruption Prevention Standard. A Compliance Management System (CMS) was established to assist staff to comply with legislation and other requirements that apply to their area of operation or management. The CMS requires that all business units prepare a compliance plan and maintain policies, procedures and standards for minimising business risk, including prevention of fraudulent and corrupt behaviour.
The Legal and Compliance Manager reviews all new laws, standards and voluntary codes relevant to Delta and then nominates and consults with the business unit responsible. All business units are required to develop compliance plans for their operations. Compliance plans include processes and procedures to control or mitigate risks and include training requirements. A mandatory fraud and corruption prevention training course has been developed and introduced across all Delta’s sites.
Delta has had no incidents of corruption and has not had to take disciplinary or legal action against staff, contractors, or suppliers in this period.
Code of conductDelta’s Code of Conduct was reviewed and updated in April. It is essential that it remains up-to-date to assist us in making decisions that reflect the high standards expected of us by our stakeholders, customers, suppliers and ourselves. The review was undertaken in conjunction with our auditors and includes additional confidentiality and security requirements that have arisen from the Gentrader contracts.
Delta has had no incidents of corruption and has not had to take disciplinary or legal action against anyone.

Introduction AppendicesWorkplaceCustomersCommunityEnvironment
Workplace safety
Occupational Health and Safety
Minimising workplace risksThe safety of everybody on our power station sites and corporate offices remains the highest priority for Delta. A strong consultative structure exists within the organisation that ensures all concerns are considered and safety continually improves. We regularly evaluate our occupational health and safety performance, policies and procedures.By applying strict standards on plant isolations, including a lock out system, and successfully implementing a behaviour-based safety system (D-ZIP), Delta has achieved continual improvement in safety performance.
We continue to develop our risk management activities, increase the focus on leadership development and reinforced Delta’s commitment to ensuring that everyone remains safe at work. This has resulted in increased understanding of safety hazards associated with our operations and the development of strategies to eliminate hazards or to mitigate the risks of injury to personnel.
Delta’s lost time injury frequency1 improved (from 4.1 in 2009-10 to 3.7) and analysis of all injuries showed a reduction in the severity of injuries. The results for the last five-year period show a low lost time injury is being maintained.
Behavioural-based safety systemDelta’s behavioural-based safety system, D-ZIP, was reviewed during the 2009-10 year resulting in the development of a refresher-training package that re-emphasises the original concepts of behavioural based safety. In 2010-11, the majority of staff members have undertaken this package with additional sessions scheduled to capture the rest of the staff.
WorkCover Self Insurance OHS Audit Delta holds a Self Insurer’s Licence that allows us to carry our own underwriting risk and manage our own claims administration. WorkCover requires that we meet the strict criteria of the licence. In May, WorkCover undertook a Self Insurance OHS Audit at Vales Point to verify whether our OHS Management System complied with the requirements of the licence.
The audit result for OHS Risk Management was 91% and for OHS Measurement, Evaluation and Review was 84%. To achieve these high levels of compliance requires a high commitment and positive attitudes to health and safety by staff at all levels.
Lock Out Isolation System
The Lock Out Isolation System, implemented in late 2008-09, has significantly reduced the safety risk associated with plant maintenance and strongly underpinned Delta’s low injury frequency rate.
1 The frequency rate represents the average number of lost time injuries (LTIs) on a staff number basis. The frequency is calculated: (Total lost time injuries x 1,000,000)/(Average number of staff during past 12 months x 2,000).
Delta’s lost time injury frequency improved (from 4.1 in 2009-10 to 3.7) and analysis of all injuries showed a reduction in the severity of injuries.
4.1 3.7

Individuals and teams that have demonstrated behaviour that support sustainability are awarded by the Chief Executive and recognised across Delta.
47Delta Electricity Sustainability Report 2010-11
Lost time injuriesDelta’s lost time injury (LTI) improved (from 6 to 5) and analysis of all injuries showed a reduction in the severity of injuries. The results for the last six-year period show a continuing reduction.
Work-related fatalities
There were no work-related fatalities involving Delta employees or contractors for the financial year 2010-11.
Occupational diseasesThere were fifteen industrial deafness claims (all ex-employees) lodged in 2010-11. It should be noted that the industrial deafness claims are excluded from the overall LTI rates.
OH&S trainingDelta has identified a number of potential workplace hazards that may lead to serious disease. These include exposure to asbestos and other dangerous chemicals and risk from fatigue and anxiety. Delta has developed procedures and training and information packages to manage these hazards.
Counselling and the Employee Assistance Program
Delta operates an Employee Assistance Program (EAP) to support and provide counselling to members of staff and families in need. Participation in EAP is voluntary and confidential. Employees with personal problems or issues are encouraged to seek assistance and are assured that it will not affect job security, leave or any other entitlements.
Counselling is available for a wide range of issues including substance abuse, relationships, financial and legal concerns, disability, health and retirement. Reports are provided which protect the anonymity of participants while allowing Delta to adapt practices and manage issues within the workplace.
This year 49 employees benefited from Delta’s EAP through 111 counselling sessions.
Prevention and risk controlDelta runs a fitness fee reimbursement scheme to encourage our staff to keep physically and mentally healthy. The scheme reimburses half of fees, to a maximum of $250, for a range of activities that provide for aerobic fitness. These include gym and swimming centre membership, entrance fees for some sporting events and some sporting club memberships.
Each year, influenza vaccinations are made available to staff free of charge. Several medical checks are used routinely to monitor at-risk staff members, including heart checks, skin checks and Dust and Disease Board lung x-rays.
Table 23: Lost time injuries (employees)
2005-06
77
2007-08
77
2008-09
77
2009-10
66
2006-07
5.6
5.6
2010-11
55
Figure 11: Lost time injuries (contractors)
2007-08 2008-09 2009-10 2010-11
3355
88
2255
22
33
11
Western Central Coast Delta Maintenance
22
Contractors are engaged to complete a project or task for a specified term (outage jobs, maintenance jobs etc). Subcontractors are engaged by contracting businesses (not directly by Delta).

Table 24: Training hours by employee category
Employee categoryAverage days/employee/year
Administrative officer 3.3
Adult Apprentice 1.51
Engineering officer 5.31
Operator 7.79
Professional officer 5.09
Powerworker 2.09
Contract Manager 2.08
Tradesperson 5.39
Trainee temporary -
Casual administration officer -
University students (temporary work experience)
1.58
Contract staff (fixed term) 0.05
Average 5.12
Introduction AppendicesWorkplaceCustomersCommunityEnvironment
Training & Development
Training and educationDelta has clear policies on training and development. Delta’s skills portfolio is supported by role definition incorporating a competency framework, a performance management system, workforce planning framework and a budgetary commitment to ensure maintenance of the skills needed to run the business.
With a high proportion of long tenure employees (i.e. with greater than 20 years service) our staff is characterised by workers with strong technical skills and extensive experience in their fields. Delta’s commitment to scholarship and apprenticeship schemes assists in building an experienced employee pool that can support our operations and industry needs into the future.
Delta’s compulsory training package is designed to help maintain a high standard of conduct and behaviour, safety and environmental awareness. The majority of the compulsory training is delivered via 19 training modules on Delta’s intranet. Some of the modules include fraud and corruption prevention, compliance management, inappropriate workplace behaviour, workplace inspections and environmental awareness.
The average training days/employee/year for this year was 5.1 (down from 5.5 from last year). The average number of training days per year is calculated without reference to the types of training undertaken. The average is reasonably stable but in some years the rollout of system upgrades or new software packages can increase the annual figure.
Figure 12: Training hours per employee
2006-07
7.1
7.1
2008-09
7.2
7.2
2009-10
5.5
5.5
2010-11
5.1
5.1
2007-08
5.8
5.8
5.12The average training days/employee/year for this year was 5.12 (down from 5.5 from last year).
TRAINING HOURS

We continue to develop our risk management activities, increase the focus on leadership development and reinforced Delta’s commitment.
49Delta Electricity Sustainability Report 2010-11
Performance and developmentWe conduct formal performance reviews biannually and consider the skill sets required for current and future responsibilities. We have a strong focus on technical training to support our business objectives and we have developed the capacity to deliver technical training in-house to further support the sustainability of Delta’s skill sets. Delta is also committed to implementing leadership training with programs currently being rolled out or in development.
The development of employees not only builds upon the effectiveness of a person in their role, but also supports the maintenance of a safe workplace. Through Delta’s Performance & Development Agreement, training opportunities are identified and monitored at each of the review periods. These agreements are reviewed at both six and 12 months, and enable discussions to be held concerning performance on the job and other workplace matters (e.g. training).
To effectively manage the impact that future staff losses will have upon Delta’s operations and to enhance the effectiveness of Delta’s staff, a range of initiatives have been introduced that focus upon the development of current and future employees.
Access to external training is available to staff where appropriate and support is provided for external study for both current and future positions. A Chief Executive Scholarship has also been provided to staff within Delta, with the successful candidate undertaking full-time study on full pay at a tertiary institution for a year.
Sponsorship was provided through training organisations to support 18 new apprenticeships, bringing the total number of sponsored apprenticeships to 66, including three trainee riggers. A range of sponsorships have been offered to engineering undergraduates at Newcastle and Wollongong universities. The sponsorship includes financial support of studies and opportunities for work experience at a Delta site. Additional placements for work experience are also offered to university students during semester breaks.
As part of our membership of the Australian Power Institute (API), Delta supports the development of power engineering skills. The API facilitates a range of bursaries and work experience placements with its member organisations. Overall we have provided some level of sponsorship to nine people at University during this period. We have also provided approximately 20 industrial placements for the period..
Figure 13: Apprentices
2222
5252
2 3
2121
4949
2 2
2525
6767
3 4
2525
6767
3 2
1818
9999
0 2
2007-082006-07 2008-09 2009-10 2010-11
Number of apprenticeships offered Total number of apprenticeships Female apprenticeships offered Indigenous apprentices offered

Introduction AppendicesWorkplaceCustomersCommunityEnvironment
Case studies
Step AheadStep Ahead, a staff engagement initiative, has been developed as part of Delta’s involvement in the NSW Office of Environment and Heritage Sustainability Advantage program. Step Ahead has been developed to encourage the recognition of behaviours aligned to Delta’s Mission Statement. The program recognises individuals and teams that have actively demonstrated behaviour that supports sustainability. The option also exists for rewards to be considered as part of the recognition process.
The areas encompassed by the Step Ahead program include:
Keeping safeEnsuring we have a safe working environment is very important. We have a comprehensive safety program to ensure we work as safely as possible.
Valuing teamwork Our people are our greatest asset and they make a difference in the work we do and the essential service that we provide. Delta provides challenging and varied work opportunities and a commitment to ongoing development and rewards for success. We value diversity and a positive and productive team environment.
Working efficiently Efficiency at Delta is about working smarter, minimising use of resources, improving our systems, embracing innovation, sharing information and thinking creatively. Greater efficiency helps us drive down costs and boost our competitiveness.
Protecting the environment We aim to work beyond environmental compliance. We continue to research and invest in ways to reduce emissions and recycle wastes.
Being socially responsible We recognise that not only do we provide an essential service to the community but we are also very much part of the community. We seek out opportunities to build and improve our relationships in our local areas and to support and endorse community initiatives.
What it is achievingWe are moving towards a more strategic approach to employee engagement in corporate sustainability activities. Motivations have developed from personal passions into organisational incentives, such as performance reviews, and have potentially even become part of employees’ career paths.
Individuals and teams that have demonstrated behaviour that support sustainability are awarded by the Chief Executive and recognised across Delta in our quarterly newsletter, DeltaWeb.
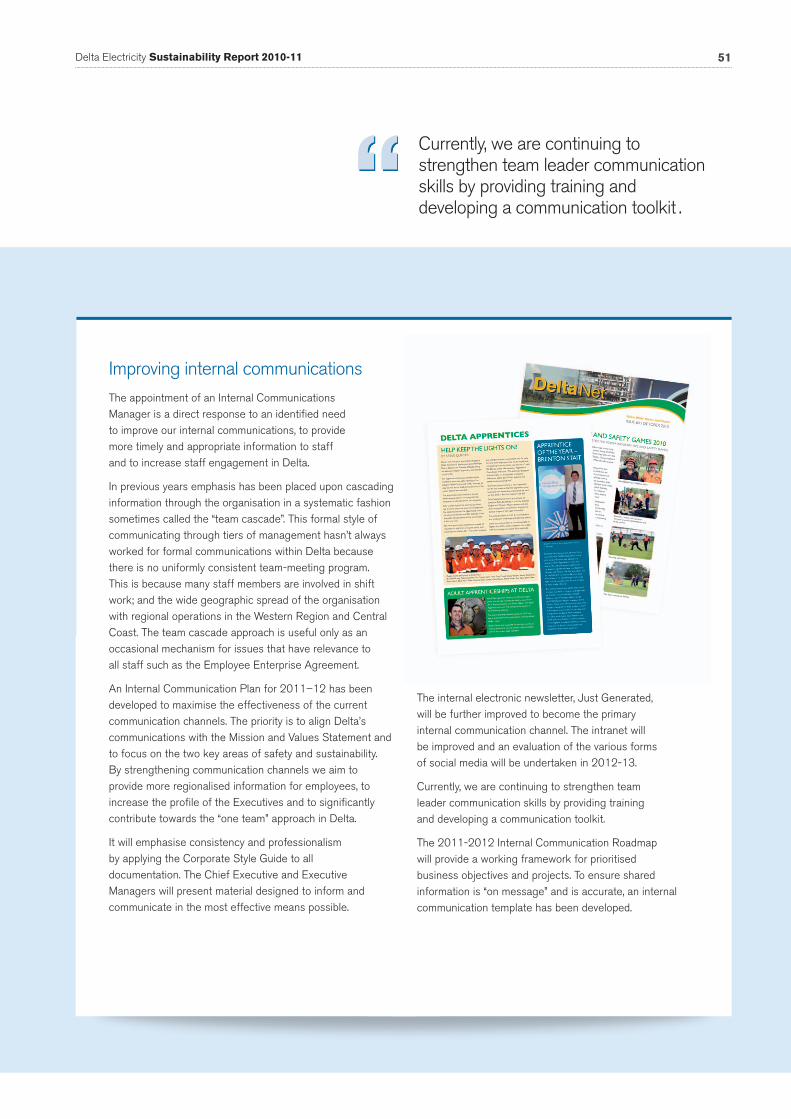
51Delta Electricity Sustainability Report 2010-11
Improving internal communicationsThe appointment of an Internal Communications Manager is a direct response to an identified need to improve our internal communications, to provide more timely and appropriate information to staff and to increase staff engagement in Delta.
In previous years emphasis has been placed upon cascading information through the organisation in a systematic fashion sometimes called the “team cascade”. This formal style of communicating through tiers of management hasn’t always worked for formal communications within Delta because there is no uniformly consistent team-meeting program. This is because many staff members are involved in shift work; and the wide geographic spread of the organisation with regional operations in the Western Region and Central Coast. The team cascade approach is useful only as an occasional mechanism for issues that have relevance to all staff such as the Employee Enterprise Agreement.
An Internal Communication Plan for 2011–12 has been developed to maximise the effectiveness of the current communication channels. The priority is to align Delta’s communications with the Mission and Values Statement and to focus on the two key areas of safety and sustainability. By strengthening communication channels we aim to provide more regionalised information for employees, to increase the profile of the Executives and to significantly contribute towards the “one team” approach in Delta.
It will emphasise consistency and professionalism by applying the Corporate Style Guide to all documentation. The Chief Executive and Executive Managers will present material designed to inform and communicate in the most effective means possible.
The internal electronic newsletter, Just Generated, will be further improved to become the primary internal communication channel. The intranet will be improved and an evaluation of the various forms of social media will be undertaken in 2012-13.
Currently, we are continuing to strengthen team leader communication skills by providing training and developing a communication toolkit.
The 2011-2012 Internal Communication Roadmap will provide a working framework for prioritised business objectives and projects. To ensure shared information is “on message” and is accurate, an internal communication template has been developed.
Currently, we are continuing to strengthen team leader communication skills by providing training and developing a communication toolkit .

AppendicesWorkplaceCommunity CustomersIntroduction Environment
CustomersKey Objective
Leverage exceptional relationships to achieve business success. Secure revenue premiums above market prices for sales.

Delta Electricity is the largest capacity electricity generator in the National Electricity Market (NEM) with an installed capacity of almost 5,000 megawatts. Our generators produce around 12% of the electricity needed by consumers in the NEM. As a wholesaler we have a limited number of customers which are major Australian electricity retailers and some major industrial loads.
53Delta Electricity Sustainability Report 2010-11
In December 2010, the NSW Government contracted the generation trading rights of the western region power stations, Mt Piper and Wallerawang, to TRUenergy (Gentrader). The contract terms are 33 years for Mt Piper and 19 years for Wallerawang.
The Gentrader model keeps ownership of the power stations with the NSW Government but sells the rights to trade the electricity in the wholesale market to a privately owned entity under Generation Trading Agreements (GTAs).
Delta continues to operate and maintain Mt Piper and Wallerawang power stations in compliance with all relevant laws, including the National Electricity Rules and the GTAs. TRUenergy undertakes all National Electricity Market related energy and ancillary services offerings and rebidding and Delta provides to TRUenergy all information to make such offers and rebids. TRUenergy takes title of all energy sent out from the western power stations and the related market risk.
Because only the western power stations operate under GTAs, and Delta retains market responsibility for its Central Coast power stations, a new structure for Delta was required to protect the respective commercial interest of Delta and TRUenergy.
In response, we have established the Gentrader management group that is responsible for managing Delta’s obligations under the GTAs. The Gentrader management group is physically separated from the Delta’s remaining NEM trading functions associated with the Central Coast plant. The management group’s key objectives are to ensure compliance with requirements, to maximise value for Delta, to minimise risks and costs and to maintain business performance and profitability.
Ensuring the maintenance of a mutually beneficial relationship with TRUenergy is critical to the success of both parties under the GTAs. Delta has developed a positive relationship with TRUenergy and looks forward to this continuing for the term of the contracts.
Gentrader process

AppendicesWorkplaceCommunity CustomersIntroduction Environment
Performance
Mt Piper
Mt Piper set a new record for annual production of 10,003 GWh (as generated). This was its first full year of continuous operation with both units upgraded to 700MW capacity.
WallerawangWallerawang achieved monthly energy production records in April, May and June, with a high level of reliability due to the major plant upgrades that have occurred over the last two years. There were no restrictions in energy production in the western region arising from limited water supplies. Wallerawang’s generation in 2010-11 increased by 1,400 GWh, to a record output of 5,541 GWh (as generated).
Wallerawang Unit 8 completed a major upgrade outage. This upgrade included low pressure blade replacement, condenser replacement, boiler economiser replacement and the full removal of the cooling tower asbestos packing and replacement with new plastic packing. The asbestos replacement job was completed in a record time for a large parabolic cooling tower in Australia.
The $13 million reverse osmosis plant at Wallerawang and the ten-kilometre pipeline between Wallerawang and Mt Piper were commissioned as part of our strategy to improve water discharges from Wallerawang.
The reverse osmosis plant removes salt and trace elements from water used in cooling. The pipeline transports the waste stream for further processing in the brine concentrators at Mt Piper.
A series of new high voltage transformers was successfully installed at Wallerawang in preparation for TransGrid’s upgrade of the the local transmission network.
ColongraThe Colongra gas-fired power station has been fully consolidated into Delta’s portfolio. It operated as planned, coming into service for short periods of time when electricity demand and prices were higher. It can achieve full load in less than 20 minutes if required.
Colongra successfully demonstrated its “black start” capability during 2010. Colongra and other generators were engaged, by the Australian Energy Market Operator (AEMO), to help demonstrate how the national electricity network would be brought back online in the event of a catastrophic event. Delta’s annual black start demonstration was extremely successful, testing Colongra in a real world situation and delivering to the high standards required by AEMO. This capability significantly increases NSW supply security in the event of a total grid blackout.
Production performanceDelta’s electricity production for 2010-11 was 21,501 GWh sent out, which was negatively impacted by a lower than expected demand for electricity. Our production was 22,163 GWh sent out in 2009-10. The plant achieved high levels of reliability with the overall plant availability well above budget at 90.88% and forced outage factor at the excellent level of 2.0%.
Equivalent Forced Outage Factor (EFOF) for the Delta portfolio was 1.94%, representing world class reliability and being the third year in a row where EFOF of around 2% was achieved.
The new GTA arrangement with TRUenergy provides further incentive to increase reliability and availability. Availability losses can result in Delta paying damages if adequate reliability is not achieved.
Vales Point Power Station turbine outage works

Wallerawang’s generation in 2010-11 increased by 1,400 GWh, to a record output of 5,541 GWh (as generated).
55Delta Electricity Sustainability Report 2010-11 55
MunmorahIn 2010-11, Munmorah was only operated in July and August 2010. Munmorah units have been placed into storage and can return to operation within six months if required by market conditions. The Munmorah site is being maintained in standby mode with environmental and safety risks being managed to meet our environmental management plans, environmental licences, safety requirements and obligations to the regulators.
Vales PointBoth units at Vales Point operated reliably despite being due for significant maintenance work. Maintenance on both units is planned to be completed during 2011-12. A new generator transformer was successfully installed on Vales Point Unit 6 within the planned outage programme.
Arrangements for the final stage of demolition and removal of the A-Station have been completed and work will commence during 2011-2012. Vales Point A-Station was decommissioned in 1989 due to surplus capacity and major components were removed in the 1990s.
10,0
03 G
Wh
10,0
03 G
Wh
5,90
9 G
Wh
5,90
9 G
Wh
5,54
1 G
Wh
5,54
1 G
Wh
172
GW
h
57 G
Wh
Mt Piper Vales Point Wallerawang Munmorah Colongra
10,003 GW
h
Figure 14: Production 2010-11 (as generated)
Equivalent Forced Outage Factor (EFOF) for the Delta portfolio representing world class reliability.
1.94%

AppendicesWorkplaceCommunity CustomersIntroduction Environment
Improving the efficiency of our portfolio is an important, cost-effective strategy to increase production without having to invest in building further plants.
We have improved our coal-fired generation efficiency by 0.9% this year largely as a result of implementing the following improvements:
- Major works to restore baseline thermal efficiency at Vales Point were carried out during unit maintenance outages; and
- Modifications at Wallerawang to optimise the combustion systems and to improve cooling tower efficiency:
• Modificationtobafflesanddamperstoimprovedistributionof air to burners, which will improve combustion;
• Controlsystemtuningtooptimiseperformance,whichwill improve responsiveness to load changes; and
• ReplacementofUnit8coolingtowerpackwiththeaim of achieving an improvement in cooling range.
Reliability and availabilityAvailability and reliability are two of Delta’s key performance indicators and are central parts of Delta’s strategic and business planning processes. The recent excellent performance of Delta’s plant reflects the successful implementation of plant maintenance and capital expenditure programs.
Delta’s availability and reliability targets are set at the strategic and business planning level and are linked with production, asset management and budgeting processes. The ten-year targets are set to support revenue growth and to provide increased value. They are benchmarked against industry performance levels sourced from esaa.
Overall, Delta plant achieved high levels of availability at 91.44%. Colongra’s availability was 99.95% and had a start reliability of 97%. Coal-fired plant availability was 90.1%.
FuelEnsuring an adequate supply of fuel for our power stations is an operational priority. All fuel has to be purchased and transported to the generation sites in the most economical way. Supply of fuel includes coal, gas and renewables.
Coal prices have increased significantly in recent years, which has increased the risk for Delta in securing supplies of coal at competitive prices. Purchases of coal for Delta’s power stations involve expenditure in excess of $400 million in our local regions, which contributes significantly to local employment and the sustainability of local communities.
Portfolio efficiency
Table 25: Generation efficiency
Generation efficiency
Sent out (per cent)
2010-11 2009-10
Source category - coal 34.4 34.1
Source category - coal 29.7 29.7
1. Generation efficiency is the ratio of energy leaving the plant to energy source, that is, electricity sent out divided by gross energy going into the plant expressed as a percentage.
Table 26: Average plant reliability
Measurement
Reliability (per cent)
2010-11 2009-10
Realibility* 96.7 95.9
* Realibility is reported as 100% minus sum of Equivalent Forced Outage Factor and Equivalent Breakdown Maintenance Factor.
Table 27: Average plant availability
Emission type*
Availability (per cent)
2010-11 2009-10
Plant availability - Coal 90.1 92.0
Plant availability - Gas 100.0 98.1
1. Availability is reported as 100% minus sum of equivalent forced outage factor, equivalent breakdown maintenance factor and planned outage.2. Delta’s availability reporting aligns with the North American Electric Reliability Council Methodology.

57Delta Electricity Sustainability Report 2010-11
Delta delivered an underlying net profit before tax of $86.2 million, which was an improvement of 19% compared to the Statement of Corporate Intent 2010-2011 budget. The underlying net profit before tax excludes a $166.7 million impact of accounting adjustments related to the Gentrader transaction ($895m inclusive of balance sheet write-downs) and a $156.4 million impairment of Central Coast asset values primarily related to the impact of the proposed carbon tax ($318.4 million inclusive of balance sheet write-downs).
The Sunshine Electricity Joint Venture between Delta Electricity Australia and the NSW Sugar Milling Cooperative went into receivership in February 2011 due to low crop volumes and low Renewable Energy Certificates prices.
More information is available in the Delta Electricity Annual Report 2010-11.
Managing financial risks and opportunitiesDelta recognises that climate change is our most significant challenge. The impact of climate change on Delta’s business is assessed annually as part of our strategic planning process. The main climate change risks we face are:
- the increased costs from the introduction of a carbon price;
- reduction in the availability of long-term water supplies for our Western Region power stations; and
- restricted generation due to increase in lake temperature on the Central Coast.
Reducing risks of the carbon pricing schemeDelta expects additional costs over the next ten years in the order of $2 billion due to the Commonwealth Government’s Clean Energy Future package.
In response to a carbon constrained future, we have expanded our low-emission generation capacity with the inclusion of gas fired plant. We are investigating ways to further improve the thermal efficiency of our generation portfolio and actively investigating carbon capture and storage technology.
Delta also faces challenges from the broader and local community that expect a reliable and affordable electricity supply, reduced environmental and greenhouse impacts and economic prosperity. Delta does not exist in isolation from the general community as we have strong and direct economic links with the local communities in which we operate in regional NSW. We provide direct employment to people operating and maintaining our power stations and indirect employment in the mining industries that provide our fuels.
Financial performance
Table 28: Financial performance
Economic measure 2010-11 2009-10
Operating revenues $1,109,473,000 $1,050,047,000
Operating costs (excluding financial costs)
$1,293,599,000 $833,694,000
Employeecompensation
$101,846,000 $98,699,000
Retained earnings ($196,781,000) $Nil
Payments to capital provicers andgovernments(dividends)
In 2010-11, Delta did notprovide a dividendto our shareholders,representing theNSW Government
In 2009-10,Delta providedfor a dividend toour shareholders,representing theNSW Government,of $36.6 million
Reducing water management riskWe are undertaking a number of measures to reduce risk associated with water management including:
- treatment of waste water to remove salt and to enable reuse of the treated water;
- use of water from coal mines to reduce demand on natural catchment water sources and also reduce discharge of mine water to rivers;
- conversion of ash extraction and placement systems from wet to dry systems; and
- ongoing monitoring and modelling of water use.
Indirect economic impactsDelta has considerable indirect economic and social impacts through our contribution to the cost of electricity the consumers pay and the services and infrastructure the people of NSW use.
Delta produces approximately 12% of the electricity needed by consumers in the National Electricity Market (NEM) and around 30% of the electricity price paid by domestic and business consumers is the direct cost of generation. Other charges added to retail accounts include network charges, service fees, market charges, retail charges and GST.
The other indirect economic impact Delta has on society is the dividends provided to the NSW Government, which are used to fund services and infrastructure in NSW.

AppendicesWorkplaceCommunity CustomersIntroduction Environment
Marketing communications
Undertaking customer satisfaction surveysDelta undertakes standardised customer satisfaction surveys of our retail customers (represented by energy traders and their managers). This provides a direct measure of our success and indicates areas of improvement in our marketing communications. Interviews were carried out by telephone with representatives of AGL, Country Energy, EnergyAustralia, Integral Energy, Origin Energy, Red Energy, Snowy Hydro and TRUenergy. The survey was carried out in July 2010.
Measuring customer satisfactionFor the purposes of an overall customer satisfaction measure, a customer satisfaction index of 95.1% for Delta’s eight customers was calculated.
This compares with customer satisfaction index figures of 98.25% for both 2006 and 2007, 97.0% for 2005 and 95.7% for 2004.
Product performance
In this study, with only a small number of key customers, the qualitative analyses are more valuable for strategy development than the ratings themselves:
- Although there was a small decline in customer satisfaction, compared to the last survey three years ago, Delta’s customers continued to have a very high level of satisfaction with the services they received, particularly for the relationship issues measured.
- Delta overall is still the highest rated supplier by our customers.
- The decline in customer satisfaction was attributed to the energy reform process and the affect it had on the timing and range of Delta’s trading products and services.
- Carbon uncertainty issues had impacted on Delta and the market.
- The areas where Delta scored highly compared to other generators were flexibility in structuring products, reliability (always doing what we say we will do), knowledge and professionalism, being pro-active (anticipating issues in advance), frequency of personal visits, availability of account executives, understanding customers’ businesses and our risk management processes.
- The areas that Delta scored below the best of the other electricity suppliers were contract terms and conditions, competitive pricing and speed of firm offer.
Figure 15: Customer satisfaction (percent)
2004 2005 2006 2007 2010
95.7
95.7 9797
98.2
98.2
98.2
98.2
95.1
95.1
1. No customer satisfaction survey was undertaken in 2008 and 2009.
95.1% customer satisfaction was calculated for Delta’s eight customers in 2010.
95.1%

The continuing pressure on market prices is the result of the recent commissioning of new gas and renewable generating capacity and reducing energy consumption
59Delta Electricity Sustainability Report 2010-11
Delta overall is still the highest rated supplier by our customers
Market presence/forcesThe average spot price in the NSW region of NEM for 2010-11 was the lowest in seven years. The continuing pressure on market prices is the result of the recent commissioning of new gas and renewable generating capacity and reducing energy consumption.
The recent sale of the NSW state-owned retailers to AGL and TRUenergy has restructured the industry in NSW and placed further downward pressure on forward contract prices.
Although a period of very hot weather in January and February produced some high spot market prices, overall price volatility has diminished in the year. This in turn has reduced the value of market reserve which is generally provided by peaking plant.
Forward contracting beyond June 2012 remains subdued given the uncertainty surrounding the implementation of a price on carbon. Once legislation is passed and the future cost of carbon is better understood, future contract volumes are expected to increase. The contract market now uses an industry standard carbon pass-through provision based on an average NEM wide emission intensity. Any generating plant with an emission intensity above the market average will not be able to fully pass through its carbon costs to its customers.
$70
$60
$50
$40
$30
$20 2000-01
2001-02
2002-03
2003-04
2004-05
2005-06
2006-07
2007-08
2008-0
9
2009-10
2010-11
Advertising and promotions
The current procedures and policy requirements for advertising and promotions are outlined in the NSW Government Advertising Guidelines. State owned corporations are not necessarily subject to the requirements but may choose to use them as guidelines for achieving value for money outcomes.
In 2010-11, we continued to use several forms of advertising in our operational activities including public awareness advertising, tenders and quotations, recruitment advertising and important public information and statutory notices.
Figure 16: Average NSW Spot Price

Case study
AppendicesWorkplaceCommunity CustomersIntroduction Environment
Sustainable Energy DevelopmentTony Vassallo is the inaugural Delta Electricity Chair in Sustainable Energy Development at the University of Sydney, having commenced in late 2008. The role of the Chair is to lead research and teaching in sustainable energy at the University, increase awareness of the need and challenges of sustainable energy and facilitate collaboration between academics and industry.
Tony’s main research focus is on energy storage and its role in facilitating sustainable energy use. Our future power supply will come from wider and more diverse sources of generation than is currently the case and much of this will be sourced from renewable sources. As our electricity supply incorporates increasing amounts of energy from intermittent sources such as wind and solar power, the ability to meet demand at all times becomes more difficult. If we are to utilise Australia’s high quality solar, wind and other renewable sources, then grid-connected energy storage will provide the capability to shift both supply and load to ensure quality and reliability are maintained. Energy storage however is currently an expensive alternative compared to gas turbines and research is needed to find cheaper ways of storing energy. Tony’s research is helping this challenge, by looking at potentially very low cost flow-battery systems which could, at scale, provide storage services for a few cents a kWh. These systems would help meet peak electricity demands by storing electricity that was produced at times of low demand, such as overnight. These storage systems could be implemented at the household level, the street level, commercial or even substation level, but the most beneficial location is still the subject of research, and depends strongly on the regulatory, economic and network conditions.
Tony also teaches Sustainable Energy to undergraduate engineers and graduate students in Sustainability. These courses prepare students for professional careers in sustainable energy, covering topics such as energy generation, distribution and use, energy cost and pricing, resource assessment, carbon capture and storage and many other energy and sustainability topics.
Our future power supply will come from wider and more diverse sources of generation than is currently the case and much of this will be sourced from renewable sources.
61Delta Electricity Sustainability Report 2010-11
Appendices62 Appendix 1 Compliance with GRI principles
64 Appendix 2 Index of standard disclosures
80 Appendix 3 2010 - 11 Sustainability Goals
81 Appendix 4 Reporting materiality
82 Glossary of acronyms

AppendicesWorkplaceCommunity CustomersIntroduction Environment
Compliance with GRI principles
Appendix 1
Principle GRI definition Test Compliance
Reliability Information and processes used in the preparation of a report should be gathered, recorded, compiled, analysed and disclosed in a way that could be subject to examination and that establishes the quality and materiality of the information.
The scope and extent of external assurance is identified.
2010 Report was reviewed by Netbalance to check for GRI reporting level.
The original source of the information in the report can be identified by the organisation.
All performance information has source identified and is defined in a separate procedural document.
Reliable evidence to support assumptions or complex calculations can be identified by the organisation.
All information in the report is supportable.
Representation is available from the original data or information owners, attesting to its accuracy within acceptable margins of error.
Data managers and data custodians are identified and are accountable for the accuracy of the information.
Clarity Information should be made available in a manner that is understandable and accessible to stakeholders using the report.
The report contains the level of information required by stakeholders, but avoids excessive and unnecessary detail.
The Sustainability Report has been professionally written, sub-edited and designed.
Stakeholders can find the specific information they want without unreasonable effort through tables of contents, maps, links or other aids.
The report has a table of contents and key aspects are indexed.
The report avoids technical terms, acronyms, jargon or other content likely to be unfamiliar to stakeholders, and should include explanations (where necessary) in the relevant section or in a glossary.
The Sustainability Report includes explanations where necessary, and a glossary of technical terms.
The data and information in the report is available to stakeholders, including those with particular accessibility needs (e.g., differing abilities, language or technology).
The report is published on the Internet and further information is available if requested.
Balance The report should reflect positive and negative aspects of the organisation’s performance to enable a reasoned assessment of overall performance.
The report discloses both favourable and unfavourable results and topics.
Delta is committed to providing full disclosure of information relating to sustainability.
The information in the report is presented in a format that allows users to see positive and negative trends in performance on a year-to-year basis.
This report sets a benchmark for comparing performance over the following years.
The emphasis on the various topics in the report is proportionate to their relative materiality.
Performance indicators are selected to be industry specific.

63Delta Electricity Sustainability Report 2010-11
Principle GRI definition Test Compliance
Comparability Issues and information should be selected, compiled and reported consistently. Reported information should be presented in a manner that enables stakeholders to analyse changes in the organisation’s performance over time and could support analysis relative to other organisations.
The report and the information contained within it can be compared on a year-to-year basis.
This report sets a benchmark for comparing performance from proceeding years.
The organisation’s performance can be compared with appropriate benchmarks.
The performance indicators are selected by the NGF and ESAA to be generation industry specific and comparable.
Any significant variation between reporting periods in the boundary, scope, length of reporting period, or information covered in the report can be identified and explained.
There are no significant variations..
Where they are available, the report utilises generally accepted protocols for compiling, measuring and presenting information, including the GRI Technical Protocols for Indicators contained in the Guidelines.
Performance indicators present information using industry standards.
The report uses GRI Sector Supplements, where available.
The Electricity Utility Sector Supplement has been included.
The report indicates the data that has been measured.
Quantitative information is used throughout the report. Qualitative information indicates processes are in place.
Accuracy The reported information should be sufficiently accurate and detailed for stakeholders to assess the reporting organisation’s performance.
The data measurement techniques and bases for calculations are adequately described, and can be replicated with similar results.
Performance indicators present information using industry standards except where otherwise stated.
The margin of error for quantitative data is not sufficient to substantially influence the ability of stakeholders to reach appropriate and informed conclusions on performance.
All information provided in the report is robust and margins of error are not relevant.
The report indicates which data has been estimated and the underlying assumptions and techniques used to produce the estimates, or where that information can be found.
Few estimates have been used and where they have been, they are explained.
The qualitative statements in the report are valid because they are based on other reported information and other available evidence.
Qualitative information is sourced from a number of defined sources and can be substantiated.
Information in the report has been disclosed while it is recent relative to the reporting period.
The information is current for the reporting period.
Timeliness Reporting occurs on a regular schedule and information is available in time for stakeholders to make informed decisions.
The collection and publication of key performance information is aligned with the Sustainability Reporting schedule.
The report provides information to the Executive as part of Delta’s strategic planning cycle.
The information in the report (including web-based reports) clearly indicates the time period to which it relates, when it will be updated, and when the last updates were made.
The period of the report is clearly indicated throughout, and is equivalent to the period covered by the annual financial performance report.

AppendicesWorkplaceCommunity CustomersIntroduction Environment
Disclosure Information Page
GRI-1.1 Welcome to Delta Electricity’s 2011 Sustainability Report P. 2
GRI-1.2 Key impacts, risks and opportunities:
Climate change and carbon pricing See Customers Section – Managing financial risks and opportunities
Gentrader See Customers Section – Gentrader process
Market forces See Customers Section – Market presence/forces
P. 57
P. 53
P. 59
GRI-2 Organisational profile
Refer to Annual Report (available on http://www.de.com.au)
GRI-2.1 Name of the organisation
Delta Electricity
GRI-2.2 Primary brands, products, and/or services
See Introduction Section – Who we are P. 3
GRI-2.3 Operational structure
See Introduction Section – Who we are P. 3
GRI-2.4 Location of headquarters
Delta’s corporate headquarters are located on Level 20, 175 Liverpool Street, Sydney.
GRI-2.5 Area of operations
See Introduction Section – Who we are P. 3
GRI-2.6 Ownership and legal form
Delta Electricity operates under the Energy Services Corporations Act 1995 and the State Owned Corporations Act 1989. Delta’s two shareholding Ministers are the Treasurer and the Minister for Finance and Services.
The organisation was formed on 1 March 1996 as part of the NSW Government’s restructure of the state’s electricity industry. This restructure was in response to large-scale changes in generation, transmission and supply of electricity in eastern Australia following a program of competition reform.
GRI-2.7 Markets See Introduction Section – Who we are P. 3
GRI-2.8 Scale of Delta Electricity
Number of employeesSee Workplace Section – Employment at Delta
Total sales revenuesSee Customers Section – Financial performance
Quantity of products or services providedSee Customers Section – Production Performance
Total assetsThe total major assets, current and non-current, are listed in the 2011 Annual Report (available on http://www.de.com.au).
P. 43
P. 57
P. 54
GRI-2.9 Significant changes in size, structure or ownership
In December 2010, the NSW Government contracted the outputs from the western region power stations, Mt Piper and Wallerawang to TRUenergy as the Delta West GenTrader contract.
The Sunshine Electricity Joint Venture between Delta Electricity Australia and the NSW Sugar Milling Cooperative went into receivership in February 2011 due to fuel shortages and low Renewable Energy Certificate prices.
Index of standard disclosures
Appendix 2

65Delta Electricity Sustainability Report 2010-11
Disclosure Information Page
GRI-2.10 Awards received in the reporting period.
Delta received a Bronze Membership in the NSW Sustainability Advantage Program run by the Office of Environment and Heritage.
Colongra Power Station was highly commended in the 2010 Engineers Australia’s Engineering Excellence Award. This award was judged in the project management category and the criterion was project or engineering work that achieves client requirement in harmony with environment, business and community considerations, while meeting time, cost and quality targets.
Delta apprentices won a range of Central Coast and Western awards with four awards for apprentice of the year in different categories. One of our apprentices won 2010 State Indigenous Apprentice of the Year.
GRI-3.1 Reporting period
The 2011 Sustainability Report reports performance from 1 July 2010 to 30 June 2011.
GRI-3.2 Date of most recent previous report
The previous report included information from 1 July 2009 to 30 June 2010.
GRI-3.4 Contact point for report queries
The Delta Sustainability Report is compiled by the Sustainability Manager who can be reached on (02) 9285 2700.
GRI-3.5 Report contents
See Introduction Section – About this report
GRI-3.6 Report boundary
The Sustainability Report relates to Delta Electricity, and only to our subsidiaries Delta Electricity Australia Pty Ltd and Mid West Primary Pty Ltd with respect to their inclusion as a consolidated entity in Delta’s financial accounts.
In the case of Delta Electricity Australia Pty Ltd, Delta’s share of energy production from the Sunshine Electricity Joint Venture is included with renewable energy data reported in this document.
Delta is an electricity generator and is not reporting on the upstream and downstream impacts of our supply chain. We are not reporting on the impacts of the supply of fuels or on the delivery issues of supply to electricity retailers, including transmission and distribution losses.
GRI-3.7 Limitations on the scope or boundary of the report
The boundary and scope of this report include the full range of material economic, environmental, and social impacts of Delta Electricity but not its subsidiaries as stated above in GRI-3.6.
GRI-3.8 Joint ventures, subsidiaries and other entities
This report does not cover the sustainability performance of Delta’s subsidiary companies Delta Electricity Australia Pty Ltd (DEA) or Mid West Primary Pty Ltd. However, in the case of DEA Delta’s share of renewable energy production from the Sunshine Electricity Joint Venture is included. Note that Delta Electricity’s Financial Performance is reported each year on a consolidated basis in Delta’s Annual Report.
GRI-3.9 Data measurement techniques and calculation methods
In 2008 we developed a Data Accountabilities Table (DAT) to identify data managers and data custodians who are accountable for the accuracy of the information in this report. The DAT has been reviewed and amended each year to reflect changes needed to comply with the esaa framework and with widened reporting. The information sources and business systems used are identified to ensure accuracy and consistency. All information in the report is supportable and able to be tracked to source.
GRI-3.10 Restatements of information
Amendments have been made to the figures for some of the environmental performance indicators due to some minor reporting errors.
GRI-3.11 Significant changes from previous reports
There are no significant changes in the reporting boundaries of this report. This is Delta’s fourth report written to comply with the The National Generators’ Forum (NGF) guidelines. Additional performance indicators have been included to comply with the esaa Sustainability Reporting Framework (as described above). The aim of this report is to record our progress in achieving our sustainability targets.

AppendicesWorkplaceCommunity CustomersIntroduction Environment
Disclosure Information Page
GRI-3.12 Standard disclosures
An index of standard disclosures is provided here.
GRI-3.13 External assurance
The contents of this report have not been independently verified. However, Netbalance assessed the 2010 Sustainability Report as an Application Level B, against the reporting requirements of the Global Reporting Initiative G3 Guide. Netbalance has also provided us with opportunities to improve our reporting, which we have incorporated into this 2011 report.
GRI-4.1 Governance structure
The State Owned Corporations Act 1989 and the Constitution govern appointment of Directors to the Board. The Delta Electricity 2010 Annual Report provides detailed information on the governance structure of Delta.
The Board meets monthly, or as required. Meetings follow set agendas providing all necessary information for informed discussion of important issues. Meetings are held at the corporate office or at a selected power station to allow the Board to visit the operational sites of the business. There are several Board Committees in place to deal with particular aspects of Delta’s business.
The Delta Electricity 2011 Annual Report provides detailed information on the governance structure of Delta and should be referred to for information about changes to the Board of Directors that occurred in the reporting period.
GRI-4.2 Governance Delta Electricity operates under a two-tier system where the executive management team is responsible for day-to-day operations. The Board has responsibility for reviewing and approving strategic direction, major business initiatives, appointments to the executive management team and executive remuneration.
GRI-4.3 Independent Board members
The Chief Executive is the only executive member on Delta Electricity’s Board. All other Board members are appointed by and are accountable to the Shareholding Ministers.
GRI-4.4 Staff communications with the Board
Board MeetingsThe Board of Delta Electricity holds monthly meetings using agreed meeting guidelines where the agenda and associated reports are provided in advance to ensure the Directors can participate in an informed way. Meetings are held in the corporate office or at one of Delta Electricity’s power station sites. Power Station meetings provide opportunities for the Board to better understand business operations and meet a broader cross-section of staff.
Managing employee-identified risksDelta’s Risk Management Plan provides employees with a framework for identification, assessment and reporting of risk. Risk management software supports a reporting hierarchy, which allows employees to identify, register and escalate risks for review, comment and action.The framework allows risk information to be elevated from plant owners to executive staff or the Board, if necessary. Key operational and strategic risks are reviewed and reported monthly to the business unit level and quarterly to the Board.
Strategic developmentEmployees are involved in developing strategies as part of several consultative processes. The annual strategic plan is formulated after consultation with senior staff. Before the plan is finalised, a strategic planning day with Directors and the executive management team is held. The annual planning process including asset management review looks to a ten-year horizon.
Compliance planningDelta has a Corporate Governance and Legal Compliance Plan, based on a compliance management software system that allows business units to centrally register their legal, regulatory and compliance obligations. The system provides escalation rules to ensure that non-compliances and overdue compliance tasks are elevated to senior management for action.
Chief Executive presentationsThe Chief Executive meets with all staff at least twice per year in open discussions about the future of the business. Staff are actively encouraged to ask questions at these meetings.
ContinuedIndex of standard disclosures
Appendix 2

67Delta Electricity Sustainability Report 2010-11
Disclosure Information Page
GRI-4.5 Performance-linked remuneration
The 2010-11 performance payments for executive managers mirrored the scheme that was used during 2009-10. This was based upon a range of measures, including:
- the outcome of performance against a Delta overall balanced scorecard;
- the outcome of performance against business unit-specific balanced scorecards;
- an individual performance payment based on:
- individual performance; and
- individual management and leadership performance.
Delta’s Annual Report includes details of executive remuneration for the reporting period.
GRI-4.6 Avoiding conflicts of interest
Delta has a Corporate Governance and Legal Compliance Plan to ensure full compliance with obligations imposed on the organisation and our officers by all relevant legislation, including corporate governance. Delta maintains a register of Directors’ interests and this is updated as required with Board members declaring any change in their interests as and when they occur.
GRI-4.7 Board selection
Appointment of Directors to the Board is governed by the State Owned Corporations Act 1989 and the Constitution. Delta’s Annual Report contains the details.
GRI-4.8 Mission statements, codes of conduct and management principles
Delta uses a set of well-defined and established principles to guide strategic decision-making. These include principles that maximise the state’s investment, are socially responsible and enable ecologically sustainable development.
Delta as a state-owned corporation is obliged to comply with all statutory requirements set out in relevant legislation, regulations and licences issued by government authorities related to electricity generation.
For more detail see:- See Iitroductory section: Our vision and mission- See workplace section: Labour/Management relations
P. 4P. 43
GRI-4.9 Governance procedures for managing performance
Delta implements our sustainability framework through our strategic and business planning process, which is the organisation’s peak planning process. Progress with implementation of strategic objectives (including identification and management of economic, environmental and social risks, opportunities and performance) is reviewed regularly at executive level and bi-annually at Board level.
In addition there are several Board committees in place for managing performance:
Board Audit and Finance CommitteeThe Board Audit and Finance Committee provides a forum for communications between the Board, senior management and both the internal and external auditors. It is responsible for the integrity of the internal audit function and ensures that management practices and systems support the effective operation of Delta’s risk management strategies, business continuity and fraud control plan. It reviews the adequacy of Delta’s short and long-term finance and risk management strategies.
Board Remuneration and Staff CommitteeThe primary objectives of the Board Remuneration and Staff Committee are to:- provide advice to the Board on remuneration and associated issues;
- enhance the independence and objectivity of Board decisions on sensitive commercial and personal issues related to the executive managers of the corporation;
- enable corporate and business strategies and plans, and remuneration strategy and policy to be effectively linked; and
- review processes and controls relating to Delta’s remuneration strategy, policy and practices in relation to legal and taxation requirements, corporation reporting obligations and overall corporation policy and direction.
Board Environment and Occupational Health and Safety CommitteeThe primary objectives of the Board Environment and Occupational Health and Safety Committee are to assist the Board in discharging our responsibility for compliance with environmental and occupational health and safety policies and legislation.

AppendicesWorkplaceCommunity CustomersIntroduction Environment
Disclosure Information Page
GRI-4.10 Governance processes for evaluating the Board’s performance
The performance agreement between the Board and the Voting Shareholders is in the form of an Annual Statement of Corporate Intent. Quarterly performance reports are provided to the Voting Shareholders with six-monthly meetings arranged to discuss progress against the objectives set out in the Statement. A meeting with the Voting Shareholders is held to discuss and agree each forthcoming Annual Statement.
In addition, an independent review of the Board’s performance was arranged by NSW Treasury on behalf of the Voting Shareholders, as part of a review of State Owned Corporation Boards.
GRI-4.11 The precautionary principle and risk management
Precautionary principleDelta’s Sustainability Policy includes a strategic requirement that we act with caution when scientific knowledge is inconclusive and there are risks of serious irreversible consequences. This is implemented at operational level through the use of environmental management plans, which use risk assessments to assess the impacts of all new operational procedures.
Risk managementDelta’s Risk Management Plan conforms to Australian Standard AS/NZS 4360:2004 Risk Management. The plan provides Delta’s management and employees with policy direction and a framework for identification, assessment and reporting of risk.
The risk management software system provides a hierarchical framework to identify, register and, if necessary, escalate risks to higher management levels for review, comment and action. Key operational and strategic risks are reviewed and reported monthly at business unit level and reported quarterly to the Delta Board.
GRI-4.12 Charters, principles or initiatives
Delta supports the Sustainable Practice Framework developed by the Energy Supply Association of Australia (esaa), which encourages best practice sustainability programs, improves voluntary sustainability reporting and shares good environmental, community, governance and workplace practice within the energy supply industry.
We are certified under ISO 14001 international standard which outlines best practice processes to manage environmental impact.
We use ISO 9000 as a standard for our quality management systems.
Our Risk Management Plan was updated in June 2009 and conforms to the Australian Standard AS/NZS 4360:2004 Risk Management.
We fully comply with the NSW Government’s Waste Reduction and Purchasing Policy (WRAPP). We aim to reduce landfill by about 10% each year in accordance with WRAPP.
GRI-4.13 Membership of associations and advocacy organizations
Australian Power InstituteBioenergy AustraliaClean Energy CouncilCommittee for Economic Development of Australia (CEDA)Coal Industry Advisory BoardCRC for Integrated Engineering Asset ManagementGreen Capital
Energy Supply Association of Australia (esaa)Electric Power Research InstituteInfrastructure Partnerships AustraliaInternational Council on Large Electric Systems (CIGRE)International Energy AgencyNational Generators Forum (NGF)Welding Technology Institute of Australia
GRI-4.14 Stakeholder groups
See Community Section — Our local community P. 33
GRI-4.15 Identification and selection of stakeholders
See Community Section — Identifying community’s concerns P. 34
GRI-4.16 Approaches to stakeholder engagement
See Community Section — Engagement with local community P. 35
GRI-4.17 Key stakeholder concerns
See Community Section — Our local communities – Our other major stakeholders
P. 33 - P. 37
ContinuedIndex of standard disclosures
Appendix 2
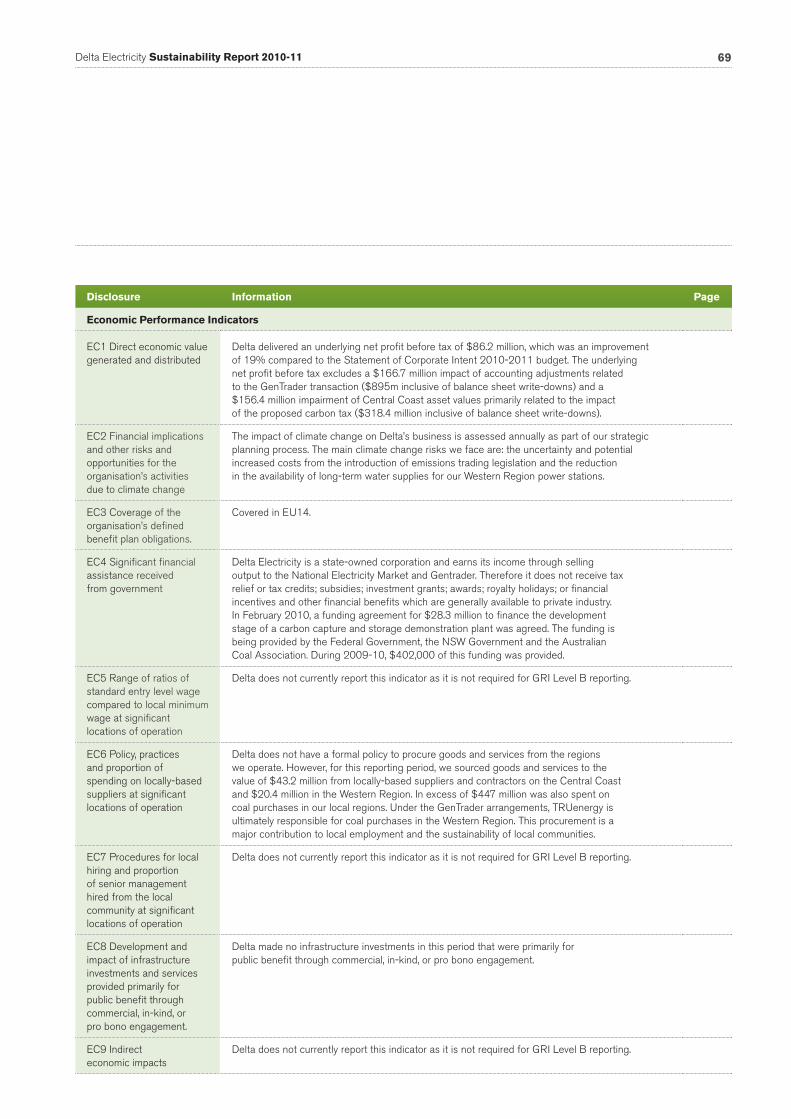
69Delta Electricity Sustainability Report 2010-11
Disclosure Information Page
Economic Performance Indicators
EC1 Direct economic value generated and distributed
Delta delivered an underlying net profit before tax of $86.2 million, which was an improvement of 19% compared to the Statement of Corporate Intent 2010-2011 budget. The underlying net profit before tax excludes a $166.7 million impact of accounting adjustments related to the GenTrader transaction ($895m inclusive of balance sheet write-downs) and a $156.4 million impairment of Central Coast asset values primarily related to the impact of the proposed carbon tax ($318.4 million inclusive of balance sheet write-downs).
EC2 Financial implications and other risks and opportunities for the organisation’s activities due to climate change
The impact of climate change on Delta’s business is assessed annually as part of our strategic planning process. The main climate change risks we face are: the uncertainty and potential increased costs from the introduction of emissions trading legislation and the reduction in the availability of long-term water supplies for our Western Region power stations.
EC3 Coverage of the organisation’s defined benefit plan obligations.
Covered in EU14.
EC4 Significant financial assistance received from government
Delta Electricity is a state-owned corporation and earns its income through selling output to the National Electricity Market and Gentrader. Therefore it does not receive tax relief or tax credits; subsidies; investment grants; awards; royalty holidays; or financial incentives and other financial benefits which are generally available to private industry.In February 2010, a funding agreement for $28.3 million to finance the development stage of a carbon capture and storage demonstration plant was agreed. The funding is being provided by the Federal Government, the NSW Government and the Australian Coal Association. During 2009-10, $402,000 of this funding was provided.
EC5 Range of ratios of standard entry level wage compared to local minimum wage at significant locations of operation
Delta does not currently report this indicator as it is not required for GRI Level B reporting.
EC6 Policy, practices and proportion of spending on locally-based suppliers at significant locations of operation
Delta does not have a formal policy to procure goods and services from the regions we operate. However, for this reporting period, we sourced goods and services to the value of $43.2 million from locally-based suppliers and contractors on the Central Coast and $20.4 million in the Western Region. In excess of $447 million was also spent on coal purchases in our local regions. Under the GenTrader arrangements, TRUenergy is ultimately responsible for coal purchases in the Western Region. This procurement is a major contribution to local employment and the sustainability of local communities.
EC7 Procedures for local hiring and proportion of senior management hired from the local community at significant locations of operation
Delta does not currently report this indicator as it is not required for GRI Level B reporting.
EC8 Development and impact of infrastructure investments and services provided primarily for public benefit through commercial, in-kind, or pro bono engagement.
Delta made no infrastructure investments in this period that were primarily for public benefit through commercial, in-kind, or pro bono engagement.
EC9 Indirect economic impacts
Delta does not currently report this indicator as it is not required for GRI Level B reporting.

AppendicesWorkplaceCommunity CustomersIntroduction Environment
Disclosure Information Page
Environmental Performance Indicators
EN1 Materials consumed in production by weight or volume (tonnes, ML or kL)
See Environmental Section — Materials converted to energy P. 29
EN2 Materials used that are recycled input materials
See Environmental Section — Recycled materials used in energy production P. 29
EN3 Direct energy consumption by primary energy source
See Environmental Section — Energy consumption P. 29
EN4 Indirect energy consumption by primary source.
As a generator, Delta’s indirect energy consumption is not significant and therefore not considered a material issue.
EN5 Energy saved due to conservation and efficiency improvements
Not reported—although partly reported at EN18 Initiatives to reduce greenhouse gas emissions and reductions achieved.
Delta will start reporting its “energy use and identified opportunities for energy savings” from 2013 as required by the Energy Efficiency Opportunities Act 2006.
EN6 Initiatives to provide energy-efficient or renewable energy-based products and services, and reductions in energy requirements as a result of these initiatives
See Environment Section — Research and Development P. 20
EN7 Initiatives to reduce indirect energy consumption and reductions achieved.
Not reported — although partly reported at EN18 Initiatives to reduce greenhouse gas emissions and reductions achieved.
EN8 Total water withdrawal by source See Environment section — Water use P. 22
EN9 Water sources significantly affected by withdrawal of water.
Delta does not currently report this indicator as it is not required for GRI Level B reporting.
EN10 Percentage and total volume of water recycled and reused.
Delta does not currently report this indicator as it is not required for GRI Level B reporting.
EN11 Location and size of land owned, leased, managed in, or adjacent to, protected areas and areas of high biodiversity value outside protected areas.
Delta does not currently report this indicator as it is not required for GRI Level B reporting.
EN12 Describe significant impacts of activities, products, and services on biodiversity in protected areas and areas of high biodiversity value outside protected areas
Delta does not operate within protected areas or areas of high biodiversity value outside protected areas.
EN13 Habitats protected or restored. Delta does not currently report this indicator as it is not required for GRI Level B reporting.
EN14 Describe the organisation’s strategies, current actions and future plans for managing impacts on biodiversity
See Environment section—Biodiversity and land management P. 28
EN15 Number of IUCN Red List species and national conservation list species with habitats in areas affected by operations, by level of extinction risk.
Delta does not currently report this indicator as it is not required for GRI Level B reporting.
EN16 Total direct and indirect greenhouse gas emissions by weight
See Environment Section — Delta’s greenhouse gas emissions P. 19
EN17 Other relevant indirect greenhouse gas emissions by weight.
Delta meets all its greenhouse gas reporting requirements. This is not material.
ContinuedIndex of standard disclosures
Appendix 2

71Delta Electricity Sustainability Report 2010-11
Disclosure Information Page
Environmental Performance Indicators - Continued
EN18 Initiatives to reduce greenhouse gas emissions and reductions achieved
See Environment Section — Responding to Climate Change. P. 20
EN19 Emissions of ozone-depleting substances by weight
EN20 NOx, SOx, particulate and other significant air emissions by type and weight
See Environment Section — Air emissions P. 24
EN21 Total water discharge by quality and destination
See Environment section — Water management P. 23
EN22 Total weight of waste by type and disposal method
See Environment section — Waste products and management P. 29
EN23 Total number and volume of significant spills
See Environment section — Spills P. 30
EN24 Weight of transported, imported, exported, or treated waste deemed hazardous under the terms of the Basel Convention Annex I, II, III, and VIII, and percentage of transported waste shipped internationally.
Not relevant to Delta.
EN25 Identity, size, protected status, and biodiversity value of water bodies and related habitats significantly affechted by the reporting organization’s discharges of water and runoff.
Delta does not currently report this indicator as it is not required for GRI Level B reporting.
EN26 Initiatives to mitigate environmental impacts of products and services, and extent of impact mitigation.
See Environment section Research and Development. P. 20
EN27 Percentage of products sold and their packaging materials that are reclaimed by category.
This is not relevant to Delta as a generator of electricity.
EN28 Monetary value of significant fines and total number of non-monetary sanctions for non-compliance with environmental laws and regulations
Delta did not receive any significant fines or non-monetary sanctions. However, an action was commenced in the Land And Environment Court alleging Delta had polluted the Upper Coxs River. Hearing dates have not yet been set and the outcome of an appeal on a protective costs order for this matter is pending.
EN29 Significant environmental impacts of transporting products and other goods and materials used for the organisation’s operations, and transporting members of the workforce.
There are no significant environmental impacts other than the footprint of the coal loaders and energy costs. However the impacts of coal transport are a concern of our local community stakeholders and is reported in the Community section — Minimising transport impacts.
P. 35
EN30 Total environmental protection expenditures and investments by type.
Delta does not currently report this indicator as it is not required for GRI Level B reporting.
10.096 tonnes February to June 2011 figures from Air Conditioning Contractor. July 2010 – Feb11 and 2009-10 Records with previous Contractor.
Central Coast Region
Emissions (tonnes)
Ozone depleting substances
2010-11 2009-10
CFCs 0
HCFCs 0.0961 0
Halons 0
12009-10 is shown as 0.150 tonnes – it was incorrectly shown as 0 tonnes in the previous Sustainability Report.
Western Region
Emissions (tonnes)
Economic measure 2010-11 2009-10
CFCs 0
HCFCs 0.157 0.1501
Halons 0

AppendicesWorkplaceCommunity CustomersIntroduction Environment
Disclosure Information Page
Social Performance Indicators: Society
SO1 Nature, scope and effectiveness of any programs and practices that assess and manage the impacts of operations on communities, including entering, operating and exiting
See Community section— Identifying community’s concerns P. 34
SO2 Percentage and total number of business units analysed for risks related to corruption
See Workplace section— Fraud and corruption prevention P. 45
SO3 Percentage of employees trained in organisation’s anti-corruption policies and procedures
Fraud and corruption prevention training is part of Delta’s compulsory training package for all employees.
SO4 Actions taken in response to incidents of corruption
SO5 Public policy positions and participation in public policy development and lobbying.
Delta made a submission to the Federal Government about the fairness of the carbon tax compensation plan suggesting that it was unfair because it favoured privately run generators using brown coal.For more information see the website: http://www.de.com.au/Media-Centre/Media-releases/default.aspx
SO6 Total value of financial and in-kind contributions to political parties, politicians, and related institutions by country.
Delta Electricity is a state owned corporation. This is not relevant.
SO7 Total number of legal actions for anti-competitive behaviour, anti-trust, and monopoly practices and their outcomes.
Nil
SO8 Monetary value of significant fines and total number of non-monetary sanctions for non-compliance with laws and regulations
In 2010-11 (and 2009-10) there were no fines or sanctions against Delta from: offence arising under s 8 (2) of the Occupational Health and Safety Act 2000 or offences arising under the Protection of the Environment Operations Act 1997.
Social Performance Indicators: Human Rights
HR1 Percentage and total number of significant investment agreements that include human rights clauses or that have undergone human rights screening.
Not relevant because of the comprehensive social and employment laws in force in the Australian operating environment.
HR2 Percentage of significant suppliers and contractors that have undergone screening on human rights and actions taken.
Not relevant because of the comprehensive social and employment laws in force in the Australian operating environment.
HR3 Total hours of employee training on policies and procedures concerning aspects of human rights that are relevant to operations, including the percentage of employees trained.
Not relevant because of the comprehensive social and employment laws in force in the Australian operating environment.
HR4 Total number of incidents of discrimination and actions taken
See Workplace section—Cultural Diversity P. 44
ContinuedIndex of standard disclosures
Appendix 2
Incidents
Corruption area 2010-11 2009-10
Corruption areaTotal number of incidents in which employees were dismissed or disciplined for corruption
0 0
Business partnersTotal number of incidents when contracts with business partners were not renewed due to violations related to corruption
0 0
Legal casesLegal cases regarding corrupt practices brought against the organisation or its employees
0 0

73Delta Electricity Sustainability Report 2010-11
Disclosure Information Page
Social Performance Indicators: Human Rights - Continued
HR5 Operations identified in which the right to exercise freedom of association and collective bargaining may be at significant risk, and actions taken to support these rights.
Not relevant because of the comprehensive social and employment laws in force in the Australian operating environment.
HR6 Operations identified as having significant risk for incidents of child labour, and measures taken to contribute to the elimination of child labour.
Not relevant because of the comprehensive social and employment laws in force in the Australian operating environment.
HR7 Operations identified as having significant risk for incidents of forced or compulsory labour, and measures to contribute to the elimination of forced or compulsory labour.
Not relevant because of the comprehensive social and employment laws in force in the Australian operating environment.
HR8 Percentage of security personnel trained in the organisation’s policies or procedures concerning aspects of human rights that are relevant to operations.
Not relevant because of the comprehensive social and employment laws in force in the Australian operating environment.
HR9 Total number of incidents of violations involving rights of indigenous people and actions taken.
Not relevant because of the comprehensive social and employment laws in force in the Australian operating environment.
Social Performance Indicators: Labour Practices and Decent Work
LA1 Total workforce by employment type, employment contract and region
Employee type
Central Coast
WesternRegion Sydney Total
2010-11 2009-10
Full-time 320 278 54 652 705
Part-time 2 4 7 13 12
Part-time trainee (fixed term) 0 0 0 0 0
Casual 6 2 0 8 8
Contract staff (fixed term) 0 0 6 6 3
Temporary university students 4 5 0 9 5
Total 332 290 67 688 733
Please note that the sustainability report includes Contract Staff (fixed term) and temporary University students (total 17) which aren’t included in staff numbers in the Annual Report.
LA2 Total number and rate of employee turnover by age group, gender and region
Employee turnover rate
2010-11 2009-10
Turnover rate 6.0% 5.0%
Employee type and locality
Terminations by gender
2010-11 2009-10
Males 62 32
Females 7 5
Total 69 37
Terminations by type
2010-11 2009-10
Resignations 20 13
Redundancy 24 1
Retirements 22 18
Other 3 5
Total 69 37
Terminations by age 2010-11 2009-10
< 18 years 0 0
18 - 30 years 7 5
30 - 50 years 14 9
50 - 65 years 45 23
65 years plus 3 0
Total 69 37

AppendicesWorkplaceCommunity CustomersIntroduction Environment
Disclosure Information Page
Social Performance Indicators: Labour Practices and Decent Work - Continued
LA2 Total number and rate of employee turnover by age group, gender and regionContinued
LA3 Benefits provided to full-time employees that are not provided to temporary or part-time employees, by major operations.
There is no difference between benefits provided to Delta employees. Part-time employees are paid salaries, bonuses and superannuation contributions on a pro-rata basis.
LA4 Percentage of employees covered by collective bargaining agreements.
95% (34 not covered out of 688 as of 30/06/2011)
LA5 Minimum notice period(s) regarding significant operational changes, including whether it is specified in collective agreements
Delta does not currently report this indicator as it is not required for GRI Level B reporting.
LA6 Percentage of total workforce represented in formal joint management-worker health and safety committees that help monitor and advise on occupational safety programs
Delta Electricity had four local OHS Committees in place to implement our workplace health and safety procedures and policies:
- Delta Maintenance Central Coast with 10 members;- Delta Maintenance Western with 6 members (absorbed into
Production Western after restructure in March 2011);- Production Central Coast with 26 members; and
- Production Western with 17 members.
The total representation on health and safety committees is 59 (which is equivalent to 8.7% of the workforce).
LA7 Rates of injury, occupational diseases, lost days, absenteeism and total number of work-related fatalities by region
See Workplace section — Occupational Health and Safety P. 46
LA8 Education, training, counselling, prevention and risk-control programs in place to assist workforce members, their families or community members regarding serious diseases
LA9 Health and safety topics covered in formal agreements with trade unions.
Delta does not currently report this indicator as it is not required for GRI Level B reporting.
ContinuedIndex of standard disclosures
Appendix 2
Recruitment 2010-11 2009-10
Recruitment 24 14
Total 24 14
Recruitment by gender
2010-11 2009-10
Males 15 28
Females 9 8
Total 24 36
Recruitment by age
2010-11 2009-10
< 18 years 0 0
18 - 30 years 10 6
30 - 50 years 7 8
50 - 65 years 7 0
65 years plus 0 0
Total 24 14
Recruitment by physical location
2010-11 2009-10
Munmorah 0 0
Vales Point 3 0
Mt Piper 2 1
Wallerawang 13 3
Sydney 5 9
Colongra 1 1
Total 24 14
Assistance to workforce members regarding serious illness
Program recipients
Education and training Counselling Prevetion and
risk control Treatment
Yes No Yes No Yes No Yes No
Workers
Workers’ families
Community members
Terminations by physical location
2010-11 2009-10
Munmorah 14 2
Vales Point 28 19
Mt Piper 5 3
Wallerawang 12 8
Sydney 10 5
Total 69 37

75Delta Electricity Sustainability Report 2010-11
Disclosure Information Page
Social Performance Indicators: Labour Practices and Decent Work - Continued
LA10 Average hours of training per year per employee by employee category
LA11 Programs for skills management and lifelong learning that support the continued employability of employees and assist them in managing career endings.
Delta does not currently report this indicator as it is not required for GRI Level B reporting.
LA12 Labour and work performance - Training and education
Delta does not currently report this indicator as it is not required for GRI Level B reporting.
LA13 Composition of governance bodies and breakdown of employees per category according to gender, age group, minority group membership, and other indicators of diversity.
Delta does not currently report this indicator as it is not required for GRI Level B reporting.
LA14 Ratio of basic salary of men to women by employee category Females Males Total
Employee category 2010-11 2010-11 2010-11
Administrative officer 6.4 63 127
Adult Apprentice 0 1 1
Engineering officer 1 129 130
Operator 0 183 183
Professional officer 7 58 65
Powerworker 1 48 49
Contract Manager 1 35 36
Tradesperson 0 78 78
Trainee temporary 0 0 0
Casual administration officer 8 0 8
University students (temporary work experience)
0 8 8
Contract staff (fixed term) 0 3 3
Average 82 606 688
Gender balance by employee category
Employee training hours
Average days/employee/year
Employee category 2010-11 2009-10
Administrative officer 3.3 3.1
Adult Apprentice 1.51 -
Engineering officer 5.31 4.0
Operator 7.79 9.3
Professional officer 5.09 7.9
Powerworker 2.09 3.6
Contract Manager 2.08 2.5
Tradesperson 5.39 4.8
Trainee temporary - -
Casual administration officer - 0.1
University students (temporary work experience)
1.58 1.1
Contract staff (fixed term) 0.05 0.1
Average 5.12 5.5
The Sustainability Report performance measure includes sponsored training e.g. University and TAFE courses whereas the Annual report figure shows the average days per person of training taken through work hours.

AppendicesWorkplaceCommunity CustomersIntroduction Environment
Disclosure Information Page
Social Performance Indicators: Product Responsibility
PR1 Life cycle stages in which health and safety impacts of products and services are assessed for improvement, and percentage of significant products and services categories subject to such procedures.
Delta does not currently report this indicator as it is not required for GRI Level B reporting.
PR2 Total number of incidents of non-compliance with regulations and voluntary codes concerning health and safety impacts of products and services during their life cycle, by type of outcomes.
Delta does not currently report this indicator as it is not required for GRI Level B reporting.
PR3 Type of product and service information required by procedures, and percentage of significant products and services subject to such information requirements.
Delta does not currently report this indicator as it is not required for GRI Level B reporting.
PR4 Total number of incidents of non-compliance with regulations and voluntary codes concerning product and service information and labelling, by type of outcomes.
Delta does not currently report this indicator as it is not required for GRI Level B reporting.
PR5 Practices related to customer satisfaction, including results of surveys measuring customer satisfaction.
See Customer section — Product performance P. 58
PR6 Programs for adherence to laws, standards and voluntary codes related to marketing communications, including advertising, promotion and sponsorship
See Customer section — Product performance P. 58
PR7 Total number of incidents of non-compliance with regulations and voluntary codes concerning marketing communications, including advertising, promotion, and sponsorship by type of outcomes.
Not relevant to Delta Electricity.
PR8 Total number of substantiated complaints regarding breaches of customer privacy and losses of customer data.
Not relevant to Delta Electricity.
PR9 Monetary value of significant fines for non-compliance with laws and regulations concerning the provision and use of products and services
Delta received no fines or notices of National Electricity Law breaches in 2010-11.
GRI Electric Utility Sector Supplement Indicators
EU1 Installed capacity MW, broken down by energy source (black coal, brown coal, hydro wind etc) and by regulatory regime - local, state, country where there is a common regulatory framework.
See Introduction Section - Who we are P. 3
EU2 Net energy output broken down by primary energy source and by regulatory regime
EU3 Number of residential, industrial and commercial customer accounts
Delta is a wholesaler in the NEM. In addition, we have 3 large industrial customers that we supply electricity under wholesale supply agreements.
EU4 Length of above and underground transmission and distribution lines by regulatory regime.
Not relevant as Delta is not a distributor.
EU5 Allocation of CO2 emission permits Under the Commonwealth Government’s Clean Energy Future Package, Delta will not receive any CO2 emission permits.
ContinuedIndex of standard disclosures
Appendix 2
Energy sourceNet energy
output (MWh)Regulatory
regime
Coal 21,577,3661
NSW
Fuel oil1
NSW
Gas 62,021 NSW
Biomass 89,6032
NSW
1 Included in coal figure above not able to provide separate figure due to the small volume of fuel oil used.2 Includes Delta’s share of electricity production from the Sunshine Electricity Joint Venture.

77Delta Electricity Sustainability Report 2010-11
Disclosure Information Page
GRI Electric Utility Sector Supplement Indicators - Continued
EU6 Management approach to ensure short and long-term electricity availability and reliability
See Customer section—Reliability and availability P. 56
EU7 Demand-side management programs including residential, commercial, institutional and industrial programs.
Not relevant to Delta.
EU8 Research and development activity and expenditure aimed at providing reliable and affordable electricity and promoting sustainable development
See Environment section—Research and development P. 20
EU9 Provisions for decommissioning of nuclear power sites. Not relevant to Delta.
EU10 Planned capacity against projected electricity demand over the long-term, broken down by energy source and regulatory regime.
Delta does not currently report this indicator as it is not required for GRI Level B reporting.
EU11 Average generation efficiency See Customer Section — Portfolio efficiency P. 56
EU12 Transmission and distribution losses as a percentage of total energy.
Not relevant to Delta.
EU13 Biodiversity of offset habitats compared to biodiversity of the affected areas
Delta does not currently report this indicator as it is not required for GRI Level B reporting.
EU14 Processes to ensure retention and renewal of skilled workforce
See Workplace section — Staff retention P. 45
EU15 Percentage of employees eligible to retire in the next 5 and 10 years broken down by job and category and region.
0-5 years 0-10 years*
Category Number % Number %
Administrative officer 6 0.9% 28 4.1%
Engineering officer 12 1.7% 50 7.3%
Operator 7 1.0% 45 6.5%
Professional officer 2 0.3% 9 1.3%
Powerworker 8 1.2% 23 3.3%
Contract Manager 1 0.1% 9 1.3%
Tradesperson 2 0.3% 11 1.6%
Casual administration officer 0 0.0% 0 0.0%
Temporary university student 0 0.0% 0 0.0%
Contract staff (fixed term) 3 0.4% 3 0.4%
Total 41 6.0% 178 25.9%
0-5 years 0-10 years*
Category Number % Number %
Vales Point 16 2.2% 91 12.4%
Munmorah 6 0.8% 32 4.4%
Mt Piper 3 0.4% 21 2.9%
Wallerawang 11 1.5% 42 5.7%
Sydney 3 0.4% 12 1.6%
Colongra 0 0% 1 0.1%
Total 39 5.3% 199 27.1%
Employees eligible to retire (by category)
Employees eligible to retire (by region)
* Includes 0-5 years staff.
* Includes 0-5 years staff.
This performance indicator was not reported last year. The retirement projections used where based on an assumed retirement age of 65 for all Delta staff.

AppendicesWorkplaceCommunity CustomersIntroduction Environment
Disclosure Information Page
GRI Electric Utility Sector Supplement Indicators - Continued
EU16 Policies and requirements regarding health and safety of employees and employees of contractors and sub-contractors
Delta has developed a range of OHS Policies and Standard Procedures to manage the health, safety and welfare of all personnel working on Delta sites. All documentation is subject to stakeholder consultation, reviewed by the Executive Safety Committee and approved by the Chief Executive.
Delta reviews all our Policies and Standard Procedures within a two-year period, with many being reviewed on a more frequent basis. Delta maintains a comprehensive suite of safety policies including:
DEP SA 001 SafetyDEP SA 002 SmokingDEP SA 003 Fire Protection and ControlDEP SA 004 Access to Apparatus Rules PolicyDEP SA 005 Eye ProtectionDEP SA 006 Policy Statement on Alcohol and DrugsDEP SA 007 Corporate Policy on FatigueDEP SA 008 Distracting Devices’
Delta complies with the Occupational Health and Safety Act 2000, the Occupational Health and Safety Regulation 2001, the Workers Compensation Act 1987 and the Workplace Injury Management and Workers Compensation Act 1998. These specify that an employer must develop an injury management plan and assist in the rehabilitation of the affected worker.
EU17 Days worked by contractor and subcontractor employees involved in construction, operation & maintenance activities.
Delta does not currently report this indicator as it is not required for GRI Level B reporting.
EU18 Percentage of contractors and sub-contractors that have undergone relevant health and safety training
100% of contractors working for Delta have undertaken Delta’s Induction Training, which includes OHS training.
EU19 Participatory decision-making processes with communities and outcomes of engagement
See Community section— Engagement with local community P. 35
EU20 Approach to managing the impacts of displacement
Delta does not currently report this indicator as it is not required for GRI Level B reporting.
EU21 Contingency planning measures, disaster/emergency management plan and training programs, and recovery/restoration plans
Delta has a comprehensive business continuity management (BCM) plan to respond and restore normal operations as quickly and efficiently as possible after an emergency. It includes testing, training and auditing to ensure continuous improvement. This approach aims to make Delta as resilient as possible after an emergency.
Delta has developed ten component action plans of the BCM. Each has a review process that includes a Business Impact Analysis to assess all impacts and to develop new responses to quickly restore normal business operations.
There is also a testing and training strategy to ensure that Delta staff members have the right level of understanding, competency and confidence to enact the BCM plan during a disaster. BCM training is undertaken using two online, interactive training packages:
- BCM Response – training for all nominated staff and their reserves; and
- BCM Awareness – mandatory training for all employees.
These interactive training packages automatically update training records and notify trainees and managers when training has lapsed.
EU22 Number of people physically or economically displaced and compensation, broken down by type of project.
Delta does not currently report this indicator as it is not required for GRI Level B reporting.
ContinuedIndex of standard disclosures
Appendix 2

79Delta Electricity Sustainability Report 2010-11
Disclosure Information Page
GRI Electric Utility Sector Supplement Indicators - Continued
EU23 Programs, including those in partnership with government, to improve or maintain access to electricity and customer support services.
Not reported as not relevant to Delta as an electricity generator.
EU24 Practices to address language, cultural, low literacy and disability related barriers to accessing and safely using electricity and customer support services.
Not reported as not relevant to Delta as an electricity generator.
EU25 Number of injuries and fatalities to the public involving organization’s assets, including legal judgements, settlements and pending legal cases of disease
There were no injuries or fatalities to the public during the period.
EU26 Percentage of population unserved in licensed distribution or service areas
Not reported as not relevant to Delta as an electricity generator.
EU27 Number of residential disconnections for non-payment, broken down by duration of disconnection and by regulatory regime
Not reported as not relevant to Delta as an electricity generator.
EU28 Power outage frequency Not reported as not relevant to Delta as an electricity generator.
EU29 Average power outage duration Not reported as not relevant to Delta as an electricity generator.
EU30 Average plant availability factor by energy source and by regulatory regime
See Customer Section - Reliability and availability. All Delta plants operate in NSW.
P. 56

AppendicesWorkplaceCommunity CustomersIntroduction Environment
GOAL 1 - To be recognised by the community as a responsible environmental manager
Key element
The development of a staff engagement program aimed at fostering a recognised environmental culture among Delta staff.
Members of staff who value an environmental culture are more likely to go beyond compliance, where it is reasonable to do so, and deliver better risk management outcomes for the organisation.
- Undertook a base line survey of community attitudes to Delta’s environmental management.
- Engaged the community through number of events or sponsorships with an environmental focus
- Conducted both regional community consultation forums quarterly
- Progressed with DECCW approved Sustainability Advantage modules for Vision and Commitment, Resource Efficiency and Staff Engagement
- There was an increase in environmental enquiries from community this year (48 enquiries in 2009-10 versus 58 enquiries in 2010-11)
GOAL 2 - Adapt to climate change and a low carbon future
Key element
We will continue implementing our greenhouse response strategy by further developing low emission generation technologies. This includes ongoing development of carbon capture and storage technologies and the investigation of thermal efficiency improvements.
- Finalised the experimental carbon capture program at Munmorah
- Plans to re-establish a pilot plant at Vales Point are underway
- Vales Point was selected as the host power station for the CCS
- Demonstration project. Search for the location of a geological storage site is progressed.
- Subject to CPRS, implement recommendations from Wallerawang biomass combustion trials in accordance with approved program
- Progressed the Mallee fuel crop project
- Development of a Biomass Business Plan is in the final stages
- A resource efficiency committee was established to provide improvements to the asset management plan
GOAL 3 - Continuous improvement in the efficient use of resources and by-products
Key element
Delta shares water with the local community. We have implemented programs to minimise consumption and secure sufficient water to ensure the supply of electricity services.
Initiatives included the expansion of reverse osmosis capability in the Western region and the use of mine water for cooling purposes wherever practical. We also continue to focus on ways of better utilising ash produced from combustion of coal at our power stations.
- Included economic or strategic water reduction initiatives in Asset Management Plan and Operational Plan
- Wang RO plant constructed
- Ash utilisation strategy review was progressed
- Incorporate economic ash utilisation business plan actions into Asset Management Plan
- Increased efficiency on portfolio basis by 0.9% relative to 2009-10
- Ceased routine operation of Munmorah
2010 -11 Sustainability Goals
Appendix 3
As part of the Sustainability Advantage Program (that Delta joined in December 2009) we have developed a sustainability implementation strategy as part of our strategic plan. Last year it included five aspirational sustainability goals. This year Delta developed a sustainability scorecard and governance framework to improve our measurement and reporting of sustainability performance and to help embed sustainability into our everyday business decision-making. The five goals we developed in 2009-10 for 2010-11, and our progress in 2010-11 are reported below.
GOAL 4 - Operate beyond compliance
Key element
Delta has a well-established environmental compliance, monitoring and reporting program consistent with an organisation that is heavily regulated in environmental and other performance areas. We have a framework for project implementation, designated environmental compliance staff and annual reporting on environmental performance.
- Achieved zero Category 1 incidents
- Reviewed Environmental Standards to update compliance reporting definitions
- Included Category 2 and Category 3 incidents review in ISO14000 Audits
- Completed an successful independent audit of Delta’s NGERS submission
GOAL 5 - Provide options for generation capacity expansion
Key element
Delta finalised planning consents for the refurbishment of Munmorah Power Station and the expansion of the Mt Piper ash placement area.
- Munmorah rehabilitation project approval achieved
- MP 1/2 ash disposal development approval progressed to final stages. Project approval is anticipated by January 2012.

81Delta Electricity Sustainability Report 2010-11
Reporting materiality
Appendix 4
Determining materiality for Delta’s sustainability reporting was a key improvement target for this year’s report. Determining what is material to our stakeholders ensures that the information presented in the report reflects the range of Delta’s economic, environmental, and social impacts.
To determine materiality for this year’s report a desktop assessment was undertaken using already available information about stakeholder’s interests. A materiality matrix was developed to correlate components of Delta’s business with management aspects defined by the GRI guidelines.
The source documents for the assessment were used to represent the views of our major stakeholder groups:
- Shareholder issues—corporate risk assessment;
- Customer issues—Customer survey June 2010
- Staff issues—Word on the Street report
- Union issues Consultative Committee Minutes of meetings
- Media analysis/General Community
- Local Stakeholder survey
- Environmental complaints and risk register
- Care Forums and Reference Group minutes
- Media releases from: NGF, esaa, Australian Power Institute
- Using figures on the Merit Order implications of the NEM and Emission Intensity
The desktop exercise involved assessing the sources of information, identifying the key issues, and relating them to a set of management aspects defined in the GRI guidelines. The frequency of the management aspects across all source documents provides an approximate measure of their materiality. Combining assessments of each stakeholder document created a materiality matrix that identifies the most important management aspects. It should be noted that the stakeholder groups have varied priorities.
Materiality keyword 2011 Rank 2010 Rank
Public Policy 1 10
Emissions, Effluents, and Waste 2 1
Availability and Reliability 3 14
Provision of Information 4 -
Community 5 6
Employment 6 5
Training and Education 7 18
Economic Performance 8 -
Market Presence 9 -
Marketing Communications 10 19
Occupational Health and Safety 11 16
Water 12 2
Biodiversity 13 4
Compliance 14 3
Labour/Management Relations 15 13
Materials 16 -
Research and Development 17 7
Overall (Environment) 18 -
System Efficiency 19 12
Plant Decommissioning 20 -
Transport 21 15
Product and Service Labelling 22 9
Demand-Side Management 23 -
Diversity and Equal Opportunity 24 17
Indirect Economic Impacts 25 11
Access 26 -
Customer Health and Safety 27 -
Disaster/Emergency Planning and Response 28 20
Based on this analysis the following twenty management aspects were found to be Delta’s most material. They are highlighted in the management sections of the report:
Please note that materiality is a measure of relevance to stakeholders. Materiality is used to guide the selection of information for emphasis in this report.

AppendicesWorkplaceCommunity CustomersIntroduction Environment
Glossary of acronyms
AEMO Australian Energy Market Operator
BCM Business Continuity Management
CARE Community Access Regional Environment forum
CCS Carbon capture and storage
CFC Chlorofluorocarbon
CMC Compliance Management System
CO2 Carbon dioxide
CPRS Carbon Pollution Reduction Scheme
CSIRO Commonwealth Scientific and Industrial Research Organisation
EAPS Ethnic Affairs Priority Statement
EEO Equal Employment Opportunities
EFOF Equivalent Forced Outage Factor
EMS Environmental Management System
EP&A Act Environmental Planning and Assessment Act 1979
esaa Energy Supply Association of Australia
ESAS Electricity Sector Adjustment Scheme
ETS emissions trading scheme
GJ Gigajoule (equivalent to a thousand million joules)
GRI Global Reporting Initiative
GWh Gigawatt hour
HCFC Hydrochlorofluorocarbon
ISO International Standards Organisation
kg Kilogram
kL Kilolitre = 1,000 litres
kt Kilotonne = 1,000 tonnes
kWh Kilowatt hour = 1,000 watt hours – unit of power
LTI Lost Time Injuries
mg/L Milligrams per litre
ML Megalitre (million litres)
Mt Megatonne (million tonnes)
MW Megawatt
MWh Megawatt hour
NAIDOC National Aboriginal and Islander Day Observance Committee
NEM National Electricity Market
NGERS National Greenhouse and Energy Reporting System
NGF National Generators Forum
NOx Nitrogen oxides, primarily nitric oxide (NO) and nitrogen dioxide (NO2)
OEH Office of Environment and Heritage
OHS Occupational Health and Safety
PADA Performance and Development Agreement
pH Measure of the degree of acidity or alkalinity of a solution from 0 to 14
PJ Petajoule; a measure of energy content of fuel Petajoule = 1015 Joules
SOx Sulphur oxides, primarily sulphur dioxide (SO2) and sulphur trioxide (SO3)
WRAPP NSW Government’s Waste Reduction and Purchasing Policy

83Delta Electricity Sustainability Report 2010-11
Notes

Notes
Introduction Environment Community Customers Workplace Appendices

Corporate Office
Level 20 175 Liverpool Street Sydney NSW 2000
T 02 9285 2700 F 02 9285 2777
DELTA ELECTRICITY
View online: WWW.DE.COM.AU

Corporate Office
Level 20 175 Liverpool Street Sydney NSW 2000
T 02 9285 2700 F 02 9285 2777
DELTA ELECTRICITY
View online: WWW.DE.COM.AU