defining the molecular evolution of extrauterine high
TRANSCRIPT

Contents lists available at ScienceDirect
Gynecologic Oncology 155 (2019) 305e317
Gynecologic Oncology
journal homepage: www.elsevier .com/locate/ygyno
Defining the molecular evolution of extrauterine high grade serouscarcinoma
James P. Beirne a, c, *, Darragh G. McArt b, Aideen Roddy b, Clara McDermott a,Jennifer Ferris a, Niamh E. Buckley a, d, Paula Coulter d, Nuala McCabe a, Sharon L. Eddie a,Philip D. Dunne e, Paul O'Reilly b, Alan Gilmore b, Laura Feeney a, g, David Lyons Ewing a,Ronny I. Drapkin f, Manuel Salto-Tellez a, h, Richard D. Kennedy a, g, Ian J.G. Harley a, c,W. Glenn McCluggage a, c, i, Paul B. Mullan a
a Ovarian Cancer Research Programme, Centre for Cancer Research and Cell Biology, Queen's University, Belfast, United Kingdom of Great Britain andNorthern Irelandb Department of Cancer Bioinformatics, Queen's University, Belfast, United Kingdom of Great Britain and Northern Irelandc Northern Ireland Centre for Gynaecological Cancer, Belfast Health and Social Care Trust, Belfast, United Kingdom of Great Britain and Northern Irelandd School of Pharmacy, Queen's University, Belfast, United Kingdom of Great Britain and Northern Irelande Department of Translational Cancer Genomics, Centre for Cancer Research and Cell Biology, Queen's University, Belfast, United Kingdom of Great Britainand Northern Irelandf Ovarian Cancer Research Center, University of Pennsylvania Perelman School of Medicine, Philadelphia, PA, USAg Northern Ireland Cancer Centre, Belfast Health and Social Care Trust, Belfast, United Kingdom of Great Britain and Northern Irelandh Northern Ireland Molecular Pathology Laboratory, Centre for Cancer Research and Cell Biology, Queens University, Belfast, United Kingdom of Great Britainand Northern Irelandi Department of Pathology, Belfast Health and Social Care Trust, Belfast, United Kingdom of Great Britain and Northern Ireland
h i g h l i g h t s
� New molecular evidence that high grade serous carcinogenesis commences in the distal fallopian tube.� Serous tubal intra-epithelial carcinoma is molecularly highly similar to metastatic high grade serous carcinoma.� Aberrant upregulation of mitosis-related pathways is strongly associated with evolution of HGSC from the fallopian tube.
a r t i c l e i n f o
Article history:Received 1 May 2019Received in revised form 23 August 2019Accepted 25 August 2019Available online 4 September 2019
Keywords:Ovarian cancerPathogenesisMolecular profiling
* Corresponding author at: Centre for Cancer ResearchE-mail address: [email protected] (J.P. Beirne).
https://doi.org/10.1016/j.ygyno.2019.08.0290090-8258/© 2019 Elsevier Inc. All rights reserved.
a b s t r a c t
Objective: High grade serous carcinoma (HGSC) is the most common and most aggressive, subtype ofepithelial ovarian cancer. It presents as advanced stage disease with poor prognosis. Recent pathologicalevidence strongly suggests HGSC arises from the fallopian tube via the precursor lesion; serous tubalintraepithelial carcinoma (STIC). However, further definition of the molecular evolution of HGSC hasmajor implications for both clinical management and research. This study aims to more clearly define themolecular pathogenesis of HGSC.
Methods: Six cases of HGSC were identified at the Northern Ireland Gynaecological Cancer Centre(NIGCC) that each contained ovarian HGSC (HGSC), omental HGSC (OMT), STIC, normal fallopian tubeepithelium (FTE) and normal ovarian surface epithelium (OSE). The relevant formalin-fixed paraffinembedded (FFPE) tissue samples were retrieved from the pathology archive via the Northern IrelandBiobank following attaining ethical approval (NIB11:005).Full microarray-based gene expression profiling was performed on the cohort. The resulting data wasanalysed bioinformatically and the results were validated in a HGSC-specific in-vitro model.
Results: The carcinogenesis of HGSC was investigated and showed the molecular profile of HGSC tobe more closely related to normal FTE than OSE. STIC lesions also clustered closely with HGSC, indicatinga common molecular origin.
Conclusion: This study provides strong evidence suggesting that extrauterine HGSC arises from thefimbria of the distal fallopian tube. Furthermore, several potential pathways were identified which could
and Cell Biology, Queen's University, 97 LisburnRoad, Belfast BT97AE, United Kingdomof Great Britain andNorthern Ireland.

J.P. Beirne et al. / Gynecologic Oncology 155 (2019) 305e317306
be targeted by novel therapies for HGSC. These findings have significant translational relevance for bothprimary prevention and clinical management of the disease.
© 2019 Elsevier Inc. All rights reserved.
1. Introduction 2.2. RNA preparation and gene expression profiling
Epithelial ovarian cancer (EOC) is the most lethal gynaecologicalmalignancy in the western world. In 2012 there were 152,000 and4300 deaths from ovarian cancer worldwide and in the UK,respectively [1]. This equates to twelve women dying from ovariancancer daily within the UK. High grade serous carcinoma (HGSC)accounts for ~70% of all EOCs and ~90% of advanced stage EOCs(stage III-IV), making it the most common and most deadlysubtype.
At a molecular level, HGSC is essentially ubiquitous for p53mutations [2]. Germline mutations in the BRCA1 or BRCA2 genes arepresent in 6.5e19% of HGSCs [3]. BRCA-mutated HGSCs are associ-ated with an increased likelihood of visceral metastases [4]. BRCA1dysfunction is also detected in sporadic cases with mutations re-ported in 15e72% and loss of function (BRCAness) observed at highfrequency [5,6].
Despite extensive investigation, the molecular mechanisms ofHGSC development remain unknown. Historically, it was thoughtHGSC developed from the ovarian surface epithelium (OSE) due toerrors in cell replication associated with the repair of traumaincurred by ovulation [7]. Several epidemiological studies sup-ported this theory with evidence that women with an increasednumber of lifetime ovulations are at a greater risk of developingHGSC [8e11].
Recently, pathological evidence has emerged that supports thetheory that the distal fallopian tube is the origin of HGSC [12]. Initialevidence for a tubal origin came from the study of risk-reducingsalpingo-oophorectomy (RRSO) specimens in women at high riskof hereditary breast and ovarian cancers [13,14]. Further investi-gation revealed most HGSCs arise from the distal fallopian tubefrom a precursor referred to as serous tubal intraepithelial carci-noma (STIC) [15]. These STIC lesions show identical p53 mutationsto the adjacent HGSC establishing a link between STIC and HGSC[16]. To complement this pathological data, we now present strongmolecular evidence suggesting high grade serous carcinogenesiscommences in the fallopian tube.
2. Materials and methods
2.1. Study cohort and tissue preparation
Tissue samples from six cases of sporadic, stage III/IV HGSCwerecollected from patients who underwent primary cytoreductivesurgery at the Northern Ireland Gynaecological Cancer Centre(Ethical approval: Northern Ireland Biobank NIB11:005,NIB13:0094). Cases were chosen based on the availability of thefollowing tissues: normal OSE, normal FTE, STIC, ovarian HGSC, andOMT. All cases had fully anonymised, matched clinico-pathologicaldata (see Supplementary file 1).
A haematoxylin and eosin (H&E) stained slide was preparedfrom each formalin fixed paraffin embedded (FFPE) block from allsix cases. The slides were reviewed by a specialist GynaecologicalPathologist (WGM) and appropriate areas annotated for each of thefive sample sites. The STIC lesions were selected from an areadistant from tumour to minimise contamination. Subsequently, ten5 mm sections were cut for macrodissection and RNA preparation.Finally, a further H&E was prepared to confirm the annotated re-gions were still present and therefore represented throughout thesections for RNA preparation.
RNA was extracted using the Roche HighPure® RNA IsolationKit (Roche, UK). Following RNA extraction, spectrophotometerquality control (QC) was performed. All samples were amplifiedusing the WT-Ovation FFPE System V2 kit (NuGEN TechnologiesInc., San Carlos, CA, USA). Following amplification, cDNA sampleswere quality controlled using both the spectrophotometer andthe Agilent 2100 bioanalyzer. Samples proceeded to fragmenta-tion and labelling using the NuGEN Encore Biotin module V2(NuGEN Technologies Inc.), before hybridisation onto Xcel® ar-rays (ALMAC Diagnostics, Craigavon, UK) in accordance with theNuGEN guidelines for hybridisation onto Affymetrix GeneChip®arrays.
2.3. Bioinformatic analysis
Background correction and normalization of gene expressiondata was carried out using justRMA, provided by the ‘affy’ Bio-conductor package [17], within the R statistical package (version3.2.2) [18]. Initial correspondence analysis was carried out on all thesamples using the ‘ade4’ [19] and ‘made4’ [20] packages. Both thecomplete expression set and a non-specific variance based filteredexpression set implemented by the ‘genefilter’ [21] package,retaining the top twenty percent of most variant probes, wereanalysed.
Following initial analysis, three comparisons (FTE vs. STIC, STICvs. ovarian HGSC and ovarian HGSC vs. OMT) were performed,using genefilter to rank the probes on the F-test and assessed thetop one hundred probes ability to stratify by way of a heatmapderived from a hierarchical clustering method involving squaredEuclidean distance and Ward's method, as described by Murtaghand Legendre [22], using the ‘heatmap.plus’ [23] package. Thelimma package [24] was then used to identify the top differentiallyexpressed genes for each comparison. These gene lists wereuploaded to Ingenuity Pathway Analysis (IPA®, QIAGEN RedwoodCity, www.qiagen.com/ingenuity) according to their Ensembl ID,with a false discovery rate cut off set at 0.05. A core analysis wasperformed on each of the data sets using the parameters outlined inSupplementary file 2.
The analysis assessed the activity of canonical pathways withinthe dataset, based on the z-score. An orange bar means the analysissoftware predicted an overall increase in the activity of thepathway, a blue bar means the software predicted an overalldecrease in the activity of the pathway, a white bar means thatpathway activity is unchanged from normal, and a grey bar meansthat activity predictions were not possible (mainly due to a lack ofpublications in the topic area). The ratio of pathway activity isidentified by the orange line. From these analyses, the top ten ca-nonical pathways were identified for each of the three compari-sons. Subsequently, gene expression profiles from an independentHGSC dataset were downloaded from the NCBI Gene ExpressionOmnibus (http://www.ncbi.nlm.nih.gov/geo/) under accessionnumber GSE69429. This dataset contained transcription profiles ofnormal fallopian tube, STIC and HGSC from 6 patients (n¼ 18samples in total). The transcriptional profiles were generated onthe Affymetrix HuEx-1_0-st-v2 array. We utilised the core genenormalised series matrix data for the analysis in our study.
The top 500 differentially expressed genes/probes representingthe FTE vs. STIC and STIC vs. ovarian HGSC comparisons, from our

J.P. Beirne et al. / Gynecologic Oncology 155 (2019) 305e317 307
study, were filtered to include genes/probes which had an adjustedp-value< 0.05 and fold change ±1.5. This generated two filteredgene lists; STIC vs ovarian HGSC reduced to 79 transcripts encoding51 unique genes and FTE vs STIC reduced to 154 transcriptsencoding 103 unique genes.
Partek Genomics Suite software (version 6.6) (Partek Inc., St.Louis, MO, USA.) was used for analysis of the independent dataset.For clustering, datamatrices were standardised to themedian valueof probe sets expression. Standardisation of the data allows forcomparison of expression levels for different probe sets. Followingstandardisation, 2-dimensional hierarchical clustering was per-formed. Euclidean distance was used to calculate the distancematrix; a multidimensional matrix representing the distance fromeach data point (probe set-sample pair) to all the other data points.Ward's linkage method was subsequently applied to join samplesand genes together, with the minimum variance, to find compactclusters based on the calculated distance matrix.
2.4. In vitro validation model
A HGSC-specific cell model was curated from validated cell lines[25,26]. KURAMOCHI, OVCAR3 and OVCAR4 were maintained inRPMI supplemented with 10% fetal calf serum (FCS), 1mmol/L so-dium pyruvate, and 50 mg/mL penicillin-streptomycin (Life Tech-nologies Inc., UK.) COV362 were maintained in DMEMsupplemented with 10% FCS,1mmol/L sodium pyruvate, and 50 mg/mL penicillin-streptomycin (Life Technologies Inc., UK.).
A non-HGSC specific cell model was also curated from validatedcell lines [25,26]. IGROV1 and SKOV3 were maintained in RPMIwith 10% FCS, 1mmol/L sodium pyruvate, and 50 mg/mL penicillin-streptomycin (Life Technologies Inc., UK.). JHOC5 were maintainedin DMEM/F12, 10% FCS and 0.1uM NEAA.
Fallopian tube secretory epithelial cells (FTSECs) were obtainedfrom one of the authors (RID) [27]. FT190 was used to representnormal FTE and FT246 (containing a stable p53 shRNA construct)was used to represent STIC. They weremaintained in DMEM-Ham'sF12 (Gibco®, Thermo Fisher Scientific Inc., UK) 2% Ultroser G (PallBioSepra, Cergy, France) and 1% penicillin-streptomycin (LifeTechnologies Inc., UK) [27]. Total RNA was extracted using RNASTAT60® (Invitrogen) and quantified using the NanoDrop 2000spectrophotometer (Thermo Fisher Scientific Inc., UK.). Subse-quently, 2 mg RNA was reverse transcribed using the TranscriptorFirst Strand cDNA Synthesis Kit (Roche, UK).
2.5. FFPE tissue validation model
The RNA preparation procedure described above was repeatedin the six-patient cohort, within the Northern Ireland MolecularPathology Laboratory (NIMPL). Total RNA was quantified using theQUBIT fluorometer (Thermo Fisher Scientific Inc., UK.). Subse-quently, 0.5 mg RNA was reverse transcribed using the TranscriptorFirst Strand cDNA Synthesis Kit (Roche, UK).
2.6. Endonuclease-prepared siRNA screening strategy
The Mission® esiRNA platform (Sigma-Aldrich, Dorset, UK) wasused to design an assay containing 60 esiRNAs (58 targets and 2controls) against several potential oncogenic targets. The selectionwas based upon the GEP data along with inclusion of somecommonly known oncogenes (see Supplementary file 3). R-lucif-erase (R-LUC) and KIF11 were selected as negative and positivecontrols respectively. This platform was selected to reduce thelikelihood of any identified effect on cell viability being associated
with off-target effects. The esiRNA screen was performed using acell density of 2000/well in a 96-well plate with an incubation of7 days, in triplicate (FT190, OVCAR4, and KURAMOCHI cell lines).Cell viability was assessed by Sulforhodamine B (SRB) colorimetricassay as previously described [28]. Plates were read at 505 nm on aBiotek Synergy 2 Multi-Modal microplate reader (Biotek In-struments Inc., Winooski, Vermont, USA) and data generated usingGen5 imager software (Biotek Instruments Inc., Winooski, Ver-mont, USA).
2.7. siRNA screening strategy
Lipofectamine® RNAiMAX reagent (Invitrogen, Thermo FisherScientific, Loughborough, UK) was used according to the manu-facturer's specifications. Cells were seeded at a density of 3e5� 105
cells in a 20 cm2 tissue culture dish and underwent validation assayafter 72 h incubation unless otherwise stated.
2.8. RT-qPCR methodology
The RealTime® ready Human Reference Gene Panel (Roche,West Sussex, UK) consists of 19 pretested, ready-to-use RT-qPCRreference gene assays along with three positive and two negativecontrol assays for the reverse transcription (RT) reaction preloadedto a 96-well plate. The panel was applied to the study cell model, inaccordance with the manufacturers' guidance, to determine themost appropriate reference genes for gene expression assays. Theresultant data was then interrogated using the NormFinder version20 algorithm (NormFinder, Department of Molecular Medicine,Aarhus University Hospital, Aarhus, Denmark). All RT-qPCR assayswere performed using LightCycler® 480 SYBR Green I Master(Roche, West Sussex, UK), in line with manufacturers' instructions,on the LightCycler® 96 real-time PCR system. For each target ofinterest, a set of standards, a no treatment control and a non-reverse transcription control were incorporated.
2.9. Western blotting
Briefly, total cellular protein extracts were prepared by adding200 mL lysis buffer (0.25M NaCl, 0.1% Igepal, 0.25M HEPES, 5mMEDTA, 0.5mM dithiothreitol [DTT]) to a 90-mm plate containingthe relevant cell lines and the lysed cells were harvested with acell scraper. Each cell lysatewas passed through a 21-gauge needlefive times, followed by incubation on ice for 10min to ensureadequate lysis. The lysates were centrifuged at 15000 g for 15minat 4 �C to pellet the cell debris. The supernatant was storedat�20 �C. Protein concentration in the supernatant was quantifiedwith the use of a Bio-Rad protein assay kit. Equal amounts ofprotein (typically 60 mg per lane) were analysed bySDSepolyacrylamide gel electrophoresis (PAGE). Following elec-trophoresis, the proteins were transferred onto Hybond-P poly-vinylidene difluoride membrane (Amersham). Transfer wascarried out at 100 V for 2 h. Following transfer, the Hybond-Pmembrane was incubated in blocking solution (5% milk [Marvel]in 1� TBST (5M NaCl, 1 M Tris [pH 7.4], 1 M KCl, 0.1% Tween 20) for1 h. Primary antibody to RRM2 [1E1] was made up at a concen-tration of 1:2000 in 5% milk/PBS/T (Abcam, Cambridge, UK). Anti-mouse was used as secondary at a concentration of 1:2000. Themembrane was washed extensively, then subjected to a chem-iluminescence detection agent (Amersham) for 5min. The mem-brane was then analysed by autoradiography.

J.P. Beirne et al. / Gynecologic Oncology 155 (2019) 305e317308
J.P. Beirne et al. / Gynecologic Oncology 155 (2019) 305e317 309
2.10. Clonogenics
Cells were seeded at a density of 3� 10̂ 5 per well and forwardtransfectedwith two 20 nM RRM2-specific siRNA sequences. Mediawas replenished after 96 h. Following 7e10 days, colony formationwas assessed via crystal violet staining and quantified by resus-pension utilising 1M sodium citrate 50% ethanol solution andabsorbance was measured at 570 nm on the Biotrak II microplatereader. Each sample was normalised to the control.
2.11. FFPE tissue
All RT-qPCR assays of FFPE-derived cDNA employed the Real-Time® Ready platform and pre-amplification (Roche, West Sussex,UK). Pre-amplification with gene-specific primer sets results in>4000-fold amplification of the selected targets without creating abias towards the original representation of the targets in the inputRNA. This technology is ideal for cDNA transcribed from RNAextracted from FFPE tissue. A RealTime® Ready Custom Panel(Roche, UK), comprising 46 targets and 2 controls in duplicate, wasdesigned specifically for this study. The assays were performed inlinewith themanufacturers' guidancewith an input of 200 ng cDNA.
2.12. Calculation of relative gene expression
Relative gene expressionwas calculated from themean RT-qPCRcycle threshold (CT) data using a standard DDCT calculation.
2.13. Statistical analysis
Analyses were performed using GraphPad Prism version 5 soft-ware (La Jolla, California, USA) unless otherwise stated. Statisticaltests are indicated in the relevant figure legend alongside p values.
3. Results
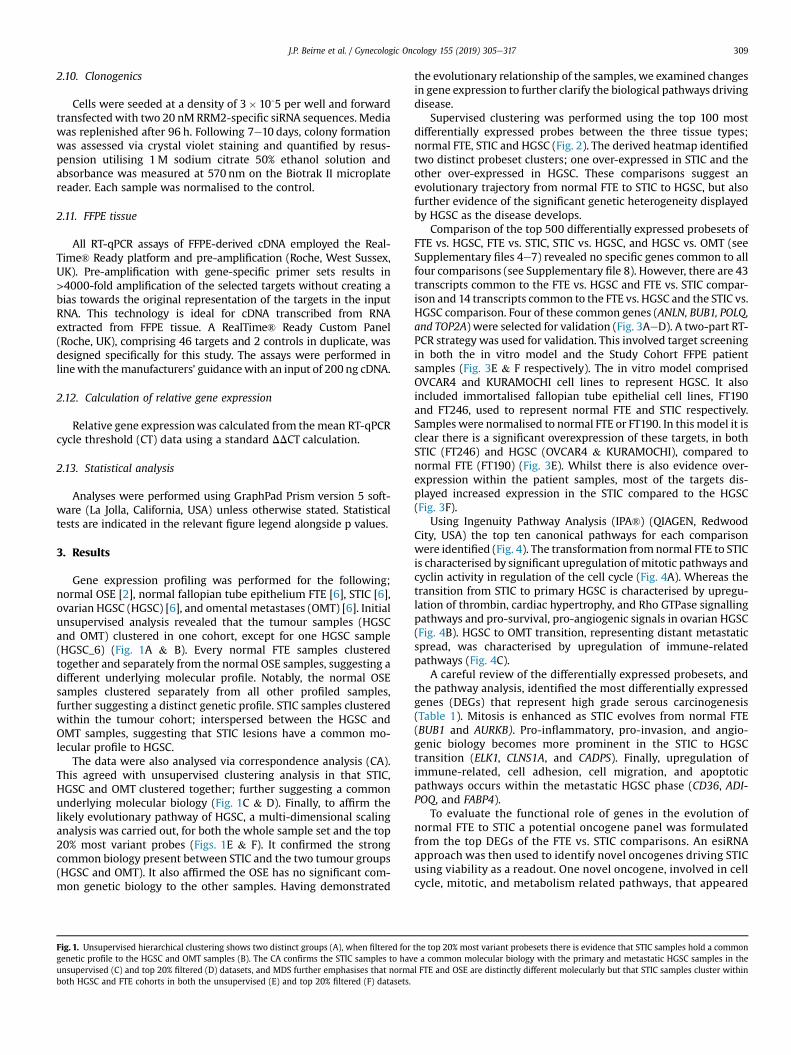
Gene expression profiling was performed for the following;normal OSE [2], normal fallopian tube epithelium FTE [6], STIC [6],ovarian HGSC (HGSC) [6], and omental metastases (OMT) [6]. Initialunsupervised analysis revealed that the tumour samples (HGSCand OMT) clustered in one cohort, except for one HGSC sample(HGSC_6) (Fig. 1A & B). Every normal FTE samples clusteredtogether and separately from the normal OSE samples, suggesting adifferent underlying molecular profile. Notably, the normal OSEsamples clustered separately from all other profiled samples,further suggesting a distinct genetic profile. STIC samples clusteredwithin the tumour cohort; interspersed between the HGSC andOMT samples, suggesting that STIC lesions have a common mo-lecular profile to HGSC.
The data were also analysed via correspondence analysis (CA).This agreed with unsupervised clustering analysis in that STIC,HGSC and OMT clustered together; further suggesting a commonunderlying molecular biology (Fig. 1C & D). Finally, to affirm thelikely evolutionary pathway of HGSC, a multi-dimensional scalinganalysis was carried out, for both the whole sample set and the top20% most variant probes (Figs. 1E & F). It confirmed the strongcommon biology present between STIC and the two tumour groups(HGSC and OMT). It also affirmed the OSE has no significant com-mon genetic biology to the other samples. Having demonstrated
Fig. 1. Unsupervised hierarchical clustering shows two distinct groups (A), when filtered forgenetic profile to the HGSC and OMT samples (B). The CA confirms the STIC samples to havunsupervised (C) and top 20% filtered (D) datasets, and MDS further emphasises that normaboth HGSC and FTE cohorts in both the unsupervised (E) and top 20% filtered (F) datasets.
the evolutionary relationship of the samples, we examined changesin gene expression to further clarify the biological pathways drivingdisease.
Supervised clustering was performed using the top 100 mostdifferentially expressed probes between the three tissue types;normal FTE, STIC and HGSC (Fig. 2). The derived heatmap identifiedtwo distinct probeset clusters; one over-expressed in STIC and theother over-expressed in HGSC. These comparisons suggest anevolutionary trajectory from normal FTE to STIC to HGSC, but alsofurther evidence of the significant genetic heterogeneity displayedby HGSC as the disease develops.
Comparison of the top 500 differentially expressed probesets ofFTE vs. HGSC, FTE vs. STIC, STIC vs. HGSC, and HGSC vs. OMT (seeSupplementary files 4e7) revealed no specific genes common to allfour comparisons (see Supplementary file 8). However, there are 43transcripts common to the FTE vs. HGSC and FTE vs. STIC compar-ison and 14 transcripts common to the FTE vs. HGSC and the STIC vs.HGSC comparison. Four of these common genes (ANLN, BUB1, POLQ,and TOP2A) were selected for validation (Fig. 3AeD). A two-part RT-PCR strategy was used for validation. This involved target screeningin both the in vitro model and the Study Cohort FFPE patientsamples (Fig. 3E & F respectively). The in vitro model comprisedOVCAR4 and KURAMOCHI cell lines to represent HGSC. It alsoincluded immortalised fallopian tube epithelial cell lines, FT190and FT246, used to represent normal FTE and STIC respectively.Samples were normalised to normal FTE or FT190. In this model it isclear there is a significant overexpression of these targets, in bothSTIC (FT246) and HGSC (OVCAR4 & KURAMOCHI), compared tonormal FTE (FT190) (Fig. 3E). Whilst there is also evidence over-expression within the patient samples, most of the targets dis-played increased expression in the STIC compared to the HGSC(Fig. 3F).
Using Ingenuity Pathway Analysis (IPA®) (QIAGEN, RedwoodCity, USA) the top ten canonical pathways for each comparisonwere identified (Fig. 4). The transformation fromnormal FTE to STICis characterised by significant upregulation of mitotic pathways andcyclin activity in regulation of the cell cycle (Fig. 4A). Whereas thetransition from STIC to primary HGSC is characterised by upregu-lation of thrombin, cardiac hypertrophy, and Rho GTPase signallingpathways and pro-survival, pro-angiogenic signals in ovarian HGSC(Fig. 4B). HGSC to OMT transition, representing distant metastaticspread, was characterised by upregulation of immune-relatedpathways (Fig. 4C).
A careful review of the differentially expressed probesets, andthe pathway analysis, identified the most differentially expressedgenes (DEGs) that represent high grade serous carcinogenesis(Table 1). Mitosis is enhanced as STIC evolves from normal FTE(BUB1 and AURKB). Pro-inflammatory, pro-invasion, and angio-genic biology becomes more prominent in the STIC to HGSCtransition (ELK1, CLNS1A, and CADPS). Finally, upregulation ofimmune-related, cell adhesion, cell migration, and apoptoticpathways occurs within the metastatic HGSC phase (CD36, ADI-POQ, and FABP4).
To evaluate the functional role of genes in the evolution ofnormal FTE to STIC a potential oncogene panel was formulatedfrom the top DEGs of the FTE vs. STIC comparisons. An esiRNAapproach was then used to identify novel oncogenes driving STICusing viability as a readout. One novel oncogene, involved in cellcycle, mitotic, and metabolism related pathways, that appeared
the top 20% most variant probesets there is evidence that STIC samples hold a commone a common molecular biology with the primary and metastatic HGSC samples in thel FTE and OSE are distinctly different molecularly but that STIC samples cluster within

Fig. 2. Heatmap showing how the top 100 probesets stratify the three contrasts: Normal FTE, STIC, and HGSC. There appears to be a set of probes becoming progressivelyrepressed and a set progressively over-expressed from normal FTE to HGSC, via STIC. Within the set of probes that become over-expressed with HGSC, a subgroupappears to be over-expressed with the development of STIC (dotted box) whereas another subgroup appears to delay over-expression until the development of HGSC(dashed box).
J.P. Beirne et al. / Gynecologic Oncology 155 (2019) 305e317310

Fig. 3. Four transcripts selected for validation of the GEP array (AeD). All show a fold change of 2e3 between normal FTE and “Cancer”. Again, STIC samples behave molecularlysimilarly to primary HGSC. Unpaired t-test confirms statistical significance between normal FTE and any other tissue type with a p-value consistently <0.005. The four transcriptswere interrogated by RqPCR within the HGSC-specific cell model (E) and within the FFPE-tissue samples (F).
J.P. Beirne et al. / Gynecologic Oncology 155 (2019) 305e317 311

Fig. 4. IPA® reveals the top 10 canonical pathways associated with the progression fromnormal FTE to STIC (A), STIC to HGSC (B), and HGSC to Omental Metastases (OMT) (C).The analysis assessed the activity of canonical pathways within the dataset, based on thez-score. An orange bar means the analysis software predicted an overall increase in theactivity of the pathway, a blue bar means the software predicted an overall decrease inthe activity of the pathway, a white bar means the z-score was close to zero (and activitytherefore unchanged from normal) and a grey bar means that activity “predictions”weren't possible (mainly due to a lack of publications in the topic area). The ratio ofpathway activity is marked by the orange line. (For interpretation of the references tocolor in this figure legend, the reader is referred to the web version of this article.)
J.P. Beirne et al. / Gynecologic Oncology 155 (2019) 305e317312
consistently was Ribonucleotide Reductase M2 (RRM2) (Fig. 5).The screen also confirmed the crucial role of many of the mitoticgenes (e.g. ANLN, BUB1B and TOP2A) that were previously shownto be overexpressed in STIC and HGSC (Fig. 3AeF). The role ofRRM2 was further explored using independent siRNAs in boththe HGSC-specific cell model and also a non-HGSC ovariancancer cell panel. The loss of RRM2 clearly had an effect on cellgrowth but it did not appear to be HGSC-specific (Fig. 6AeD). At aprotein level, examined by western blot, there was no demon-strable effect of RRM2 silencing (Fig. 6E & F). These data suggestRRM2 may play a role in EOC carcinogenesis but is not specific toHGSC.
During this project a study using similar samples was pub-lished [29]. This provided us with a unique opportunity to usethese additional samples as a validation cohort. They reported acommon molecular profile of STIC and invasive STIC (HGSC) withevidence of a 62-gene signature that becomes overexpressedwith carcinogenesis. When the 62-gene signature was applied toour independent cohort similar results were noted (seeSupplementary file 9). The normal FTE cluster is distinctlyseparate from that of the STIC and HGSC. The outcome of thisanalysis reinforces the strength of the current study's GEPdataset but also further emphasises the HGSC evolution fromnormal FTE.
4. Discussion
There is an ever-expanding body of pathological evidencesupporting the fallopian tube as the site of origin of extrauterineHGSC. The majority of the initial evidence emanated from thestudy of RRSO specimens from women at high risk of developingHGSC [13]. Since then, evidence has accumulated that sporadicHGSCs also derive from the fallopian tube in a significant ma-jority of cases [30]. The current study adds weight to the path-ological evidence by defining the underlying molecular profile ofHGSC. Specifically, it provides molecular evidence of the evolu-tion of HGSC from the fallopian tube with STIC as a transitionpoint.
The comparison of the top 500 differentially expressed probe-sets of FTE vs. HGSC, FTE vs. STIC, STIC vs. HGSC, and HGSC vs. OMTproved interesting. The fact there were specific groups of genescommon to the FTE vs. HGSC and FTE vs. STIC comparison and theSTIC vs. HGSC and FTE vs. HGSC comparison suggests these clustersof genes may be associated with the malignant transformation ofnormal FTE. Furthermore, the fact most genes associated withdistant metastatic spread (HGSC vs OMT) are not commonwith anyother group suggests they are associated disease survival and me-tastases rather than cancer initiation.
The observation of upregulated mitotic genes and aberrant cellcycle regulators in the evolution of normal FTE to STIC advancesthe relative paucity of knowledge regarding early HGSC carcino-genesis. The surge of mitotic pathway expression and cyclin ac-tivity combined with reciprocal repression of cell cycle checkpointregulation (particularly in association with DNA damage) is bothin keeping with the genomic instability of HGSC and characteristicof this phase of disease pathogenesis. One study reported cellcycle arrest and increased expression of the mitotic checkpointmembers in a cell model designed to mimic STIC lesions as theyaged in culture [31]. Concurrently, it was shown that down-regulation of BRCA1 in the aging cells led to activation of theanaphase promoting complex and subsequent return to the cellgrowth pattern seen with ‘younger’ cells. It is likely that loss ofBRCA1 may lead to initiation of a new cell cycle without fullcompletion of cytokinesis. This biology is classical of an earlycarcinogenic event and carries significant potential for biomarkerand therapeutic development.

Table 1The most differentially expressed genes associated with evolution of the high gradeserous carcinoma. Each set of genes is an indicative reflection of the underlyingmolecular biology within each phase.
NFT-STIC
TPX2, Microtubule-Associated (TPX2)Budding Uninhibited By Benzimidazoles 1 (BUB1)Ubiquitin-Conjugating Enzyme E2C (UBE2C)Anillin Actin Binding Protein (ANLN)Aurora Kinase B (AURKB)Abnormal Spindle Microtubule Assembly (ASPM)Ligand Dependent Nuclear Receptor Corepressor-Like (LCORL)ZW10 Interacting Kinetochore Protein (ZWINT)
STIC-HGSC
Delta-Like 1 Homolog (DLK1)Kelch Domain Containing 8A (KLDCH8A)Chloride Channel, Nucleotide-Sensitive, 1A (CLNS1A)ELK1, Member of ETS Oncogene Family (ELK1)Calcium-Dependent Secretion Activator (CADPS)Collectin Sub-family Member 11 (COLEC11)TraB Domain Containing 2A (TRABD2A)
HGSC-OMT
Adiponectin, C1Q and Collagen Domain Containing (ADIPOQ)CD36 Molecule (Thrombospondin Receptor) (CD36)Fatty Acid Binding Protein 4, Adipocyte (FABP)Delta-Like 1 Homolog (DLK1)Kelch Domain Containing 8A (KLDCH8A)Collectin Sub-family Member 11 (COLEC11)Perilipin 1 (PLIN1)Alcohol Dehydrogenase 1B (class I), Beta Polypeptide (ADH1B)
J.P. Beirne et al. / Gynecologic Oncology 155 (2019) 305e317 313
The molecular profile of the STIC to HGSC transition is charac-terised by upregulation of thrombin, cardiac hypertrophy, and RhoGTPases signalling pathways. This stage of pathogenesis is associ-ated with early intraperitoneal metastasis and other groups havereported elevated thrombin signalling, with downstream upregu-lation of NF-kB, and pro-inflammatory platelet activationmediatingcell invasion and pro-survival, pro-angiogenic signals in ovariancancer cells [32]. The role of Rho family GTPases and their down-stream effectors, like ROCK and ERK, have also been shown to play amajor role in epithelial e mesenchymal transition, cancer cellmotility, and invasion in ovarian cancer [33,34].
The evolution of HGSC to OMT is characterised by upregulationof immune-related pathways. Leucocyte extravasation signallingupregulation associatedwith elevated Rho GTPase activity has beenreported in the STIC to HGSC transition [35]. It also plays a role intransition of leucocytes from the bloodstream to tissue and viceversa; this is an important feature of metastases and potentiallycould be manipulated for liquid biopsies. Elevated Tec Kinase sig-nalling also correlates with this stage of disease, as it is an activatorof adhesion, migration, apoptosis, and a known T-cell activator.Similarly, iCOS-iCOSL signalling is heavily involved with T-helpercell activation and differentiation via NFAT signalling. These find-ings are in keeping with the knowledge of the role of immuneevasion in the survival of a range of cancers [36]. The DEG pathwayanalysis of ovarian to omental HGSC transition in our study reflectsa state of immune dysregulation (notably via T-helper lymphocyteand B-lymphocyte regulated genes), indicating processes such as T-Cell exhaustion which has been reported to be a feature ofadvanced HGSC [37]. Therapeutically, this could indicate this latestage of disease might be vulnerable to immune checkpoint-basedtherapies.
Whilst this study is based upon a limited sample set, it isuniquely suited to carefully analyse alterations in pathology as thedata arises from samples from the same patient. This reduces theexperimental noise that would normally be associated with inter-patient comparisons. Accurate, detailed pathological annotationand expansive gene expression profiling further amplify the qualityof the resulting data. Although only two normal OSE samples wereincluded in the study due to quality control constraints, there was aclear separation of these samples from all other samples includedin the study. Furthermore, given the evidence that STIC has acommonmolecular profile to HGSC (both ovarian and omental), thewealth of prior pathological evidence suggesting STIC is the pri-mary neoplasm, and the fact that STIC lesions originate on the distalFTE, this study provides further support for a fallopian tubal originfor HGSC.
Additional support for the fallopian origin comes from com-bined analysis between this study and a prior study [29]. There areno other studies that have compared ovarian tumour/HGSC withnormal fallopian tube. To date, expression profiling studies ofovarian carcinogenesis continue to use OSE as a comparator-control[38]. This external dataset also identified mitotic genes, as in thecurrent study, to be overexpressed in early carcinogenesis, againsuggesting that mitotic dysfunction is crucial to the evolution ofHGSC. The combined analysis validated the strength of our geneexpression profiling dataset with the normal FTE vs. STIC signatureclearly separating the normal FTE from the ‘cancer’ cluster. Thesame effect was not seen for the STIC vs. HGSC signature and thismay reflect the slight difference in tissue source or the loss of geneclassifiers on transfer between analysis platforms. The fact that thebiological profile of early carcinogenesis seen in this study wasconfirmed in the combined analysis affirms the scientific approachof using the fallopian tube, rather than normal OSE as in previousstudies, as the comparator cell of origin. Consequently, this bolsters
the molecular evidence of a carcinogenic pathway from normal FTEto HGSC, via STIC.
5. Conclusion
The characterisation of the underlying molecular profile ofHGSC has more clearly defined the evolutionary trajectory of thedisease. Consequently, it adds to the current body of knowledgeregarding disease pathogenesis. The identification of key regu-latory pathways, most notably the aberrant upregulation ofmitosis-related pathways, has also provided insight into thebiological processes driving the evolution of HGSC from the fal-lopian tube. The understanding of the biology of this disease iscrucial to the development of both novel interventions anddisease-specific biomarkers. Therapeutic agents targeting keyregulatory pathways carry significant promise for future treat-ments of HGSC but the key to the reduction in mortality fromHGSC is the identification of a highly sensitive, disease-specificscreening biomarker. However, in the interim, we would advo-cate the opportunistic surgical removal of fallopian tubes when awoman has completed her family as another approach that couldsignificantly reduce the incidence of this devastating disease[39,40].
Supplementary data to this article can be found online athttps://doi.org/10.1016/j.ygyno.2019.08.029.
Acknowledgments
We firstly want to acknowledge the valuable contributionsmade by our late colleague Dr. Jennifer Quinn-O'Brien who wasinstrumental in the design and initiation of this project. The Gene

Fig. 5. Mission esiRNA screen of 58 oncogenes in the HGSC cell model (AeC). The dashed red lines represent 75% and 50% cell viability thresholds, while the yellow and green bars representtargets that displayed cell viability below those respective thresholds (n¼ 3). esiRNA knockdown of RRM2 had a significantly greater negative effect on cell viability in KURAMOCHI(p¼ 0.009) and OVCAR4 (p¼ 0.006) than FT190 (p¼ 0.08) (D). Comparison of the negative effect on cell viability showed a significant difference between both FT190 and KURAMOCHI(p¼ 0.04) and FT190 and OVCAR4 (p¼ 0.02) (E). (For interpretation of the references to color in this figure legend, the reader is referred to the web version of this article.)
J.P. Beirne et al. / Gynecologic Oncology 155 (2019) 305e317314

Fig. 6. Validation with two independent siRNAs for RRM2 in the HGSC cell model and the non-HGSC cell panel confirm RRM2 knockdown has a negative effect on cell growth(p< 0.005) (A-D). Assessment, by western blotting, of protein expression reveals RRM2 knockdown does not translate at a protein level (E & F).
J.P. Beirne et al. / Gynecologic Oncology 155 (2019) 305e317 315

J.P. Beirne et al. / Gynecologic Oncology 155 (2019) 305e317316
Expression Profiling data from this study would not have beenpossible without the generous support of the Belfast Health andSocial Care Trust Samaritan Fund. The samples used in this researchwere received from the Northern Ireland Biobank which is fundedby HSC Research and Development Division of the Public HealthAgency in Northern Ireland and Cancer Research UK through theBelfast CRUK Centre and the Northern Ireland Experimental CancerMedicine Centre; additional support was received from the Friendsof the Cancer Centre. The Northern Ireland Molecular PathologyLaboratory, which is responsible for creating resources for the NIB,has received funding from Cancer Research UK, the Friends of theCancer Centre and the Sean Crummey Foundation. The researchfellowship of the lead author (JPB) was also funded byHSC Researchand Development Division of the Public Health Agency in NorthernIreland.
Author contributions
The study was conceived, designed and initiated by JPB, IJGH,WGM, and PBM through the Ovarian Cancer Research Focus Groupat CCRCB, QUB. IJGH and WGMcG selected appropriate casesthrough the Northern Ireland Centre for Gynaecological CancerMultidisciplinary Meeting. WGM performed pathological analysisand annotation. JPB collated all relevant clinico-pathological data.DMcA, AR, AG, PO, PD, NM, NB provided bioinformatics supportand were involved in analysis of the raw gene expression profiling(GEP) data. MST provided support for tissue sectioning andannotation through the Northern Ireland Molecular PathologyLaboratory. RDK and NM provided support for GEP assay. MST, RDand RDK were also invaluable in results analysis and interpreta-tion. RID supplied fallopian tube cells for in vitro assays. JPB, CM,DLE, JF, PC and LF did all laboratory validation work with supportfrom PBM, SLE and NB. JPB and PBM prepared the manuscript. Allauthors were involved in refining and finalising the manuscriptfor submission.
Declaration of competing interest
Professor Richard Kennedy is Vice President and Medical Di-rector of Almac Diagnostics, ALMAC, Craigavon, UK. Dr. NualaMcCabe is an employee of Almac Diagnostics, ALMAC, Craigavon,UK. Professor Ronny Drapkin serves on the scientific advisory boardof Repare Therapeutics, Siamab Therapeutics, and Pear TreeTherapeutics.
References
[1] CRUK, Ovarian Cancer. http://www.cancerresearchuk.org/health-professional/cancer-statistics/statistics-by-cancer-type/ovarian-cancer, 2014. (AccessedApril 2016).
[2] A.A. Ahmed, D. Etemadmoghadam, J. Temple, et al., Driver mutations in TP53are ubiquitous in high grade serous carcinoma of the ovary, J. Pathol. 221(2010) 49e56.
[3] J.P. Beirne, G.W. Irwin, S.A. McIntosh, I.J.G. Harley, D.P. Harkin, The molecularand genetic basis of inherited cancer risk in gynaecology, The Obstetrician &Gynaecologist 17 (2015) 233e241.
[4] C. Gourley, C.O. Michie, P. Roxburgh, et al., Increased incidence of visceralmetastases in Scottish patients with BRCA1/2-defective ovarian cancer: anextension of the ovarian BRCAness phenotype, J. Clin. Oncol. 28 (2010)2505e2511.
[5] J.I. Weberpals, K.V. Clark-Knowles, B.C. Vanderhyden, Sporadic epithelialovarian cancer: clinical relevance of BRCA1 inhibition in the DNA damage andrepair pathway, J. Clin. Oncol. 26 (2008) 3259e3267.
[6] D.D. Bowtell, The genesis and evolution of high-grade serous ovarian cancer,Nat. Rev. Cancer 10 (2010) 803e808.
[7] M.F. Fathalla, Incessant ovulation–a factor in ovarian neoplasia? Lancet 2(1971) 163.
[8] A.S. Whittemore, R. Harris, J. Itnyre, Characteristics relating to ovarian cancerrisk: collaborative analysis of 12 US case-control studies. IV. The pathogenesisof epithelial ovarian cancer. Collaborative Ovarian Cancer Group, Am. J. Epi-demiol. 136 (1992) 1212e1220.
[9] K.A. Rosenblatt, D.B. Thomas, Lactation and the risk of epithelial ovariancancer. The WHO Collaborative Study of Neoplasia and Steroid Contraceptives,Int. J. Epidemiol. 22 (1993) 192e197.
[10] H.O. Adami, C.C. Hsieh, M. Lambe, et al., Parity, age at first childbirth, and riskof ovarian cancer, Lancet 344 (1994) 1250e1254.
[11] H.A. Risch, L.D. Marrett, G.R. Howe, Parity, contraception, infertility,and the risk of epithelial ovarian cancer, Am. J. Epidemiol. 140 (1994)585e597.
[12] N. Singh, W.G. McCluggage, C.B. Gilks, High-grade serous carcinoma oftubo-ovarian origin: recent developments, Histopathology 71 (2017)339e356.
[13] J.M.J. Piek, P.J. van Diest, R.P. Zweemer, et al., Dysplastic changes in prophy-lactically removed fallopian tubes of women predisposed to developingovarian cancer, J. Pathol. 195 (2001) 451e456.
[14] A. Finch, P. Shaw, B. Rosen, J. Murphy, S.A. Narod, T.J. Colgan, Clinical andpathologic findings of prophylactic salpingo-oophorectomies in 159 BRCA1and BRCA2 carriers, Gynecol. Oncol. 100 (2006) 58e64.
[15] Y. Lee, A. Miron, R. Drapkin, et al., A candidate precursor to serouscarcinoma that originates in the distal fallopian tube, J. Pathol. 211 (2007)26e35.
[16] E. Kuhn, R.J. Kurman, R. Vang, et al., TP53 mutations in serous tubal intra-epithelial carcinoma and concurrent pelvic high-grade serous carcinoma-evidence supporting the clonal relationship of the two lesions, J. Pathol. 226(2012) 421e426.
[17] L. Gautier, L. Cope, B.M. Bolstad, R.A. Irizarry, affy–analysis ofAffymetrix GeneChip data at the probe level, Bioinformatics 20 (2004)307e315.
[18] Team RC, R: A Language and Environment for Statistical Computing, RFoundation for Statistical Computing, Vienna, Austria, 2012.
[19] S. Dray, A.B. Dufour, The ade4 package: implementing the duality diagram forecologists, J. Stat. Softw. 22 (2007) 1e20.
[20] A.C. Culhane, J. Thioulouse, G. Perriere, D.G. Higgins, MADE4: an R package formultivariate analysis of gene expression data, Bioinformatics 21 (2005)2789e2790.
[21] R. Gentleman, V. Carey, W. Huber, F. Hahne, Genefilter: Genefilter: Methodsfor Filtering Genes From High-throughput Experiments. R Package, 2015(1.52.0).
[22] F. Murtagh, P. Legendre, Ward's hierarchical agglomerative clusteringmethod: which algorithms implement ward's criterion? J. Classif. 31 (2014)274e295.
[23] A. Day, heatmap.plus: Heatmap With More Sensible Behavior, 29/10/2012,http://CRAN.R-project.org/package¼heatmap.plus, 2012. (Accessed 20November 2015).
[24] M.E. Ritchie, B. Phipson, D. Wu, et al., limma powers differential expressionanalyses for RNA-sequencing and microarray studies, Nucleic Acids Res. 43(2015) e47.
[25] Anglesio MSW, K. C.; Melnyk, N.; Chow, C.; Salamanca, C.; Prentice, L. M.;Senz, J.; Yang, W.; Spillman, M. A.; Cochrane, D. R.; Shumansky, K.; Shah, S. P.;Kalloger, S. E.; Huntsman, D. G.. Type-specific cell line models for type-specificovarian cancer research. PLoS One 2013; 8.
[26] S. Domcke, R. Sinha, D.A. Levine, C. Sander, N. Schultz, Evaluating cell lines astumour models by comparison of genomic profiles, Nat. Commun. 4 (2013)2126.
[27] A.M. Karst, R. Drapkin, Primary culture and immortalization ofhuman fallopian tube secretory epithelial cells, Nat. Protoc. 7 (2012)1755e1764.
[28] V. Vichai, K. Kirtikara, Sulforhodamine B colorimetric assay for cytotoxicityscreening, Nat. Protoc. 1 (2006) 1112e1116.
[29] Y. Yamamoto, G. Ning, B.E. Howitt, et al., In vitro and in vivo correlates ofphysiological and neoplastic human fallopian tube stem cells, J. Pathol. 238(2016) 519e530.
[30] C.B. Gilks, J. Irving, M. Kobel, et al., Incidental nonuterine high-grade serouscarcinomas arise in the fallopian tube in most cases: further evidence for thetubal origin of high-grade serous carcinomas, Am. J. Surg. Pathol. 39 (2015)357e364.
[31] V.M. Yu, C.M. Marion, T.M. Austria, J. Yeh, A.H. Schonthal, L. Dubeau, Role ofBRCA1 in controlling mitotic arrest in ovarian cystadenoma cells, Int. J. Cancer130 (2012) 2495e2504.
[32] K. Egan, D. Crowley, P. Smyth, et al., Platelet adhesion and degranulationinduce pro-survival and pro-angiogenic signalling in ovarian cancer cells,PLoS One 6 (2011), e26125.
[33] Z.Z. Pan, W. Bruening, A.K. Godwin, Involvement of RHO GTPases and ERK insynuclein-gamma enhanced cancer cell motility, Int. J. Oncol. 29 (2006)1201e1205.
[34] J. Peng, G. Zhang, Q. Wang, et al., ROCK cooperated with ET-1 to induceepithelial to mesenchymal transition through SLUG in human ovarian cancercells, Biosci. Biotechnol. Biochem. 76 (2012) 42e47.

J.P. Beirne et al. / Gynecologic Oncology 155 (2019) 305e317 317
[35] N. Heemskerk, J. van Rijssel, J.D. van Buul, Rho-GTPase signaling in leukocyteextravasation: an endothelial point of view, Cell Adhes. Migr. 8 (2014)67e75.
[36] D.S. Vinay, E.P. Ryan, G. Pawelec, et al., Immune evasion in cancer: mecha-nistic basis and therapeutic strategies, Semin. Cancer Biol. 35 (2015), S185-S98.
[37] K. Abiko, M. Mandai, J. Hamanishi, et al., PD-L1 on tumor cells is induced inascites and promotes peritoneal dissemination of ovarian cancer through CTLdysfunction, Clin. Cancer Res. 19 (2013) 1363e1374.
[38] L. Zhang, M. Luo, H. Yang, S. Zhu, X. Cheng, C. Qing, Next-generationsequencing-based genomic profiling analysis reveals novel mutations forclinical diagnosis in Chinese primary epithelial ovarian cancer patients,J. Ovarian Res. 12 (2019) 19.
[39] J.S. Kwon, Ovarian cancer risk reduction through opportunistic salpingectomy,J. Gynecol. Oncol. 26 (2015) 83e86.
[40] RCOG, The Distal Fallopian Tube as the Origin of Non-uterine Pelvic High-grade Serous Carcinomas, Royal College of Obstetricians and Gynaecologists,2014.