defining industry kpi’s - collision industry conference · assigned tasks define cycle time...
TRANSCRIPT

Defining Industry KPI’s
Definitions CommitteeDefinitions Committee
0707--3030--20092009

Committee Members
Chris AndreoliChris Andreoli Mel Mel HunkeHunke
Scott BiggsScott Biggs Doug KellyDoug Kelly
Barry DornBarry Dorn Joe LacyJoe Lacy
Al EstorgaAl Estorga Jeffery PattiJeffery Patti
Chris EvansChris Evans Richard PerryRichard Perry
Don FinleyDon Finley Bob SmithBob Smith
Ron GuilliamsRon Guilliams Rick TuuriRick Tuuri
ChrisaChrisa HickeyHickey Dusty WombleDusty Womble

Assigned Tasks
�� Define Cycle TimeDefine Cycle Time
�� Define Other Industry Define Other Industry KPIKPI’’ss That Are That Are
Used to Measure Shop PerformanceUsed to Measure Shop Performance
•• Performance ReviewsPerformance Reviews
•• Chart of AccountsChart of Accounts
Cycle Time Definitions
��Disclaimer: Cycle time is only one Disclaimer: Cycle time is only one
component of shop performance. The component of shop performance. The
measurement of Cycle Time should be measurement of Cycle Time should be
used in conjunction with other critical used in conjunction with other critical
KPIKPI’’ss to determine the overall to determine the overall
efficiency and performance of a repair efficiency and performance of a repair
facility.facility.
Normalizing the Variables
�� Drivable vs. NonDrivable vs. Non--DrivableDrivable
�� Performance Relative to Your MarketPerformance Relative to Your Market
�� ““Keys to KeysKeys to Keys”” vs. Production Timevs. Production Time
�� Specialized or Luxury VehiclesSpecialized or Luxury Vehicles
�� Possible Subsets for Each of the DefinitionsPossible Subsets for Each of the Definitions
Cycle Time Definitions
�� The Committee Identified the Need for The Committee Identified the Need for
Three Three Different Definitions for Cycle Time:Different Definitions for Cycle Time:
�� RepairerRepairer
�� InsurerInsurer
�� ConsumerConsumer
The following are the definitions that we are The following are the definitions that we are
recommending to the CIC body for approval.recommending to the CIC body for approval.

Repairer Cycle Time
�� Repairer Cycle Time:Repairer Cycle Time: From the Time From the Time
the Vehicle Arrives at the Repair the Vehicle Arrives at the Repair
Facility for Repair Until the Vehicle is Facility for Repair Until the Vehicle is
Completed and Picked Up by the Completed and Picked Up by the
Consumer, (includes weekends). Consumer, (includes weekends).
Commonly Referred to As, Commonly Referred to As, ““Keys to Keys to
KeysKeys””..
Insurer Cycle Time
�� Insurer Cycle Time: Insurer Cycle Time: ““The Time From The Time From
the First Notice of Loss to When the the First Notice of Loss to When the
Claim is PaidClaim is Paid””..
Consumer Cycle Time
�� Consumer Cycle Time: Consumer Cycle Time: ““From the Time From the Time
of the Accident to the Time the Vehicle of the Accident to the Time the Vehicle
is Repaired and Returned to the is Repaired and Returned to the
ConsumerConsumer””..
Other KPI’s to be Defined
�� Repair Labor Hours Per DayRepair Labor Hours Per Day
�� Repair Dollars Per DayRepair Dollars Per Day
�� Normalized items in chart of accountsNormalized items in chart of accounts

Cycle Time Presentation
J.D. Power and Associates
�� Presenting for J.D. Power and Associates:Presenting for J.D. Power and Associates:
Mark GarrettMark Garrett
Senior Research ManagerSenior Research Manager
Insurance PracticeInsurance Practice
[email protected]@jdpa.com

© 2009 J.D. Power and Associates,The McGraw-Hill Companies, Inc. All Rights Reserved.
Its All in the Eye of the Beholder: Customer Satisfaction and Cycle Time
Presented by J.D. Power and Associates
July 30, 2009

© 2009 J.D. Power and Associates,The McGraw-Hill Companies, Inc.
All Rights Reserved.
• Focused on the auto claims experience involving physical damage – both repairable and total losses.
• Excludes claims involving only glass/windshield damage.
• Survey designed with active collaboration from many
carriers profiled in the study.
• Study provides a clear set of benchmarks for recent claim
performance among the top 25 insurers in the nation.
• National sample of 11,700 respondents who filed a claim
within the last year.
• Surveys gathered independently to ensure results are objective
and representative.
• Interviews obtained in July/August 2008
Survey Overview

© 2009 J.D. Power and Associates,The McGraw-Hill Companies, Inc.
All Rights Reserved.
Overall
Satisfaction
Index
Service
Interaction29%
3%
18%
Rental Experience
Repair Process
First Notice of Loss
– Call Center
36% Settlement
34% Appraiser
36% Local Agent
31% Adjuster
Key Drivers of Customer SatisfactionRepairable Vehicles
13%

© 2009 J.D. Power and Associates,The McGraw-Hill Companies, Inc.
All Rights Reserved.
Index Range of PerformanceRepairable Vehicles
876
910
875859
883
825 824 829810
826
738 742 734
771
724
650
700
750
800
850
900
950
Overall CSI FNOL
Call CenterService
Interaction Repair
Facility
Settlement
Ind
ex S
co
re
Highest Insurer Score Industry Lowest Insurer Score
The Repair Facility has the tightest range of performance acrossInsurance carriers.

© 2009 J.D. Power and Associates,The McGraw-Hill Companies, Inc.
All Rights Reserved.
*Data sourced from J.D. Power and Associates 2008 Customer Contact Satisfaction Study
Relationship Between Satisfaction with Repairand Likelihood to Recommend Shop – Carrier Level
Insurance Carriers
35%
45%
55%
65%
75%
7.75 8.00 8.25 8.50 8.75 9.00 9.25
Overall Satisfaction with Repair Process
% C
us
tom
ers
wh
o w
ill d
efi
nit
ely
re
co
mm
en
d s
ho
pHigh correlation between satisfaction with the Repair Process and
recommending the Repair Facility.

© 2009 J.D. Power and Associates,The McGraw-Hill Companies, Inc.
All Rights Reserved.
Claim Contact

© 2009 J.D. Power and Associates,The McGraw-Hill Companies, Inc.
All Rights Reserved.
47%
12%
40%
8.158.03
8.38
0%
20%
40%
60%
80%
Company Appraiser Independent Appraiser Repair Facility
% W
ho
ap
pra
ise
d v
eh
icle
6.00
7.00
8.00
9.00
Th
oro
ug
hn
es
s o
f ap
pra
isa
l
Thoroughness of appraisal
Who Appraised Vehicle
Customers are more satisfied when the appraisal is conducted by an employee of the repair facility.

© 2009 J.D. Power and Associates,The McGraw-Hill Companies, Inc.
All Rights Reserved.
22% 20%15%
35%
803822
828850
0%
20%
40%
60%
80%
Local agent Repair Facility Person reported
claim to
Company
Appraiser/Adjuster
% P
rim
ari
ly in
tera
cte
d w
ith
du
rin
g c
laim
600
700
800
900
Ov
era
ll CS
IPrimary Interaction Throughout Claim
Satisfaction scores are highest when customer deals with the repairer or their personal agent.
Person Identified as Primary Interaction
Overall CSI
© 2009 J.D. Power and Associates,The McGraw-Hill Companies, Inc.
All Rights Reserved.
Repair Process

© 2009 J.D. Power and Associates,The McGraw-Hill Companies, Inc.
All Rights Reserved.
Methods Used to Select Repair Facility
25%29%
17%
30%
849823
787771
0%
20%
40%
60%
80%
Had shop in mind
(Preferred Shop)
Had shop in mind
(Non-Preferred/DK)
Insurer
Recommended /
Other
Chose from Insurer's
list
% M
eth
od
used
to
sele
ct
sh
op
600
700
800
900
Rep
air P
rocess In
dex
* Caution small sample size.
Customers are most satisfied when they can use a shop they
had in mind for repair work.
Repair Process Index

© 2009 J.D. Power and Associates,The McGraw-Hill Companies, Inc.
All Rights Reserved.
Who is Responsible for Quality of Repairs?
Customers primarily view the repair facility as being responsible for the quality of their repairs.
20%
79%
94%
4%
0%
20%
40%
60%
80%
100%
Insurer Repair Facility
% R
esp
on
sib
le f
or
rep
air
s
DRP Shop Non-DRP Shop
50% 49%
Progressive Concierge Center

© 2009 J.D. Power and Associates,The McGraw-Hill Companies, Inc.
All Rights Reserved.
Point Customer Considers Claim Settled Repairable Vehicles
Majority of claimants considered claim “settled” when they pick up their vehicles.
18%
47%
32%
6% 8%
82%
0%
20%
40%
60%
80%
100%
Accepted settlement offer Received payment Picked up vehicle
% W
hen
cla
im c
on
sid
ere
d s
ett
led
Insurer Paid Customer
(30% of claims)
Paid Repair Facility
(55% of claims)

© 2009 J.D. Power and Associates,The McGraw-Hill Companies, Inc.
All Rights Reserved.
Repaired Vehicle Claim Timeline
FNOL Next Contact with Insurer
Appraisal Conducted
Vehicle to Body shop
Informed of Settlement
Vehicle backto customer
0 1 2 3 4 5 6 7 8 9 10 11 12 13 14 15 16 17 18
Number of Days
6.05.03.01.3 14.35.9Time of
Incident

© 2009 J.D. Power and Associates,The McGraw-Hill Companies, Inc.
All Rights Reserved.
Repaired Vehicle Claim Timeline
It’s not all about “keys to keys.”
Drivable
Towed
FNOL Next Contact with Insurer
Appraisal Conducted
Vehicle to Body shop
Informed of Settlement
Vehicle backto customer
5.83.2 13.31.5 5.3 6.9
3.0 4.22.00.5 17.95.7
0 1 2 3 4 5 6 7 8 9 10 11 12 13 14 15 16 17 18
Number of Days
5.64.42.61.3 12.1
9.45.43.21.4 15.15.6
Repair FacilityAppraisal
Appraisal at Home
© 2009 J.D. Power and Associates,The McGraw-Hill Companies, Inc.
All Rights Reserved.
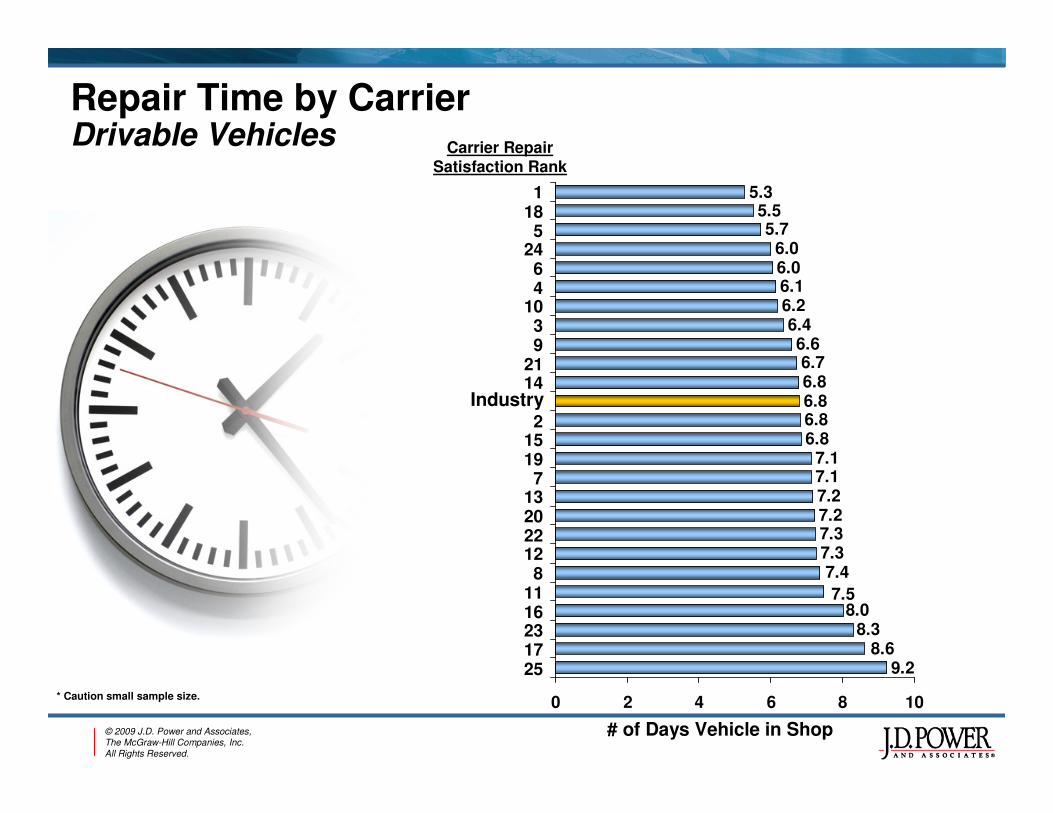
Repair Time by CarrierDrivable Vehicles
* Caution small sample size.
Carrier RepairSatisfaction Rank
7.37.37.27.27.17.1
6.86.86.86.86.7
6.66.4
6.26.16.06.0
5.75.5
5.3
9.28.6
8.0
7.4
7.5
8.3
0 2 4 6 8 10
Carrier YCarrier X
Carrier WCarrier VCarrier UCarrier TCarrier SCarrier RCarrier QCarrier PCarrier OCarrier NCarrier MCarrier L
Carrier KCarrier JCarrier I
Carrier HCarrier GCarrier FCarrier ECarrier DCarrier CCarrier BCarrier A
Industry
# of Days Vehicle in Shop
Industry
25172316118
122220137
19152
142193
1046
245
181

© 2009 J.D. Power and Associates,The McGraw-Hill Companies, Inc.
All Rights Reserved.
Attribute Scorecard—Repair Process2009 Auto Claims Study (Preliminary)
Worst in Industry Best in IndustryIndustry
Speed of completing the work
Kept informed of progress
Thoroughness of appraising damage
Responsiveness
Explaining the work
Quality of the repair work
7.0 7.5 8.0 8.5 9.0 9.5

© 2009 J.D. Power and Associates,The McGraw-Hill Companies, Inc.
All Rights Reserved.
Top Service Practices Repair Process
20% 30% 40% 50% 60% 70% 80% 90% 100%
Worst in Industry Best in IndustryIndustry
Notify customer of repair issues
Proactive updates on repair
Use OEM parts or have a parts discussion
Fix vehicle the first time
Repair drivable vehicles with 7 days (14 days for tow)
Complete repair when promised
Flexible appointment time
© 2009 J.D. Power and Associates,The McGraw-Hill Companies, Inc.
All Rights Reserved.
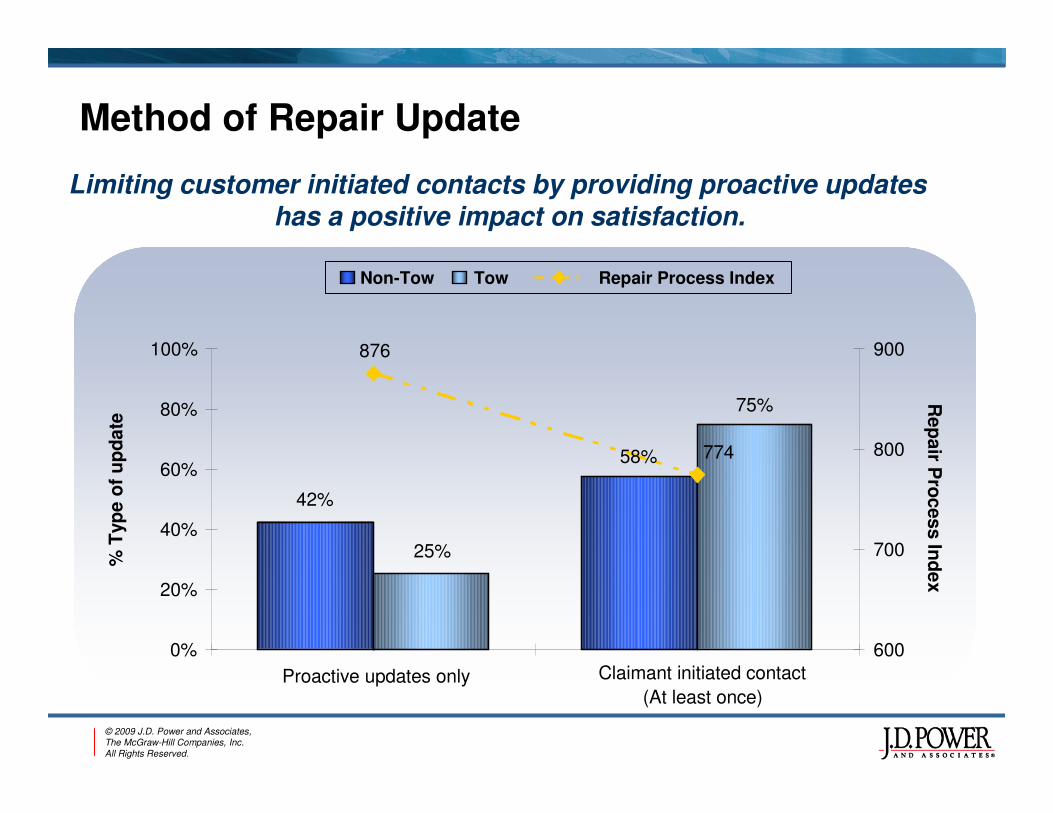
Method of Repair Update
Limiting customer initiated contacts by providing proactive updates has a positive impact on satisfaction.
Repair Process IndexNon-Tow Tow
58%
75%
42%
25%
774
876
0%
20%
40%
60%
80%
100%
Proactive updates only Claimant initiated contact
(At least once)
% T
yp
e o
f u
pd
ate
600
700
800
900
Rep
air P
rocess In
dex

© 2009 J.D. Power and Associates,The McGraw-Hill Companies, Inc.
All Rights Reserved.
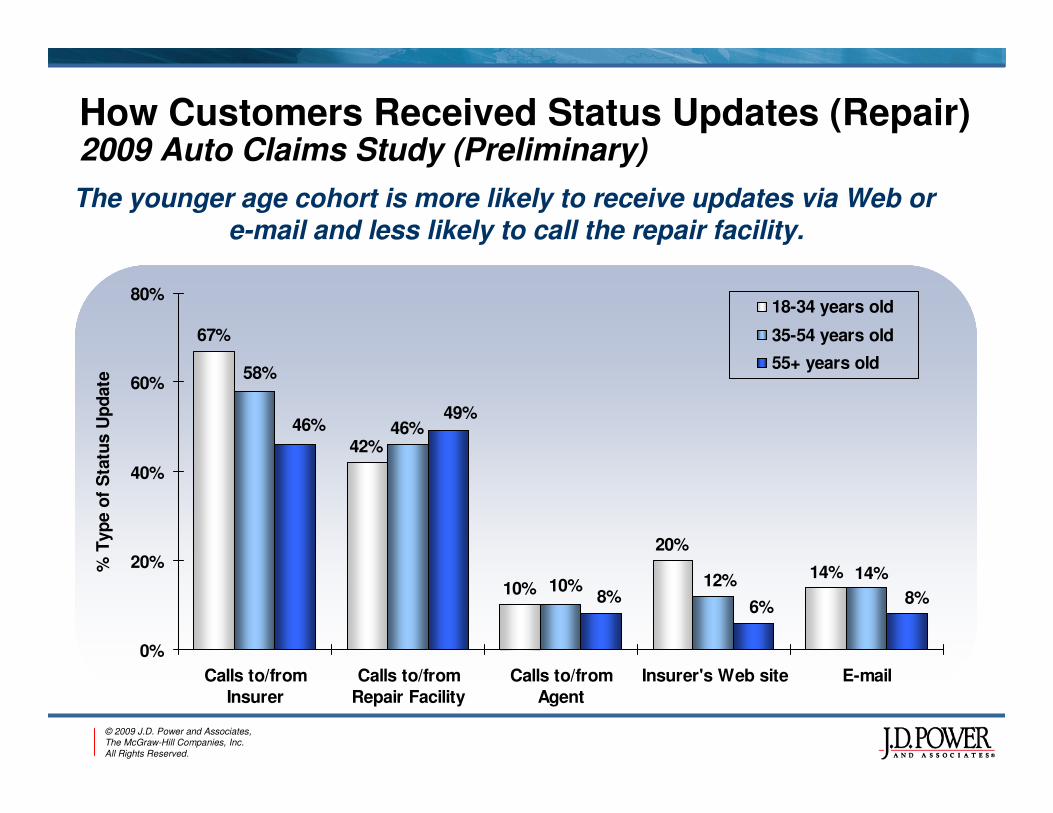
Customer Updates: Repairable Vehicles
© 2009 J.D. Power and Associates,The McGraw-Hill Companies, Inc.
All Rights Reserved.
67%
42%
10%
20%
46%
14%12%10%
58%
14%
8%6%
8%
46%49%
0%
20%
40%
60%
80%
Calls to/from
Insurer
Calls to/from
Repair Facility
Calls to/from
Agent
Insurer's Web site E-mail
% T
yp
e o
f S
tatu
s U
pd
ate
18-34 years old
35-54 years old
55+ years old
How Customers Received Status Updates (Repair)2009 Auto Claims Study (Preliminary)
The younger age cohort is more likely to receive updates via Web or e-mail and less likely to call the repair facility.

© 2009 J.D. Power and Associates,The McGraw-Hill Companies, Inc.
All Rights Reserved.
Do Customers Prefer More or Less Options?2009 Auto Claims Study (Preliminary)
41%
54%64%
35%
27%
22%
24%19% 14%
0%
20%
40%
60%
80%
100%
18-34 years old 35-54 years old 55+ years old
% o
f P
refe
rrin
g D
iffe
ren
t O
pti
on
s
No change in updates Prefer more/different options Prefer less options
The younger age cohort is also more likely to prefer receiving updates through a different method.

© 2009 J.D. Power and Associates,The McGraw-Hill Companies, Inc.
All Rights Reserved.
Difference in Preferred Update Method 2009 Auto Claims Study (Preliminary)
10%
3%
-2%
8%
18%
1%
-9%
3%
26%
1%
-11%
-3%
-30% -20% -10% 0% 10% 20% 30%
18-34 years old
35-54 years old
55+ years old
E-mail / text message
Insurer's Web site
Calls to/from Agent
Calls to/from Repair Facility
Calls to/from Insurer
Prefer more updatesPrefer less updates
All customer groups prefer more e-mail updates.

© 2009 J.D. Power and Associates,The McGraw-Hill Companies, Inc.
All Rights Reserved.
43%
15%
51%
786
877884
0%
20%
40%
60%
80%
Contacted by Insurer Contacted by Repair
Facility
Not Contacted
% o
f c
laim
an
ts c
on
tac
ted
po
st
cla
im
600
700
800
900
Se
rvic
e In
tera
ctio
n In
de
x
Contacting customers after they received their vehicle has a
positive impact on satisfaction.
Contacted Post Repair
Note: Multiple Response
* 2009 Preliminary Data
Service Interaction Index
45%
65%
55%
% Will Definitely Recommend*

© 2009 J.D. Power and Associates,The McGraw-Hill Companies, Inc.
All Rights Reserved.
Conclusion
Contact Info:Mark Garrett248-312-4378

Thank You
�� To Contact Committee:To Contact Committee:
�� [email protected]@fixauto.com
�� 951951--522522--4999 cell4999 cell